


TCE-YOLOv5: Lightweight Automatic Driving Object Detection Algorithm Based on YOLOv5

Abstract
1. Introduction
2. Related Work
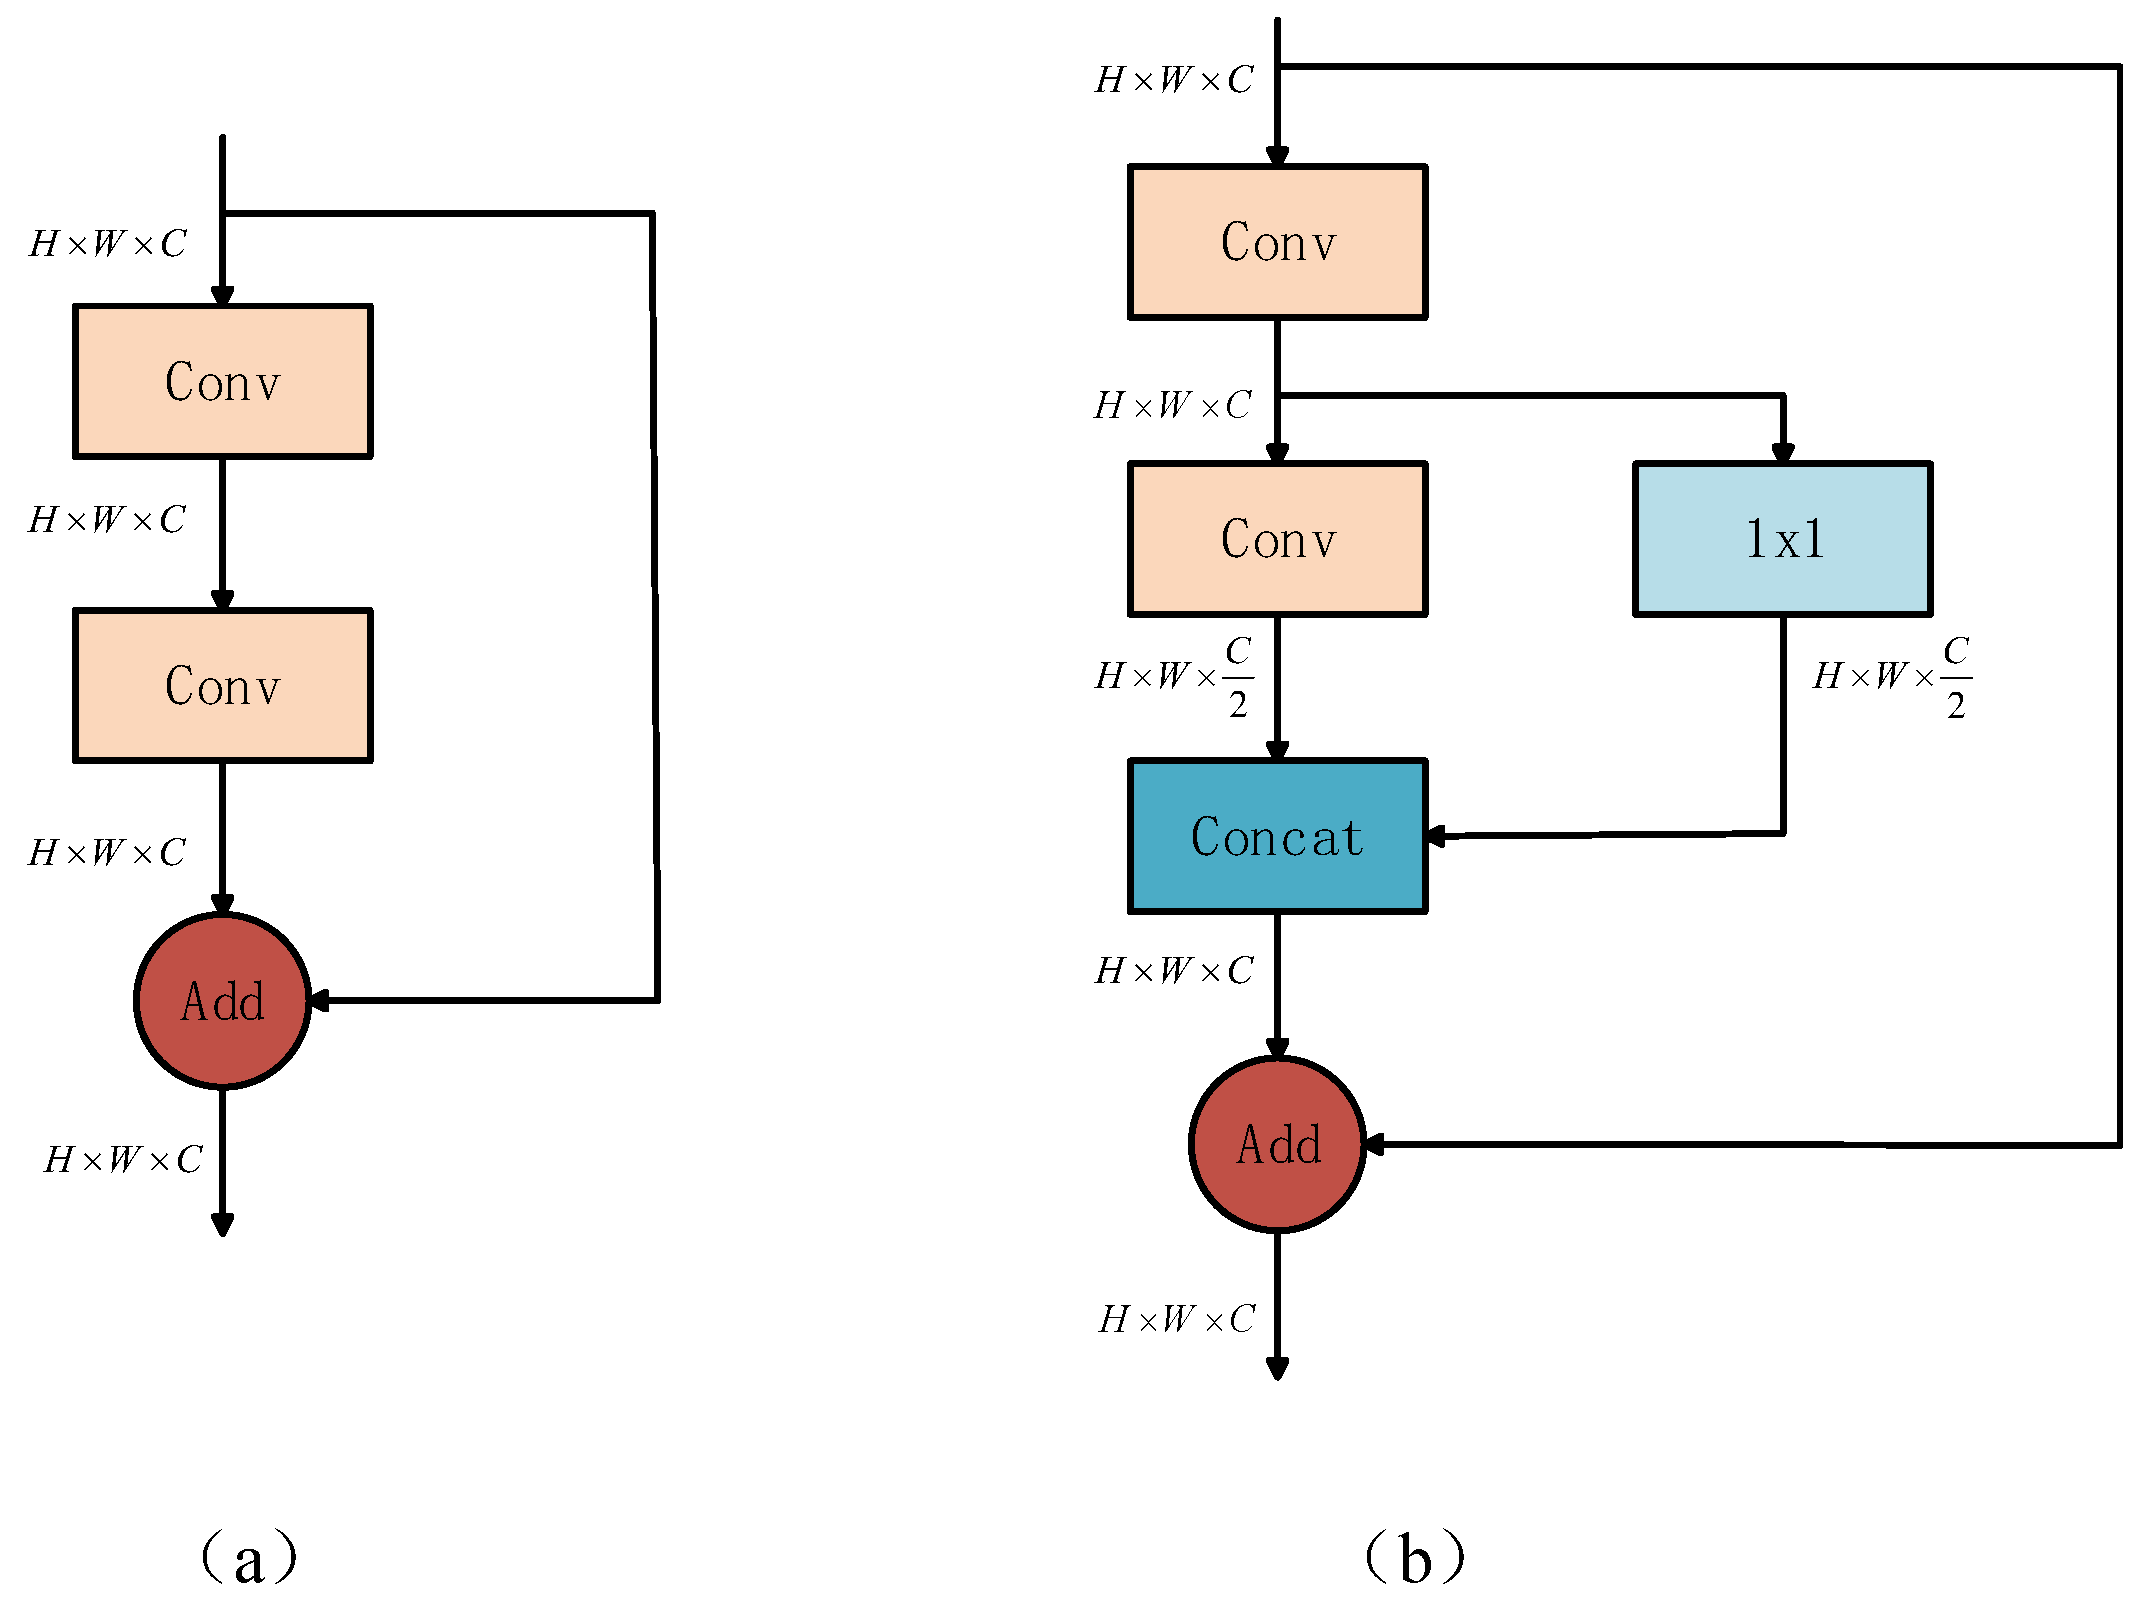
- A 3 × 3 convolution in the Bottleneck layer of the C3 module in the network is grouped. This architectural design reduces model complexity by reducing the parameter count and computation, facilitating the creation of architectures optimized for deployment in resource-limited environments. Processing the input channels of each group independently not only reduces the redundancy within the model, but also promotes the locality and diversity of feature learning.
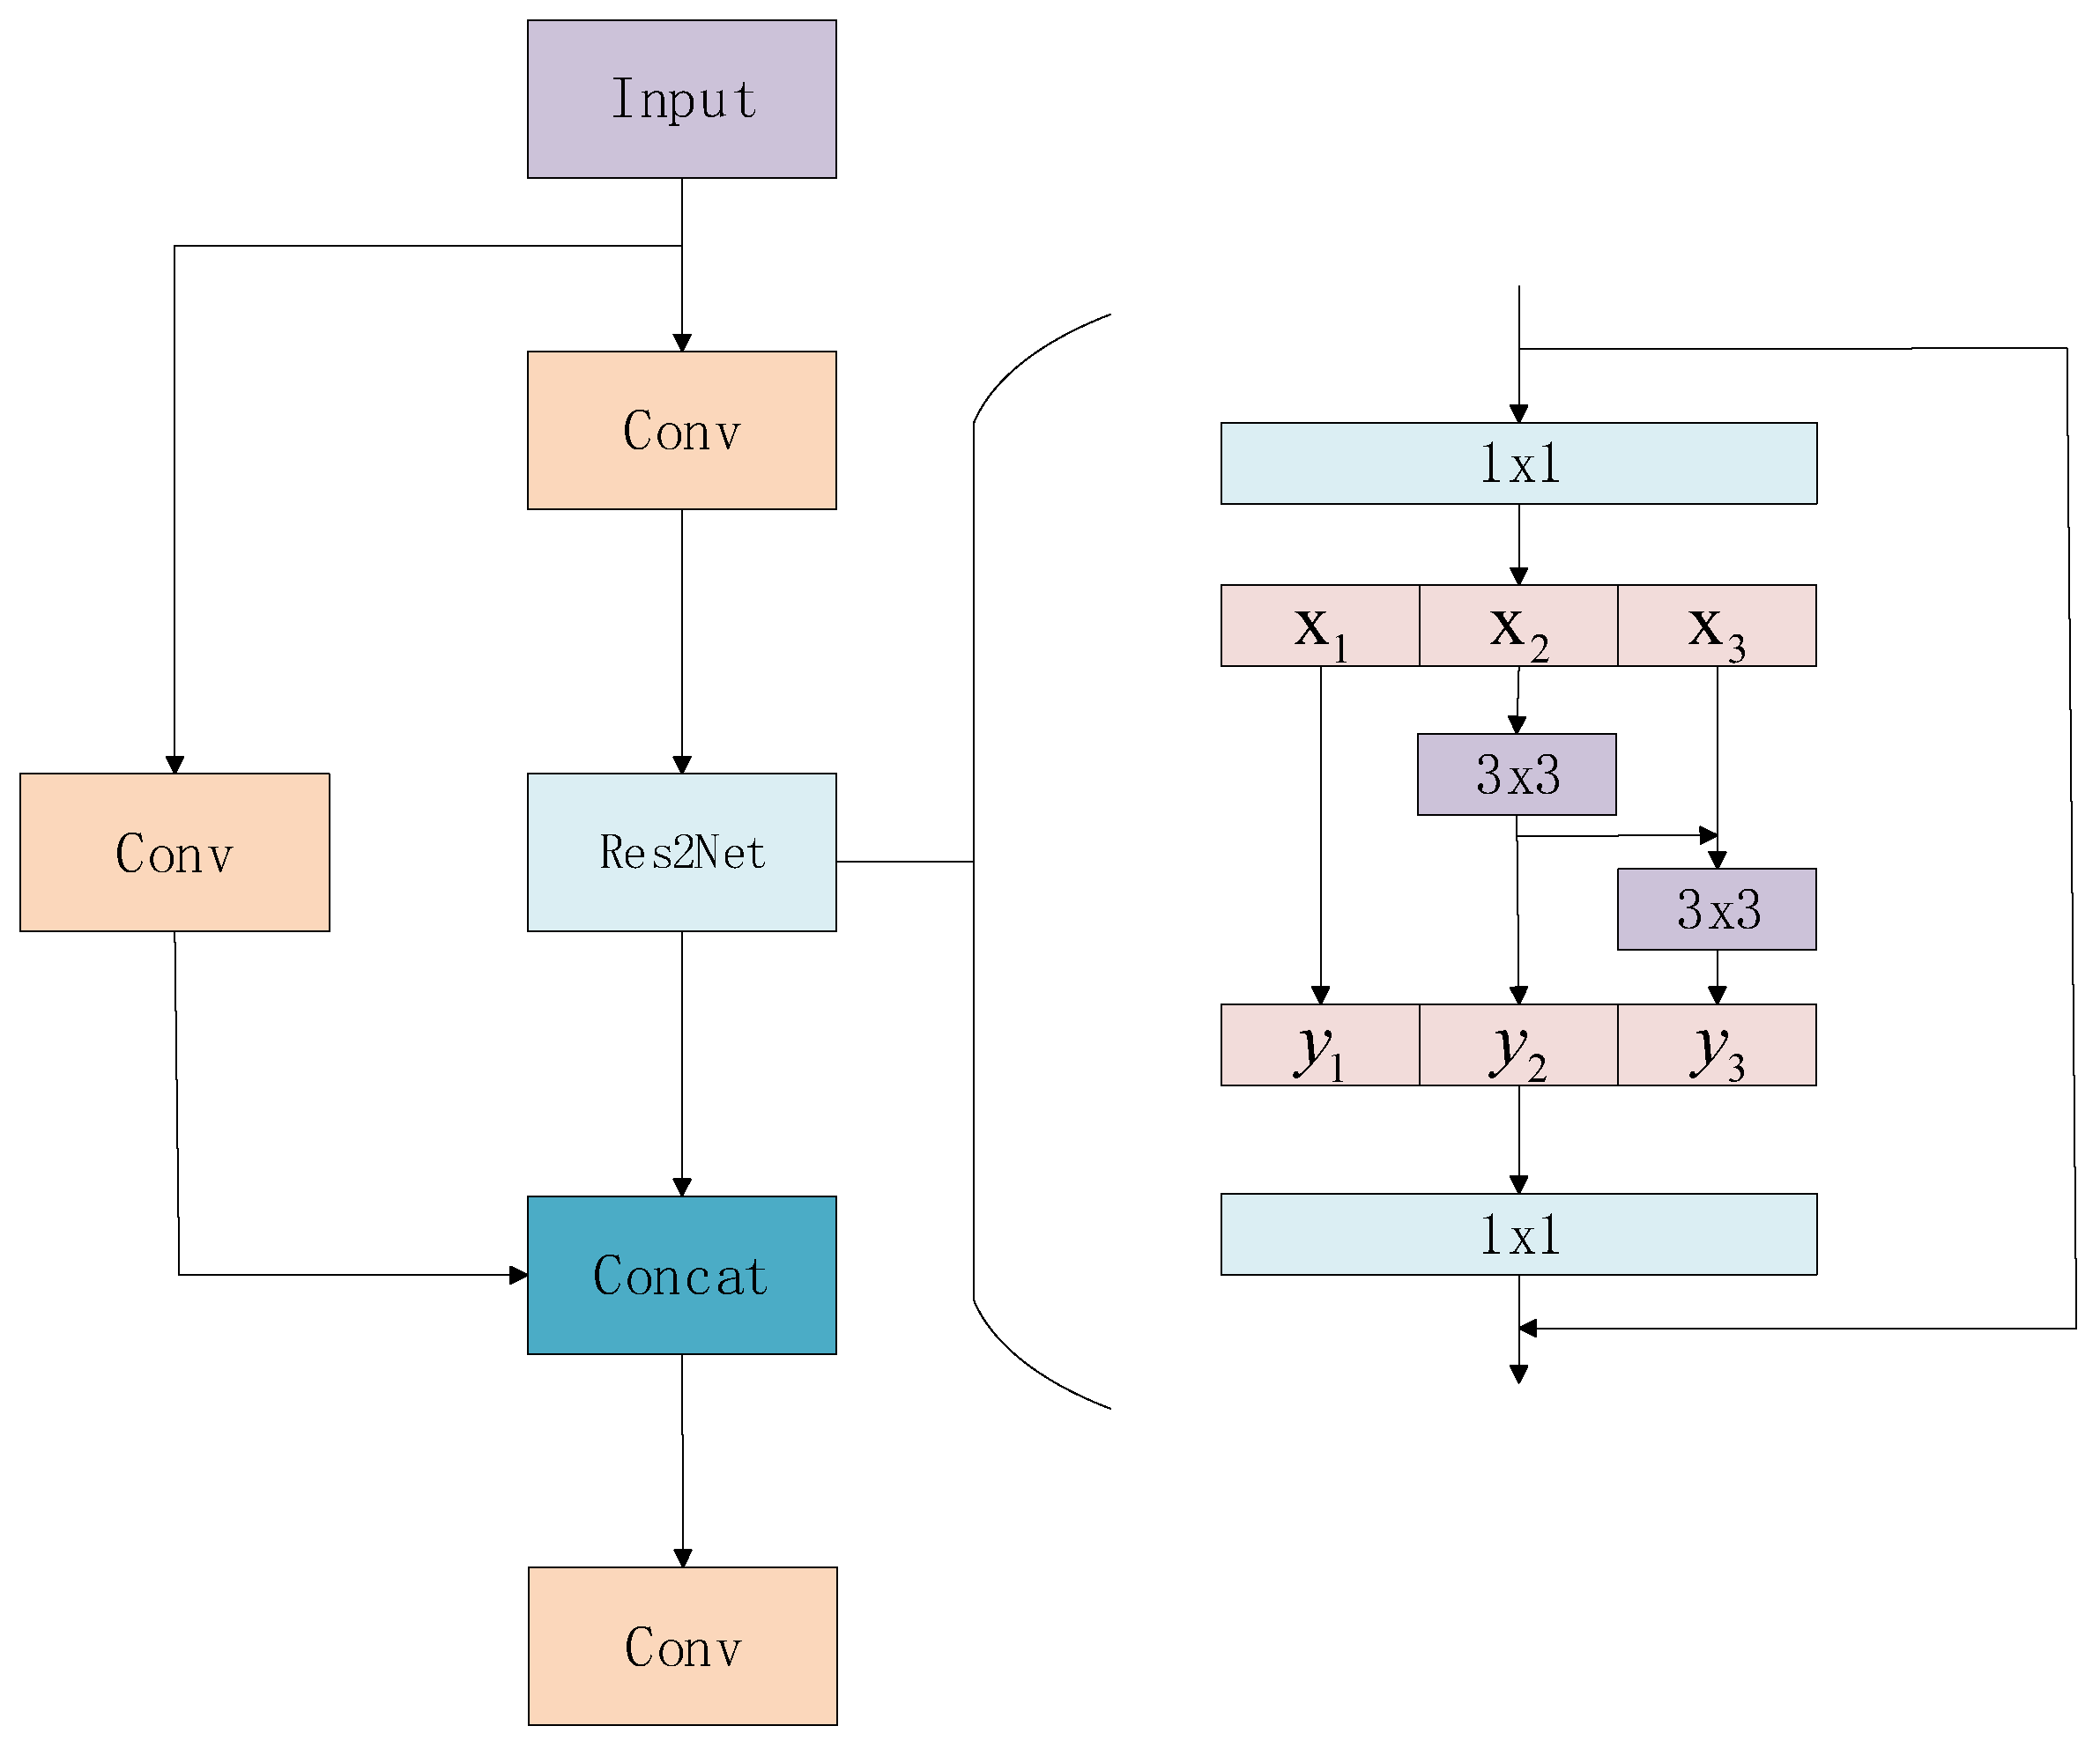
- The C3 module in the neck is replaced by a Res2Net module, which uses group convolution and feature reuse to extract features at different scales. The introduction of grouping convolution further reduces the computational burden of the model. By dividing the input feature maps into different groups and applying subsequent independent convolution operations to each subgroup, this method effectively reduces parameter counts and computation power. The feature reuse mechanism enables the network to utilize the feature information extracted from previous layers more effectively, avoiding redundant computation. It not only improves the computational efficiency of the network, but also promotes the deep interaction between features and enhances the expressiveness of the model.
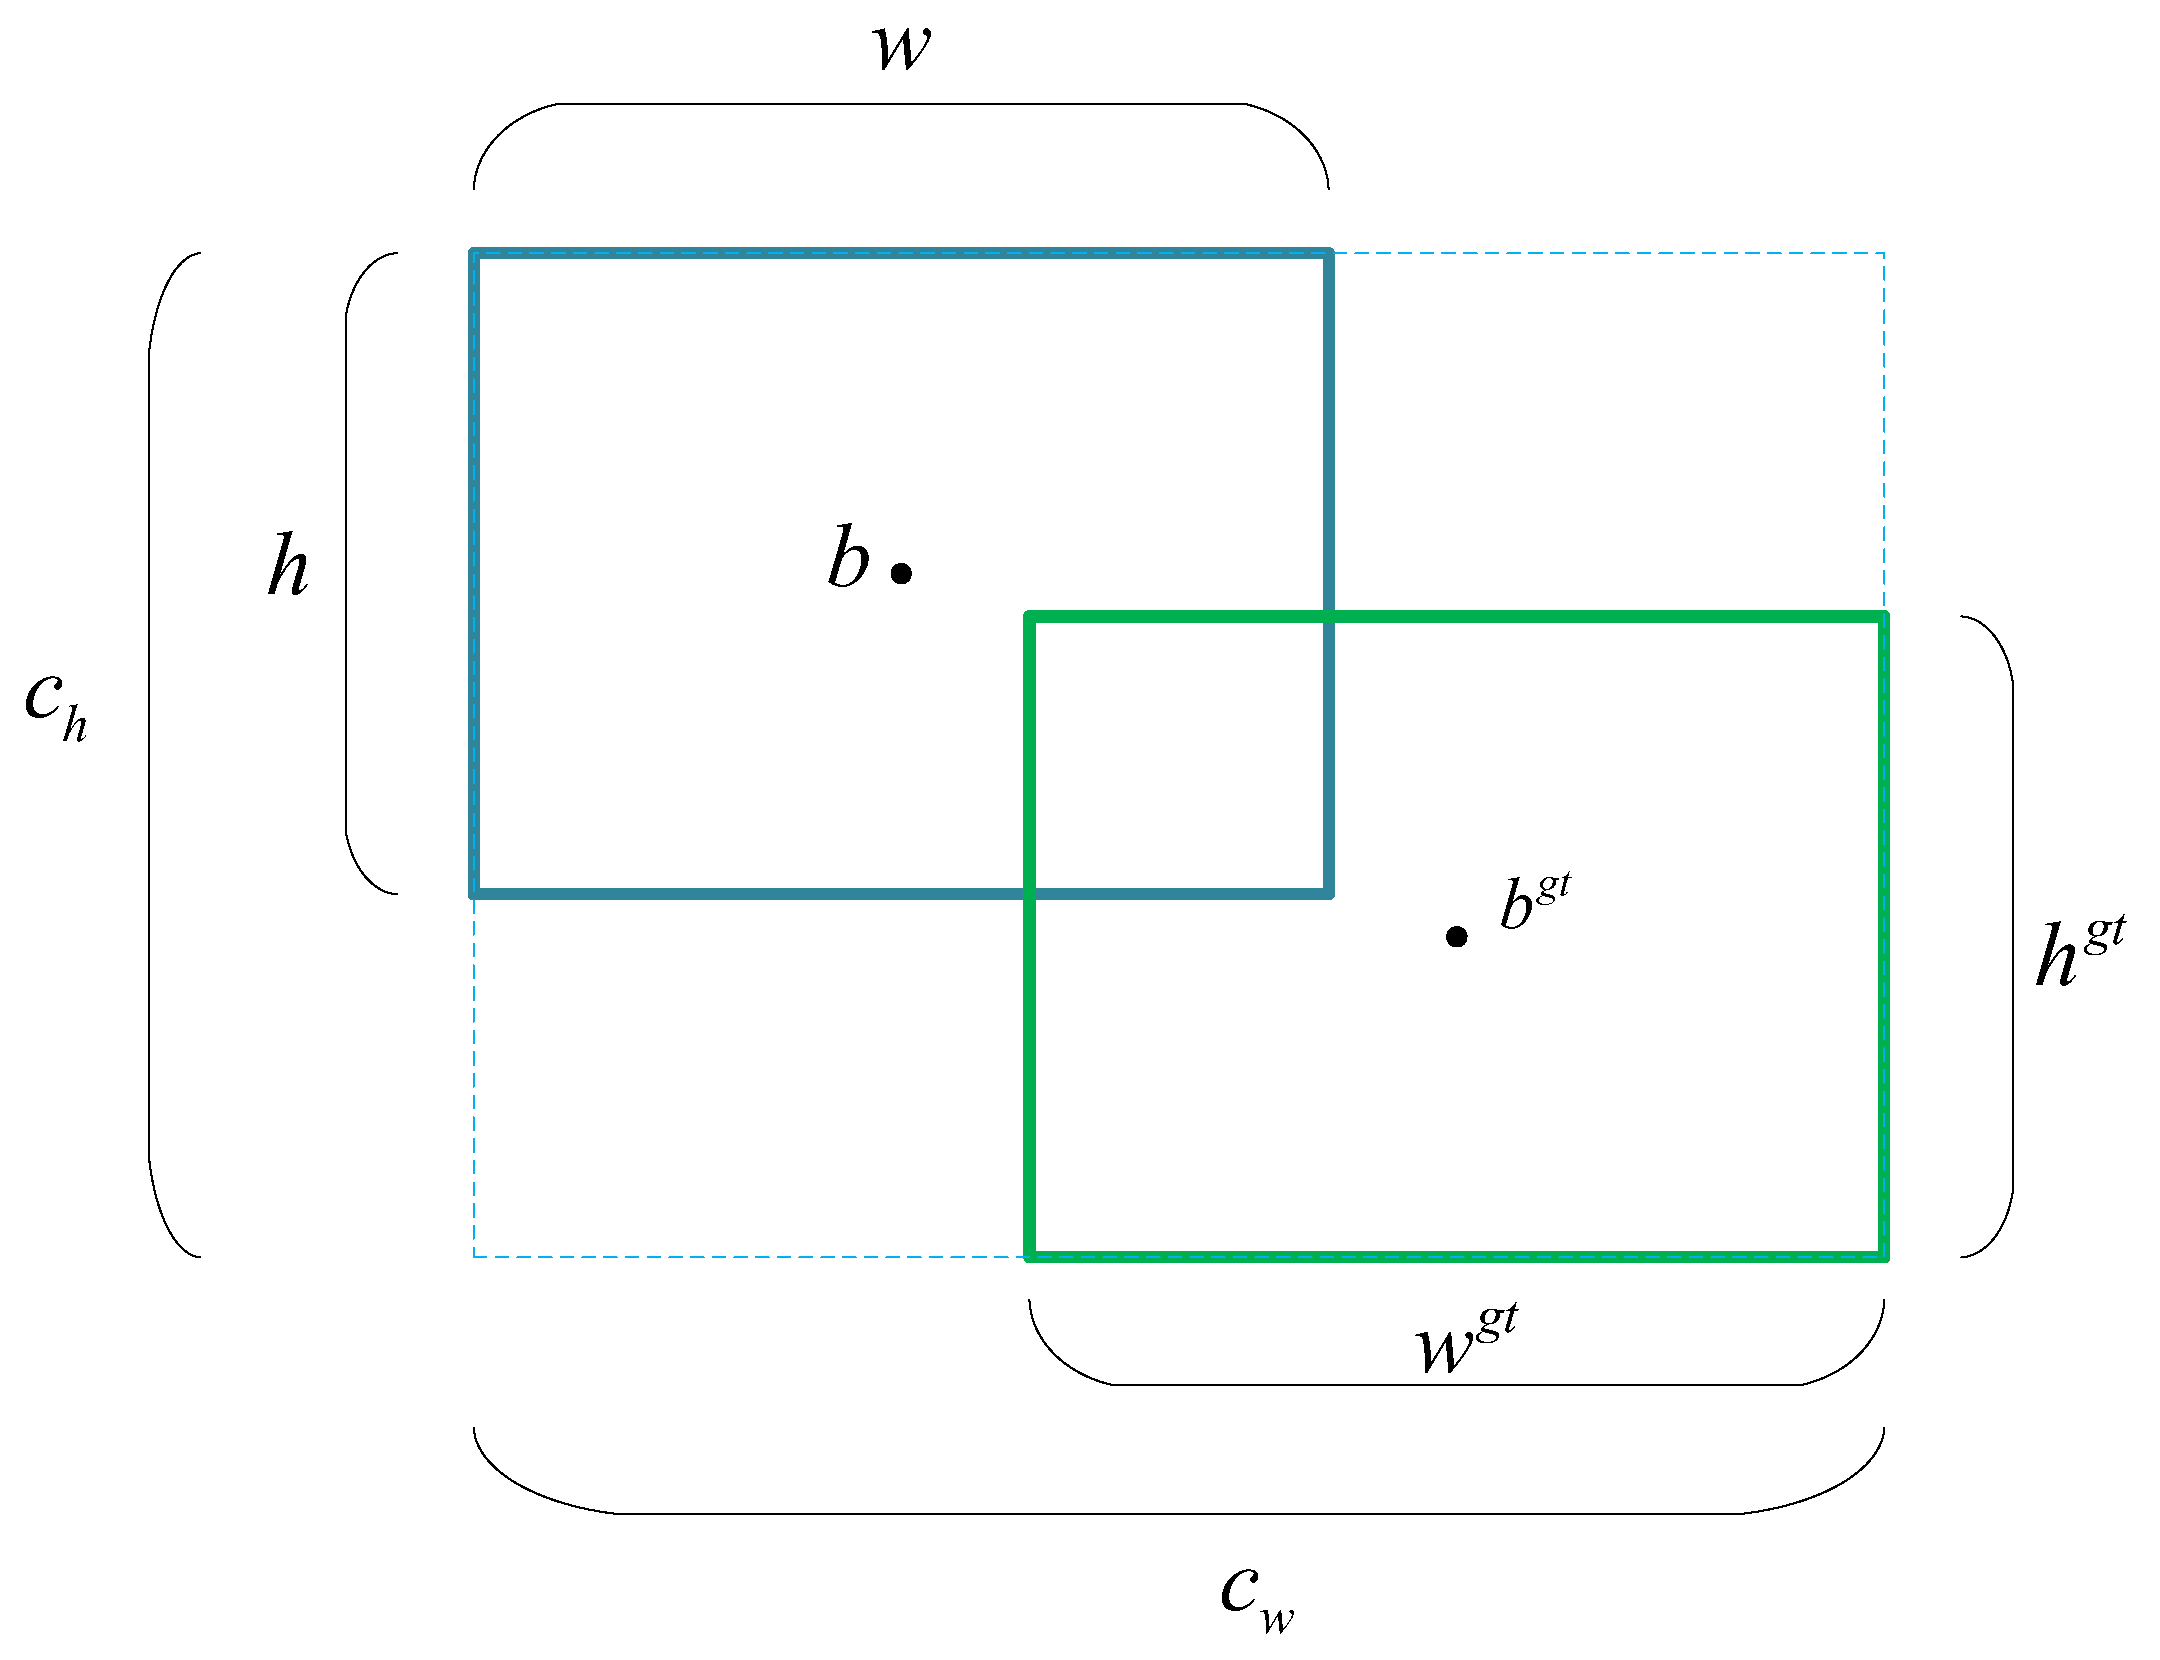
- The EIOU loss function introduces more parameters to calculate the overlap area, which can measure the overlap degree of the predicted box and the real box more accurately. It not only takes into account the proportion of the intersection area between the predicted box and the real box to the union area, but also takes into account the shape, direction and center point distance and other factors. These factors work together to calculate the loss, which can more fully reflect the spatial relationship between the two boxes. This makes it more sensitive when dealing with small targets, thus improving the accuracy of target detection.
3. Method
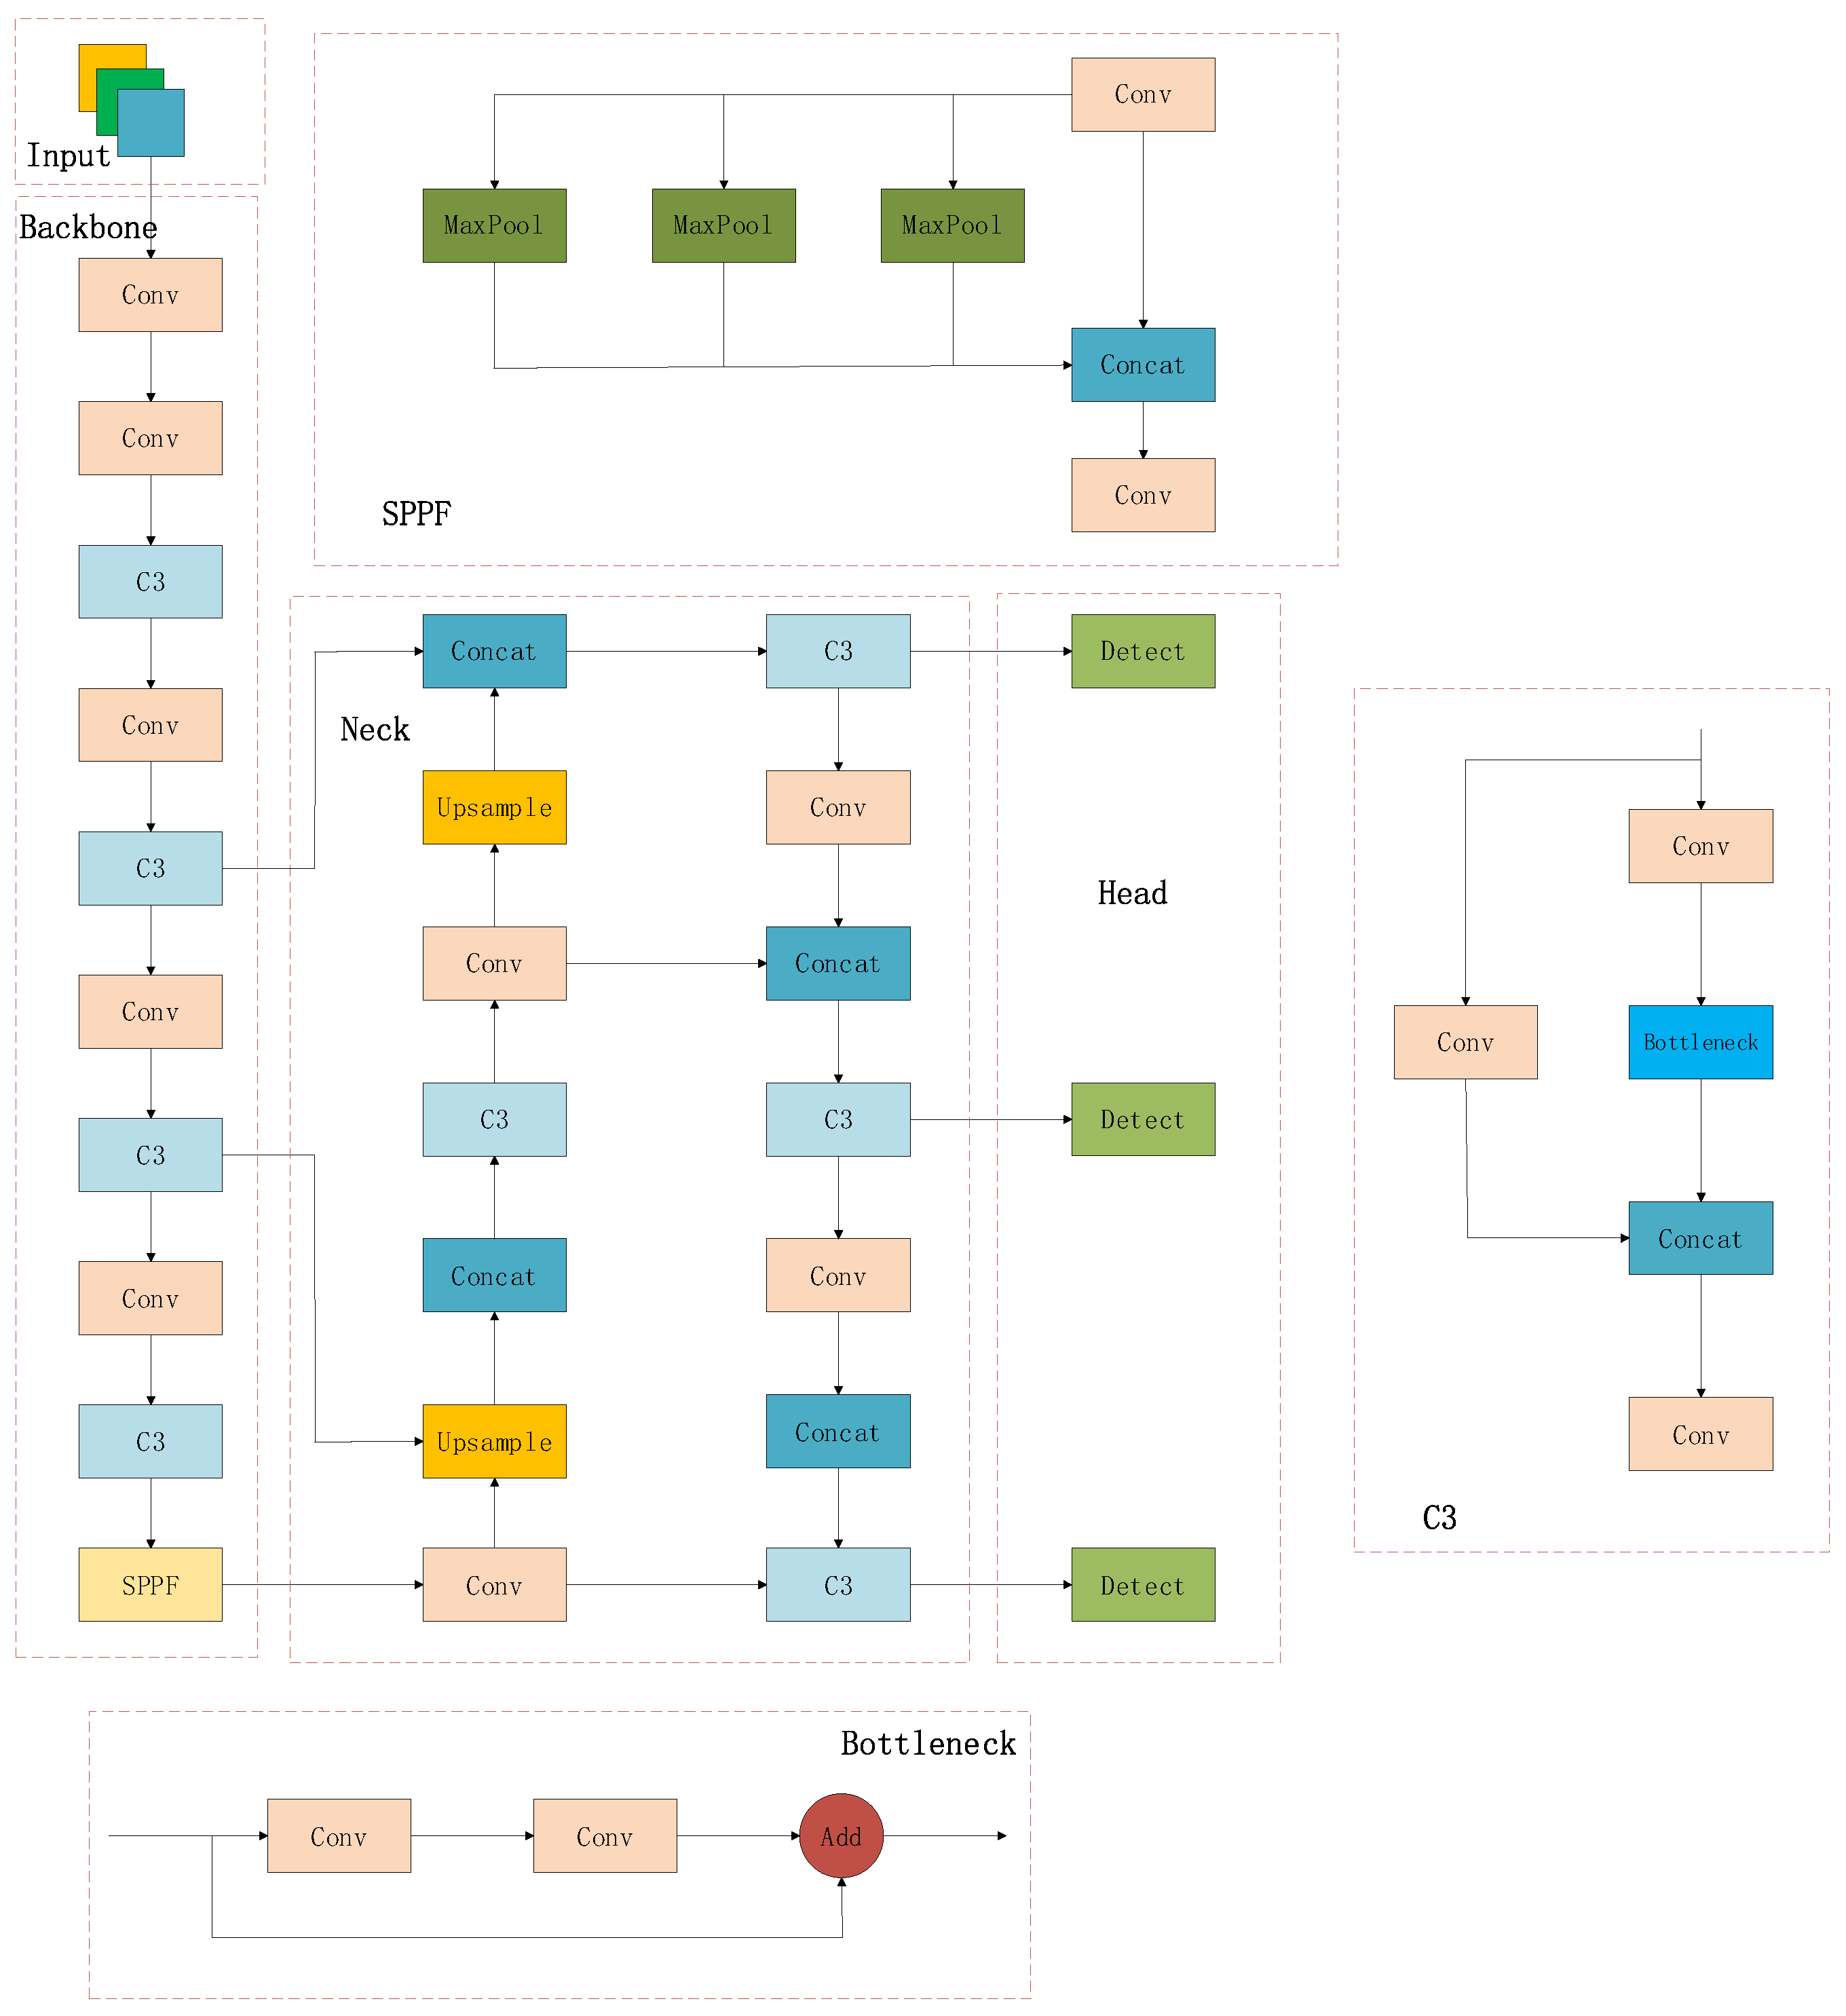
3.1. YOLOv5
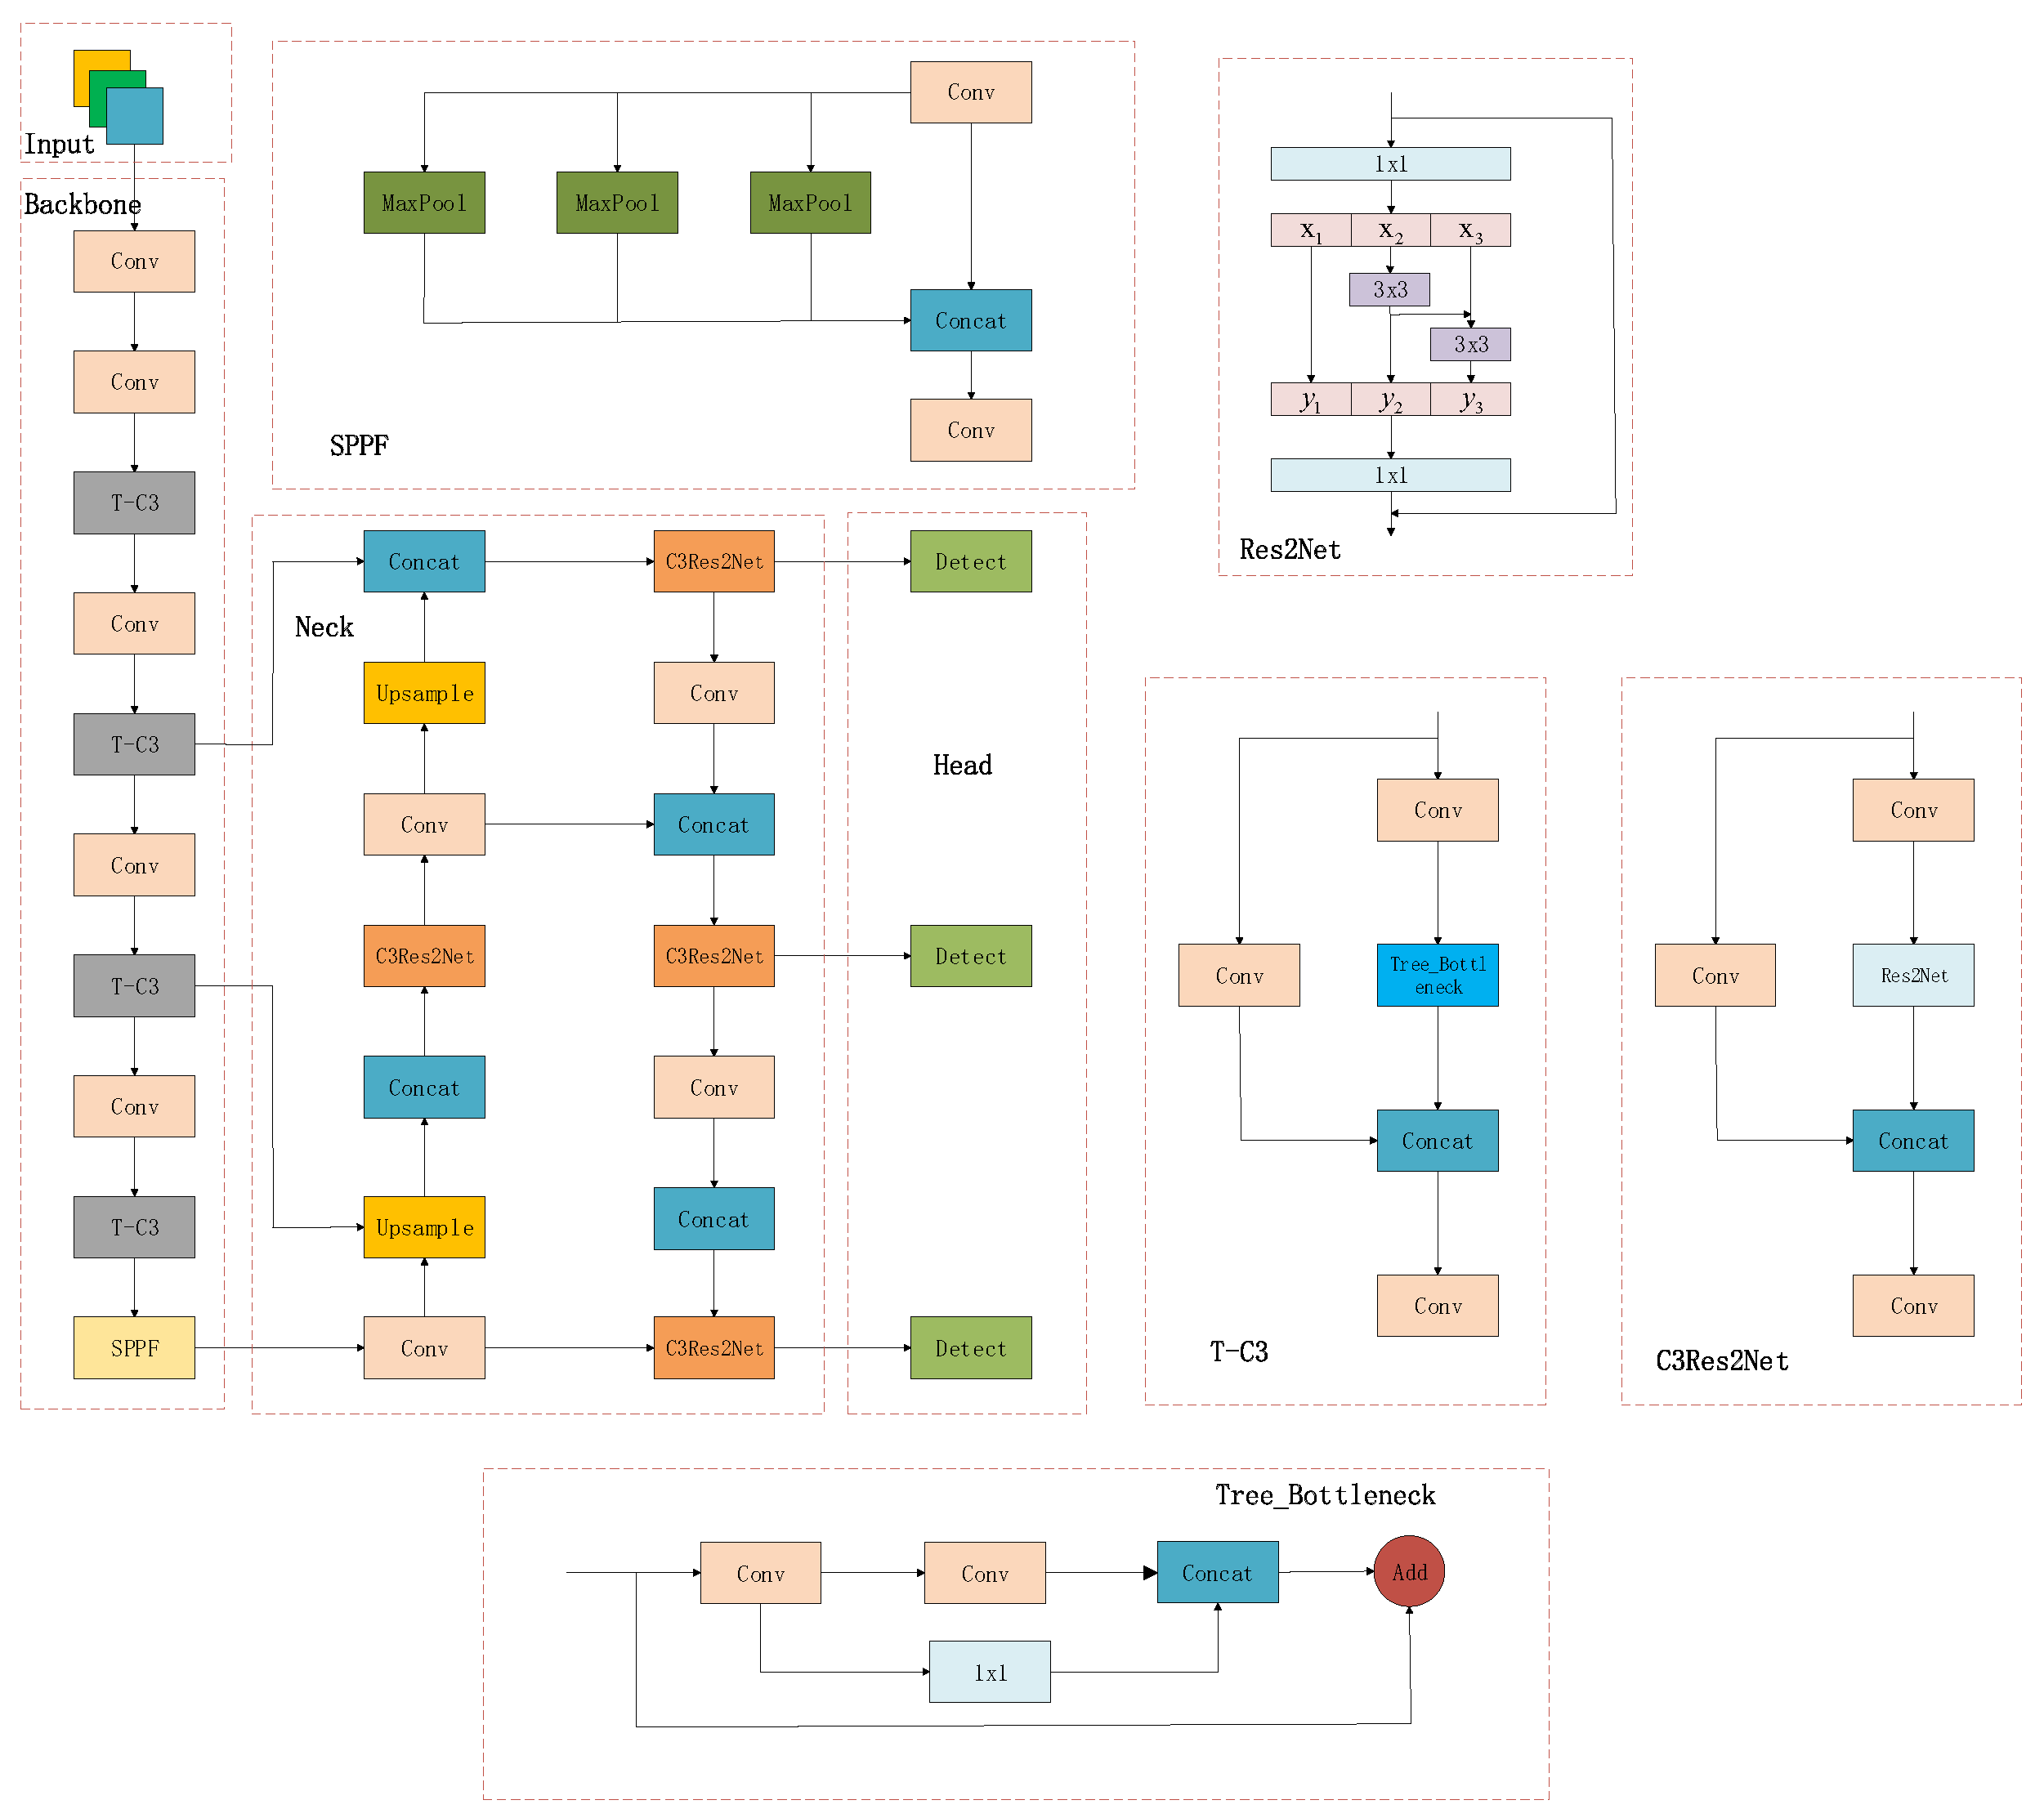
3.2. TCE-YOLOv5
3.3. T-C3
3.4. C3Res2Net
3.5. Loss Function
4. Experiment and Result Analysis
4.1. Experiment Settings
4.2. Datasets
4.3. Evaluation Metrics
4.4. Result Analysis
5. Conclusions
Author Contributions
Funding
Data Availability Statement
Conflicts of Interest
Abbreviations
| Name | Representation | Name | Representation |
| x | Input feature map | Weighting factor | |
| y | Output feature map | Aspect ratio parameter | |
| i-layer 3 × 3 Convolution operation | Width of the real box | ||
| Euclidean distance | Height of the real box | ||
| b | Center point of the prediction box | w | Width of the prediction box |
| Center point of the real box | h | Height of the prediction box | |
| [c]c | Diagonal length of the minimum external rectangle. | Width of the minimum external rectangle | |
| Height of the minimum external rectangle |
References
- Ning, J.; Wang, J. Automatic Driving Scene Target Detection Algorithm Based on Improved YOLOv5 Network. In Proceedings of the 2022 International Conference on Computer Network, Electronic and Automation (ICCNEA), Xi’an, China, 23–25 September 2022; pp. 218–222. [Google Scholar]
- Shirmohammadi, S.; Ferrero, A. Camera as the instrument: The rising trend of vision based measurement. IEEE Instrum. Meas. Mag. 2014, 17, 41–47. [Google Scholar] [CrossRef]
- Paden, B.; Čáp, M.; Yong, S.Z.; Yershov, D.; Frazzoli, E. A Survey of Motion Planning and Control Techniques for Self-Driving Urban Vehicles. IEEE Trans. Intell. Veh. 2016, 1, 33–55. [Google Scholar] [CrossRef]
- Cao, Z.; Xu, L.; Niu, Z.; Zhang, C.; You, G.; Zhao, M.; Yang, Y. YOLOv7-Based Autonomous Driving Object Detection Algorithm. In Proceedings of the 2024 9th International Conference on Computer and Communication Systems (ICCCS), Xi’an, China, 19–22 April 2024; pp. 172–177. [Google Scholar]
- Fu, Y.; Li, C.; Yu, F.R.; Luan, T.H.; Zhang, Y. A Survey of Driving Safety with Sensing, Vehicular Communications, and Artificial Intelligence-Based Collision Avoidance. IEEE Trans. Intell. Transp. Syst. 2022, 23, 6142–6163. [Google Scholar] [CrossRef]
- Mahadevkar, S.V.; Khemani, B.; Patil, S.; Kotecha, K.; Vora, D.R.; Abraham, A.; Gabralla, L.A. A Review on Machine Learning Styles in Computer Vision—Techniques and Future Directions. IEEE Access 2022, 10, 107293–107329. [Google Scholar] [CrossRef]
- Lv, Z.; Song, H. Mobile Internet of Things Under Data Physical Fusion Technology. IEEE Internet Things J. 2020, 7, 4616–4624. [Google Scholar] [CrossRef]
- He, K.; Zhang, X.; Ren, S.; Sun, J. Deep residual learning for image recognition. In Proceedings of the IEEE Conference on Computer Vision and Pattern Recognition (CVPR), Las Vegas, NV, USA, 27–30 June 2016; pp. 770–778. [Google Scholar]
- Shu, H.; Liu, T.; Mu, X.; Cao, D. Driving Tasks Transfer Using Deep Reinforcement Learning for Decision-Making of Autonomous Vehicles in Unsignalized Intersection. IEEE Trans. Veh. Technol. 2022, 71, 41–52. [Google Scholar] [CrossRef]
- Ren, H.; Jing, F.; Li, S. DCW-YOLO: Road Object Detection Algorithms for Autonomous Driving. IEEE Access 2024. early access. [Google Scholar] [CrossRef]
- David, G. Object Recognition from Local Scale-invariant Features. In Proceedings of the International Conference on Computer Vision, Kerkyra, Greece, 20–27 September 1999; pp. 1150–1157. [Google Scholar]
- Surasak, T.; Takahiro, I.; Cheng, C.H.; Wang, C.E.; Sheng, P.Y. His togram of Oriented Gradients for Human Detection in Video. In Proceedings of the International Conference on Business and Industrial Research (ICBIR), Bangkok, Thailand, 17–18 May 2018; pp. 172–176. [Google Scholar]
- Krizhevsky, A.; Sutskever, I.; Hinton, G.E. ImageNet classification with deep convolutional neural networks. Adv. Neural Inf. Process. Syst. 2012, 25, 1097–1105. [Google Scholar] [CrossRef]
- Girshick, R.; Donahue, J.; Darrell, T.; Malik, J. Rich Feature Hierarchies for Accurate Object Detection and Semantic Segmentation. In Proceedings of the IEEE Conference on Computer Vision and Pattern Recognition, Columbus, OH, USA, 23–28 June 2014; pp. 580–587. [Google Scholar]
- Redmon, J.; Redmon; Divvala, S.; Girshick, R.; Farhadi, A. You Only Look Once: Unified, Real-Time Object Detection. In Proceedings of the IEEE Conference on Computer Vision and Pattern Recognition (CVPR), Las Vegas, NV, USA, 27–30 June 2016; pp. 779–788. [Google Scholar]
- Redmon, J.; Farhadi, A. Yolov3: An incremental improvement. arXiv 2018, arXiv:1804.02767. [Google Scholar]
- Bochkovskiy, A.; Wang, C.Y.; Liao, H.Y.M. Yolov4: Optimal Speed and Accuracy of Object Detection. arXiv 2020, arXiv:2004.10934. [Google Scholar]
- Zhu, X.; Lyu, S.; Wang, X.; Zhao, Q. TPH-YOLOv5: Improved YOLOv5 based on transformer prediction head for object detection on drone-captured scenarios. In Proceedings of the IEEE/CVF International Conference on Computer Vision, Montreal, BC, Canada, 11–17 October 2021; pp. 2778–2788. [Google Scholar]
- Wang, C.Y.; Bochkovskiy, A.; Liao, H.Y.M. YOLOv7: Trainable bag-of-freebies sets new state-of-the-art for real-time object detectors. In Proceedings of the IEEE Conference on Computer Vision and Pattern Recognition, Vancouver, BC, Canada, 17–24 June 2023; pp. 7464–7475. [Google Scholar]
- Liu, Y.; Shen, S. Vehicle Detection and Tracking Based on Improved YOLOv8. IEEE Access 2025, 13, 24793–24803. [Google Scholar] [CrossRef]
- Wang, A.; Chen, H.; Liu, L.; Chen, K.; Lin, Z.; Han, J. Yolov10: Real-time end-to-end object detection. Adv. Neural Inf. Process. Syst. 2024, 37, 107984–108011. [Google Scholar]
- Zhu, L.; Geng, X.; Li, Z.; Liu, C. Improving YOLOv5 with attention mechanism for detecting boulders from planetary images. Remote Sens. 2021, 13, 3776. [Google Scholar] [CrossRef]
- Dong, X.; Yan, S.; Duan, C. A lightweight vehicles detection network model based on YOLOv5. Eng. Appl. Artif. Intell. 2022, 113, 104914. [Google Scholar] [CrossRef]
- Liu, X.; Wang, Y.; Yu, D.; Yuan, Z. YOLOv8-FDD: A Real-Time Vehicle Detection Method Based on Improved YOLOv8. IEEE Access 2024, 12, 136280–136296. [Google Scholar] [CrossRef]
- Wang, H.; Ma, Z. Small Target Detection Algorithm of Edge Scene Based on Improved YOLOv8. In Proceedings of the 2024 13th International Conference of Information and Communication Technology (ICTech), Xiamen, China, 12–14 April 2024; pp. 124–128. [Google Scholar]
- Cao, Y.; Li, C.; Peng, Y.; Ru, H. MCS-YOLO: A multiscale object detection method for autonomous driving road environment recognition. IEEE Access 2023, 11, 22342–22354. [Google Scholar] [CrossRef]
- Feng, J.; Yi, C. Lightweight detection network for arbitrary-oriented vehicles in UAV imagery via global attentive relation and multi-path fusion. Drones 2022, 6, 108. [Google Scholar] [CrossRef]
- Lai, H.; Chen, L.; Liu, W.; Yan, Z.; Ye, S. STC-YOLO: Small object detection network for traffic signs in complex environments. Sensors 2023, 23, 5307. [Google Scholar] [CrossRef] [PubMed]
- Wang, X.; Zhang, J.; Wang, Y.; Li, M.; Liu, D. Defect Detection of Track Fasteners Based on Pruned YOLO V5 Model. In Proceedings of the 2022 IEEE 11th Data Driven Control and Learning Systems Conference (DDCLS), Chengdu, China, 3–5 August 2022. [Google Scholar]
- Farooq, M.A.; Shariff, W.; Corcoran, P. Evaluation of Thermal Imaging on Embedded GPU Platforms for Application in Vehicular Assistance Systems. IEEE Trans. Intell. Veh. 2023, 8, 1130–1144. [Google Scholar] [CrossRef]
- Xia, W.; Li, P.; Huang, H.; Li, Q.; Yang, T.; Li, Z. TTD-YOLO: A Real-Time Traffic Target Detection Algorithm Based on YOLOV5. IEEE Access 2024, 12, 66419–66431. [Google Scholar] [CrossRef]
- He, K.; Zhang, X.; Ren, S.; Sun, J. Spatial pyramid pooling in deep convolutional networks for visual recognition. IEEE Trans. Pattern Anal. Mach. Intell. 2015, 37, 1904–1916. [Google Scholar] [CrossRef] [PubMed]
- Liu, S.; Qi, L.; Qin, H.; Shi, J.; Jia, J. Path aggregation network for instance segmentation. In Proceedings of the IEEE Conference on Computer Vision and Pattern Recognition, Salt Lake City, UT, USA, 18–23 June 2018; pp. 8759–8768. [Google Scholar]
- Wang, Y.; Jin, S.; Yin, C.; Wu, Z. Target Detection Algorithm Based on Improved YOLOv5 for Edge Computing Devices. In Proceedings of the 2023 5th International Conference on Robotics, Intelligent Control and Artificial Intelligence (RICAI), Hangzhou, China, 1–3 December 2023; pp. 965–970. [Google Scholar]
- Rao, L. TreeNet: A lightweight one-shot aggregation convolutional network. arXiv 2021, arXiv:2109.12342. [Google Scholar]
- Gao, S.-H.; Cheng, M.-M.; Zhao, K.; Zhang, X.-Y.; Yang, M.-H.; Torr, P. Res2Net: A new multi-scale backbone architecture. IEEE Trans. Pattern Anal. Mach. Intell. 2021, 43, 652–662. [Google Scholar] [CrossRef]
- Rezatofighi, H.; Tsoi, N.; Gwak, J.; Sadeghian, A.; Reid, I.; Savarese, S. Generalized intersection over union: A metric and a loss for bounding box regression. In Proceedings of the IEEE/CVF Conference on Computer Vision and Pattern Recognition (CVPR), Long Beach, CA, USA, 15–20 June 2019; pp. 658–666. [Google Scholar]
- Zhang, Y.-F.; Ren, W.; Zhang, Z.; Jia, Z.; Wang, L.; Tan, T. Focal and efficient IOU loss for accurate bounding box regression. Neurocomputing 2022, 506, 146–157. [Google Scholar] [CrossRef]
- Zheng, Z.; Wang, P.; Liu, W.; Li, J.; Ye, R.; Ren, D. Distance-IoU loss: Faster and better learning for bounding box regression. Proc. AAAI Conf. Artif. Intell. 2020, 34, 12993–13000. [Google Scholar] [CrossRef]
- Tao, J.; Wang, H.; Zhang, X.; Li, X.; Yang, H. An object detection system based on YOLO in traffic scene. In Proceedings of the 2017 6th International Conference on Computer Science and Network Technology (ICCSNT), Dalian, China, 21–22 October 2017; pp. 315–319. [Google Scholar]
- Zhang, J.; Zou, X.; Kuang, L.D. CCTSDB 2021: A more comprehensive traffic sign detection benchmark. In Human-Centric Computing and Information Sciences; Springer: Berlin, Germany, 2022; Volume 12. [Google Scholar]
- Wang, X.; Gao, H.; Jia, Z.; Li, Z. BL-YOLOv8: An improved road defect detection model based on YOLOv8. Sensors 2023, 23, 8361. [Google Scholar] [CrossRef]
- Yang, J.; Sun, T.; Zhu, W.; Li, Z. A Lightweight Traffic Sign Recognition Model Based on Improved YOLOv5. IEEE Access 2023, 11, 115998–116010. [Google Scholar] [CrossRef]


| Area | Small (IoU = 0.5:0.95) | Mediume (IoU = 0.5:0.95) | Large (IoU = 0.5:0.95) |
|---|---|---|---|
| C3 | 0.461 | 0.616 | 0.781 |
| C3Res2Net | 0.467 | 0.623 | 0.751 |
| Models | Params (M) | Flops (G) | mAP@50 (%) | mAP@50:95 (%) | P (%) | R (%) |
|---|---|---|---|---|---|---|
| YOLOv5 | 7 | 16 | 93.5 | 68. 8 | 94.4 | 87.1 |
| TCE-YOLOv5 | 5.7 | 12.6 | 94.5 | 70.8 | 94.1 | 88.8 |
| YOLOv7-tiny | 6 | 13.2 | 92.8 | 64.5 | 92.2 | 86.2 |
| Improved-YOLOv5 [43] | 5.8 | 13.6 | 91.6 | 66.5 | 90.5 | 86.9 |
| YOLOv8 | 11.1 | 28.7 | 95.2 | 78.0 | 95.0 | 90.8 |
| Models | Params (M) | Flops (G) | mAP@50 (%) | mAP@50:95 (%) | P (%) | R (%) |
|---|---|---|---|---|---|---|
| YOLOv5 | 7 | 16 | 93.5 | 66.3 | 93.9 | 87.8 |
| TCE-YOLOv5 | 5.7 | 12.6 | 93.4 | 66.5 | 93.2 | 87.9 |
| YOLOv7-tiny | 6 | 13.2 | 89.5 | 60.0 | 90.3 | 83.0 |
| Improved-YOLOv5 [43] | 5.8 | 13.7 | 92.0 | 66.1 | 92.7 | 86.3 |
| YOLOv8 | 11.1 | 28.7 | 97.2 | 75.6 | 96.6 | 92.9 |
| Models (FP32) | P (%) | R (%) | mAP@50 (%) | mAP@50:95 (%) | FPS |
|---|---|---|---|---|---|
| YOLOv5 | 94.5 | 87.5 | 93.6 | 69.0 | 30 |
| Improved-YOLOv5 [43] | 90.1 | 87.0 | 92.0 | 66.5 | 20 |
| TCE-YOLOv5 | 93.6 | 89.0 | 94.5 | 70.8 | 32 |
| Models (FP16) | P (%) | R (%) | mAP@50 (%) | mAP@50:95 (%) | FPS |
|---|---|---|---|---|---|
| YOLOv5 | 94.4 | 87.6 | 93.6 | 69.0 | 53 |
| Improved-YOLOv5 [43] | 89.9 | 87.2 | 92.0 | 66.4 | 51 |
| TCE-YOLOv5 | 93.9 | 88.8 | 94.6 | 70.5 | 61 |
| T-C3 | C3Res2Net | EIOU | P (%) | R (%) | mAP@50 (%) | mAP@50:95 (%) | Params (M) |
|---|---|---|---|---|---|---|---|
| 94.4 | 87.1 | 93.5 | 68.8 | 7 | |||
| ✓ | 93.6 | 87.0 | 93.5 | 68.4 | 6.2 | ||
| ✓ | 94.2 | 90.1 | 94.4 | 71.9 | 6.5 | ||
| ✓ | 94.1 | 87.6 | 94.0 | 70.0 | 7 | ||
| ✓ | ✓ | 94.4 | 88.8 | 94.2 | 70.3 | 5.7 | |
| ✓ | ✓ | 94.3 | 88.6 | 94.2 | 70.4 | 6.2 | |
| ✓ | ✓ | ✓ | 94.1 | 88.8 | 94.5 | 70.8 | 5.7 |
Disclaimer/Publisher’s Note: The statements, opinions and data contained in all publications are solely those of the individual author(s) and contributor(s) and not of MDPI and/or the editor(s). MDPI and/or the editor(s) disclaim responsibility for any injury to people or property resulting from any ideas, methods, instructions or products referred to in the content. |
© 2025 by the authors. Licensee MDPI, Basel, Switzerland. This article is an open access article distributed under the terms and conditions of the Creative Commons Attribution (CC BY) license (https://creativecommons.org/licenses/by/4.0/).
Share and Cite
Wang, H.; Yang, Z.; Liu, Q.; Zhang, Q.; Wang, H. TCE-YOLOv5: Lightweight Automatic Driving Object Detection Algorithm Based on YOLOv5. Appl. Sci. 2025, 15, 6018. https://doi.org/10.3390/app15116018
Wang H, Yang Z, Liu Q, Zhang Q, Wang H. TCE-YOLOv5: Lightweight Automatic Driving Object Detection Algorithm Based on YOLOv5. Applied Sciences. 2025; 15(11):6018. https://doi.org/10.3390/app15116018
Chicago/Turabian StyleWang, Han, Zhenwei Yang, Qiaoshou Liu, Qiang Zhang, and Honggang Wang. 2025. "TCE-YOLOv5: Lightweight Automatic Driving Object Detection Algorithm Based on YOLOv5" Applied Sciences 15, no. 11: 6018. https://doi.org/10.3390/app15116018
APA StyleWang, H., Yang, Z., Liu, Q., Zhang, Q., & Wang, H. (2025). TCE-YOLOv5: Lightweight Automatic Driving Object Detection Algorithm Based on YOLOv5. Applied Sciences, 15(11), 6018. https://doi.org/10.3390/app15116018