Article

Wave-Screening Methods for Prestress-Loss Assessment of a Large-Scale Post-Tensioned Concrete Bridge Model Under Outdoor Conditions

1
Bundesanstalt für Materialforschung und -prüfung (BAM), 12205 Berlin, Germany
2
Department of Earth and Environmental Sciences, Ludwig-Maximilians-University, 80333 Munich, Germany
3
Institute of Geophysics, University of Hamburg, 20146 Hamburg, Germany
*
Author to whom correspondence should be addressed.
Appl. Sci. 2025, 15(11), 6005; https://doi.org/10.3390/app15116005
Submission received: 24 March 2025 / Revised: 15 May 2025 / Accepted: 22 May 2025 / Published: 27 May 2025

Abstract

:
This paper presents advancements in structural health monitoring (SHM) techniques, with a particular focus on wave-screening methods for assessing prestress loss in a large-scale prestressed concrete (PC) bridge model under outdoor conditions. The wave-screening process utilizes low-frequency wave propagation obtained from seismic interferometry of structural free vibrations and high-frequency wave propagation obtained through ultrasonic transducers embedded in the structure. An adjustable post-tensioning system was employed in a series of experiments to simulate prestress loss. By comparing bridge vibrations under varying post-tensioning forces, the study investigated prestress loss and examined temperature-related effects using the coda wave interferometry (CWI) method. Local structural alterations were analyzed through wave velocity variations, demonstrating sensitivity to bridge temperature changes. The findings indicate that wave-based methods are more effective than traditional modal analysis for damage detection, highlighting the dual impacts of prestress loss and temperature, as well as damage localization. This study underscores the need for long-term measurements to account for temperature fluctuations when analyzing vibration measurements to investigate changes in prestressing force in PC structures.

1. Introduction

Structural Health Monitoring (SHM) techniques have significantly advanced civil engineering, particularly in long-term monitoring of full-scale structures [1]. Among these techniques, operational vibration monitoring, analyzed through Operational Modal Analysis (OMA) [2], has gained popularity due to its non-destructive nature and convenience for large-scale structures. However, vibration monitoring faces challenges, such as environmental effects interfering with vibration signals, complicating the extraction of useful information, and masking local damage [3,4,5].
The sensitivity of modal parameters as damage indicators [6,7] and prestress problems [8,9] further complicates the assessment, making it inaccurate to attribute deviations in fundamental frequency solely to prestress loss [10]. This has led to the development of various OMA-based methods for assessing prestress loss in prestressed concrete (PC) bridges [11], with no single method emerging as definitive. Additionally, factors like tendon relaxation, creep, and shrinkage of concrete significantly influence vibration responses.
To address these issues, this paper aims to develop robust and sensitive damage detection methods based on on-site vibration measurements. Many vibration-based damage identification methods are founded on the premise that structural damage reduces stiffness, altering global vibration responses and natural frequencies [12,13]. The natural frequency of full-scale civil structures is a significant dynamic characteristic and is consequently widely used in civil engineering [14]. Modal analysis, therefore, plays a crucial role in SHM [15].
Recent advancements in active vibration techniques [16,17] have enabled high-frequency excitations, which are more sensitive to minor damage. Karaiskos et al. outlined two main types of ultrasonic pulse velocity (UPV) systems: through-transmission and pulse–echo methods [18]. While pulse–echo techniques are commonly used in homogeneous materials, their effectiveness in concrete is limited due to the material’s inherent heterogeneity [19]. Consequently, surface-mounted piezoelectric transducers have been widely used in SHM. More recently, attention has shifted towards embedded piezoelectric transducers, which can be used in monitoring the hydration process and enabling early-age concrete assessment [20]. Ultrasonic testing has been employed for over three decades to evaluate bridge conditions due to its sensitivity to micro-damage and material inconsistencies [21]. However, high-energy transitions are limited in extensive measurements, and ultrasonics are highly sensitive to environmental temperature changes [22].
In parallel, Lamb waves have been extensively used in SHM applications, particularly due to recent advancements in sensor technology [23]. These waves are highly effective for detecting surface-level damage. However, as noted by Gorgin et al., Lamb wave-based systems are also significantly influenced by environmental and operational conditions, necessitating the implementation of temperature compensation strategies [24]. While Lamb waves are powerful for surface crack detection, our study focuses on internal structural phenomena—specifically, prestress loss and temperature-induced effects—that extend beyond the primary application domain of Lamb wave techniques.
A comprehensive PC bridge model with a post-tensioning system was investigated under outdoor conditions. Various prestressing forces were applied to simulate prestress loss and induce potential damage conditions. Our primary focus is on prestressed bridges, as ageing infrastructure is a pressing issue in many countries, including Germany. Nevertheless, the methodology proposed here is versatile and can be applied to other prestressed or reinforced concrete constructions. This paper presents a dual approach using two different scales of wave-screening methods for damage detection in large-scale structures. Low-frequency wave propagation, extracted from vibration signals using seismic interferometry [25], was compared with high-frequency wave propagation during active ultrasonic testing. Seismic interferometry, which allows impulse responses to be extracted between vibration receivers, offers advantages in detection range over ultrasonic waves.
Our study utilizes coda wave interferometry (CWI) to assess wave velocity variations. The stretching technique [26], as described by Niederleithinger et al., has proven effective in detecting subtle changes in concrete. In this work, it is used to estimate temperature variations and evaluate structural conditions while simultaneously monitoring prestress loss. Compared to conventional modal analysis, this method demonstrates enhanced sensitivity to local structural changes and thermal effects, thereby challenging earlier conclusions [27] that questioned the viability of vibration measurements for assessing prestressing force variations in PC structures.
This paper presents findings from both short-term measurements and continuous monitoring. However, the discussion of bonded versus unbonded post-tensioning systems falls outside the scope of this study.

2. Methods

2.1. The CWI Analysis

Coda waves, characterized by their multiple scattering, spend significantly more time in the material compared to direct waves. This extended propagation time allows them to accumulate signatures of very small changes encountered along their path, providing dense sampling of the medium. Consequently, a notable advantage of coda waves is their high sensitivity to weak perturbations in the medium.
This paper leverages the advantages of coda waves to analyze both low-frequency and ultrasonic wave propagation. The CWI method, which has been applied to seismic [28,29] and ultrasonic [30,31] waveforms, is therefore proposed.
In the CWI method, two coda wave fields are correlated. The cross-correlation (CC) value is used to indicate discrepancies in wave propagation in the local area under different structural conditions. If damage, prestress loss, or other influence factors alter the local structural properties, the wave propagation will change. Therefore, the cross-correlation of the original wave signal u o t and the altered wave signal u a t is used to quantify their consistency, as shown in the following equation:
C C = t 1 t 2 u o t u a t d t t 1 t 2 u o 2 t d t t 1 t 2 u a 2 t d t .
The CC value ranges from 0 to 1. A CC value of 1 indicates that the original wave signal remains unchanged, while a CC value of less than 1 signifies that the altered wave signal differs from the original wave signal.
The stretching method [32] has been proposed to explain the alternation in the original wave signal, which is stretched or compressed by a “velocity perturbation” in the time domain. This velocity perturbation can be formulated as follows:
d v v = δ t t = α ,
where v is velocity, t is time, and α is defined as the stretching factor. The altered wave signal can be represented by the following:
u a t = u o t ( 1 + α ) .
To estimate the value of velocity perturbation α in a range of [ d v v ,   d v v ], the reverse of the altered wave signal presented as u a t α t is used to correlate the original wave signal u o t . By reaching the maximum cross-correlation (max. CC) value of the original signal and the reverse of the altered signal, the velocity perturbation α can be retrieved:
max ( C C ) = t 1 t 2 u o t u a t α t d t t 1 t 2 u o 2 t d t t 1 t 2 u a 2 t α t d t .
In this paper, the original wave signals were selected from the reference data obtained during our monitoring, while the altered wave signals were derived from other data sources.

2.2. CWI of Seismic Interferometry

Seismic interferometry [33] is a technique used to correlate ambient noise fields to derive Green’s functions, which represent wave propagation between two receivers. It can be briefly explained by the convolution of the Green’s function G at points A and B, with time arguments t and t , respectively:
G x B , x s , t G x A , x s , t = G x B , x S , t + t G x A , x S , t d t = G x B , x A , t .
Green’s function represents the system’s response to an impulse with x A and x B denoting the signals recorded at receivers A and B in response to an input signal x s at the source position S over time t .
Equation (5) holds if the receivers A and B are surrounded by random noise sources. If there are limitations in the distribution or frequency content of the noise sources, Green’s function will not be fully reconstructed. However, it may still be useful for further analysis, as shown in recent laboratory experiments [34].
The function G x B , x A , t resulting from the cross-correlation of the signals recorded at two receivers is termed the cross-correlation function (CCF). This function enables the reconstruction of impulse responses, representing the low-frequency wave propagation used in this research. The causal part of the CCF is considered the impulse response for the CWI assessment, correlating the coda parts of the impulsive waves. Consequently, the CWI analysis in low-frequency wave propagation can be described as the “Correlation of Coda in Causal part of CCF”, referred to as the “C4 function” in this study.

3. Experimental Setup and Instrumentation

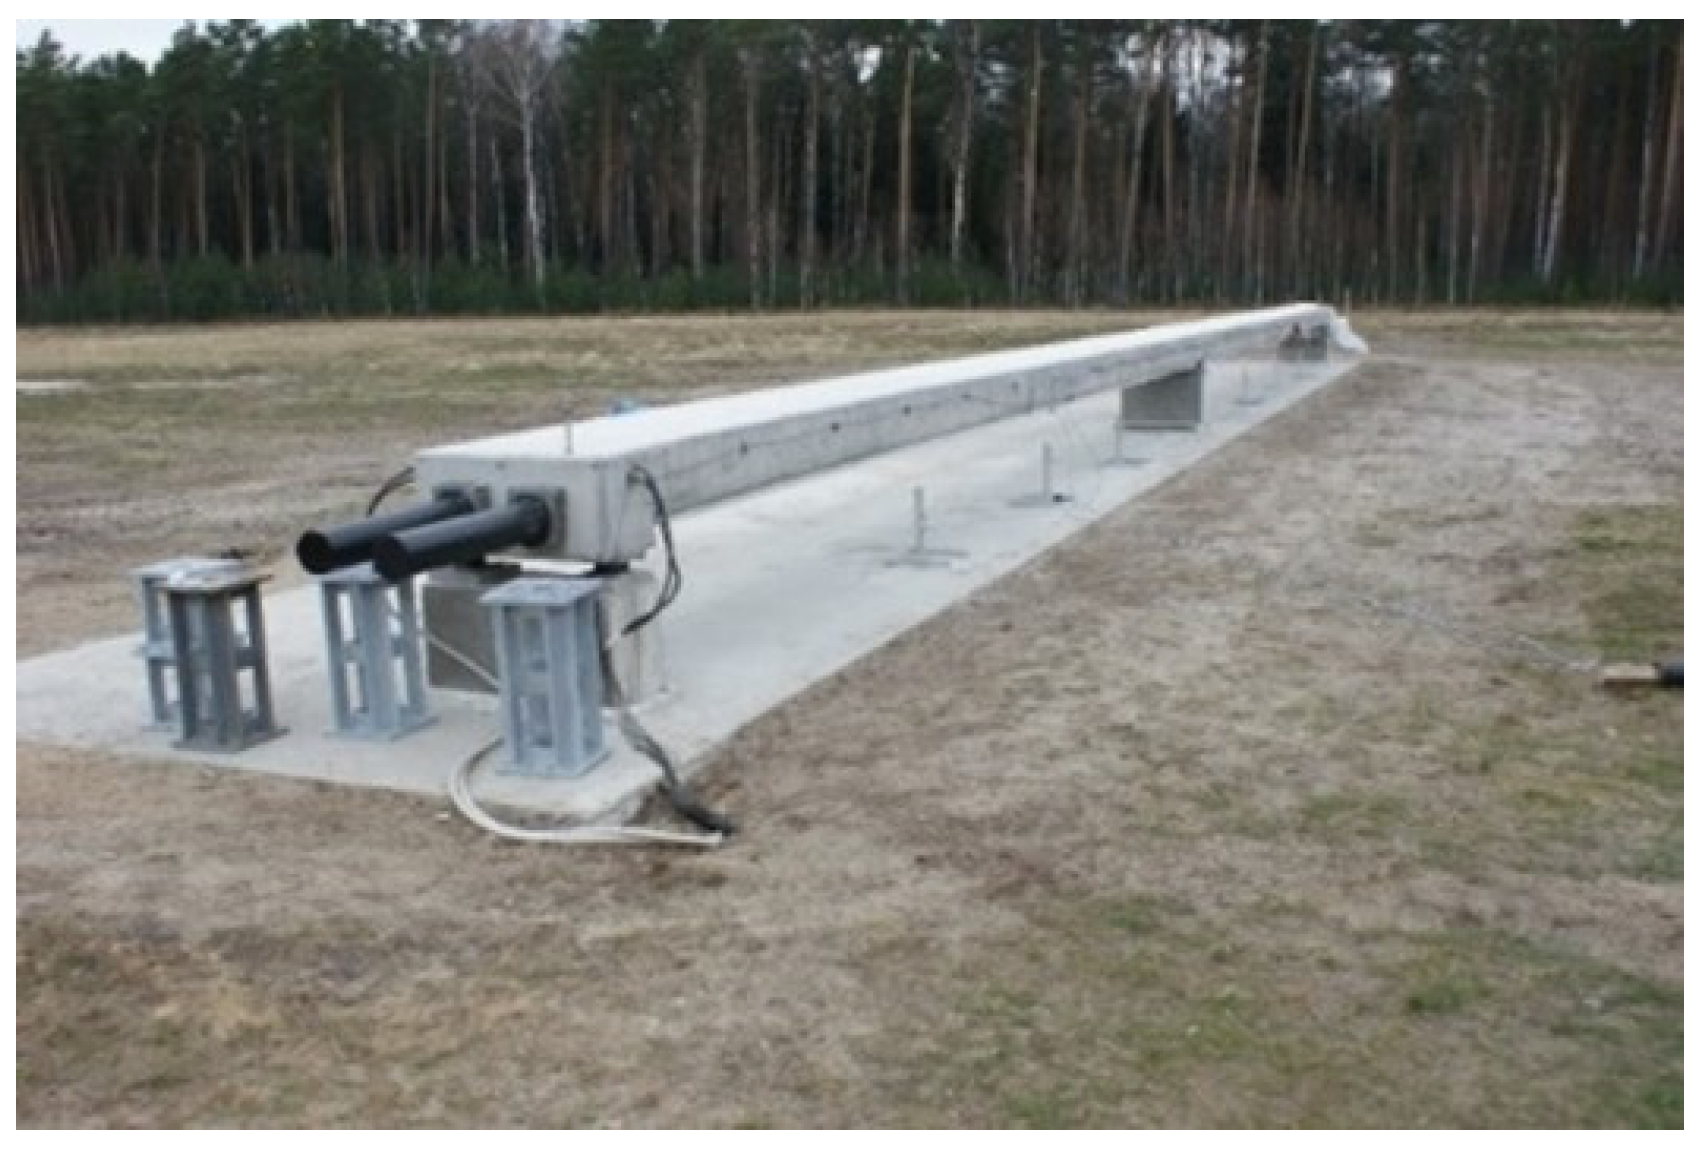
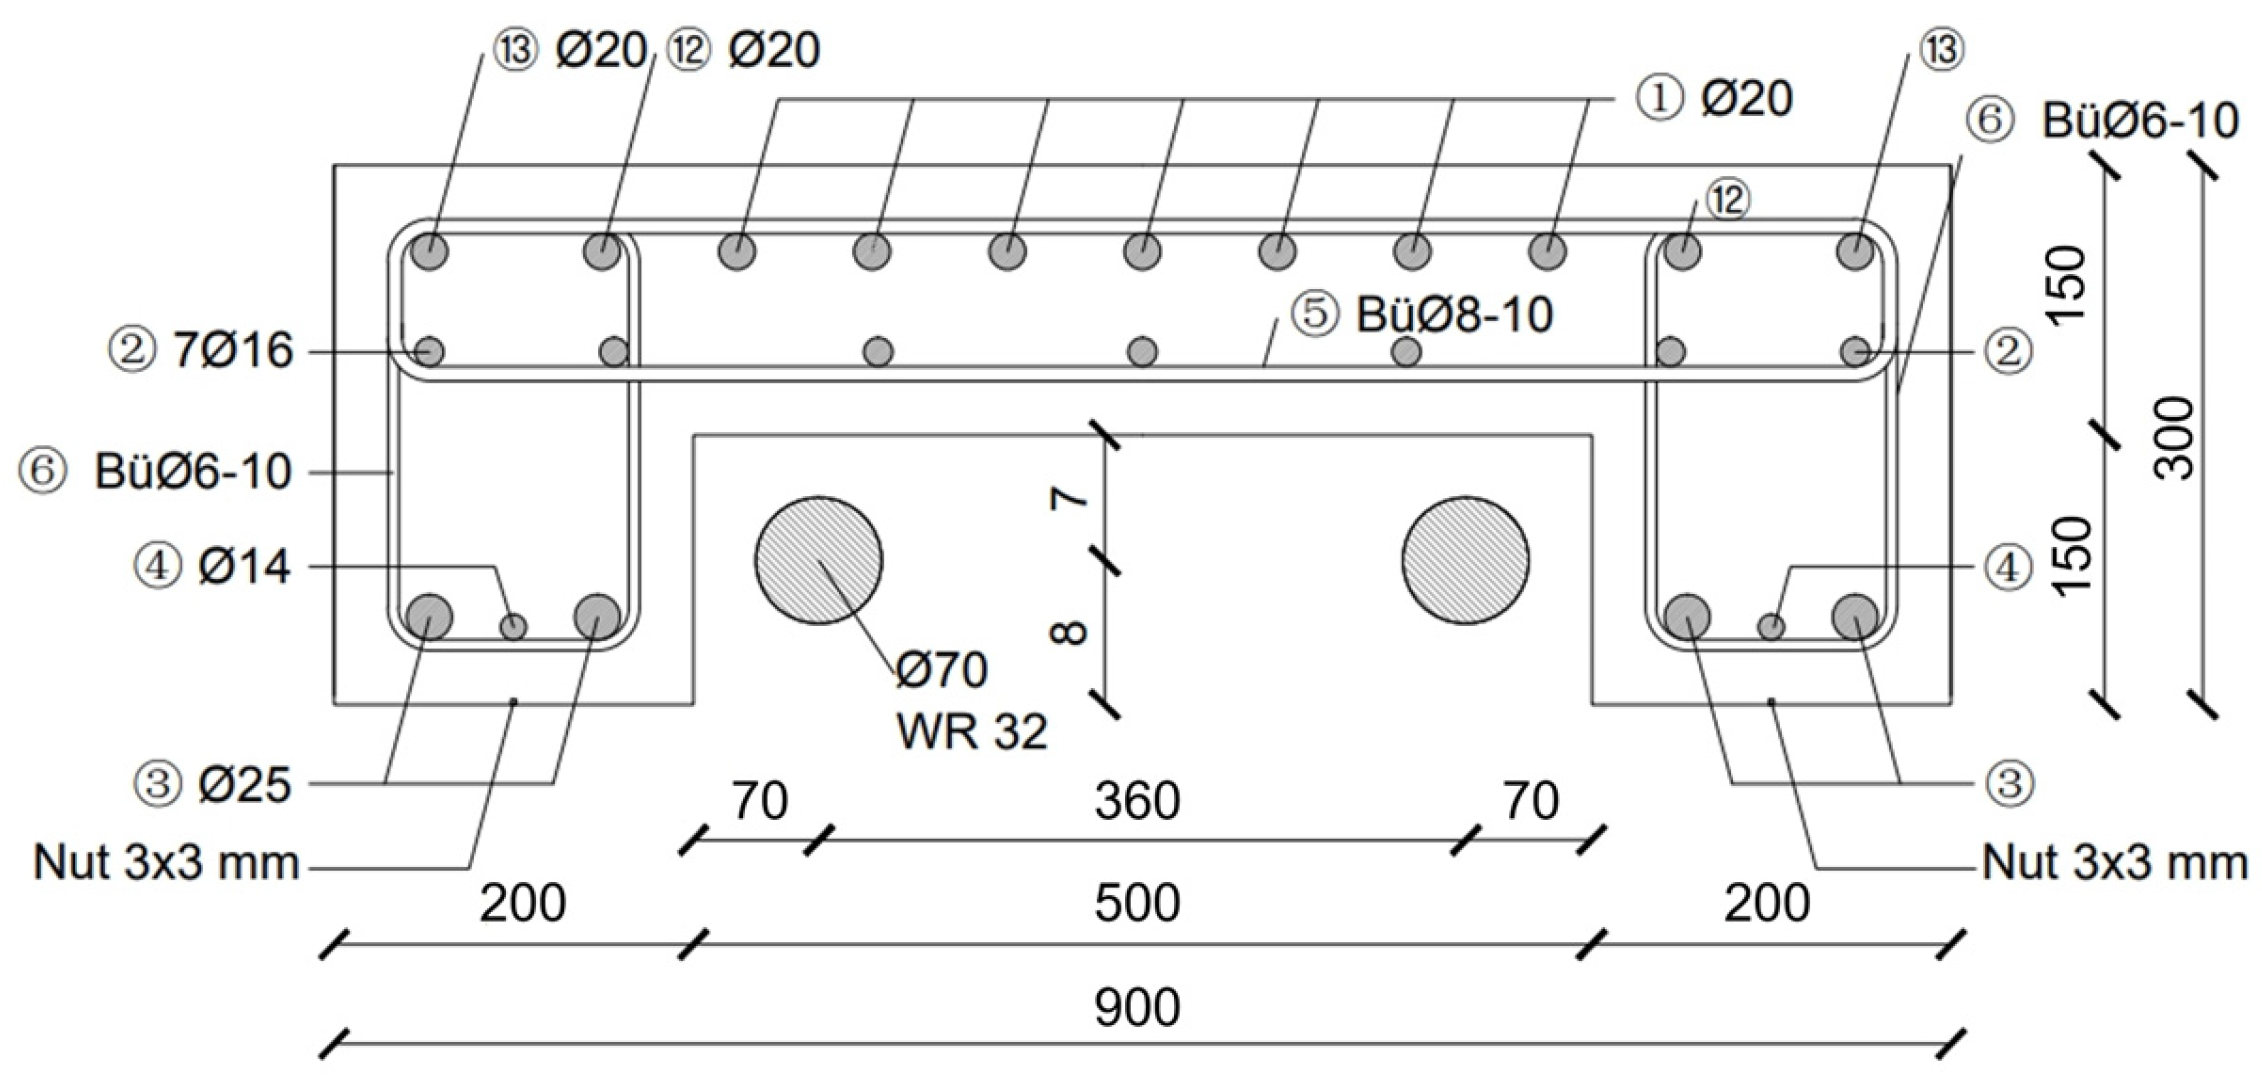
3.1. Bridge Model Description

A large-scale prestressed concrete (PC) bridge model equipped with an adjustable post-tensioning system is shown in Figure 1.
The bridge model is located at the BAM (Bundesanstalt für Materialforschung und -prüfung, Berlin, Germany) test site TTS, 50 km south of Berlin. It is exposed to ambient environmental conditions, including sunshine, wind, and day–night temperature cycles.
The bridge model measures 24 m in length, 0.9 m in width, and 0.3 m in depth (Figure 2). It is a two-span structure, and each span is 12 m. This model is a monolithic beam with three supports and a rigid connection to the foundation slab. It features an inverted U-beam structure with a compression strength based on concrete type C45 and Young’s modulus of 36,000 MPa. Tests on the compressive strength of the concrete were conducted prior to the construction of the bridge model in 2016. However, the compressive strength of the bridge was not monitored during the study.
Figure 3 illustrates the post-tensioning system and the unbonded tendons. It shows two tendon ducts, each containing two steel tendons of type 32WR, as specified in ETA-05/0123 (European Technical Assessment) [35]. These tendons can provide a maximum prestressing force of 676 kN. The prestressing force is applied using hydraulic cylinders, as shown in Figure 3. The force is controlled through the hydraulic oil flow, allowing precise regulation of the tension applied to the steel tendons. By varying the post-tensioning force, openings, and closures in the existing cracks can be induced, generating a range of damage phenomena.

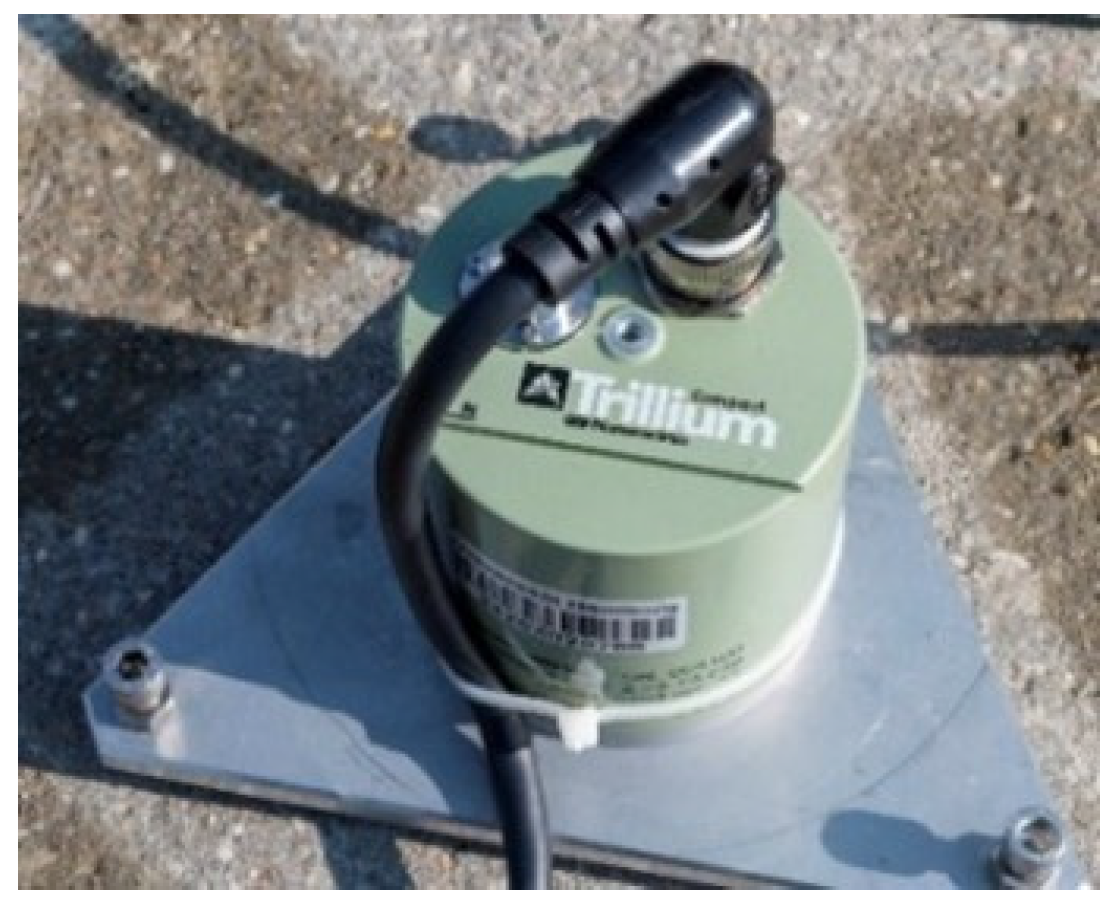
3.2. Sensor Deployment and Measurement Techniques

This section details the deployment of sensors and the measurement techniques used to capture both low- and high-frequency wave phenomena, forming part of a comprehensive instrumentation strategy to monitor the bridge’s dynamic behavior and internal condition.
During the monitoring campaign, several measurement sessions were conducted using a combination of four vibration sensors, four navigation sensors for six-degree-of-freedom (6-DOF) measurements, and twelve geophones. To ensure consistent sensor positioning and adequate spacing throughout the monitoring period, a non-symmetrical configuration across the two spans was adopted. However, since the focus of this paper is on extracting shear wave propagation from the vertical vibrations of the bridge, the configurations of the other sensors are not discussed further.
Free vibration measurements were conducted using a Trillium Compact broadband seismometer to capture low-frequency wave propagation (Figure 4). This highly sensitive instrument measured the vertical translational responses of the bridge at a recording rate of 200 Hz.
For high-frequency wave monitoring, embedded piezoelectric ultrasonic transducers (Figure 5), specifically the Acsys-SO807 model designed by Acoustic Control Systems, Ltd., Moscow, Russia for BAM, were employed. These transducers were embedded in the bridge model from an early age, specifically during concreting, to enable continuous structural monitoring throughout its service life. The hollow piezoceramic design allows each transducer to function as both a transmitter and a receiver, operating at a sampling rate of 2 MHz. Their stable signal quality and low sensitivity to environmental disturbances make them particularly well-suited for in situ wave velocity estimation and crack detection in concrete structures [36,37].
Figure 6 illustrates the deployment of four Trillium Compact vibration sensors. Each is spaced 6 m apart to ensure consistent low-frequency wave propagation paths between adjacent sensors. The bridge features a monolithic cross-section and symmetric spans, with two sensors placed on each span—Stations 1 and 2 on the south and Stations 3 and 4 on the north. Equal spacing between Stations 1–2, 2–3, and 3–4 ensures uniform measurement intervals. An arrow marked with an “N” in Figure 6 indicates the direction of the north. Additionally, ultrasonic transducers were embedded at cross-sections A, B, C, D, and E. The experimental design ensured that the distances between ultrasonic sensor pairs were shorter than those between vibration recording stations. This arrangement facilitates the validation of low-frequency wave propagation using high-frequency ultrasonic measurements within the same measurement region.
This configuration was selected for two main reasons. First, it maintains consistent sensor spacing throughout the monitoring period, ensuring reliable data collection despite the asymmetry relative to the beam centerline. While direct comparison of mid-span displacements between spans is not possible, the setup still provides sufficient spatial resolution to capture structural mode shapes. Second, the layout supports directional comparison between seismic interferometry and ultrasonic wave propagation. For instance, wave travel from Station 1 to 2 corresponds to propagation from A to B, while Station 3 to 4 aligns with D to E. These paths share similar boundary conditions: 2.5 m from the initial support to the first station, 6 m between the first and second stations, and 3.5 m from the second station to the opposite support. This configuration facilitates wave direction reversal, allowing for a more comprehensive analysis of sender–receiver dynamics.
Additionally, one temperature sensor was used to measure air temperature, while two other sensors were inserted in the middle of the bridge, one on the bottom and one on the side (Figure 7). The bridge temperature presented in this paper was derived from the average temperature of both sides. The difference between them was negligible.

4. Vibration Measurements

4.1. Frequency Domain Analysis
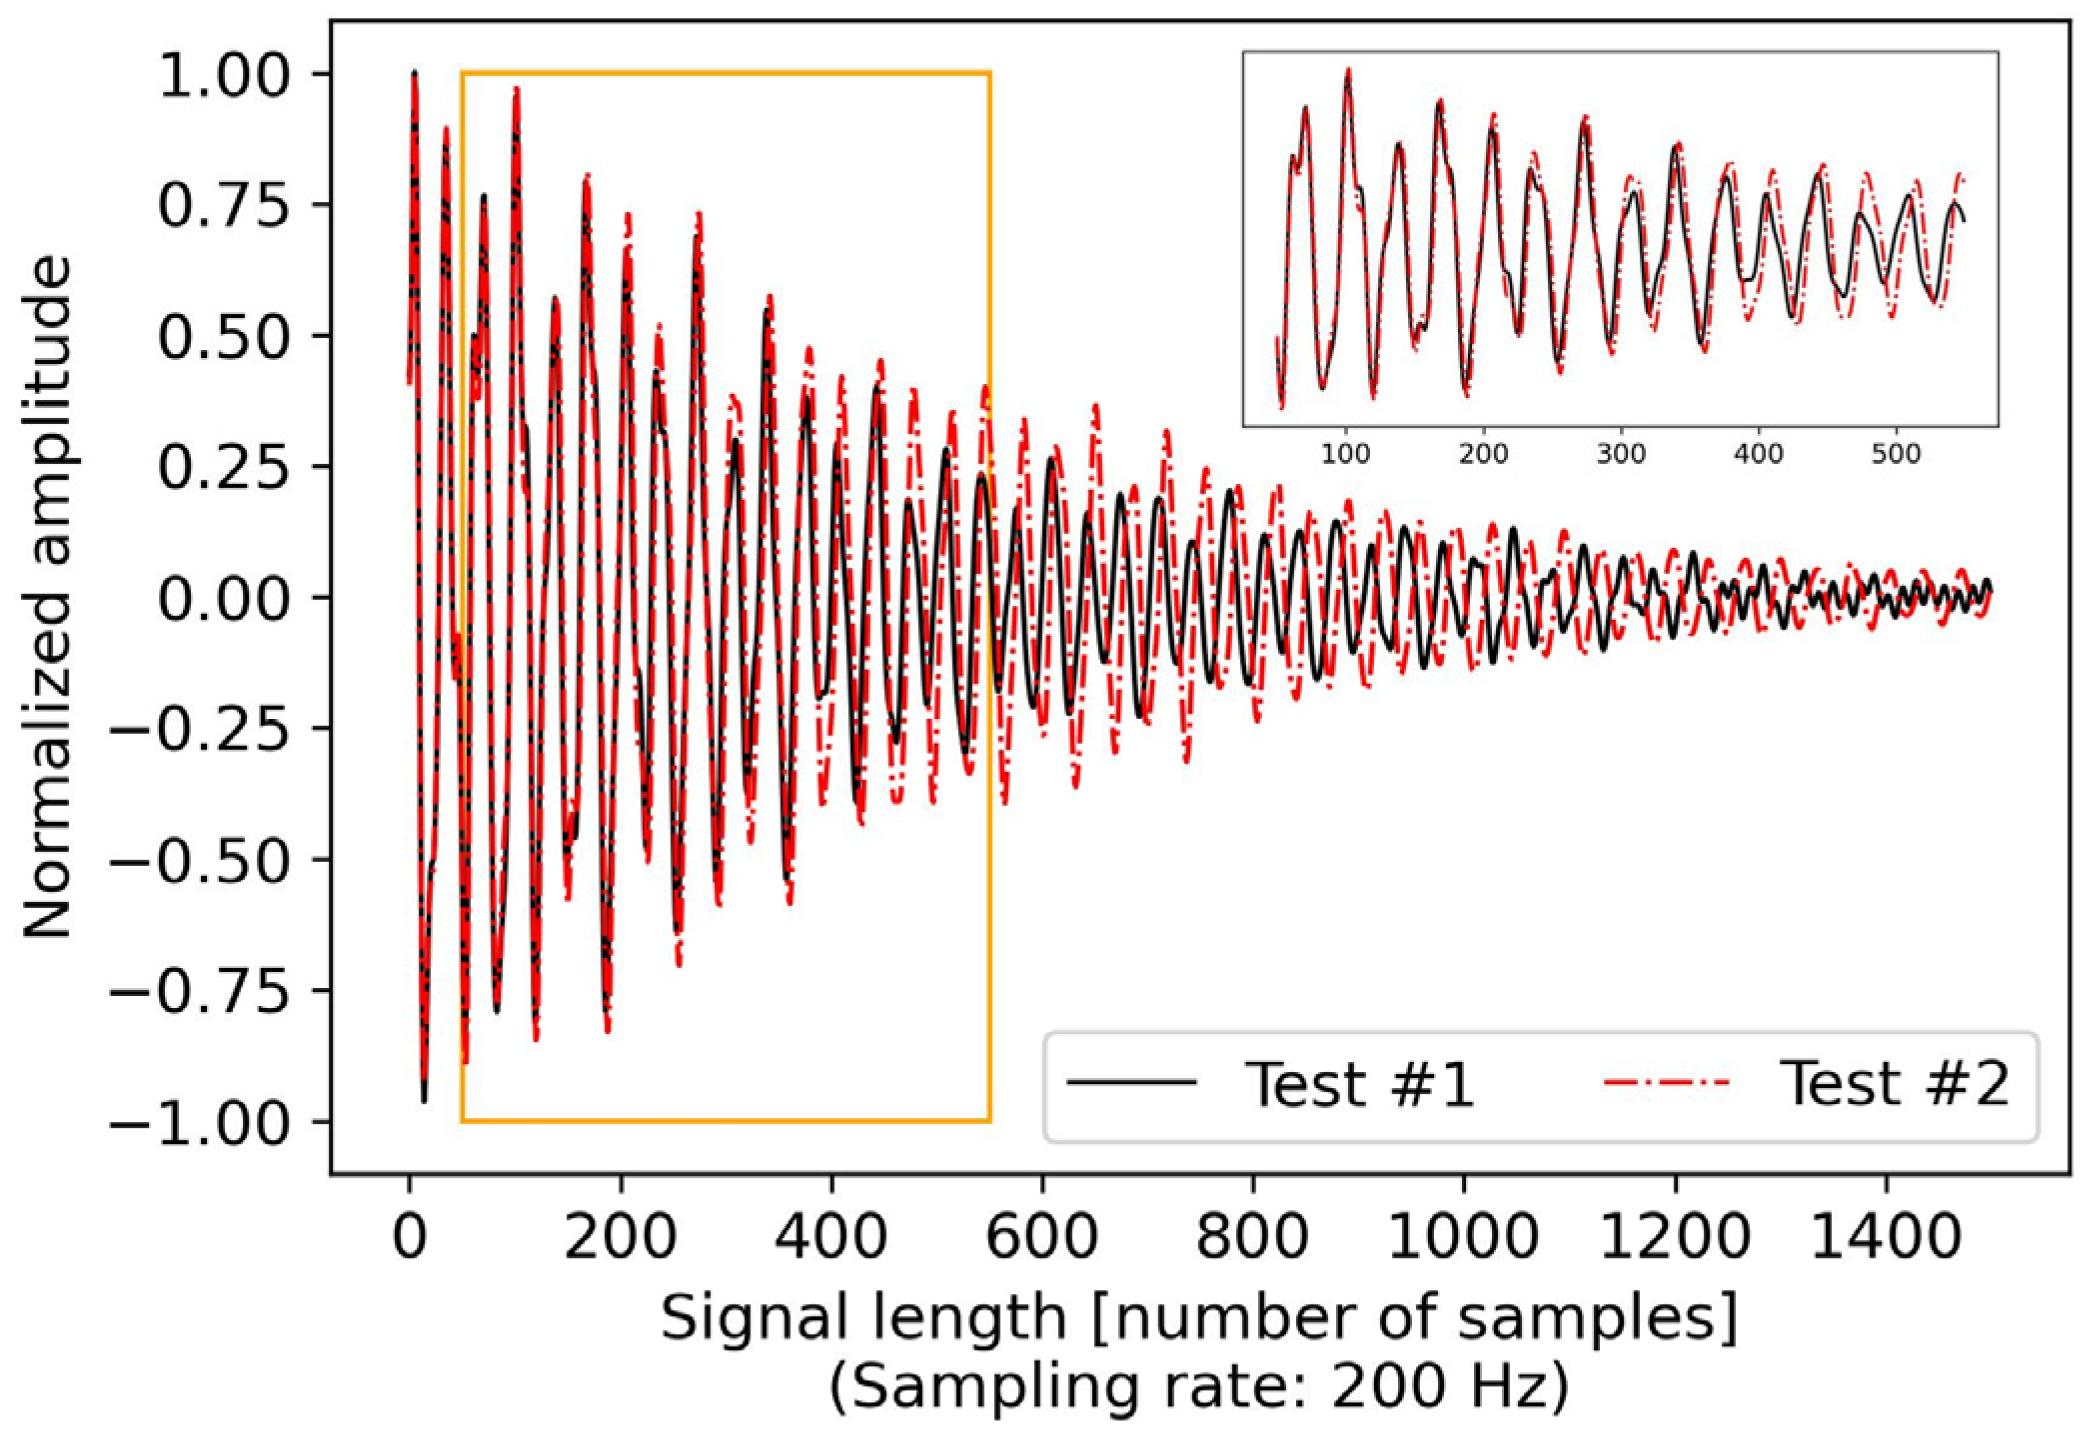
The vibration records at four stations, with a prestressing force of 450 kN applied to the bridge, are transformed into the frequency domain using the Fourier Transform to obtain the frequency spectra of the vibration signals. The frequency spectra, shown in Figure 8, reveal the same peaks, which characterize the global dynamic characteristics of the bridge.

4.2. CCFs

To extract the impulse wave propagation from the vibration measurement data, an example is demonstrated using the vibration records at Stations 1 and 2 on the south span, with a prestressing force of 450 kN applied to the bridge (Figure 9).
These 2-min vibration records, filtered in the frequency range between 1 and 40 Hz, are correlated by iteratively correlating 15-s signal segments to yield eight CCFs. Figure 10 shows the causal parts of the eight CCFs, each with a window length of 7.5 s.
All causal parts of the CCFs were stacked and normalized to enhance the noise signal ratio (NSR) and better match impulse waves.

4.3. Long-Term Monitoring Results

Continuous monitoring under ambient environmental conditions was conducted twice without altering the prestressing forces. The bridge was prestressed at 360 kN and 200 kN, representing normal and low levels of prestressing conditions, respectively.
To retrieve the impulse responses from the vibration measurement data, the procedure introduced in Section 4.2 CCFs was applied to the recordings at the stations. By correlating 15-s segments in traces at two stations as a pair, the total CCFs in an hour were stacked and normalized. The causal parts represent the impulse responses at hourly intervals for over 60 h. The impulse response in the first hour was chosen as the reference wave signal for CWI analysis, allowing for the estimation of velocity variations over the 60-h period.
To identify velocity changes in low- and high-frequency wave propagations, only the wavefield between the vibration Station pair 1–4 was compared with the ultrasonic wavefields, as the velocity variations observed between vibration Station pairs 1–2 and 3–4 were similar to those between vibration Station pair 1–4. The results, shown in Figure 11 and Figure 12, reveal a significant discrepancy in the relationship between velocity variation and bridge temperature. The “bridge temperature difference” in Figure 11, Figure 12, Figure 13 and Figure 14 refers to the comparison with a temperature reference, which is part of the reference data record chosen for CWI analysis. This representation allows measurement data from different days to be combined in a single plot for comparison.
Two different scales of wavelength traveling in their corresponding wave propagation distances demonstrate consistent velocity variation. To quantify the impact of bridge temperature differences, linear regression analysis was applied to show their correlation by ratios (Figure 13 and Figure 14).
The difference between the two ratios under normal and low prestressing conditions in the vibration signals is smaller than that in the ultrasonic signals. Overall, the slopes at 200 kN are steeper than those at 360 kN (Figure 13 and Figure 14). This is because heat can cause existing cracks to open, leading to a greater decrease in velocity. It is straightforward to infer that the bridge has more cracks under 200 kN than under 360 kN, which are influenced by high bridge temperatures, causing more significant velocity decreases. The influence of damage and cracks on velocity/temperature dependence has also been demonstrated in other research [38].
Based on this observation in Figure 12 and Figure 13, the north mid-span is identified as having a higher damage level than the south mid-span. These continuous monitoring results provide a basic assessment for identifying prestress loss in the experiments.

5. Prestress Loss Tests

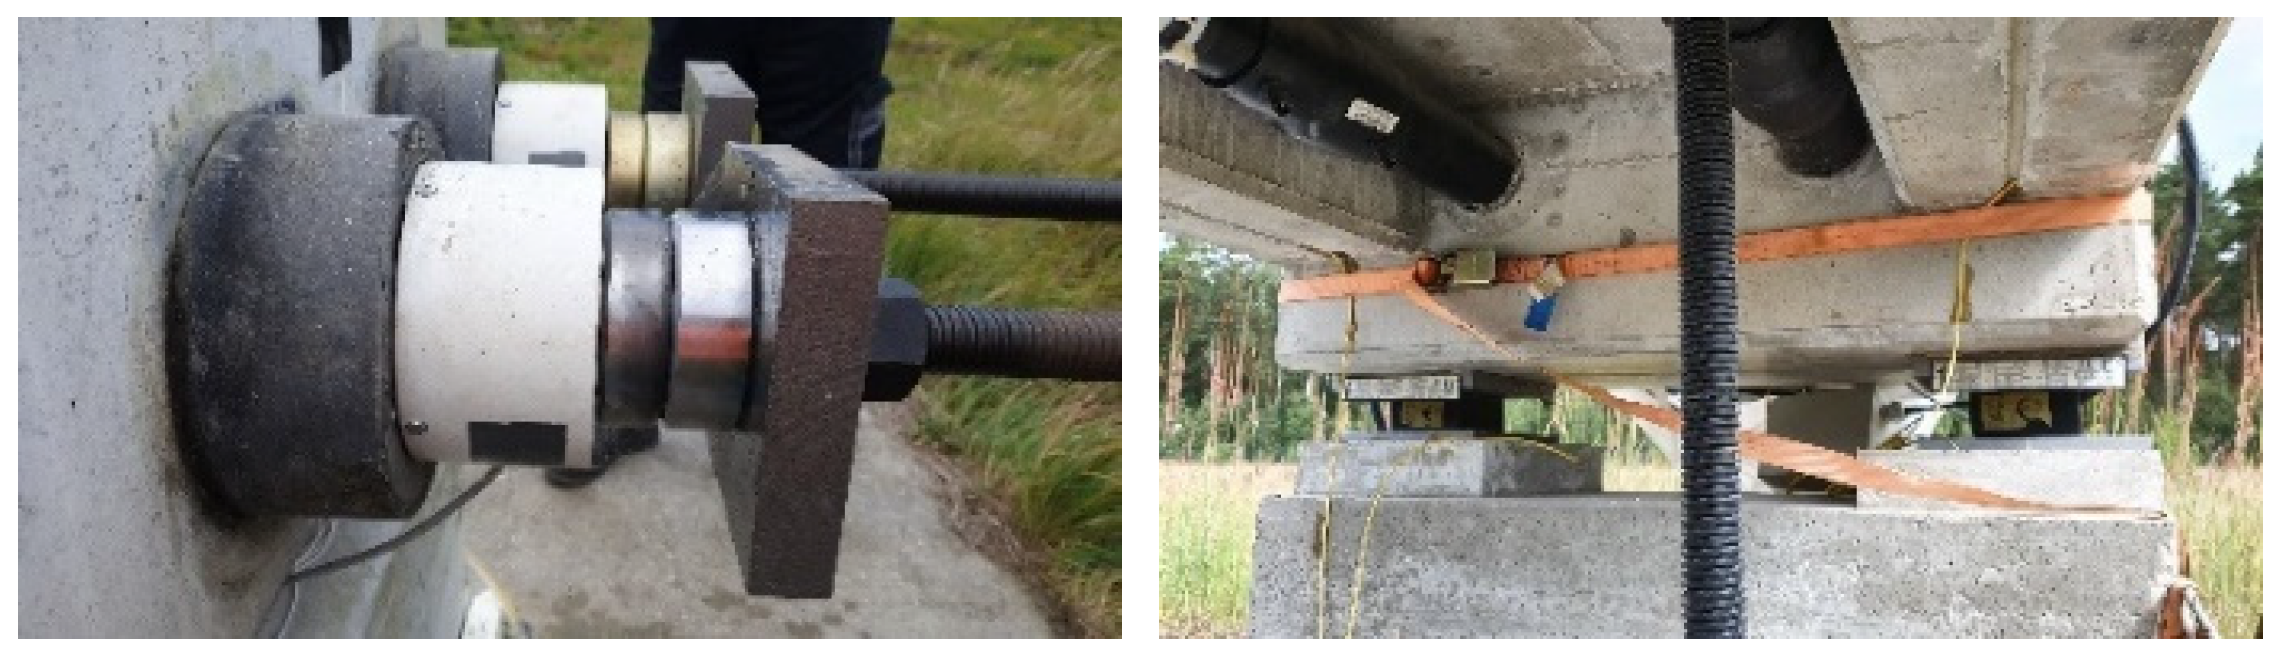
5.1. Prestressing Force Setup

To assess the prestress loss, the prestressing force 450 kN was set as the reference condition. Figure 15 provides an overview of the prestressing force setup. The prestressing force was decreased in steps of 50 kN. After reaching the lowest prestressing force of 200 kN, the force was increased in steps of 50 kN up to 450 kN. In total, there are 11 tests for variable prestressed conditions. Vibration measurements were taken for 10 min during each test, and all vibration records were filtered in the frequency range between 1 and 40 Hz for assessment. The temperature records in Figure 15 highlight the discrepancy between the bridge temperature and the air temperature. Notably, the ambient temperature was higher during tests #1 and #2 due to direct sunshine on the bridge. Subsequently, the sky became cloudy, causing the ambient temperature to drop suddenly. However, the bridge temperature continued to rise slowly due to the heat retained and dissipated from the bridge structure, evidencing the slow heat dissipation in the concrete.

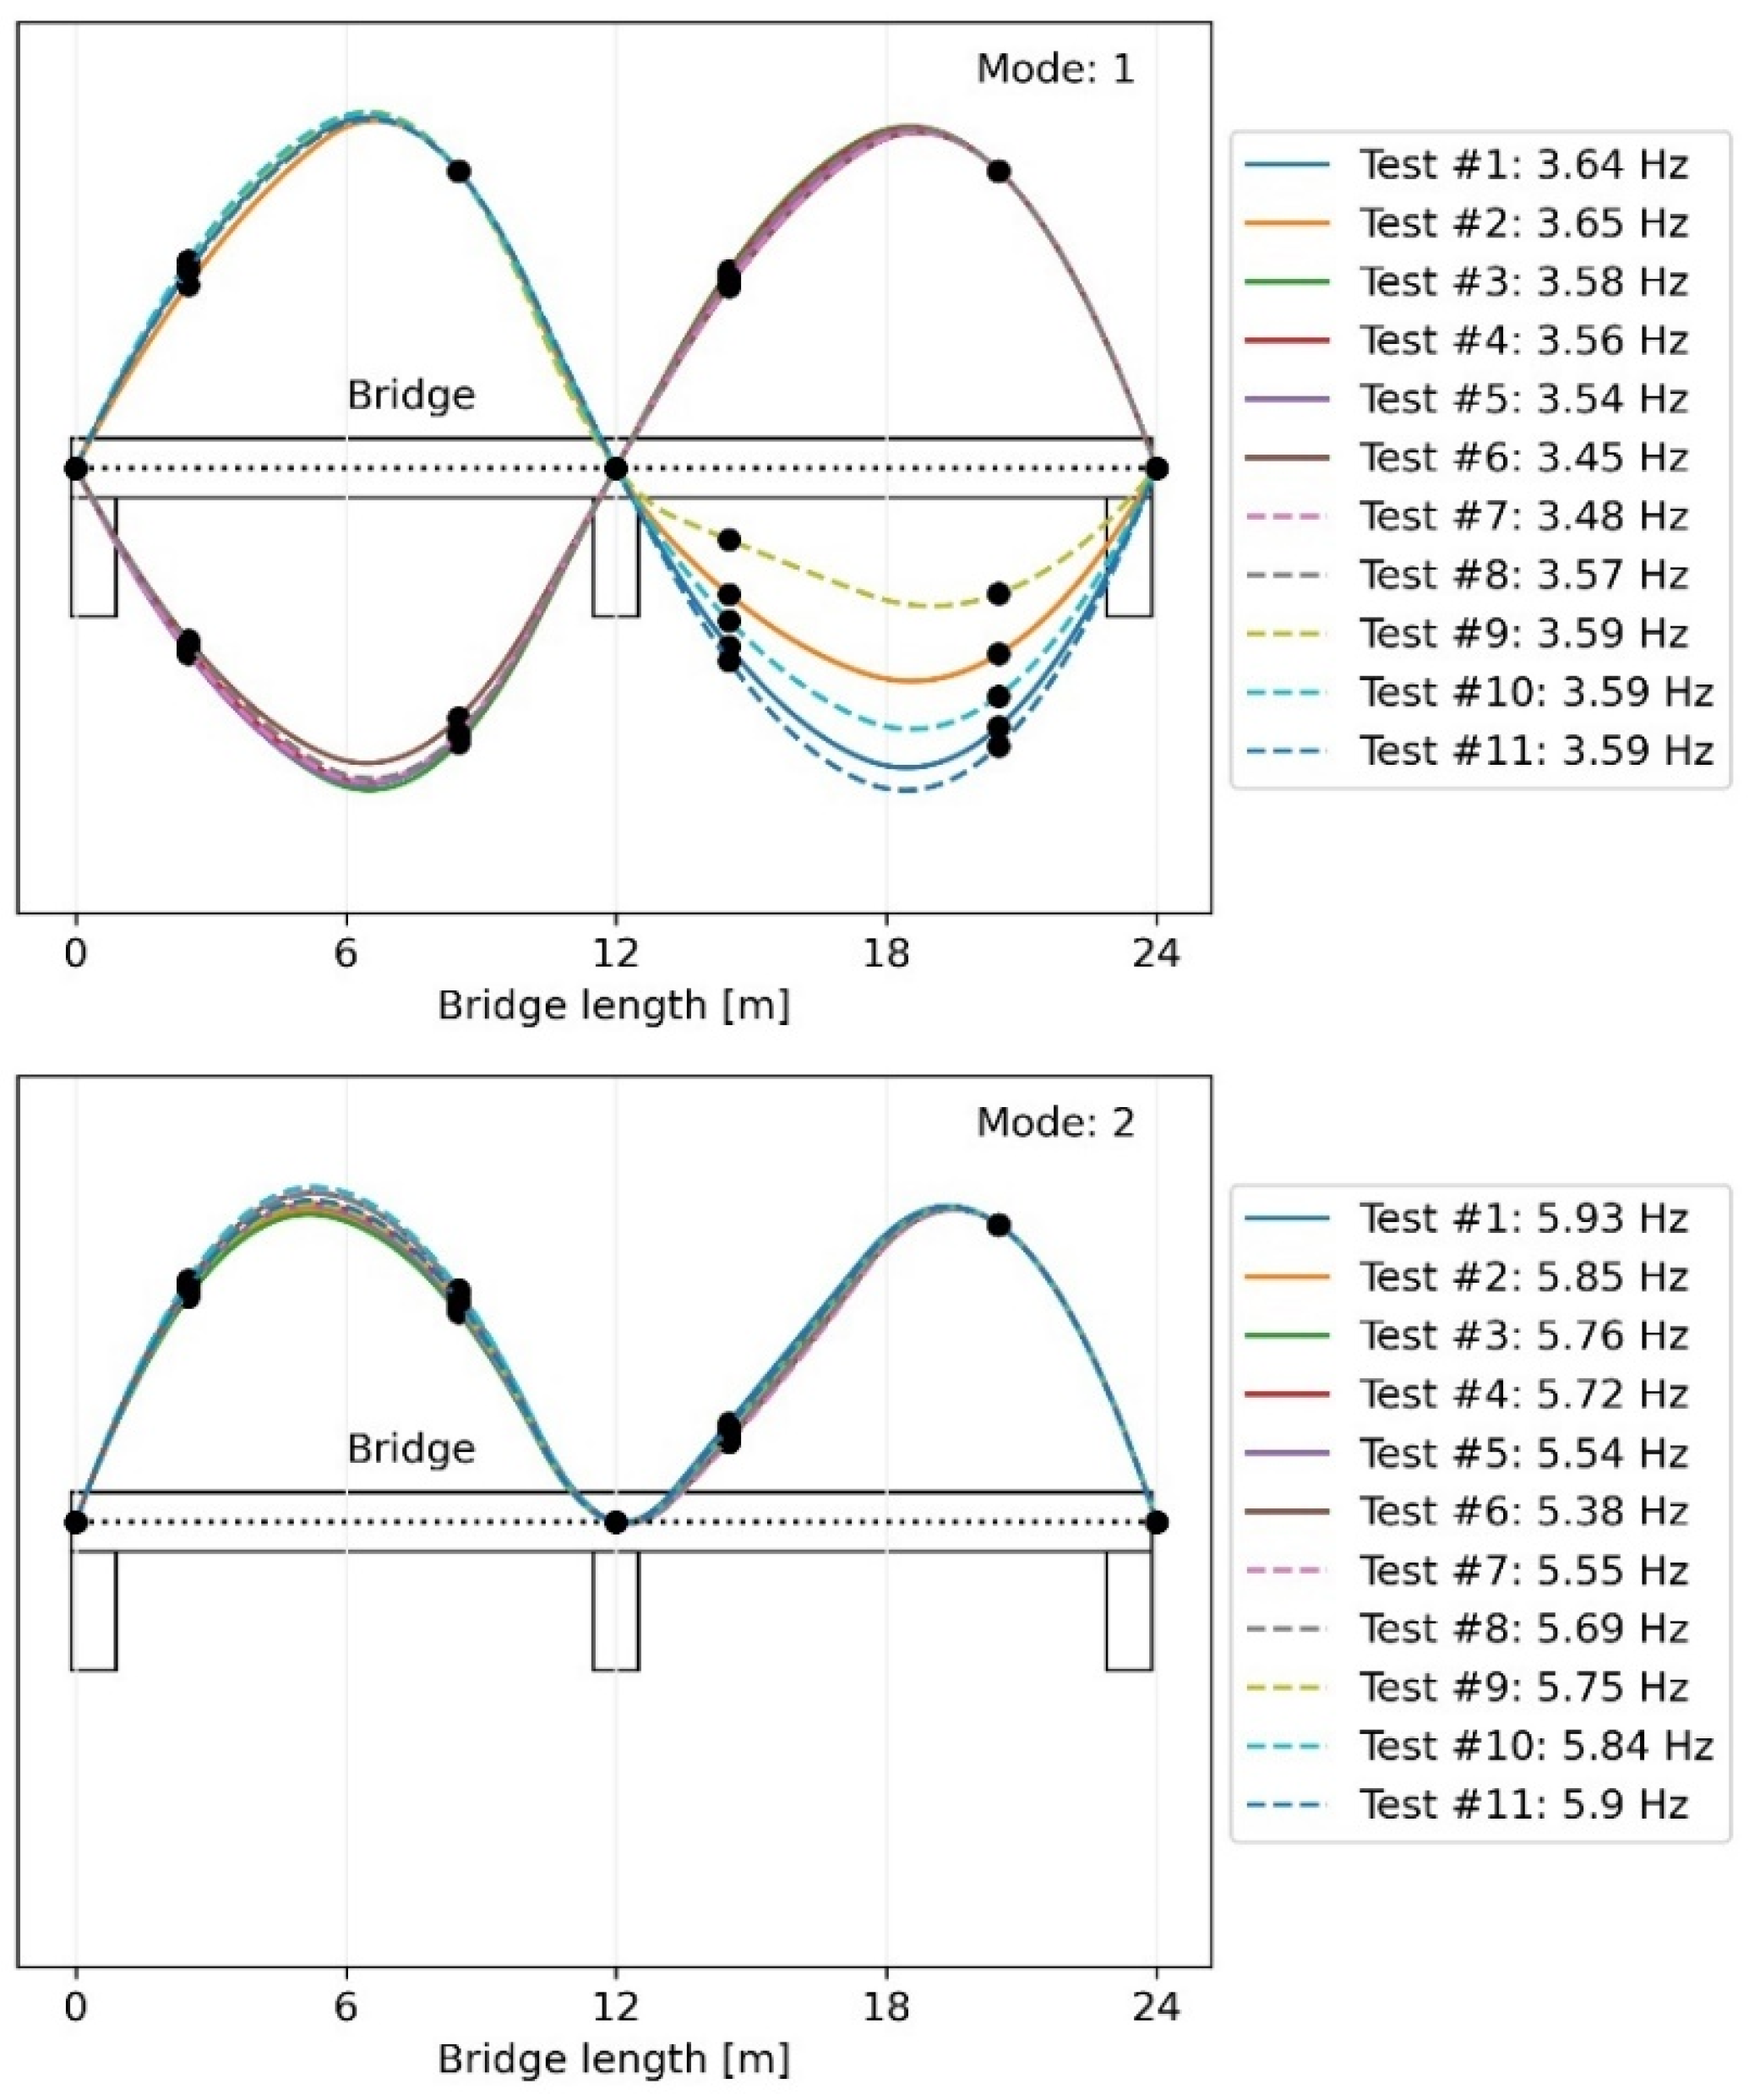
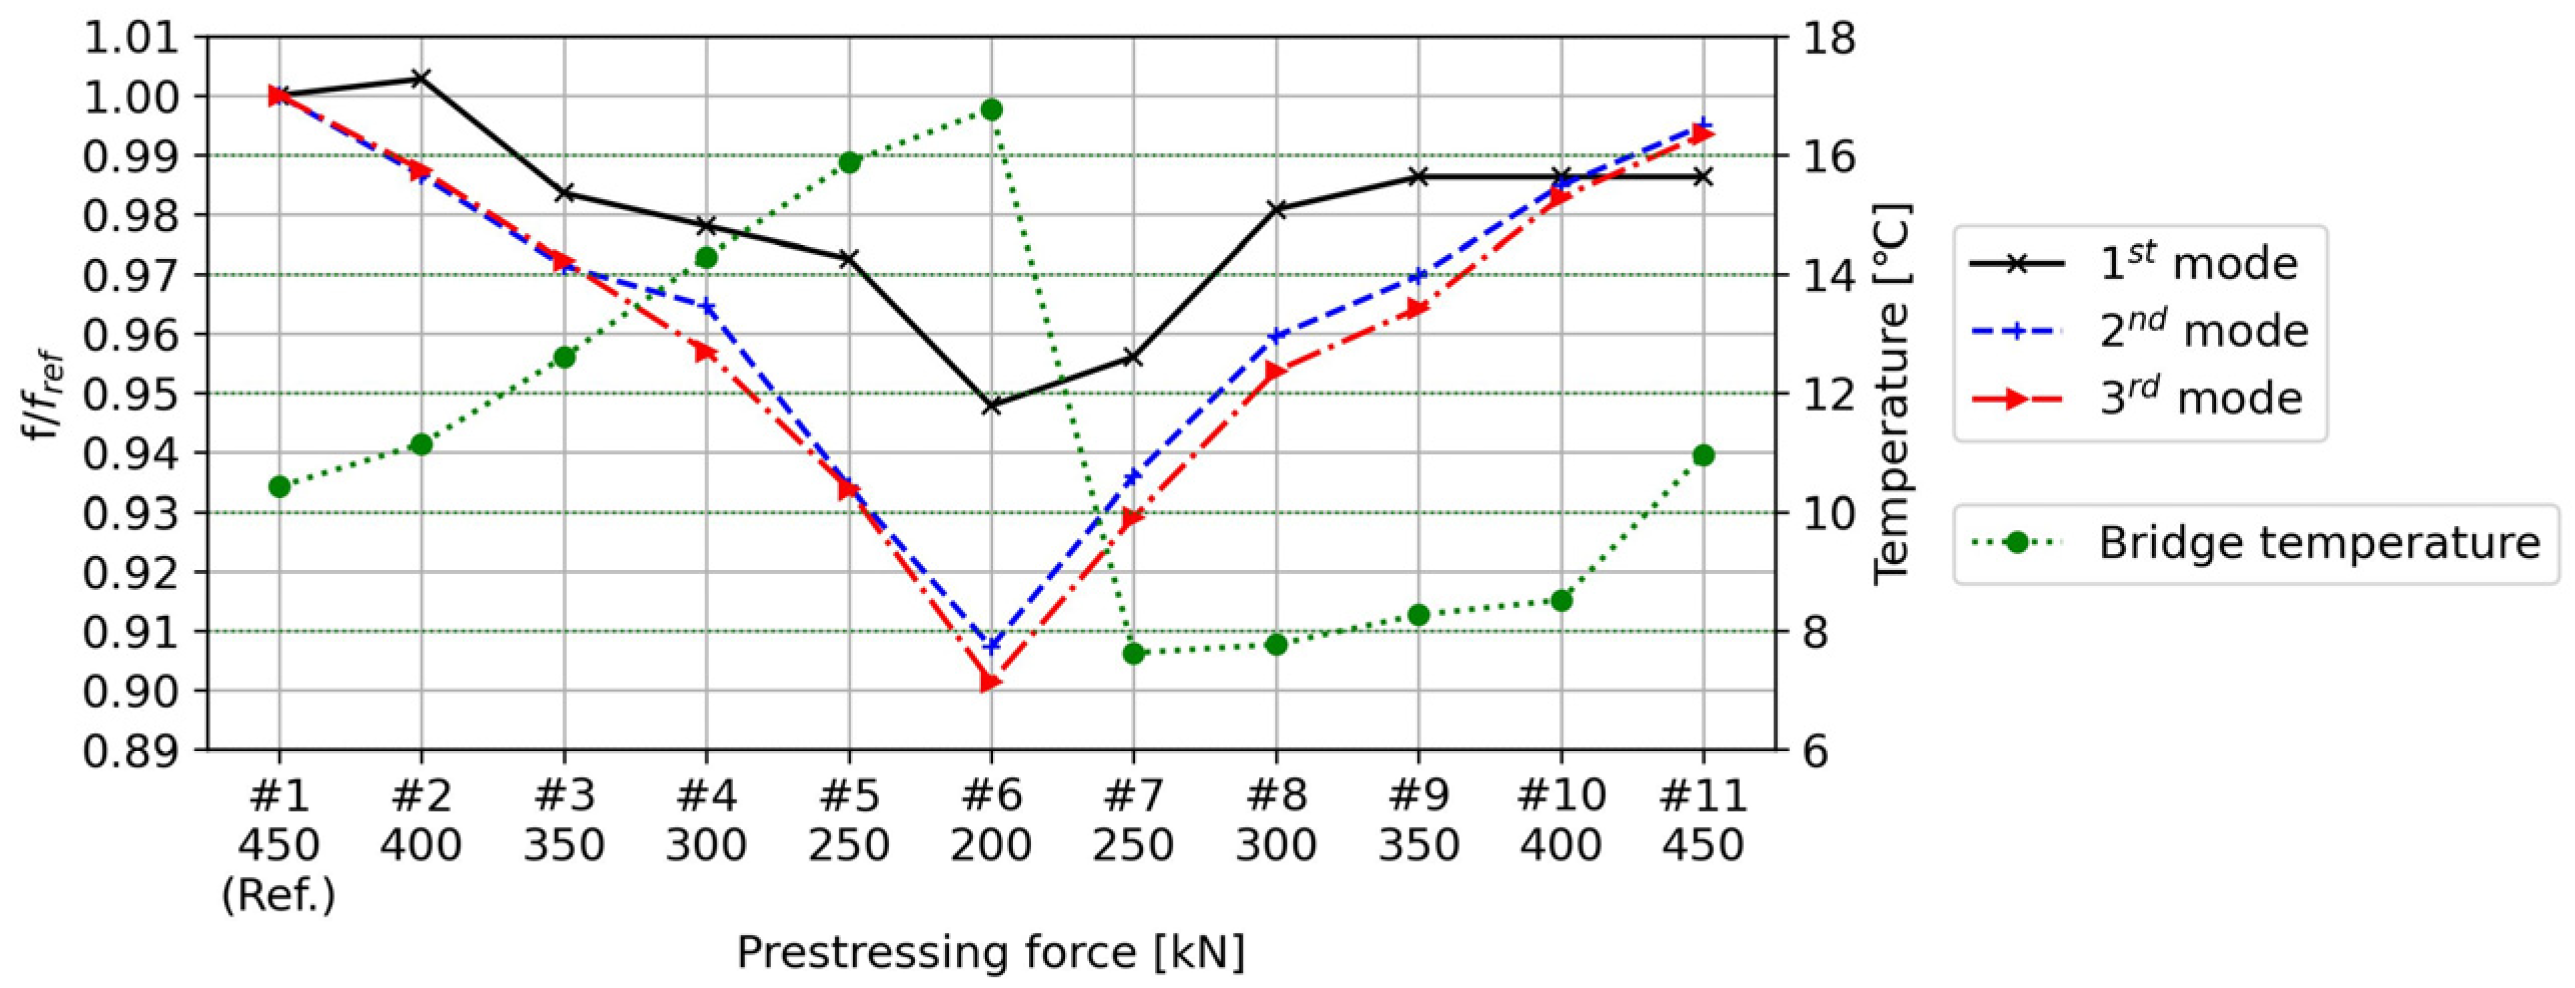
5.2. Modal Analysis Results

The OMA method was adopted to investigate prestress loss conditions. Using the Frequency Domain Decomposition (FDD) method ([39,40]), the singular values of the power spectral density were calculated to reveal the energy magnitude of the dominant frequencies with the peak picking (PP) method. This approach allows us to determine the natural frequencies corresponding to the predominant mode shapes. To facilitate this process in the OMA analysis, a Python (2022) module called PyOMA ([41]) was applied.
Figure 16 presents the first three modal frequencies and their corresponding mode shapes for each test. The differences in Mode 1 and Mode 3 are evident. The lower prestress is associated with lower modal frequency. However, the mode shape curves are spline interpolations designed to fit the bending motion of the bridge. Consequently, changes in the amplitude of the mode shapes are not reliable for identifying prestressing levels. This phenomenon will be validated through velocity studies in the subsequent section of the paper, which will demonstrate the impact of material changes.
As shown in Figure 17, lower prestress results in a significant reduction in frequency, with test #1 serving as the reference for comparison. However, changes in the first mode do not consistently decrease or increase in the same proportion with adjustments in post-tensioning forces. Notably, there is a drop between tests #5 (approximately −3%) and #6 (approximately −5%) in the first mode, while significant drops occur between tests #4 (approximately −4%) and #6 (approximately −10%) in the second and third modes. These observations suggest that cracks began to open when the force dropped below 300 kN, highlighting the combined effects of reduced prestress and existing cracks. Subsequently, the cracks tended to close as the force increased in tests #7 to #11. However, the modal information is insufficient to identify the temperature effects and damage location.

5.3. CWI Analysis Results

During each test, 10-min vibration recordings at the stations were correlated to obtain CCFs with a window length of 15 s. Forty CCFs were stacked and normalized, and their causal parts were used as impulse responses for CWI analysis, with test #1 serving as the reference. Figure 18 illustrates the impulse responses on the south span from tests #1 and #2. It can be observed that the impulse responses in tests #1 and #2 differ due to discrepancies in their structural properties. This difference can be interpreted by the wave velocity variation, estimated from the stretching factor used to obtain the max. CC value of the two impulsive signals.

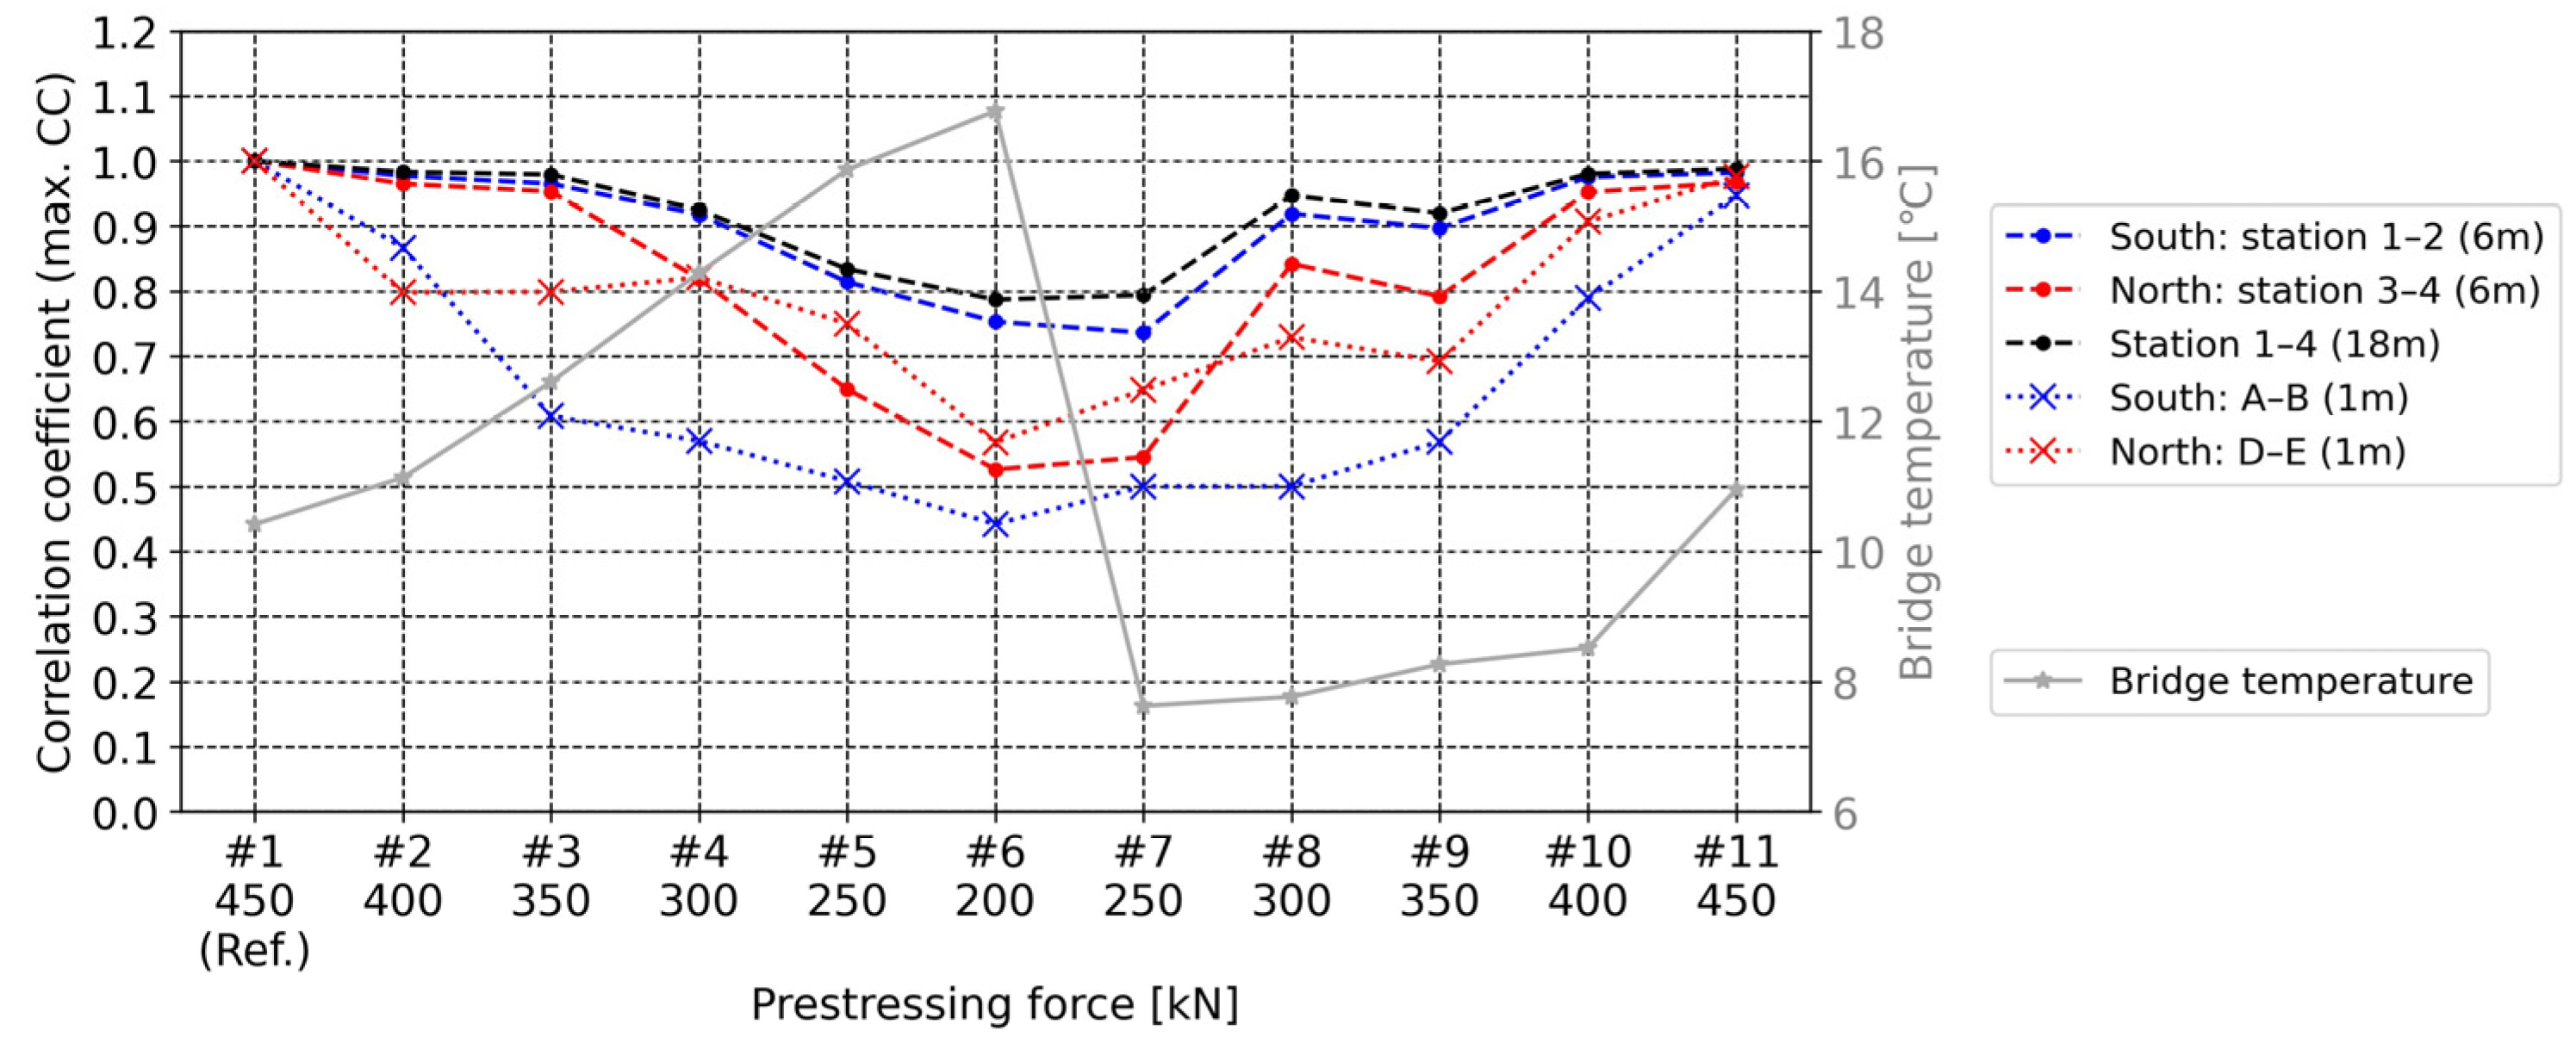
5.3.1. Max. CC Values

Figure 19 presents the max. CC values on both the south and north sides of the bridge. The low-frequency wave propagation distances were 6 m across two Station pairs (1–2 on the south span and 3–4 on the north span), while the ultrasonic wave propagation distance was 1 m in the mid-span areas between A–B and D–E on both sides. Additionally, the low-frequency wave propagation distance of 18 m across Station pairs 1 and 4, covering most of the bridge structure, was also compared.
The bridge temperature did not significantly affect the max. CC values during short-term measurements. This conclusion is based on comparing the bridge temperatures between tests #1 to #5 and tests #7 to #11. Overall, there is a clear correlation between the max. CC values and changes in prestressing: higher prestress levels correspond to higher max. CC values. Assuming that existing cracks in the bridge under lower prestress levels were opened or extended, such structural changes lead to lower max. CC values. While the quantification of cracks falls beyond the scope of this study, we acknowledge the potential of integrating our approach with surface Lamb wave techniques in future research. Notably, Yang et al. demonstrated the effectiveness of fundamental Lamb modes in detecting the depth of surface-breaking cracks [42], highlighting a promising direction for extending our methodology.
The changes in the max. CC values due to varying prestressing forces were significantly different depending on the wave propagation distances. The max. CC value was more sensitive to shorter distances than longer ones. Based on this, the range of max. CC values at the north mid-span over 1 m are similar to those over a distance of 6 m at the north span. This implies that the damage across the north span is uniform. On the other hand, at the south mid-span, the range of max. CC values over 1 m are much lower than that over a distance of 6 m at the south span. This implies that the south span has a concentrated damage area in the 1-m mid-span.
In summary, the max. CC values can help localize damage but not quantify the damage level.

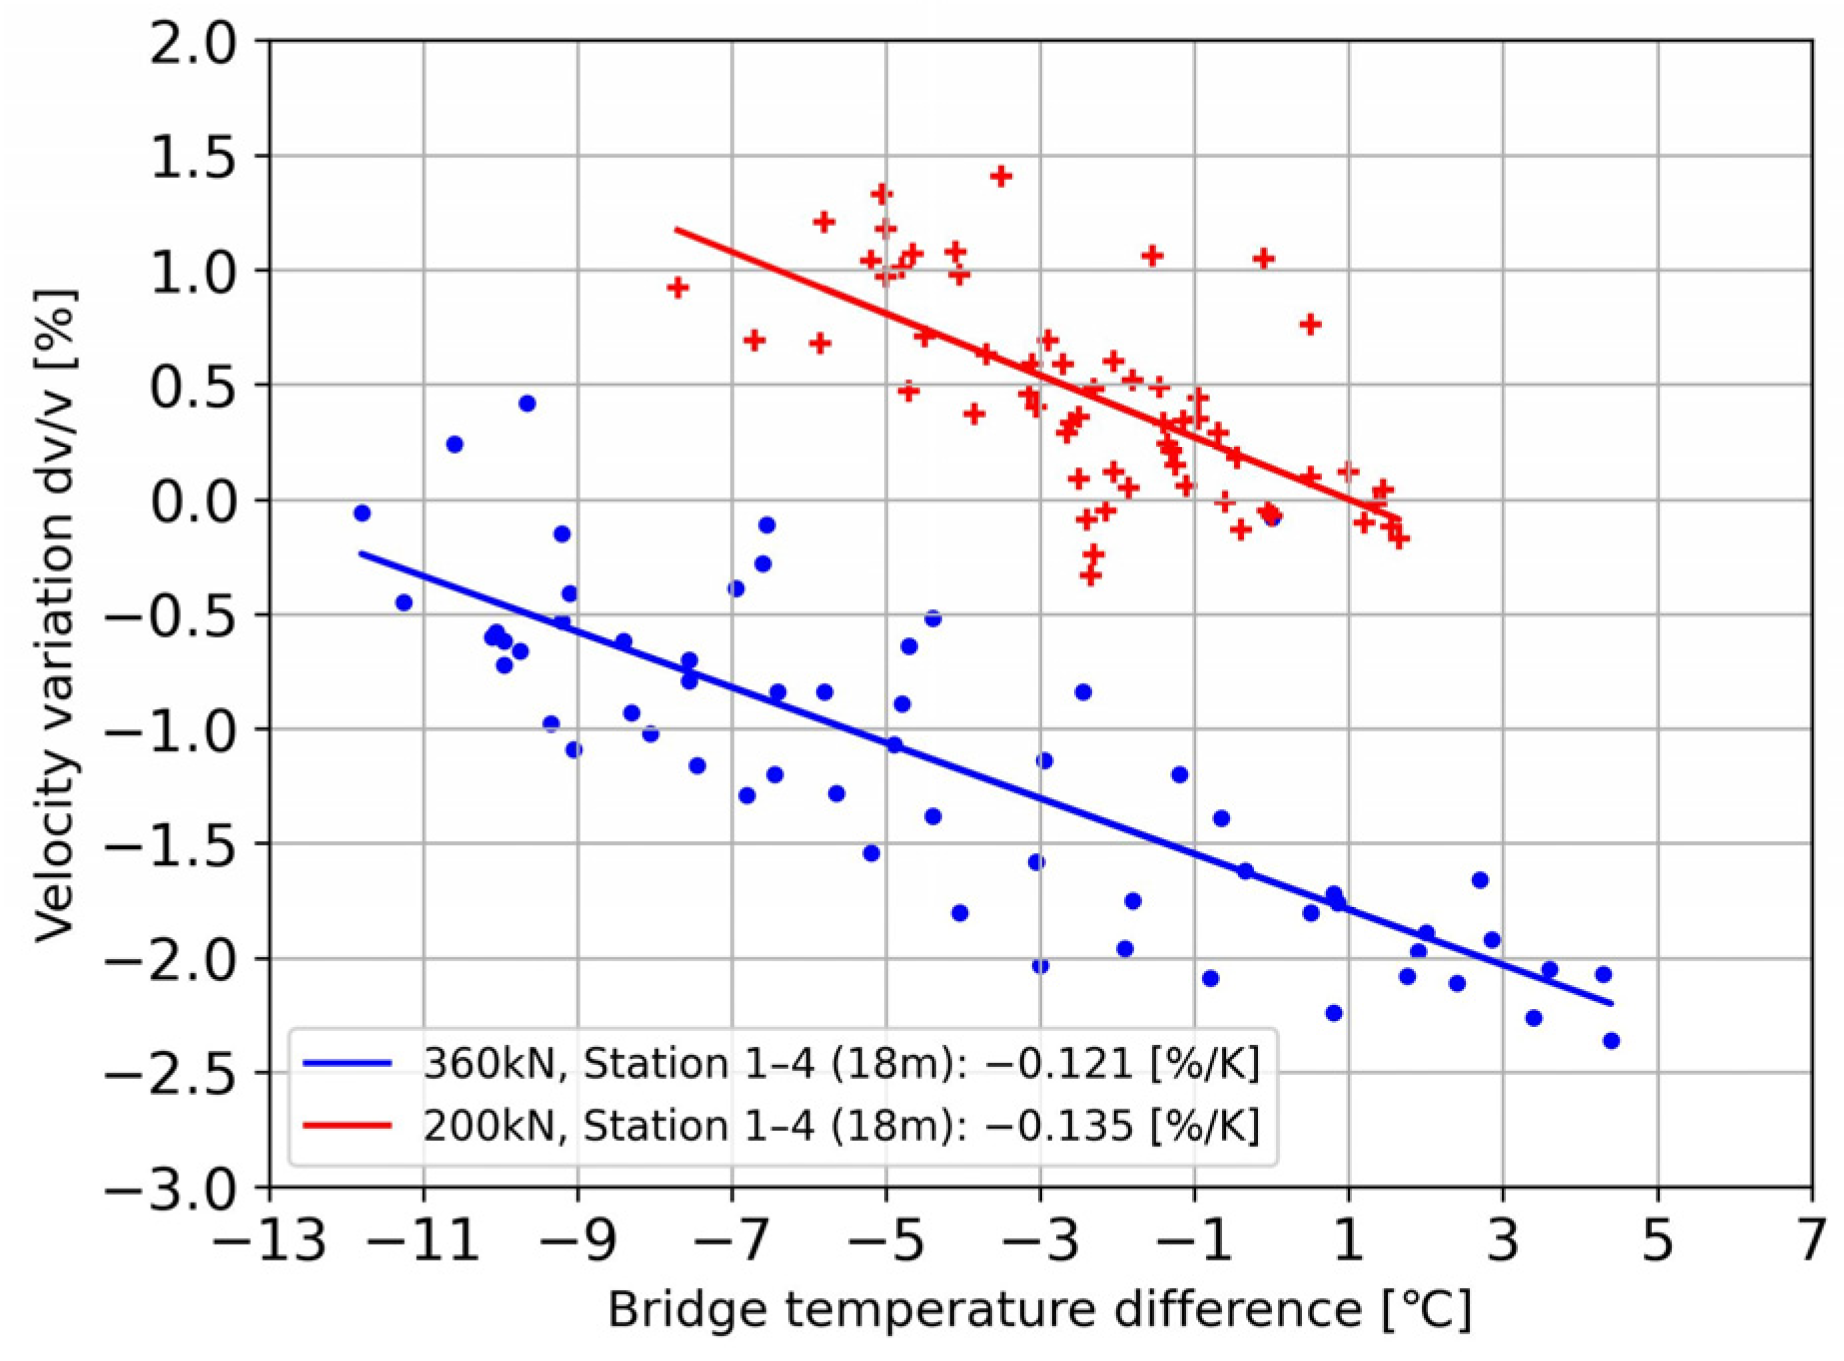
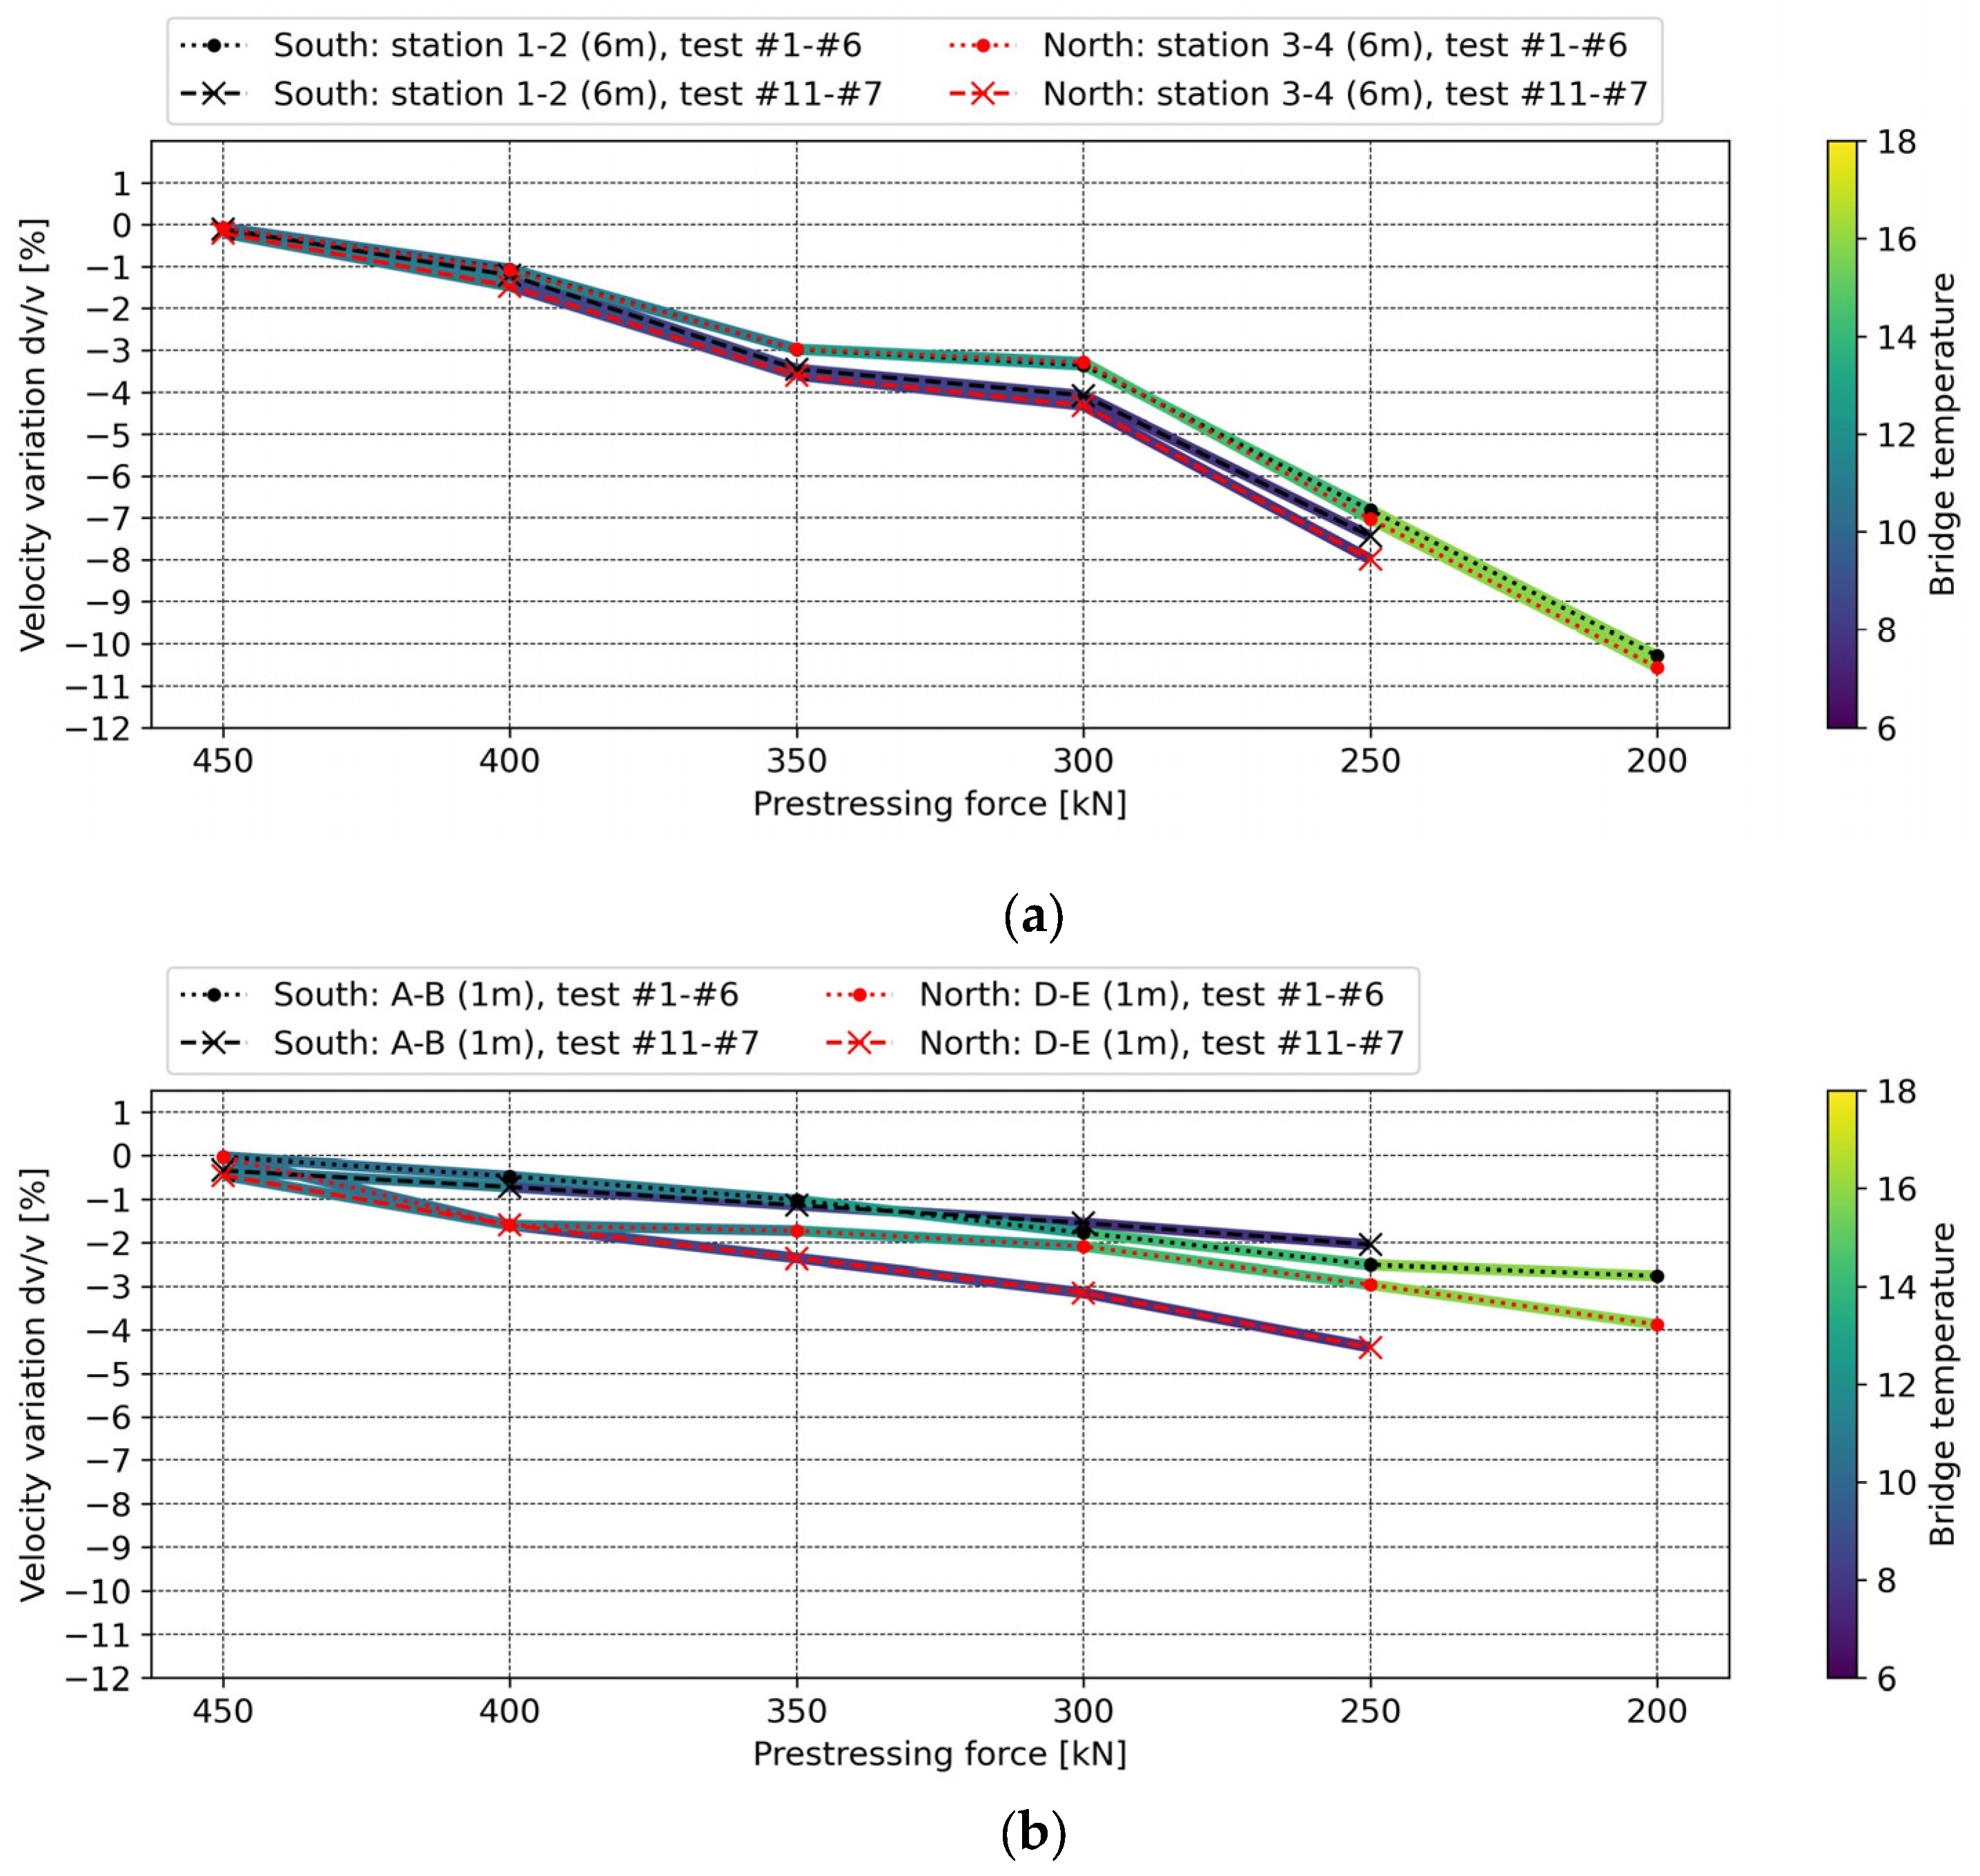
5.3.2. Wave Velocity Variations

Figure 20 compares wave velocity variations related to bridge temperature changes between tests #1 to #6 and tests #7 to #11.
A reduction in velocities in both vibration and ultrasonic wave fields was observed as the post-tensioning force decreased. The velocity changes varied more significantly among different ultrasonic sensor pairs than across different vibration Station pairs in both the south and north spans (comparing the same marker but different colors in Figure 20a,b). Notably, during tests #11–#7, the difference between the south and north spans (−2% and −4.5%) at a post-tensioning force of 250 kN in the ultrasonic wave field in Figure 20b was as large as 2.5%, while in the vibration wave field in Figure 20a, the difference between the south and north spans (−7.5% and −8%) at a post-tensioning force of 250 kN was less than 1%. Similarly, during tests #1–#6, the difference between the south and north spans (−2.7% and −4%) at a post-tensioning force of 200 kN in the ultrasonic wave field in Figure 20b was up to 1.3%, while in the vibration wave field in Figure 20a, it was less than 0.5%. Nevertheless, this indicates that while the vibration recordings reveal a global vibration behavior, they can also highlight local phenomena on different spans, similar to ultrasonic recordings through the CWI analysis.
In addition, the influence of bridge temperature is observed when comparing different tests conducted at the same post-tensioning force (comparing the same color but different markers in Figure 20a,b). The temperature effect on ultrasonic wave velocity variations is larger at the north span than at the south span, based on the difference between two velocity variations in two tests with the same post-tensioning force. The temperature effect on vibration wave velocity variations is also larger at the north span than at the south span, based on the difference between two velocity variations in two tests with the same post-tensioning force. These consistent results indicate that both scales of wave-screening methods are reliable and can be applied in the same cases.
However, a significant decline in vibration velocity is noted in Figure 20a when the bridge is prestressed below 300 kN. This phenomenon indicates damage states such as prestress loss and subsequent crack opening, consistent with previous studies [43,44]. Additionally, this observation correlates with the drops in the second and third modal frequencies in the modal analysis, aligning with previous findings (e.g., [45]). Therefore, further research is encouraged to focus on how higher modes are affected by changes in prestress. In contrast, the gradients of the ultrasonic velocity changes observed in Figure 20b between different sensor pairs remain relatively consistent at each step of prestress loss.
Furthermore, the negative velocity variation in the north mid-span was markedly higher than in the south mid-span under identical bridge temperature conditions. Based on formulations that establish the relationship between the modulus of elasticity (E) of concrete and ultrasonic pulse velocity [46], where a lower E modulus corresponds to a lower wave velocity, it can be concluded that the north mid-span has sustained greater damage than the south mid-span due to its considerable velocity reduction.
In the short-term measurement, changes in wave velocity were found to be an effective method for detecting overall structural integrity changes resulting from the post-tensioning force. The temperature effects were revealed by local properties, and a direct relationship between the decreased velocities and the reduced prestress was evident. The varying ratios at different locations but under the same temperature condition suggest different levels of local damage, indicating the potential for damage localization.

6. Conclusions

This study demonstrates the effectiveness of wave propagation analysis in understanding global structural behavior and local material integrity. By applying CWI to both ultrasonic waves and seismic interferometry of vibrational data, the advantages of wave propagation in damage detection were validated, surpassing the results of modal analysis. The sensitivity of wave propagation to environmental factors and prestress loss was thoroughly examined.
While adjusting post-tensioning force was straightforward, controlling bridge temperature posed significant challenges due to outdoor fluctuations. This highlights the importance of addressing on-site measurement data, including temperature variations, for consistent comparisons. Long-term monitoring is essential to capture these effects, and our findings demonstrate the feasibility of compensating for temperature-induced changes in wave velocity through empirical relationships.
In conclusion, this work re-evaluates the perceived limitations of vibration-based damage detection in prestressed structures. It shows that, when integrated with wave-based techniques, vibration measurements can provide valuable insights into structural health—especially in detecting subtle changes due to cracking and prestress loss. Additionally, irregularities observed in mode shapes suggest that span-specific differences in crack density may influence modal behavior, warranting further investigation.
Future research should focus on the following. (1) Environmental compensation: enhancing the robustness of damage detection by refining the relationship between temperature and wave velocity. (2) Crack density effects: systematically studying discrepancies between modal analysis and CWI results under controlled variations in cracking density. High-resolution imaging or distributed sensing could be employed to monitor these variations, offering deeper insights into the complementary strengths and limitations of each method.
Ultimately, this work supports the development of more comprehensive and resilient SHM strategies for PC infrastructure.

Author Contributions

Investigation and data curation, C.-M.L. and F.B.; writing—original draft preparation, C.-M.L.; writing—review and editing, C.-M.L., E.N. and H.I.; project administration and funding acquisition, H.I., C.H. and E.N. All authors have read and agreed to the published version of the manuscript.

Funding

This paper is part of the research conducted under the GIOTTO Project (GIOTTO: Gebäudeschwingungen: kombinierte Zustandsanalyse mit innovativem Sensorkonzept), which is financially supported by the Bundesministerium für Bildung und Forschung (BMBF) as part of the “Früherkennung von Erdbeben und ihren Folgen” program. The grant number is 03G0885D.

Institutional Review Board Statement

Not applicable.

Informed Consent Statement

Not applicable.

Data Availability Statement

The raw data supporting the conclusions of this article will be made available by the authors on request.

Acknowledgments

The authors extend their gratitude to colleagues from BAM division 8.2 for the ultrasonic testing and division 7.2 for their assistance with the post-tensioning system used in the experiment. The authors also extend their sincere thanks to the reviewers and academic editors for their insightful comments and suggestions, which have greatly contributed to enhancing the scientific rigor and clarity of this paper.

Conflicts of Interest

The authors declare no conflicts of interest.

Abbreviations

The following abbreviations are used in this manuscript:
CWICoda wave interferometry
FDDFrequency Domain Decomposition
Max. CCMaximum cross-correlation
NSRNoise signal ratio
OMAOperational modal analysis
PCPrestressed concrete
PPPeak picking
SHMStructural health monitoring
UPVUltrasonic pulse velocity

References

  1. Soyoz, S.; Feng, M.Q. Long-term monitoring and identification of bridge structural parameters. Comput.-Aided Civ. Infrastruct. Eng. 2009, 24, 82–92. [Google Scholar] [CrossRef]
  2. Rainieri, C.; Fabbrocino, G. Operational Modal Analysis of Civil Engineering Structures; Springer: New York, NY, USA, 2014; Volume 142, p. 143. [Google Scholar]
  3. Deraemaeker, A.; Reynders, E.; De Roeck, G.; Kullaa, J. Vibration-based structural health monitoring using output-only measurements under changing environment. Mech. Syst. Signal Process. 2008, 22, 34–56. [Google Scholar] [CrossRef]
  4. Han, Q.; Ma, Q.; Xu, J.; Liu, M. Structural health monitoring research under varying temperature condition: A review. J. Civ. Struct. Health Monit. 2021, 11, 149–173. [Google Scholar] [CrossRef]
  5. Zhang, C.; Mousavi, A.A.; Masri, S.F.; Gholipour, G.; Yan, K.; Li, X. Vibration feature extraction using signal processing techniques for structural health monitoring: A review. Mech. Syst. Signal Process. 2022, 177, 109175. [Google Scholar] [CrossRef]
  6. Alampalli, S. Effects of testing, analysis, damage, and environment on modal parameters. Mech. Syst. Signal Process. 2000, 14, 63–74. [Google Scholar] [CrossRef]
  7. Wickramasinghe, W.R.; Thambiratnam, D.P.; Chan, T.H.; Nguyen, T. Vibration characteristics and damage detection in a suspension bridge. J. Sound Vib. 2016, 375, 254–274. [Google Scholar] [CrossRef]
  8. De Angelis, A.; Losanno, D.; Parisi, F.; Pecce, M.R. Identification of Modal Parameters of Scaled Bridge PC Beams by OMA Dynamic Tests. J. Bridge Eng. 2024, 29, 04024051. [Google Scholar] [CrossRef]
  9. Gandelli, E.; Rossini, G.; Mantelli, S.G.; Minelli, F. Damage detection of prestressed concrete beams affected by shear and flexure cracks through vibration monitoring. Eng. Struct. 2024, 304, 117572. [Google Scholar] [CrossRef]
  10. Bonopera, M.; Chang, K.C.; Lee, Z.K. State-of-the-art review on determining prestress losses in prestressed concrete girders. Appl. Sci. 2020, 10, 7257. [Google Scholar] [CrossRef]
  11. Zanini, M.A.; Faleschini, F.; Pellegrino, C. New trends in assessing the prestress loss in post-tensioned concrete bridges. Front. Built Environ. 2022, 8, 956066. [Google Scholar] [CrossRef]
  12. Salawu, O.S. Detection of structural damage through changes in frequency: A review. Eng. Struct. 1997, 19, 718–723. [Google Scholar] [CrossRef]
  13. Alvandi, A.; Cremona, C. Assessment of vibration-based damage identification techniques. J. Sound Vib. 2006, 292, 179–202. [Google Scholar] [CrossRef]
  14. Carden, E.P.; Fanning, P. Vibration based condition monitoring: A review. Struct. Health Monit. 2004, 3, 355–377. [Google Scholar] [CrossRef]
  15. Zahid, F.B.; Ong, Z.C.; Khoo, S.Y. A review of operational modal analysis techniques for in-service modal identification. J. Braz. Soc. Mech. Sci. Eng. 2020, 42, 398. [Google Scholar] [CrossRef]
  16. Niederleithinger, E.; Wolf, J.; Mielentz, F.; Wiggenhauser, H.; Pirskawetz, S. Embedded ultrasonic transducers for active and passive concrete monitoring. Sensors 2015, 15, 9756–9772. [Google Scholar] [CrossRef]
  17. Schumacher, T.; Niederleithinger, E. Combining Passive and Active Ultrasonic Stress Wave Monitoring Techniques: Opportunities for Condition Evaluation of Concrete Structures. In Proceedings of the NDT-CE 2022-The International Symposium on Nondestructive Testing in Civil Engineering, Zurich, Switzerland, 16–18 August 2022. [Google Scholar]
  18. Karaiskos, G.; Deraemaeker, A.; Aggelis, D.G.; Van Hemelrijck, D. Monitoring of concrete structures using the ultrasonic pulse velocity method. Smart Mater. Struct. 2015, 24, 113001. [Google Scholar] [CrossRef]
  19. Gholizadeh, S. A review of non-destructive testing methods of composite materials. Procedia Struct. Integr. 2016, 1, 50–57. [Google Scholar] [CrossRef]
  20. Lim, Y.Y.; Smith, S.T.; Soh, C.K. Wave propagation based monitoring of concrete curing using piezoelectric materials: Review and path forward. NDT E Int. 2018, 99, 50–63. [Google Scholar] [CrossRef]
  21. Hassan, M.; Burdet, O.; Favre, R. Ultrasonic measurements and static load tests in bridge evaluation. NDT E Int. 1995, 28, 331–337. [Google Scholar] [CrossRef]
  22. Epple, N.; Sanchez-Trujillo, C.A.; Niederleithinger, E. Ultrasonic monitoring of large-scale structures-input to engineering assessment. In Life-Cycle of Structures and Infrastructure Systems; CRC Press: Boca Raton, FL, USA, 2023; pp. 1805–1812. [Google Scholar]
  23. Hassani, S.; Dackermann, U. A systematic review of advanced sensor technologies for non-destructive testing and structural health monitoring. Sensors 2023, 23, 2204. [Google Scholar] [CrossRef]
  24. Gorgin, R.; Luo, Y.; Wu, Z. Environmental and operational conditions effects on Lamb wave based structural health monitoring systems: A review. Ultrasonics 2020, 105, 106114. [Google Scholar] [CrossRef] [PubMed]
  25. Snieder, R.; Miyazawa, M.; Slob, E.; Vasconcelos, I.; Wapenaar, K. A comparison of strategies for seismic interferometry. Surv. Geophys. 2009, 30, 503–523. [Google Scholar] [CrossRef]
  26. Niederleithinger, E.; Wang, X.; Herbrand, M.; Müller, M. Processing ultrasonic data by coda wave interferometry to monitor load tests of concrete beams. Sensors 2018, 18, 1971. [Google Scholar] [CrossRef] [PubMed]
  27. Abdel-Jaber, H.; Glisic, B. Monitoring of prestressing forces in prestressed concrete structures—An overview. Struct. Control Health Monit. 2019, 26, e2374. [Google Scholar] [CrossRef]
  28. Snieder, R.; Grêt, A.; Douma, H.; Scales, J. Coda wave interferometry for estimating nonlinear behavior in seismic velocity. Science 2002, 295, 2253–2255. [Google Scholar] [CrossRef]
  29. Obermann, A.; Planès, T.; Larose, E.; Sens-Schönfelder, C.; Campillo, M. Depth sensitivity of seismic coda waves to velocity perturbations in an elastic heterogeneous medium. Geophys. J. Int. 2013, 194, 372–382. [Google Scholar] [CrossRef]
  30. Planès, T.; Larose, E. A review of ultrasonic Coda Wave Interferometry in concrete. Cem. Concr. Res. 2013, 53, 248–255. [Google Scholar] [CrossRef]
  31. Grabke, S.; Clauß, F.; Bletzinger, K.U.; Ahrens, M.A.; Mark, P.; Wüchner, R. Damage detection at a reinforced concrete specimen with coda wave interferometry. Materials 2021, 14, 5013. [Google Scholar] [CrossRef]
  32. Zhong, B.; Zhu, J. Applications of stretching technique and time window effects on ultrasonic velocity monitoring in concrete. Appl. Sci. 2022, 12, 7130. [Google Scholar] [CrossRef]
  33. Wapenaar, K.; Draganov, D.; Snieder, R.; Campman, X.; Verdel, A. Seismic Interferometry: Tutorial on seismic interferometry: Part 1—Basic principles and applications. Geophysics 2010, 75, 75A195–75A209. [Google Scholar] [CrossRef]
  34. Hadziioannou, C.; Larose, E.; Coutant, O.; Roux, P.; Campillo, M. Stability of monitoring weak changes in multiply scattering media with ambient noise correlation: Laboratory experiments. J. Acoust. Soc. Am. 2009, 125, 3688–3695. [Google Scholar] [CrossRef] [PubMed]
  35. ETA-05/0123; European Technical Assessment. DIBt: Berlin, Germany, 2023. Available online: https://dywidag.com/downloads/eta-05-0123-dywidag-pt-bar-tendon-system-with-bars-o-175-to-47-mm/de (accessed on 16 April 2025).
  36. Kee, S.H.; Zhu, J. Using piezoelectric sensors for ultrasonic pulse velocity measurements in concrete. Smart Mater. Struct. 2013, 22, 115016. [Google Scholar] [CrossRef]
  37. Dumoulin, C.; Deraemaeker, A. Design optimization of embedded ultrasonic transducers for concrete structures assessment. Ultrasonics 2017, 79, 18–33. [Google Scholar] [CrossRef]
  38. Sun, H.; Zhu, J. Thermal modulation of nonlinear ultrasonic wave for concrete damage evaluation. J. Acoust. Soc. Am. 2019, 145, EL405–EL409. [Google Scholar] [CrossRef]
  39. Brincker, R.; Zhang, L.; Andersen, P. Modal identification of output-only systems using frequency domain decomposition. Smart Mater. Struct. 2001, 10, 441. [Google Scholar] [CrossRef]
  40. Lorenzo, G.W.F.; Mercerat, D.; d’Avila, M.P.S.; Bertrand, E.; Deschamps, A. Operational modal analysis of a high rise rc building and modelling. In Proceedings of the IOMAC’15-The 6th International Operational Modal Analysis Conference, Gijon, Spain, 12–14 May 2015. [Google Scholar]
  41. Pasca, D.P.; Aloisio, A.; Rosso, M.M.; Sotiropoulos, S. PyOMA and PyOMA_GUI: A Python module and software for Operational Modal Analysis. Softw. X, 2022, in press. [CrossRef]
  42. Yang, Y.; Cascante, G.; Polak, M.A. Depth detection of surface-breaking cracks in concrete plates using fundamental Lamb modes. NDT E Int. 2009, 42, 501–512. [Google Scholar] [CrossRef]
  43. Stähler, S.C.; Sens-Schönfelder, C.; Niederleithinger, E. Monitoring stress changes in a concrete bridge with coda wave interferometry. J. Acoust. Soc. Am. 2011, 129, 1945–1952. [Google Scholar] [CrossRef]
  44. Zhong, B.; Zhu, J.; Morcous, G. Measuring acoustoelastic coefficients for stress evaluation in concrete. Constr. Build. Mater. 2021, 309, 125127. [Google Scholar] [CrossRef]
  45. Aloisio, A. Aspects of vibration-based methods for the prestressing estimate in concrete beams with internal bonded or unbonded tendons. Infrastructures 2021, 6, 83. [Google Scholar] [CrossRef]
  46. Bolborea, B.; Baera, C.; Dan, S.; Gruin, A.; Burduhos-Nergis, D.D.; Vasile, V. Concrete compressive strength by means of ultrasonic pulse velocity and moduli of elasticity. Materials 2021, 14, 7018. [Google Scholar] [CrossRef]
Figure 1. A large-scale post-tensioned concrete bridge model located at the BAM TTS.
Applsci 15 06005 g001
Figure 2. The inverse U-shaped cross-section along the bridge length, highlighting unbonded tendon ducts (diameter Ø 70) beneath the structure. The numbers 1–6, 12, and 13 represent different types of rebar based on their sizes.
Applsci 15 06005 g002
Figure 3. The post-tensioning system, composed of hydraulic cylinders at the bridge ends and two unbonded tendons beneath the structure.
Applsci 15 06005 g003
Figure 4. Trillium Compact broadband seismometer used for vibration measurement.
Applsci 15 06005 g004
Figure 5. Embedded ultrasonic transducers, designed by Acoustic Control Systems, Ltd. for BAM [16], and their embedment.
Applsci 15 06005 g005
Figure 6. Stationing of vibration recording sensors and the embedding positions (cross-sections A, B, C, D, and E) of ultrasonic transducers. (The arrow on the right-hand side indicates the direction of the north).
Applsci 15 06005 g006
Figure 7. Placement of temperature sensors (TT0210KC3-T105-1500, TEWA Temperature Sensors, Lublin, Poland).
Applsci 15 06005 g007
Figure 8. Frequency spectra recorded at four stations as the bridge prestressed with 450 kN.
Applsci 15 06005 g008
Figure 9. The vibration records at Stations 1 and 2 (south span).
Applsci 15 06005 g009
Figure 10. The causal parts of eight CCFs with a cut-window length of 7.5 s.
Applsci 15 06005 g010
Figure 11. Continuous monitoring of velocity variations in vibration signals under the two prestressing levels: 360 kN and 200 kN.
Applsci 15 06005 g011
Figure 12. Continuous monitoring of velocity variations in ultrasonic signals under the two prestressing levels: 360 kN and 200 kN.
Applsci 15 06005 g012
Figure 13. Correlation between velocity variation of ultrasonic signals and bridge temperature in continuous monitoring.
Applsci 15 06005 g013
Figure 14. Correlation between velocity variation of vibration signals and bridge temperature in continuous monitoring.
Applsci 15 06005 g014
Figure 15. The prestressing force setup in short-term measurements.
Applsci 15 06005 g015
Figure 16. The first three modes obtained by using the OMA analysis.
Applsci 15 06005 g016aApplsci 15 06005 g016b
Figure 17. The change ratio ( f / f r e f ) of the first three modal frequencies.
Applsci 15 06005 g017
Figure 18. The impulse responses obtained from the stacked and normalized causal parts of the 40 CCFs on the south span in tests #1 and #2.
Applsci 15 06005 g018
Figure 19. Max. CC values in the vibration recordings (Station pairs 1–2, 3–4, and 1–4) and ultrasonic wave fields (A–B and D–E).
Applsci 15 06005 g019
Figure 20. Velocity variations during prestress loss monitoring: (a) vibration wave fields; (b) ultrasonic wave fields.
Applsci 15 06005 g020
Disclaimer/Publisher’s Note: The statements, opinions and data contained in all publications are solely those of the individual author(s) and contributor(s) and not of MDPI and/or the editor(s). MDPI and/or the editor(s) disclaim responsibility for any injury to people or property resulting from any ideas, methods, instructions or products referred to in the content.

