Article

View-Aware Contrastive Learning for Incomplete Tabular Data with Low-Label Regimes

1
China Agricultural University, Beijing 100083, China
2
School of Statistics, University of International Business and Economics, Beijing 100029, China
3
School of Accountancy, Central University of Finance and Economics, Beijing 100081, China
4
School of English and International Studies, Beijing Foreign Studies University, Beijing 100089, China
5
School of Statistics and Mathematics, Central University of Finance and Economics, Beijing 100081, China
6
National Security Academy, University of International Relations, Beijing 100091, China
*
Author to whom correspondence should be addressed.
These authors contributed equally to this work.
Appl. Sci. 2025, 15(11), 6001; https://doi.org/10.3390/app15116001
Submission received: 24 April 2025 / Revised: 20 May 2025 / Accepted: 24 May 2025 / Published: 27 May 2025
(This article belongs to the Special Issue Advances in Neural Networks and Deep Learning)

Abstract

To address the challenges of label sparsity and feature incompleteness in structured data, a self-supervised representation learning method based on multi-view consistency constraints is proposed in this paper. Robust modeling of high-dimensional sparse tabular data is achieved through integration of a view-disentangled encoder, intra- and cross-view contrastive mechanisms, and a joint loss optimization module. The proposed method incorporates feature clustering-based view partitioning, multi-view consistency alignment, and masked reconstruction mechanisms, thereby enhancing the model’s representational capacity and generalization performance under weak supervision. Across multiple experiments conducted on four types of datasets, including user rating data, platform activity logs, and financial transactions, the proposed approach maintains superior performance even under extreme conditions of up to 40% feature missingness and only 10% label availability. The model achieves an accuracy of 0.87, F1-score of 0.83, and AUC of 0.90 while reducing the normalized mean squared error to 0.066. These results significantly outperform mainstream baseline models such as XGBoost, TabTransformer, and VIME, demonstrating the proposed method’s robustness and broad applicability across diverse real-world tasks. The findings suggest that the proposed method offers an efficient and reliable paradigm for modeling sparse structured data.

1. Introduction

With the explosive growth of data, structured tabular data has become an indispensable information carrier in various fields [1]. In particular, it plays a critical role in intelligent decision-making, risk assessment, and behavior prediction across such key domains as healthcare, education, industrial monitoring, and finance [2]. For instance, structured data are extensively employed in the financial sector for tasks such as credit scoring, risk control, and fraud detection [3]. However, in practical application scenarios structured data often suffer from severe missing values, uneven sampling, and label sparsity, which can pose significant challenges for traditional supervised learning methods [4]. Training models with strong robustness and generalization ability becomes increasingly difficult under these circumstances, especially when dealing with large-scale samples, high-dimensional features, and severely missing labels [5]. In many real-world scenarios, labeled data are scarce or even completely unavailable, which further exacerbates the training difficulty [6]. Moreover, the heterogeneity and complexity of high-dimensional structured data increases the likelihood of overfitting or bias during model training under sparse data conditions [7]. Consequently, the effective utilization of limited labeled information along with large amounts of unlabeled data has emerged as a critical challenge. To address this issue, recent research has focused on novel strategies in the field of self-supervised learning, aiming to fully exploit unlabeled data for effective representation learning [8]. Therefore, achieving efficient model training in environments characterized by sparse and missing data is of both theoretical importance and practical value, particularly in solving domain-specific problems such as financial risk control, credit assessment, and anomaly detection [9]. Traditional machine learning models such as logistic regression, decision tree, random forest, and support vector machine (SVM) have been widely used to model structured data [10]. These models offer advantages such as well-established theoretical foundations and low computational complexity, and are capable of handling missing values to some extent [11]. Nonetheless, their performance tends to degrade significantly in the presence of high-dimensional features or severe data incompleteness. Conventional methods for missing data imputation typically rely on simple interpolation techniques, mean value substitution, or outright deletion of incomplete samples [12]. However, these approaches often ignore latent correlations and structural information within the data, which may lead to information loss or bias, particularly in high-dimensional scenarios [13,14]. Furthermore, traditional methods generally assume complete and noise-free data, which is rarely the case in real-world applications [15].
In recent years, the rapid development of deep learning has enabled the application of deep neural networks (DNNs) to structured data modeling [16,17]. Models such as TabNet and TabTransformer have introduced attention mechanisms and deep architectures in order to automatically capture complex feature relationships, thereby improving representation and predictive performance [18]. Notably, TabNet combines the strengths of decision trees and neural networks, utilizing self-attention to automatically select salient features, thereby avoiding the need for manual feature selection and demonstrating high adaptability in sparse data scenarios [19,20]. TabTransformer, on the other hand, leverages the transformer architecture to model tabular data, replacing the row-column-based input structure with self-attention to effectively capture long-range dependencies among features [21,22]. As a result, deep learning models have shown superior performance over traditional methods in structured data processing, particularly under conditions of high heterogeneity and missing values [23,24]. Several recent works further illustrate the effectiveness of self-supervised approaches. For instance, Wei Yi et al. [25] proposed SurroundDepth, a self-supervised multi-camera depth estimation framework that introduces cross-view feature fusion and scale-aware pretraining to enhance panoramic depth consistency. This approach achieved state-of-the-art results on the DDAD and nuScenes datasets. Similarly, Bastian Wandt et al. [26] introduced CanonPose, a self-supervised monocular 3D human pose estimation method that learns 3D pose from unlabeled multi-view images by enforcing multi-view consistency and unbiased reconstruction, thereby eliminating the need for camera calibration and 3D ground truth. Sun Libo et al. [27] proposed SC-DepthV3, a self-supervised monocular depth estimation method that integrates pseudo-depth priors and enhanced loss functions to improve robustness and accuracy in dynamic scenes. Their results showed that this approach outperforms existing baselines across multiple public datasets. Additionally, Chen Kai et al. [28] presented MultiSiam, a self-supervised multi-instance Siamese representation learning framework tailored for autonomous driving. This method incorporates IoU-based positive sample definition, feature alignment, and intra-image clustering with self-attention to boost generalization and downstream performance. Their approach surpasses methods such as MoCo and BYOL on the Cityscapes and BDD100K datasets.
To address the aforementioned challenges, we propose a self-supervised representation learning framework based on multi-view consistency constraints. The proposed framework aims to model latent structure using unlabeled data, preserve the structural information of tabular data, and achieve both feature completion and semantic enhancement. Unlike traditional supervised learning approaches, our proposed method does not rely on full supervision; instead, useful information is extracted from unlabeled samples and latent patterns in the data are fully exploited through a self-supervised learning paradigm. The contributions of the proposed method are summarized as follows:
  • A multi-view consistency constraint mechanism is designed to encode data through multiple views, enabling the model to learn stable and discriminative latent representations from distinct feature subspaces. Consistency-based contrastive learning is employed to enhance the ability to capture relationships across views, improving both robustness and generalization.
  • A view-disentangled encoder is developed in order to effectively address the heterogeneity of tabular data. Data features are partitioned into multiple subspaces, each corresponding to a distinct view, with independently designed encoding paths for each view. This design allows the model to capture localized structure and improves its representational capacity.
  • A cross-view consistency loss is introduced during training to ensure alignment of latent representations across different views. Such a constraint guides the model to learn semantically meaningful features, thereby enhancing its performance on diverse datasets.
  • A self-supervised learning framework is adopted, allowing the proposed model to leverage the latent information in unlabeled data. This approach addresses the challenges of label sparsity and missing values, enabling effective training even under incomplete data conditions.
The remainder of this paper is structured as follows: Section 2 reviews related work on sparse structured data modeling, self-supervised learning, and multi-view consistency modeling; Section 3 details the datasets, preprocessing and augmentation strategies, and overall architecture and core components of the proposed self-supervised learning framework with multi-view consistency constraints; Section 4 presents the complete experimental results and analysis, including comparisons with various baseline models, module-level ablation studies, and parameter sensitivity evaluations, along with an in-depth discussion of the method’s limitations and potential directions for future research; finally, Section 5 concludes the paper by summarizing the key contributions of this study.

2. Related Work

2.1. Modeling Methods for Sparse Tabular Data

In the modeling of structured tabular data, traditional machine learning methods such as logistic regression, decision tree, random forest, and gradient boosting models (e.g., XGBoost) have long served as strong baselines [11,29]. As a linear classification method, logistic regression estimates class probabilities by applying a linear transformation to the input features, followed by a nonlinear mapping function. Its simplicity, interpretability, and low computational cost make it a preferred choice in many practical applications; however, its performance is often limited in scenarios involving high-dimensional sparse data, where feature redundancy and missing values can lead to instability and reduced predictive accuracy [30]. Tree-based models such as decision trees and ensemble methods construct recursive partitions over the feature space, and are capable of handling nonlinear relationships. These methods are relatively robust to missing data and offer high interpretability [31]. Nevertheless, they often suffer from overfitting and reduced generalization capability in particularly sparse or high-dimensional contexts [32]. In recent years, deep neural networks (DNNs) have been increasingly applied to structured data tasks. Architectures such as TabNet and TabTransformer integrate attention mechanisms and embedding modules to automatically learn relevant feature representations [33,34]. These methods outperform traditional baselines in terms of many benchmarks, particularly in capturing complex feature interactions and adapting to sparse distributions. For instance, TabNet dynamically attends to informative features at each decision step, while TabTransformer models dependencies across heterogeneous features through stacked attention layers.
Despite their promising results, deep models are typically data-hungry and less robust to missing or noisy inputs. Their reliance on large labeled datasets and limited interpretability restricts their effectiveness in real-world scenarios with limited supervision or incomplete data [35,36]. These challenges underscore the need for more flexible and label-efficient solutions that are capable of modeling sparse structured data with better generalization and interpretability.

2.2. Self-Supervised Learning in Structured Data

Self-supervised learning (SSL) is a subclass of unsupervised learning that has emerged as a powerful paradigm. SSL enables model training without relying on manual annotations by leveraging intrinsic data structure to construct pretext tasks [37]. SSL has shown outstanding success in domains such as computer vision and natural language processing, with models like BERT demonstrating the ability to learn rich semantic representations through masked prediction objectives [38,39]. In the context of structured data, SSL has received growing attention in recent years. Existing approaches typically design pretext tasks such as masked feature prediction, pseudo-label generation, and contrastive learning [40,41]. For instance, masked feature prediction involves randomly hiding parts of the input vector and training the model to reconstruct the missing features, thereby promoting the learning of intra-sample dependencies. Contrastive learning, on the other hand, encourages the model to learn discriminative representations by contrasting similar and dissimilar data pairs under different augmentations or views [42]. These techniques have achieved promising results across various tabular benchmarks, improving downstream performance under limited supervision. However, applying SSL to structured data presents unique challenges compared to unstructured domains. Tabular data often exhibit complex feature dependencies, heterogeneous subspaces, and varying sparsity patterns, which may not be fully exploited by conventional SSL strategies [43]. For example, naive masking may overlook semantic roles or correlations among attributes, while contrastive objectives may suffer from insufficient augmentation diversity in tabular formats.
As a result, existing SSL methods often struggle to generalize under severe missingness or in highly sparse regimes. These limitations underscore the need for SSL frameworks that are tailored to the characteristics of structured data, particularly those capable of modeling inter-feature relationships and exploiting partial supervision signals. Addressing these gaps remains a critical direction for improving model robustness and generalization in real-world applications.

2.3. Multi-View Learning and Consistency Modeling

Multi-view learning aims to leverage multiple complementary representations of data by partitioning features into different subspaces or views, thereby improving representation learning and generalization [44,45]. Common strategies include feature subset resampling, dimensionality projection, and graph-based view construction [46]. These approaches enable models to exploit inter-view correlations and preserve diverse semantic perspectives. Consistency modeling techniques are frequently employed to integrate knowledge from different views. These typically involve enforcing agreement between representations or predictions across views, which helps to capture shared underlying structures and enhances model robustness [47]. Such mechanisms have been successfully applied in the image, graph, and text domains, contributing to performance gains in semi-supervised and self-supervised settings.
Despite their success, the application of multi-view learning to sparse tabular data introduces unique challenges. One key issue is asymmetric missingness across feature groups, which may disrupt alignment between views and reduce the effectiveness of consistency constraints [48]. Additionally, the heterogeneous and non-Euclidean nature of tabular features complicates view construction, making traditional partitioning strategies less effective [49]. In low-label regimes, consistency objectives also face difficulties due to the absence of reliable supervision signals, leading to noisy or unstable training dynamics [50]. Therefore, designing multi-view frameworks that are specifically tailored to structured data characteristics such as uneven feature distributions and complex inter-feature dependencies remains an open and critical research direction.

3. Materials and Method

3.1. Data Collection

Four types of structured datasets were utilized in the experiments, covering typical tasks such as user behavior rating, online activity logging, synthetic sparse-labeled samples, and financial transaction records. The objective was to comprehensively evaluate the effectiveness and generalizability of the proposed self-supervised representation learning method across both real-world and simulated scenarios. All data were obtained from publicly accessible and reputable online platforms. The user behavior rating data were collected from two well-known recommendation system platforms, MovieLens and Book-Crossing, comprising approximately 170,000 records. Each sample contained features such as user ID, item ID, rating value, timestamp, gender, age, and item category, resulting in a total feature dimension of 50. Missing values primarily occurred in user attribute fields. Operational log data were sourced from the Kaggle Web User Logs Dataset, which encompasses user interactions on e-commerce and social media platforms. Features include click behavior, dwell time, page depth, and search queries, with a dimensionality of approximately 60. A total of 200,000 records were collected, with missingness mainly caused by irregular behavioral tracking frequencies. Synthetic sparse-labeled data were generated using the make_classification interface from the Scikit-learn library, with feature dimensions ranging from 100 to 200. Randomized missing mechanisms and sparse label settings were introduced to simulate low-response or weak-supervision modeling scenarios, resulting in 100,000 synthesized samples. Financial transaction data were collected from the IEEE-CIS Fraud Detection and UCI Credit Card Default datasets, totaling 180,000 records. Features included transaction time, amount, payment method, billing period, default status, and risk level, with a feature dimension of up to 120. Missing entries in this dataset were typically due to privacy-protected fields. Prior to processing, all data were uniformly encoded in UTF-8. Continuous variables were treated with statistical imputation and Gaussian-based missing simulation, while categorical variables were processed using embedding mapping. Standard normalization was applied to ensure consistency in data format and model input structure. During model training, 80% of the data were used for training and validation, with the remaining 20% held out for testing to ensure the reproducibility and generalizability of the results. The structural statistics of the datasets are summarized in Table 1 and Table 2.

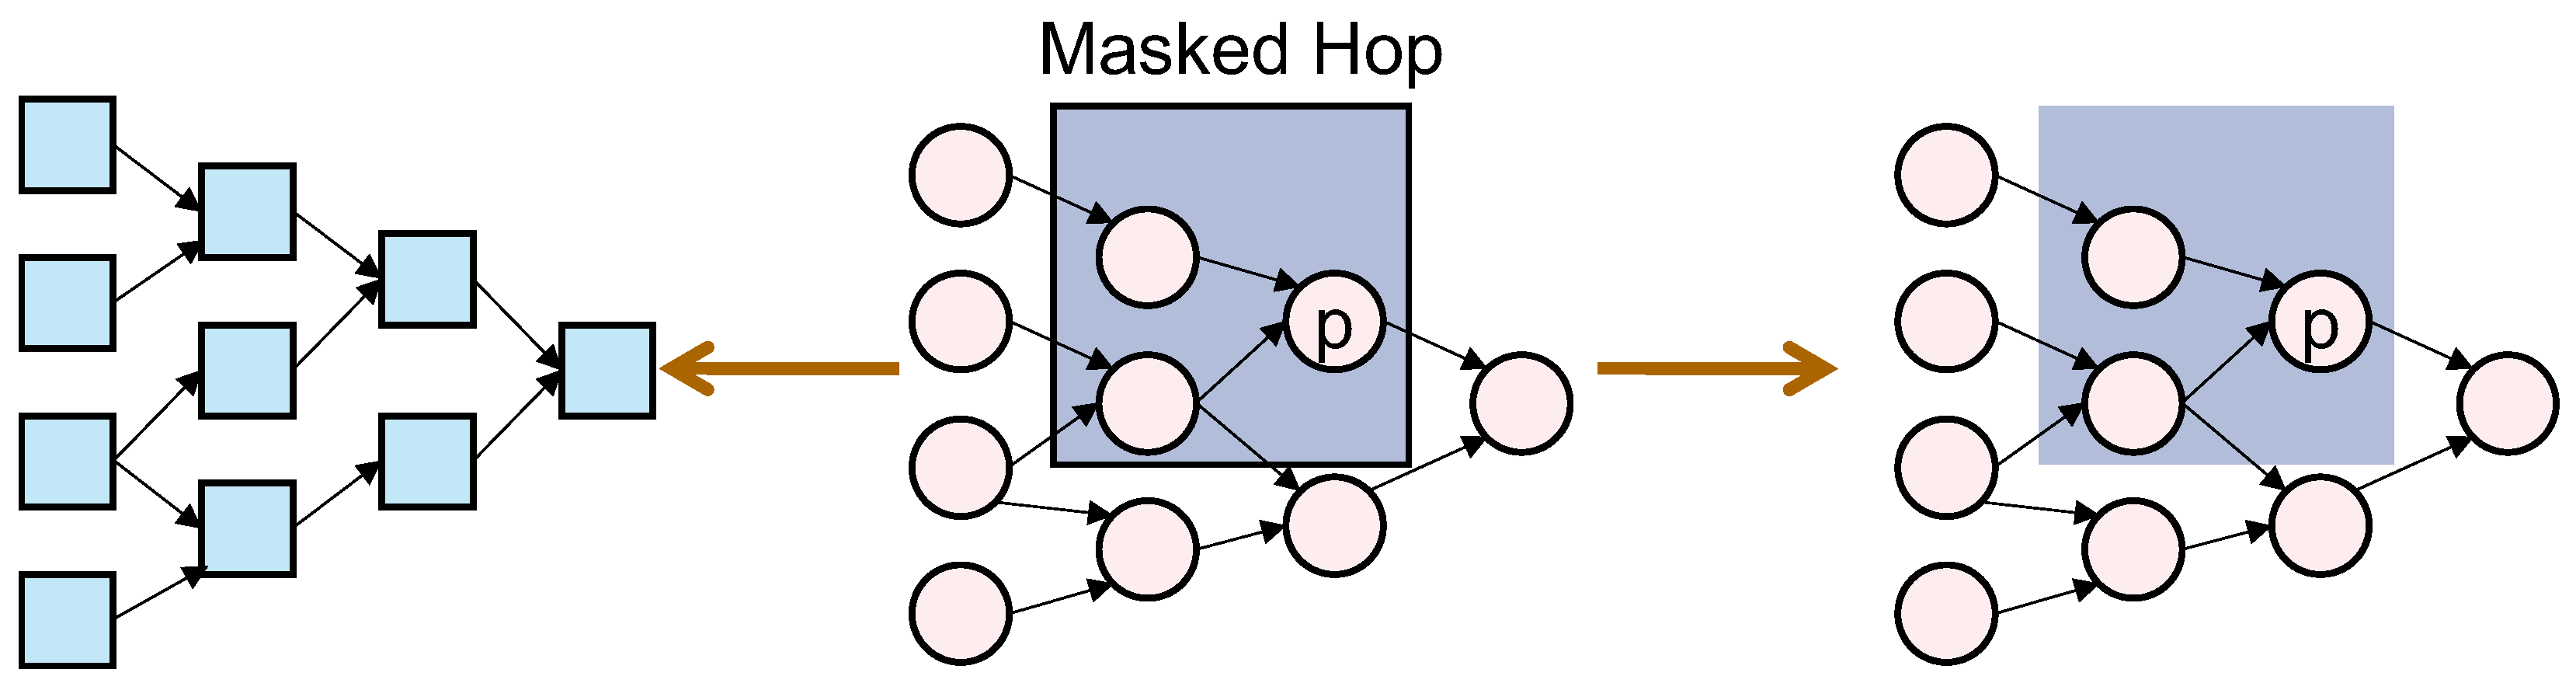
3.2. Data Augmentation

Recent theoretical advances have emphasized that increasing the number of effective training samples through either data collection or data augmentation plays a critical role in reducing generalization error. The proxy learning curve of multiclass Bayesian classifiers demonstrates that, irrespective of the underlying model parameters, the mean squared error between the estimated and true posterior statistics decreases as the training set size N increases [51]. This convergence implies that augmenting training data via techniques such as imputation can bring the empirical risk closer to the Bayes risk. Moreover, for sparse structured datasets, the presence of missing values not only hinders training efficiency but also degrades predictive accuracy. Consequently, effective imputation of missing values during the preprocessing stage is essential for enhancing model generalization performance and preserving the integrity and consistency of the data. In the preprocessing stage, handling missing values is a critical task in structured data modeling. For sparse structured datasets, the presence of missing values not only affects training efficiency but also degrades prediction accuracy. Therefore, effective imputation of missing values is essential to maintain data integrity and consistency. Common approaches include statistical imputation and local distribution smoothing, both of which rely on analyzing the distribution patterns of observed data to reasonably infer the missing entries. Statistical imputation methods fill in missing values based on statistical properties of the data. Typical techniques include mean imputation, linear interpolation, and regression-based estimation. For continuous variables, mean imputation is the simplest approach. Missing values of a feature x i are replaced with the mean of its observed values across the sample set. Let n be the total number of observations and let m be the number of missing entries; then, the imputed value is calculated as follows:
x ^ i = 1 n m j D x i , j
where x ^ i denotes the imputed value and D represents the index set of non-missing values. In contrast, linear interpolation estimates missing values based on adjacent data points, while regression-based methods build predictive models to estimate the missing entries. For high-dimensional data, mean or linear interpolation may overlook feature correlations, resulting in structurally inconsistent imputations. To address this, local distribution smoothing has been proposed. This method assumes local structural consistency and fills in missing values using weighted averages from neighboring data points. Given a missing feature x i and a neighborhood N i of the sample, the imputed value is calculated as
x ^ i = j N i w i j x i , j j N i w i j ,
where w i j denotes the similarity-based weight between sample i and j and where x i , j is the observed value of feature i in sample j. This approach helps to preserve local data structure and mitigates the information loss associated with simple imputation. Standardization is another widely used preprocessing technique in machine learning, particularly when features have different units or scales. It transforms features to a standard range, which facilitates convergence and improves training stability. The standardization process involves subtracting the mean and dividing by the standard deviation:
x i = x i μ i σ i
where x i is the standardized value, x i is the original feature value, and μ i and σ i respectively denote the mean and standard deviation of feature i. This normalization ensures that all features contribute equally during model training, avoiding dominance by features with larger magnitudes. For categorical variables, common encoding techniques include label encoding and embedding mappings. While label encoding assigns integer values to categories, it may introduce unintended ordinal relationships. Thus, embedding mappings are preferred for unordered categories, especially in deep learning. The key idea is to represent each category with a dense vector in a continuous space. For C categories, the embedding process is defined as follows:
e c = Emb ( Category ( c ) )
where e c R d is the embedding vector for category c and Emb represents the embedding layer. These embeddings are learnable parameters within the network, enabling the model to capture semantic relationships among categories while maintaining context. Data augmentation is a technique used to enhance model generalization by generating synthetic training samples. In SSL, it not only expands the training distribution but also encourages the model to learn robust and generalizable patterns. For structured data, effective augmentation strategies include feature subset resampling, feature masking, additive noise injection, and GANSO [52]. Feature subset resampling involves randomly selecting subsets of features to create diverse training instances. This encourages the model to focus on varying combinations of input dimensions, thereby mitigating overfitting and promoting robustness. The process can be expressed as follows:
x ˜ = x [ S ]
where S denotes a randomly selected subset of features and x ˜ represents the resulting sample. By repeatedly sampling different subsets, the model learns from a wider range of feature patterns and has improved generalization to unseen data. Feature masking is another widely adopted augmentation strategy, and is particularly effective in self-supervised settings. During training, a subset of features is randomly masked and the model is tasked with reconstructing the features from the remaining context. This forces the model to capture inter-feature dependencies and enhances its robustness against missing data. The reconstruction can be formulated as
x ^ i = f ( x i ; θ ) ,
where x i is the input with the i-th feature masked, x ^ i is the predicted value, f is the mapping function, and θ denotes model parameters. This strategy enables the model to infer missing information from partial observations, which is crucial when dealing with real-world incomplete datasets. The technique of additive noise injection improves robustness by simulating real-world perturbations during training. Random noise sampled from a predefined distribution is added to the input features, creating noisy variations that the model must learn to tolerate. Formally, the augmented input is provided by
x ˜ = x + n ,
where n is the additive noise, typically drawn from a Gaussian distribution. This technique trains the model to be invariant to small input fluctuations and enhances performance in noisy or corrupted environments. Collectively, these preprocessing and augmentation strategies form a comprehensive pipeline that supports robust SSL on structured data. Statistical imputation and local smoothing effectively address missing values, while standardization and embedding ensure consistent feature representation. Data augmentation methods such as feature resampling, masking, and noise injection enrich training diversity and enhance the generalizability and resilience of the learned representations. These techniques provide essential tools for tackling the unique challenges of sparse tabular data and contribute to improved model performance in downstream tasks. Finally, the GANSO oversampling method expands the original sample space by constructing diverse network slice configurations, which enhances the model’s generalization capability in complex environments. The procedure can be formulated as follows:
x ˜ = f ( x ; θ )
where x denotes the original sample, θ represents the configuration parameters, and x ˜ is the generated sample. This method generates new samples in a structurally consistent manner, effectively mitigating the issue of data imbalance.

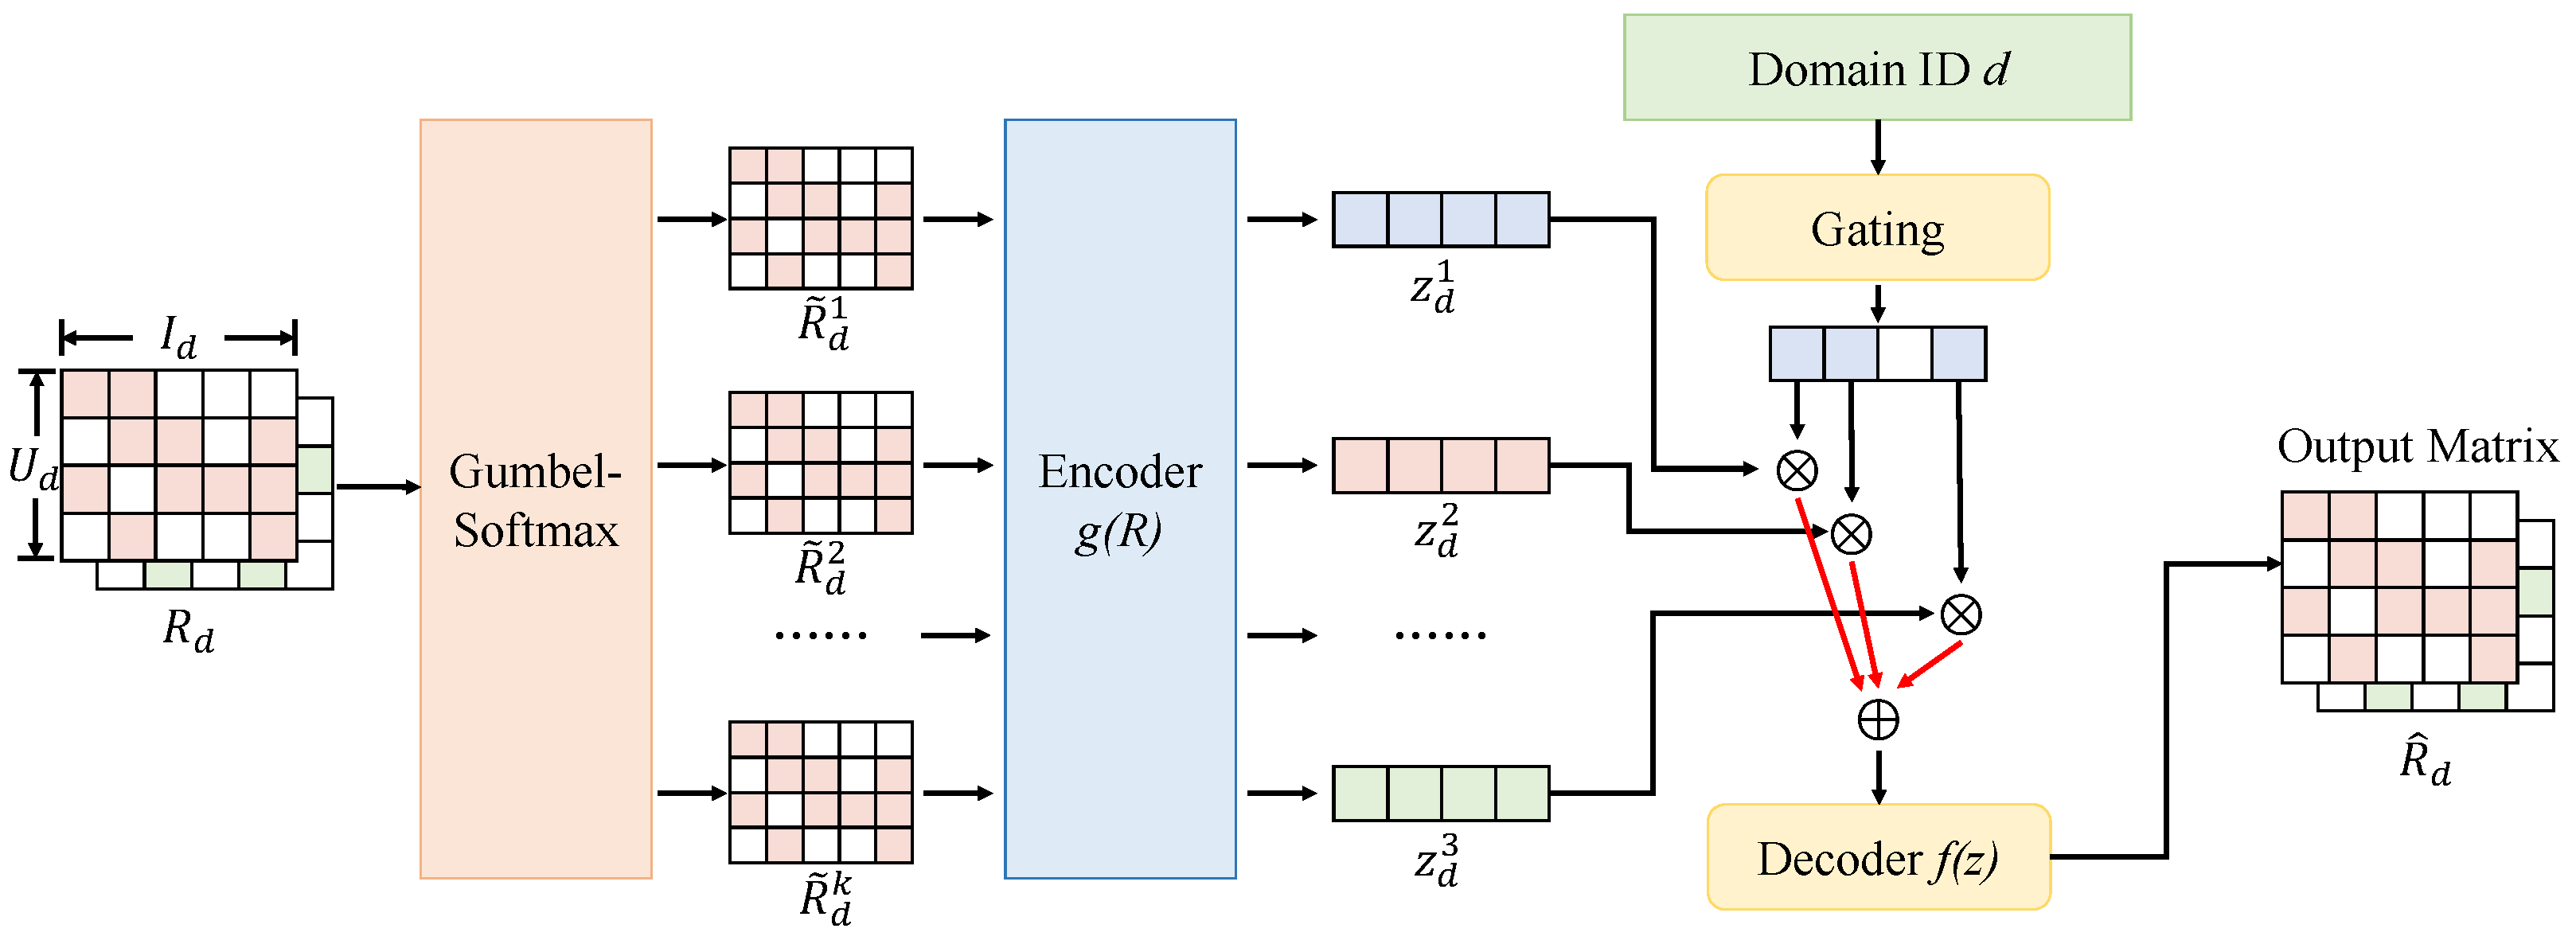
3.3. Proposed Method

The proposed model is designed to take feature subspaces of structured sparse data as input. Initially, the original feature vectors are partitioned into random groups through a multi-view strategy and fed into several independent encoders operating in parallel to generate multi-view latent representations. These representations are subsequently processed by the consistency contrast module, where both intra-view and cross-view contrastive tasks are executed to enhance robustness. Finally, all outputs are jointly optimized within a fusion module through integration of the multi-view contrastive loss and masked reconstruction error, enabling collaborative representation learning and structural alignment.

3.3.1. Multi-View Encoder

Within the proposed SSL framework, the multi-view encoder serves as a core component responsible for partitioning and encoding feature subspaces of structured sparse inputs. Its design aims to uncover latent structural information from diverse feature combinations across multiple perspectives, thereby enhancing the generalization capability in downstream representation learning and predictive tasks. As illustrated in Figure 1, the original input is represented by a rating matrix R d R u d × I d , where u d denotes the number of users and I d is the number of items. Because such matrices typically contain substantial missing values, direct encoding would result in incomplete information and reduced representational capacity. To address this, a Gumbel-Softmax module is introduced to perform multi-view partitioning of the original features in a differentiable manner. This module applies soft sampling to split R d along the feature dimension into k subspaces, resulting in submatrices R ˜ d 1 , R ˜ d 2 , , R ˜ d k . This approach retains global semantic structure while introducing perturbations that enrich representational diversity, simulating potential latent subfeature distributions found in practice. Each submatrix is then passed through a structurally identical but independently parameterized encoder network g i ( · ) to generate the corresponding latent representation z d i = g i ( R ˜ d i ) , where i = 1 , , k .
Each encoder adopts a two-layer nonlinear feedforward neural network. The first layer performs a linear transformation with hidden dimensionality d hidden = 128 , followed by a ReLU activation. The second layer maps the output to a latent vector of dimension d latent = 64 . The complete encoding operation is formally defined as follows:
z d i = g i ( R ˜ d i ) = ReLU ( W 2 ( i ) · ReLU ( W 1 ( i ) · vec ( R ˜ d i ) + b 1 ( i ) ) + b 2 ( i ) )
where W 1 ( i ) R 128 × n i and W 2 ( i ) R 64 × 128 , while n i represents the flattened dimension of R ˜ d i . This decoupling strategy enables each view to independently capture higher-order feature correlations within its subspace while mitigating the risk of representation bias due to dominant features. The multi-view encoder design offers both theoretical significance and practical value. First, by introducing subspace-level distribution perturbations, it improves the model’s robustness under diverse augmentation strategies and alleviates disruptions caused by missing entries in tabular data. Second, although all views share the same architectural design, their parameters remain unshared. This enables each to learn unique statistical patterns during training, enhancing the discriminative power of latent representations. Furthermore, the collection of z d i embeddings serves as input for subsequent contrastive learning and weighted fusion, facilitating the construction of interpretable and disentangled multimodal embedding spaces. In practice, the number of views k and the feature subset size for each view are treated as critical hyperparameters. Experimental results demonstrate that a moderate increase in k enhances the model’s capacity to characterize complex structural patterns, while excessive partitioning leads to overly sparse subspaces, with a negative impact on encoder performance. Therefore, k is empirically set to 4, with each encoder receiving a randomly sampled 25% of the feature set. A joint optimization involving contrastive loss and masked prediction loss ensures that all view-specific embeddings converge toward a unified semantic space.

3.3.2. View Consistency Contrastor

Within the proposed multi-view consistency-based self-supervised representation learning framework, the view consistency contrastor plays a pivotal role in aligning latent representations across views. Its core objective is to promote semantic aggregation and latent coordination among view-specific embeddings while preserving the independence of encoders across views. As illustrated in the corresponding module diagram, the consistency contrastor constructs a “masked hop” neighborhood structure to simulate inter-view information propagation. Contrastive learning is then applied on the basis of this structure to ensure alignment of the latent spaces across views, as shown in Figure 2.
Specifically, given the latent representations from k views, denoted by z d 1 , z d 2 , , z d k , a set of masked neighborhoods N p is generated by using local perturbation and masking mechanisms to construct a multi-layer graph adjacency structure. Architecturally, a three-layer graph neural network (GNN) is employed to perform consistency learning. Each layer consists of a linear transformation followed by an activation function, with an attention-based fusion mechanism introduced to enable inter-view interactions. The channel dimensions are set as follows: the first layer uses a width of 64 and 32 channels, the second layer uses 32 and 16, and the third layer uses 16 and 8. ReLU activations are applied between layers, and dropout is used to prevent overfitting. Mathematically, the intra-view contrastive loss between two perturbed samples z i and z j from the same view is defined as
L intra = log exp ( sim ( z i , z j ) / τ ) z k B exp ( sim ( z i , z k ) / τ ) ,
where sim ( a , b ) denotes cosine similarity, τ is the temperature coefficient, and B represents the batch-wise set of negative samples. This loss encourages consistent representations within each view under perturbations. For inter-view latent representation pairs z d i , z d j , a cross-view consistency loss is defined as
L cross = i = 1 k j = 1 , j i k ϕ ( z d i ) ϕ ( z d j ) 2 2
where ϕ ( · ) is a shared linear projector that maps all view-specific embeddings to a common latent alignment space. This loss imposes a Euclidean constraint to align the semantics across views. To enhance local contrastive stability, a graph-based masked neighborhood encoding strategy is further introduced. As shown in the module diagram, a “masked hop” is defined as a local h-hop subgraph centered on node p, with certain edges masked and restructured. Through GNN-based propagation, positive and negative sample pairs are constructed within the masked region, enhancing the model’s capacity to encode localized structural information. The associated loss function is formulated as follows:
L masked = p P log exp ( sim ( z p , z ^ p + ) ) z ^ q N p exp ( sim ( z p , z ^ q ) )
where z ^ p + denotes the reconstructed positive sample from the masked neighborhood and N p is the set of corresponding negative samples. This mechanism allows the model to retain semantic consistency even under information masking, which enhances the robustness of local structure modeling. Ultimately, the view consistency contrastor is integrated with the aforementioned multi-view encoder to form a complete encode–contrast–align learning loop. During training, all contrastive losses and the masked reconstruction loss are jointly optimized under the following objective:
L total = L intra + λ 1 · L cross + λ 2 · L masked + λ 3 · L recon
where λ 1 , λ 2 , and λ 3 are balancing coefficients. This multi-level consistency constraint framework not only enhances the stability and discriminability of the learned representations but also strengthens the semantic connections across feature subspaces. It is particularly well suited for structured sparse datasets with substantial label incompleteness, where it significantly improves performance on tasks such as credit scoring, user classification, and risk detection.

3.3.3. Consistency Fusion and Loss Function Design

Within the proposed multi-view consistency-based self-supervised representation learning framework, the module for consistency fusion and loss function design serves as the critical component that connects the previous two modules and enables unified objective optimization. Its primary function is to integrate multi-view embeddings and apply information-theoretic loss functions for joint training, thereby enhancing the semantic density and structural alignment of the representation space. As shown in the architectural diagram, this module consists of three sub-processes: encoding–projection, variable soft discretization, and information entropy maximization. Inspired by contrastive learning and variational inference, the design emphasizes mining cross-view mutual information while preserving local consistency constraints within individual views, as shown in Figure 3.
In practice, each embedding z d i produced by the multi-view encoder is passed into a projection network ψ i ( · ) . This projection network adopts a three-layer fully connected architecture. The first layer has parameters [ width = 64 , height = 1 , channels = 128 ] , followed by [128, 64] in the second layer, and [64, 32] in the third. Each layer is followed by a ReLU activation and a dropout operation to prevent overfitting and improve expressive capacity. The projected output z ^ d i = ψ i ( z d i ) is then used as the intermediate representation entering the variable soft discretization module. The soft discretization stage aims to map the continuous latent vector z ^ d i into a finite probabilistic discrete set v 1 , v 2 , , v m , thereby enhancing the controllability of the information structure. The Gumbel-Softmax operation with a learnable temperature parameter is adopted as the discretization mechanism, expressed as follows:
q i j = exp ( ( z ^ i j + g i j ) / τ ) k = 1 m exp ( ( z ^ i k + g i k ) / τ ) ,
where g i j denotes Gumbel noise, τ is the annealing temperature, and q i j indicates the assignment probability of sample i to discrete variable j. This soft partitioning retains gradient flow while allowing multiple latent vectors to share semantic clusters, improving representational stability and generalization. Building on this, a contrastive objective based on joint mutual information maximization is designed to measure the alignment of latent variables across different views. Let the discrete variable sets from two views be v i and v j , respectively; then, the cross-view joint mutual information loss is defined as
L info = i = 1 m j = 1 m P ( v i , v j ) log P ( v i , v j ) P ( v i ) P ( v j ) ,
where P ( v i , v j ) is the estimated joint distribution from a sample co-occurrence matrix and P ( v i ) , P ( v j ) denote the corresponding marginal probabilities. This loss essentially represents the negative mutual information, and its optimization encourages the latent variables from different views to exhibit stronger semantic dependency and structural consistency.

3.4. Hardware and Software Environment

Experiments were conducted on a high-performance workstation equipped with an NVIDIA RTX 3090 GPU (manufactured by NVIDIA Corporation, headquartered in Santa Clara, CA, USA) featuring 24 GB of memory and two Intel Xeon processors (Manufactured by Intel Corporation, headquartered in Santa Clara, CA, USA) with 16 cores each, totaling 32 logical cores. The system was configured with 64 GB of RAM and a 1 TB solid-state drive. The RTX 3090 GPU (manufactured by NVIDIA Corporation, headquartered in Santa Clara, CA, USA) significantly accelerated the training of deep learning models, especially when handling high-dimensional sparse data and large-scale datasets, resulting in substantially reduced training times. In terms of software, Python 3.13 was used as the primary programming language, with PyTorch serving as the core deep learning framework. PyTorch enabled efficient model training by leveraging its dynamic computation graph and automatic differentiation capabilities. Data preprocessing and feature engineering were performed using the Pandas and NumPy libraries to ensure data quality and consistency. The learning rate was initialized at 0.001 and the Adam optimizer was selected along with a learning rate decay strategy. The batch size was set to 32 and the number of training epochs was set to 50 to allow sufficient convergence. To prevent overfitting and enhance generalization, dropout regularization with a dropout rate of 0.5 was applied. All hyperparameters were carefully tuned through multiple experimental iterations to ensure optimal performance during training.

3.5. Dataset Description and Experimental Protocol

Three publicly available structured datasets were employed for evaluation, corresponding to tasks of credit scoring prediction, transaction behavior classification, and synthetic anomaly detection. These datasets varied in terms of feature dimensionality, missing data rates, and label sparsity, offering a comprehensive test bed for assessing the proposed model’s effectiveness under diverse sparse structured data scenarios. For each dataset, experimental settings involved simulating low-label regimes (10–20%) of labeled data and high missingness conditions in order to assess the model’s performance in semi-supervised and incomplete data environments. A standard train–test split ratio of 8:2 was adopted to ensure that the test set adequately represented the variability and complexity of each dataset. In addition, 5-fold cross-validation was performed to enhance the robustness and reliability of the experimental results, reducing the impact of random data partitioning on performance evaluation. Key hyperparameters, including the number of views k, learning rate, dropout rate, and hidden dimensions, were selected via grid search based on validation performance to ensure optimal model configuration.

3.6. Evaluation Metrics

Several standard metrics were employed to comprehensively evaluate both classification and reconstruction performance, including accuracy, F1-score, area under the curve (AUC), and normalized mean squared error (Normalized MSE). Accuracy quantifies the proportion of correctly classified instances across the entire dataset, while F1-score balances precision and recall, making it particularly suitable for imbalanced classification scenarios. AUC reflects the model’s discriminative capability across varying decision thresholds, with higher values indicating better robustness. Normalized MSE is used to assess the relative reconstruction error in regression tasks by comparing predicted outputs against actual values normalized by the ground truth variance.

3.7. Baseline

To comprehensively evaluate the performance of the proposed method, comparisons were conducted with several classical and state-of-the-art baseline models, including logistic regression [53], XGBoost [54], TabNet [55], TabTransformer [56], VIME [57], and BERT [58]. Logistic regression is a well-established linear model suitable for linearly separable data. It is widely used due to its simplicity and computational efficiency. XGBoost, a gradient-boosted decision tree algorithm, is capable of capturing nonlinear feature interactions and exhibits strong resistance to overfitting, making it a popular choice for structured data modeling. TabNet is a deep learning-based model that combines attention mechanisms with decision tree-inspired feature selection. It enables automatic identification of informative features and is particularly effective in modeling sparse structured data. TabTransformer leverages the transformer architecture to model tabular data and is capable of capturing long-range dependencies among features, making it well suited for datasets with complex feature interactions. VIME is an SSL framework specifically designed for structured data. It effectively learns latent representations by maximizing the similarity of representations under various perturbations, and performs well in scenarios with limited labels and high missing rates. Although originally designed for natural language processing, BERT has recently been adapted for structured data tasks due to its powerful contextual representation learning capabilities, which are advantageous in feature representation and downstream prediction tasks.

4. Results and Discussion

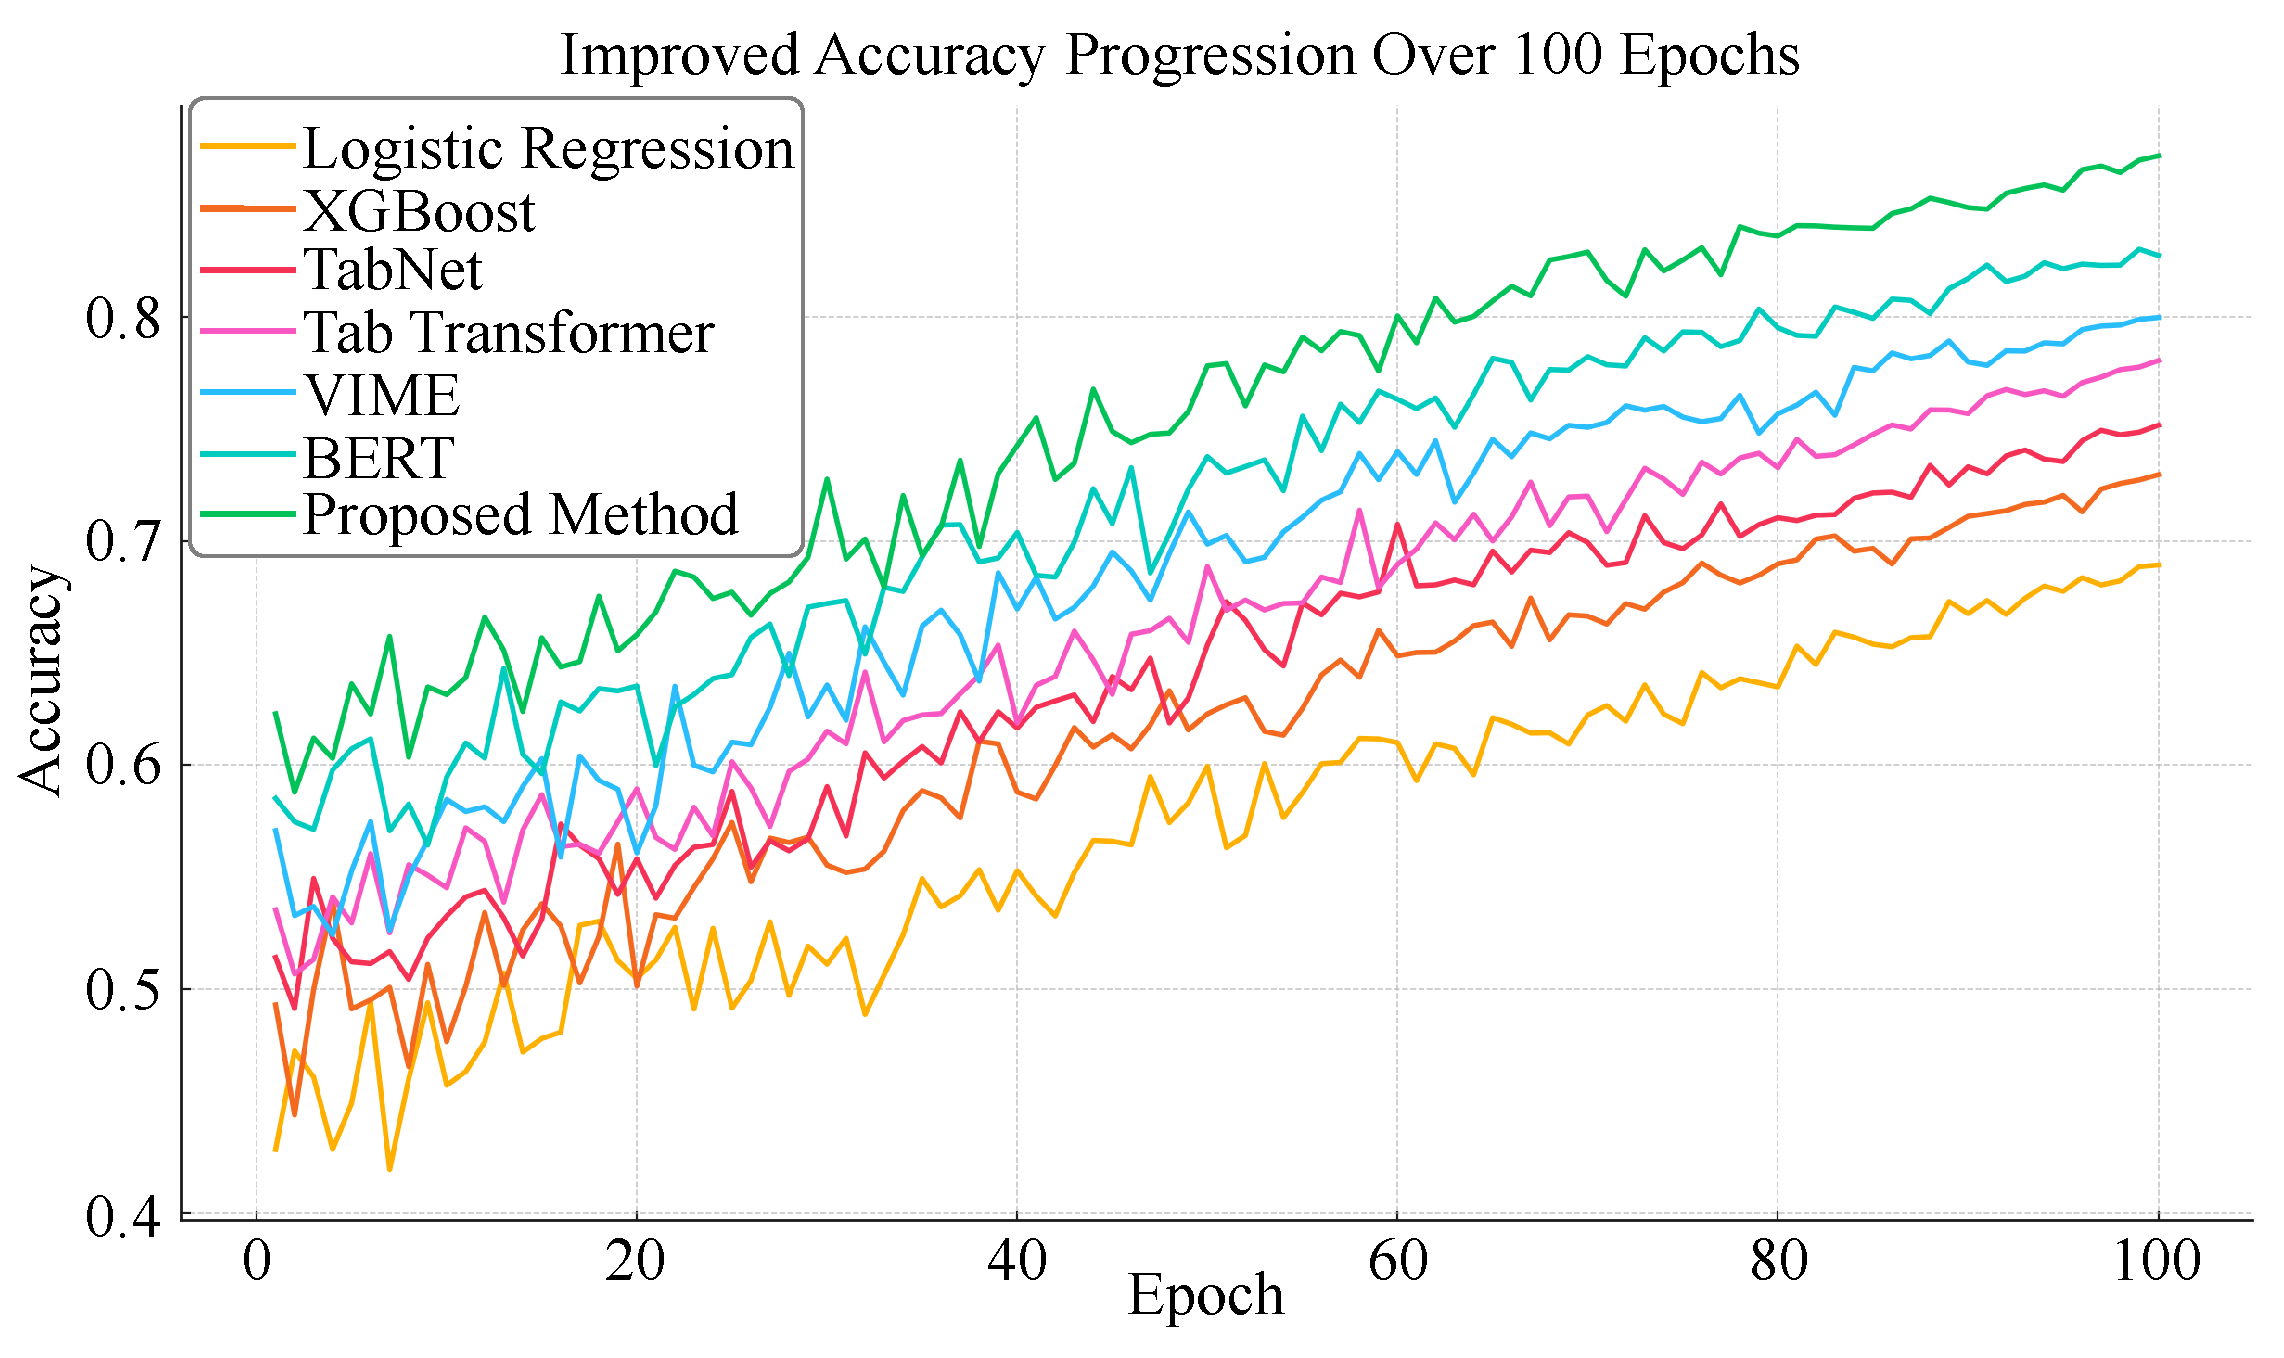
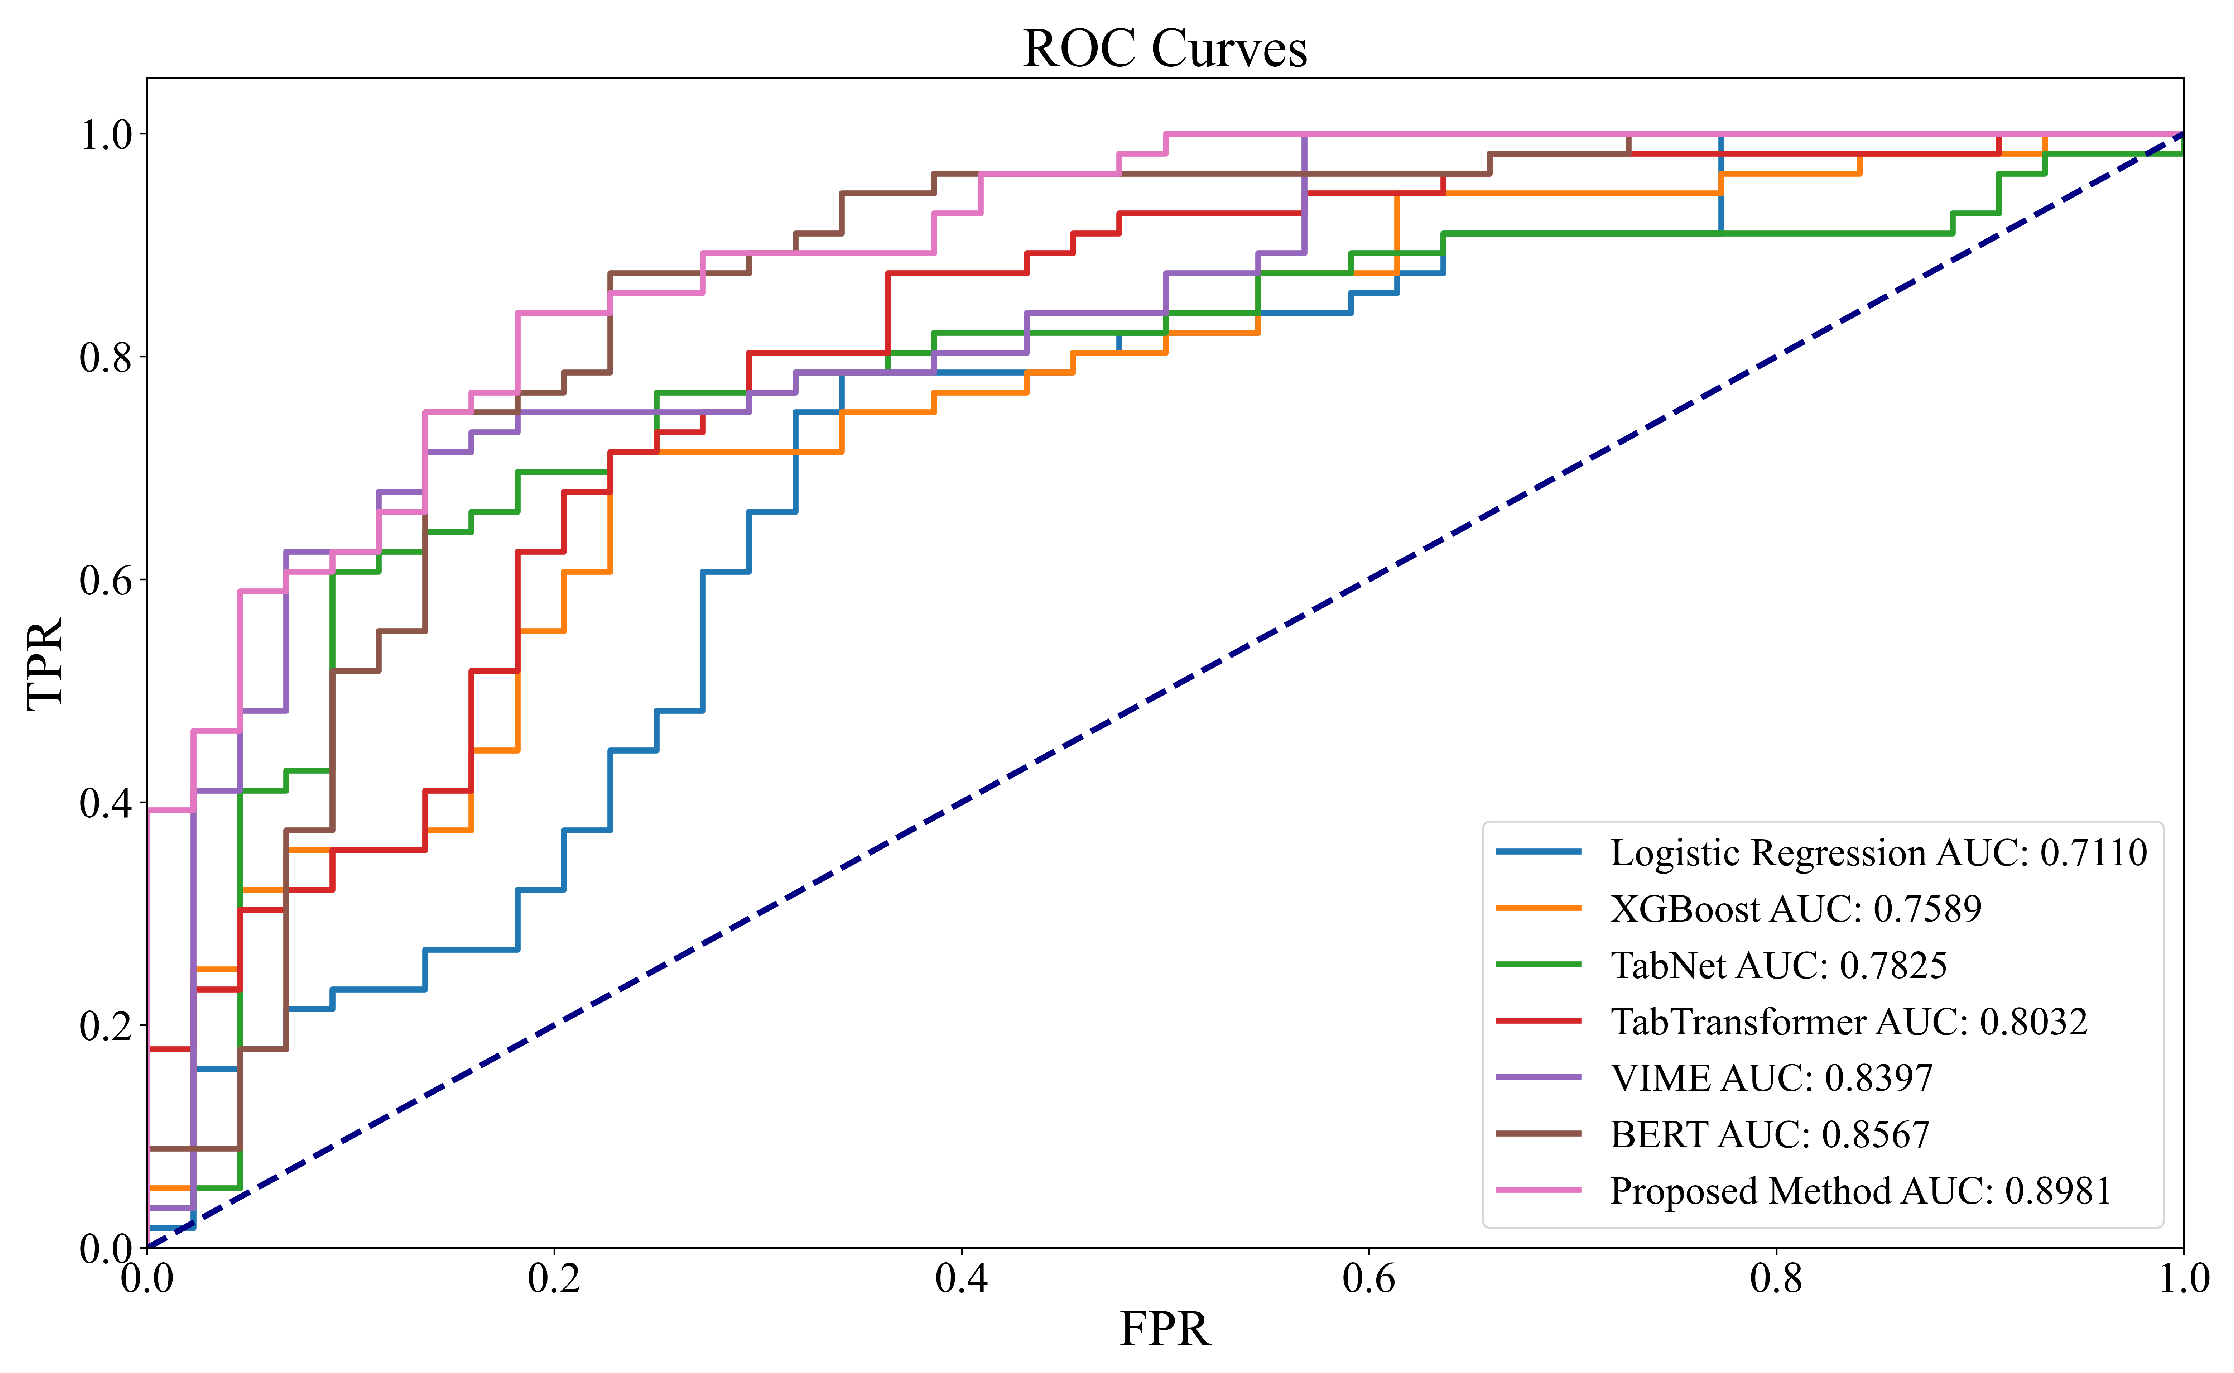
4.1. Experimental Results of Different Models Under Missing Labels and Incomplete Features

This experiment was designed to evaluate the robustness and generalization capabilities of various models under conditions of label sparsity and feature incompleteness. Special attention was paid to assessing whether the proposed multi-view SSL method could effectively model latent semantic structures in scenarios characterized by high missing rates and weak supervision. By controlling the proportion of missing features and the visibility of labels in the input data, the performance of several model types (traditional linear models, tree-based models, tabular deep learning models, self-supervised models, and pretrained architectures) was compared on a classification task. The metrics used for evaluation included accuracy, F1-score, AUC, and normalized mean squared error (MSE).
As shown in Table 3 and Figure 4 and Figure 5, under conditions of high feature missingness and low label availability, shallow models such as logistic regression exhibited the weakest performance, with the lowest values across all metrics. Models based on self-supervision and pretraining generally outperformed the others, with our proposed method achieving the best results on all four metrics. From a structural and learning mechanism perspective, the limited performance of shallow models such as logistic regression and XGBoost can be attributed to their reliance on complete feature inputs and strong supervision signals, which hinders their ability to capture complex nonlinear dependencies under sparsity. Models such as TabNet and TabTransformer leverage deep architectures and attention mechanisms to capture feature interactions in tabular data, but still require sufficient supervision to achieve semantic aggregation. As a self-supervised method designed for structured data, VIME improves performance through masked reconstruction and contrastive learning. BERT, although originally developed for natural language processing, demonstrates strong contextual and feature modeling capabilities when adapted to tabular tasks. Notably, the proposed method further integrates multi-view partitioning, consistency-based contrastive learning, and masked prediction, enabling the construction of stable semantic representations from multiple subspaces. This leads to enhanced adaptability to missing labels and incomplete features and confirms the theoretical and practical strengths of the proposed model design.

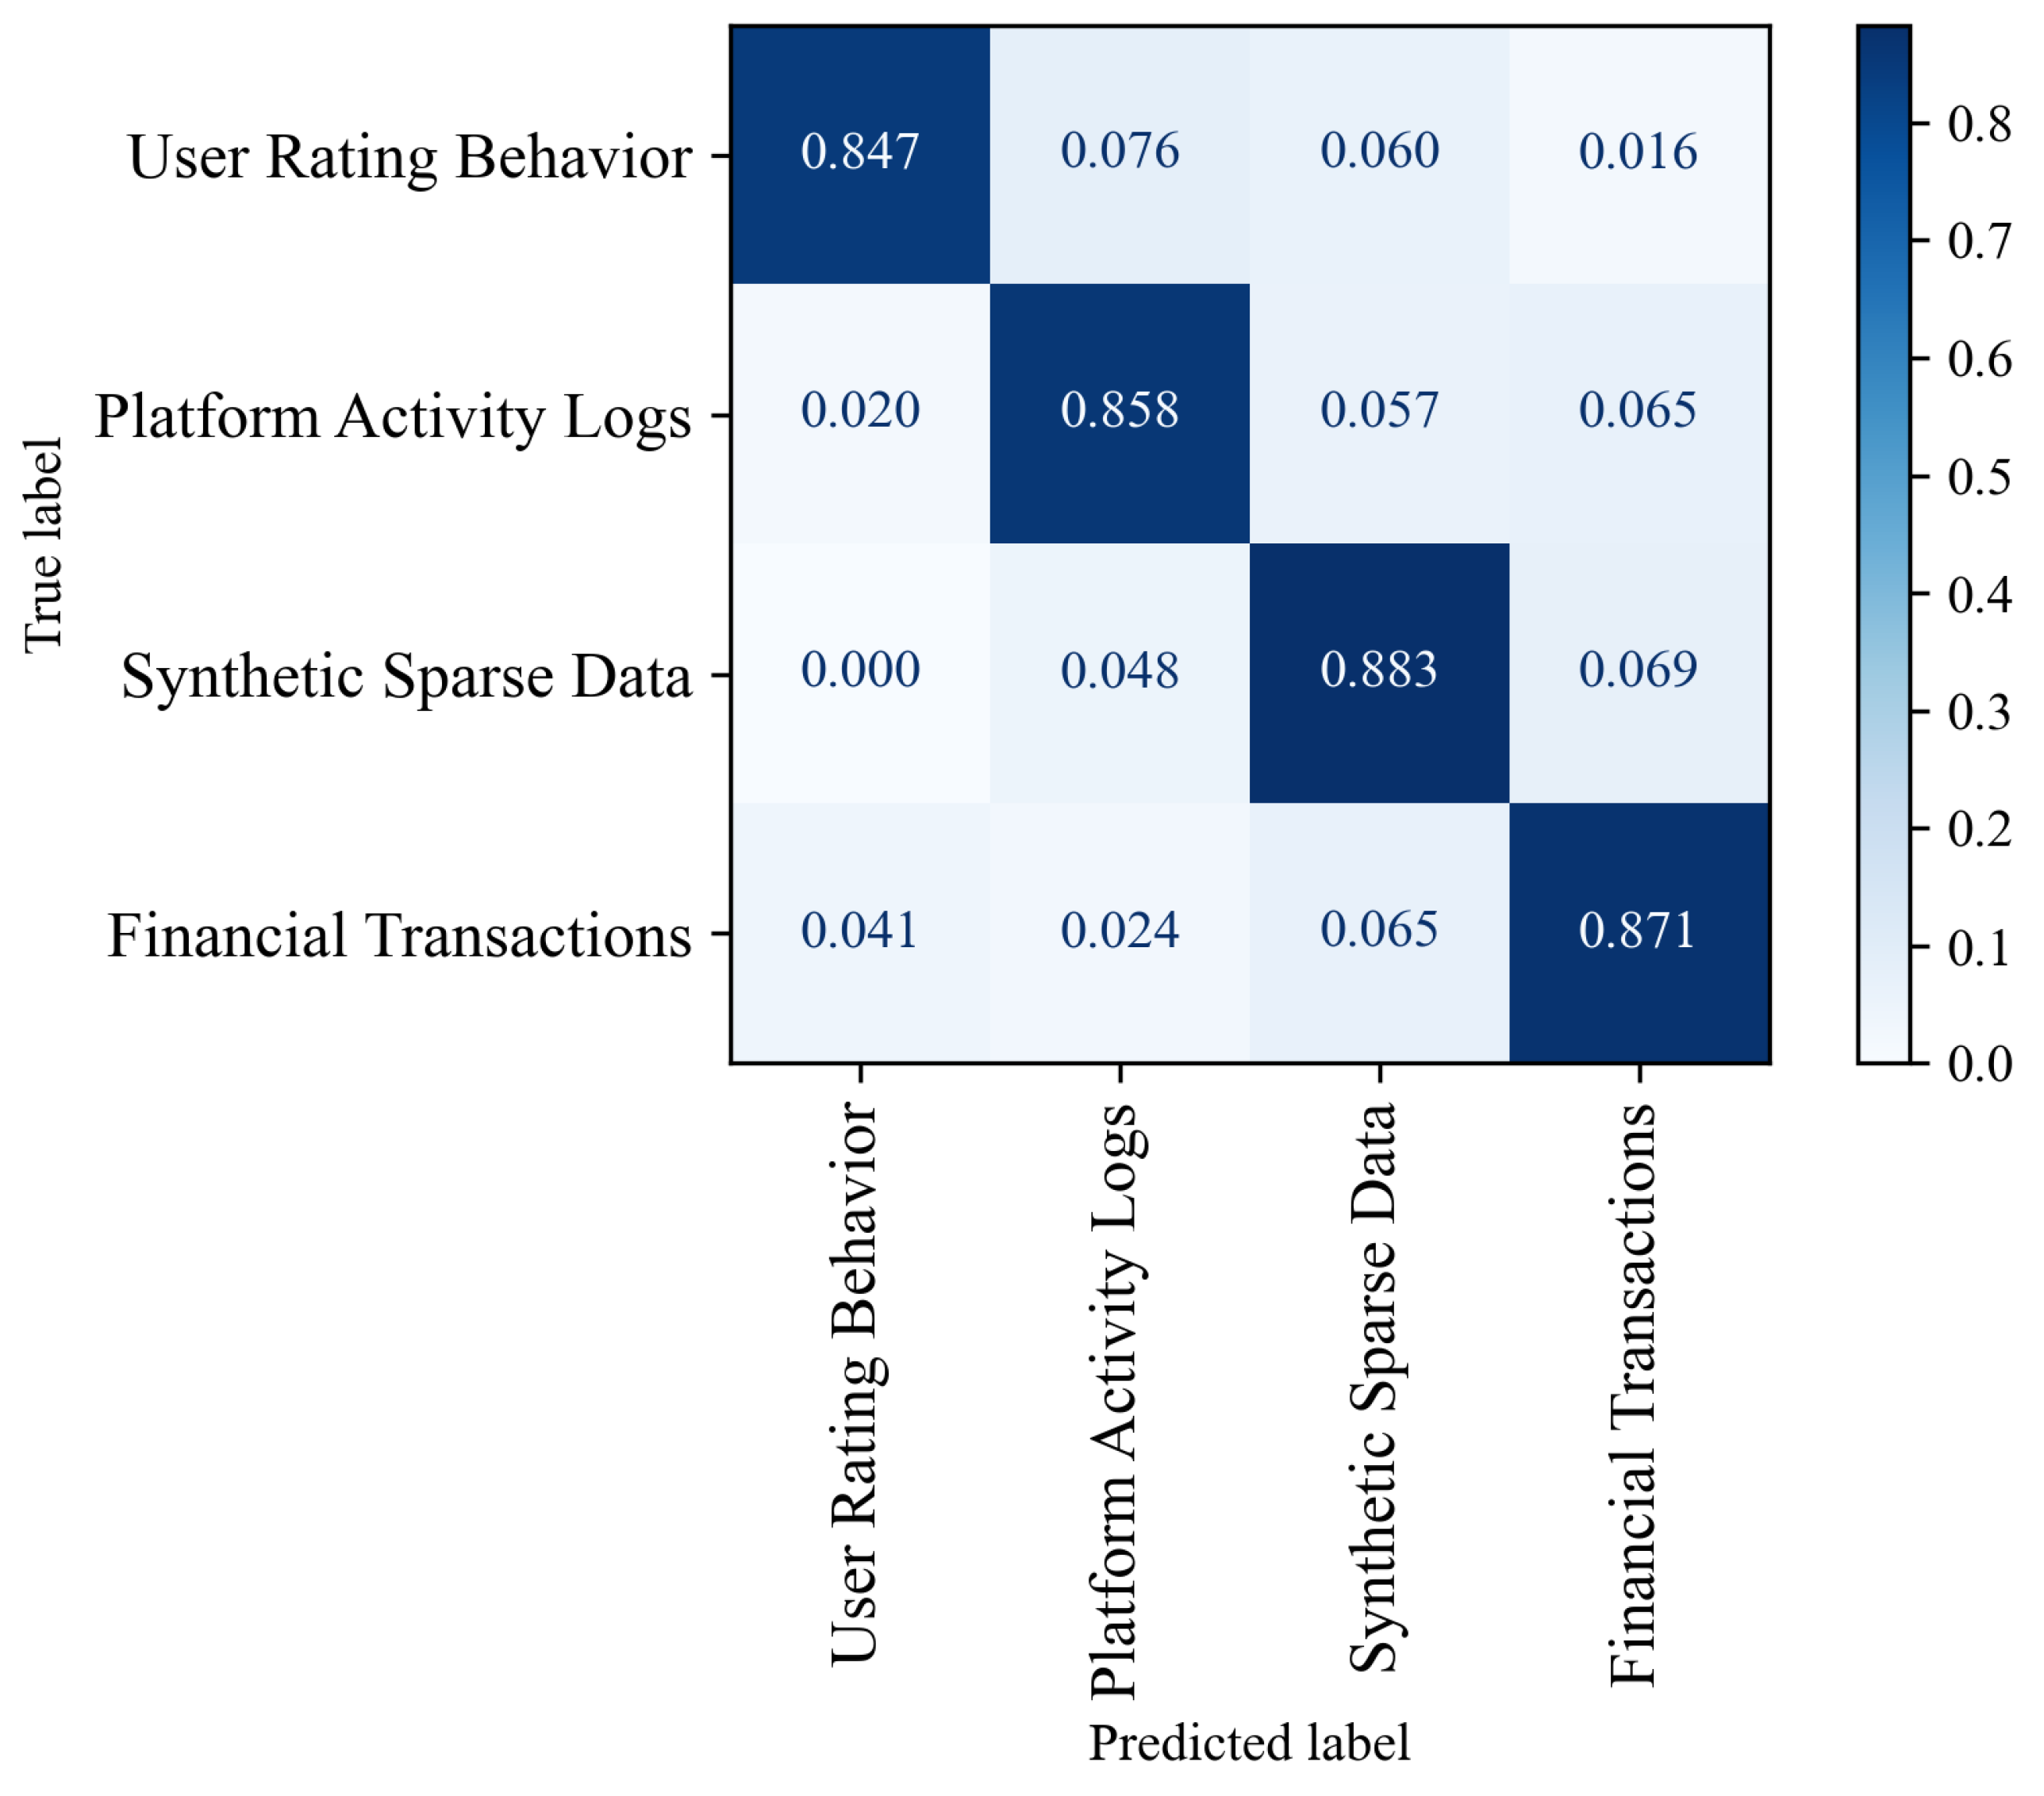
4.2. Performance Evaluation on Diverse Structured Datasets

To validate the generalization capability and robustness of the proposed method, extensive experiments were conducted on four types of structured datasets, including user rating behavior, platform activity logs, synthetic sparse data, and financial transactions. As shown in Table 4 and Figure 6, the proposed method consistently achieved high accuracy (above 0.85), F1-score, and AUC across all datasets while maintaining a low normalized mean squared error. These results demonstrate the model’s effectiveness in handling heterogeneous data structures and its applicability across multiple domains.

4.3. Monte Carlo Analysis and Significance Testing

This experiment aimed to assess the statistical robustness and significance of the proposed model’s performance improvements. To this end, Monte Carlo resampling was conducted by randomly splitting the training and testing sets across five independent runs. All model configurations and hyperparameters were kept fixed in order to isolate the variability introduced by data partitioning. The objective was to evaluate the stability of the results and determine whether the observed performance gains over the baseline models were statistically significant, as shown in Table 5.

4.4. Computational Complexity Analysis

To assess the computational efficiency of the implemented methods, both theoretical and empirical comparisons were conducted. The dominant time complexity of each model was analyzed with respect to the input size n (number of samples) and feature dimension d. Shallow models such as logistic regression exhibit linear time complexity O ( n d ) , as they primarily involve matrix-vector multiplications. Gradient-boosted trees (e.g., XGBoost) typically require O ( n d log n ) due to tree construction over multiple boosting rounds. VIME adds an auxiliary encoder and feature masking, resulting in an approximate complexity of O ( n d 2 ) per batch. TabNet incorporates sequential attention steps with sparse feature selection, yielding an overall complexity between O ( n d ) and O ( n d 2 ) . Transformer-based architectures such as TabTransformer and BERT rely on self-attention operations with complexity O ( n d 2 + d 3 ) . Our proposed method introduces multi-view encoding and inter-view attention, leading to a complexity of O ( n k d 2 ) , where k is the number of views. Despite the higher theoretical cost, it is designed to support efficient parallel computation. The practical computational cost was also measured in terms of training time per epoch, inference latency per sample, and peak GPU memory usage. All experiments were conducted under identical hardware settings. The results were averaged over five Monte Carlo runs and are presented in Table 6.

4.5. Impact of Multi-View Partitioning Strategies on Model Performance

This experiment was conducted to examine the impact of different multi-view partitioning strategies on the performance of self-supervised representation learning. Specifically, three partitioning approaches were compared: random partitioning, information gain-based partitioning, and cluster-based partitioning. All other modules and training configurations were held constant, and performance was assessed using accuracy, F1-score, AUC, and normalized MSE.
As shown in Table 7, the random partitioning strategy resulted in the worst model performance, suggesting that arbitrary splitting fails to preserve meaningful structural relationships among features. Partitioning based on the information gain resulted in improved performance by capturing subsets of features with higher relevance to the target labels. The best results were achieved using cluster-based partitioning, which consistently outperformed the other two strategies across all metrics. This advantage was particularly apparent in accuracy and F1-score, indicating superior capability in modeling feature dependencies. From a theoretical perspective, the performance differences observed across these partitioning strategies stem from their ability to retain informative structure within each subspace. Random partitioning ignores statistical and semantic correlations among features, leading to unstable distributions in the latent embeddings. In contrast, the information gain-based approach utilizes label-conditioned entropy to guide the inclusion of high-importance features in each view, but has limited effectiveness under weak supervision. The cluster-based strategy constructs high-similarity feature groups via unsupervised learning, which enhances both intra-subspace consistency and inter-subspace complementarity. This in turn leads to more cooperative and expressive view-specific embeddings. Given that the proposed method relies heavily on multi-view consistency learning, the structural quality of the subspaces directly influences the discriminative power of the latent space, which explains why cluster-based partitioning consistently yields superior results in both theoretical and empirical settings.

4.6. Ablation Study on Contrastive Loss Mechanisms Under Label and Feature Incompleteness

This experiment was conducted to analyze the impact of different contrastive loss mechanisms on model performance. The study compares intra-view consistency, cross-view consistency, and a combined setting of both in order to investigate the effectiveness of representation learning under scenarios involving missing labels and incomplete features. All training parameters and network architectures were held constant in order to ensure comparability of the results, with only the contrastive loss strategy varied.
As shown in Table 8, the model exhibited inferior performance when using intra-view contrast alone, with lower scores in accuracy, F1-score, and AUC. This suggests that relying solely on similarity constraints within a single view fails to adequately capture the latent semantic relationships across views. On the other hand, applying only the cross-view contrastive loss led to notable improvements, indicating that inter-subspace consistency modeling significantly enhances the quality of the learned embeddings. When both intra- and cross-view contrastive mechanisms were employed simultaneously, the model achieved the best performance across all evaluation metrics, with an accuracy of 0.87, F1-score of 0.83, and normalized MSE reduced to 0.072. These results confirm the complementary and synergistic effects of dual consistency learning. From a modeling perspective, the intra-view contrastive mechanism enforces consistency among perturbed samples within the same subspace, resulting in improved local robustness; however, it lacks the capacity to mitigate potential drifts in representation alignment across views. The cross-view contrastive mechanism introduces inter-view alignment objectives, strengthening latent dependencies and promoting globally consistent embedding structures. Nevertheless, relying exclusively on cross-view objectives may lead to overly homogenized intra-view representations with diminished specificity. By jointly optimizing both local and global consistencies, the proposed strategy not only enhances the discriminability and coherence of the embeddings but also addresses representational degradation caused by missing labels and features. This underscores the importance of well-designed contrastive loss structures in multi-view self-supervised frameworks.

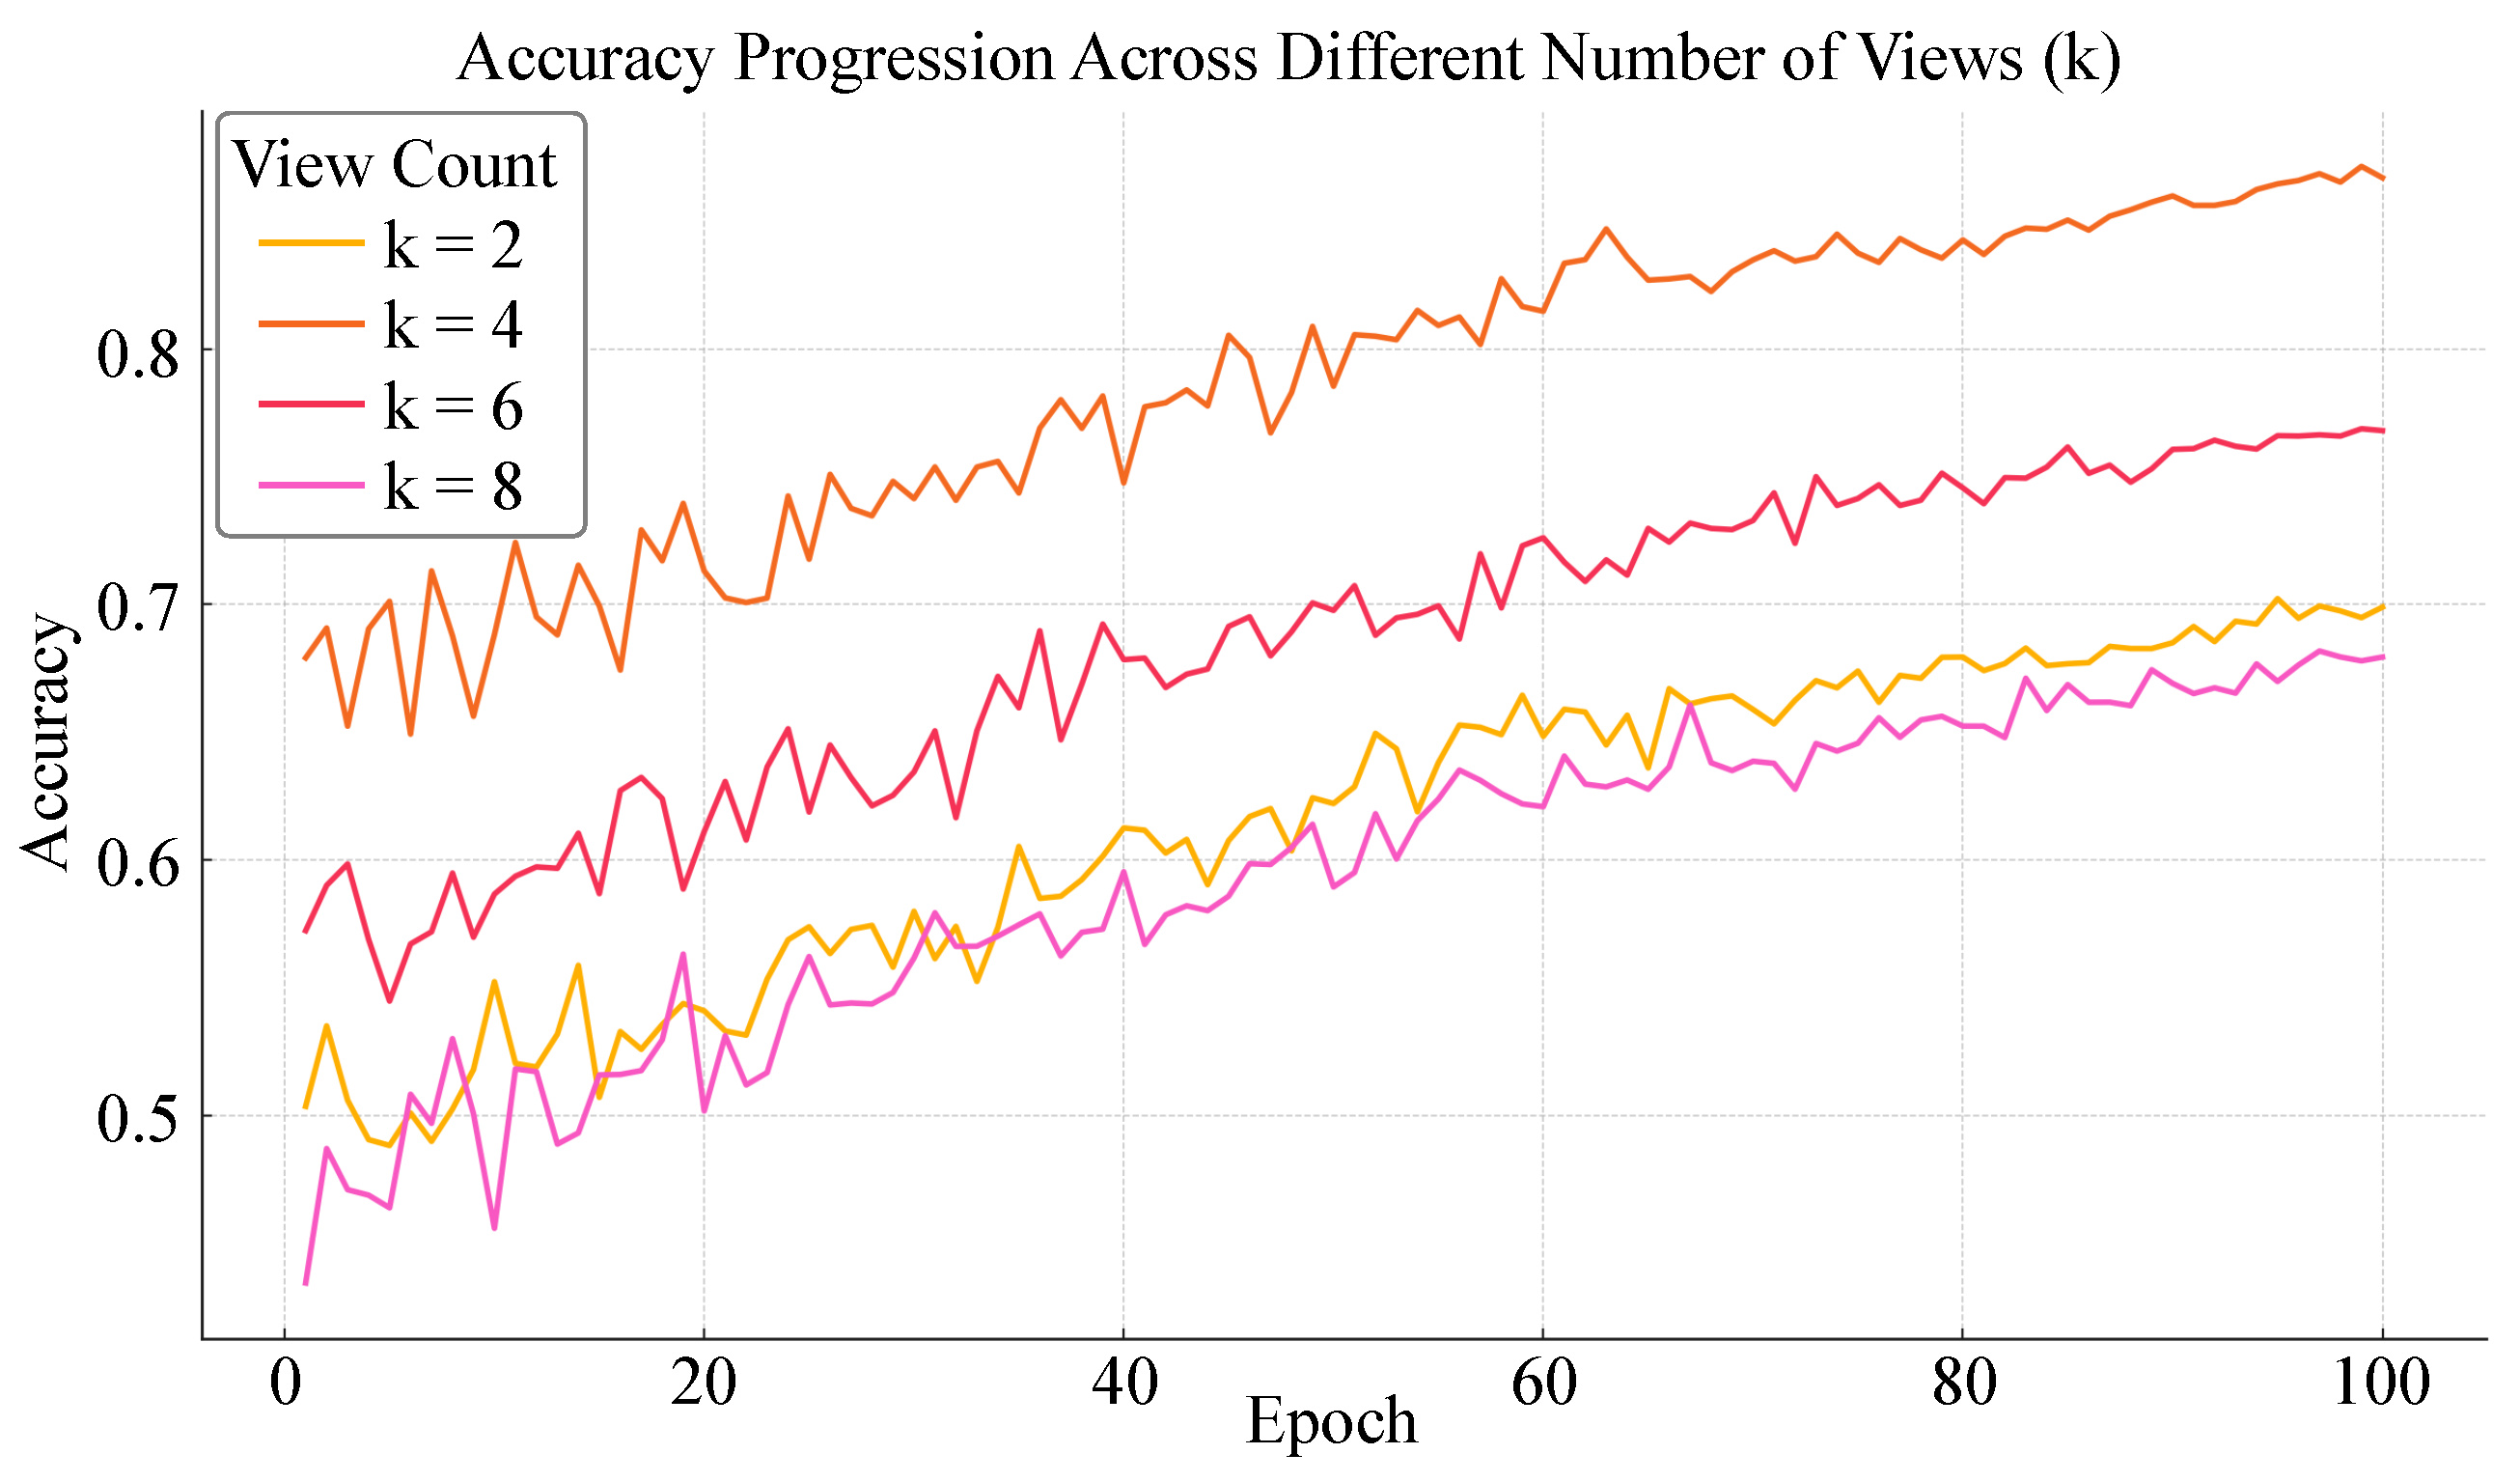
4.7. Impact of View Quantity on Model Performance Under Incomplete Supervision

This experiment aimed to investigate the influence of the number of views k on model performance. By adjusting k from 2 to 8, the effects on classification accuracy, F1-score, AUC, and normalized MSE were analyzed. All other aspects of the model architecture and training configuration were held constant to ensure the comparability of results under different k values.
As shown in Table 9 and Figure 7, the model achieved optimal performance when the number of views was set to k = 4 , with an accuracy of 0.87, F1-score of 0.83, AUC of 0.90, and normalized MSE reduced to 0.072. In contrast, performance declined when k was set to 2 or 6, particularly for k = 2 , where accuracy dropped to 0.70, suggesting that insufficient view diversity may result in inadequate feature coverage. Increasing the number of views to k = 8 led to further degradation, yielding the lowest performance across all metrics. This indicates that excessive partitioning introduces subspace noise and disrupts semantic alignment and integration. From a theoretical perspective, the number of views determines the granularity of feature subspace decomposition, which directly influences the amount of structural information captured by each encoder. With too few views, the model fails to encompass diverse feature combinations, resulting in under-represented latent patterns. Conversely, an overly large number of views reduces the information density within each subspace, diluting signal strength and complicating contrastive pair construction due to sparse associations, which may cause instability during training and degrade generalization. Setting k = 4 achieves a desirable tradeoff between diversity and contextual integrity. Each view retains sufficient structural context, while the consistency objectives across views effectively align latent representations from different subspaces, facilitating the construction of a coherent semantic space. These findings highlight the importance of selecting an appropriate number of views in multi-view self-supervised frameworks to maintain the quality and stability of the learned representations.

4.8. Discussion

A series of experiments was conducted to address the challenges posed by label sparsity and feature incompleteness in structured data. These experiments demonstrated the robustness and adaptability of the proposed multi-view consistency-based SSL framework across multiple real-world application scenarios. The experimental design encompassed evaluations of different view partitioning strategies, configurations of contrastive loss components, and the sensitivity of model performance to the number of views. Across various datasets, strong generalization capabilities were consistently observed, particularly in tasks such as user behavior analysis, financial risk prediction, and operational log modeling. For instance, user interactions with items are typically extremely sparse in user rating scenarios such as those encountered on e-commerce or video streaming platforms, with most users providing feedback on only a limited number of items. Traditional models such as logistic regression or XGBoost rely heavily on abundant and high-quality labels to accurately model user preferences, resulting in poor performance in sparse rating contexts. By incorporating a multi-view partitioning mechanism, the proposed method encodes user features, item attributes, and behavioral context into distinct views. Masked prediction and consistency-based contrastive objectives are then applied to recover stable latent representations from incomplete data. Even with limited rating information, this strategy enables the extraction of discriminative preference representations by modeling inter-feature relationships. As a result, the proposed method significantly outperforms baselines in terms of both accuracy and AUC.
In the context of financial transaction data such as credit scoring or fraud detection systems, models must often contend with numerous missing or inconsistent fields, for example in cases where users omit employment details, transaction types are anonymized, or default records are incomplete. This issue is especially prominent in micro-enterprise lending, where submitted information is typically sparse and label availability is minimal. In scenarios with only 10% to 20% labeled samples, the performance of traditional supervised methods in identifying high-risk users deteriorates markedly. In contrast, the proposed framework exhibits substantial robustness, which can be attributed to its use of consistency constraints to align latent variables across views. This facilitates the extraction of stable structural representations from sparsely populated feature spaces, resulting in high predictive accuracy for critical metrics such as default probability and credit rating. Further analysis of the contrastive loss design revealed that using either intra-view or cross-view consistency alone offers limited performance gains. However, their combination consistently yields superior stability and accuracy. In the case of social media log data, user behaviors observed across different pages can differ due to device type, network conditions, or time of interaction, introducing inter-view asymmetry. Intra-view contrast alone fails to reconcile such disparities, while cross-view contrast is susceptible to local perturbations. Combining both mechanisms enhances the model’s adaptability to structural variations and stabilizes behavioral representations, enabling more accurate inference of user intent and motivation. This makes the method particularly suitable for intelligent recommendation and interest modeling systems.
Our sensitivity experiments on the number of views also highlight a crucial tradeoff between modeling capability and computational cost in practical deployments. In large-scale user risk classification tasks, partitioning features into an excessive number of views dilutes the information content of each view, undermining the efficacy of contrastive learning. Conversely, using too few views restricts the model’s ability to capture inter-feature diversity and complementarity. Our experimental results indicate that setting the number of views to k = 4 yields optimal performance across various scenarios. This configuration strikes a balance by providing sufficient informational redundancy to support contrastive learning without imposing excessive computational overhead. It is particularly well suited for deployment on edge computing platforms, where efficient risk identification and behavioral analytics are essential.

4.9. Limitation and Future Work

Despite the significant performance improvements demonstrated by the proposed multi-view consistency-based self-supervised representation learning method across various structured data scenarios, particularly under conditions of missing labels and incomplete features, several limitations remain that warrant further investigation. Future research may be pursued in two primary directions. First, the incorporation of more lightweight view modeling and fusion mechanisms, such as dynamically reweighted attention-based view adjustment strategies, could reduce computational overhead while enhancing the model’s adaptability across diverse hardware platforms. Second, efforts could be directed toward integrating temporal dynamics with the view partitioning mechanism. For instance, the use of temporal graph neural networks or structure-evolving awareness modules may strengthen the model’s capacity to adapt to evolving data structures and improve interpretability. Furthermore, the inclusion of datasets from a broader range of sources, especially real-world sparse tabular data from domains such as healthcare, government, and manufacturing, would serve to further validate the generalizability and practical value of the proposed framework.

5. Conclusions

Traditional supervised learning methods often suffer from performance degradation and limited generalization capability in structured data modeling tasks, particularly under conditions characterized by high missing rates and sparse labeling. To address these practical challenges, we have proposed a self-supervised representation learning framework based on multi-view consistency constraints. This unified architecture integrates a view-disentangled encoder, a view-consistency contrastor, and a loss fusion module. In classification tasks conducted across varying levels of missingness and label availability, the proposed method consistently outperformed baseline models across several key metrics, achieving an accuracy of 0.87, F1-score of 0.83, and AUC of 0.90 while reducing the normalized mean squared error to 0.066. These results significantly surpass those attained by conventional methods such as logistic regression, XGBoost, and deep tabular models including TabTransformer and VIME. Ablation studies further revealed that the most stable performance was achieved under three critical configurations: partitioning views based on feature clustering, jointly applying both the intra-view and cross-view consistency contrastive losses, and setting the number of views to k = 4 . These findings underscore the advantages of the proposed method in effectively representing structural subspaces, maintaining latent consistency, and managing model complexity. Future enhancements could involve the integration of dynamic graph modeling, temporal feature structures, and adaptive view mechanisms, which would extend the applicability of the proposed framework to dynamic data environments and cross-domain tasks.

Author Contributions

Conceptualization, Y.Y., Q.L., Z.L. and C.L.; data curation, S.L., S.Z. and Y.W. (Yiyan Wang); formal analysis, Y.W. (Yakui Wang) and S.Z.; funding acquisition, C.L.; investigation, Y.W. (Yakui Wango); methodology, Y.Y., Q.L. and Z.L.; project administration, C.L.; resources, S.L., S.Z. and Y.W. (Yiyan Wang); software, Y.Y., Q.L. and Z.L.; supervision, C.L.; validation, Y.W. (Yakui Wang); visualization, S.L. and Y.W. (Yiyan Wang); writing—original draft, Y.Y., Q.L., Z.L., Y.W. (Yakui Wang), S.L., S.Z., Y.W. (Yiyan Wang) and C.L. All authors have read and agreed to the published version of the manuscript.

Funding

This research was funded by National Natural Science Foundation of China, grant number 61202479.

Data Availability Statement

The data presented in this study are available on request from the corresponding author.

Conflicts of Interest

The authors declare no conflicts of interest.

References

  1. Ruan, Y.; Lan, X.; Ma, J.; Dong, Y.; He, K.; Feng, M. Language modeling on tabular data: A survey of foundations, techniques and evolution. arXiv 2024, arXiv:2408.10548. [Google Scholar]
  2. Sarker, I.H. Data science and analytics: An overview from data-driven smart computing, decision-making and applications perspective. SN Comput. Sci. 2021, 2, 377. [Google Scholar] [CrossRef] [PubMed]
  3. Goldstein, I.; Spatt, C.S.; Ye, M. Big data in finance. Rev. Financ. Stud. 2021, 34, 3213–3225. [Google Scholar] [CrossRef]
  4. Lei, X.; Mohamad, U.H.; Sarlan, A.; Shutaywi, M.; Daradkeh, Y.I.; Mohammed, H.O. Development of an intelligent information system for financial analysis depend on supervised machine learning algorithms. Inf. Process. Manag. 2022, 59, 103036. [Google Scholar] [CrossRef]
  5. Sharma, N.; Soni, M.; Kumar, S.; Kumar, R.; Deb, N.; Shrivastava, A. Supervised machine learning method for ontology-based financial decisions in the stock market. ACM Trans. Asian Low-Resour. Lang. Inf. Process. 2023, 22, 1–24. [Google Scholar] [CrossRef]
  6. Qu, L.; Liu, S.; Liu, X.; Wang, M.; Song, Z. Towards label-efficient automatic diagnosis and analysis: A comprehensive survey of advanced deep learning-based weakly-supervised, semi-supervised and self-supervised techniques in histopathological image analysis. Phys. Med. Biol. 2022, 67, 20TR01. [Google Scholar] [CrossRef]
  7. Petrini, L.; Cagnetta, F.; Vanden-Eijnden, E.; Wyart, M. Learning sparse features can lead to overfitting in neural networks. Adv. Neural Inf. Process. Syst. 2022, 35, 9403–9416. [Google Scholar] [CrossRef]
  8. Zhao, H.; Lou, Y.; Xu, Q.; Feng, Z.; Wu, Y.; Huang, T.; Tan, L.; Li, Z. Optimization strategies for self-supervised learning in the use of unlabeled data. J. Theory Pract. Eng. Sci. 2024, 4, 30–39. [Google Scholar] [CrossRef]
  9. Ndifon, V.B. The Reliability and Efficiency of Replacing Missing Data in Sparse Data Sets. Ph.D. Thesis, Northcentral University, Scottsdale, AZ, USA, 2023. [Google Scholar]
  10. Shafiei, A.; Tatar, A.; Rayhani, M.; Kairat, M.; Askarova, I. Artificial neural network, support vector machine, decision tree, random forest, and committee machine intelligent system help to improve performance prediction of low salinity water injection in carbonate oil reservoirs. J. Pet. Sci. Eng. 2022, 219, 111046. [Google Scholar] [CrossRef]
  11. Abdulhafedh, A. Comparison between common statistical modeling techniques used in research, including: Discriminant analysis vs logistic regression, ridge regression vs LASSO, and decision tree vs. random forest. Open Access Libr. J. 2022, 9, e8414. [Google Scholar] [CrossRef]
  12. Teegavarapu, R.S. Imputation Methods: An Overview. Imputation Methods for Missing Hydrometeorological Data Estimation; Springer: Cham, Switzerland, 2024; pp. 27–41. [Google Scholar]
  13. Brini, A.; van den Heuvel, E.R. Missing data imputation with high-dimensional data. Am. Stat. 2024, 78, 240–252. [Google Scholar] [CrossRef]
  14. Zhang, Y.; Wa, S.; Liu, Y.; Zhou, X.; Sun, P.; Ma, Q. High-accuracy detection of maize leaf diseases CNN based on multi-pathway activation function module. Remote Sens. 2021, 13, 4218. [Google Scholar] [CrossRef]
  15. Lee, T.; Shi, D. A comparison of full information maximum likelihood and multiple imputation in structural equation modeling with missing data. Psychol. Methods 2021, 26, 466. [Google Scholar] [CrossRef] [PubMed]
  16. Borisov, V.; Leemann, T.; Seßler, K.; Haug, J.; Pawelczyk, M.; Kasneci, G. Deep neural networks and tabular data: A survey. IEEE Trans. Neural Netw. Learn. Syst. 2022, 35, 7499–7519. [Google Scholar] [CrossRef]
  17. Zhang, L.; Zhang, Y.; Ma, X. A New Strategy for Tuning ReLUs: Self-Adaptive Linear Units (SALUs). In Proceedings of the ICMLCA 2021 2nd International Conference on Machine Learning and Computer Application, Shenyang, China, 17–19 December 2021; VDE: Offenbach, Germany, 2021; pp. 1–8. [Google Scholar]
  18. Shakir, W.A. Benchmarking TabLM: Evaluating the Performance of Language Models Against Traditional Machine Learning in Structured Data Tasks. In Proceedings of the 2024 1st International Conference on Emerging Technologies for Dependable Internet of Things (ICETI), Sana’a, Yemen, 25–26 November 2024; IEEE: Piscataway, NJ, USA, 2024; pp. 1–10. [Google Scholar]
  19. McDonnell, K.; Murphy, F.; Sheehan, B.; Masello, L.; Castignani, G. Deep learning in insurance: Accuracy and model interpretability using TabNet. Expert Syst. Appl. 2023, 217, 119543. [Google Scholar] [CrossRef]
  20. Li, Q.; Zhang, Y. Confidential Federated Learning for Heterogeneous Platforms against Client-Side Privacy Leakages. In Proceedings of the ACM Turing Award Celebration Conference-China 2024, Changsha China, 5–7 July 2024; pp. 239–241. [Google Scholar]
  21. Vyas, T.K. Deep learning with tabular data: A self-supervised approach. arXiv 2024, arXiv:2401.15238. [Google Scholar]
  22. Li, Q.; Zhang, Y.; Ren, J.; Li, Q.; Zhang, Y. You Can Use But Cannot Recognize: Preserving Visual Privacy in Deep Neural Networks. arXiv 2024, arXiv:2404.04098. [Google Scholar]
  23. Sun, Y.; Li, J.; Xu, Y.; Zhang, T.; Wang, X. Deep learning versus conventional methods for missing data imputation: A review and comparative study. Expert Syst. Appl. 2023, 227, 120201. [Google Scholar] [CrossRef]
  24. Li, Q.; Ren, J.; Zhang, Y.; Song, C.; Liao, Y.; Zhang, Y. Privacy-Preserving DNN Training with Prefetched Meta-Keys on Heterogeneous Neural Network Accelerators. In Proceedings of the 2023 60th ACM/IEEE Design Automation Conference (DAC), San Francisco, CA, USA, 9–13 July 2023; IEEE: Piscataway, NJ, USA, 2023; pp. 1–6. [Google Scholar]
  25. Wei, Y.; Zhao, L.; Zheng, W.; Zhu, Z.; Rao, Y.; Huang, G.; Lu, J.; Zhou, J. Surrounddepth: Entangling surrounding views for self-supervised multi-camera depth estimation. In Proceedings of the Conference on Robot Learning, PMLR, Atlanta, GA, USA, 6–9 November 2023; pp. 539–549. [Google Scholar]
  26. Wandt, B.; Rudolph, M.; Zell, P.; Rhodin, H.; Rosenhahn, B. Canonpose: Self-supervised monocular 3d human pose estimation in the wild. In Proceedings of the IEEE/CVF Conference on Computer Vision and Pattern Recognition, Nashville, TN, USA, 19–25 June 2021; pp. 13294–13304. [Google Scholar]
  27. Sun, L.; Bian, J.W.; Zhan, H.; Yin, W.; Reid, I.; Shen, C. Sc-depthv3: Robust self-supervised monocular depth estimation for dynamic scenes. IEEE Trans. Pattern Anal. Mach. Intell. 2023, 46, 497–508. [Google Scholar] [CrossRef]
  28. Chen, K.; Hong, L.; Xu, H.; Li, Z.; Yeung, D.Y. Multisiam: Self-supervised multi-instance siamese representation learning for autonomous driving. In Proceedings of the IEEE/CVF International Conference on Computer Vision, Montreal, BC, Canada, 11–17 October 2021; pp. 7546–7554. [Google Scholar]
  29. Koo, H.; Kim, T.E. A comprehensive survey on generative diffusion models for structured data. arXiv 2023, arXiv:2306.04139. [Google Scholar]
  30. Alharthi, A.M.; Lee, M.H.; Algamal, Z.Y. Improving Penalized Logistic Regression Model with Missing Values in High-Dimensional Data. Int. J. Online Biomed. Eng. 2022, 18, 113–129. [Google Scholar] [CrossRef]
  31. Konstantinov, A.V.; Utkin, L.V. Interpretable machine learning with an ensemble of gradient boosting machines. Knowl.-Based Syst. 2021, 222, 106993. [Google Scholar] [CrossRef]
  32. Pedro, F. A review of data mining, big data analytics, and machine learning approaches. J. Comput. Nat. Sci. 2023, 3, 169–181. [Google Scholar] [CrossRef]
  33. Ahmed, S.F.; Alam, M.S.B.; Hassan, M.; Rozbu, M.R.; Ishtiak, T.; Rafa, N.; Mofijur, M.; Shawkat Ali, A.; Gandomi, A.H. Deep learning modelling techniques: Current progress, applications, advantages, and challenges. Artif. Intell. Rev. 2023, 56, 13521–13617. [Google Scholar] [CrossRef]
  34. Somvanshi, S.; Das, S.; Javed, S.A.; Antariksa, G.; Hossain, A. A survey on deep tabular learning. arXiv 2024, arXiv:2410.12034. [Google Scholar]
  35. Song, H.; Kim, M.; Park, D.; Shin, Y.; Lee, J.G. Learning from noisy labels with deep neural networks: A survey. IEEE Trans. Neural Netw. Learn. Syst. 2022, 34, 8135–8153. [Google Scholar] [CrossRef] [PubMed]
  36. Jia, S.; Jiang, S.; Lin, Z.; Li, N.; Xu, M.; Yu, S. A survey: Deep learning for hyperspectral image classification with few labeled samples. Neurocomputing 2021, 448, 179–204. [Google Scholar] [CrossRef]
  37. Gui, J.; Chen, T.; Zhang, J.; Cao, Q.; Sun, Z.; Luo, H.; Tao, D. A survey on self-supervised learning: Algorithms, applications, and future trends. IEEE Trans. Pattern Anal. Mach. Intell. 2024, 46, 9052–9071. [Google Scholar] [CrossRef]
  38. Lin, S.Y.; Kung, Y.C.; Leu, F.Y. Predictive intelligence in harmful news identification by BERT-based ensemble learning model with text sentiment analysis. Inf. Process. Manag. 2022, 59, 102872. [Google Scholar] [CrossRef]
  39. Subakti, A.; Murfi, H.; Hariadi, N. The performance of BERT as data representation of text clustering. J. Big Data 2022, 9, 15. [Google Scholar] [CrossRef]
  40. Rani, V.; Nabi, S.T.; Kumar, M.; Mittal, A.; Kumar, K. Self-supervised learning: A succinct review. Arch. Comput. Methods Eng. 2023, 30, 2761–2775. [Google Scholar] [CrossRef]
  41. Liu, X.; Zhang, F.; Hou, Z.; Mian, L.; Wang, Z.; Zhang, J.; Tang, J. Self-supervised learning: Generative or contrastive. IEEE Trans. Knowl. Data Eng. 2021, 35, 857–876. [Google Scholar] [CrossRef]
  42. Xie, Z.; Zhang, Z.; Cao, Y.; Lin, Y.; Bao, J.; Yao, Z.; Dai, Q.; Hu, H. Simmim: A simple framework for masked image modeling. In Proceedings of the IEEE/CVF Conference on Computer Vision and Pattern Recognition, New Orleans, LA, USA, 18–24 June 2022; pp. 9653–9663. [Google Scholar]
  43. Hua, T.; Wang, W.; Xue, Z.; Ren, S.; Wang, Y.; Zhao, H. On feature decorrelation in self-supervised learning. In Proceedings of the IEEE/CVF International Conference on Computer Vision, Montreal, BC, Canada, 11–17 October 2021; pp. 9598–9608. [Google Scholar]
  44. Yan, X.; Hu, S.; Mao, Y.; Ye, Y.; Yu, H. Deep multi-view learning methods: A review. Neurocomputing 2021, 448, 106–129. [Google Scholar] [CrossRef]
  45. Yu, Z.; Dong, Z.; Yu, C.; Yang, K.; Fan, Z.; Chen, C.P. A review on multi-view learning. Front. Comput. Sci. 2025, 19, 197334. [Google Scholar] [CrossRef]
  46. Kumar, A.; Yadav, J. A review of feature set partitioning methods for multi-view ensemble learning. Inf. Fusion 2023, 100, 101959. [Google Scholar] [CrossRef]
  47. Li, Z.; Tang, C.; Liu, X.; Zheng, X.; Zhang, W.; Zhu, E. Consensus graph learning for multi-view clustering. IEEE Trans. Multimed. 2021, 24, 2461–2472. [Google Scholar] [CrossRef]
  48. Zhao, P.; Zhao, S.; Zhao, X.; Liu, H.; Ji, X. Partial multi-label learning based on sparse asymmetric label correlations. Knowl.-Based Syst. 2022, 245, 108601. [Google Scholar] [CrossRef]
  49. Liu, D.; Tian, Y.; Zhang, Y.; Gelernter, J.; Wang, X. Heterogeneous data fusion and loss function design for tooth point cloud segmentation. Neural Comput. Appl. 2022, 34, 17371–17380. [Google Scholar] [CrossRef]
  50. Tan, Z.; Li, D.; Wang, S.; Beigi, A.; Jiang, B.; Bhattacharjee, A.; Karami, M.; Li, J.; Cheng, L.; Liu, H. Large language models for data annotation and synthesis: A survey. arXiv 2024, arXiv:2402.13446. [Google Scholar]
  51. Salazar, A.; Vergara, L.; Vidal, E. A proxy learning curve for the Bayes classifier. Pattern Recognit. 2023, 136, 109240. [Google Scholar] [CrossRef]
  52. Salazar, A.; Vergara, L.; Safont, G. Generative Adversarial Networks and Markov Random Fields for oversampling very small training sets. Expert Syst. Appl. 2021, 163, 113819. [Google Scholar] [CrossRef]
  53. Kleinbaum, D.G.; Dietz, K.; Gail, M.; Klein, M.; Klein, M. Logistic Regression; Springer: Berlin/Heidelberg, Germany, 2002. [Google Scholar]
  54. Chen, T.; Guestrin, C. Xgboost: A scalable tree boosting system. In Proceedings of the 22nd ACM Sigkdd International Conference on Knowledge Discovery and Data Mining, San Francisco, CA, USA, 13–17 August 2016; pp. 785–794. [Google Scholar]
  55. Arik, S.Ö.; Pfister, T. Tabnet: Attentive interpretable tabular learning. In Proceedings of the AAAI Conference on Artificial Intelligence, Virtual, 2–9 February 2021; Volume 35, pp. 6679–6687. [Google Scholar]
  56. Huang, X.; Khetan, A.; Cvitkovic, M.; Karnin, Z. Tabtransformer: Tabular data modeling using contextual embeddings. arXiv 2020, arXiv:2012.06678. [Google Scholar]
  57. Yoon, J.; Zhang, Y.; Jordon, J.; Van der Schaar, M. Vime: Extending the success of self-and semi-supervised learning to tabular domain. Adv. Neural Inf. Process. Syst. 2020, 33, 11033–11043. [Google Scholar]
  58. Koroteev, M.V. BERT: A review of applications in natural language processing and understanding. arXiv 2021, arXiv:2103.11943. [Google Scholar]
Figure 1. Illustration of the view-disentangled encoder module. ⊗ means dot and ⊕ means plus.
Applsci 15 06001 g001
Figure 2. Illustration of the view-consistency contrastor module based on masked hop neighborhoods. Starting from the original AIG Netlist, multi-hop neighborhoods centered on node p are constructed within the PM netlist.
Applsci 15 06001 g002
Figure 3. Illustration of the consistency fusion and loss function design module. Two augmented views X and X are encoded and projected into a latent space, followed by soft variable discretization to produce segment-wise variable groups v 1 , , v 4 and v 1 , , v 4 .
Applsci 15 06001 g003
Figure 4. Improved accuracy progression over 100 epochs.
Applsci 15 06001 g004
Figure 5. ROC curves of all compared models under missing labels and incomplete features. The proposed method achieves the highest AUC (0.8981), demonstrating superior discriminative ability compared to baseline methods.
Applsci 15 06001 g005
Figure 6. Confusion matrices of the proposed method across different structured datasets, illustrating class-wise prediction performance.
Applsci 15 06001 g006
Figure 7. Accuracy Progression Across Different Number of Views (K).
Applsci 15 06001 g007
Table 1. Structured data statistics used in the experiments.
Data TypeSourceSample SizeFeature DimensionMax Missing Rate
User Rating BehaviorMovieLens, Book-Crossing170,0005028%
Platform Activity LogsKaggle Web Logs200,0006033%
Synthetic Sparse DataScikit-learn (Synthetic)100,000100–20040%
Financial TransactionsIEEE-CIS, UCI Default180,00012035%
Table 2. Label categories used in the experiments.
Data TypeClass Type (Label Categories)
User Rating BehaviorBinary: Liked (rating 4 ), Not Liked (rating < 4 )
Platform Activity LogsBinary: High-Intent Action, Low-Intent Action
Synthetic Sparse DataMulti-class: 5 synthetic categories
Financial TransactionsBinary: Fraudulent, Non-Fraudulent
Table 3. Experimental results of different models under missing labels and incomplete features.
ModelAccuracyF1-ScoreAUCNormalized MSE
Logistic Regression0.690.650.710.164
XGBoost0.730.690.760.147
TabNet0.750.700.780.130
TabTransformer0.780.730.800.122
VIME0.800.760.840.108
BERT0.830.790.860.089
Proposed Method0.870.830.900.066
Table 4. Experimental results of the proposed method on different structured datasets.
Dataset TypeAccuracyF1-ScoreAUCNormalized MSE
User Rating Behavior (MovieLens, Book-Crossing)0.850.810.880.070
Platform Activity Logs (Kaggle Web Logs)0.860.820.890.068
Synthetic Sparse Data (Scikit-learn)0.880.840.910.063
Financial Transactions (IEEE-CIS, UCI)0.870.830.910.067
Table 5. Performance over five Monte Carlo runs (mean ± std); * indicates statistically significant improvements ( p < 0.05 ) compared with the best-performing baseline (BERT).
ModelAccuracyF1-ScoreAUCNormalized MSE
Logistic Regression0.690 ± 0.0080.650 ± 0.0110.710 ± 0.0090.164 ± 0.012
XGBoost0.730 ± 0.0060.690 ± 0.0070.760 ± 0.0050.147 ± 0.008
TabNet0.750 ± 0.0060.700 ± 0.0070.780 ± 0.0060.130 ± 0.007
TabTransformer0.780 ± 0.0040.730 ± 0.0050.800 ± 0.0030.122 ± 0.006
VIME0.800 ± 0.0070.760 ± 0.0080.840 ± 0.0050.108 ± 0.009
BERT0.830 ± 0.0040.790 ± 0.0060.860 ± 0.0030.089 ± 0.005
Proposed Method0.870 ± 0.003 *0.830 ± 0.004 *0.900 ± 0.003 *0.066 ± 0.004 *
p-value0.0310.0280.0190.015
Note: p-values were calculated using paired t-tests over five Monte Carlo runs, comparing the proposed method against the best baseline. Bold values indicate statistically significant improvements ( p < 0.05 ).
Table 6. Computational cost comparison across models.
ModelTraining Time (s/Epoch)Inference Time (ms/Sample)Peak Memory (MB)
Logistic Regression0.20.0350
XGBoost1.50.05130
TabNet3.20.08280
TabTransformer7.80.19820
BERT16.40.291024
VIME4.20.09310
Proposed Method12.70.25940
Table 7. Impact of multi-view partitioning strategies on model performance.
Partition StrategyAccuracyF1-ScoreAUCNormalized MSE
Random Partition0.740.700.780.120
Information Gain-Based0.810.750.840.101
Cluster-Based Partition0.870.830.900.072
Table 8. Comparison of different contrastive loss settings under missing labels and incomplete features.
Contrastive SettingAccuracyF1-ScoreAUCNormalized MSE
Intra-View Only0.730.700.760.157
Cross-View Only0.790.750.820.113
Intra + Cross View0.870.830.900.072
Table 9. Performance of different view counts (k) under missing labels and incomplete features.
Number of Views (k)AccuracyF1-ScoreAUCNormalized MSE
80.680.630.700.185
20.700.660.720.172
60.770.720.800.120
40.870.830.900.072
Disclaimer/Publisher’s Note: The statements, opinions and data contained in all publications are solely those of the individual author(s) and contributor(s) and not of MDPI and/or the editor(s). MDPI and/or the editor(s) disclaim responsibility for any injury to people or property resulting from any ideas, methods, instructions or products referred to in the content.

