Article

A Novel High-Precision Imaging Radar for Quality Inspection of Building Insulation Layers

1
College of Geo-Exploration Science and Technology, Jilin University, Changchun 130026, China
2
The 22nd Research Institute of the China Electronics Technology Group Corporation, Qingdao 266107, China
*
Author to whom correspondence should be addressed.
Appl. Sci. 2025, 15(11), 5991; https://doi.org/10.3390/app15115991
Submission received: 20 March 2025 / Revised: 3 May 2025 / Accepted: 21 May 2025 / Published: 26 May 2025

Abstract

:

Featured Application

Safety incidents caused by the detachment of insulation layers have been increasing year by year. The main cause of insulation layer detachment is an insufficient amount of mortar used during construction, which results in an inadequate bonding area between the insulation board and the substrate, leading to a decrease in tensile strength and wind pressure resistance. To achieve the quantitative detection of the bonding area of the insulation layer’s bonding mortar, this paper designs and develops a novel high-precision imaging radar specifically for insulation layer quality detection. This radar can penetrate the 120 mm thick insulation layer of the exterior wall to provide accurate imaging of the bonding mortar, with a lateral resolution of 45 mm at a 120 mm depth. Through the high-precision imaging results, the bonding area of the mortar can be quantitatively calculated, thus enabling quantitative non-destructive testing of the insulation layer quality.

Abstract

In recent years, the building insulation layer peeling caused by quality problems has brought about safety hazards to human life. Existing means of non-destructive testing of building insulation layers, including laser scanning, infrared thermal imaging, ultrasonic testing, acoustic emission, ground-penetrating radar, etc., are unable to simultaneously guarantee the detection depth and resolution of the insulation layer defects, not to mention high-precision imaging of the insulation layer structure. A new type of high-precision imaging radar is specifically designed for the quantitative quality inspection of external building insulation layers in this paper. The center frequency of the radar is 8800 MHz and the −10 dB bandwidth is 3100 MHz, which means it can penetrate the insulated panel not less than 48.4 mm thick and catch the reflected wave from the upper surface of the bonding mortar. When the bonding mortar is 120 mm away from the radar, the radar can achieve a lateral resolution of about 45 mm (capable of distinguishing two parties of bonding mortar with a 45 mm gap). Furthermore, an ultra-wideband high-bunching antenna is designed in this paper combining the lens and the sinusoidal antenna, taking into account the advantages of high directivity and ultra-wideband. Finally, the high-precision imaging of data collected from multiple survey lines can visually reveal the distribution of bonded mortar and the bonding area. This helps determine whether the bonding area meets construction standards and provides data support for evaluating the quality of the insulation layer.

1. Introduction

The building insulation layer can effectively reduce the loss or infiltration of heat and keep the indoor temperature stable, which not only saves energy but also provides a more comfortable living environment for humans [1,2,3,4,5]. In addition, the insulation layer can protect the building structure and improve environmental quality [6].
The origins of building insulation layers can be traced back to ancient humans’ preliminary exploration of building comfort and energy conservation. With the development of building technology and materials, insulation technology has gradually evolved and improved [7]. Since the 1960s, with the improvement in energy-saving consciousness, building insulation technology has developed rapidly. Relevant building energy conservation standards have been introduced internationally, promoting the popularization of external building insulation systems. Highly efficient insulation materials are commonly used in the exterior walls, roofs, and windows of modern buildings, and external building insulation systems have become part of the standard design.
The number of accidents in which the insulation system falls off and injures pedestrians and damages property has been increasing year by year, which mainly stems from cracks, hollowing, water seepage, and insufficient adhesion in the external insulation system for exterior building walls. If the quality of the insulation layer is not properly handled, it may lead to poor building energy efficiency, compromise building comfort, and even cause safety hazards. Therefore, the quality inspection of building insulation layers is an important part of ensuring insulation effectiveness and building safety.
The amount of bonding mortar is closely related to the quality of the insulation layer. If the amount of mortar is too low, it will result in an insufficient bonding area between the insulation board and the substrate, which will reduce tensile strength and wind pressure resistance, making it prone to hollowing and detachment. If the mortar layer is too thick, cracks may occur due to increased shrinkage stress, which weakens the bonding effect. The standard commonly used to detect the quality of the insulation layer is that the bonding area measured by the point-frame method should not be less than 40%, and in high wind pressure areas, a full bonding method (100% coverage) should be used. Therefore, how to conduct non-destructive testing and accurately calculate the bonding area of the bonding mortar within the insulation layer is an important research topic in the field of the quantitative detection of insulation layer quality [8].
Existing means of the non-destructive testing of building insulation systems include laser scanning, infrared thermal imaging, ultrasonic testing, acoustic emission, traditional ground-penetrating radar, etc. [9,10,11,12]. Laser scanning technology can acquire 3D point cloud data of the surface of insulation layers, which can then be used to analyze the flatness, thickness variations, and potential delamination risks of the surface. However, it cannot penetrate the insulation layer to detect internal structures [13]. Infrared thermography detects defects such as voids, cracks, or delamination inside the insulation layer by monitoring the surface temperature distribution. However, this method requires appropriate temperature differences, is greatly influenced by environmental factors, and cannot quantitatively assess the internal conditions of the layer [14,15,16,17]. Ultrasonic technology can penetrate the insulation layer to determine if there are voids, cracks, delamination, or other defects inside. However, the hammering used to excite signals during testing can damage the insulation layer, and the identification of defects relies on human experience, which can be affected by subjective factors [18]. Acoustic wave detection technology monitors the acoustic waves generated by the insulation layer during stress or temperature changes by placing sensors on the surface. This technology can monitor the condition of the insulation layer in real time under structural stress, but it requires precise sensor placement for long-term monitoring [19,20,21]. Ground-penetrating radar (GPR) is a common non-destructive testing method, but traditional radar with a center frequency below 3 GHz has low distance resolution and lateral resolution, making it difficult to achieve high-precision imaging of bonding mortar, thus failing to quantitatively assess the bonding area [22,23,24,25,26,27]. A comparative analysis of the advantages and limitations of these detection methods is presented in Table 1. In general, the existing inspection methods are not able to image the structure of the insulation layer, such as bonding mortar, with high precision and thus achieve quantitative detection.
In this paper, a kind of high-precision imaging radar specially used for the quality inspection of the external insulation system of buildings is designed by analyzing the relevant technical parameters of the bonding mortar structure determination radar of the insulation system. The radar can realize high-precision three-dimensional imaging of the bonding mortar structure, which provides data support for subsequent quantitative calculation of the laying density and the area of the bonding mortar structure, which is of great significance to the quantitative detection of the bonding mortar layer.
This paper consists of five parts. Section 2 proposes the functional requirements of the system based on the structure of the insulation layer and application requirements and refines them into radar technical parameters. Section 3 introduces the composition of the radar system and the design scheme of every part. It selects the radar signal frequency based on the calculation formula of radar technical parameters and designs an ultra-wideband high-bunching antenna. Section 4 describes the radar data acquisition and processing method, which realizes the high-precision imaging of insulation layer bonding mortar structures. The radar can perform high-precision imaging of different insulation layer bonding mortar structures. Section 5 gives the conclusion.

2. Radar Inspection Principle and Main Technical Parameters

2.1. Radar Inspection Principle

The principle of radar inspection of the external insulation system of building exterior walls is as shown in Figure 1. The radar transmitting antenna sends ultra-wideband electromagnetic waves in the form of pulses to the wall with an external insulation structure (a thin-plastered external insulation system, for example, which is usually composed of insulated panels and other attached structures), and the electromagnetic waves propagate in the wall and are reflected when they encounter a target body with electrical property contrast, such as a bonding mortar layer, a seepage location, or a steel rein for bonding mortar, and the returned signals are received by the receiving antenna. The received electromagnetic waves are processed and analyzed. The spatial position, structure, electrical properties, and geometric shape of the target inside the wall are inferred based on the signal waveform, two-way propagation time, etc., so as to detect the target inside the wall. The high-precision imaging radar constructs a three-dimensional data volume through multiple survey line measurements to perform high-precision imaging of the insulation layer structure, which will provide data support for the quantitative inspection of the insulation layer structure.

2.2. Main Technical Parameters

Taking the thin-plastered insulation system, which is mature and commonly used in the external insulation system of building exterior walls, as a representative, the main technical parameters of the radar system are determined, which includes detection depth, range resolution, and lateral resolution.
According to the difference in the relative dielectric constant of the wall structure, the thin-plastered insulation system can be divided into three parts, the bonding mortar layer ( ε r = 5~10), the insulated panel ( ε r = 1~3), and the anti-cracking mortar layer ( ε r = 5~10) [28,29,30]. ε r denotes the relative dielectric constant. The thickness of the bonding mortar layer is about 10~15 mm. The main materials of the insulated panels include expanded polystyrene slabs, extruded polystyrene slabs, etc. It has very low loss and the thickness usually does not exceed 100 mm. The thickness of the anti-cracking mortar layer is usually no more than 10 mm. The radar must at least detect the sum of the thin-plastered insulation system, which means the detection depth is greater than or equal to 120 mm [8]. In general, the building insulation layer peeling is caused by the detachment of the bonding mortar layer, which encourages us to pay attention to the structure of the bonding mortar layer. Therefore, the range resolution here is the minimal thickness of the insulated panel (50 mm) to ensure that we can see the reflection wave of the bonding mortar layer.
The attached structure of the thin-plastered insulation system is the bonding mortar layer. Most of the construction methods are spot bonding methods, as shown in Figure 2. The closest edge spacing between two pieces of bonding mortar is usually 50 mm–180 mm. Here, we defined the lateral resolution as less than or equal to 50 mm, which means that the radar can distinguish two pieces of bonding mortar with an edge spacing of 50 mm.

3. Radar System Design

3.1. System Composition

The high-precision imaging radar system consists of a high-precision imaging radar and a remote control terminal, in which the radar includes the host and the antenna. The high-precision imaging radar is connected to the remote control terminal through a network cable, as shown in Figure 3. The host consists of an Ethernet module, an ARM master control module, a radar transceiver module, a power supply, and a distance trigger module. The Ethernet module is used for communication between the remote control terminal and the radar. The ARM master control module is used to receive the range trigger signal from the distance trigger module, control the radar transceiver module to start/stop the acquisition, receive the commands issued by the remote control terminal and execute them, and name and store the acquired data according to the survey line. The radar transceiver module generates transmitting signals to the transmitting antenna and receives echo signals from the receiving antenna. The power supply is used to power the radar. The distance trigger module is used to send a range trigger signal to the ARM master control module to start the acquisition when the radar starts to move along the survey line and record the actual length of the device traveling over the survey line. The host is connected to the antenna by a high-frequency coaxial cable. The antenna consists of transmitting and receiving antennas, which are used to realize the radiation and reception of electromagnetic waves. The remote control terminal equipped with acquisition software is used to set parameters and send start/stop commands by the user before detection and prompts the user to end the acquisition and complete the amount of stored data after detection.

3.2. Radar Signal Selection

The range resolution R is determined by the time–domain pulse width W and the wave velocity in the medium v , with the expression as follows,
R = W v 2 ,
where the time–domain pulse width is related to its frequency bandwidth,
W = 1 B ,
Here, we take the −10 dB bandwidth as B .
The wave velocity v in a medium depends on the velocity c of the electromagnetic wave in a vacuum, being c = 3.0 × 1 0 8 m / s , and the relative dielectric constant ε r of the medium,
v = c ε r ,
We can derive that,
B = c 2 ε r R ,
To achieve the resolution of the insulation board ( ε r = 1~3, R = 50 mm) of the insulation layer, the bandwidth of the radar should not be less than 3000 MHz with ε r = 1.
According to the radar’s detection depth D , range resolution R , and the average relative dielectric constant ε ¯ r of the insulated panel and its surface mortar, the center frequency f c of the radar-transmitted pulse can be selected as follows [31],
75 R ε ¯ r < f c < 1200 ε ¯ r 1 D
The unit of f c is megahertz (MHz). Insulated panels are made of foam covered with a thin layer of mortar and they have an average relative dielectric constant ε ¯ r of 2 to 4.
Take the maximum value on the left side of the equation, which means the denominator should take the minimum value. Take the minimum value on the right side of the equation, which also means ε ¯ r should take the minimum value. Range resolution R is substituted into the calculation with a value of 10 mm and the average relative dielectric constant of 2. Finally, we obtain 5304 M H z < f c < 10 , 000 M H z .
According to the Fresnel principle, assuming that the target buried depth is D , the lateral resolution L can be calculated according to the following formula,
L = λ D 2 = D c 2 ε ¯ r f c
The smaller ε ¯ r is, the bigger f c is. When D = 120 mm, ε ¯ r = 2 , we need f c 5091 M H z to achieve L = 50 m m .
Considering the design cost and the miniaturization of the radar system, the X2 impulse radar transceiver from Novelda is selected for the radar. The flexible transceiver makes X2 the perfect choice for implementing high-accuracy, high-resolution sensing systems with low power consumption [32]. Table 2 shows the TX parameters when choosing the parameter PGSelect = 9, 10.
Based on various technical parameters of the radar and the parameters of the X2 impulse radar transceiver, it is determined that the center frequency is 8800 MHz and the operating bandwidth is 3100 MHz for settings of PGSelect = 10. Output pulse frequency spectra (at PRF = 100 MHz) are given in Figure 4.

3.3. Ultra-Wideband High-Bunching Antenna Design

3.3.1. Antenna Selection

The radar system uses two antenna units for transmission and reception, and the transmitting antenna and the receiving antenna can be of the same form. The transmitting antenna unit is mainly used to efficiently radiate the high-speed pulse output by the power amplifier to produce as little tailing and oscillation as possible. The receiving antenna is used to receive the reflected echo signals, and the receiving antenna is expected to have high directivity. The high-precision imaging radar system transmits high-speed pulse signals, and the signal energy is mainly concentrated in 7.25–10.35 GHz. The requirements of the radar system for antenna units can be summarized as follows: ultra-wideband, narrow beam, and miniaturized antenna. At the same time, the antenna system and the transmitting module can be well-matched. Therefore, antenna design is the focus and difficulty of this radar design.
The ultra-wideband planar sinusoidal antenna is an antenna that combines ultra-wideband technology and sinusoidal antenna design. It has a wide frequency band, good radiation characteristics, and a compact structure, making it suitable for high-frequency and wide-bandwidth communication and measurement applications. However, sinusoidal antennas typically do not have the same directivity as high-gain directional antennas and therefore perform poorly in applications that require high-gain and long-range transmission.
A lens antenna is a kind of antenna that utilizes the lens principle to focus electromagnetic waves, and its main features are better directionality and gain. Compared with conventional antennas, lens antennas have the advantages of high gain, high directivity, smaller side-lobe, low distortion, and excellent beam control.
Therefore, in this paper, an ultra-wideband planar sinusoidal antenna with a reflecting plate and lens is used to design an ultra-wideband high-bunching antenna to ensure that the directionality of the antenna is enhanced while satisfying the ultra-wideband [33].

3.3.2. Ultra-Wideband High-Bunching Antenna

The ultra-wideband high-bunching antenna consists of an ultra-wideband planar sinusoidal antenna radiation oscillator, reflecting plate, feed strip line, and lens, and the input and output interfaces can adopt an SMA coaxial interface, as shown in Figure 5.

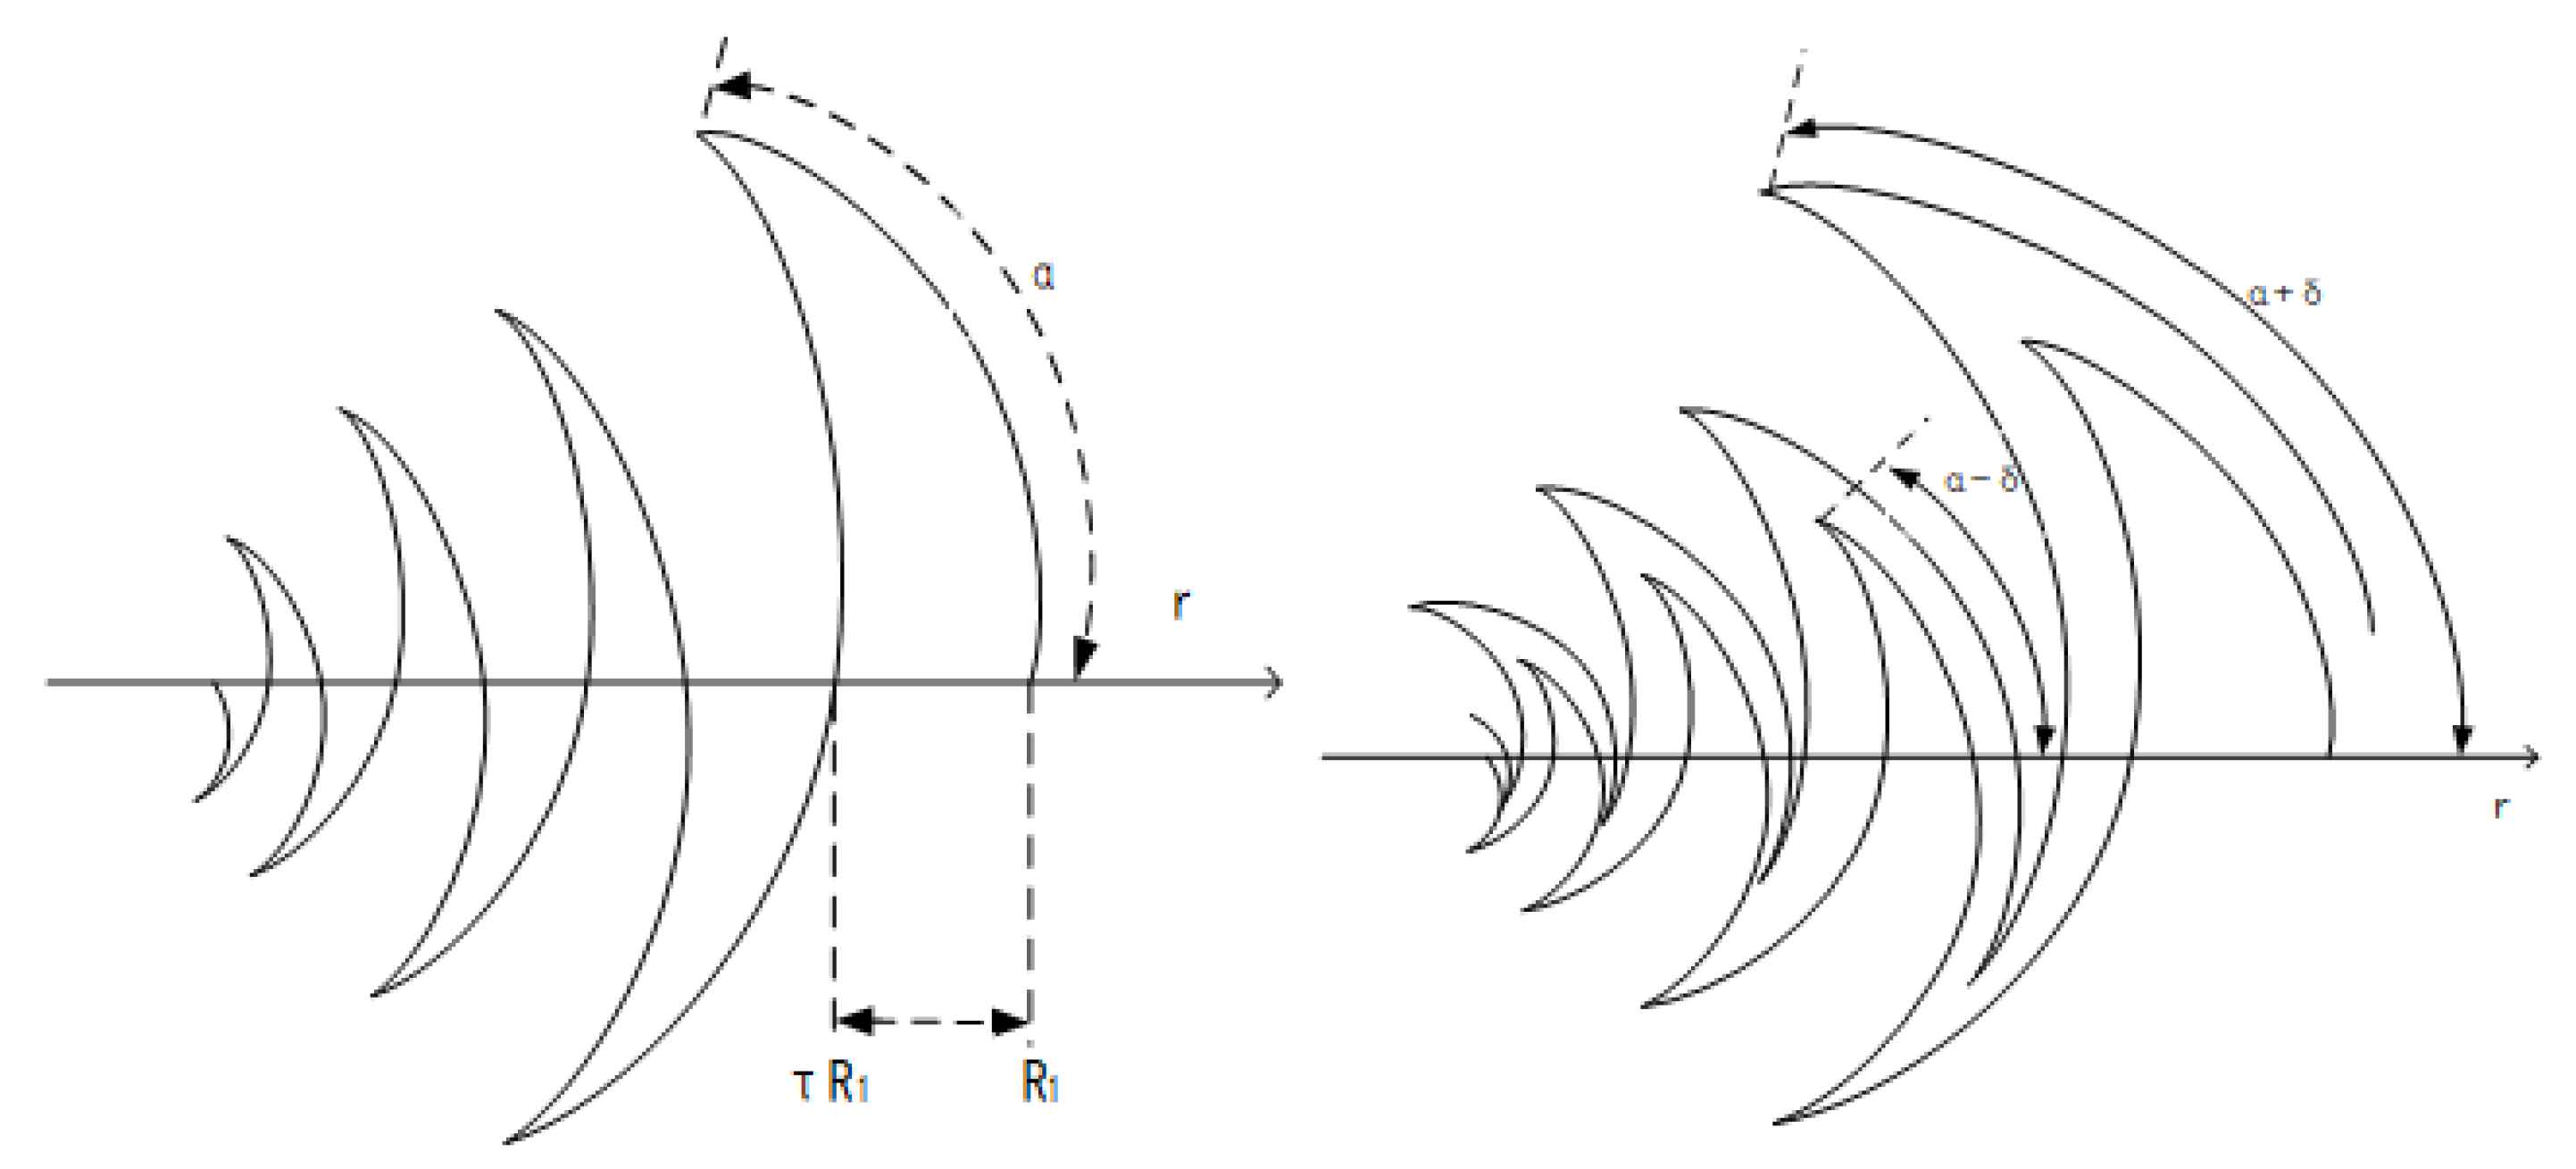
Radiation Oscillator

The radiation oscillator is a sinusoidal antenna similar to the sinusoidal asymptotic log-periodic structure, and this type of antenna can meet the requirements of wideband. In order to make the antenna oscillator and the transceiver match well, a ring micro-strip line structure is adopted. Based on the working center frequency, two balanced feed terminals with a phase difference of 180 degrees are connected to the center of the two oscillator arms.
The basic component of a sinusoidal antenna is the sinusoidal curve, seen in Figure 6, and its antenna structure belongs to the frequency-independent log-periodic or quasi-log-periodic structure, which can be obtained by rotating the basic sinusoidal curve appropriately, and the basic sinusoidal curve is determined by two parameters, the scale factor τ and the angle α , and the sinusoidal curve is formed by a series of unit group segments connected together, and the p-th unit group segment can be defined by the following equation [34],
ϕ ( r ) = ( 1 ) p α p sin π ln r R p ln τ p R p + 1 r R p
where r and α are the polar coordinates of the curve, r represents the distance from the pole, and p is the number of the segments of different unit groups, which increases from the outer unit to the inner unit of the curve. The radial distance of the pth unit is denoted by R p , which can be described by the following formula,
R p = τ p 1 R p 1
The following two curves are obtained by rotating the basic sinusoidal curve around the coordinate origin by an angle δ counterclockwise and clockwise, respectively,
ϕ ( r ) = ( 1 ) p α p sin π ln r R p ln τ p ± δ R p + 1 r R p
The range of the area jointly enclosed by the two curves described by the above equation is called an arm of the sinusoidal antenna. In order to make the antenna performance meet its requirements, the antenna parameters are transformed for modeling simulation and the electrical model is as shown in Figure 7.
The standing wave ratio (SWR) curve of the antenna radiation oscillator obtained from Ansys Student is as shown in Figure 8. It can be seen from the SWR curve that the optimized model can achieve a standing wave ratio of less than 3 in the 6–12 GHz range, which can meet the matching requirements of the system. Here, a standing wave ratio of less than 3 means that the voltage reflection is less than 50%, which is a commonly used practical threshold for evaluating antenna performance.
The plane pattern of the antenna is shown in Figure 9. It can be seen that the pattern of each typical frequency point is similar in shape, and they are all one-sided spherical radiation patterns with good directivity.

Lens Design

The lens has the characteristics of enhancing radiation directivity [35]. This section presents a design procedure for the dielectric lens. The lens geometry is shown below. It is made up of two parts, a hemisphere and a cylinder. R is the radius of the hemisphere lens and is wide enough to cover the antennas. d is the height of the cylinder, and the radius of the cylinder is larger than R to reserve space for securing. D is the distance between the antenna and the dielectric lens. It assumes that propagating rays are illuminated from a single-point source.
Snell’s law of refraction is applied at the point of incidence at the bottom surface of the lens in Figure 10; we obtain s i n η = n s i n γ , where η is the incident angle and n is a refractive index. We hope that the electromagnetic wave emerging from the lens is a plane wave. Based on this, we assume that the transmission angle is α + γ at the point of the exit at the upper surface of the lens, so then the incidence angle is α , n s i n α = s i n α + γ , and θ + α + γ = π 2 .
The following electric path condition can be imposed, which means equal propagation time,
r + n l + s = D + n ( R + d )
where
s = R Rsin θ
l = d + Rsin θ
r = D cos ( η )
The distance D is chosen to be λ c / 2 based on the fact that microwave impedance matching features are repeated every λ c / 2 . The relative dielectric constant of acrylic materials typically ranges from 2.6 to 3.4, varying depending on the manufacturing process and formulation. By investigating and calculating, we finally designed a lens made of acrylic materials with a dielectric constant of 3.0. It has a hemisphere with a radius of 27.5 mm and a cylinder with a height of 8 mm. Figure 11 shows the geometry of the transmitted wave without (blue line) and with (red line) the lens. The lens obviously makes the wave beam more focused.

Reflective Backplane

In practical applications, we only need to use the energy radiated by the antenna toward the medium side. The energy radiated by the antenna facing away from the medium will interfere with the system and cause many adverse effects. In order to make the antenna obtain unidirectional radiation characteristics, we add metal coating on the back of the micro-strip feeder to enhance the radiation directivity so that the antenna has close to zero radiation in the back direction. The commonly used reflective cavity is a flat-bottomed reflective cavity; the depth of the cavity is λ / 4 , where λ is the wavelength corresponding to the center frequency of the antenna and the cavity diameter is the same as the antenna’s outer diameter [36].

Structure Design

To facilitate engineering implementation, the antenna oscillator and the reflecting plate are both implemented using PCBs designed by EDA software version 6.4.25.0, and the two are connected and fixed with long nylon screws, shown in Figure 12. The lens is also secured by four nylon screws that hold the oscillator plate in place, realizing an integrated fixing method that is simple, lightweight, and easy to operate. After finally adding the outer shell, the dimensions are 20 cm in length, 20 cm in width, and 15 cm in height.

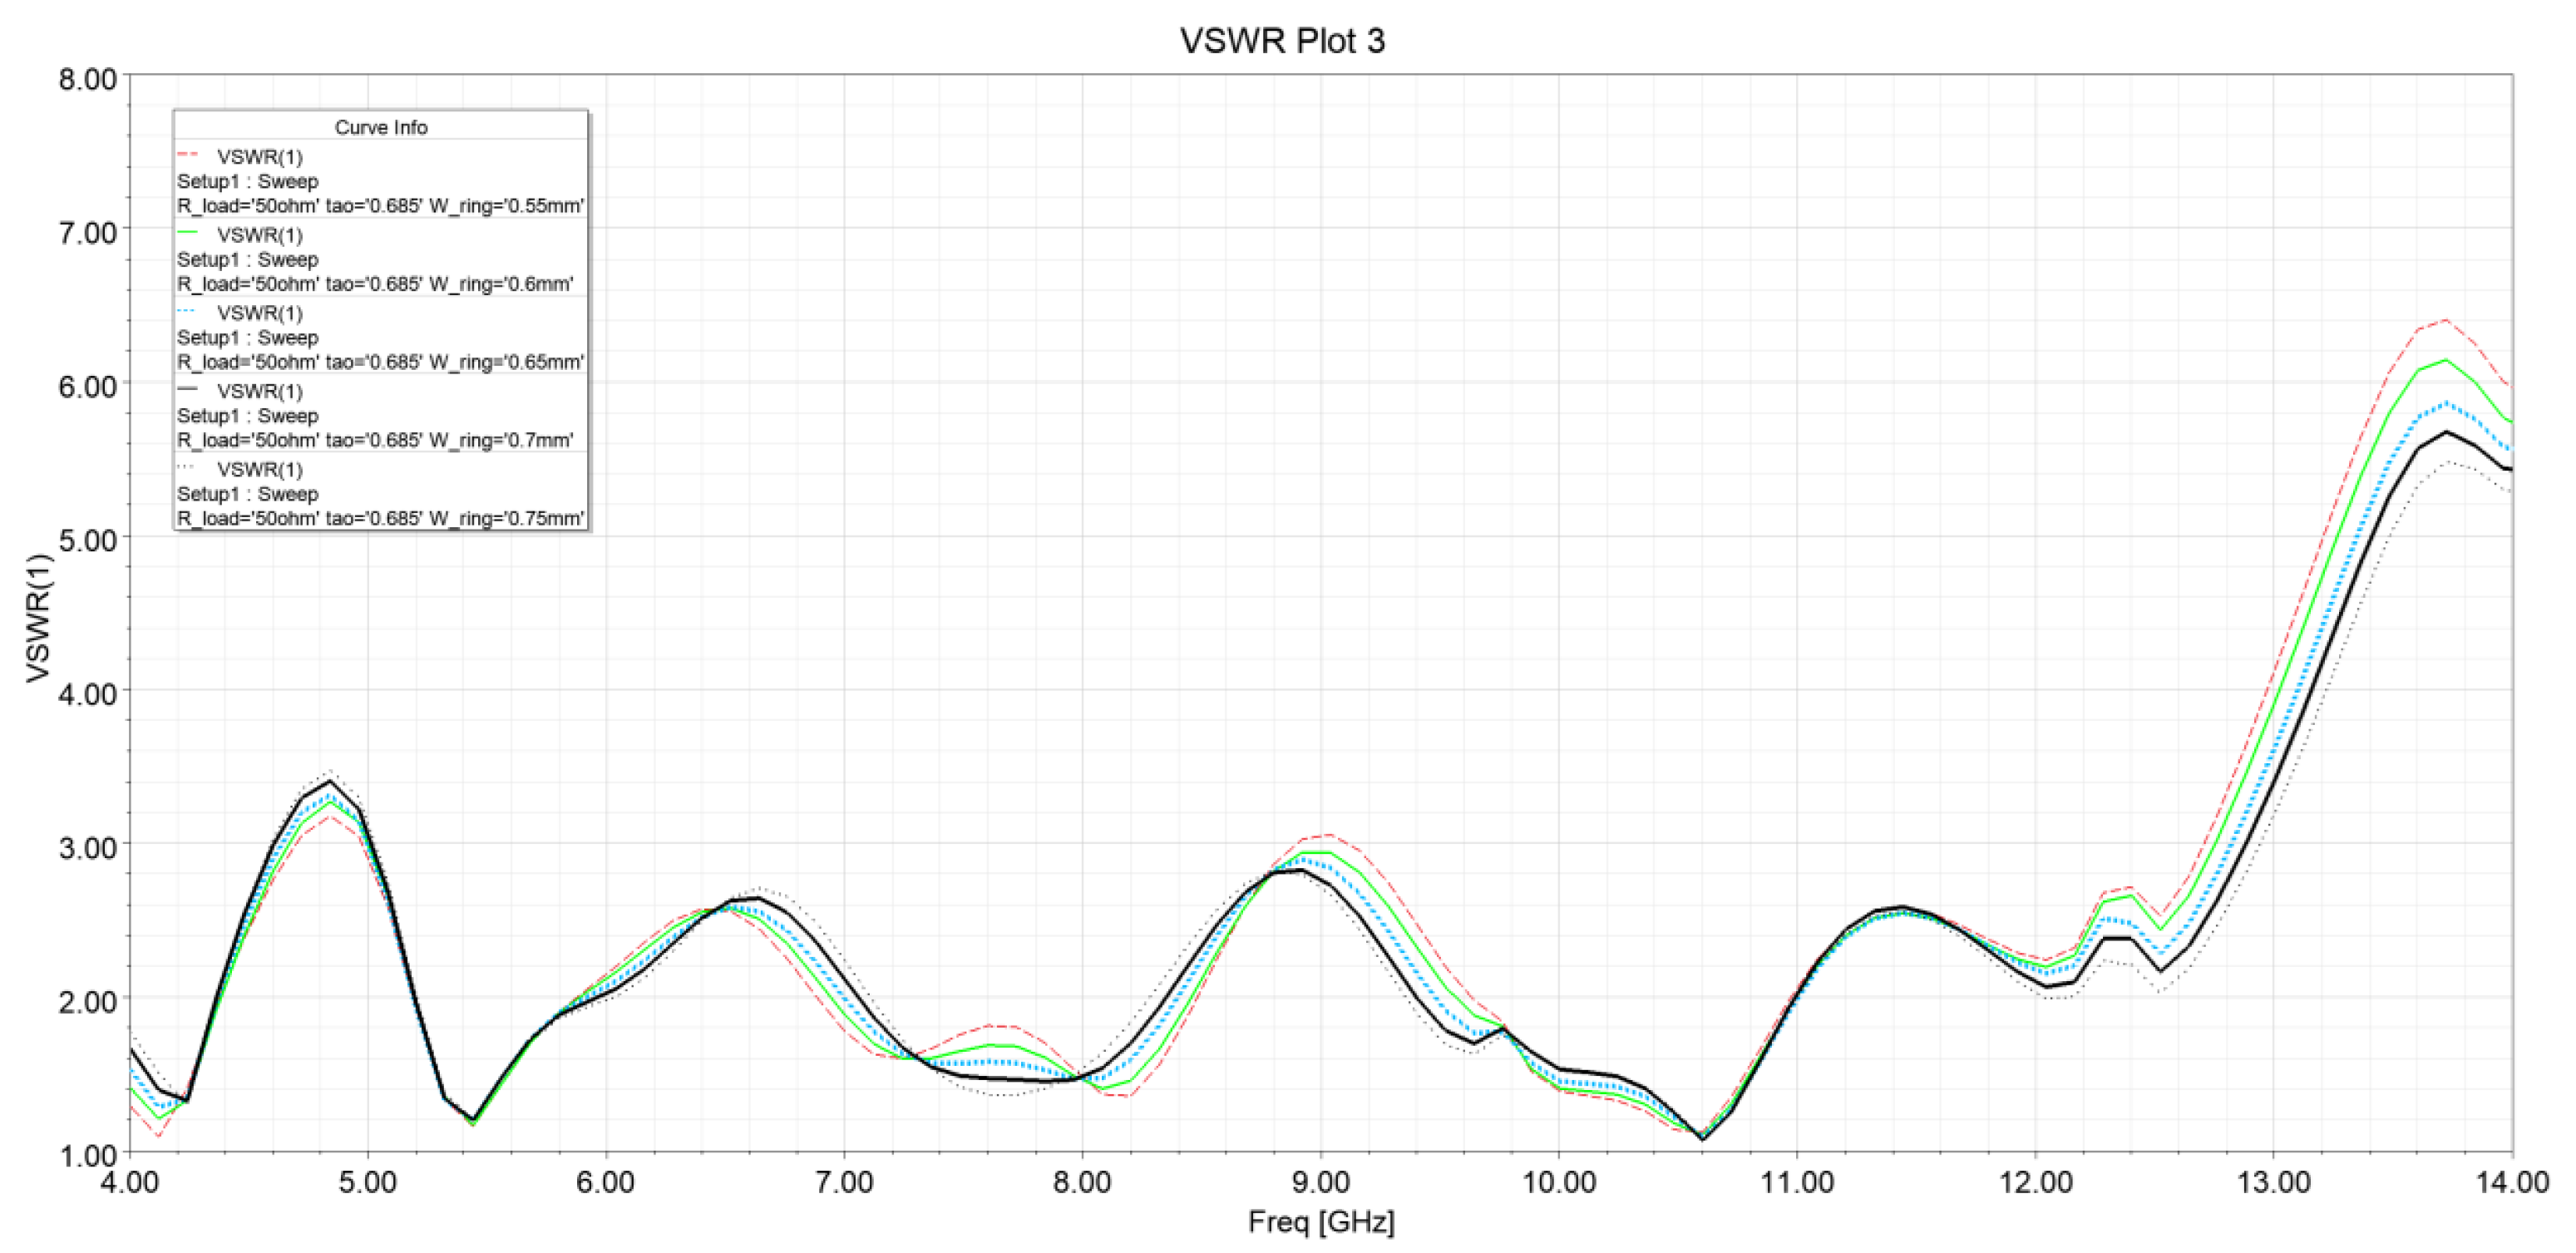
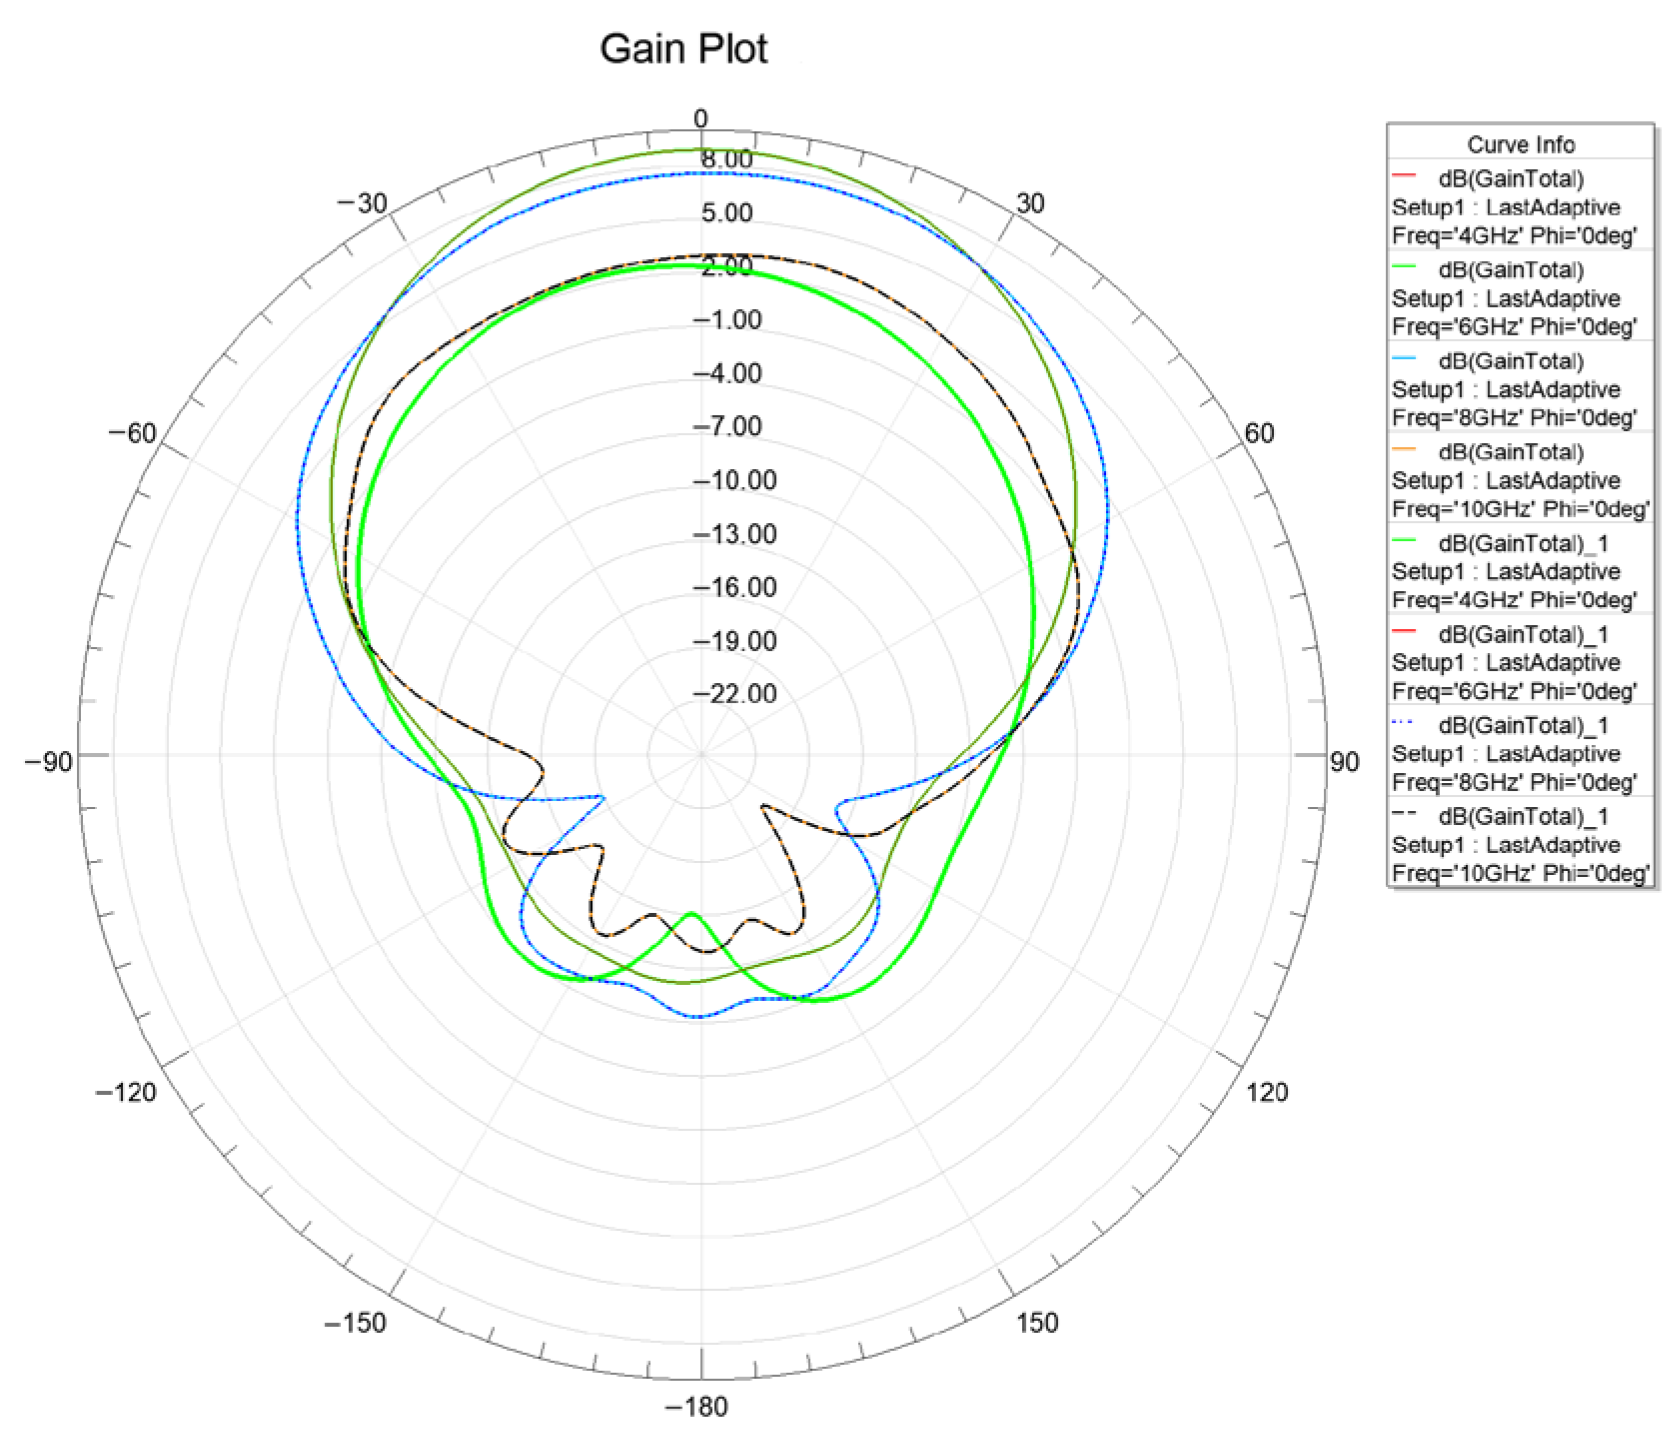
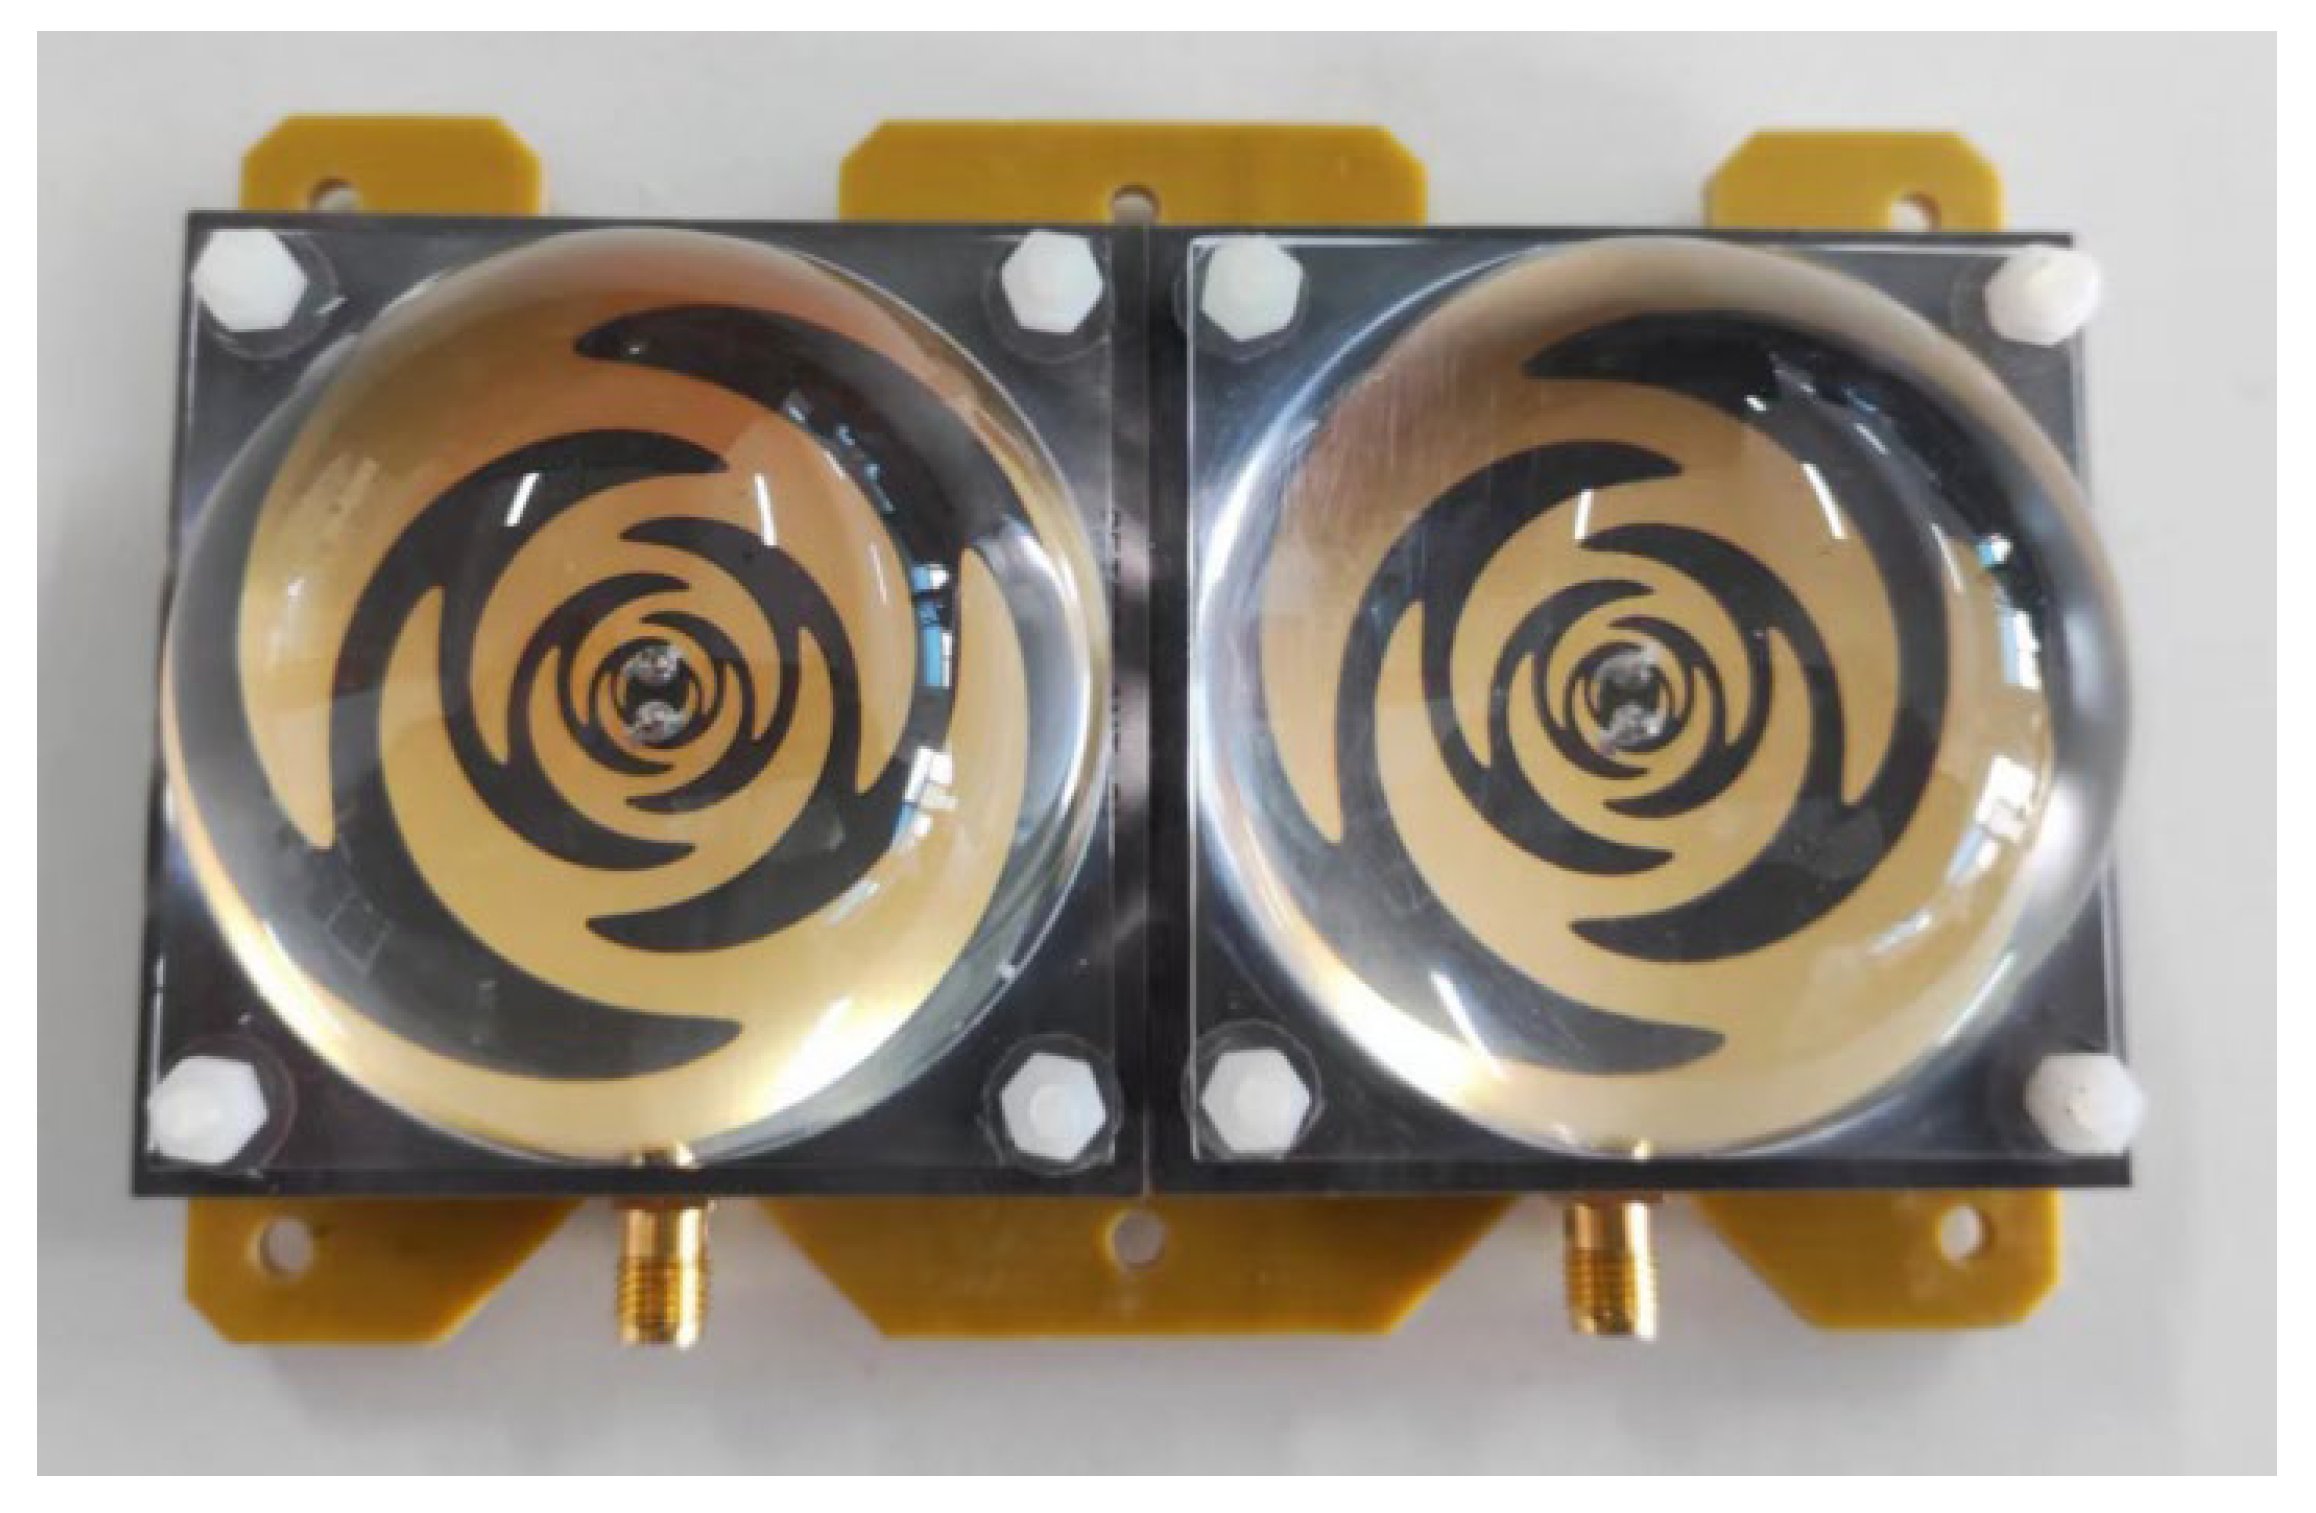
3.3.3. Antenna Sample Test Results

The processed and assembled insulation layer antenna is as shown in Figure 13. The standing wave ratio test curves of the transceiver antenna unit are as shown in Figure 14. It can be seen from the measured curves of the standing wave ratio that the standing wave ratio of the antenna unit in the working frequency band is within 3.0, which meets the design expectations and can meet the use requirements.

4. Test and Imaging Results

In order to verify the performance of the high-precision imaging radar, we constructed a typical insulation layer test site, which covers the insulation layer with different bonding mortar structures, such as spot bonding, spot and frame bonding, strip bonding, full bonding, and the actual bonding mortar structure, as shown in Figure 15.
In this paper, three areas are selected for the test, shown in Figure 16. In combination with actual engineering needs, in order to improve collaborative efficiency, the survey line adopts a round-trip zigzag survey line. The high-precision imaging radar developed by us is used to lay out the survey line outside the insulation layer for measurement. The survey line spacing is 20 mm, and the signal triggering form adopts distance triggering. The measuring wheel rotates on the wall, and the radar collects a piece of data every 20 mm. Therefore, a 20 mm × 20 mm grid is formed in space, and a piece of radar data of 512 sample points is obtained at each grid point.
The data collected from the above three test areas are intercepted, flipped (the direction of the survey line is reversed), distance-normalized, and aligned to form a three-dimensional data volume arranged in accordance with the spatial position of the survey line, on the basis of which the temporal and spatial domain features are extracted and analyzed and from which the data are constructed for media layering. The established approximate spatial model is used to perform high-precision imaging and ultimately to form high-precision imaging of the insulation layer. Data processing explanation process is shown in Figure 17.
As can be seen from Figure 18, the high-precision imaging radar can image bonding mortar structures of different structures. The energy of the cement disk and fully bonded region is balanced, the boundary structure is clear, and the frame structure can basically be presented. There are energy discontinuities, which may be caused by misalignment in the survey line layout or data splicing process.
When applying the above imaging results, we found that due to the scattering effect at the edge of the cement disk, the diameter of the imaged region is slightly larger than the actual diameter of the cement disk. Under the current data processing method, the estimated diameter is approximately 0.008 m larger than the actual value. When the diameter of the cement disk is 0.05 m, the area is approximately 0.0027 m2 larger. This means that when the bonding area of the cement disk is insufficient, missed detections are likely to occur. In the future, we will continue to research the data processing algorithm to suppress edge scattering waves and more accurately calculate the cement disk area.

5. Conclusions

The main reason for the detachment of the insulation layer is an insufficient amount of mortar used during construction. In the insulation layer inspection standard, the proportion of the bonding area of the mortar is used to measure the sticking quality of the insulation layer. Generally, in the dot-frame sticking method, the sticking area should be no less than 40%. Traditional inspection methods either cannot penetrate the external medium to detect the internal structure of the mortar or have insufficient resolution to distinguish the internal structure of the mortar. Generally speaking, traditional methods are unable to provide reliable data for the quantitative evaluation of the sticking area.
To address this issue, a new type of high-precision imaging radar specially used for quality inspection of the external insulation system of buildings is designed by analyzing the relevant technical parameters of the bonded mortar structure determination radar of the insulation system in this paper. The radar can realize high-precision imaging of the bonded mortar structure, which provides data support for the subsequent quantitative calculation of the laying density and the area of the bonded mortar structure, which is of great significance to the quantitative detection of the bonded mortar layer.
The ultra-wideband high-bunching antenna equipped with the radar combines the advantages of the high gain and high directionality of the lens antenna with the ultra-wideband characteristics of the sinusoidal antenna, which effectively reduces the antenna azimuth angle. In conjunction with the high-frequency radar design, the high-precision imaging radar system can penetrate through a 120 mm insulation layer for high-precision imaging. In addition, affected by the edge-diffracted waves, the imaging results of this radar are slightly larger than the actual area of the mortar. To avoid missing the situation of insufficient mortar usage, the imaging algorithm will be continuously improved in the follow-up to increase imaging accuracy.
At present, the radar collects data by laying out multiple survey lines and then stitching the data to achieve high-precision imaging, which can intuitively obtain the distribution of bonding mortar. In the future, a multi-channel imaging radar can be designed to increase the data acquisition rate.
Currently, the radar is carried by a wall-climbing robot, and cables are used to connect the radar system and the remote display control terminal, which greatly limits the radar’s crawling range and speed. In the future, wireless connection can be considered and a more stable carrying platform can be replaced.

Author Contributions

Investigation, methodology, software, validation, visualization, writing—original draft, D.C.; conceptualization, project administration, Z.Z.; formal analysis, supervision, writing—review and editing, W.G.; resources, test designing, data collection, Y.Y.; investigation, validation, writing—review and editing, C.W.; antenna designing and manufacturing, S.L. All authors have read and agreed to the published version of the manuscript.

Funding

This research received no external funding.

Institutional Review Board Statement

Not applicable.

Informed Consent Statement

Not applicable.

Data Availability Statement

The original contributions presented in the study are included in the article, further inquiries can be directed to the corresponding author.

Acknowledgments

The authors wish to thank The 22nd Research Institute of the China Electronics Technology Group Corporation for providing the multi-channel radar system and raw data.

Conflicts of Interest

Authors Dandan Cheng, Wei Ge, Yuemeng Yin, Chenghao Wang and Shaolong Li were employed by the company The 22nd Research Institute of the China Electronics Technology Group Corporation. The remaining author declares that the research was conducted in the absence of any commercial or financial relationships that could be construed as a potential conflict of interest.

Abbreviations

The following abbreviations are used in this manuscript:
ARMAdvanced RISC Machine
SMASubMiniature version A
SWRStanding wave ratio
VSWRVoltage standing wave ratio
PCBPrinted Circuit Board

References

  1. Kośny, J.; Yarbrough, D.W. Thermal Efficiency of Insulation in Building Structures—The Impact of Thermal Bridging. Thermal Insulation and Radiation Control Technologies for Buildings; Springer International Publishing: Cham, Germany, 2022; pp. 443–486. [Google Scholar]
  2. Chai, J.; Fan, J. Advanced thermal regulating materials and systems for energy saving and thermal comfort in buildings. Mater. Today Energy 2022, 24, 100925. [Google Scholar] [CrossRef]
  3. Okokpujie, I.P.; Essien, V.; Ikumapayi, O.M.; Nnochiri, E.S.; Okokpujie, K.; Akinlabi, E.T. An overview of thermal insulation material for sustainable engineering building application. Int. J. Des. Nat. Ecodynamics 2022, 17, 831–841. [Google Scholar] [CrossRef]
  4. Schiavoni, S.; Bianchi, F.; Asdrubali, F. Insulation materials for the building sector: A review and comparative analysis. Renew. Sustain. Energy Rev. 2016, 62, 988–1011. [Google Scholar] [CrossRef]
  5. Zach, J.; Novák, V.; Peterková, J.; Bubeník, J.; Košir, M.; Božiček, D.; Krejza, Z. The Use of Advanced Environmentally Friendly Systems in the Insulation and Reconstruction of Buildings. Buildings 2023, 13, 404. [Google Scholar] [CrossRef]
  6. Fan, C. Research on Material Selection and Construction Technology Application of Exterior Insulation System. Ph.D. Thesis, Shenyang Jianzhu University, Shenyang, China, 2015. [Google Scholar]
  7. Wang, D.T. Analysis on Quality Issues for External Thermal Insulation System on Outer Walls. Adv. Mater. Res. 2012, 430–432, 1628–1631. [Google Scholar] [CrossRef]
  8. JGJ 144-2019; Technical Standard for External Wall Insulation Engineering. The Ministry of Housing and Urban-Rural Development of the People’s Republic of China: Beijing, China, 2019.
  9. Sadowski, Ł. Non-Destructive Testing for Building Evaluation. Buildings 2022, 12, 1030. [Google Scholar] [CrossRef]
  10. Liu, X.; Zhang, H.; Wang, X. Research on the detection and control of external insulation materials for building exterior walls. Build. Technol. 2015, 42, 36–40. [Google Scholar]
  11. Li, Z.; Wang, M.; Xu, Y. Research on Detection Technology and Application of Building Exterior Wall Insulation Layer. Archit. Eng. Technol. Des. 2017, 6, 87–91. [Google Scholar]
  12. Song, F.; Luo, Y.; Wang, T. Research Progress of Nondestructive Testing Technology for Insulation Layer. Mater. Test. 2018, 34, 11–15. [Google Scholar]
  13. Zhang, D.; Wang, Z.; Jiang, L. Application of 3D laser scanning technology in defect detection of external wall thermal insulation system. Constr. Technol. 2020, 49, 4. [Google Scholar]
  14. Chen, X.; Wang, Z.; Xu, Q.; Zhang, D.; Chen, L. Application Research of Infrared Thermal Imaging Technology in Safety Detection of External Wall and External Insulation System. Build. Struct. 2023, 53, 105–112. [Google Scholar]
  15. Jiao, C. Research on the detection and identification of defects in the external insulation layer of building exterior walls based on infrared images. Ph.D. Thesis, Xi’an University of Architecture and Technology, Xi’an, China, 2022. [Google Scholar]
  16. Gao, C.; Zhang, T. Application of Infrared Thermography for Detecting Delamination in Thermal Insulation Layers. In Proceedings of the International Conference on Civil Engineering and Construction, Lyon, France, 21–23 September 2017; pp. 98–103. [Google Scholar]
  17. Li, X.; Li, Y. Application of Infrared Thermography in Evaluating the Quality of Thermal Insulation Layers in Buildings. Energy Build. 2020, 208, 109671. [Google Scholar]
  18. Yang, S.; Li, Z. Detection and Evaluation of Thermal Insulation Layer Defects in Buildings Using Ultrasonic and Infrared Imaging. Constr. Build. Mater. 2019, 224, 937–947. [Google Scholar]
  19. Wang, L.; Chen, Z. Non-Destructive Evaluation of Insulation Layer in Buildings Using Acoustic Emission and Thermograph. In Proceedings of the International Symposium on Non-Destructive Testing in Civil Engineering, Zurich, Switzerland, 16–18 August 2022; pp. 244–251. [Google Scholar]
  20. Wang, Z.; Zhang, D.; Chen, X.; Jiang, L.; Zheng, S. Experimental Research on Defect Detection of EPS Board Thin Plastering External Wall External Insulation System Based on Acoustics. Constr. Technol. 2020, 49, 20–23. [Google Scholar]
  21. Wang, Z.; Zhang, D.; Jiang, L.; Chen, X.; Li, Y.; Zhang, Y. Experimental Research on Defect Detection of Inorganic Insulation Mortar External Wall and External Insulation System Based on Acoustics. Constr. Technol. 2020, 49, 5–8. [Google Scholar]
  22. Zhang, D. Application of Ground Penetrating Radar Technology in Nondestructive Testing of Inorganic Thermal Insulation Mortar Exterior Wall and Exterior Thermal Insulation System. Constr. Technol. 2020, 49, 16–19. [Google Scholar]
  23. Neal, A. Ground-penetrating radar and its use in sedimentology: Principles, applications and recent advances. Earth-Sci. Rev. 2004, 66, 261–330. [Google Scholar] [CrossRef]
  24. Loizos, A.; Vasilenko, G. Application of ground-penetrating radar for the investigation of building materials and structures. J. Appl. Geophys. 2014, 107, 50–56. [Google Scholar]
  25. Tosti, F.; Luciani, M. Assessment of the quality of thermal insulation materials in existing buildings through ground-penetrating radar. J. Build. Phys. 2016, 39, 242–259. [Google Scholar]
  26. Cesare, S.; Pepe, M. Application of ground-penetrating radar for the evaluation of building insulation materials and structures. Constr. Build. Mater. 2013, 38, 556–562. [Google Scholar]
  27. He, Z.; Zhang, L. Application of Ground Penetrating Radar for Non-destructive Testing of Insulating Materials in Civil Engineering. Int. J. Nondestruct. Test. Ultrason. Test. 2018, 3, 22–30. [Google Scholar]
  28. Muqaibel, A.; Safaai-Jazi, A.; Bayram, A.; Attiya, A.; Riad, S. Ultrawideband through-the-wall propagation. IEEE Proc. Microw. Antennas Propag. 2005, 152, 581–588. [Google Scholar] [CrossRef]
  29. Zhekov, S.S.; Franek, O.; Pedersen, G.F. Dielectric Properties of Common Building Materials for Ultrawideband Propagation Studies. IEEE Antennas Propag. Mag. 2020, 62, 72–81. [Google Scholar] [CrossRef]
  30. Yasmeen, K.; Ram, S.S. Estimation of Electrical Characteristics of Inhomogeneous Walls Using Generative Adversarial Networks. IEEE J. Sel. Top. Appl. Earth Obs. Remote Sens. 2023, 16, 15. [Google Scholar] [CrossRef]
  31. Zeng, Z.; Liu, S.; Wang, Z.; Xue, J. Principle and Application of Ground Penetrating Radar; Science Press: Beijing, China, 2006; pp. 91–92. [Google Scholar]
  32. Novelda. X2 Impulse Radar Transceiver; Novelda: Trondheim, Norway, 2015. [Google Scholar]
  33. Sammeta, R.; Filipović, D.S. A low-profile sinuous antenna. 2014 IEEE Antennas and Propagation Society International Symposium (APSURSI), Memphis, TN, USA, 6–12 July 2014; pp. 1333–1334. [Google Scholar]
  34. Crocker, D.A.; Scott, W.R. Sinuous Antenna Design for UWB Radar. 2019 IEEE International Symposium on Antennas and Propagation and USNC-URSI Radio Science Meeting, Atlanta, GA, USA,, 7–12 July 2019. [Google Scholar] [CrossRef]
  35. Seo, B.; Yoon, I.; Oh, J. Practical Design Considerations for Compact Array-Fed Huygens’ Dielectric Lens Antennas. Sensors 2019, 19, 538. [Google Scholar] [CrossRef]
  36. Yan, Y. Research and Design of Planar Microstrip Antenna with Back Cavity. Ph.D. Thesis, Nanjing University, Nanjing, China, 2011. [Google Scholar]
Figure 1. Radar inspection principle of external building insulation system.
Applsci 15 05991 g001
Figure 2. Analysis of the main technical parameters of the radar system.
Applsci 15 05991 g002
Figure 3. Composition of the radar system.
Applsci 15 05991 g003
Figure 4. Output pulse frequency spectra.
Applsci 15 05991 g004
Figure 5. Ultra-wideband high-bunching antenna structure.
Applsci 15 05991 g005
Figure 6. Schematic diagram of a sinusoidal antenna [34]. The basic sinusoidal curve is determined by two parameters, the scale factor τ and the angle α , and two curves on the right side are obtained by rotating the basic sinusoidal curve at the left side around the coordinate origin by an angle δ .
Applsci 15 05991 g006
Figure 7. Simulation model of an antenna oscillator. Two balanced feed terminals with a phase difference of 180 degrees are connected to the center of the two oscillator arms.
Applsci 15 05991 g007
Figure 8. VSWR curve. The standing wave ratio is less than 3 in the 6–12 GHz range, which means the voltage reflection is less than 50%, which ensures high antenna transmission efficiency.
Applsci 15 05991 g008
Figure 9. Plane pattern of each typical frequency point, 4 GHz, 6 GHz, 8 GHz, and 10 GHz, and they are all one-sided spherical radiation patterns with good directivity.
Applsci 15 05991 g009
Figure 10. Geometry of the dielectric lens.
Applsci 15 05991 g010
Figure 11. The geometry of the transmitted wave without (blue parts) and with (red parts) the designed lens.
Applsci 15 05991 g011
Figure 12. Structure of the radar.
Applsci 15 05991 g012
Figure 13. Picture of insulation layer test antenna.
Applsci 15 05991 g013
Figure 14. Measured standing wave ratio curve of the antennas by E5071C ENA Series Network A nalyzer of KeySight. (a) Transmitting antenna. (b) Receiving antenna.The trianglular markers indicate the frequency points with relatively high standing wave ratios and they are all below 3.
Applsci 15 05991 g014
Figure 15. Design drawing of test site mortar distribution and the actual test scene.
Applsci 15 05991 g015
Figure 16. Survey lines, adopting a round-trip zigzag survey line.
Applsci 15 05991 g016
Figure 17. Data processing explanation process.
Applsci 15 05991 g017
Figure 18. The high-precision imaging results, which show the shape and size of the bonding mortar in different structures. (a) The designed drawing of the first survey area. (b) The designed drawing of the second survey area. (c) The designed drawing of the third survey area. (d) The radar detection results corresponding to (a). (e) The radar detection results corresponding to (b). (f) The radar detection results corresponding to (c).
Applsci 15 05991 g018
Table 1. The advantages and limitations of these detection methods.
Existing Nondestructive Testing (NDT) MethodsAdvantagesLimitations
Optical Testing
-Laser Scanning
-Infrared Thermographic Testing
Capable of airborne operation and enables quantitative detection of surface defects (e.g., cracks, deformations) in insulation layers with high efficiency and accuracySurface-level detection only, limited to severe surface defects (e.g., cracks), cannot penetrate insulation to assess internal voids, water infiltration, bonding mortar distribution, and area coverage
Acoustic Testing
-Ultrasonic Testing
-Tap Testing
Low-cost solution and requires minimal technical expertise for operators, reducing training barriersSubjective analysis, defect localization relies heavily on empirical interpretation, introducing operator bias
Conventional High-Frequency Ground Penetrating Radar (GPR) TestingDeep detection capability, identifies subsurface features such as reinforcing bars (rebar) and protective layer thickness beneath the insulation.Higher operational expenses, resolution insufficient to distinguish 1–2 cm thick bonded mortar layers
Table 2. The parameters of the X2 impulse radar transceiver.
ParameterTest LevelMin.Typ.Max.Unit
Output port match, S22
6.0–10.2 GHzIII (vn-tr) −3.8 dB
Output pulse center frequency
PGSelect = 9III (vn-ti) 8.2 GHz
PGSelect = 10III (vn-ti) 8.8 GHz
Bandwidth, −10 dB
PGSelect = 9III (vn-ti)2.352.653.20GHz
PGSelect = 10III (vn-ti)2.653.104.40GHz
Disclaimer/Publisher’s Note: The statements, opinions and data contained in all publications are solely those of the individual author(s) and contributor(s) and not of MDPI and/or the editor(s). MDPI and/or the editor(s) disclaim responsibility for any injury to people or property resulting from any ideas, methods, instructions or products referred to in the content.

