Article

Numerical Simulation on Dynamic Response of Drilling Parameters in Loaded Rock Mass

1
College of Energy and Mining Engineering, Shandong University of Science and Technology, Qingdao 266590, China
2
Graduate School of Engineering, Nagasaki University, Nagasaki 852-8521, Japan
3
School of Mine Safety, North China Institute of Science & Technology, Langfang 065201, China
4
Shandong Energy Group Co., Ltd., Jinan 250014, China
5
Guotun Coal Mine, Shandong Energy Group Luxi Mining Co., Ltd., Heze 274700, China
*
Author to whom correspondence should be addressed.
Appl. Sci. 2025, 15(11), 5977; https://doi.org/10.3390/app15115977
Submission received: 27 March 2025 / Revised: 24 April 2025 / Accepted: 24 April 2025 / Published: 26 May 2025

Abstract

:
The characterization of the mechanical parameters of rock mass is a basic problem in the field of rock mechanics, and it is also an important basis for surrounding rock classification, stability analysis, and support design in underground engineering. Based on the engineering background of pressure relief drilling in Guotun Coal Mine, this paper carries out an engineering test while drilling. The numerical simulation method is used to explore the influence of different lithology rocks, different control conditions, and different confining pressure conditions on the parameters while drilling and to study the variation in drilling time, drilling depth, drilling rate, and revolution speed. The results show that under the same control conditions, the drilling rate of coal, mudstone, sandy mudstone, and siltstone are in the order of coal > mudstone > sandy mudstone > siltstone. For similar rock specimens, when the thrust is fixed, the drilling rate increases with the increase in the revolution speed, and when the revolution speed is fixed, the drilling rate increases with the increase in the thrust. When the rock specimen is in different confining pressure states, the drilling rate decreases with the increase in confining pressure, and the torque increases with the increase in confining pressure. This study provides a scientific basis for the realization of in situ rapid and effective measurement technology for the rock mechanical parameters of coal and rock mass, which is helpful for improving the measurement accuracy and efficiency and promoting the safe and efficient mining of coal mines.

1. Introduction

The geomechanical characteristics of rock mass structures and their mechanical parameters are the basic basis for the classification of surrounding rock, stability analyses, and the support design in underground engineering. The rapid and effective prediction of the geomechanical characteristics of rock mass is the premise to ensure the safety and efficient construction and maintenance of underground engineering [1,2].
The measurement-while-drilling technology is a technology that uses the drilling equipment, while drilling, to control, monitor, and analyze the drilling parameters such as the drilling rate, thrust, torque, and revolution speed in the drilling process [3,4,5,6,7]. Some scholars [8,9,10,11,12,13] have carried out systematic research on the response law of rock mechanics parameters and drilling parameters through theoretical analysis and laboratory tests and put forward a variety of prediction models for engineering rock mass quality evaluation. It is worth noting that most of the current prediction models based on drilling parameters are semi-empirical models, which have problems of reliability and unclear applicable conditions. Laboratory tests also face problems such as being time-consuming, incurring high costs, and producing results that are easily affected by the non-uniform characteristics of rock samples. In contrast, the numerical simulation software has obvious advantages. It can quickly set different parameter combinations and can complete a large number of simulation calculations in a short time, so as to quickly obtain the results under different conditions. In addition, by constructing a detailed model, the numerical simulation software can also comprehensively analyze the changes in various drilling parameters related to the drill bit during the drilling process, providing more abundant and detailed data support for the research work [14,15,16,17,18].
In terms of numerical simulation, Che [19] et al. used ABAQUS 2014 software to simulate the rock fragmentation process of PDC cutters and compared the simulation results with the experimental data. The results show that the simulation results are in good agreement with the experimental results. Wang et al. [20] used numerical simulation methods to conduct in-depth research on the rock breaking process of the drill under static and dynamic loads. The results show that the rock breaking efficiency under dynamic loads is significantly higher than that under static loads. Zhang Guang Hui [21] based on the finite element analysis software LS-DYNA, the rock breaking simulation analysis model of a PDC bit is established, and the interaction law between the drilling rate, bit speed, drilling pressure, and torque is obtained. Fu Mengxiong et al. [22] studied the relationship between the vibration characteristics of the drill pipe and the rock strength during the drilling process for the roof anchoring hole in the coal roadway by the numerical simulation method and concluded that the drilling vibration characteristics are important information for identifying the roof strata. Liu Shaowei et al. [16,23] used the numerical simulation method to analyze the drilling characteristics of roof rock in a coal roadway and found that the drilling process was categorized as discontinuous ‘jumping’. They determined the relationship between the drilling rate and the resistance of different rock types and found that the average drilling rate can be used as a better index to measure rock types. In summary, these research results provide an important basis for the development of technology for measurement while drilling in coal roadways from different angles. However, in the study of the response law of drilling parameters and rock mass mechanical characteristics, the existing research is mostly carried out under relatively single or simplified working conditions. In the process of an actual coal mine drilling operation, drilling is not only faced with complex and changeable geological conditions but also with various factors such as different drilling process combinations, which are intertwined with each other. At present, the response law between drilling parameters and rock mass mechanical characteristics under the coupling of these multiple factors needs to be further studied. Therefore, the response law between the drilling parameters and the mechanical characteristics of rock mass based on the engineering site still needs to be further explored.
This paper takes the pressure relief drilling in Guotun Coal Mine as the engineering background and carries out a field test of the rock mechanics parameters while drilling. ABAQUS2023 software was used to carry out mesoscopic numerical simulation tests of rock identification while drilling under different drilling parameters and stress states, to explore the influence of different types of rocks and different stress states on drilling parameters, to clarify the variation information regarding the drilling parameters while drilling in rock surrounding a coal roadway under different control conditions and to reveal the dynamic response law of drilling parameters and rock mass mechanical characteristics. The research results provide a scientific basis for the in situ measurement technology of rock mechanics parameters for coal and rock mass and have important academic value for promoting the safe and efficient development of coal mining.

2. In Situ Drilling Test in Underground Coal Mine

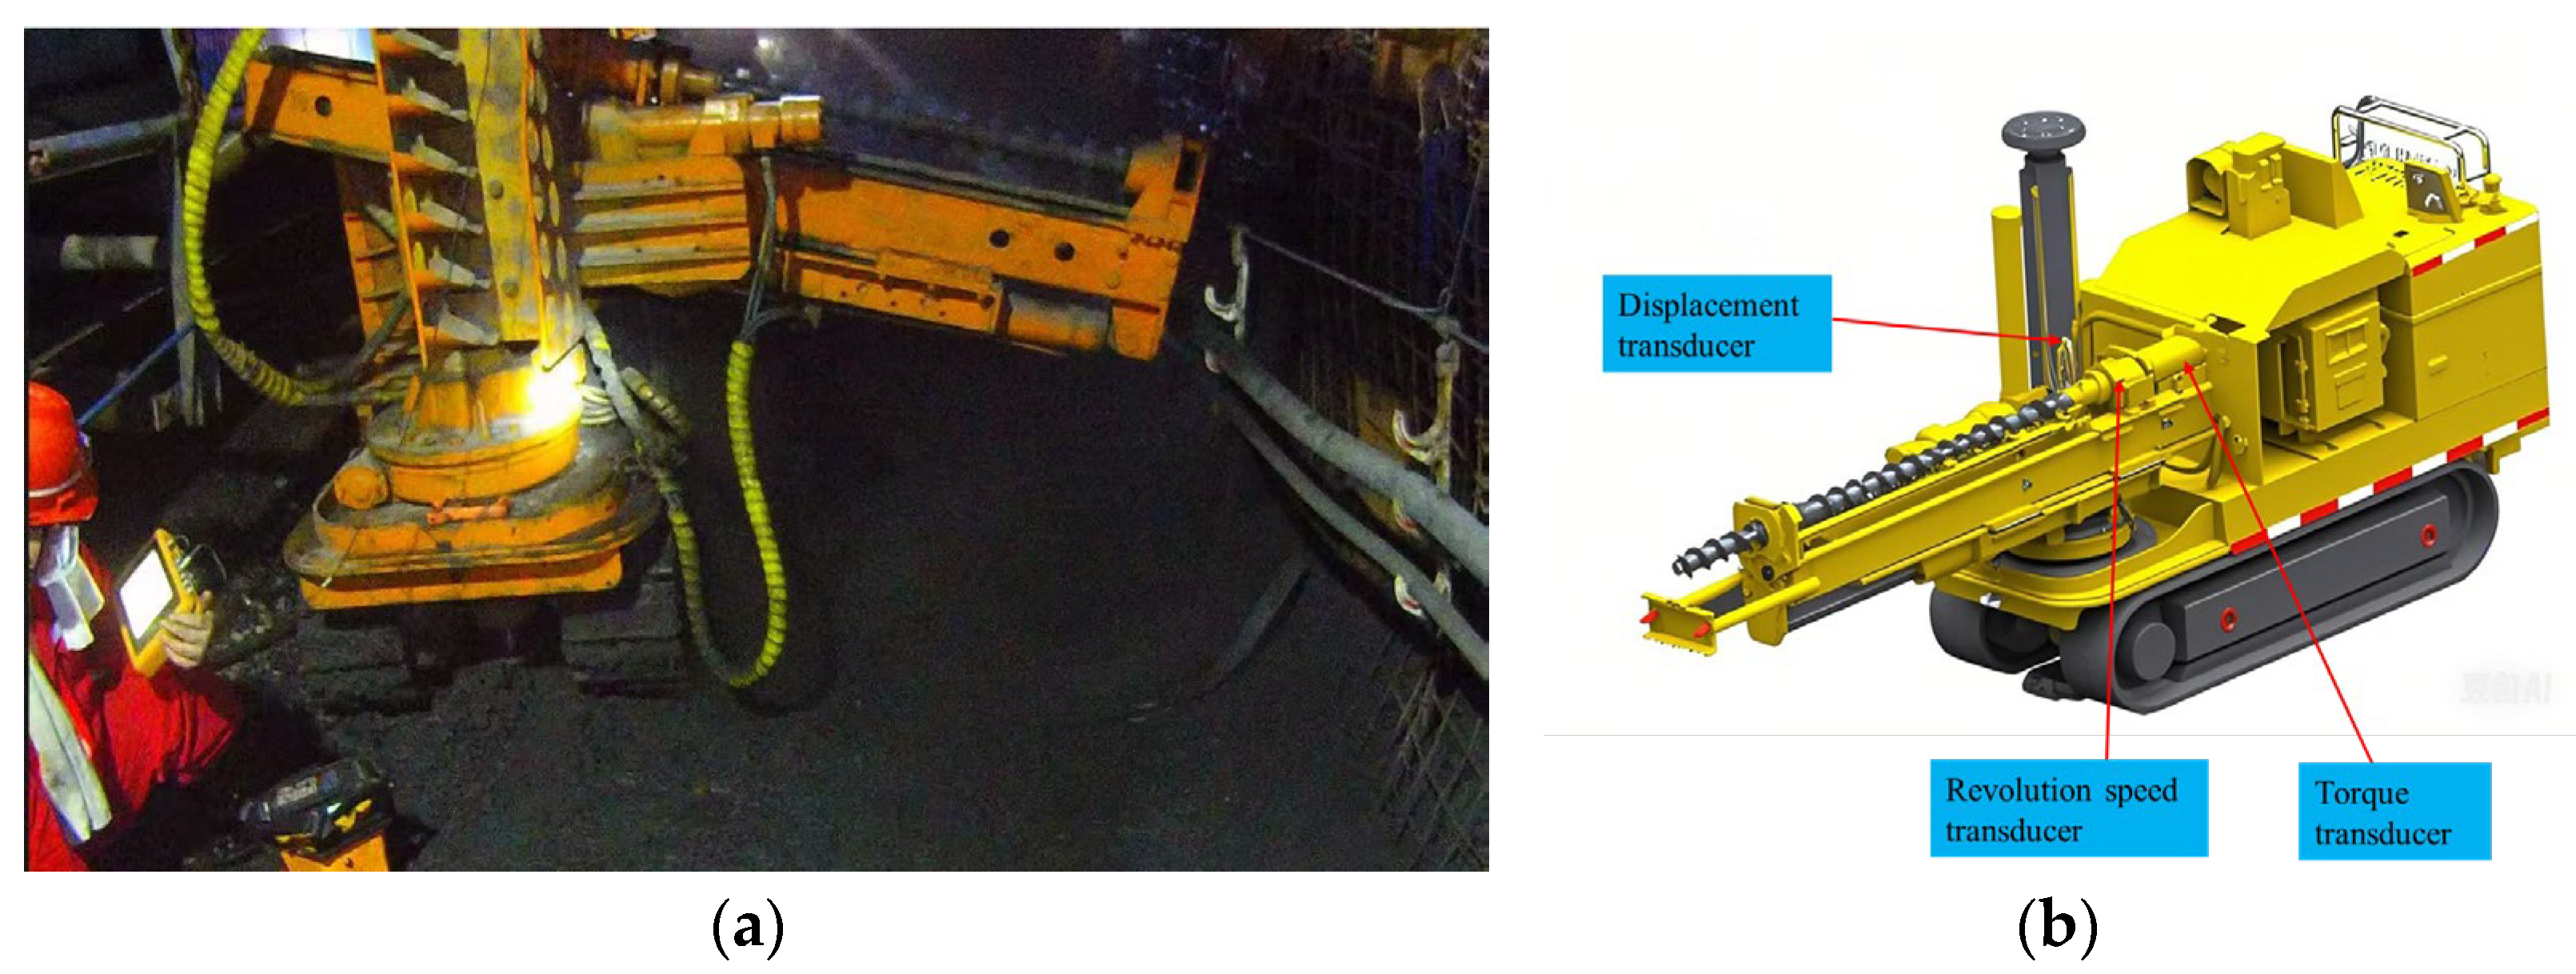
2.1. Downhole Test Equipment and Methods

In order to deeply explore the changes in various parameters in the process of underground drilling and to obtain accurate data while drilling, an in situ test of measurement while drilling was carried out in the 2309 track crossheading of the Guotun Coal Mine in the Shandong mining area. The test adopts the CMS1-1200/45 (Z) (from Shandong Tianhe Technology Co., Ltd., Zoucheng City, Shandong Province, China) intelligent anti-impact drilling vehicle system. The equipment adopts the integrated structure design of a pumping station and a drilling rig and is equipped with an automatic drill pipe loading and unloading mechanism. The diameter of the drilling hole is 150 mm, and the maximum single hole continuous drilling operation can reach 25 m, which meets the needs of large diameter pressure relief drilling in the construction of the track roadway side of the working face in this test. The diameter of the rock bolt hole is 28 mm, and the depth of the hole is 2.2 m. In addition, the drilling rig is also equipped with a GPD60 (A) torque sensor (from Zhengzhou Coal Machinery Hydraulic and Electrical Control Co., Ltd. in Zhengzhou, China), KHJ16 mine speed sensor (from China’s Jiangsu Province Nanjing Keyite Electric Co., Ltd. Nanjing Keyite Electric Co., Ltd., Nanjing, China), and ZGJS12.6 mine displacement sensor (from Guizhou Mining Technology Co., Ltd., Zunyi, China as shown in Figure 1b. During the drilling process, the data from each drilling are collected, including key information such as the revolution speed, drilling parameters, time, drilling depth, pressure, drilling rate, and drilling torque. The downhole drilling test and the drill truck sensor arrangement are shown in Figure 1.

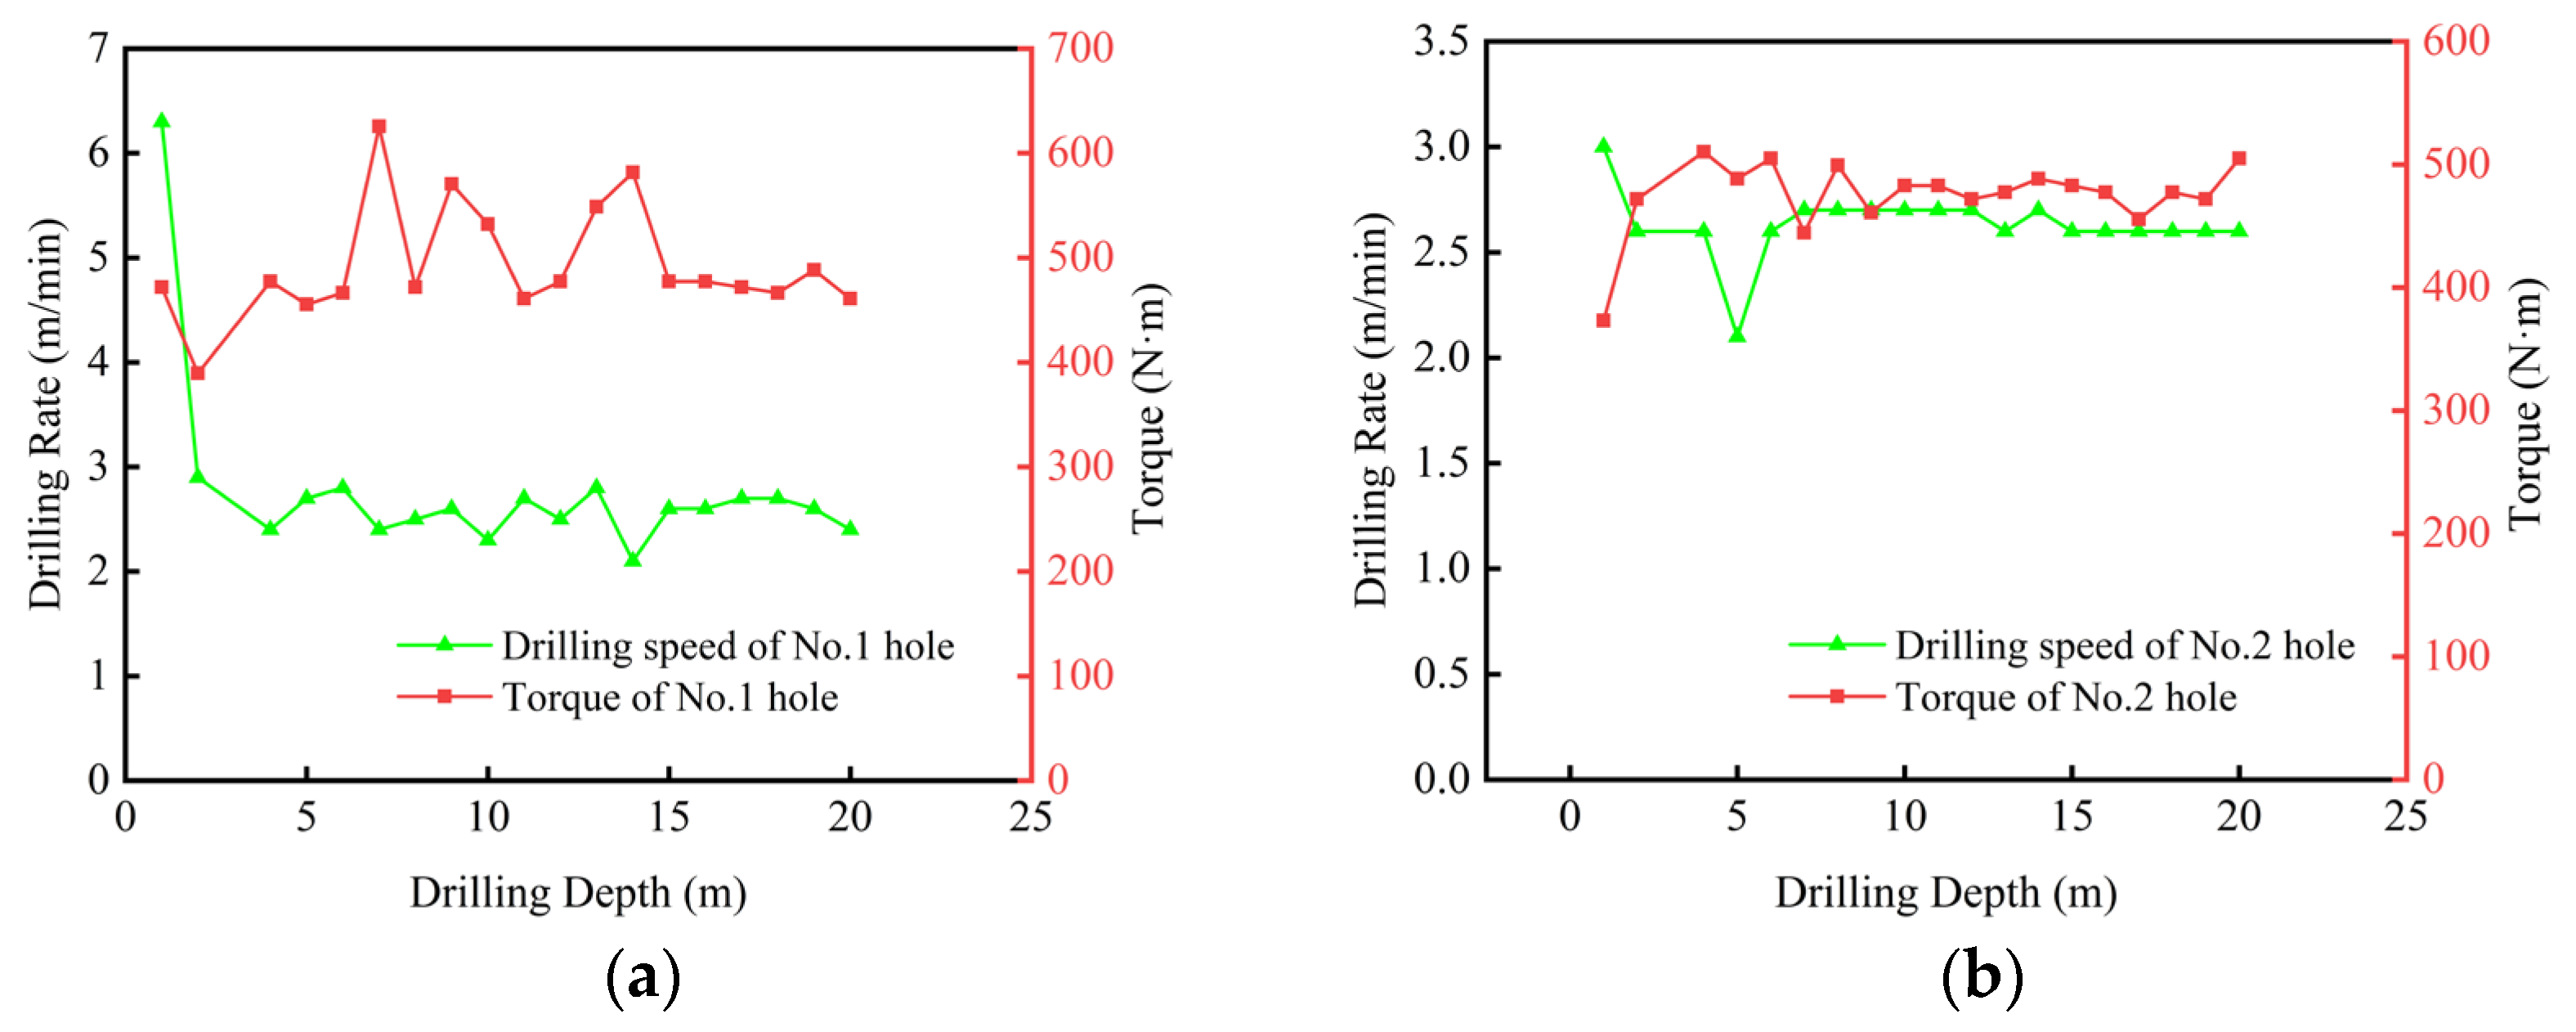
2.2. Test Result Analysis

The data obtained from the construction of large-diameter pressure relief boreholes in the track roadway side of the working face of the Guotun Coal Mine are shown in Table 1, and the change curve obtained after sorting out the data is shown in Figure 2. It can be seen from the drilling data in Table 1 and Figure 2 that the drilling rate shows a short downward trend before drilling 5 m. It is considered that there may be a hard shell or dense layer on the surface of the coal rock mass contacted by the drill bit at the beginning of drilling, and its hardness and strength are high, which increases the difficulty of breaking the rock. The torque rises rapidly and then fluctuates. In the early stage of drilling (up to about 5 m), the drill bit begins to cut into the coal rock mass, and the friction resistance between the drill bit and the coal rock mass increases rapidly, resulting in a rapid increase in torque. In the subsequent drilling process, the coal and rock mass contacted by the drill bit is relatively the same in terms of mineral composition and mechanical parameters, and the ability to resist the drill bit drilling is basically unchanged, so that the friction resistance between the drill bit and the coal and rock mass is stable, so the torque and drilling rate will remain stable.
Through the above analysis, it can be seen that with the increase in drilling depth, the drilling rate of the drilling rig shows a trend of decreasing first and then increasing slowly, and finally the drilling rate will remain stable. The change trend for torque is an increase with the increase in drilling depth, and then it begins to decrease, and finally it maintains a small fluctuation in a stable range.

3. Establishment of Numerical Model

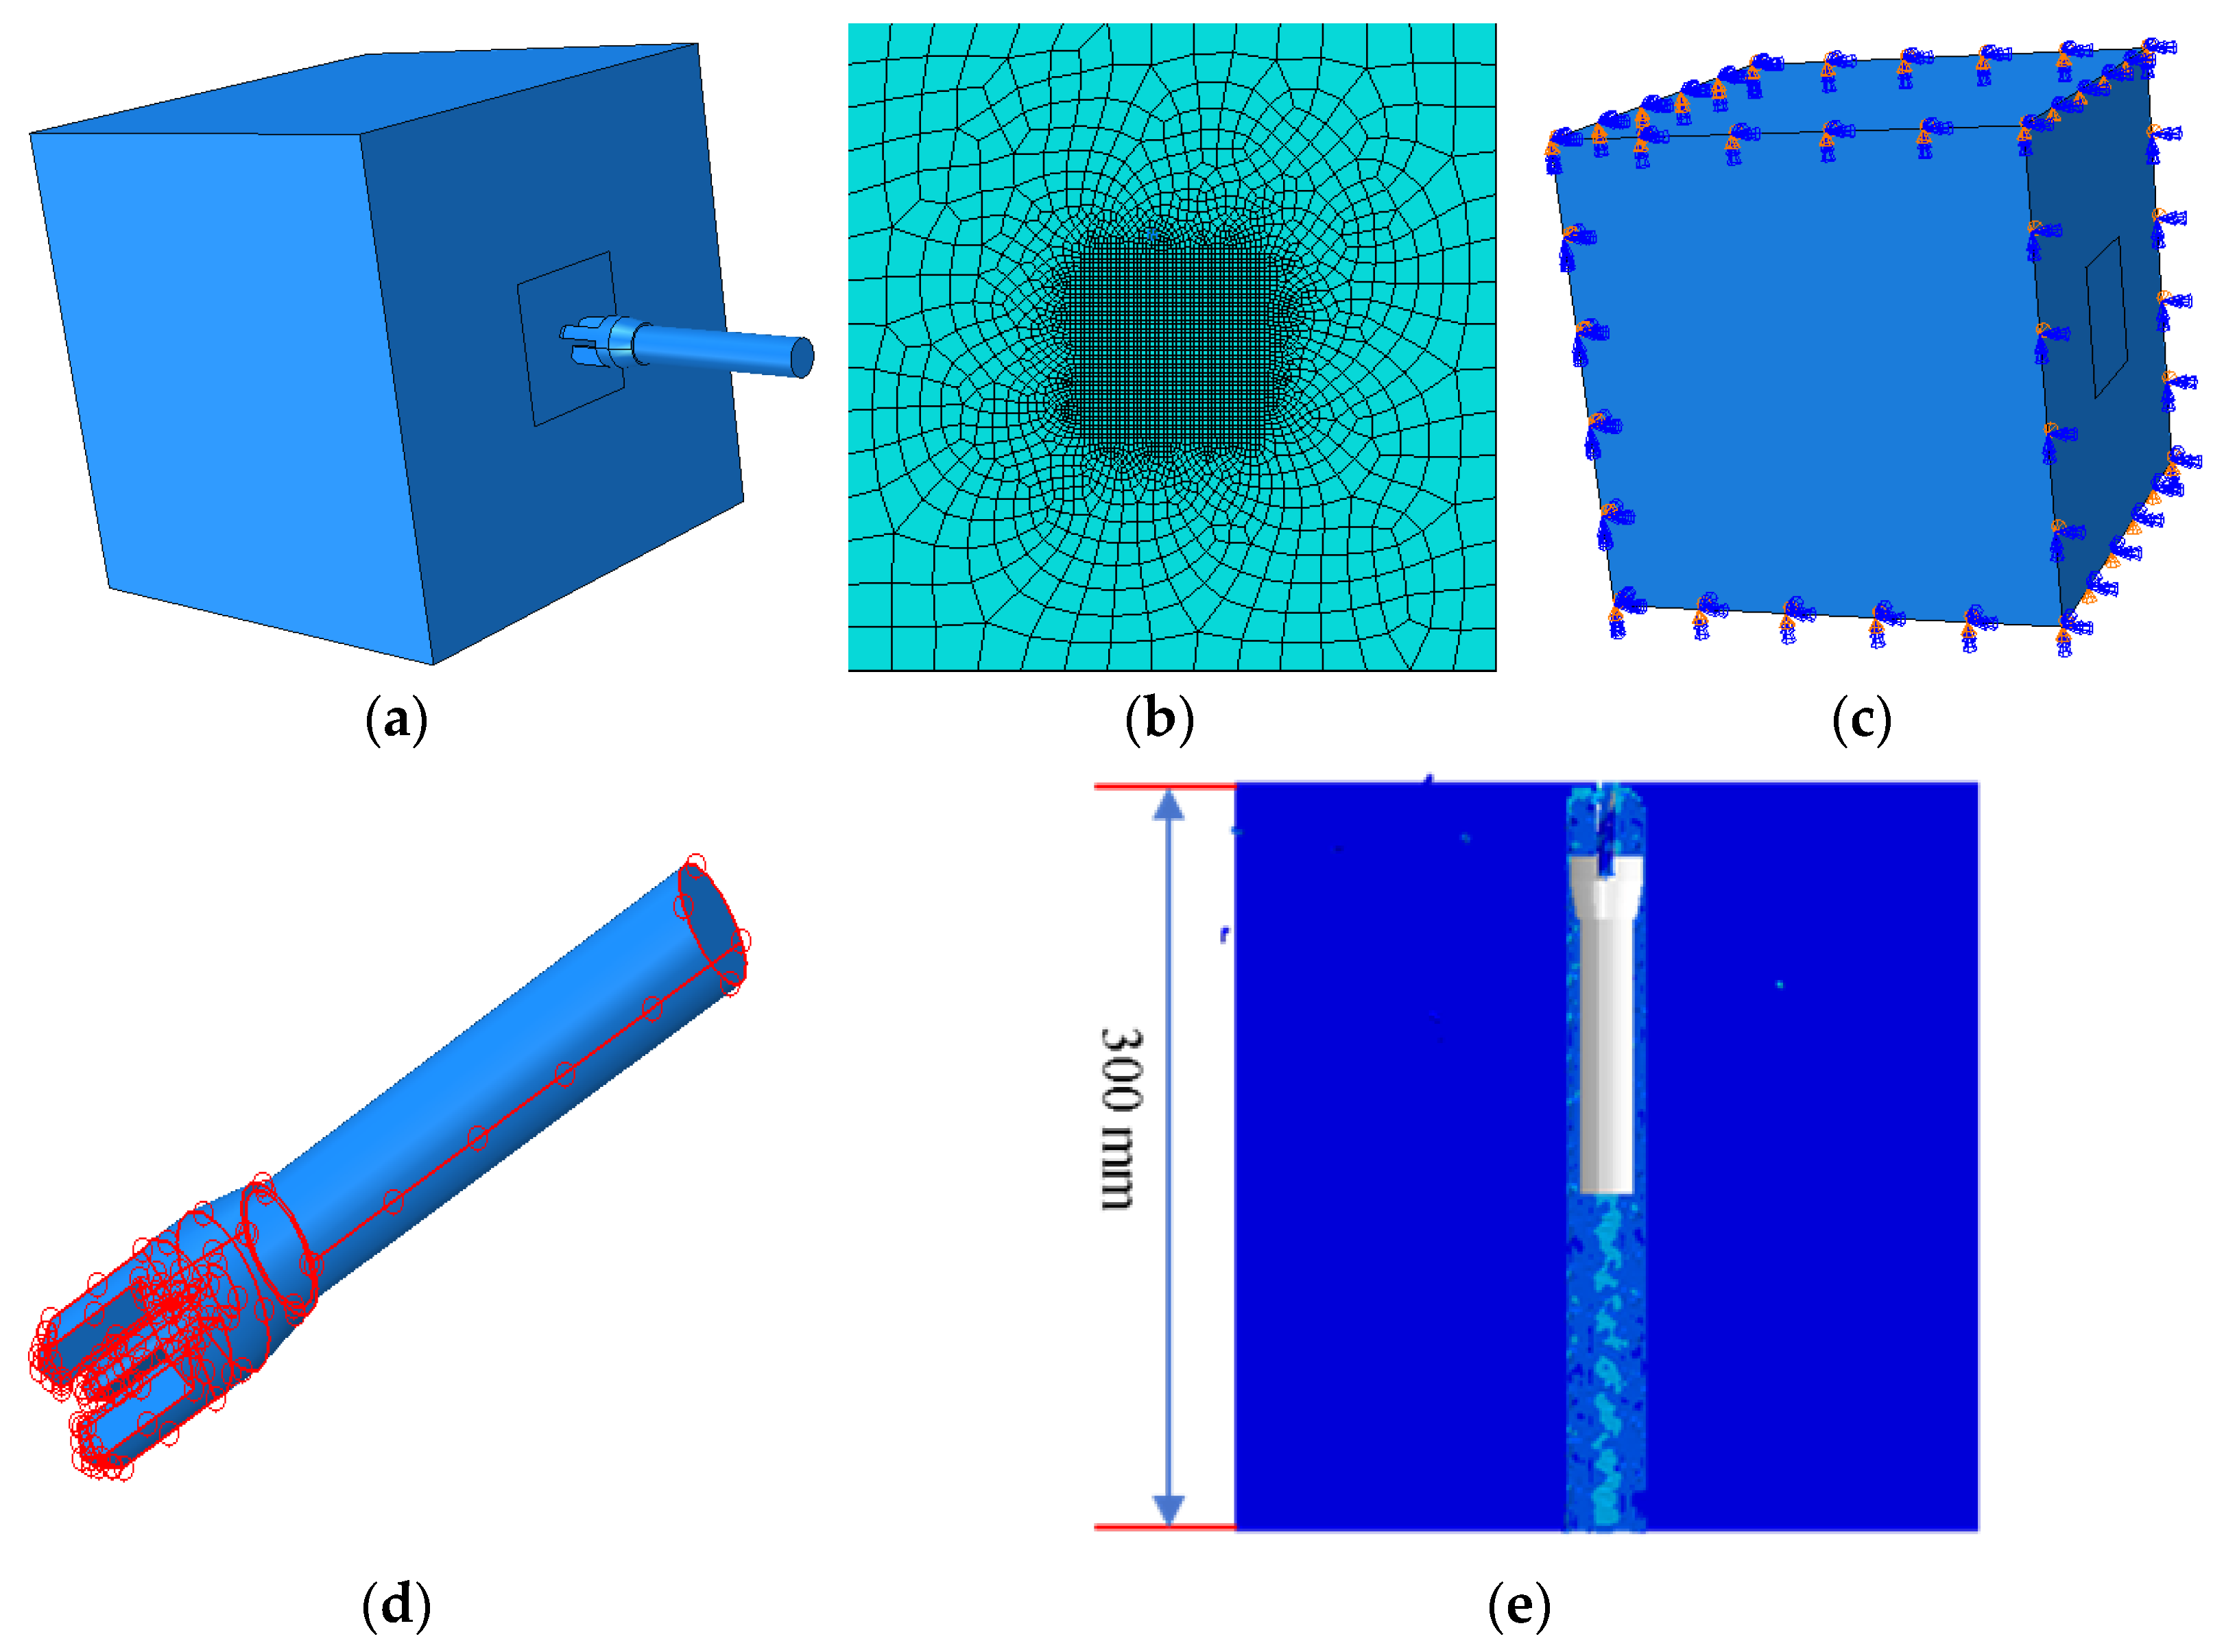
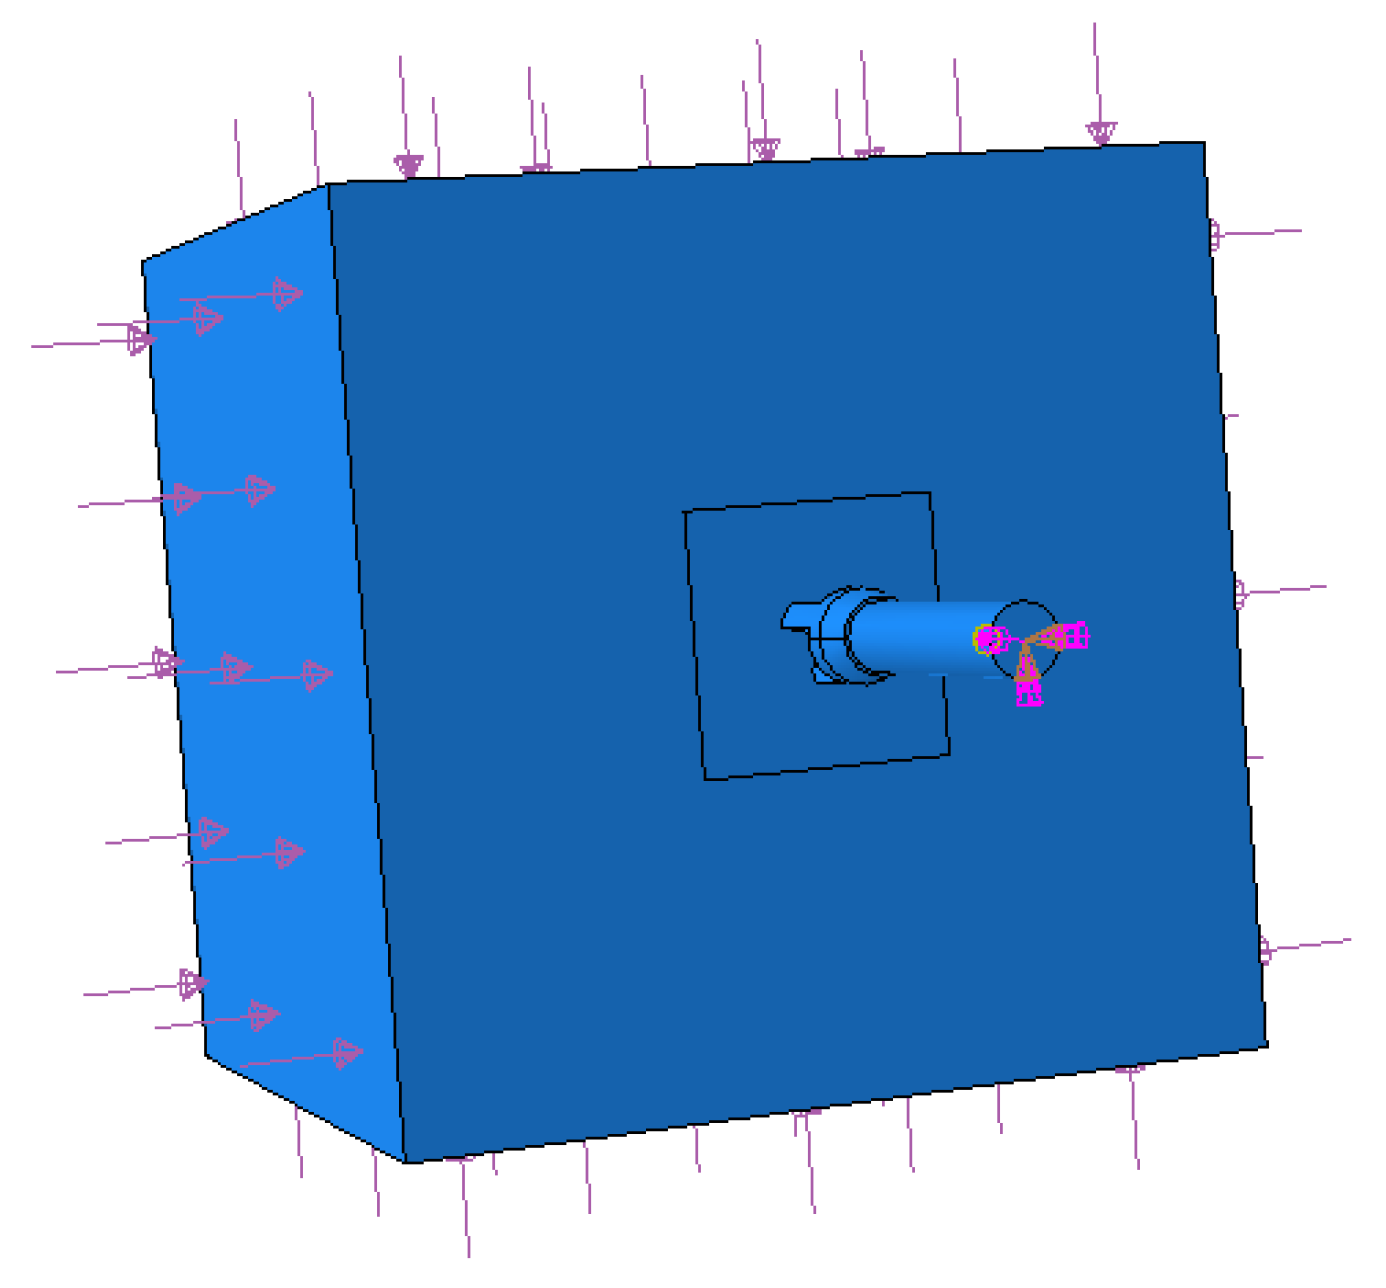
3.1. Drilling Model Establishment

The drill bit model with a diameter of Φ = 28 mm was used in the drilling process and was established in Solidworks v.2022 software and then imported into Abaqus/CAE v.2023 for component transformation. The subsequent numerical model was established in ABAQUS as shown in Figure 3. In view of the irregular shape of the drill bit, it is defined as a rigid body. In the model construction, the C3D4 tetrahedral element with relatively simple calculation and strong rigidity is selected, and the total number of grid nodes is 7402. According to the principle of Saint-Venant, in order to weaken the influence of the rock boundary on the calculation results, the diameter of the rock model should be at least 5 times the diameter of the drill bit. Therefore, this paper takes the rock model as a cube with a side length of 300 mm, and the rock part adopts the 8-node reduced integral unit (C3D8R) sweep grid division technology. The axis algorithm divides the rock mass into loose grid units around the dense center as shown in Figure 3b, which saves calculation time and ensures calculation accuracy. The total number of nodes is 5,232,000. The simulation process in this paper is mainly the whole process of the bit breaking the rock. In order to increase the analysis accuracy, the model is solved by the explicit analysis module Abaqus/Explicit.
In the process of simulating the drilling process of the drill bit, the full degree of freedom of the rock is constrained to ensure that the pose of the rock during the drilling process remains unchanged as shown in Figure 3c. The addition of constraints to the drill bit so that the drill bit will not move and bend in addition to the drilling direction is shown in Figure 3d. The parameters such as the thrust of the drill bit, the revolution speed, and the stress state of the rock during the drilling process are changed, respectively, and the dynamic response characteristics of the coal mine roadway under different drilling parameters and different confining pressures are studied.

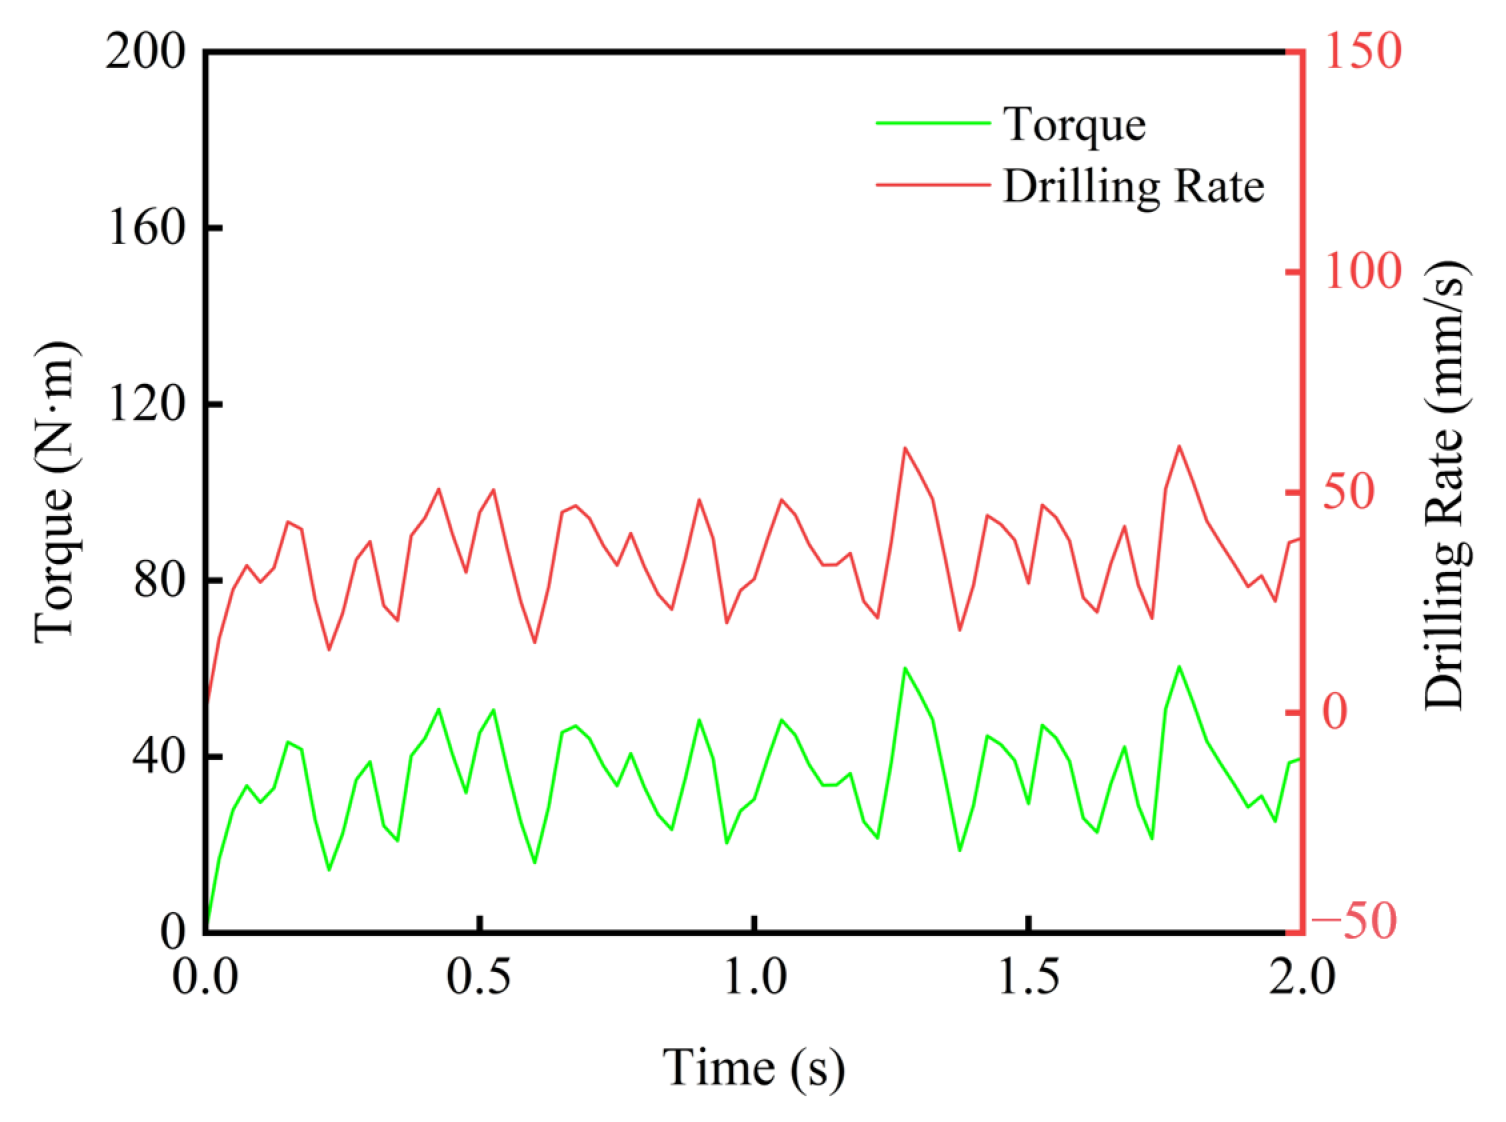
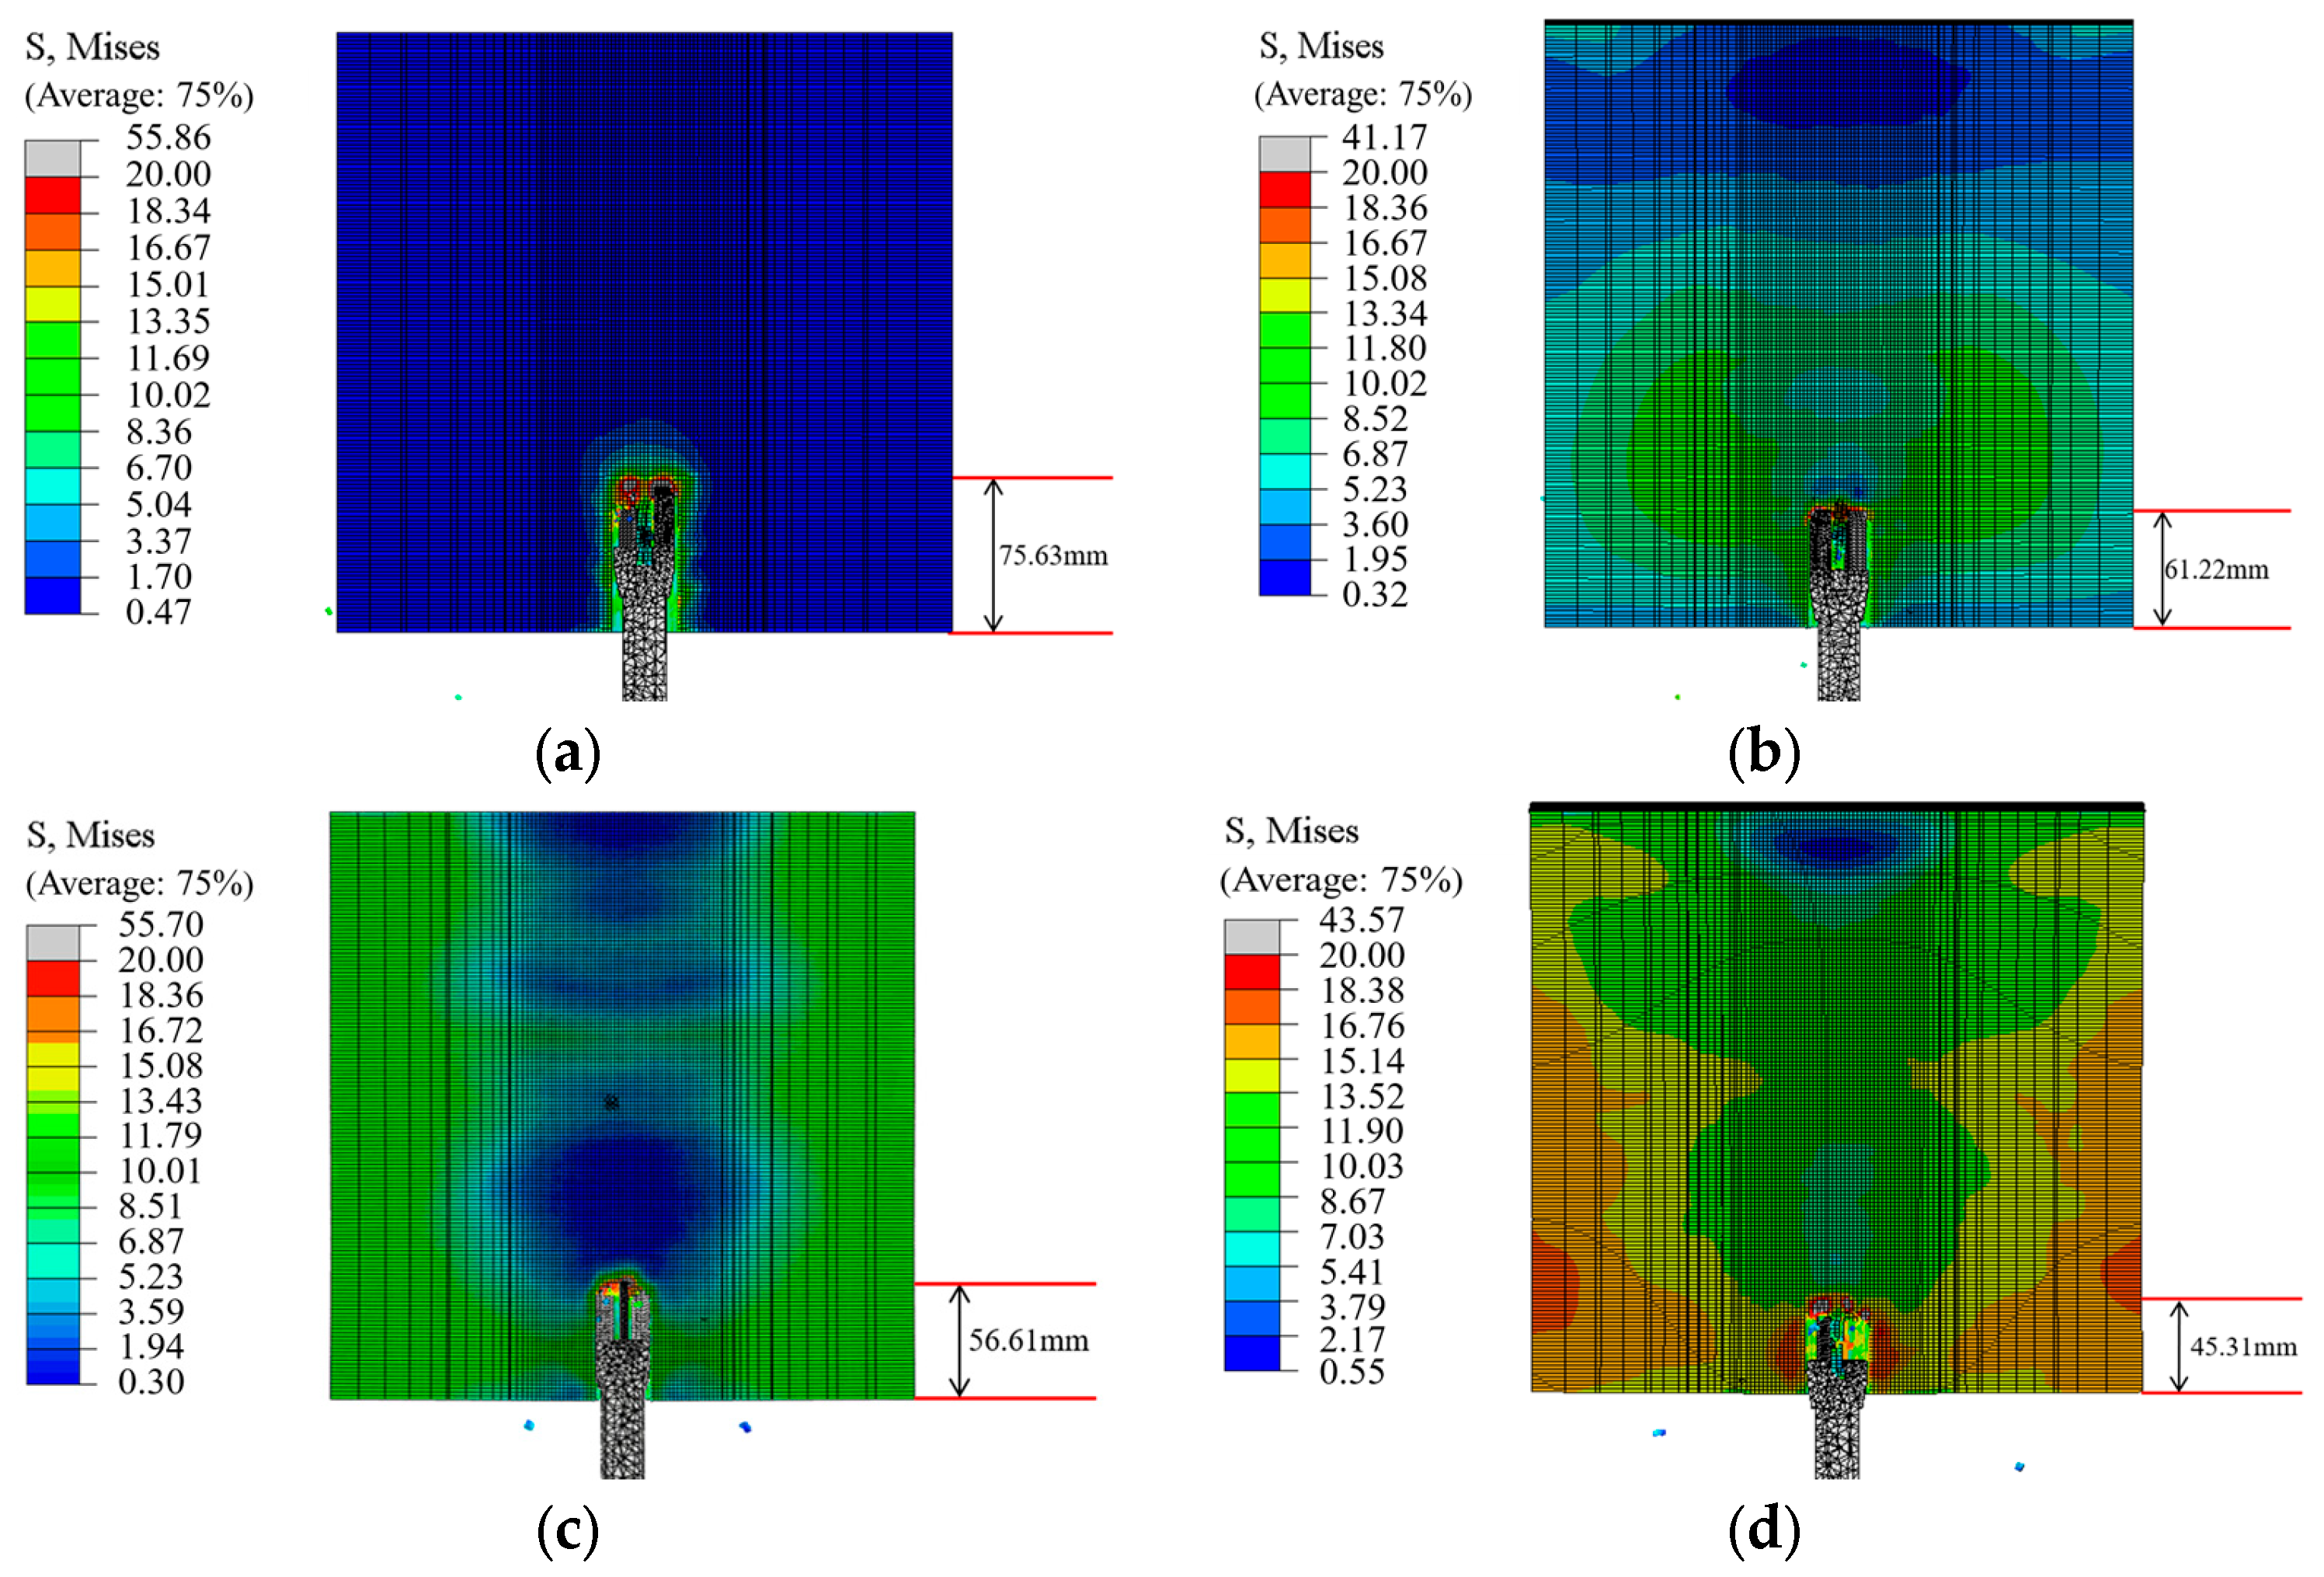
3.2. Reliability Analysis of Drilling Simulation

Relevant research shows that [17] in the drilling construction of a coal mine roadway the trajectory of the drill bit in the hole shows a ‘step-up’ change characteristic, accompanied by a rebound phenomenon. At the same time, the drilling rate is not uniform and stable but fluctuates, which is mainly due to the non-linear uniform growth relationship between the depth and load of the drill bit invading the rock. In the early stage of the load increase, the penetration depth increases in a certain proportion with the increase in load. When the load reaches a certain critical value, the penetration depth of the drill bit will increase suddenly. Therefore, the drilling rate and torque will also have a certain jump fluctuation due to the change in drilling depth. Through the field drilling data shown in Figure 2, it can be clearly observed that with the increase in drilling depth, the drilling rate and torque show a certain degree of fluctuation.
In the numerical simulation study, in order to make the change in drilling parameters in the simulation results more in line with the actual drilling process, the following assumptions are made:
(1)
During the drilling process, the drill bit is drilled in a manner perpendicular to the rock specimen, and the borehole does not deflect;
(2)
The stiffness and strength of the drill bit are much higher than that of the rock, so the drill bit is assumed to be a rigid body;
(3)
When the rock unit fails to drill, it is directly removed. Without considering the problem of repeated crushing, the broken rock unit will no longer affect the subsequent rock drilling work;
(4)
The rock in the numerical model is homogeneous and isotropic, without considering the existence of primary cracks in the rock and without considering the influence of tectonic stress and pore pressure in the rock [16,18].
Based on the above assumptions, the drilling simulation experiment is carried out, and the obtained time–drilling rate and time–torque curves are shown in Figure 4. In the process of numerical simulation, it is assumed that the drill bit is a rigid body without deformation. This assumption simplifies the complex mechanical response of the drill bit itself in the simulation process, so that the research focuses on the relationship between the rock and drilling parameters. Secondly, the factor of bit wear is not considered for the time being. Bit wear cannot be ignored in practical engineering. However, the purpose of this simulation is to explore the influence of different initial characteristics of different rocks on drilling. If the influence is not included, the simulation conditions can be more idealized and controllable. Finally, the ‘life and death unit’ is used in the hypothesis. Its function is to remove the rock unit directly from the model when the rock unit fails to drill. This function makes the drilling rate curve more in line with the changes in the actual drilling process, as shown in Figure 4. After comparing the simulation curve in Figure 4 with the curve obtained from the field test shown in Figure 2, it is found that the change trend of the two is basically the same. It can be seen that the construction of this numerical simulation is reasonable and can provide a reliable basis for subsequent research.
In the study of rock mechanics, there are many kinds of criteria to describe the yield behavior of rock. When it comes to the specific type of rock, the Drucker–Prager criterion and Mohr–Coulomb criterion are frequently used in related research and engineering practice. Mohr–Coulomb criterion, as a classical criterion for rock yield judgment, is based on the shear strength theory of rock and plays an important role in many rock mechanics analysis scenarios. The Drucker–Prager criterion [24,25] is based on the theory of the Mohr–Coulomb criterion and Mises criterion. Based on the expansion, under certain conditions, the Drucker–Prager criterion can achieve mutual transformation with the Mohr–Coulomb criterion. The Drucker–Prager criterion regards deviatoric stress as the cause of material failure and reflects the influence of volume stress on material strength, which can better reflect the whole process of rock from initial stress to yield. Therefore, the Drucker–Prager criterion is selected in this paper to describe the failure process of rock combined with the shear damage failure mechanism.
In order to make the simulation results more accurate and reliable, the relevant geological data of the Guotun Coal Mine in the Shandong mining area are consulted to understand that the rock types in the process of drilling construction mainly include mudstone, sandy mudstone, fine sandstone, and siltstone. Therefore, this paper selects four types of materials, coal, mudstone, sandy mudstone, and siltstone, to participate in the simulation analysis. Part of the physical and mechanical parameters of the four coal–rock materials [26,27] are shown in Table 2.

3.3. Numerical Simulation Experiment Scheme

In order to further explore the dynamic response mechanism in the drilling process of a coal mine roadway, this study will systematically change the key parameters in the drilling process, including the thrust, the revolution speed of the drill bit, and the stress state of the rock, so as to study the variation law of the dynamic response characteristics of coal mine roadway drilling under different drilling parameters and different confining pressure conditions. The drilling simulation experiment scheme under different thrust speed conditions is shown in Table 3.
In order to further explore the influence of confining pressure conditions on the drilling parameters of coal in the drilling process, this experiment applied pressure on the surface of the rock in the x and y directions as shown in Figure 5, and the variation in parameters while drilling in the process of coal drilling under confining pressure is studied. The specific experimental scheme is shown in Table 4.

4. Numerical Simulation Results Analysis

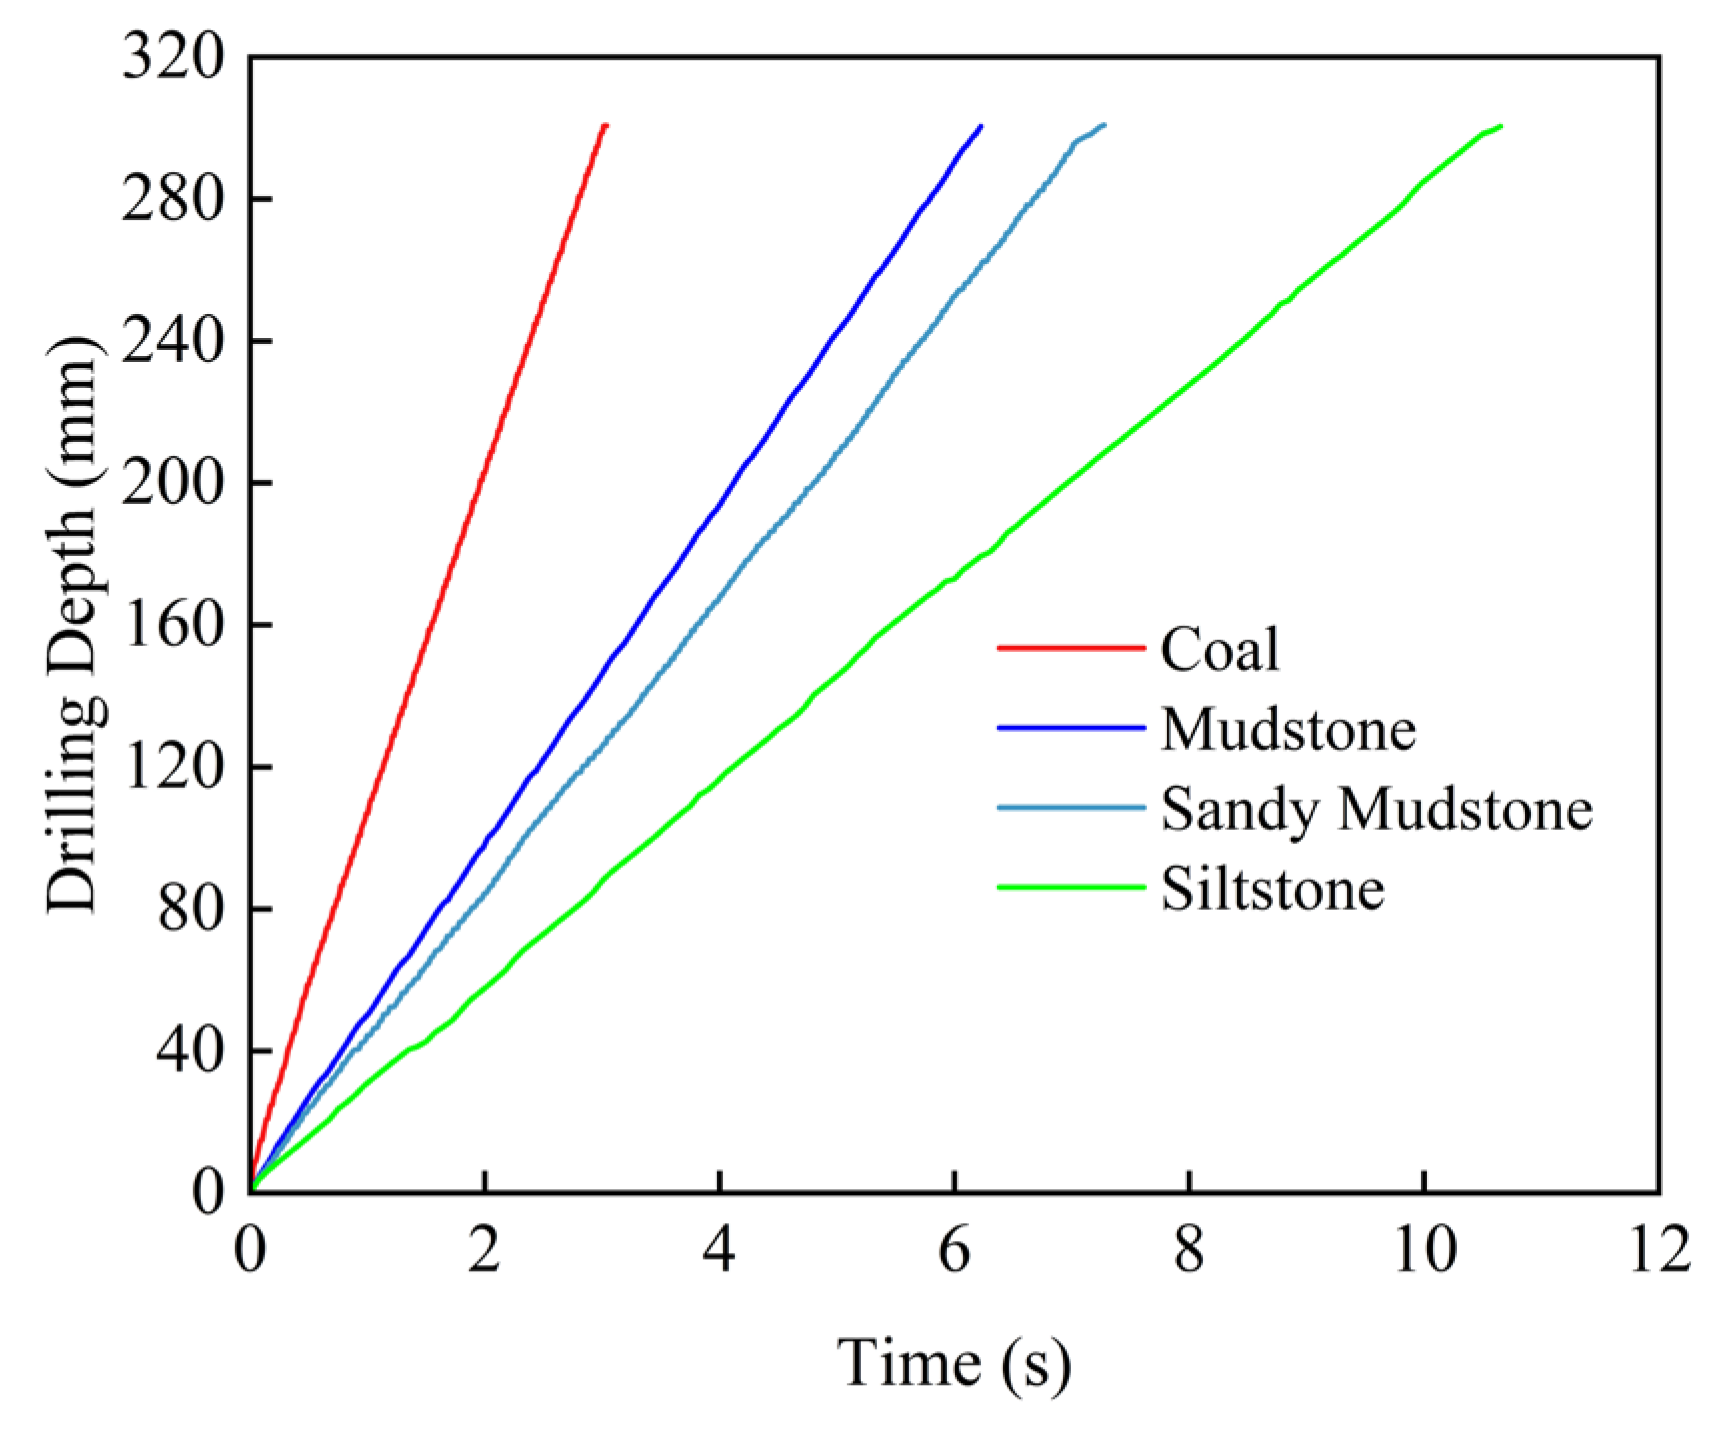
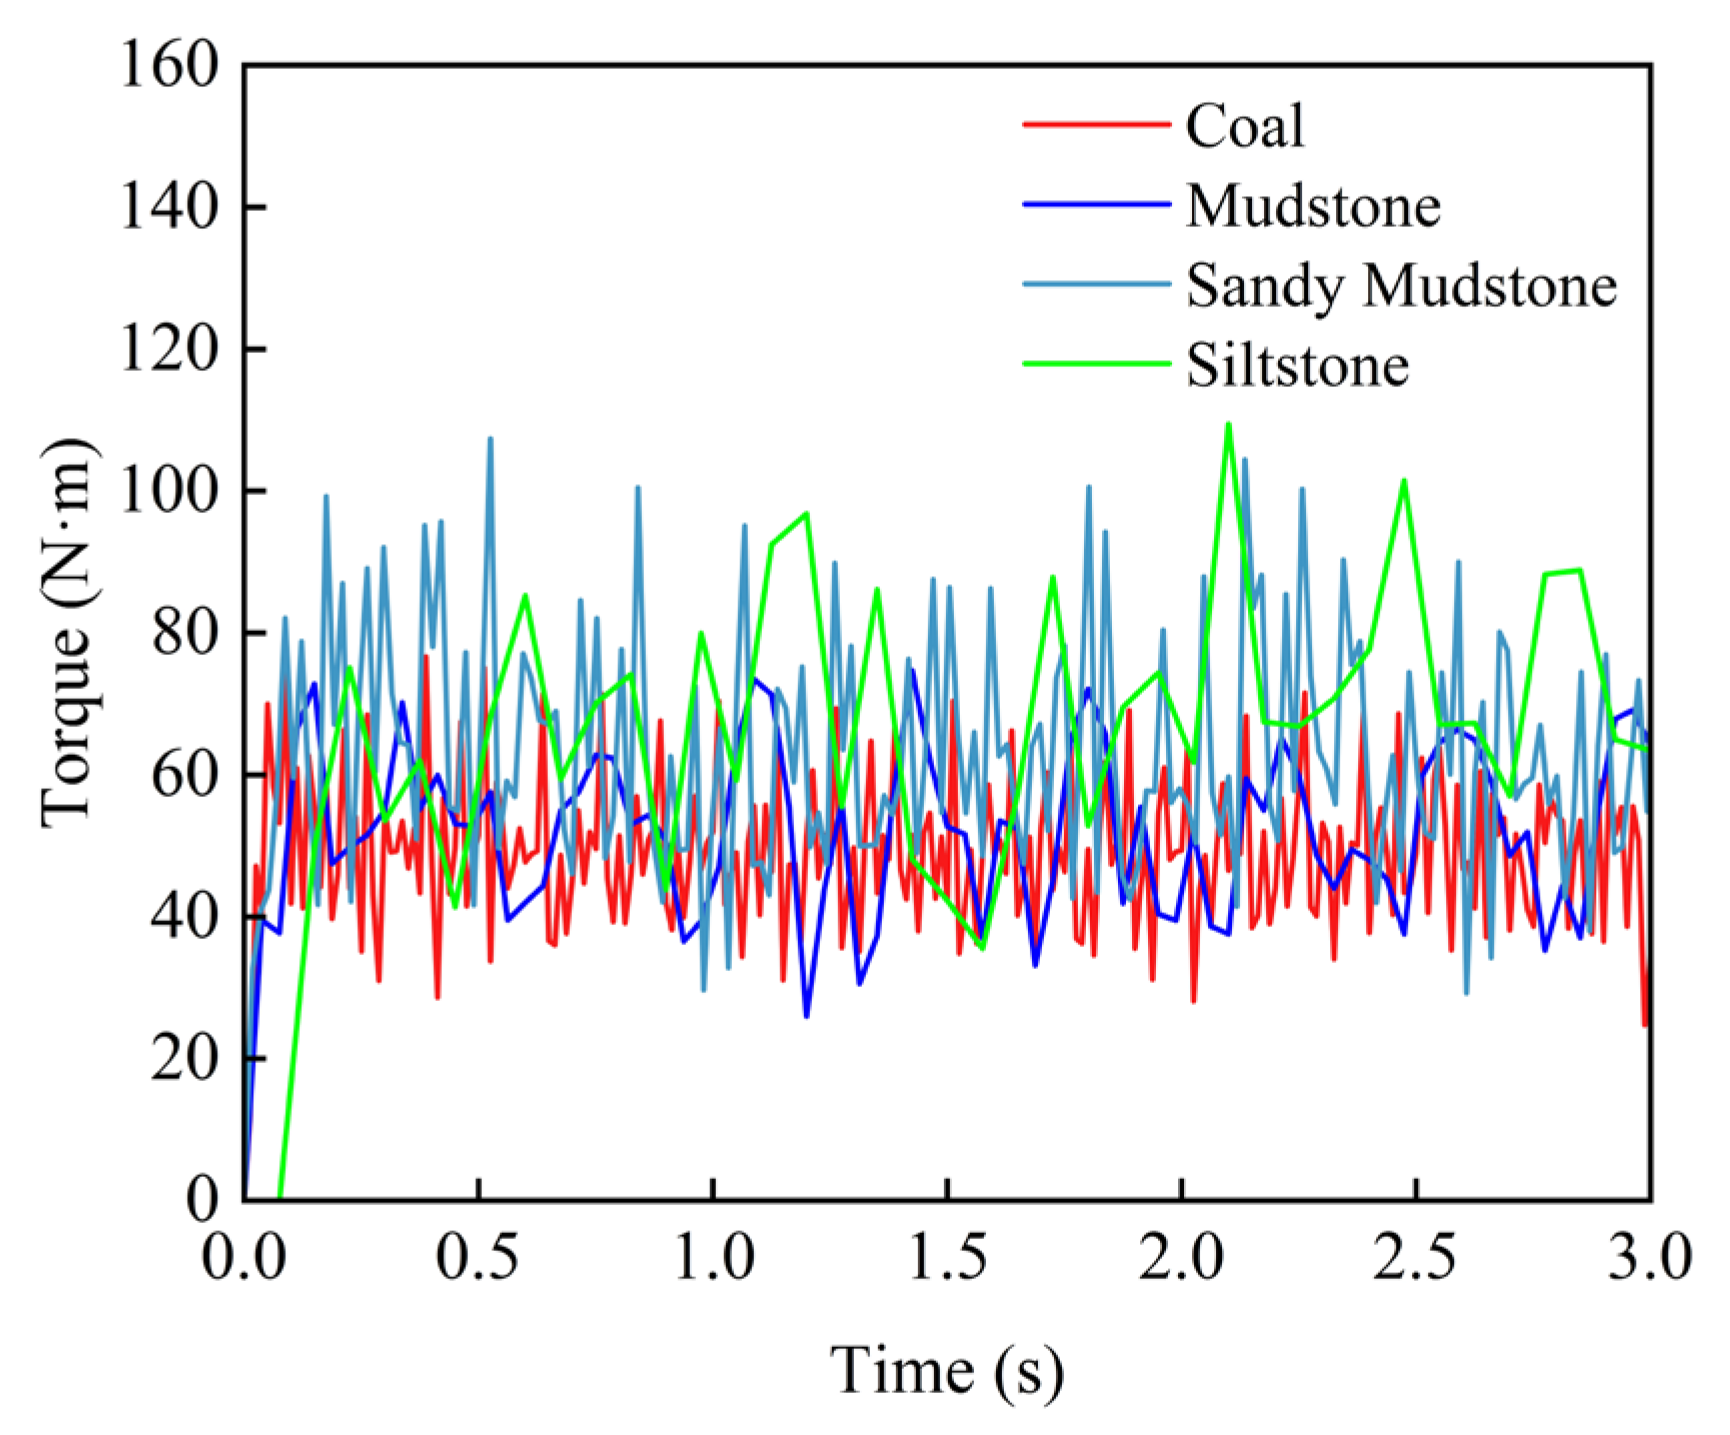
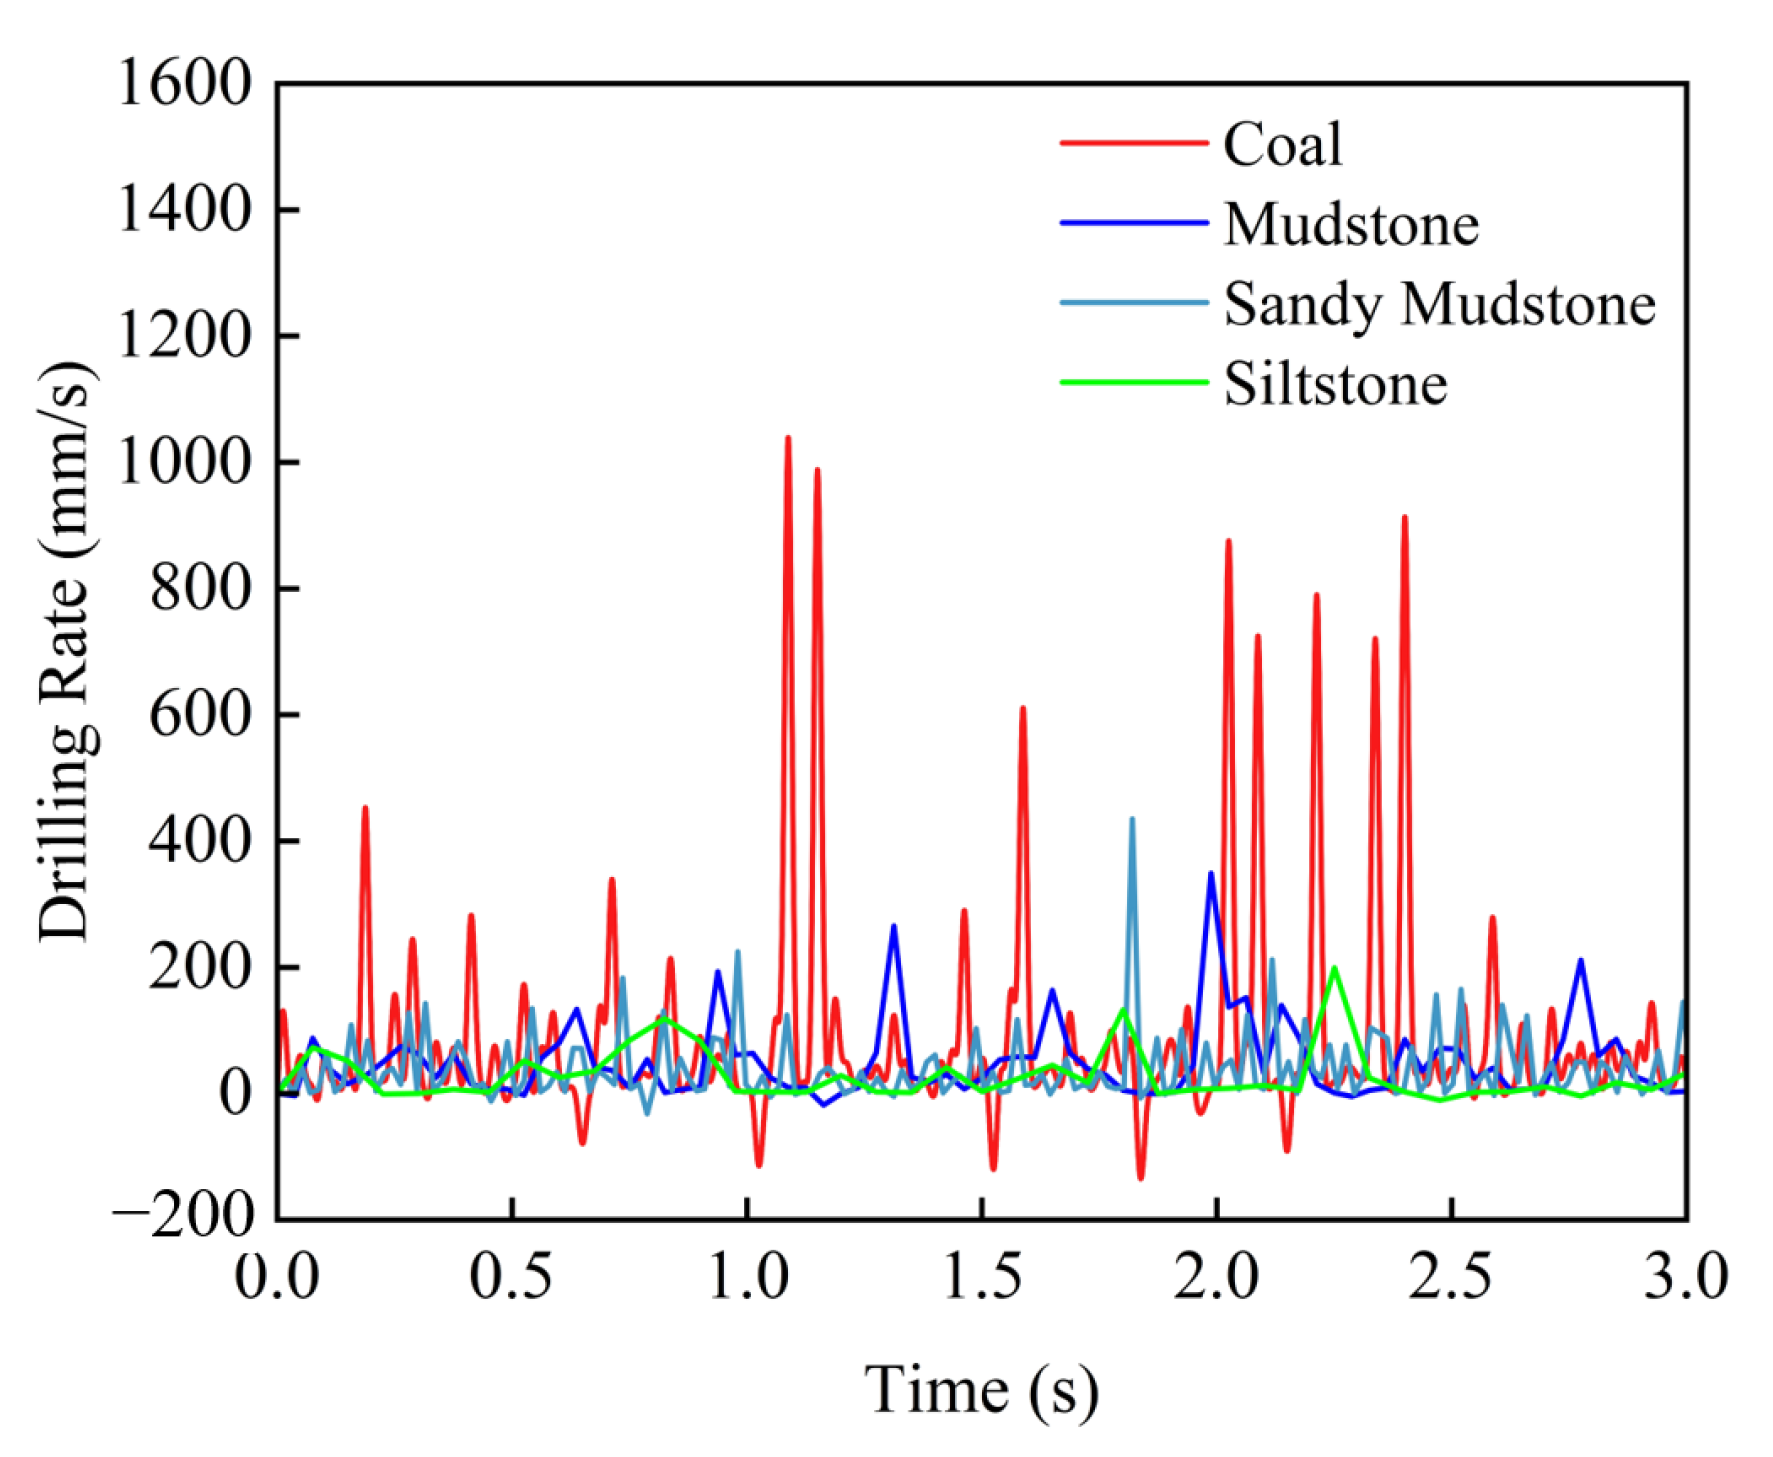
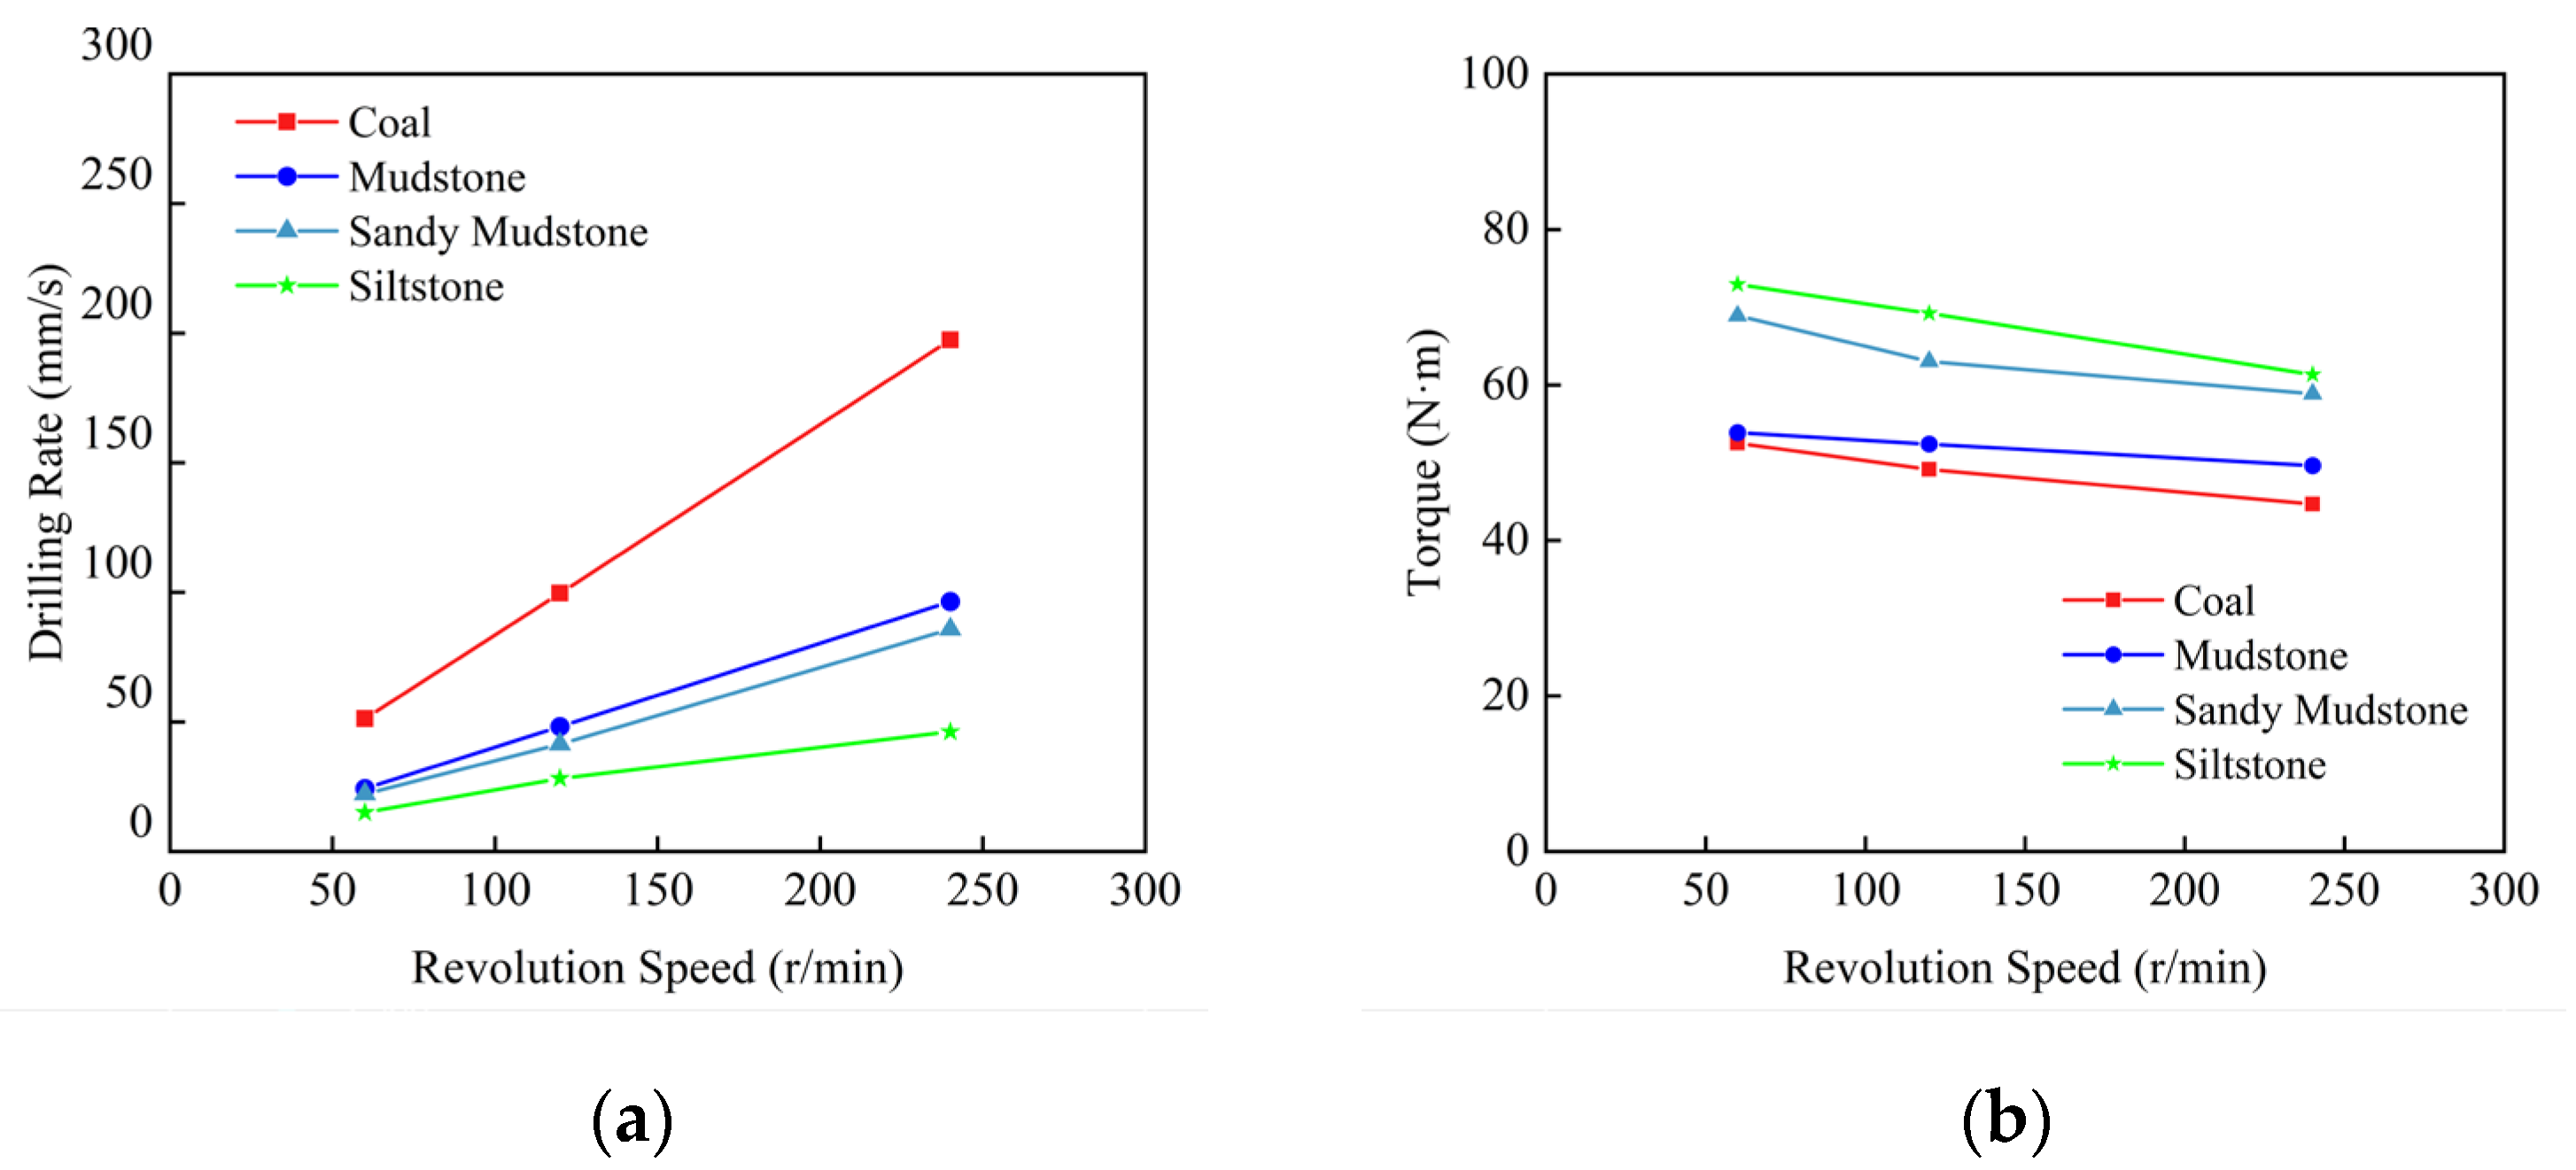
4.1. Analysis of Drilling Parameters Under Different Lithology Conditions

In order to compare and analyze the change trend for the drilling rate of each rock under the same thrust speed control condition, in the process of numerical simulation, the revolution speed of the fixed bit is 120 r/min, and the thrust is 5000 N. The time–drilling depth, time–drilling rate, and time–torque curves of each rock under the same horizontal control conditions are recorded, respectively, as shown in Figure 6, Figure 7 and Figure 8.
The reverse torque of the drill bit during the drilling process is collected, and the curve of the torque changing with time is obtained. From the analysis of Figure 7 and Figure 8, it can be seen that when the drill bit contacts the rock, the torque and drilling rate will increase sharply. This phenomenon intuitively reflects that the drill bit needs to overcome the large resistance to start the process of breaking the rock at the moment of cutting into the rock. At this time, the energy is rapidly consumed, which is directly manifested as a sudden increase in the torque and drilling rate. After entering the stable drilling stage, the torque does not remain constant but fluctuates within a certain range. At the same time, the instantaneous drilling rate of the drill bit alternates between positive and negative, showing obvious fluctuation. This fluctuation characteristic strongly reveals that there is a complex contact–separation–recontact dynamic process between the bit and the rock during the drilling process.
In the microscopic process of rock drilling, the fluctuation in the torque and drilling rate is closely related to the function of the ‘life and death unit’ used in meshing. When the cutting teeth break the rock, each unit in the model will bear different degrees of stress. If a unit fails because the stress it bears exceeds its limit, the unit will be removed from the model according to the setting of the ‘life and death unit’. According to the principle of interaction in mechanics, at the moment of unit failure, the contact between the cutting teeth and the rock will be suddenly interrupted, which will lead to a sharp decline in the reaction force and moment. As the drill bit continues to rotate, the cutting teeth establish contact with the new rock unit. At this time, the reaction force and torque will rise rapidly. This process directly causes severe fluctuations in the torque and drilling rate. During the whole drilling process, this contact–failure cycle is repeated continuously, so that the force on the drill bit is always in a certain state of change.
The drilling performance of different rock types under the same thrust and revolution speed is further compared, and the parameters such as the drilling time, drilling rate, and torque are analyzed in detail. When drilling the same displacement, the shortest time required for drilling coal is 3.01 s, followed by mudstone at 6.22 s, sandy mudstone at 7.27 s, and the longest time required for drilling is for siltstone at 10.65 s. From the change in the drilling rate and torque, under the same drilling depth, the average drilling rate and average torque of different rocks show significant differences. The average drilling rate of coal is 99.83 mm/s, and the average torque is 48.95 N·m; the average drilling rate of mudstone is 48.21 mm/s, and the average torque is 51.85 N·m; the average drilling rate of sandy mudstone is 41.49 mm/s, and the average torque is 63.04 N·m; the average drilling rate of siltstone is 28.2 mm/s, and the average torque is 67.47 N·m. In-depth exploration of its internal mechanism shows that there is a significant correlation between rock strength and drilling characteristics. Usually, the higher the rock strength, the greater the torque required in the drilling process, the smaller the drilling rate, and the longer the required drilling time. Based on the above analysis and the law of torque and drilling rate change curve, it can be clearly concluded that with the increase in the rock’s uniaxial compressive strength, in the four types of rocks, namely coal, mudstone, sandy mudstone, and siltstone, the average drilling rate demonstrates the decreasing law of coal > mudstone > sandy mudstone > siltstone, while the torque demonstrates the increasing law of coal < mudstone < sandy mudstone < siltstone. Therefore, in the process of on-site drilling construction, the strength of the drilled rock layer can be judged according to the difference in drilling rate and torque.

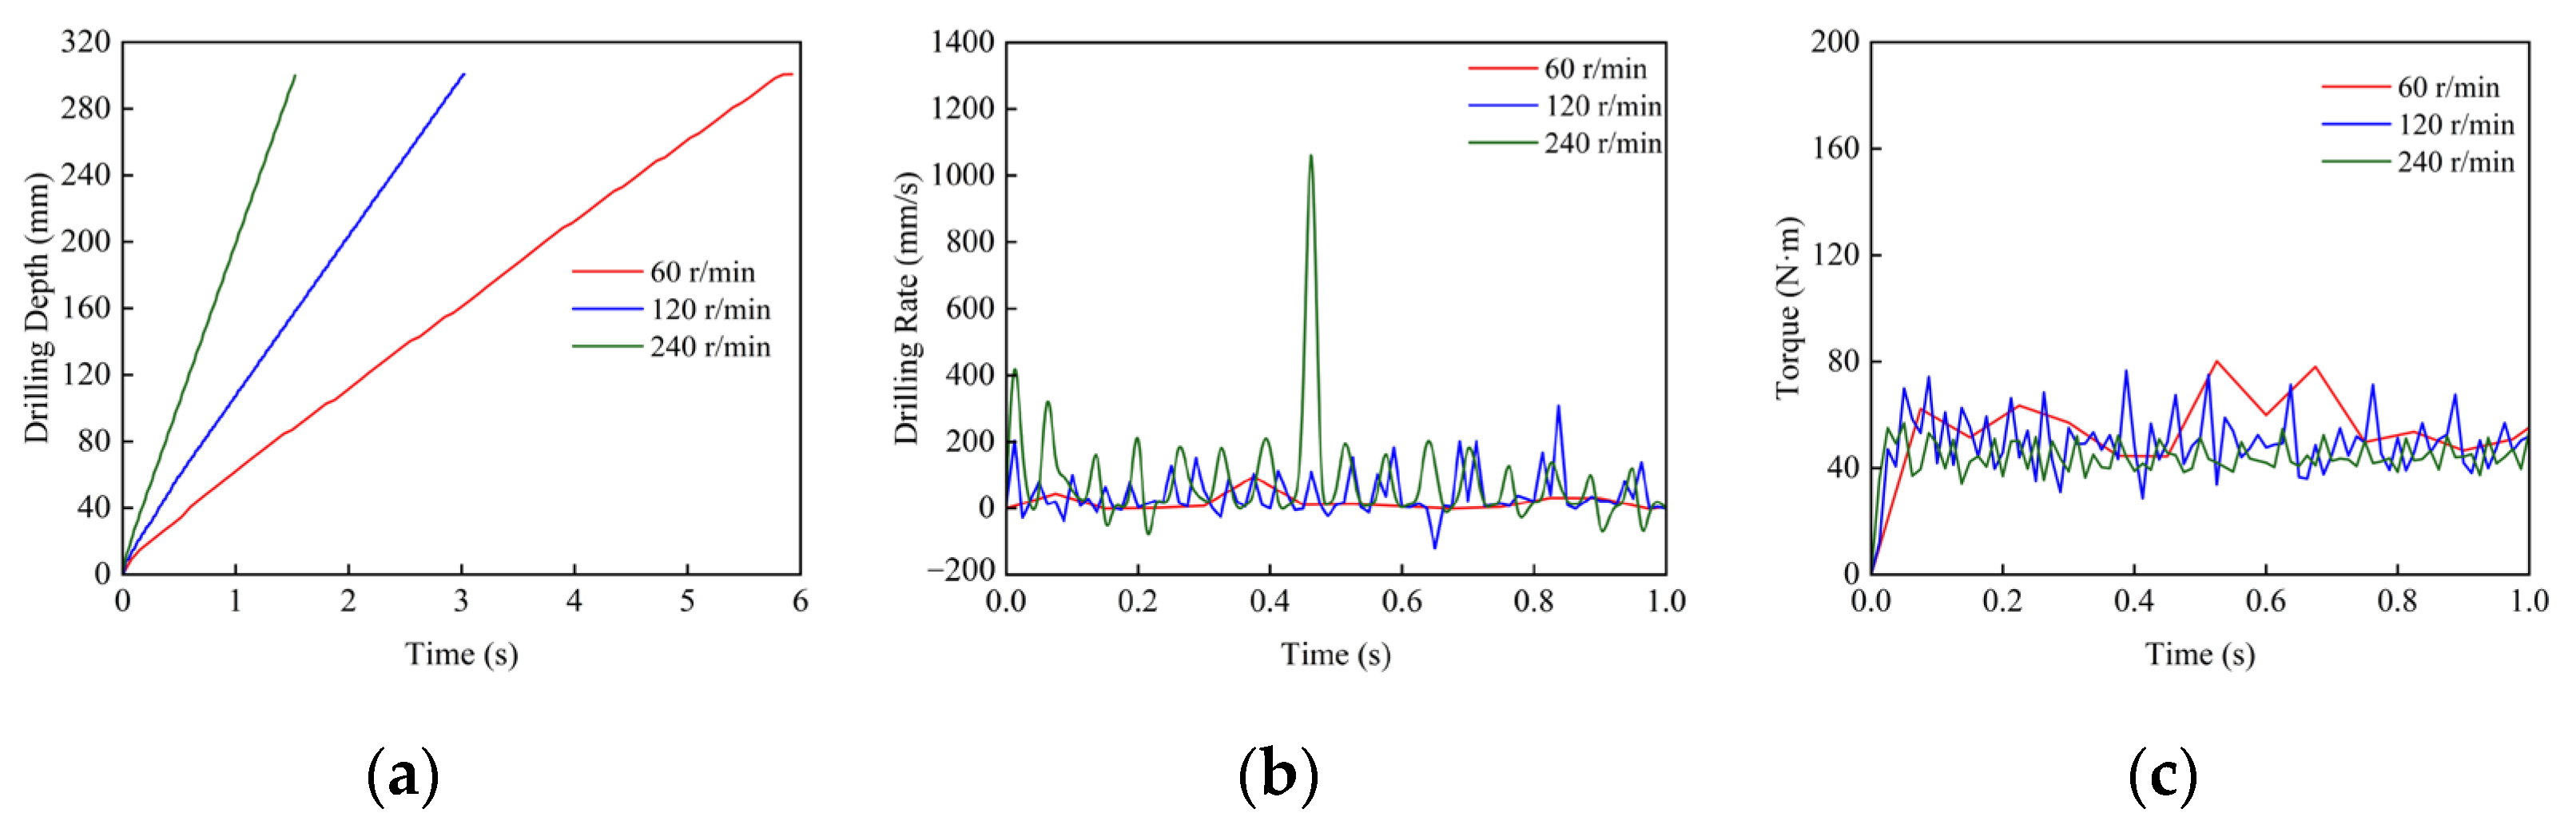
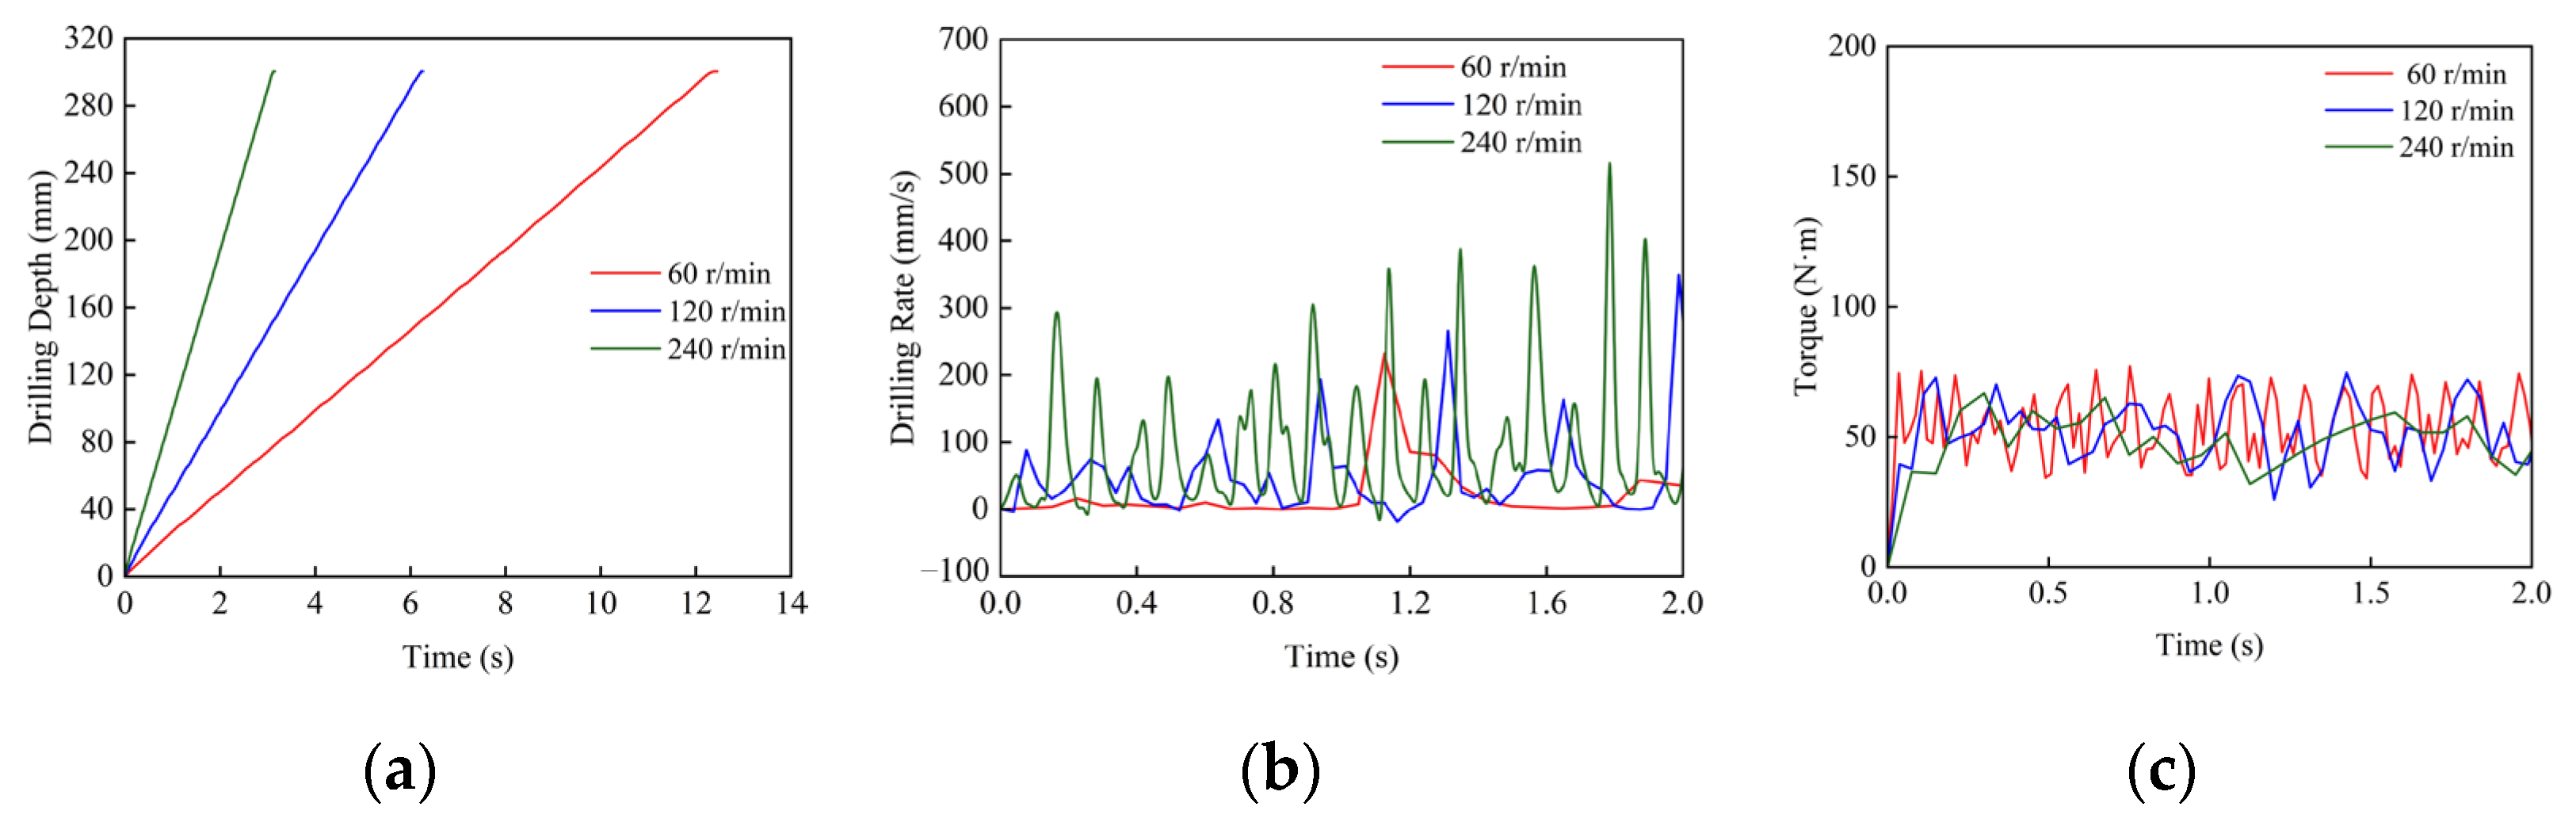
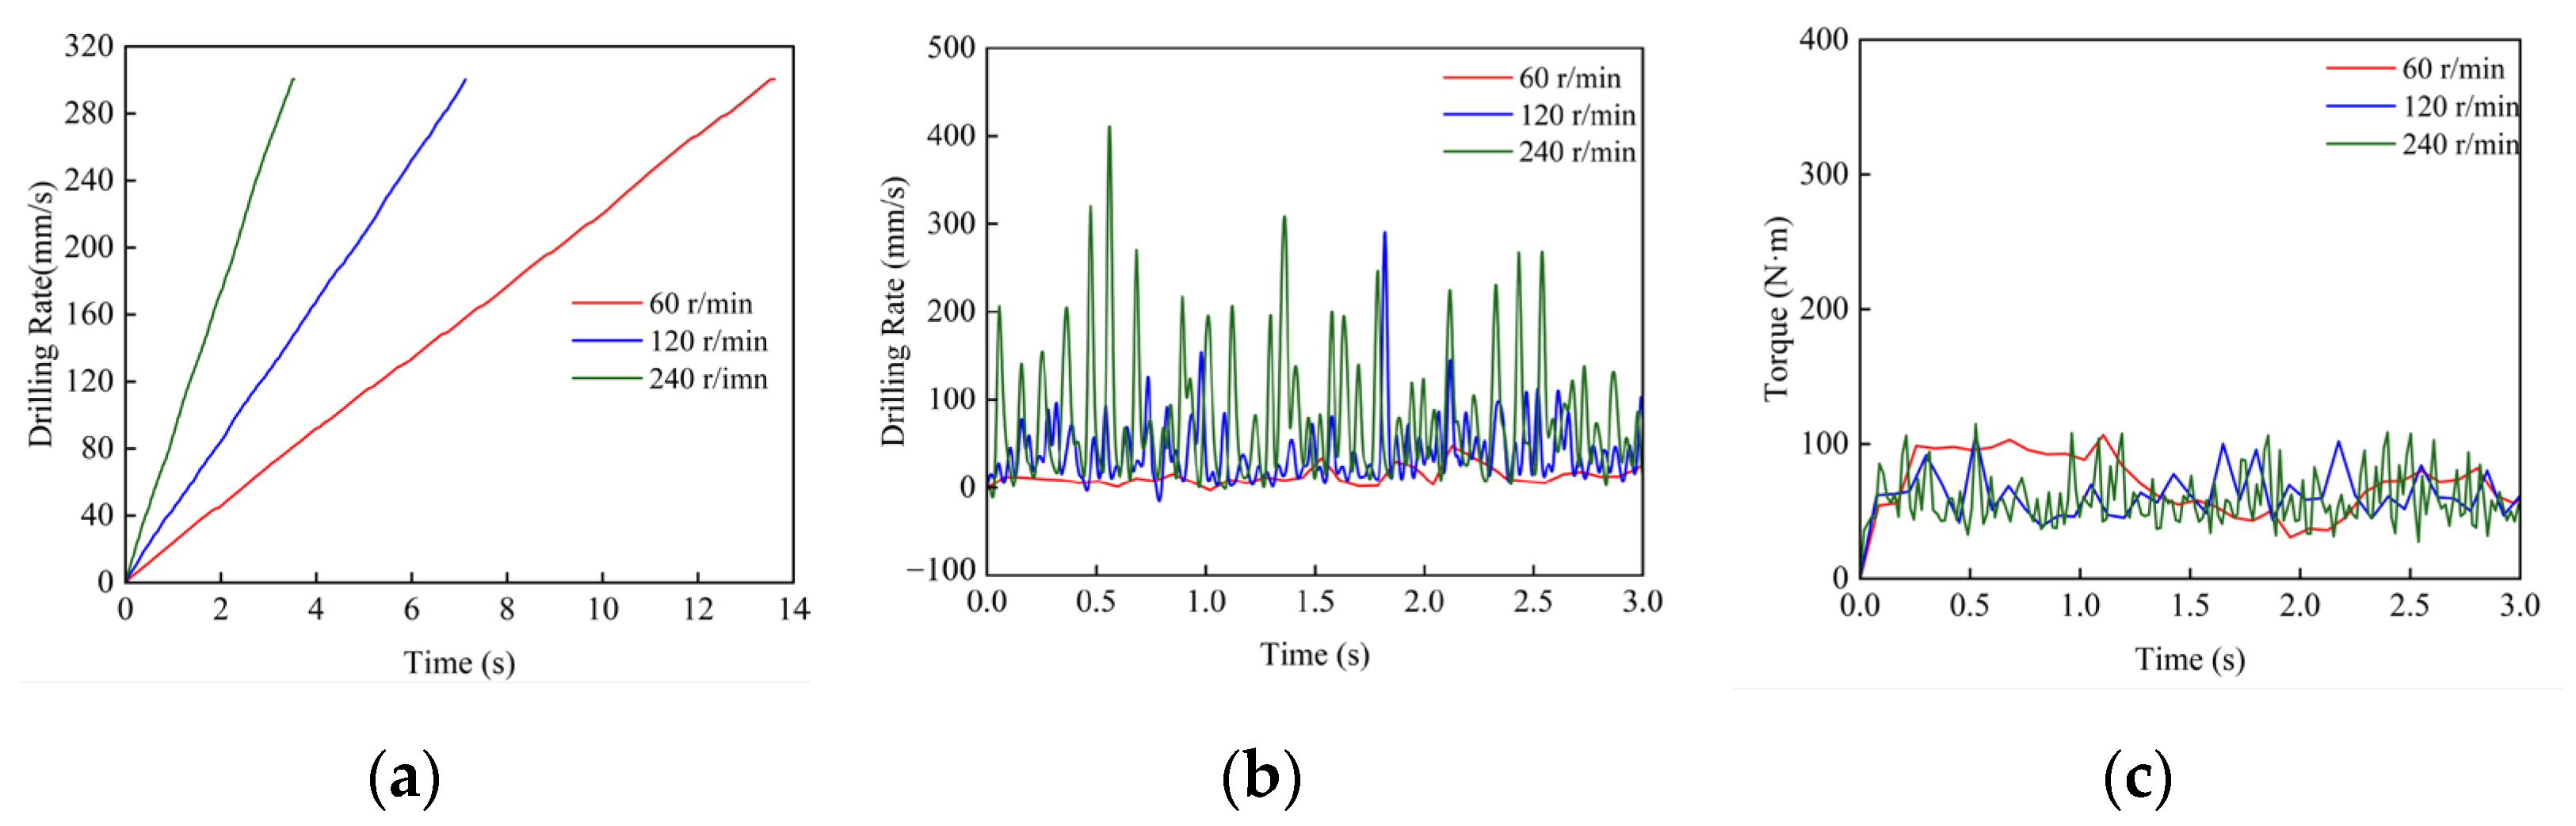
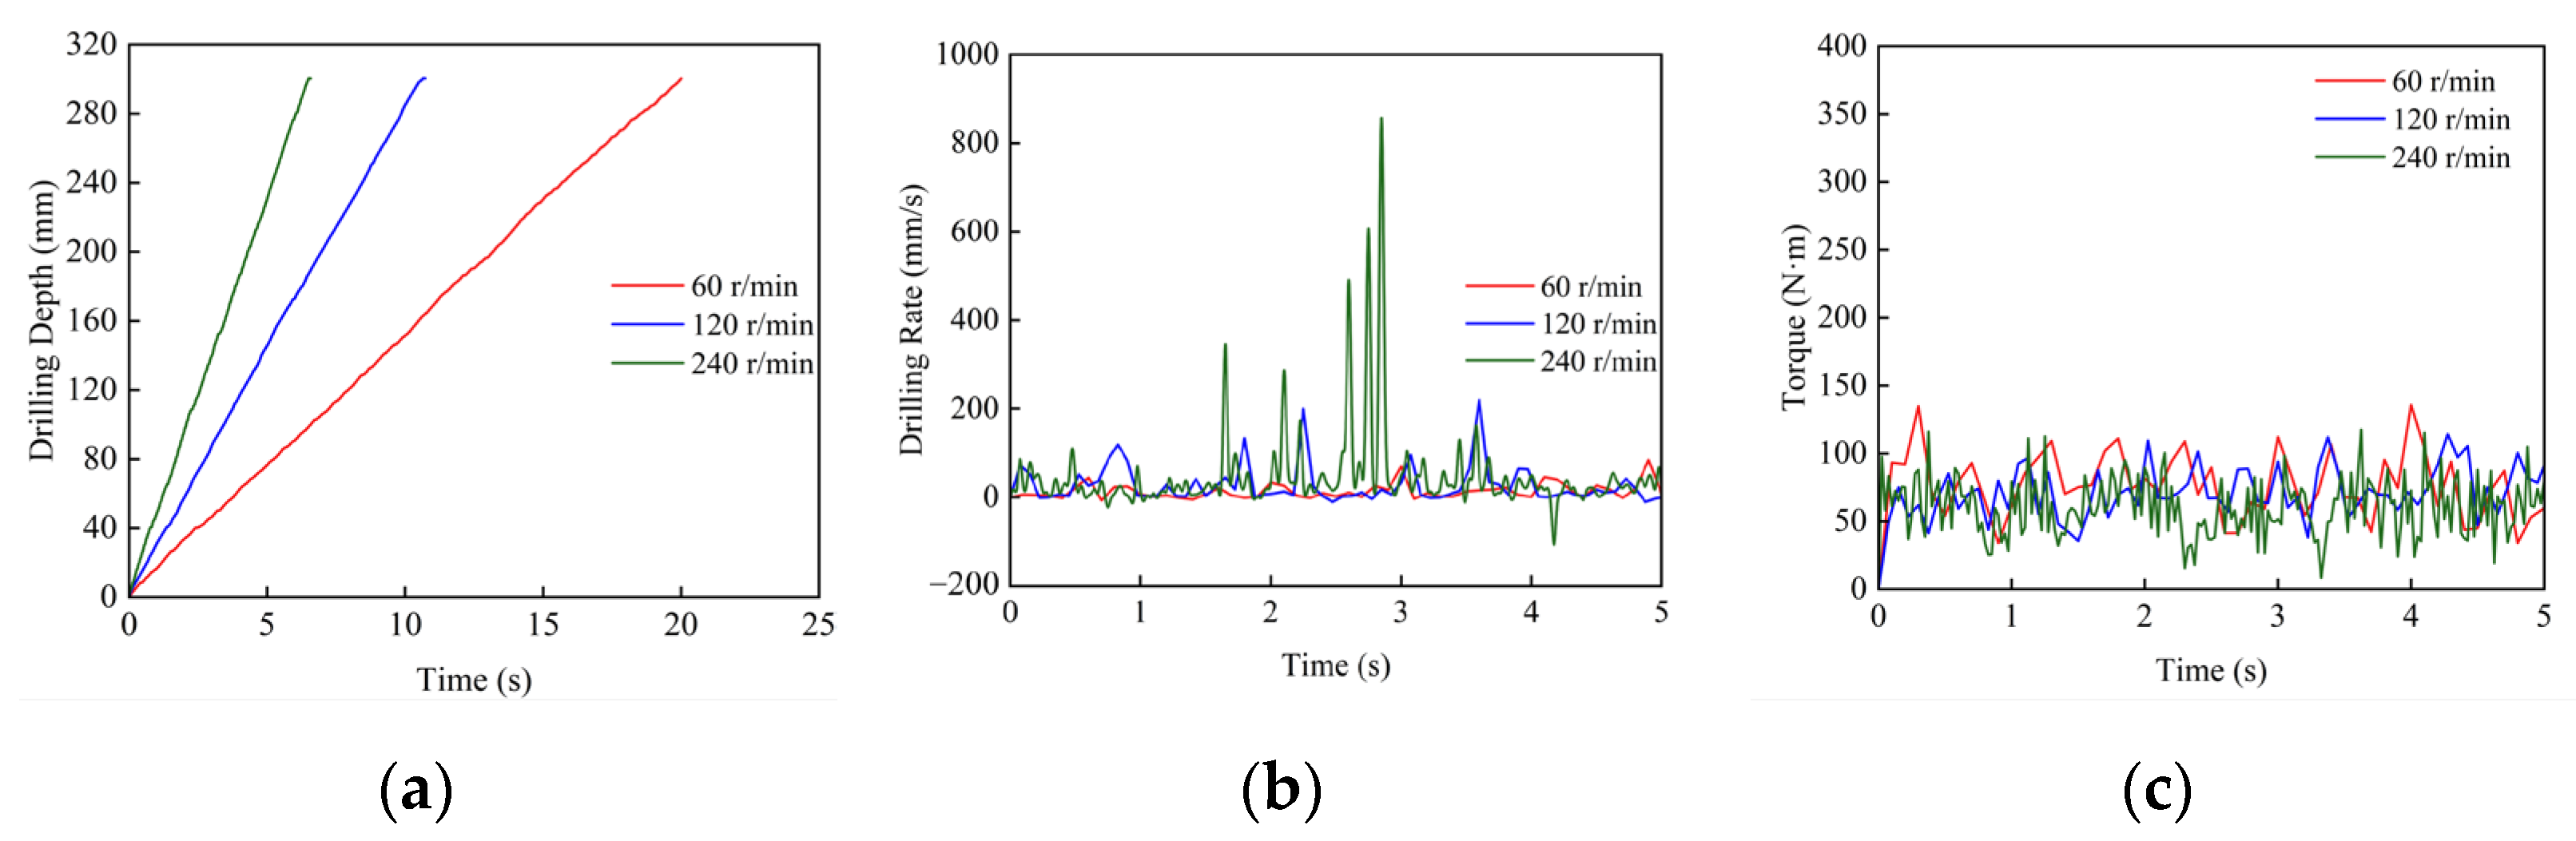
4.2. Analysis of Drilling Parameters Under Different Revolution Speed Conditions

In order to deeply explore the characteristic variation law of drilling parameters under different rotational speed conditions, this study carried out drilling simulation experiments on coal, mudstone, sandy mudstone, and siltstone. In the simulation process, the thrust of the drill bit is fixed at 5000 N. By changing the revolution speed of the drill bit, the time–drilling depth, time–drilling rate, and time–torque relationship curves of coal, mudstone, sandy mudstone, and sandstone under different revolution speeds are obtained, as well as the curves of torque and drilling rate with revolution speed, as shown in Figure 9, Figure 10, Figure 11, Figure 12 and Figure 13.
In Figure 9b, Figure 10b, Figure 11b, and Figure 12b, it can be seen that under a thrust of 5000 N, the drilling rate fluctuates greatly with time, and the higher the speed, the more violent the fluctuation. At 60 r/min, the drilling rates of coal, mudstone, sandy mudstone, and siltstone are 51.28 mm/s, 24.25 mm/s, 22.21 mm/s, and 15.01 mm/s, respectively. The drilling rate is at a low level for most of the time, and the fluctuation frequency is low. When the revolution speed is increased to 120 r/min, the drilling rates of coal, mudstone, sandy mudstone, and siltstone are 99.83 mm/s, 48.21 mm/s, 41.49 mm/s, and 28.20 mm/s, respectively. There will be relatively stable and strong cutting force, which can continuously break the rock and promote the stable drilling of the drill bit. Although there are still fluctuations in the follow-up, the fluctuation range is significantly reduced compared with the low revolution speed condition. This is because after the revolution speed increases, the continuity of the drill bit cutting will not be stuck or reversely pushed as at low of a revolution speed. The stable cutting frequency and relatively sufficient cutting force brought by the higher revolution speed make the drilling rate maintain a relatively stable fluctuation range. When the revolution speed is increased to 240 r/min, the drilling rates of coal, mudstone, sandy mudstone, and siltstone are 197.37 mm/s, 96.46 mm/s, 85.71 mm/s, and 46.15 mm/s, respectively. The fluctuation in the drilling rate is the most severe; not only is the fluctuation range large but also the fluctuation frequency is high. The friction between the drill bit and rock increases sharply at a high revolution speed. According to the relationship between friction and speed, this has a great interference on the drilling rate. Although it can reach a high positive peak at multiple time points, it shows high drilling efficiency at a high revolution speed. However, unstable fluctuations also mean that there are risks in the drilling process.
Through the analysis of the time–drilling depth change curves of Figure 9a, Figure 10a, Figure 11a, and Figure 12a, it can be seen that the slope increases with the increase in the revolution speed. Because the slope of time–drilling depth reflects the drilling rate in the physical sense, this phenomenon shows that the drilling rate increases with the increase in the revolution speed. In Figure 13a, it can be seen that the drilling rate also shows an upward trend with the increase in the revolution speed in the same rock, which also shows that the revolution speed and the drilling rate are positively correlated. Through the analysis of Figure 9c, Figure 10c, Figure 11c, and Figure 12c, it can be seen that the torques of coal, mudstone, sandy mudstone, and siltstone are 51.84 N·m, 56.96 N·m, 64.91 N·m, and 72.50 N·m, respectively, at a low speed of 60 r/min. At this speed, the torque growth is gentle. This is because, at the moment of start-up, the bit is just in contact with the rock surface, and it is necessary to gradually overcome the initial static friction force of the rock. In this process, the speed is relatively slow, making the torque growth rate more gentle; until the torque reaches the first peak, the variation range of the torque is limited to a small range, showing relatively gentle fluctuation characteristics. When the speed is 120 r/min, the torques of coal, mudstone, sandy mudstone, and siltstone are 48.95 N·m, 51.85 N·m, 63.04 N·m, and 67.47 N·m, respectively. At this speed, the initial fluctuation range for the torque is large. Compared with the case of 60 r/min, the higher speed gives the drill a stronger initial impact force, which can quickly break the initial resistance of the rock surface and break the rock strongly, making the torque explode instantly and grow rapidly. However, due to the higher speed, the cutting frequency is more efficient, and the torque fluctuation range increases when the rock knot is encountered. At a high revolution speed of 240 r/min, the torques of coal, mudstone, sandy mudstone, and siltstone are 44.28 N·m, 47.41 N·m, 58.01 N·m, and 61.13 N·m, respectively. At this speed, the torque cuts rapidly and fluctuates violently. The high speed gives the drill a higher kinetic energy, which can quickly break the rock, instantaneously producing a huge crushing force, and the torque also rises sharply. From the above analysis and Figure 13b displaying the speed–torque curve, it can be clearly seen that there is a significant negative correlation between speed and torque. The specific performance is that with the continuous increase in speed, the torque shows a corresponding decreasing trend.

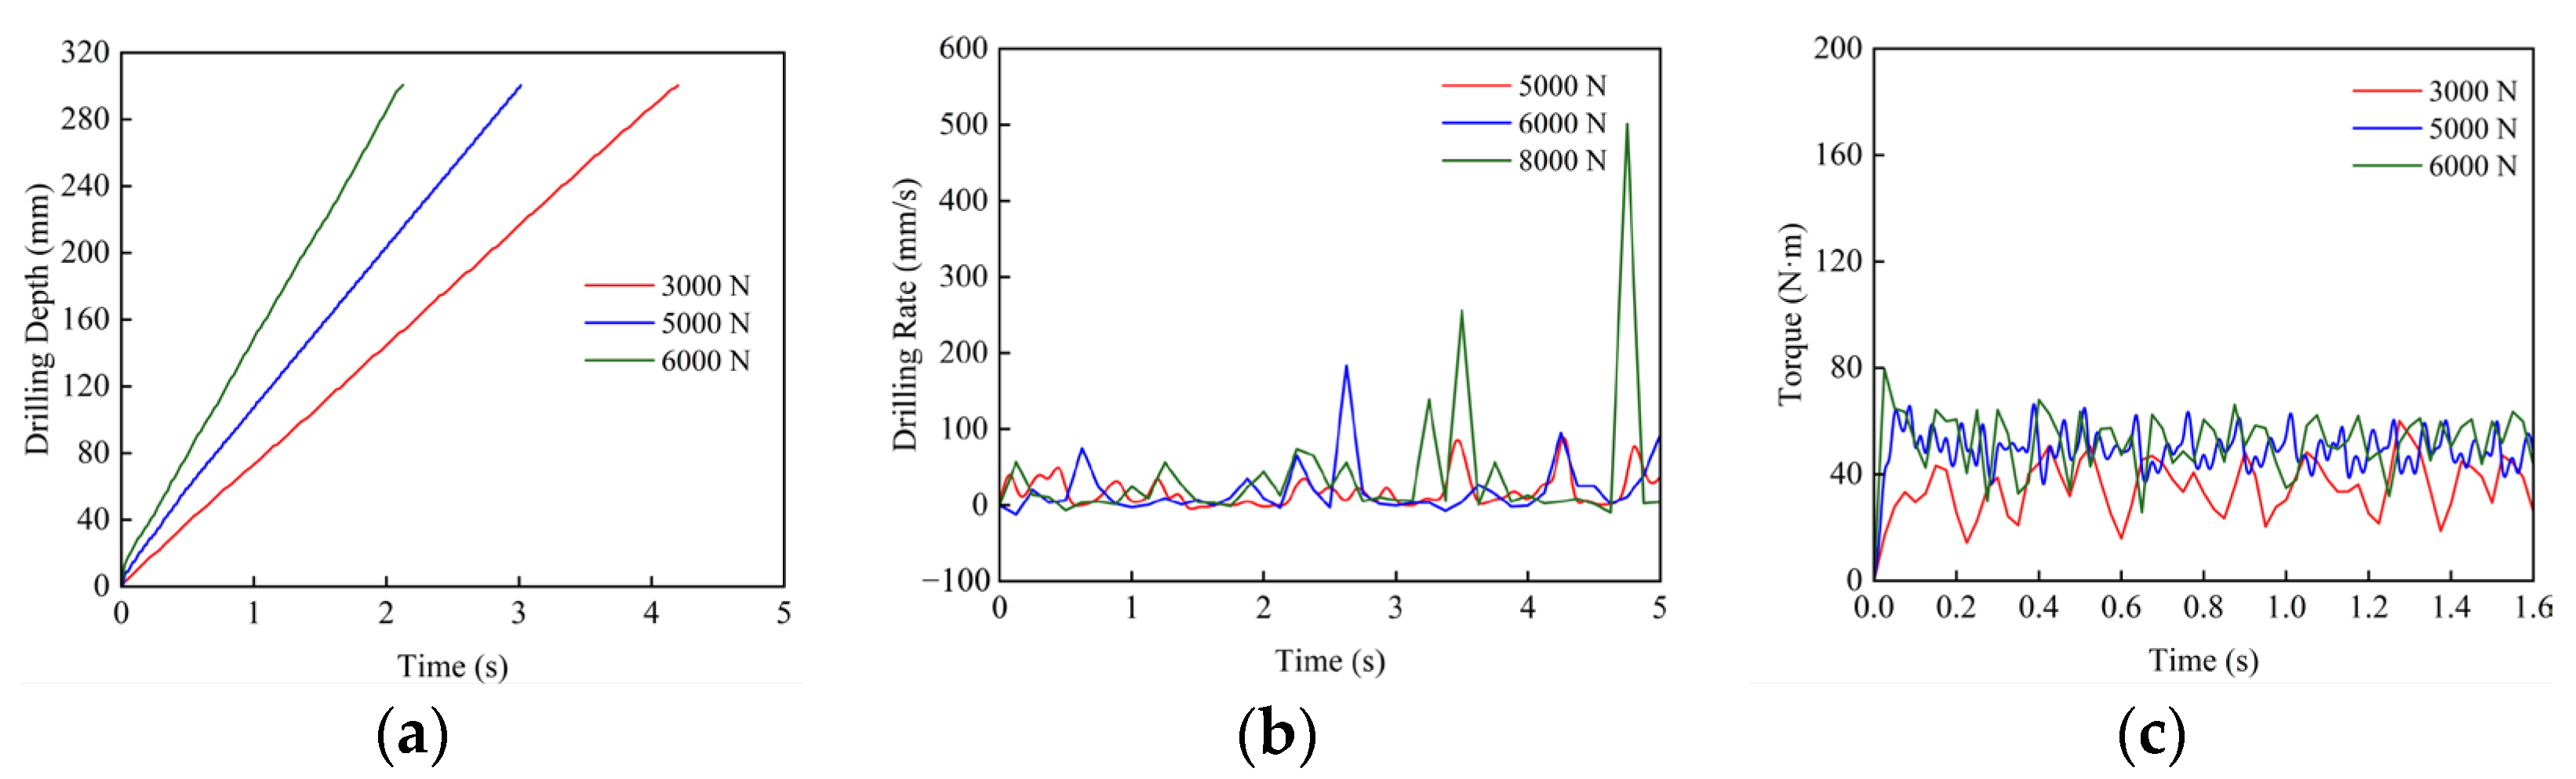
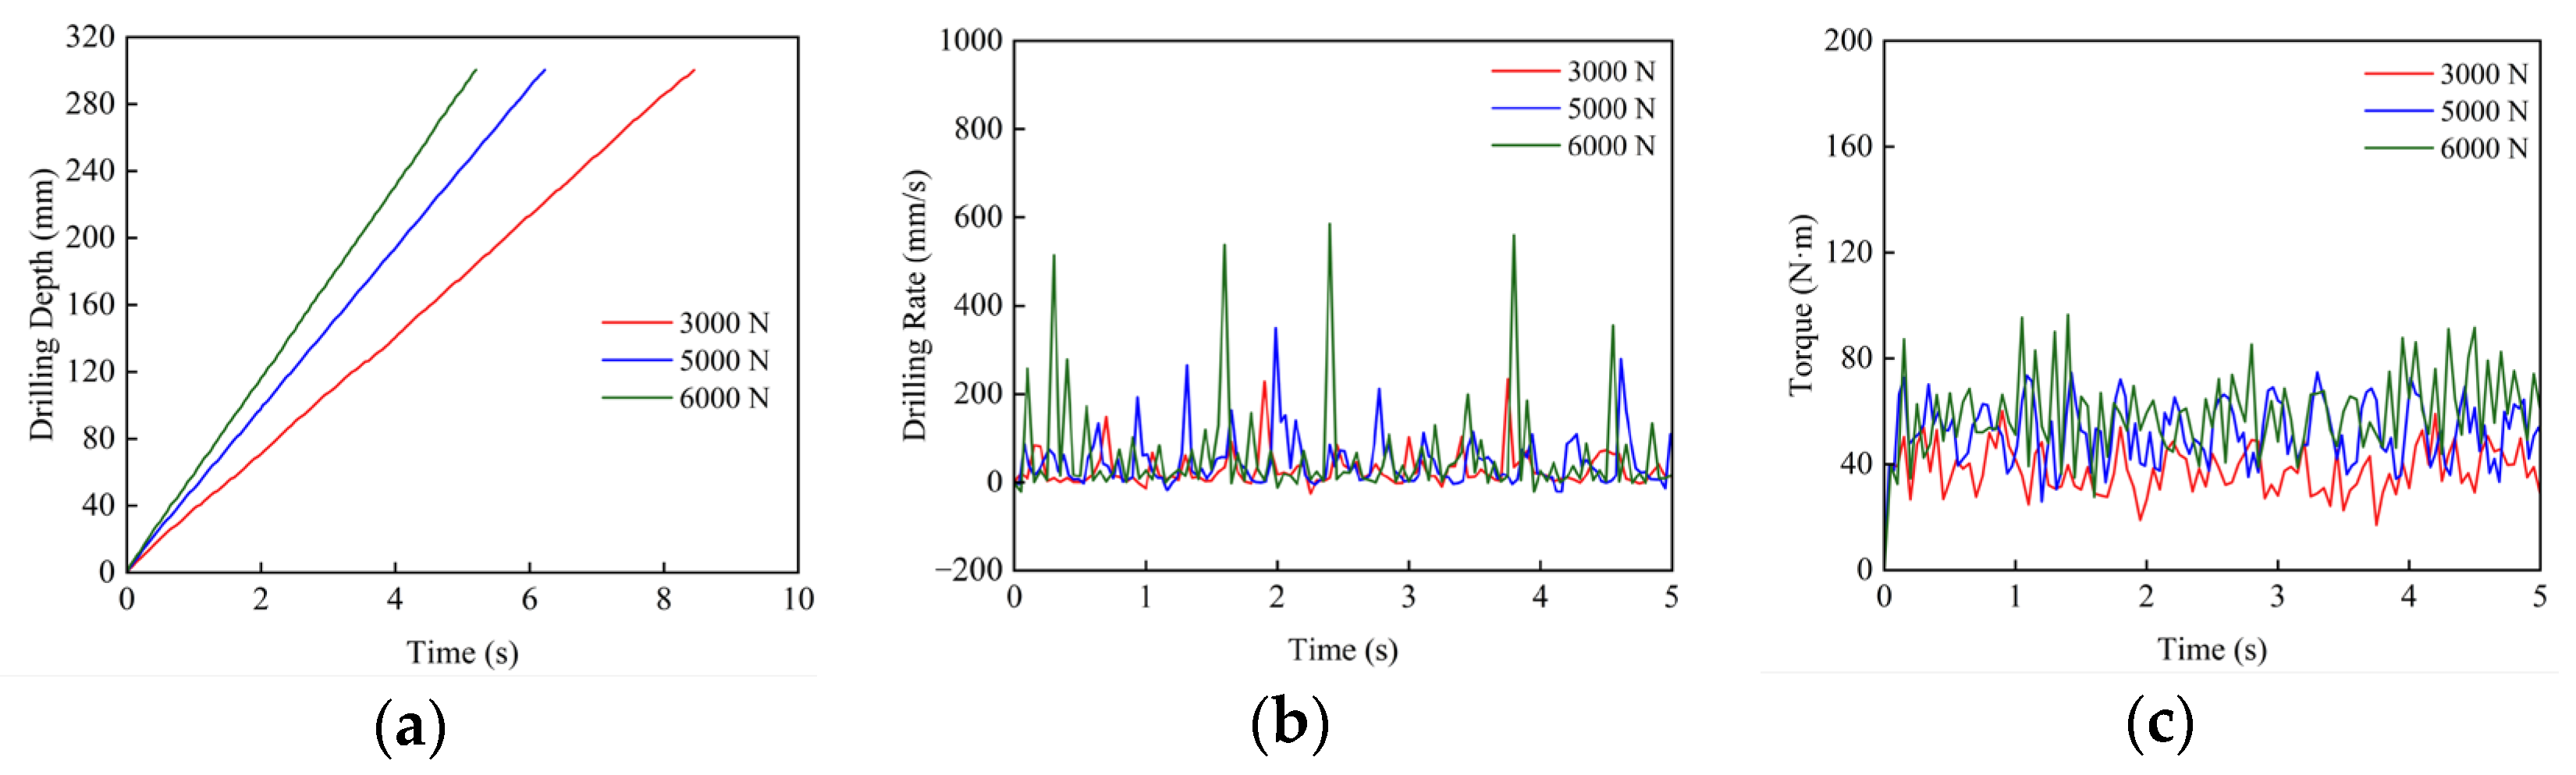
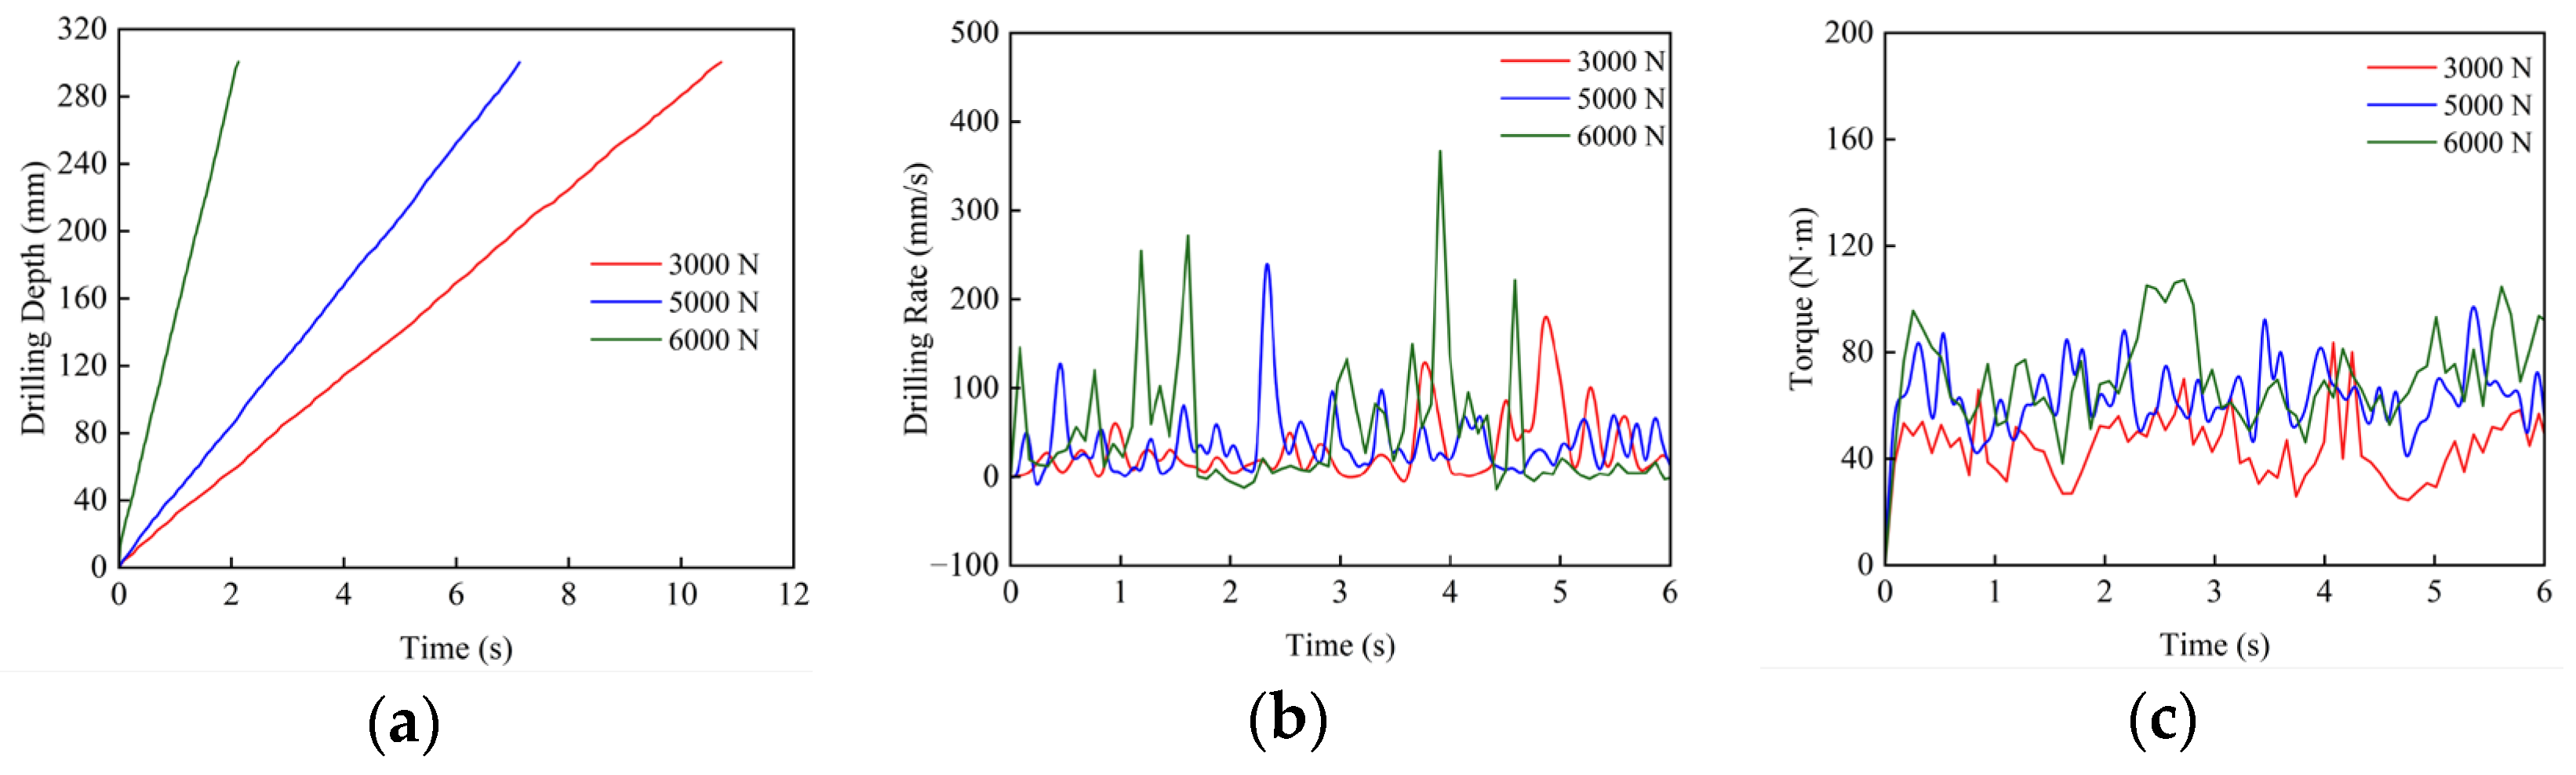
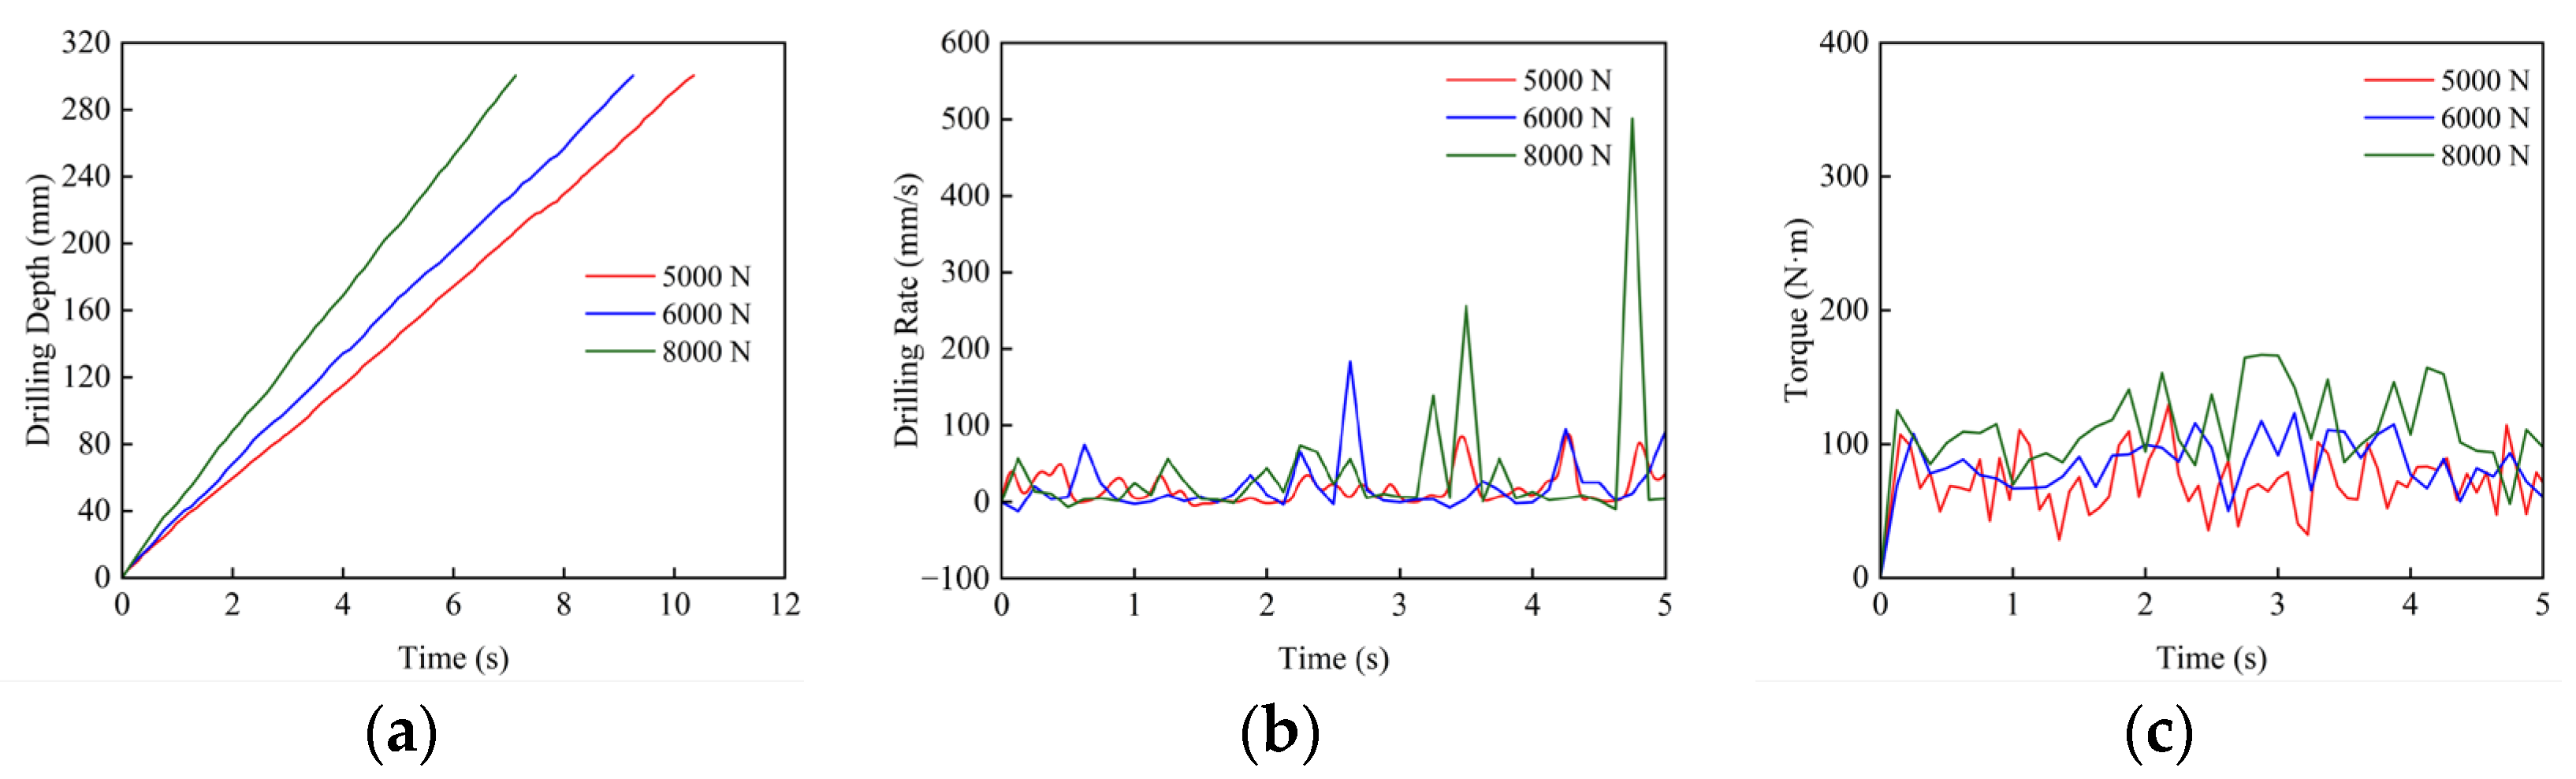
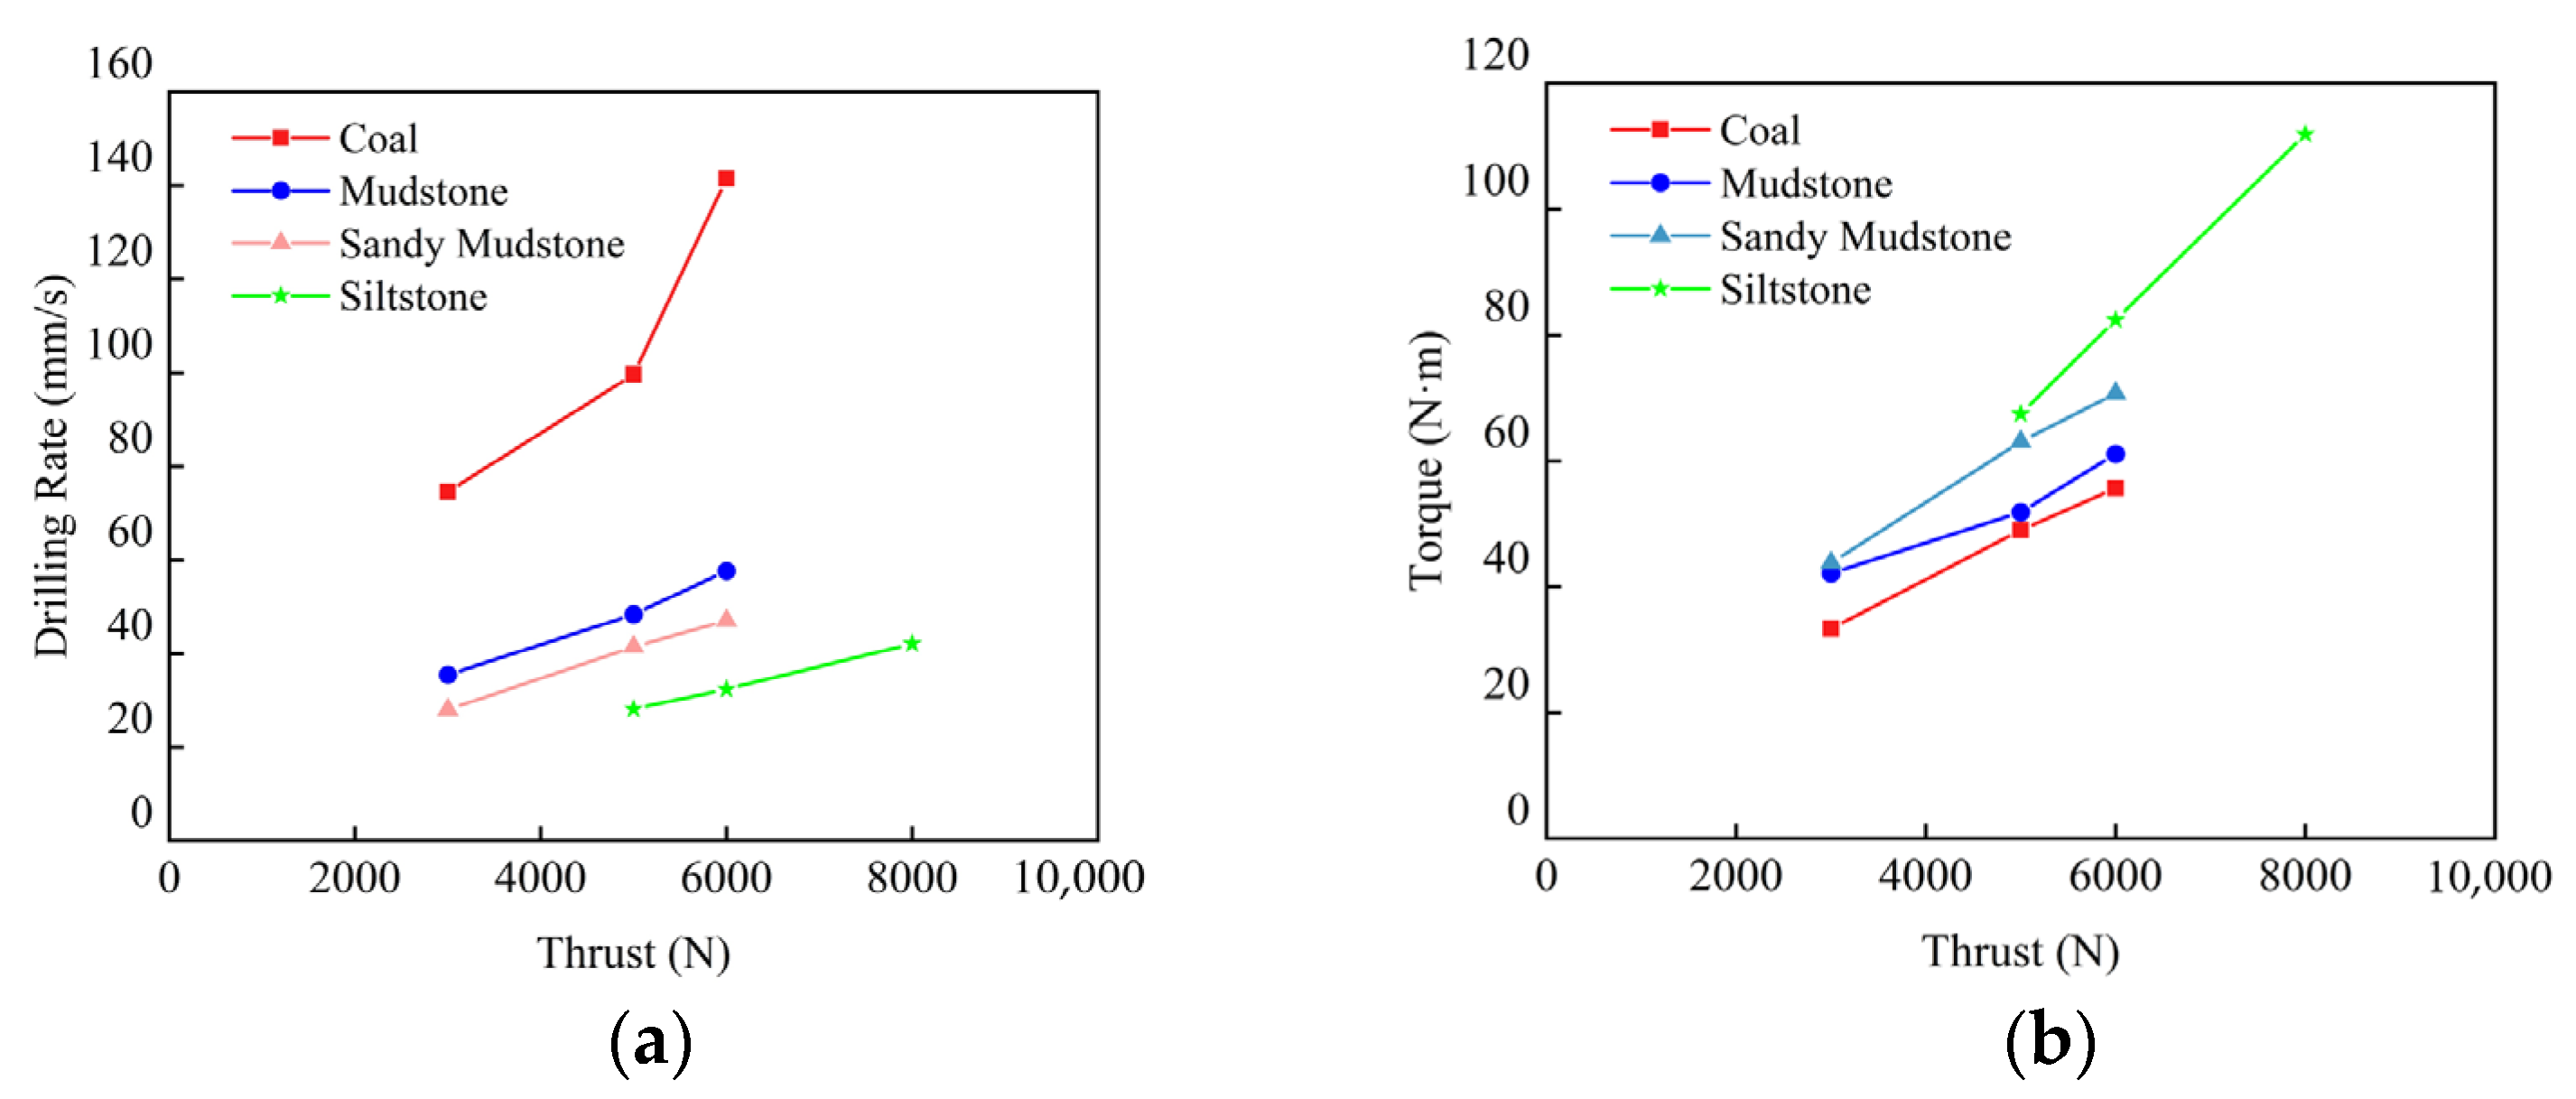
4.3. Analysis of Drilling Parameters Under Different Thrust Conditions

In order to compare and analyze the variation trend of the drilling rate and torque of each rock under different thrust conditions, in the numerical simulation, the revolution speed of the drill bit is fixed at 120 r/min. By changing the thrust, the time–drilling depth, time–drilling rate, and time–torque curves of drilling four kinds of rocks under different thrust levels are recorded, respectively, as well as the curves for the drilling rate and torque changing with thrust, as shown in Figure 14, Figure 15, Figure 16, Figure 17 and Figure 18.
Through the analysis of Figure 14b, Figure 15b, Figure 16b, and Figure 17b, it can be found that under the same thrust, due to the low strength of coal, mudstone, and sandy mudstone, even if the thrust is small, the drill bit can cut into the rock relatively easily. The siltstone has high strength and hardness, so it is difficult for the drill bit to cut into the rock effectively, and the drilling rate is very low. This is because when the thrust is at a low level, the contact pressure between the cutting edge of the drill bit and the rock is significantly lower than the compressive strength of the rock. Because the rock needs to overcome its own structural strength to break, when the thrust is small, the breaking of the rock is mainly due to the work accomplished by the contact friction between the cutting edge and the rock. This process is mainly to grind the rock, and the separated rock particles are extremely small, which leads to the drilling rate being not significant. When the thrust rises, the drill bit can be pushed relatively easily, and the drilling rate will rise rapidly with the increase in thrust. It can be seen from Figure 14a, Figure 15a, Figure 16a, Figure 17a, and Figure 18a that as the thrust continues to increase, the drilling rate of coal increases from 74.62 mm/s to 141.51 mm/s, the drilling rate of mudstone increases from 35.51 mm/s to 57.69 mm/s, and the drilling rate of sandy mudstone increases from 28.03 mm/s to 47.09 mm/s. The drilling rate of mudstone increases from 28.16 mm/s to 42.13 mm/s, and the drilling rate of all kinds of rocks will gradually increase accordingly, showing a significant positive correlation trend.
Through the analysis of Figure 14c, Figure 15c, Figure 16c, and Figure 17c, it can be seen that the variation law of torque in the drilling process of four kinds of rocks is basically the same. Taking coal as an example, when the thrust is 3000 N, the average value of torque is 38.33 N·m. At the initial moment of drilling, due to the small thrust, the initial pressure exerted by the drill bit on the rock surface is limited, and it is difficult to quickly break the initial resistance of the rock surface, making the torque close to 0. With the passage of time, the drill bit gradually cuts into the rock. However, due to the lack of thrust, it is relatively difficult to overcome the cohesion and friction of the rock, and the torque will jump sharply to try to break through the obstacles, thus forming multiple peaks and valleys, and the fluctuation range is large.
When the thrust increases to 5000 N, the average torque is 48.99 N·m. In the initial stage of drilling, the torque rises from zero due to the need to overcome the static friction on the rock surface. With the deepening of drilling, the larger thrust makes the drill bit more powerfully cut into the rock. Compared with the low thrust, it can drill into the rock faster, so the torque rises faster in the early stage and reaches a higher peak value. The drill bit will still encounter frequent resistance changes during drilling, resulting in continuous fluctuation of torque. Moreover, when the thrust of 5000 N is facing the same rock, although it has stronger rock breaking ability, it will also cause more severe friction and collision, making the torque fluctuation more obvious, and the overall torque value is higher than that of 3000 N of thrust most of the time.
When the thrust is further increased to 6000 N, the average torque is 55.67 N·m. At the initial moment of drilling, the bit is in close contact with the rock surface with strong thrust, and the torque rises rapidly. Due to the strong impact force brought by high thrust, it can drill into the rock surface faster, making the torque reach a higher value earlier. However, with the increase in drilling depth, the high-strength thrust not only breaks the rock but also triggers a more intense mechanical interaction between the drill bit and the rock. The reaction force of the rock on the drill bit is also larger and changes frequently, resulting in severe torque fluctuations, higher peak values, and generally maintaining high torque values throughout the entire time period. From the above analysis and Figure 18b, it can be seen that as the thrust continues to increase, the torque of various rocks during drilling will gradually increase accordingly, showing a clear positive correlation trend.

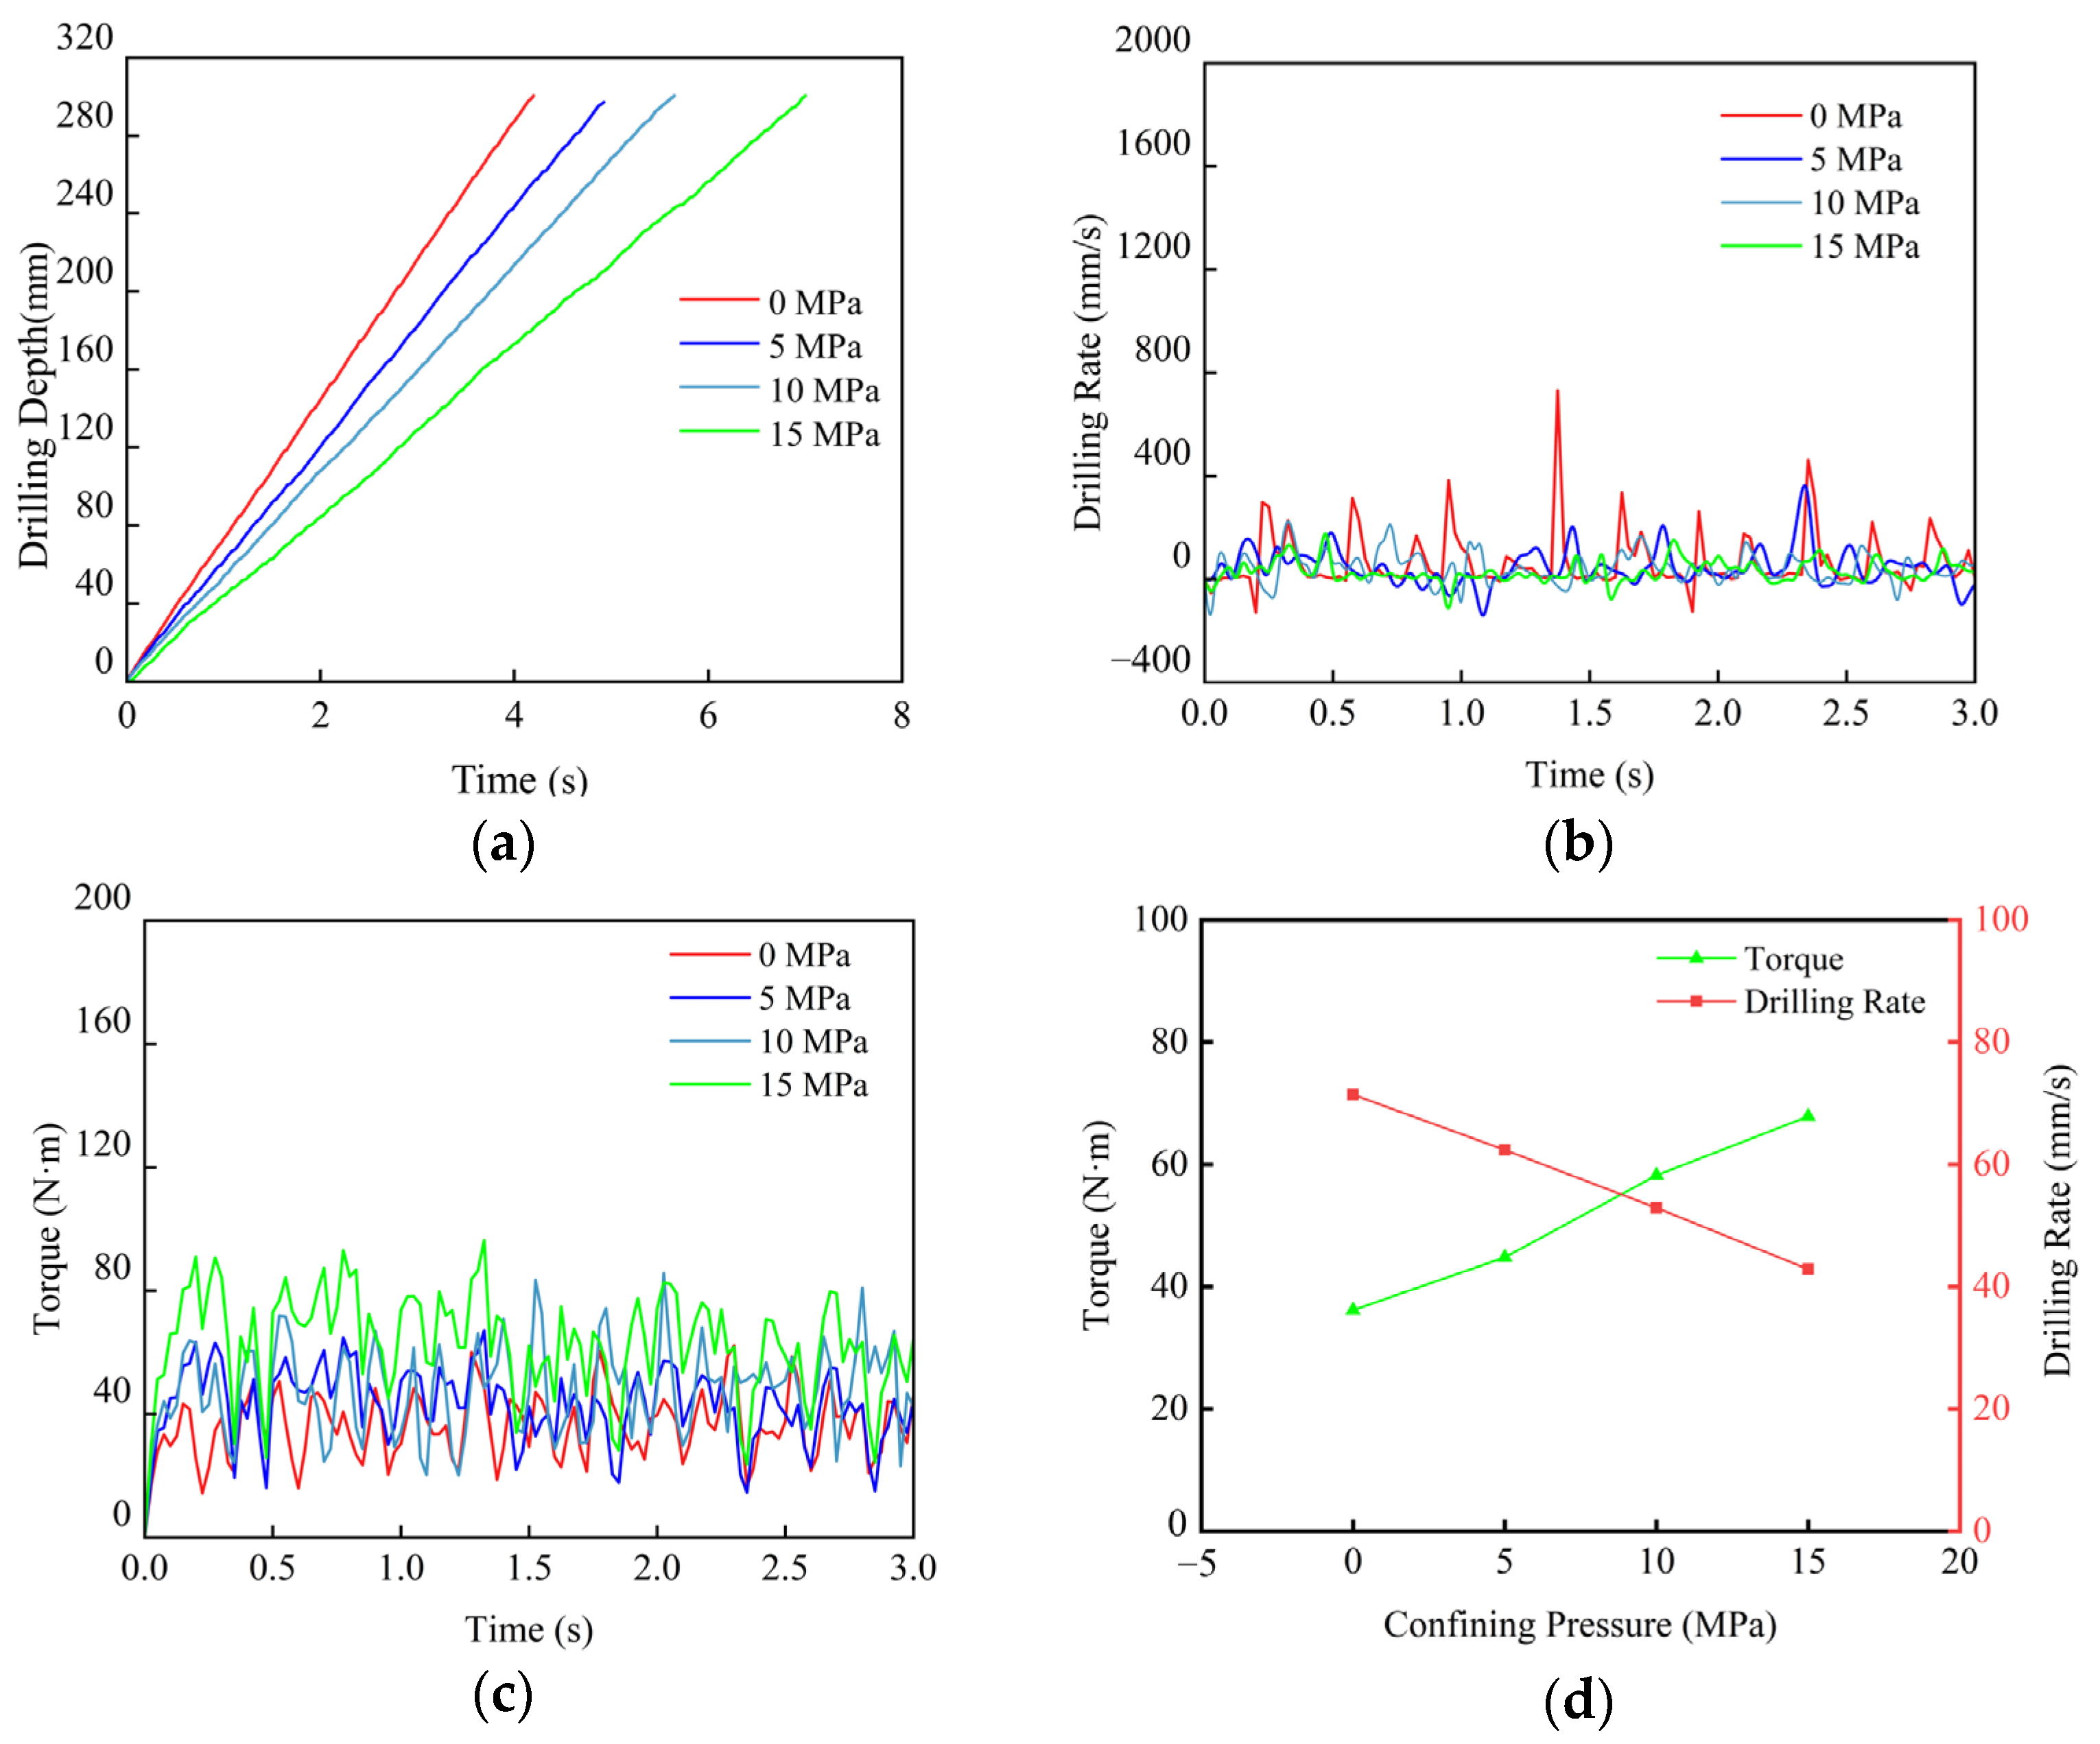
4.4. Analysis of Drilling Parameters Under Different Confining Pressure Conditions

According to the experimental scheme of Table 4, the numerical simulation experiment is carried out, and the variation curve of coal parameters while drilling under different confining pressure conditions and the stress cloud diagram of drilling for 1 s under different confining pressures are obtained as shown in Figure 19 and Figure 20.
From the analysis of Figure 19a–c, it can be seen that at the beginning of the drilling operation, the drilling rate and torque immediately show a sharp rise. However, with the continuous advancement of the drill bit, the torque will show a reciprocating fluctuation in a certain range. Regarding the motion mode, the drilling rate of the drill bit has the characteristics of dynamic change with displacement, and its value and direction at any given time are not the same. The instantaneous drilling rate of the drill bit rises rapidly to a certain value at the beginning of drilling, then decreases rapidly, and then shows a non-uniform fluctuation in a large range.
Under the condition of 3000 N of thrust and a revolution speed of 60 r/min, different confining pressures are applied to the specimen. The variation curves for the torque and drilling rate with confining pressure are shown in Figure 19d. The analysis shows that the average drilling rate of the drill bit is 71.42 mm/s when the confining pressure is 0 MPa. The average drilling rate of the drill bit is 62.37 mm/s when the confining pressure is 5 MPa. The average drilling rate of the bit is 52.91 mm/s when the confining pressure is 10 MPa. The average drilling rate of the drill bit is 42.85 mm/s when the confining pressure is 15 MPa. When the confining pressure increases from 0 MPa to 15 MPa, the drilling rate decreases from 71.42 mm/s to about 42.85 mm/s. It can be seen from Figure 20 that the drilling depth will gradually decrease with the increase in confining pressure within 1 s of drilling, which is also in line with the trend of a decreasing drilling rate with the increase in the confining pressure in the above analysis. In the absence of confining pressure, the rock stress is concentrated in the contact area of the bit, which is characterized by brittle fracturing, and the rock is easy to disintegrate locally, so the corresponding drilling rate is the fastest. As the confining pressure increases from 0 MPa to 15 MPa, the stress is gradually evenly distributed, the density and strength of the rock are improved, and the drill bit will be subjected to greater resistance during drilling, which ultimately leads to a decrease in the drilling rate.
When the confining pressure is 0 MPa, the average torque of the drill bit is 36.16 N·m. The average torque of the drill bit is 44.82 N·m when the confining pressure is 5 MPa. The average torque of the drill bit is 58.21 N·m when the confining pressure is 10 MPa. The average torque of the drill bit is 67.86 N·m when the confining pressure is 15 MPa. When the confining pressure is increased from 0 MPa to 15 MPa, the torque is increased from 36.16 N·m to 67.86 N·m, indicating that with the increase in the confining pressure, the constraint of rock on the drill bit is enhanced, resulting in an increase in the resistance that the drill bit needs to overcome during rotation, which in turn increases the torque. In the range of 0~5 MPa with lower confining pressure, the increase in torque is relatively gentle, which may be due to the fact that the compaction effect of confining pressure on rock is not significant at this time. In the range of 0~10 MPa, the torque growth rate is accelerated, indicating that the compaction effect of confining pressure on rock is gradually obvious, the rock strength is increased, and the resistance to the drill bit is increased rapidly. In the range of 10~15 MPa, the growth rate tends to be gentle, which may be because the compaction degree of rock under higher confining pressure is close to the limit, and the effect of further increases in the confining pressure on rock strength is weakened.
Through the above analysis, it can be seen that with the increase in the confining pressure, the average value of the drilling rate gradually decreases, the average value of the torque gradually increases, and the torque shows an increasing trend with the increase in the confining pressure. There is a negative correlation between the drilling rate and the confining pressure and a positive correlation between the torque and the confining pressure.
Based on the assumption that the drill bit is perpendicular to the rock specimen and the borehole does not deflect in the Section 3.2 drilling simulation reliability analysis, the numerical simulation results in this paper do not specifically consider the axiality of the hole. Therefore, the analysis results mainly reflect the response law of the parameters while drilling under the condition of axial stable drilling.

5. Conclusions

Aiming at the problem of in situ identification of rock mechanical parameters of coal and rock mass in mine, this paper takes the drilling pressure relief project of the deep roadway in the Guotun Coal Mine as the background and adopts the research paradigm of a multi-dimensional verification of numerical simulation and a field test to systematically reveal the coupling mechanism of confining pressure–lithology–drilling parameters. According to the geological data of the deep roadway in the Guotun Coal Mine, the material parameters of different lithologies (coal, mudstone, sandy mudstone, and siltstone) are set, and the stress environment under different confining pressure conditions of 0~15 MPa is simulated. Through the simulation experiment of mesoscopic damage drilling based on the ABAQUS platform, the dynamic response law between different lithologies (coal, mudstone, sandy mudstone, and siltstone), confining pressure conditions (0~15 MPa), and drilling parameters (drilling rate, thrust, and torque) is compared and analyzed. The aim is to provide a theoretical basis for on-site identification of rock mechanical parameters. In this paper, the drilling parameters are analyzed and discussed based on numerical simulation combined with on-site drilling pressure relief. The main findings are as follows:
(1)
At the same thrust–revolution speed level, the higher the strength of the rock, the greater the torque required for the drilling process and the slower the drilling rate. The average drilling rate of the four kinds of rock drilling is coal > mudstone > sandy mudstone > siltstone;
(2)
When the thrust is constant, with the increase in revolution speed, the drilling rate of coal, mudstone, sandy mudstone, and siltstone is approximately proportional to the linear increase, and the torque shows a negative correlation trend with the increase in the drilling rate. When the revolution speed is constant, with the increase in thrust, the drilling rate and torque of all kinds of rocks will gradually increase accordingly, showing a significant positive correlation trend;
(3)
With the increase in the confining pressure of the specimen, the average value of the torque increases gradually, and the average value of the drilling rate decreases gradually. There is an approximate linear negative correlation between drilling rate and rock confining pressure, and an approximate linear positive correlation between torque and rock confining pressure;
(4)
In this paper, the variation in parameters while drilling under different influence conditions is preliminarily studied. At the same time, there are also some shortcomings. For example, only four rock samples of coal, mudstone, sandy mudstone, and siltstone are selected for research, and other common rock types are not involved. The limited selection of rock types limits the universality of the research results. Therefore, future research can consider further increasing the types of rock samples (such as limestone, shale, etc.) and discuss the response characteristics of drilling parameters under complex geological conditions to further improve and expand the experimental results.

Author Contributions

Conceptualization, Methodology, Writing—review and editing: Y.J.; Writing—original draft, Visualization: Z.B. and Y.Z.; Conceptualization, Methodology, Funding acquisition, Supervision: D.G.; Investigation, Methodology: J.L. and H.L. All authors have read and agreed to the published version of the manuscript.

Funding

This research was funded by the Fundamental Research Funds for the Central Universities (No. 3142023005), the Science and Technology Support Project of Langfang (No. 2023013149), the National Natural Science Foundation of China (No. 52204101), and the Natural Science Foundation of Shandong Province (No. ZR2022QE137).

Institutional Review Board Statement

Not applicable.

Informed Consent Statement

Not applicable.

Data Availability Statement

Data associated with this research are available and can be obtained by contacting the corresponding author upon reasonable request.

Conflicts of Interest

Decheng Ge was employed by the company Shandong Energy Group Co., Ltd., Jinan, China, Yining Zheng was employed by the company Guotun Coal Mine, Shandong Energy Group Luxi Mining Co., Ltd., Heze, China. The remaining authors declare that the research was conducted in the absence of any commercial or financial relationships that could be construed as a potential conflict of interest.

References

  1. Fu, Z.L.; Wang, L. Comparative experimental study on point load strength and tension-compression strength of coal seam roof and floor rock. J. Rock Mech. Eng. 2013, 32, 88–96. [Google Scholar]
  2. Li, N.; Li, Q.; Song, L. A new idea for obtaining rock mechanics parameters based on rotary cutting. J. Rock Mech. Eng. 2015, 34, 323–329. [Google Scholar] [CrossRef]
  3. Yang, W.W.; Yue, Z.Q.; Tham, L.G. Automatic monitoring of inserting or retrieving SPT sampler in drillhole. Geotech. Test. J. 2012, 35, 420–436. [Google Scholar] [CrossRef]
  4. Gui, M.W.; Soga, K.; Bolton, M.D.; Hamelin, J.P. Instrumented borehole drilling for subsurface investigation. J. Geotech. Geoenviron. Eng. 2002, 128, 283–291. [Google Scholar] [CrossRef]
  5. Kahraman, S.A.I.R.; Bilgin, N.; Feridunoglu, C. Dominant rock properties affecting the penetration rate of percussive drills. Int. J. Rock Mech. Min. Sci. 2003, 40, 711–723. [Google Scholar] [CrossRef]
  6. Yu, Q.L.; Wang, Y.H.; Li, Y.; Cao, Y.S.; Pu, J.Y. Research progress on characterization of rock mass structure and mechanical parameters based on measurement while drilling. Met. Mine 2023, 45–58. [Google Scholar] [CrossRef]
  7. Tan, Z.Y.; Cai, M.F.; Yue, Z.Q.; Tan, G.H.; Li, Z.F. Drilling parameters are used to identify the interface of complex weathered granite strata in Hong Kong. J. Rock Mech. Eng. 2006, S1, 2939–2945. [Google Scholar]
  8. Teale, R. The Concept of Specific Energy in Rock Drilling. In International Journal of Rock Mechanics and Mining Sciences & Geomechanics Abstracts; Pergamon: Oxford, UK, 1965; Volume 2, pp. 57–73. [Google Scholar]
  9. Song, L.; Li, N.; Liu, F.Y. Feasibility study on the application of rotary penetration technology in harder strata. Geomechanics. Rock Soil Mech. 2011, 32, 635–640. [Google Scholar] [CrossRef]
  10. Yue, Z.Q. Drilling process monitoring (DPM) improves the evaluation method of engineering rock mass quality. J. Rock Mech. Eng. 2014, 10, 1977–1996. [Google Scholar] [CrossRef]
  11. Tan, Z.Y.; Yue, Z.Q.; Tan, G.H.; Li, Z.F. Diamond drilling specific work and real-time classification of weathered granite. J. Rock Mech. Eng. 2007, S1, 2907–2912. [Google Scholar]
  12. Wang, Q.; Qin, Q.; Gao, S.; Li, S.C.; Gao, H.K.; He, M.C.; Zhang, C. The relationship between digital drilling parameters and rock uniaxial compressive strength. Coal J. 2018, 43, 1289–1295. [Google Scholar] [CrossRef]
  13. Wang, Q.; Gao, H.K.; Jiang, Z.H.; Li, J.B. Development and application of digital drilling test system for surrounding rock of underground engineering. J. Rock Mech. Eng. 2020, 39, 301–310. [Google Scholar] [CrossRef]
  14. Shi, J.; Wang, J.; Liu, X. The Nonlinear Dynamics Simulation of Drill String-drill Bit-rock Based on ABAQUS. In Proceedings of the 2nd International Conference on Civil, Materials and Environmental Sciences, London, UK, 13–14 March 2015; Atlantis Press: Dordrecht, The Netherlands, 2015; pp. 454–457. [Google Scholar]
  15. Li, X.T. Experimental Study on Drilling Characteristics of Anchor Hole in Coal Roadway Roof. Master’s Thesis, Henan Polytechnic University, Jiaozuo, China, 2015. [Google Scholar]
  16. Liu, S.W.; Liu, D.L.; Feng, Y.L.; Li, X.T.; Shang, P.X. Influence of stress state on drilling speed of roof anchoring hole in coal roadway. Coal J. 2014, 39, 608–613. [Google Scholar] [CrossRef]
  17. Liu, S.W.; Feng, Y.L.; Liu, D.L. Numerical test of dynamic response characteristics of layered roof rock drilling in coal roadway. J. Rock Mech. Eng. 2014, S1, 3170–3176. [Google Scholar] [CrossRef]
  18. Lin, T.J.; Lian, Z.H.; Meng, Y.F.; Yang, B.; Wu, X.Z.; Xiao, Z. Finite element simulation of dynamic rock breaking in air drilling. J. Rock Mech. Eng. 2008, S2, 3592–3597. [Google Scholar]
  19. Che, D.; Smith, J.; Ehmann, K.F. Finite element study of the cutting mechanics of the three dimensional rock turning process. In Proceedings of the International Manufacturing Science and Engineering Conference, Charlotte, NC, USA, 8–12 June 2015; American Society of Mechanical Engineers: New York, NY, USA, 2015; Volume 56826, p. V001T02A021. [Google Scholar]
  20. Wang, S.Y.; Sloan, S.W.; Liu, H.Y.; Tang, C.A. Numerical simulation of the rock fragmentation process induced by two drill bits subjected to static and dynamic (impact) loading. Rock Mech. Rock Eng. 2011, 44, 317–332. [Google Scholar] [CrossRef]
  21. Zhang, G.H. Research on Rock Breaking Mechanism and Surrounding Rock State Identification Technology of PDC Bit. Master’s Thesis, China University of Mining and Technology, Xuzhou, China, 2015. [Google Scholar]
  22. Fu, M.X.; Liu, S.W.; Fan, K.; Bloomberg; Kang, Y.L.; Jia, H.S. Numerical simulation study on vibration characteristics of drill pipe drilling in roof anchoring hole of coal roadway. J. Min. Saf. Eng. 2019, 36, 473–481. [Google Scholar] [CrossRef]
  23. Liu, S.W.; Zhu, Q.K.; Jia, H.S.; Li, X.T. Dynamic response characteristics and identification of rock interface in coal roadway roof anchoring hole drilling. J. Min. Saf. Eng. 2017, 34, 748–753+759. [Google Scholar] [CrossRef]
  24. Liu, J.L.; Luan, M.T.; Xu, C.S.; Wang, J.L.; Yuan, F.F. Drucker-Prager criterion parameter characteristics analysis. J. Rock Mech. Eng. 2006, S2, 4009–4015. [Google Scholar]
  25. Shiyun, X.; Gao, L.; Zhe, W. Wang Drucker-Prager material consistent rate constitutive model. Eng. Mech. 2003, 4, 147–151. [Google Scholar]
  26. Liu, D.L. Study on the Dynamic Response Characteristics of Roof Anchoring Hole Drilling in Coal Roadway. Master’s Thesis, Henan Polytechnic University, Jiaozuo, China, 2014. [Google Scholar]
  27. Kong, S.T. Simulation Study on Rock Breaking of Rotary Drilling Rig. Master’s Thesis, China University of Geosciences (Beijing), Beijing, China, 2021. [Google Scholar] [CrossRef]
Figure 1. Drilling test in coal mine and sensor layout of drilling rig. (a) Coal mine underground drilling test diagram; (b) drilling car sensor layout.
Applsci 15 05977 g001
Figure 2. Drilling rate and torque dot plot. (a) No.1 hole; (b) No.2 hole.
Applsci 15 05977 g002
Figure 3. Numerical drilling model diagram. (a) Drilling model; (b) mesh subdivision; (c) rock load setting; (d) drill constraint; (e) profile of rock drilling process.
Applsci 15 05977 g003
Figure 4. Numerical simulation verification curve.
Applsci 15 05977 g004
Figure 5. Concentrated force diagram.
Applsci 15 05977 g005
Figure 6. Time–drilling depth curve.
Applsci 15 05977 g006
Figure 7. Time–torque curve.
Applsci 15 05977 g007
Figure 8. Time–drilling rate curve.
Applsci 15 05977 g008
Figure 9. Variation curves of drilling parameters of coal under different revolution speeds with thrust of 5000 N. (a) Time–drilling depth variation curve; (b) time–drilling rate variation curve; (c) time–torque variation curve.
Applsci 15 05977 g009
Figure 10. Variation curves of drilling parameters of mudstone under different revolution speeds with thrust of 5000 N. (a) Time–drilling depth variation curve; (b) time–drilling rate variation curve; (c) time–torque variation curve.
Applsci 15 05977 g010
Figure 11. Variation curves of drilling parameters of sandy mudstone under different revolution speeds with thrust of 5000 N. (a) Time–drilling depth variation curve; (b) time–drilling rate variation curve; (c) time–torque variation curve.
Applsci 15 05977 g011
Figure 12. Variation curves of drilling parameters of siltstone under different revolution speeds with thrust of 5000 N. (a) Time–drilling depth variation curve; (b) time–drilling rate variation curve; (c) time–torque variation curve.
Applsci 15 05977 g012
Figure 13. Variation curves of torque and drilling rate with revolution speed. (a) Different rock revolution speed–drilling rate change curve; (b) different rock revolution speed–torque change curve.
Applsci 15 05977 g013
Figure 14. The variation curve of drilling parameters of coal No.12 under different thrust conditions at 120 r/min. (a) Time–drilling depth variation curve; (b) time–drilling rate variation curve; (c) time–torque variation curve.
Applsci 15 05977 g014
Figure 15. Variation curves of drilling parameters of mudstone under different thrust conditions with revolution speed of 120 r/min. (a) Time–drilling depth variation curve; (b) time–drilling rate variation curve; (c) time–torque variation curve.
Applsci 15 05977 g015
Figure 16. Variation curves of drilling parameters of sandy mudstone under different thrust conditions at 120 r/min. (a) Time–drilling depth variation curve; (b) time–drilling rate variation curve; (c) time–torque variation curve.
Applsci 15 05977 g016
Figure 17. Variation curves of drilling parameters of siltstone under different thrust conditions at 120 r/min. (a) Time–drilling depth variation curve; (b) time–drilling rate variation curve; (c) time–torque variation curve.
Applsci 15 05977 g017
Figure 18. Variation curves of torque and drilling rate with thrust. (a) Thrust–drilling rate variation curves of different rocks; (b) thrust–torque variation curves of different rocks.
Applsci 15 05977 g018
Figure 19. Drilling parameter curves of coal under different confining pressure conditions. (a) Time–drilling depth variation curve; (b) time–drilling rate variation curve; (c) time–torque variation curve; (d) confining pressure–torque and confining pressure–drilling rate variation curves.
Applsci 15 05977 g019
Figure 20. Stress cloud diagram of drilling for 1 s under different confining pressures. (a) 0 MPa; (b) 5 MPa; (c) 10 MPa; (d) 15 MPa.
Applsci 15 05977 g020
Table 1. Field data of measurement while drilling.
Drilling Depth/mTorque of No.1 hole/(N·m)Drilling Rate of No.1 Hole/(m/min)Torque of No.2 Hole/(N·m)Drilling Rate of No.2 Hole/(m/min)
1471.86.3373.13
2389.52.9471.82.6
3384.13548.72
4477.32.4510.22.6
5455.42.7488.32.1
6466.42.8504.82.6
7625.52.4444.42.7
8471.92.5499.32.7
9570.62.6460.92.7
10532.22.3482.82.7
11460.92.7482.82.7
12477.32.5471.82.7
13548.72.8477.32.6
14581.62.1488.32.7
15477.32.6482.82.6
16477.32.6477.32.6
17471.82.7455.42.6
18466.42.7477.32.6
19488.32.6471.82.6
20460.92.4504.82.6
Table 2. Main physical properties of rock.
Rock TypeCoalMudstoneSandy MudstoneSiltstone
Density
/(g/cm3)
1.352.662.612.88
Elastic Modulus/GPa2.809.5010.0031.60
Poisson Ratio0.230.260.270.30
Uniaxial Compressive Strength/MPa21.3038.2048.0083.00
Angle of Friction28.0038.0048.0029.90
Table 3. Drilling simulation experiment scheme.
Rock TypeThrust/(N)Revolution Speed
/(r/min)
Coal500060, 120, 240
Mudstone
Sandy Mudstone
Siltstone
Coal3000, 6000120
Mudstone
Sandy Mudstone6000, 8000
Siltstone
Table 4. Numerical simulation experiment scheme under different confining pressure conditions.
Rock TypeConfining Pressure /MPaThrust /NRevolution Speed
/(r/min)
Coal03000120
5
10
15
Disclaimer/Publisher’s Note: The statements, opinions and data contained in all publications are solely those of the individual author(s) and contributor(s) and not of MDPI and/or the editor(s). MDPI and/or the editor(s) disclaim responsibility for any injury to people or property resulting from any ideas, methods, instructions or products referred to in the content.

