Article

Modeling the Future of Liquefied Natural Gas Transportation: Regression Analysis of Historical Data and Fleet Development Scenarios

Faculty of Maritime Studies, University of Split, 21000 Split, Croatia
*
Author to whom correspondence should be addressed.
Appl. Sci. 2025, 15(11), 5973; https://doi.org/10.3390/app15115973
Submission received: 28 March 2025 / Revised: 22 May 2025 / Accepted: 22 May 2025 / Published: 26 May 2025
(This article belongs to the Section Marine Science and Engineering)

Abstract

:
The analysis conducted in this paper observes long-term trends in the LNG transportation market with a tendency to predict its future development by applying market patterns and variables that follow changes in the historical period. The basis of this paper is a previous study that provided an analysis of this sector until the end of 2024 using linear regression. A comparison of the predictions with the results obtained showed that these predictions were mostly accurate, with a small deviation in LNG trade volume (10.9%), LNG fleet size (12.7%), and the number of countries exporting LNG (5%). The largest deviation was in the propulsion systems for new ships, where a new system (ME-GA) was introduced but later abandoned. Based on previous studies and current data, a forecast was made until the end of 2029, which shows that the LNG market will continue its growth and the LNG trade volume will exceed 450 MT by the end of this decade. As a result, the LNG fleet will grow to over 900 vessels. The data on the propulsion types of the LNG fleet show that the trend shown in previous studies will continue, namely that this LNG fleet will be powered by XDF and MEGI plants.

1. Introduction

In recent decades, man-made environmental damage has come to the fore, leading to a greater emphasis on the responsible and sustainable use of our planet’s resources. The rapid growth of the world’s population, heavy reliance on fossil fuels, resource exploitation, industrial expansion, and globalization have led to significant pollution and climate change. The effects of these activities are becoming increasingly clear and widespread, and the risks of climate change are already being felt in many regions of the world. This has raised awareness of the need to adapt to climate change and efforts to reduce pollution. As a result, the use of green energy sources that minimize the negative impact on the environment is increasingly being promoted. In this context, liquefied natural gas (LNG) is becoming increasingly important in the global energy landscape, particularly due to its versatility in the transportation sector. A 2018 study predicts that LNG will account for more than 60% of global gas trade by 2040 [1]. LNG is mainly transported by ship, although a significant proportion is still transported via pipelines. It is well known that transportation by ship costs much less than transportation via onshore infrastructure. The main advantage is that it can be delivered to locations that do not need to be in close geographical proximity to the customer and do not require extensive and expensive transportation facilities [2]. Thanks to innovations in LNG transportation and LNG technology, trade is no longer limited by pipeline infrastructure, allowing natural gas to be delivered to regions where pipelines are unavailable or impractical [3]. This makes the transportation of LNG by sea particularly advantageous, as exporters can deliver the gas to any location with a liquefaction facility, while importers can source the gas from any region with such facilities [4]. In addition, LNG transported by sea is generally purer than pipeline gas. The liquefaction process removes most impurities, a step that is not normally required for pipeline transportation [5].
Since the early 2000s, global LNG production capacities have increased more than eightfold [6]. This growth has been accompanied by a significant increase in global gas trade, which rose from 100 million tons in 2000 to 1029.9 million tons in 2024, as various studies show [7,8,9]. According to Galczynski et al., the LNG sector now accounts for more than 30% of the global energy market [10]. Considering the continuous growth of the world population, Danilov et al. assume that the demand for LNG will continue to rise, leading to a further increase in both production capacity and consumption [11]. In addition, Nikhalat et al. predict that technological advances will reduce investment costs for LNG projects, while improvements in global infrastructure will increase market liquidity and business opportunities in the LNG sector [12]. In a similar study on the Russian Yamal LNG project, Razmanova et al. predict that the development of the Northern Sea Route and Arctic regions will contribute to greater LNG trade volumes while increasing the Russian LNG production capacity [13].
LNG is increasingly seen as an alternative fuel for various types of transportation [14,15,16]. With the introduction of stricter environmental regulations in the shipping industry, LNG has gained attention as a fuel, and numerous studies have highlighted its benefits [17,18,19,20]. Although LNG offers certain advantages compared to other fossil fuels, its use still results in significant CO2 emissions, an issue that has been studied by Jing et al. and Katebah et al. [21,22,23]; these authors conducted assessments on current and future air emissions in the shipping sector, similar to the analyses of Righi et al. and Ytreberg et al. [24,25]. Collecting data on the LNG market and trade is essential for evaluating company performance and understanding market dynamics. The aim of this research is to analyze the changes in the LNG market over time and predict trends for the period after 2024.
This paper follows from the study by Stanivuk et al., in which the overall forecast of the future LNG market and fleet behavior for the period from 2019 to 2024 was analyzed [26]. A brief review of these predictions showed quite good accuracy, but also that the predicted results differ from the actual results. Moreover, the period for which the prediction was made is about to expire, and this analysis should predict what will happen in the LNG market in the coming period. The combination of these two facts led to the main objective of this paper, which is to evaluate the quality of the previous prediction and, if it is good, to make a new prediction for the next five years on the same basis. In addition, this new research highlights an anomaly, namely the introduction and subsequent disappearance of the new propulsion system, which clearly shows how an unexpected event can affect predictions.
This paper aims to address key gaps in the existing research by exploring the following questions: Has a concept or new idea remained entirely unexamined? Is there a question or problem within a specific field that existing studies have yet to resolve? Is the available literature on the topic outdated? Has a particular population, location, or age group been overlooked in previous research? These predictions should be useful for researchers in the field as well as experts in analyzing future developments. The comparison between previous studies and the actual figures is explained in Section 3.

2. Research Methodology

Linear regression is a simple and powerful tool for modeling and understanding relationships between variables. This technique is usually one of the first to be learned in the fields of data science and machine learning. It is a statistical approach to modeling the relationship between a dependent variable (also called a response or target) and one or more independent variables (called predictors or features). The goal of linear regression is to find the best fit line (or a hyperplane in higher dimensions) that predicts the dependent variable based on the values of the independent variables.
This paper uses Excel, a diagnostic program widely used in various industries, to predict and analyze market behavior over time based on the results of a basic qualitative analysis [27]. The forecasting method involved the creation of an Excel database into which valuable research data were incorporated to predict LNG market trends and fleet behavior. The data used came from IGU World Reports, BP Statistical Reviews, and Environmental Impact Statements, combining insights from different data sets [7,28,29].
The results are clear, accurate, and easy to interpret for the readers. For this study, background data collected over a decade were entered into an Excel spreadsheet, allowing for the calculation of average growth rates for various LNG market and trade elements. These growth rates were then used to forecast market dynamics for the next five years, with projections extending to 2030. The corresponding diagrams show these projections [28,29]. The same forecasting method was also used in the earlier study by Stanivuk et al. [26]. In this study, the same methods were used to compare the actual results with those of the above-mentioned study.
Linear regression is a simple and powerful tool for modeling and understanding relationships between variables. This technique is usually among the first learned in data science and machine learning. It is a statistical approach used to model the relationship between a dependent variable (also called a response or target) and one or more independent variables (called predictors or features). The goal of linear regression is to find the best fitting line (or a hyperplane in higher dimensions) that predicts the dependent variable based on the values of the independent variables.

3. Analysis of the Previous Prediction

An initial review of the given predictions has shown that there are certain deviations from the actual results [26]. In this chapter of the research paper, the actual difference between the earlier predictions of Stanivuk et al. and the actual results will be shown, with everything simplified by the Excel tables to facilitate comparison. It is important to point out that the difference between the orange and green Excel lines shows the difference between the earlier research results and the actual data [7].

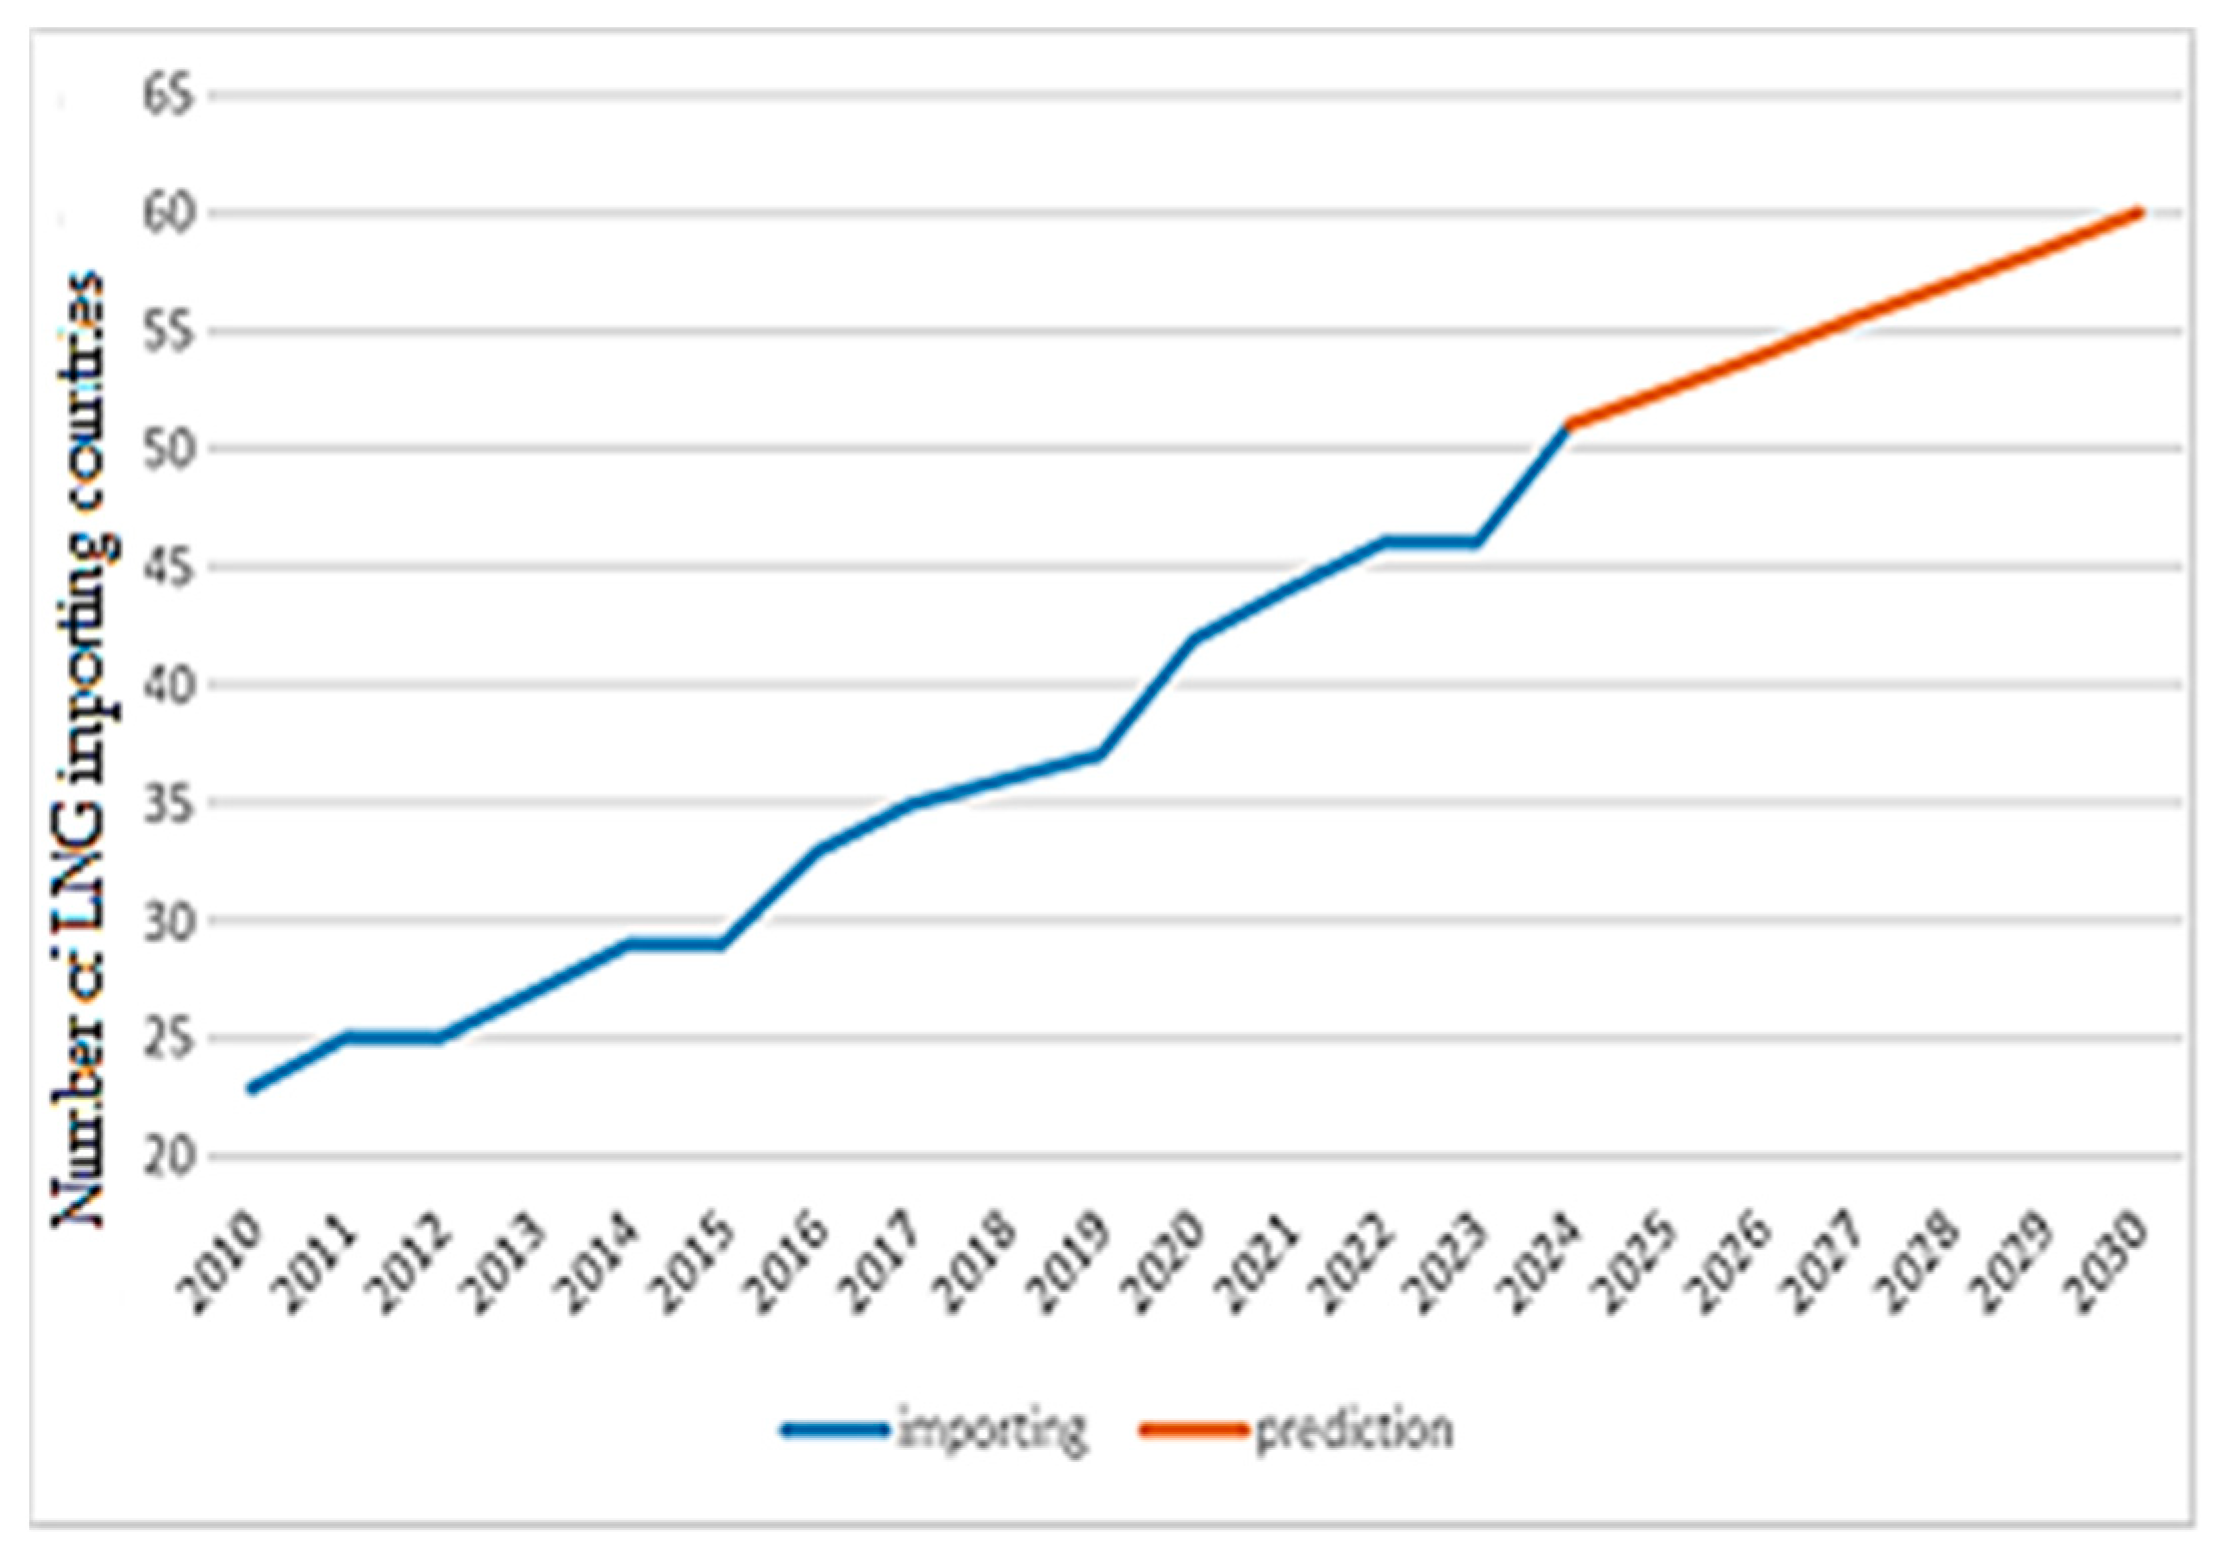
3.1. LNG-Importing Countries Comparison

Stanivuk et al. forecast a development in the number of LNG importers in the period from 2019 to 2025 [26]. The comparison between this forecast and the actual data for the period up to 2024 is shown in Figure 1.
According to the prediction by Stanivuk et al., the number of importing countries was not correct at the end of the prediction period, even if it was correct in 2020 and 2023 [26,30]. The differences during the forecast period are shown in Table 1.
Table 1 shows that the overall prediction of Stanivuk et al. was not correct at the end of the prediction period [26]. The actual situation shows that the import market has developed in a positive direction, better than predicted in the previous study.

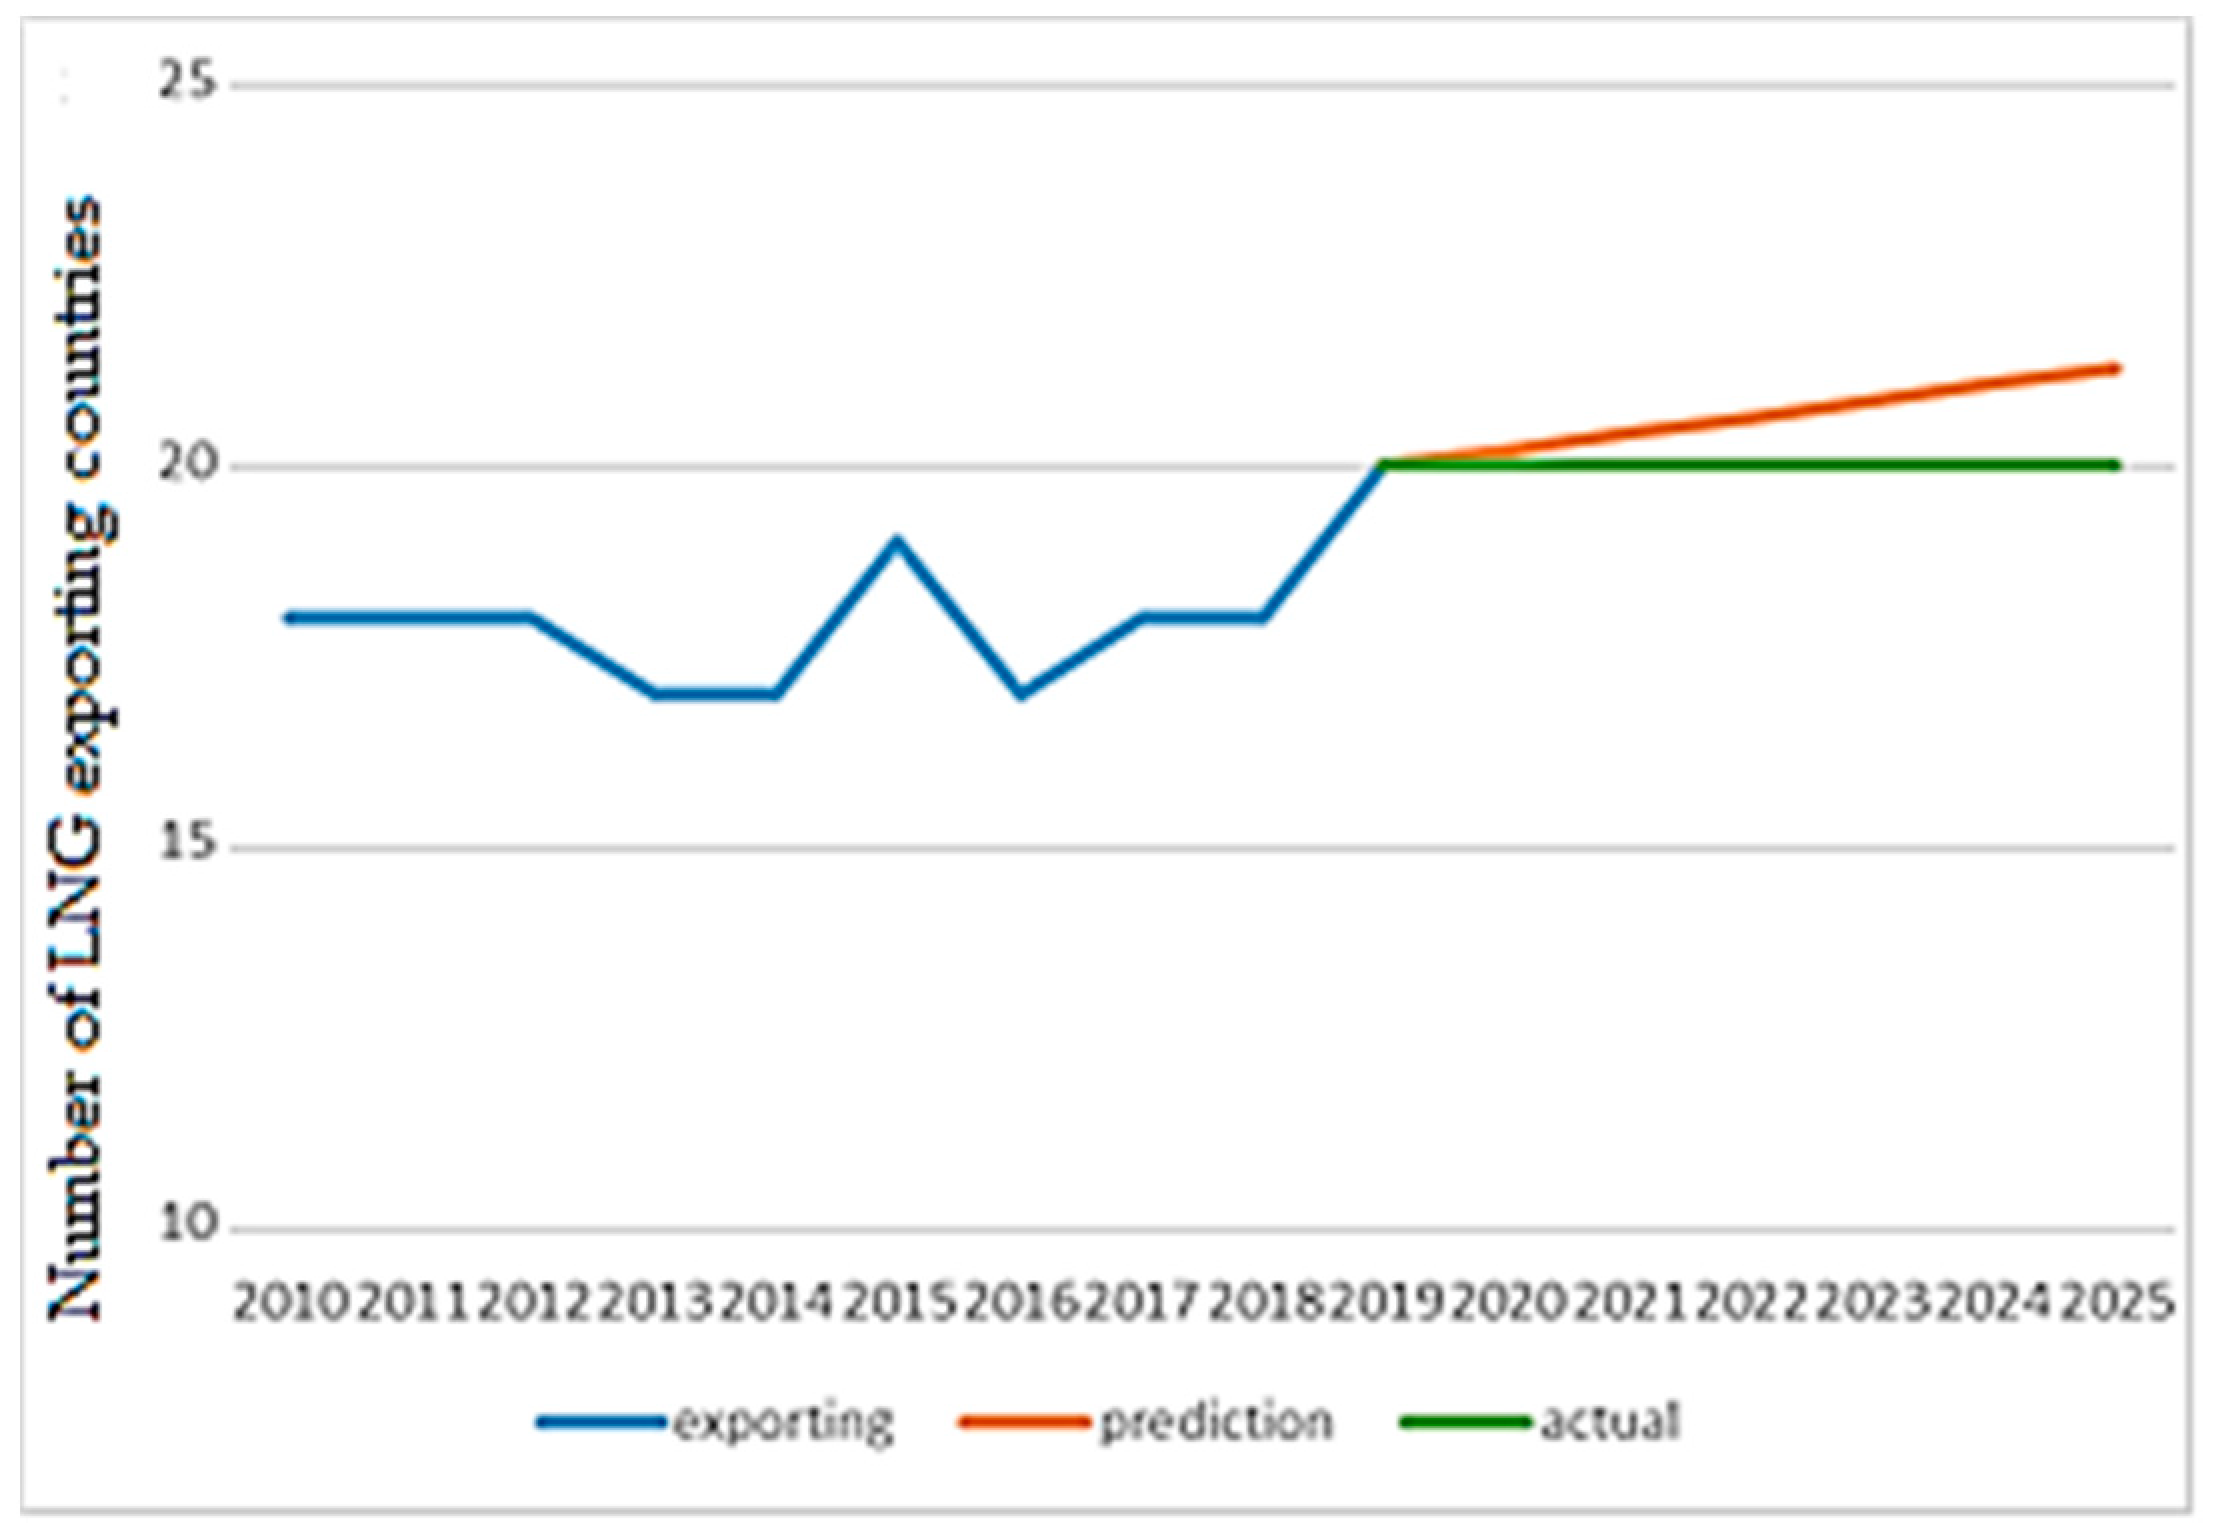
3.2. LNG-Exporting Countries Comparison

In the forecast, a development in the number of LNG exporters was predicted for the period from 2019 to 2025 [26]. The comparison between this forecast and the actual data is shown in Figure 2.
For the period analyzed, Stanivuk et al. predicted 21 countries exporting LNG to customers, while the actual number is 20, as shown in the International Gas Union 2024 World LNG report [7,26]. This difference is also shown in Table 2.
Table 2 shows that the prediction differs slightly from the actual data, although the difference concerns only one exporting country [26,30,31]. Therefore, this prediction can be considered very accurate for the end of this period.

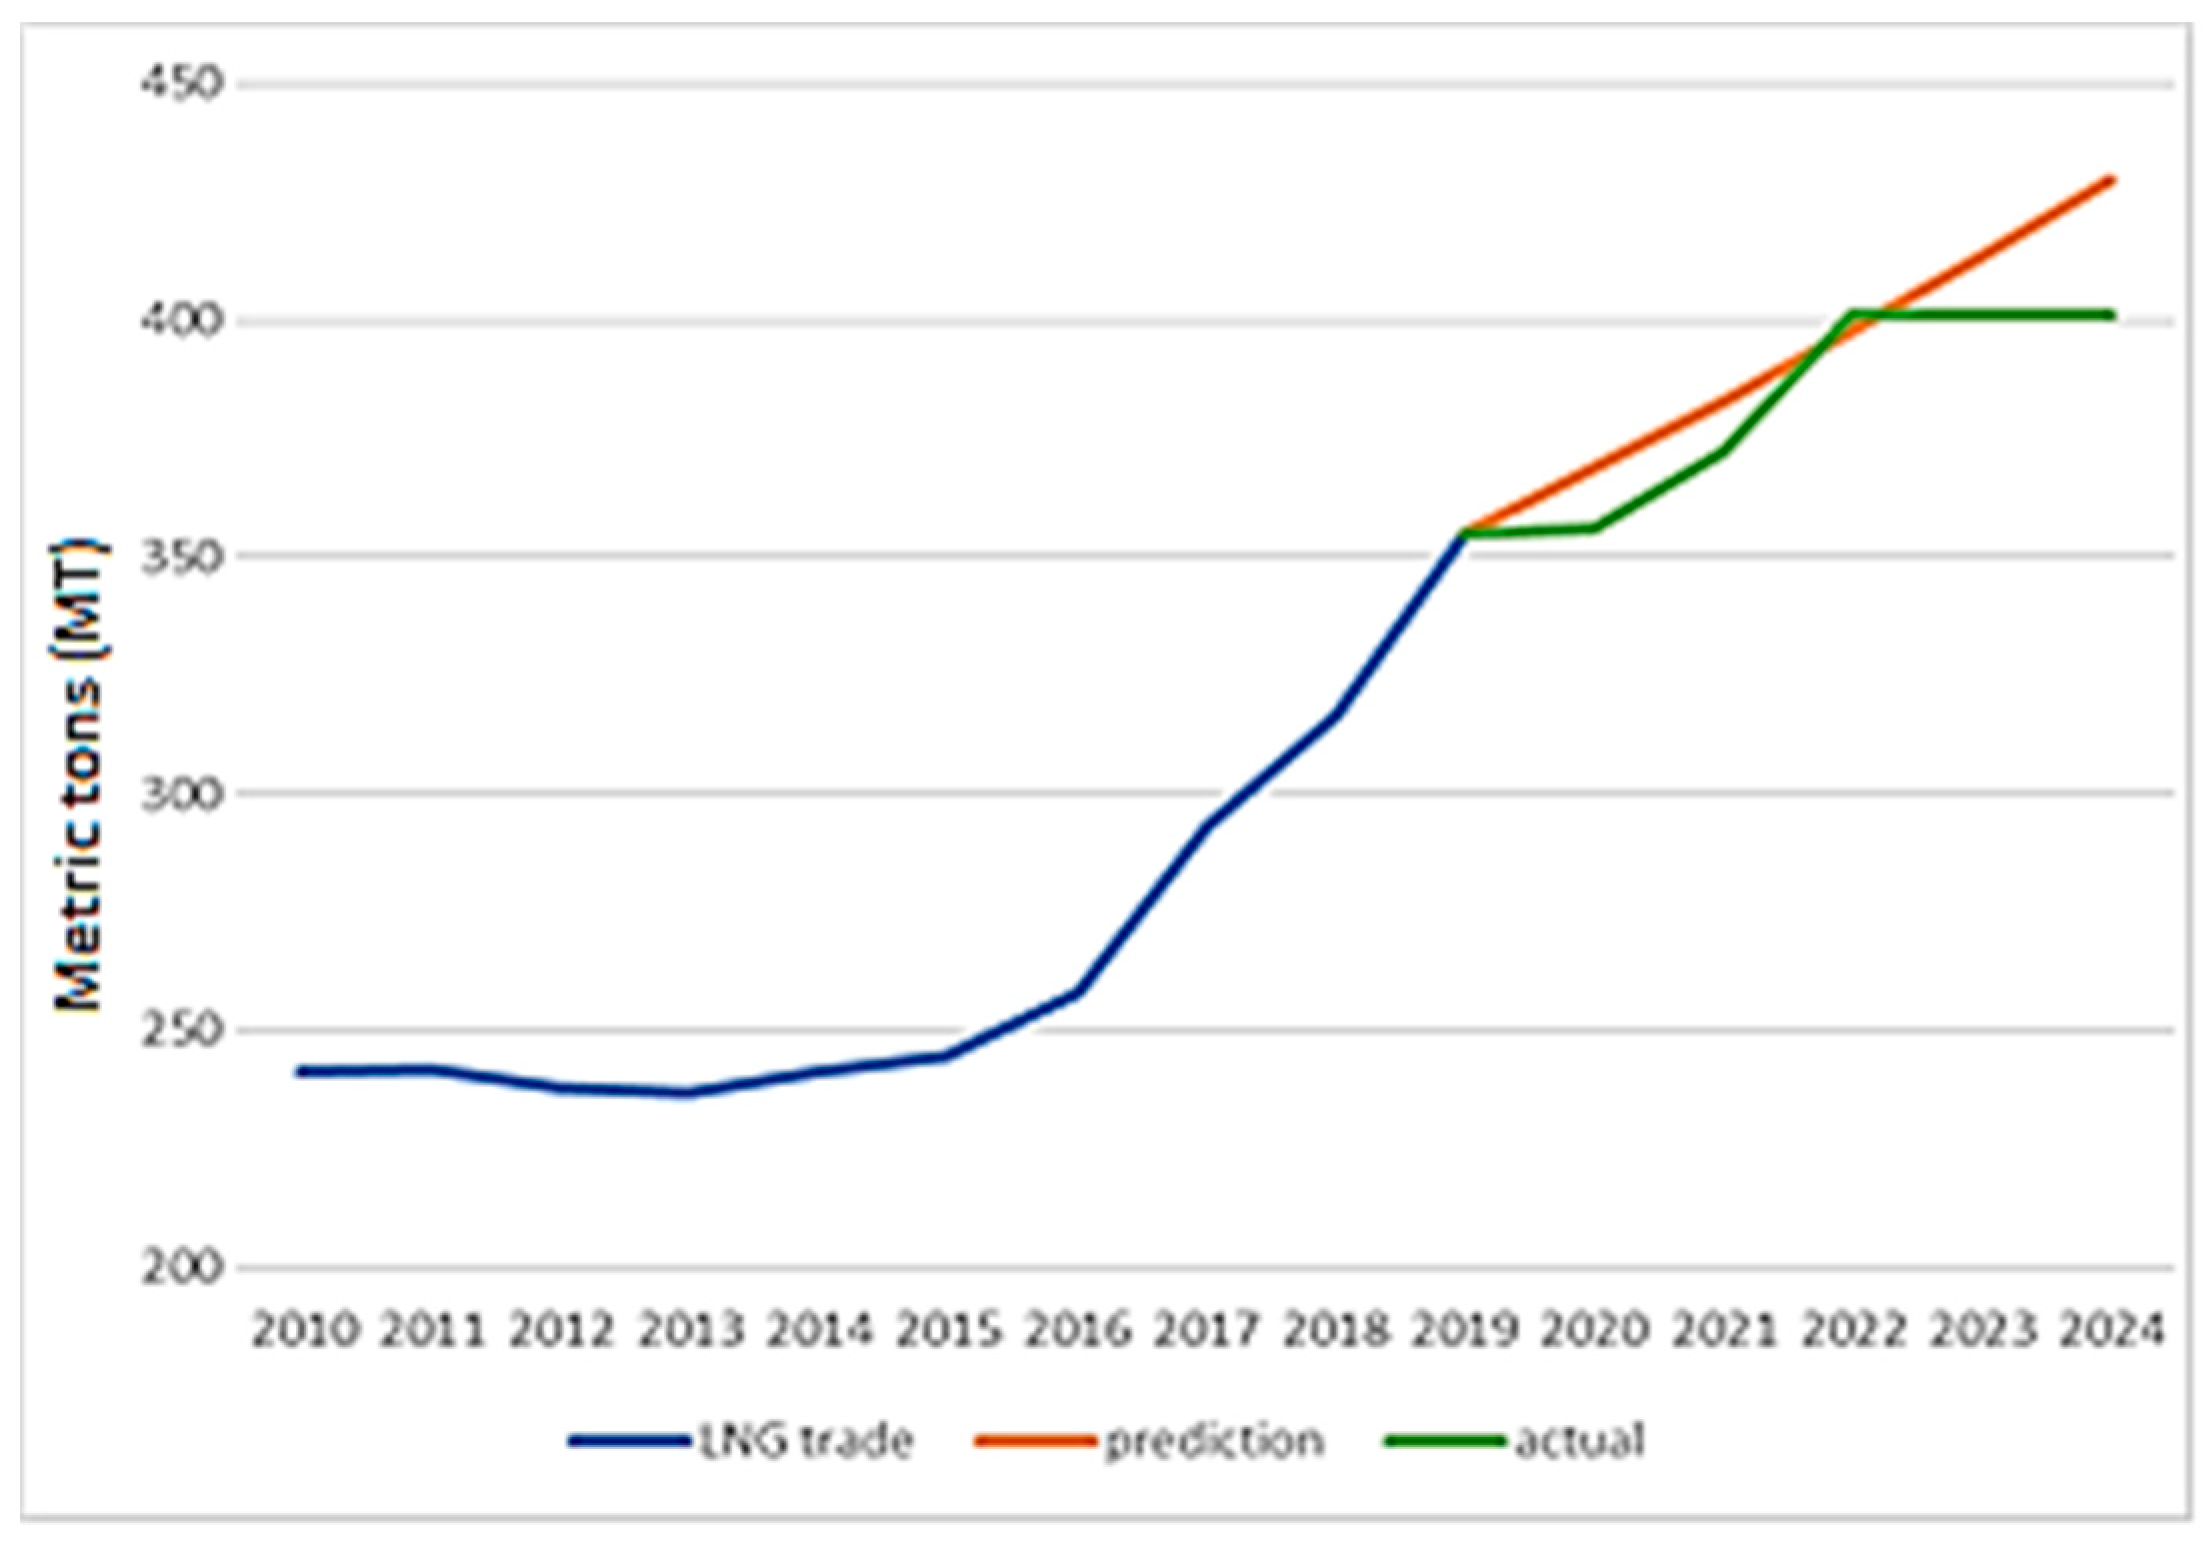
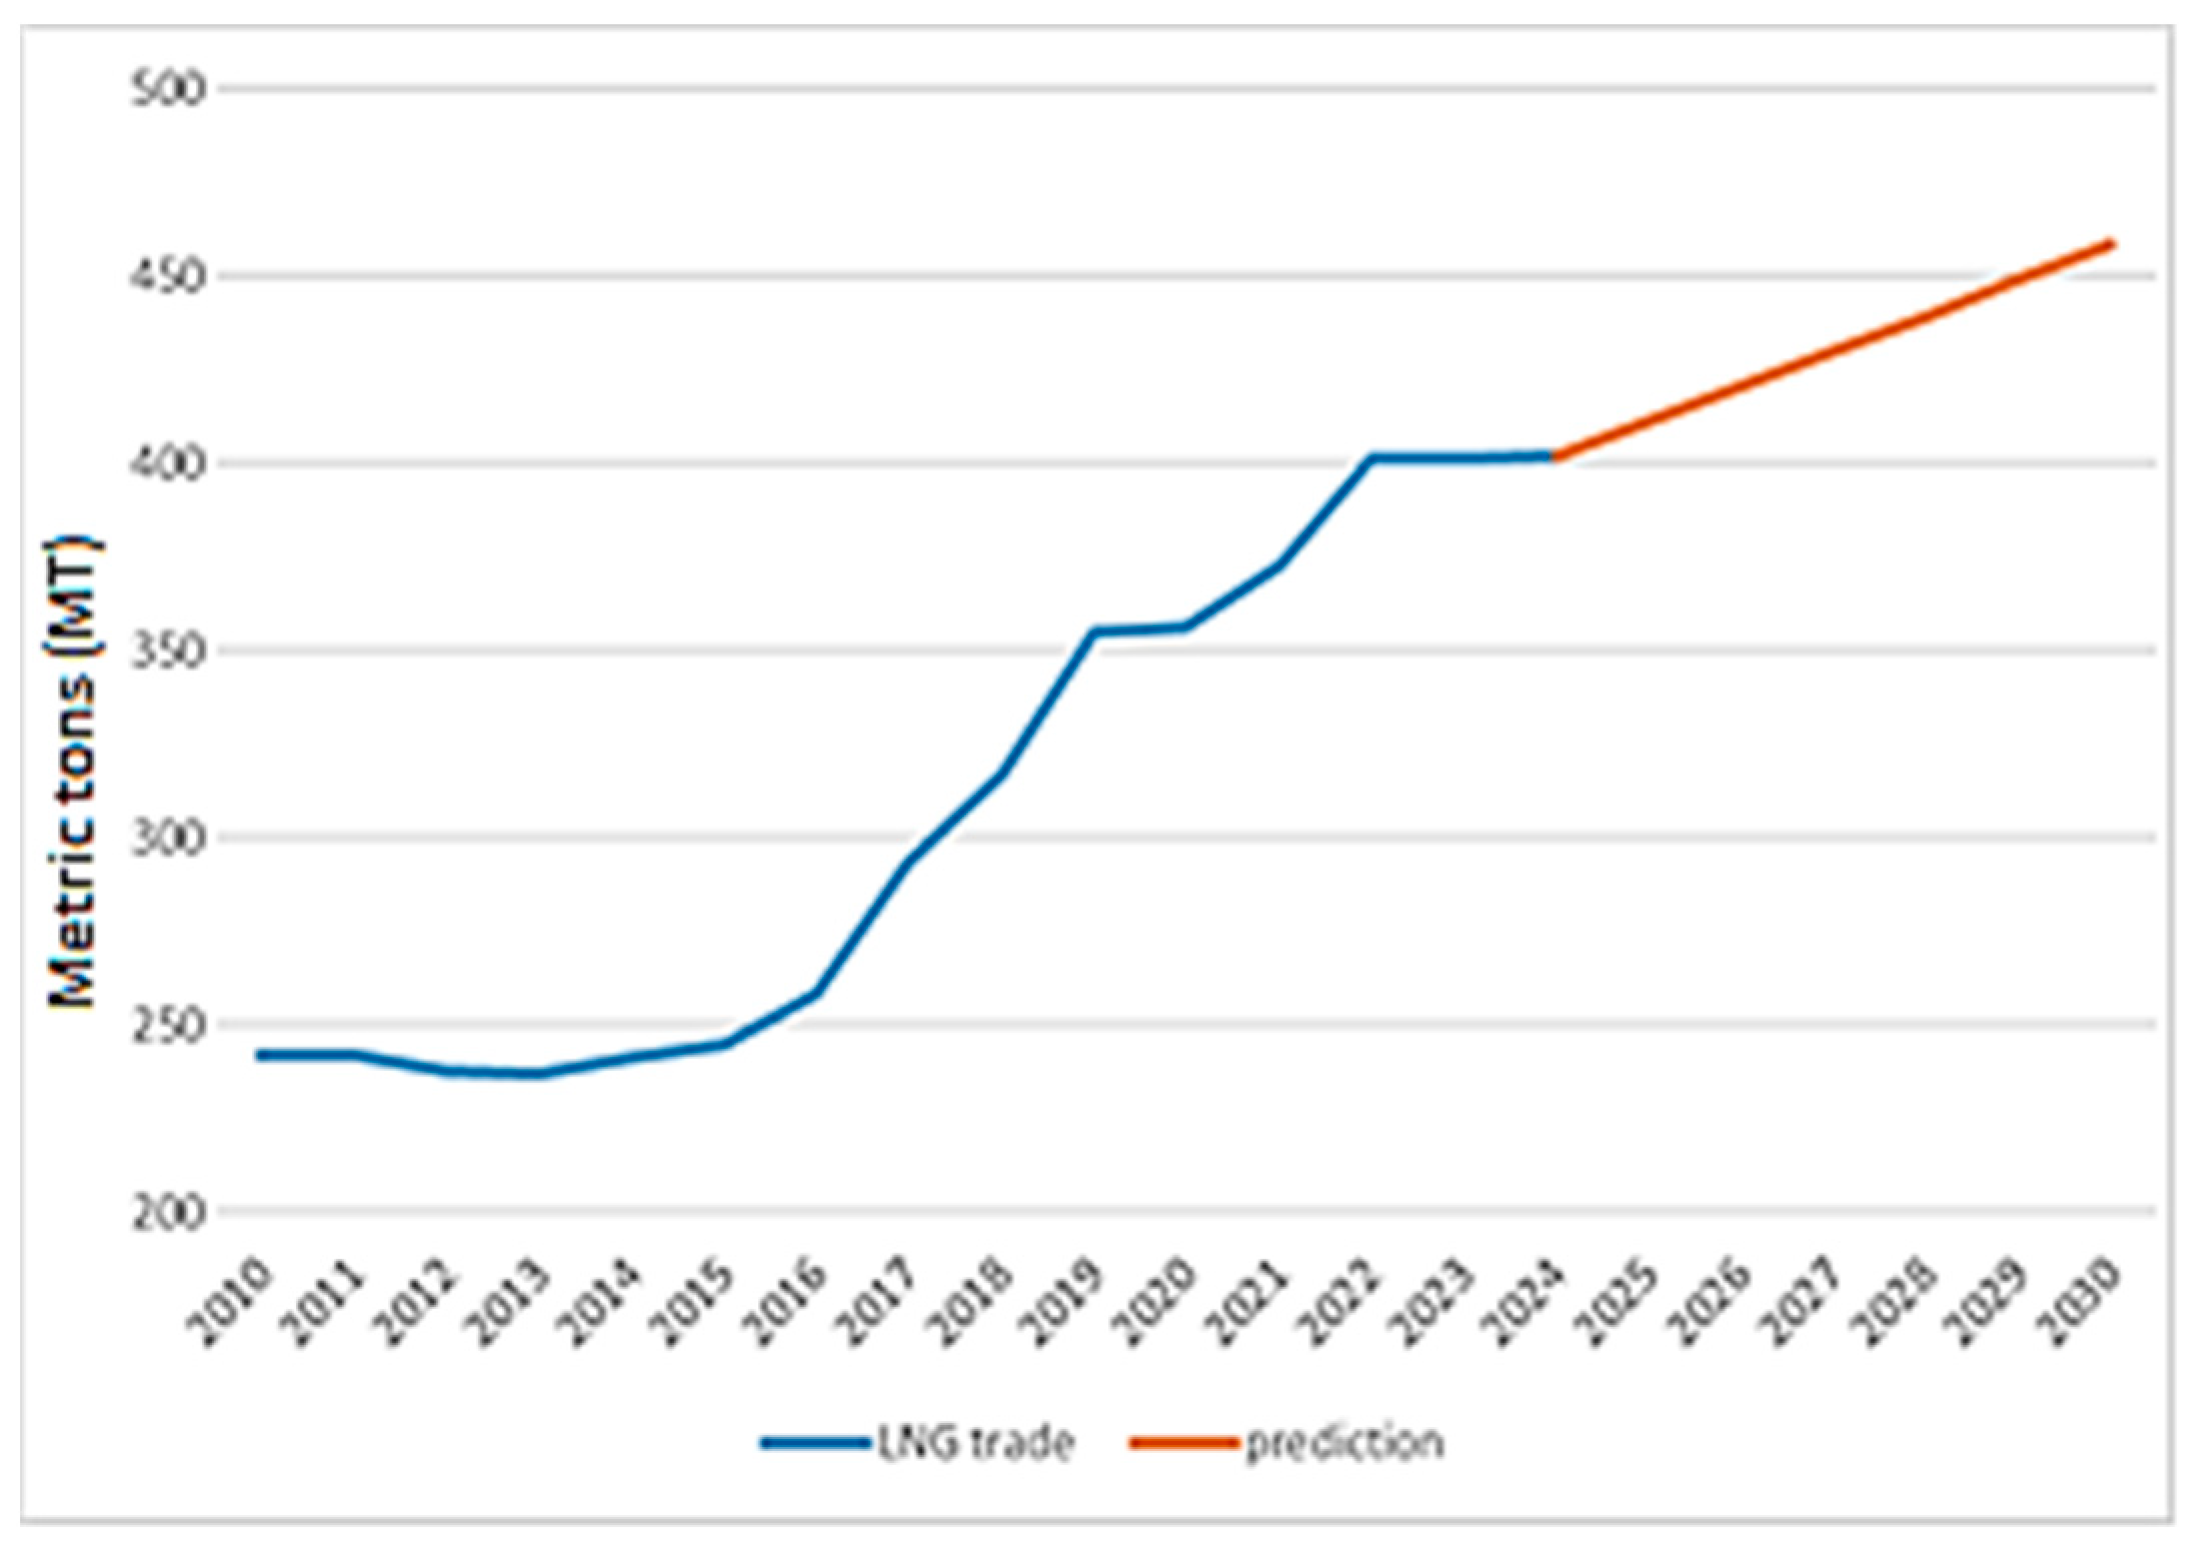
3.3. LNG Trade Volume Comparison

A significant increase in the LNG trade volume was also predicted for the period from 2019 to 2025, with the LNG trade volume expected to rise to 450 million tons by the end of 2024 or early 2025 [26]. The comparison between this forecast and the actual data for the period 2019 to 2024 is shown in Figure 3.
Regarding the LNG trade volume, the above forecast that the trade volume of liquefied natural gas will reach about 450 million tons by the end of 2024 (early 2025) has proven to be optimistic; however, the actual data show that the LNG trade volume is 401.42 million tons [7,26]. Table 3 shows the comparison between the actual data and the forecast, as well as the calculation of the difference between the two values.
Table 3 shows that this forecast is also quite accurate, although the increase in error over time is noticeable. At the end of 2024, the deviation is 6.62% and shows an increasing trend over time.

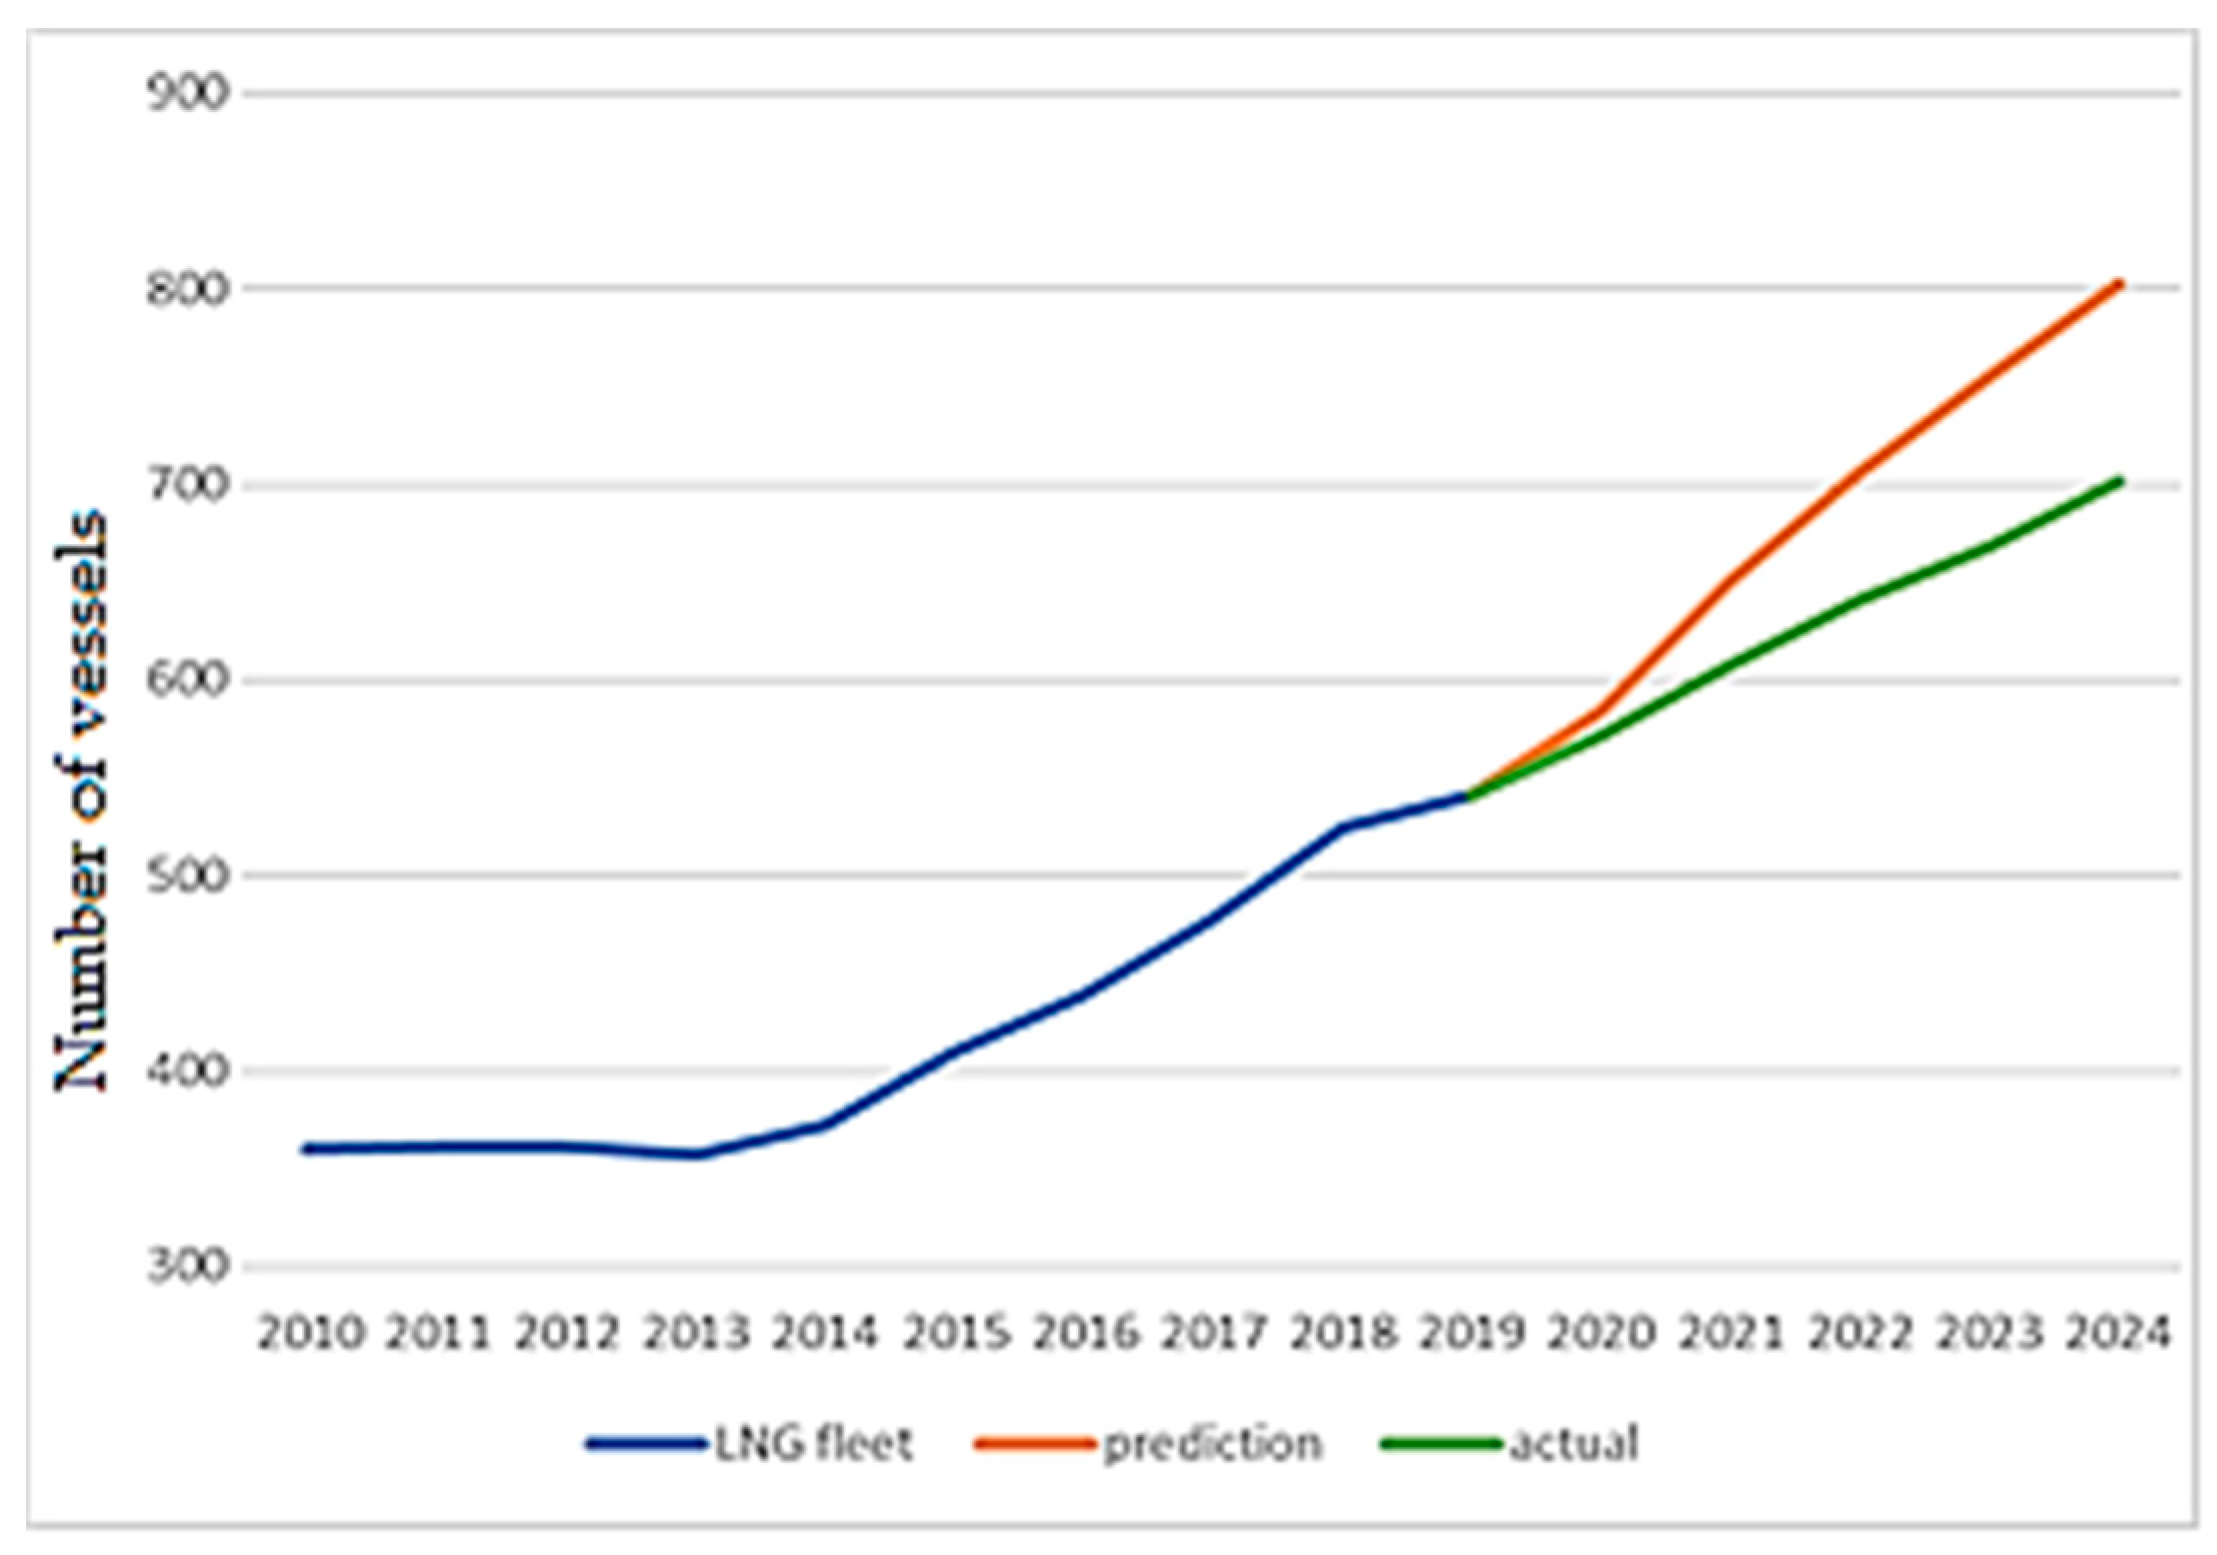
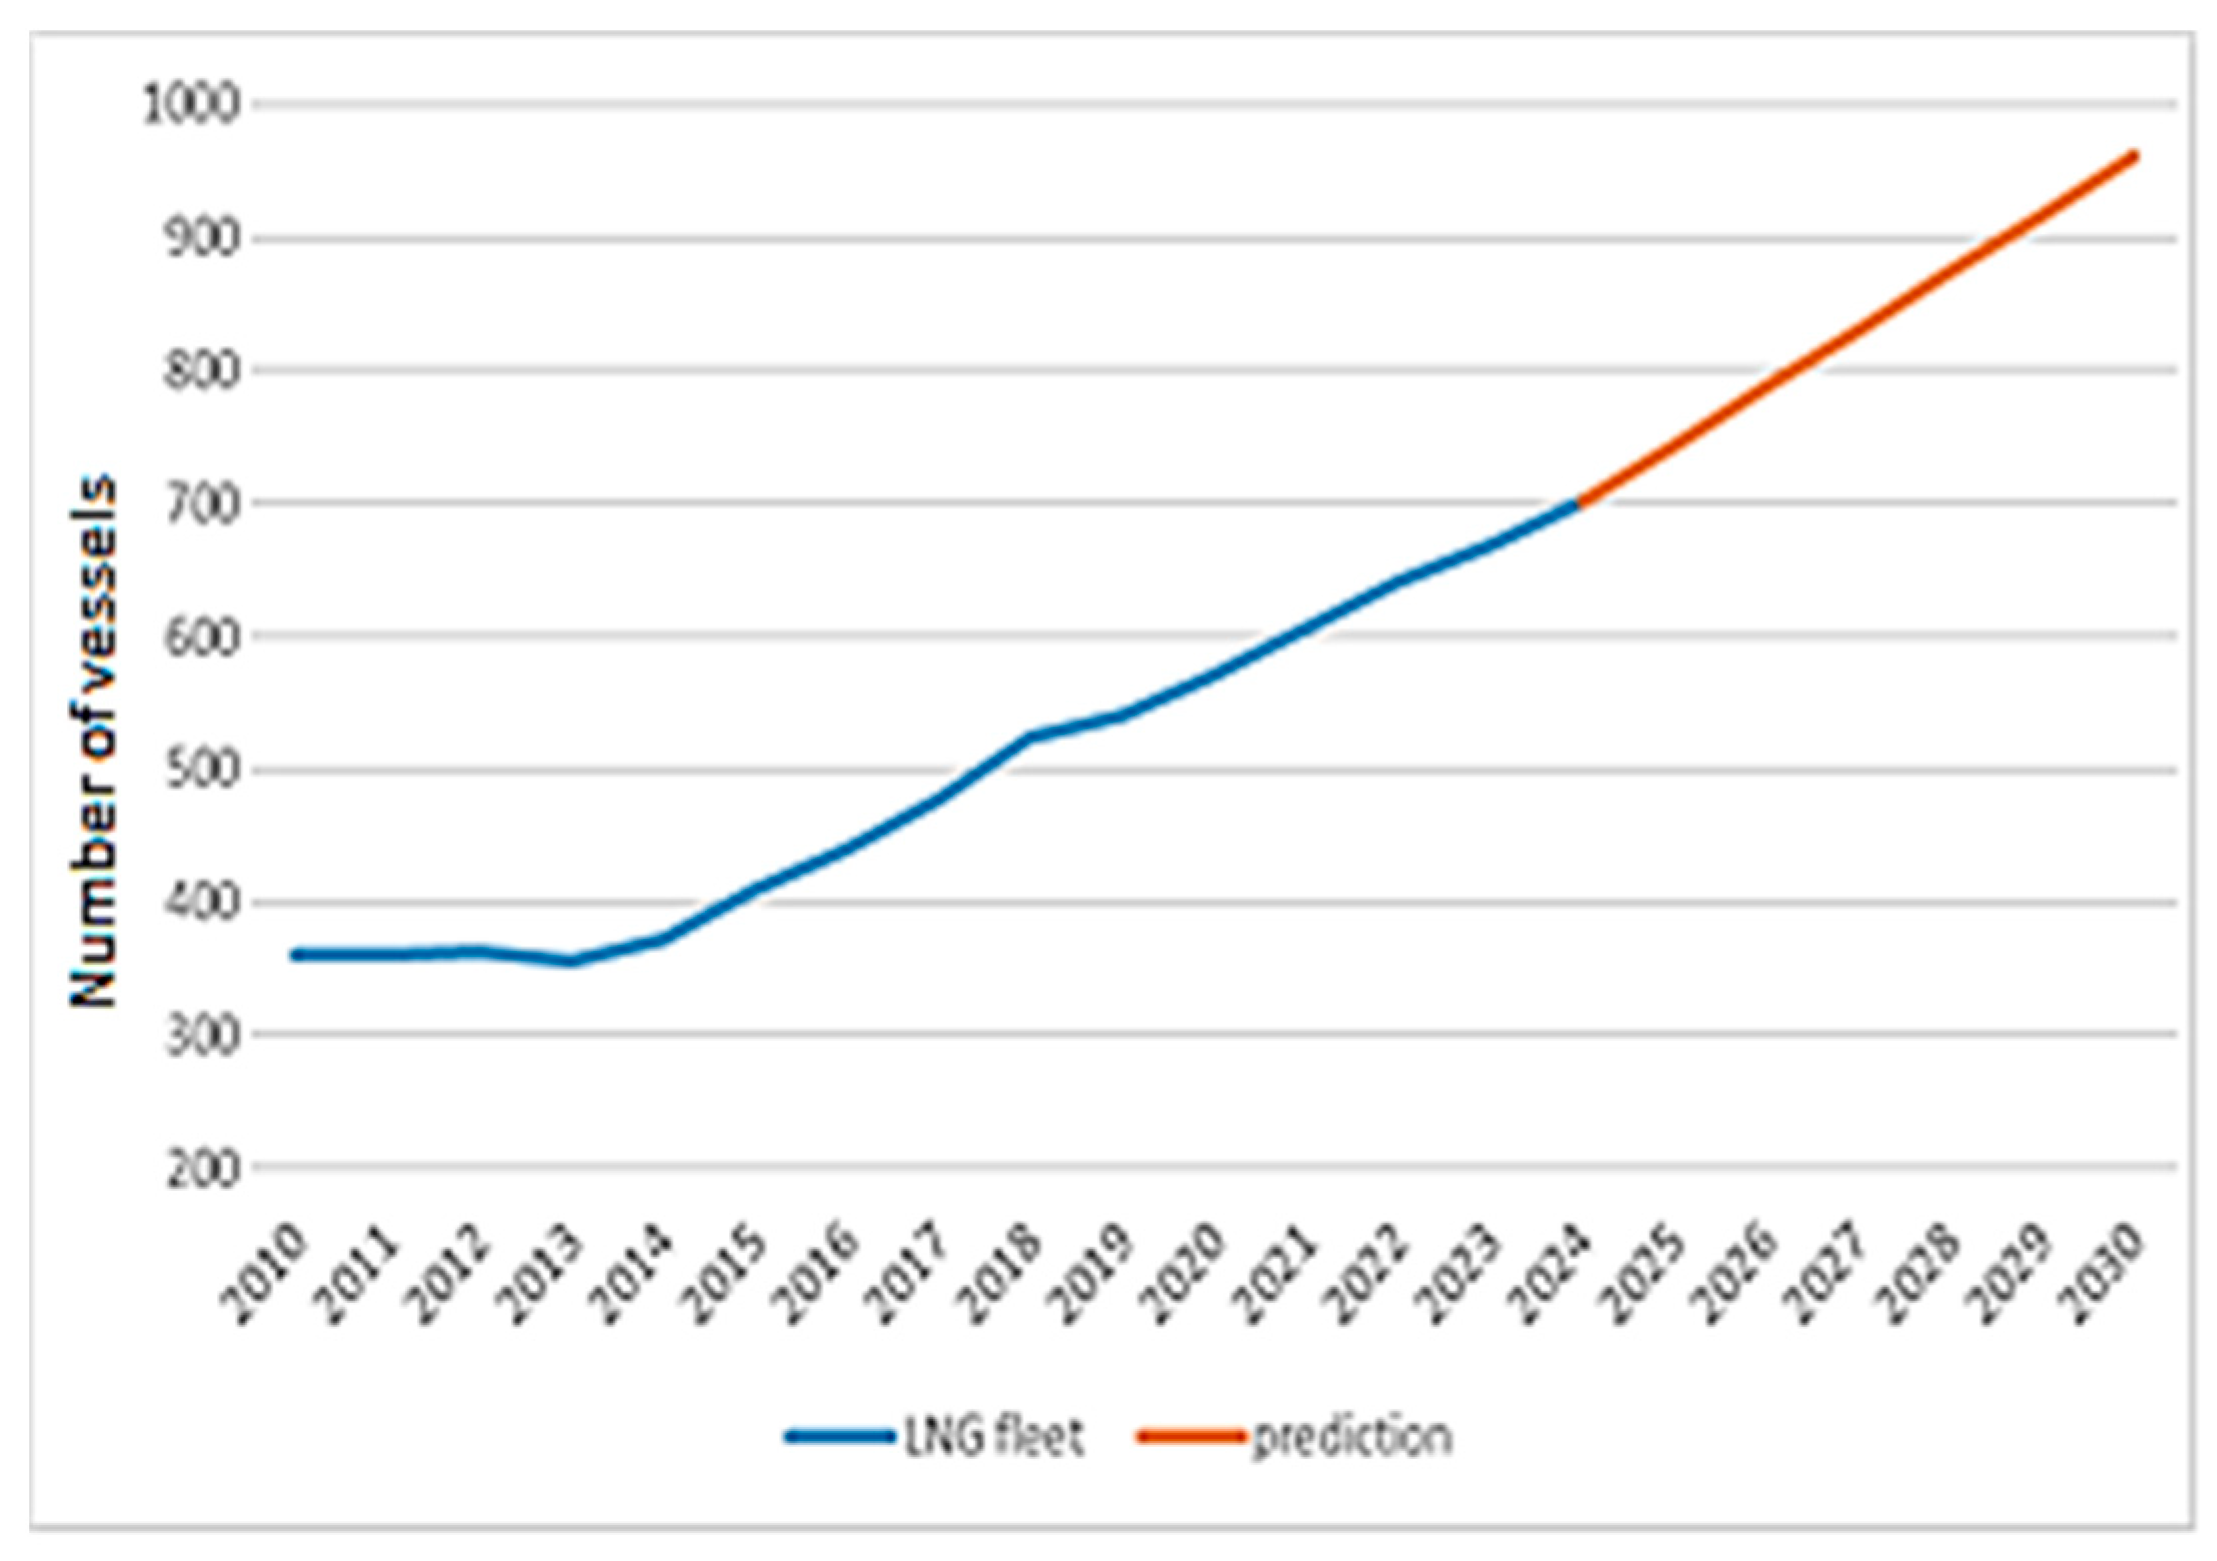
3.4. LNG Fleet Comparison

A forecast for the growth of the LNG shipping fleet for the period 2019–2025 predicted very optimistic growth [26]. As the forecast was based, among other things, on the number of new ships ordered, a good match between the forecast and the actual data is expected. A comparison between this forecast and the actual data is shown in Figure 4.
The results obtained are not as expected; there are significant differences, which are shown in Figure 4. Table 4 provides a clear comparison between the predicted and actual size of the LNG shipping fleet and the difference between these two values.
Table 4 shows that the prediction for the beginning of the period is very good (as expected), but that the difference increases rapidly over time and that the good prediction deteriorates rapidly. The analysis shows that the difference at the end of 2024 is 12.7% (quite large), with a tendency to grow further.

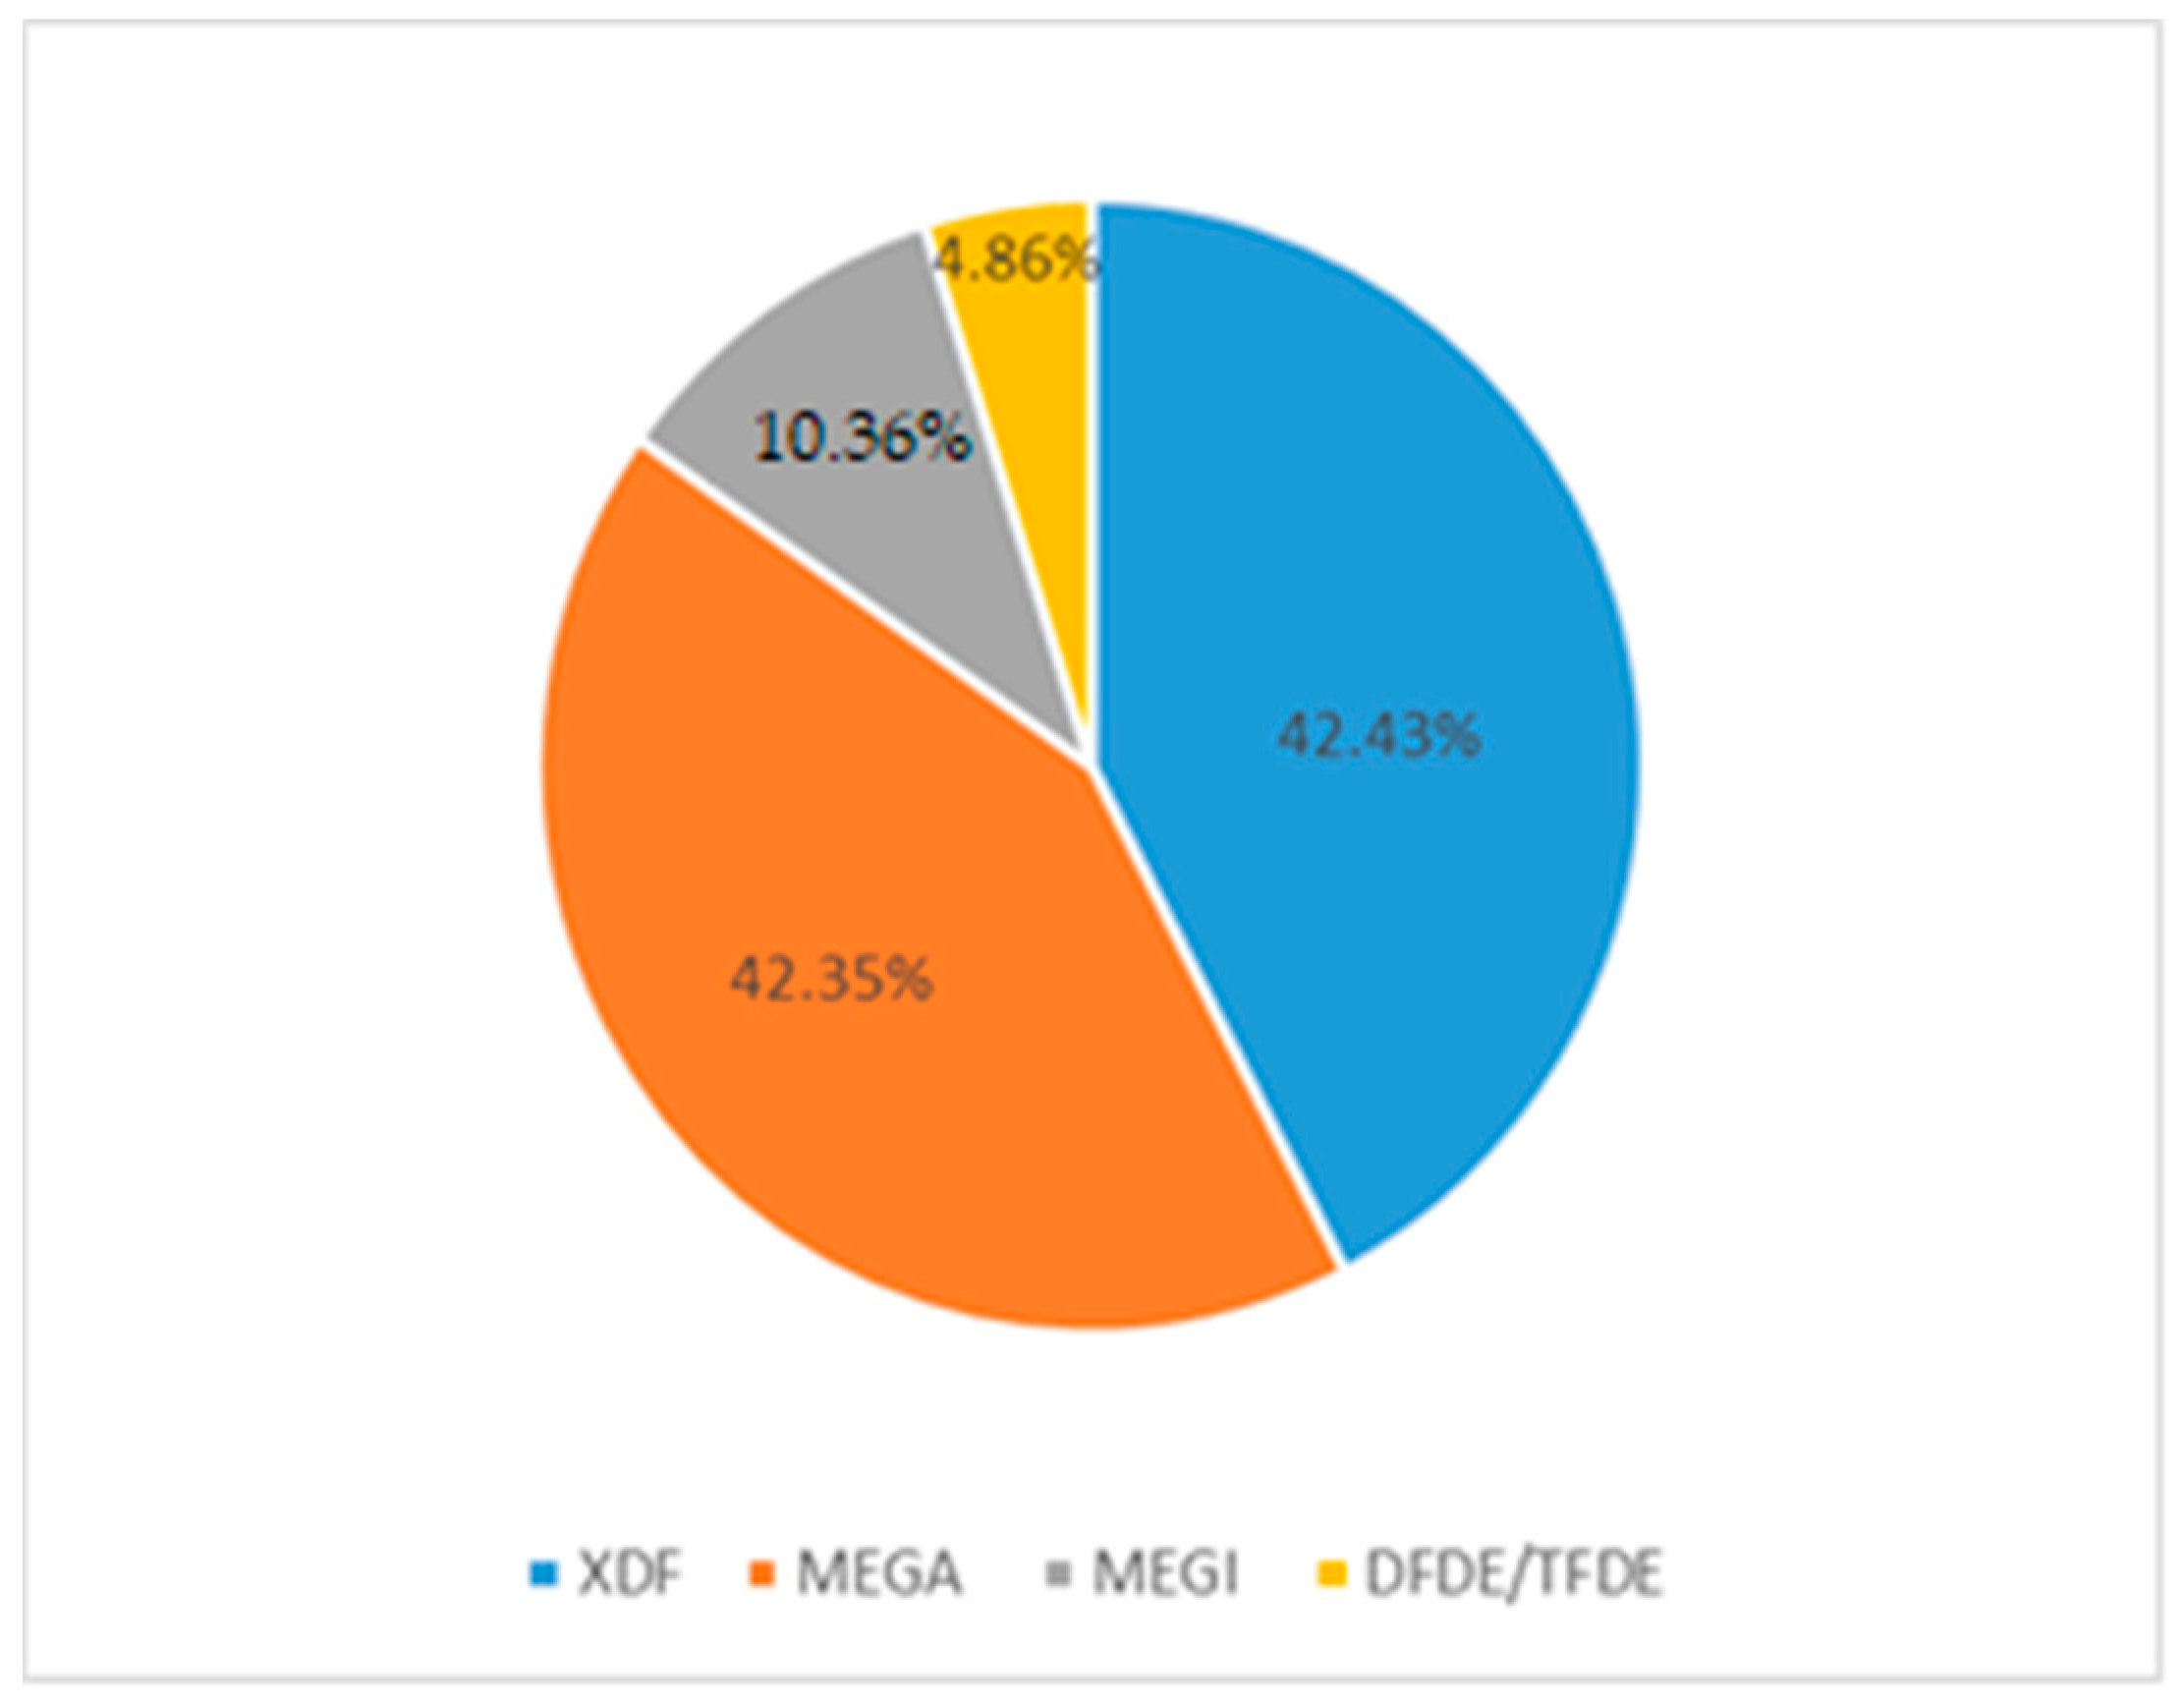
3.5. Propulsion Solutions on LNG Ships Comparison

In an earlier analysis, three types of propulsion were examined: steam turbines, XDF, and MEGI. The choice of propulsion type for LNG vessels is critical as it affects capital and operating costs, emission levels, propulsion compartment size, vessel reliability, and compliance with key regulations [7,26].
Steam turbines are widely used in the maritime industry due to their adaptability and ability to be installed in various systems and configurations. Steam propulsion systems are most commonly found in the engine rooms of LNG vessels and remain the predominant mode of propulsion for these vessels [32]. Nearly twenty years ago, steam turbine systems fueled by boil-off gas and HFO (heavy fuel oil) were the only propulsion option for LNG carriers [7].
Today, steam turbines are generally considered an outdated technology for ship propulsion. However, one of the main advantages of steam propulsion systems over diesel engine systems is their higher reliability and lower probability of failure. These traditional systems generally require less maintenance and are known for their robustness. The advantages of internal control of such systems are their simplicity and affordability, and only a single dock visit is required to overhaul the turbine. Routine inspections are rarely required and are usually only carried out for obvious malfunctions [33].
It has already been mentioned that a steam turbine is primarily fueled with vaporized gas from cargo tanks or, if this is insufficient, with an alternative HFO. One of the main disadvantages of steam turbines is their low efficiency, which is only 35% at full load. The current fleet comprises 240 steam-turbine-powered ships, which corresponds to 34.2% of the total fleet [7].
However, new ships with steam turbines are no longer being built due to problems with rising fossil fuel prices and stricter emission regulations, indicating a shift to newer and more environmentally friendly technologies. These advanced technologies offer higher efficiency and greater operational flexibility as they allow for a wider range of operating speeds and adaptation to different operating conditions.
Compared to steam turbine propulsion, modern propulsion systems such as Dual-Fuel Diesel Electric (DFDE) engines, Tri-Fuel Diesel Electric (TFDE) engines, low-pressure Winterthur Gas and Diesel (XDF) engines, and M-type electronically controlled gas injection (MEGI) engines offer 25–50% greater efficiency and cost effectiveness.
The company Winterthur Gas and Diesel (WinGD) developed a low-pressure injection system with a high air–fuel ratio in the cylinder. It was based on a well-known Sulzer slow-speed engine using Wartsila’s dual-fuel technology, in which a lean air–gas mixture is burned in the Otto cycle and injected in the gas mode, while a small amount of diesel pilot fuel is injected into the cylinder for ignition at top dead center (TDC). The first XDF engine was delivered in 2017 [34].
The MEGI engine type stands for the M-type electronically controlled gas injection, developed by MAN B&W. This engine type is based on the fact that the fuel is injected into the cylinder at a high pressure of between 250 and 300 bar, with a minimum amount of pilot fuel and an injection angle close to the top dead center (TDC). This type of injection enables a dynamic response to the gas–oil combustion of the slow-speed MAN ME-C engine [35].
However, the differences in performance depend largely on factors such as load conditions. [7]. The DFDE drive, which is considered one of the first alternatives to steam turbine systems, was introduced in 2006. This system can run on both diesel and boil-off gas and uses two different operating modes to drive the main generators: gas and diesel operation. The generators then drive electric motors, which improves the overall efficiency by over 20% compared to conventional steam turbine drive systems.
The introduction of TFDE propulsion systems in 2008 represented a significant innovation in LNG ship technology. These vessels offered a significant improvement in adaptability as they could utilize HFO as an additional fuel source. Compared to conventional steam turbine propulsion systems, which can adapt to different fuel types depending on sailing conditions, TFDE ships offer an improvement in overall efficiency of up to 30% [36].
In 2022, a new propulsion type was added to the drive types. The MAN B&W ME-GA is based on the proven MAN B&W dual-fuel concept with negligible installation effort and has an efficient ignition concept and an irreplaceable gas supply system that ensures safe and reliable operation [37].
In addition, the ME-GA is characterized by nominal operating costs, simple supply and treatment concepts, and low maintenance costs for the fuel gas supply system. It complements the established MEGI diesel engine in MAN Energy Solutions’ two-stroke engine portfolio, which now offers low-pressure and high-pressure dual-fuel solutions for LNG operation [38].
The ME-GA engine is a low-pressure, Otto cycle, two-stroke, dual-fuel LNG engine developed primarily for the LNG carrier market. It is designed to offer ship owners a lower capital cost option that can compete with WinGD’s XDF engine.
The launch of the ME-GA engine in April 2021 was a complete success: 100 orders were placed in the first eight months. To date, more than 260 units have been ordered, of which more than 40 are already in operation. Each ME-GA engine features exhaust gas reduction technology (EGR), which reduces methane slip emissions by up to 50% compared to first-generation Otto cycle engines without EGR. This technology not only helps to reduce emissions but also improves fuel efficiency in both gas and oil operations, which supports compliance with Tier II and Tier III standards.
It quickly took the top position on the order lists for ships, only for these engines to stop being sold in 2024 due to new circumstances.
The focus here is on methane slip, i.e., unburned methane (CH4) that escapes into the atmosphere during combustion. Methane is a particularly worrying greenhouse gas because, according to the US Environmental Protection Agency [39], it traps heat 28 times more effectively than carbon dioxide (CO2) over a 100-year period.
The International Maritime Organization (IMO) is therefore developing regulations to control methane emissions in international shipping, which are to be implemented by 2027. At the same time, the European Union is taking measures with its FuelEU Maritime Policy, which should lead to the regulation of methane emissions from 2025 [40].
For the Danish engine manufacturer, which has invested hundreds of millions of euros in the development of low-carbon and carbon-free engine technologies for the maritime industry, this change in regulations is a major challenge. Although the exact amount of investment in the ME-GA engine has not been disclosed, it is clear that significant funds will need to be deployed to meet the growing demand for cleaner marine engines [41]. Therefore, the new IMO regulations on methane slip, which are expected to come into force in 2027, would require significant technical updates and investment, making this engine no longer economically viable [42].
Figure 5 shows a forecast for the share of the propulsion market for the period between 2019 and 2025.
Although it is difficult to predict future trends with certainty, the current market focus is clearly shifting from steam turbines to more fuel-efficient LNG engines. Demand for more efficient propulsion systems is expected to grow in the future, with XDF and MEGI technologies likely to gain a larger market share [39]. Figure 6 and Figure 7 illustrate the trends for 2024, with a comparison between the propulsion types of the active fleet and the order book showing that no steam-powered vessels have been ordered for this year, confirming the predicted shift.
Table 5 shows the relationship between the type of vessel propulsion and fuel consumption.
Table 5 gives us insight into the correlation between drive type and fuel consumption, as it is plotted from higher to lower consumers. Figure 6 shows the order book of LNG vessels by propulsion type for the year 2025.
Figure 6 gives insight into the order book for LNG ships for 2025, although this is very likely to be influenced by the unexpected ME-GA case.

3.6. Analysis of Deviation from Actual Results

The analysis of the deviation from the actual results shows different tendencies, but one fact can be deduced from the overall analysis. The prediction of Stanivuk et al. is overall of quite high quality but shows the shortcomings of all predictions; it cannot predict all events and gets worse with time [26]. The comparisons of the first and second forecasts (for LNG-importing and LNG-exporting countries) shown in Table 1 and Table 2 show negligible deviations from the data of the real situation and can be described as very accurate.
The forecast accuracy is somewhat worse for LNG trading volumes (Table 3), where the deviation rises to 6.62% at the end of the reporting period, although it should be noted in particular that the error rate tends to increase over time.
The situation in the LNG vessel market (Table 4) shows the same tendency, but in a much more pronounced form, with the forecast error in this case rising to 12.7%, which is significant. The reason for this behavior, according to Wood, is the oversupply in the market [43].
The propulsion analysis represents a special case in which an unexpected loop occurred. In 2022, a new drive type, ME-GA, was added to the existing drive types. In a very short time, it took the top position on the order lists for ships, only for these engines to stop being sold in 2024; i.e., due to problems with environmental requirements, this concept was abandoned.
The war between Russia and Ukraine has had a major impact on the entire LNG transportation network and has led to a significant increase in routes between Europe and the USA. This conflict has led to a steady demand for LNG in Europe, resulting in a corresponding development of European ports. However, according to the overall figures presented in Section 2 and the official data from the IGU World Reports, the BP Statistical Reviews, and the Environmental Impact Assessments, the war did not have a major impact on the growth of the LNG trade, but the question remains whether the halt in growth shown in Figure 3 is related to this problem [7,28,29,44].
In 2022, Europe increased its LNG imports by ship by 60%, compensating for the decline in gas supplies from Russian pipelines due to the problems in Ukraine. Thanks to this increase in imports by sea, Europe was able to maintain its energy security and meet its energy needs despite the supply disruptions caused by the crisis [45].
Forecasts for the development of the LNG-powered shipping fleet are promising, as demand for LNG has increased significantly in areas with strict sulfur emission controls following the introduction of environmental regulations to improve air quality [46].
These events demonstrate the need for more frequent market analysis and forecasting over a shorter period of time.

4. Forecast for the Future Period

The global LNG market has grown for the fifth year in a row, reaching 1029.9 million metric tons (MT) in 2023, its highest level since 2010, which corresponds to an annual increase of 6.8% [7]. This upward trend is largely due to the expansion of the global LNG infrastructure. The USA was the largest exporter in 2023, with a total of 84.5 MT exports (+8.9 MT compared to 2022), while China will once again take first place in terms of imports with a total of 71.2 MT imports (+7.6 MT compared to 2022) [7].
As in the previous analysis, linear regression is also used in this study. The method is not flawless; there will be deviations over the period, but this type of prediction provides relatively good results using a simple method. Perhaps better results could be obtained using a model, but this would make the whole process considerably more complex.

4.1. New Prediction for LNG Import

Based on the information about market development to date and the current situation in the import market, a forecast was drawn up, which can be seen in Figure 7.
Figure 7 shows a forecast, according to which the number of LNG-importing countries will continue to rise and reach 60 by 2030. Growth is expected to be linear, with minor fluctuations as the market expands almost every year. Since the forecast for the previous period was fully accurate, and assuming that there will be no market disruptions in the future, this forecast should also be fairly accurate.

4.2. New Prediction for LNG Export

The forecast for the number of LNG-exporting countries is also based on the data from the previous period (Figure 8).
Although the situation shown in Figure 8 remains unchanged, the method predicts an increase of one in the number of exporting countries. The previous forecast predicted the same increase, which did not materialize.

4.3. New Prediction for Volume of LNG Trade

The strong growth in the LNG trade volume between 2015 and 2022 has come to a standstill in the last two years, meaning that the new growth curve is significantly weaker than in the last forecast. The insufficiently studied impact of the war in Ukraine on the LNG trade, its extension or termination, as well as recent political changes in the world may significantly affect the market and the variability in market behavior over time, changing the appearance of the curve shown in Figure 9 within a very short period of time.
Despite all the challenges and the standstill in the last two years, the forecast in Figure 9 clearly shows that the LNG trade volume will continue to grow in the coming years, albeit at a slower rate than in the previous period, and will exceed the 450 MT mark in 2029.

4.4. New Prediction for World LNG Fleet

In February 2024, the total number of LNG ships amounted to 701, an increase of 5% compared to 2023 [7]. This figure includes chartered ships in operation worldwide, ships awaiting loading and delivery of their first cargo, and ships that have been converted into floating terminals for the reception, storage, and regasification of liquefied natural gas (FSRU).
The year 2023 was characterized by significant disruptions in the international shipping market. From the third quarter onward, a drought in Panama lowered the water level of Lake Gatun, the main water source of the Panama Canal, and reduced the number of daily transits, forcing US LNG cargoes to take the longer route around the Cape of Good Hope to Asia. The situation improved in early 2024 when rainfall increased again. At this point, however, passage through the Red Sea was hampered by attacks on ships by Houthi rebels in Yemen. In February, LNG ships began to avoid the Red Sea and thus also the Suez Canal on their way to Asia and Europe. The market overcame these challenges in part through trade swaps and other optimization strategies [7].
Based on the information on the current status of the LNG fleet, a forecast was drawn up, which can be seen in Figure 10.
Figure 10 shows a forecast for the future period in which the actual number of LNG ships will continue to rise, with the number of ships reaching 900 by 2029 and continuing to increase.

4.5. New Prediction for Propulsion Solutions for LNG Ships

The last forecast included Dual-Fuel Diesel Electric (DFDE) engines, Tri-Fuel Diesel Electric (TFDE) engines, Winterthur Gas and Diesel (XDF) low-pressure engines, M-Type, Electronically Controlled Gas Injector (MEGI) engines, and steam turbines, but this forecast suffered a significant setback. ME-GA engines, which were not analyzed for a forecast, have taken the leading position in the market, displacing all other solutions. Due to problems with methane slip, this type of engine will be discontinued after only three years of production, meaning that a forecast for future development in this segment has no basis for analysis. In terms of propulsion systems, which have already made considerable progress, more innovative and efficient propulsion technologies will continue to be used, and until something new comes onto the market, ships will mainly be powered by XDF and MEGI systems.

5. Discussion

This section of the paper explains the forecasted growth for the entire research, as well as the possible factors across the world that might affect the LNG trade during the upcoming period.
The number of LNG-importing countries will increase by 17.5 % by 2030. The number of LNG-exporting countries is forecasted to increase at the same rate of 5% during the forecast period. The LNG trade volume is expected to increase by 15% over the next five years. According to the prediction, the LNG fleet could grow by 40% by 2030.
All these predictions depend on a large number of positive and negative factors. The global market for liquefied natural gas (LNG), which is already characterized by its volatility and strategic importance, will change significantly by 2030. Amid geopolitical tensions—from the ongoing conflict in Ukraine to instability in the Red Sea and Yemen to regulatory changes by the new US administration—the dynamics of the LNG trade are shifting in expected and unexpected ways.
The Russian invasion of Ukraine, now in its third year, continues to have a negative impact on global energy security. Europe’s shift away from Russian pipeline gas has greatly increased demand for LNG, particularly from the US, Qatar, and other suppliers. This switch has not only made Europe a premium market for LNG exporters, but has also tightened supply for other regions, particularly in Asia. While Europe has expanded its regasification capacities, the port and pipeline infrastructure in some regions (e.g., Germany and the Baltic states) remains strained.
The resurgence of Houthi attacks in the Red Sea, particularly near the Babel-Mandeb Strait—a major global chokepoint—has disrupted LNG shipping routes between the Middle East, Asia, and Europe. Major shipping companies have diverted their vessels around the Cape of Good Hope, adding weeks to transit times and increasing freight costs. Insurance premiums for vessels transiting the risk zones have skyrocketed, driving up overall delivery costs. Qatar’s exports to Europe have been delayed, prompting European buyers to diversify even more to LNG from the Atlantic basin (e.g., from the USA and West Africa).
Qatar, one of the world’s largest LNG exporters, is responding to these tensions with a mixture of opportunism and caution. With long-term contracts binding Asian buyers and increased interest from Europe, Qatar has a significant advantage.
The newly elected US administration has introduced a series of tariff and trade policy changes designed to reshape international trade, including the energy sector. Although these changes are presented as measures to support domestic industry and climate goals, they could impact the global LNG trade. Licenses for LNG exports will be reviewed under stricter climate policy considerations, which could lead to a slowdown in new project approvals. Stricter inspection and reporting requirements for cross-border LNG transactions could increase the administrative burden for traders. Talks about imposing tariffs on LNG facilities or certain destinations—especially those with weak climate commitments—could affect trade flows.
Adding to the complexity of the LNG landscape in 2025 is the emergence of a highly pathogenic strain of avian influenza (HPAI) that has spread in parts of Asia and Europe. Although it is not directly linked to LNG, its impact is being felt. In the affected regions, the outbreaks have led to local closures, staff shortages at ports, and temporary disruptions to cargo handling. LNG tanker routes have had to be adjusted to comply with changes in international health regulations, leading to further delays in deliveries. The outbreak of avian flu temporarily slowed down industrial activity in key importing countries such as South Korea and Japan, which reduced short-term demand for LNG. Although avian flu is expected to be contained faster than COVID-19 due to improved global coordination, the impact of avian flu has highlighted the need for LNG players to factor health risks into their logistics and demand forecasts.

6. Conclusions

The analysis of the LNG market and the LNG fleet gives a clear picture of the crucial role that gas transportation plays in global trade. The maritime transportation industry is a complex network in which the LNG sector is an important part, involving various companies that operate and manage purpose-built vessels. These vessels are involved in various tasks related to the global transportation of LNG and adapt to fluctuations in demand. This paper examines the fundamental aspects of the LNG market and the LNG trade by examining reference data from previous years and making projections for the period between 2025 and 2030. This paper follows from the previous forecast, which was quite accurate but is now outdated and should be replaced by a newer forecast based on an analysis of more recent data. In 2023, the global LNG market and trade reached 401.42 million tons, representing an annual growth of 2.1% compared to 2022. The market analysis shows that this growth trend is likely to continue in the coming years. The reports also show that the number of countries importing LNG has increased significantly, a trend that is expected to continue due to market expansion and increasing investment in new terminals and cheaper FSRU capacity. LNG’s share of energy sources is also expected to increase further. According to forecasts by the World Energy Agency, green energy and natural gas will take a leading role over fossil fuels such as coal, which will be phased out due to stricter emission control laws. This transition is expected to be completed by 2035. From 2010 to 2024, the global LNG fleet has grown, reflecting the overall expansion of the LNG market. The data confirm that the number of LNG ships will continue to increase in the coming period. An analysis of LNG propulsion systems shows a clear trend toward the introduction of newer, more useful technologies. As propulsion systems have evolved significantly, ships will use more innovative and useful propulsion technologies in the future. The ME-GA propulsion episode shows that there can be missteps along the way and that predictions like these are sometimes completely off the mark.
This paper presents analysis and forecasts of the LNG market and fleet, providing valuable insight into the potential environmental impact of this sector in the maritime industry. While LNG is increasingly being used as an alternative fuel in shipping, its propulsion systems still have a significant carbon footprint, raising concerns about the long-term cost-effectiveness of this technology.
The forecast in this paper predicts that the general LNG market will continue to expand and grow in the right direction over the next five years in all the sectors mentioned.

Author Contributions

Conceptualization, T.S., D.K. and L.S.; methodology, D.K. and L.S.; validation, D.K. and T.S.; formal analysis, T.S., D.K. and L.S.; investigation, T.S., D.K. and L.S.; resources, T.S., D.K. and L.S.; data curation, T.S., D.K. and L.S.; writing—original draft preparation, D.K. and L.S.; visualization, T.S., D.K. and L.S.; supervision, T.S. All authors have read and agreed to the published version of the manuscript.

Funding

This research received no external funding.

Institutional Review Board Statement

Not applicable.

Informed Consent Statement

Not applicable.

Data Availability Statement

The original contributions presented in this study are included in the article. Further inquiries can be directed to the corresponding author.

Conflicts of Interest

The authors declare no conflicts of interest.

References

  1. International Energy Agency. World Energy Outlook Report; IEA/OECD: Paris, France, 2018. [Google Scholar]
  2. Makarichev, Y.A.; Anufriev, A.S.; Zubkov, Y.V.; Didenko, N.I. Energy efficiency of the wind power generator. In Proceedings of the 2019 IEEE Conference of Russian Young Researchers in Electrical and Electronic Engineering (ELConRus), Saint Petersburg and Moscow, Russia, 28–31 January 2019; pp. 1011–1015. [Google Scholar]
  3. Liu, Y.; Shi, X.; Laurenceson, J. Dynamics of Australia’s LNG export performance: A modified constant market shares analysis. Energy Econ. 2020, 89, 104808. [Google Scholar] [CrossRef]
  4. Hashimoto, S. A New Idea for LNG Trade: Enhancing Market Competition through a Tanker-Based Trading System. J. Asian Energy Stud. 2020, 4, 9–19. [Google Scholar] [CrossRef]
  5. Dyatlov, S.A.; Didenko, N.I.; Ivanova, E.A.; Soshneva, E.B.; Kulik, S.V. Prospects for Alternative Energy Sources in Global Energy Sector. IOP Conf. Ser. Earth Environ. Sci. 2020, 434, 012014. [Google Scholar] [CrossRef]
  6. Merkulov, V.I.; Skripnuk, D.F.; Kulik, S.V. Analysis of world LNG production capacity. IOP Conf. Ser. Earth Environ. Sci. 2020, 539, 012057. [Google Scholar] [CrossRef]
  7. IGU (International Gas Union). World LNG Report (2011–2024); IGU: London, UK.
  8. Flower, A. LNG in the Global Context; Springer Books: Berlin/Heidelberg, Germany, 2021; pp. 235–285. [Google Scholar]
  9. Kiebzak, P.W.; Czerniawski, F.K. LNG Market-Passing Trend or Effective Solution During Energy Transition-Global Market Forecast for 2020–2030; SPE Europec; OnePetro: Richardson, TX, USA, 2020. [Google Scholar]
  10. Gałczyński, M.; Ruszel, M.; Turowski, P.; Zajdler, R.; Zawisza, A. Global LNG Market; Ignacy Lukasiewicz Energy Policy Institute: Rzeszów, Poland, 2017. [Google Scholar]
  11. Danilov, R.; Arabyan, M.; Usov, D. Influence of technologies on LNG market development. IOP Conf. Ser. Mater. Sci. Eng. 2019, 537, 042030. [Google Scholar] [CrossRef]
  12. Nikhalat-Jahromi, H.; Fontes, D.B.; Cochrane, R.A. Future liquefied natural gas business structure: A review and comparison of oil and liquefied natural gas sectors. WIREs Energy Environ. 2016, 6, e240. [Google Scholar] [CrossRef]
  13. Razmanova, S.; Steblyanskaya, A. Arctic LNG cluster: New opportunities or new treats? IOP Conf. Ser. Earth Environ. Sci. 2020, 539, 012165. [Google Scholar] [CrossRef]
  14. Pavlenko, N.; Comer, B.; Zhou, Y.; Clark, N.; Rutherford, D. The Climate Implications of Using LNG as a Marine Fuel; International Council on Clean Transportation: Berlin, Germany, 2020. [Google Scholar]
  15. Herdzik, J. LNG as a marine fuel-possibilities and problem. J. KONES 2011, 18, 169–176. [Google Scholar]
  16. Stefana, E.; Marciano, F.; Alberti, M. Qualitative risk assessment of a Dual Fuel (LNG-Diesel) system for heavy-duty trucks. J. Loss Prev. Process. Ind. 2016, 39, 39–58. [Google Scholar] [CrossRef]
  17. IMO 2020—Cutting Sulphur Oxide Emissions. Available online: https://www.imo.org/en/MediaCentre/HotTopics/Pages/Sulphur-2020.aspx (accessed on 27 April 2025).
  18. Iannaccone, T.; Landucci, G.; Tugnoli, A.; Salzano, E.; Cozzani, V. Sustainability of cruise ship fuel systems: Comparison among LNG and diesel technologies. J. Clean. Prod. 2020, 260, 121069. [Google Scholar] [CrossRef]
  19. Unseki, T. Environmentally superior LNG-Fueled vessels. Mitsubishi Heavy Ind. Tech. Rev. 2013, 50, 37–43. [Google Scholar]
  20. Zhang, Y.; Jiang, H.; Li, J.; Shao, S.; Hou, H.; Qi, Y.; Zhang, S. Life cycle assessment and optimization analysis of different LNG usage scenarios. Int. J. Life Cycle Assess. 2017, 23, 1218–1227. [Google Scholar] [CrossRef]
  21. Langton, T. LNG prospects in the Asia–Pacific region. Resour. Policy 1994, 20, 257–264. [Google Scholar] [CrossRef]
  22. Jing, D.; Dai, L.; Hu, H.; Ding, W.; Wang, Y.; Zhou, X. CO2 emission projection for Arctic shipping: A system dynamics approach. Ocean Coast. Manag. 2021, 205, 105531. [Google Scholar] [CrossRef]
  23. Katebah, M.A.; Hussein, M.M.; Shazed, A.; Bouabidi, Z.; Al-Musleh, E.I. Rigorous simulation, energy and environmental analysis of an actual baseload LNG supply chain. Comput. Chem. Eng. 2020, 141, 106993. [Google Scholar] [CrossRef]
  24. Righi, M.; Hendricks, J.; Sausen, R. The global impact of the transport sectors on atmospheric aerosol in 2030—Part 1: Land transport and shipping. Atmos. Meas. Tech. 2015, 15, 633–651. [Google Scholar] [CrossRef]
  25. Ytreberg, E.; Åström, S.; Fridell, E. Valuating environmental impacts from ship emissions—The marine perspective. J. Environ. Manag. 2021, 282, 111958. [Google Scholar] [CrossRef]
  26. Stanivuk, T.; Mahić, J.; Stazić, L.; Perdić-Lukačević, H. LNG market and fleet analysis. Transp. Probl. 2021, 16, 173–183. [Google Scholar] [CrossRef]
  27. Khadka, B. Data Analysis Theory and Practice: Case: Python and Excel Tools. 2019. Available online: https://www.academia.edu/65189499/Data_analysis_theory_and_practice_Case_Python_and_Excel_Tools (accessed on 25 April 2025).
  28. BP Statistical Review of World Energy (2011–2024). Available online: https://www.bp.com/en/global/corporate/energy-economics/webcast-and-on-demand.html (accessed on 26 April 2025).
  29. Environmental Impact Statement (EIS)—Appendixes: Parts, I.; II; III. Available online: https://pnglng.com/Environment/Environmental-Impact-Statement (accessed on 12 April 2025).
  30. Meyer, D.Z.; Avery, L.M. Excel as a Qualitative Data Analysis Tool. Field Methods 2008, 21, 91–112. [Google Scholar] [CrossRef]
  31. Palocsay, S.W.; Markham, I.S.; Markham, S.E. Utilizing and teaching data tools in Excel for exploratory analysis. J. Bus. Res. 2010, 63, 191–206. [Google Scholar] [CrossRef]
  32. Nikhalat, H.; Zavitsas, K.; Mireille, E.H.; Bell, M.G. A Comparison of Oil and LNG Industries Performance Indicators: LNG Market Future Prediction. Available online: https://www.researchgate.net/publication/282119705_Predicting_the_future_of_LNG_market_A_review_and_comparison_of_oil_and_LNG_industries_performance_indicators_and_risk_factors (accessed on 26 April 2025).
  33. Medica-Viola, V.; Mrzljak, V.; Anđelić, N.; Jelić, M. Analysis of Low-Power Steam Turbine With One Extraction for Marine Applications. Nase More 2020, 67, 87–95. [Google Scholar] [CrossRef]
  34. Poljak, I.; Orović, J.; Knežević, V.; Mrzljak, V. LNG carrier main steam turbine reliability in the exploitation period of time. TransNav Int. J. Mar. Navig. Saf. Sea Transp. 2020, 14, 39–42. [Google Scholar]
  35. Huan, T.; Hongjun, F.; Wei, L.; Guoqiang, Z. Options and Evaluations on Propulsion Systems of LNG Carriers. In Propulsion Systems; IntechOpen: London, UK, 2019. [Google Scholar] [CrossRef]
  36. Svensson, B. Making The Most of BOG; Diesel & Gas Turbine Worldwide, vol. 4/2017; KHL Group: Southfields, UK, 2017; Available online: https://www.researchgate.net/publication/380978526_DFDE_and_Steam_Turbine_Propulsion_System_Energy_Efficiency_Operational_Index_comparison_on_board_LNG_Carrier (accessed on 28 April 2025).
  37. Yeo, D.; Ahn, B.; Kim, J.; Kim, I. Propulsion alternatives for modern LNG carriers. In Gas Technology Institute—15th International Conference and Exhibition on Liquefied Natural Gas, Barcelona, Spain, 24–27 April 2007; pp. 620–635. Available online: https://www.man-es.com/company/press-releases/press-details/2021/03/18/world-first-me-ga-engine-demonstration#:~:text=MAN%20Energy%20Solutions%20has%20has,its%20Copenhagen%20Research%20Centre%20today (accessed on 26 April 2025).
  38. MAN Energy Solutions. Available online: https://www.man-es.com/company/press-releases/press-details/2023/07/17/me-ga-opti-optimises-combustion-onboard-lng-carrier-newbuilding (accessed on 13 April 2025).
  39. United States Environmental Protection Agency (EPA)—Importance of Methane. Available online: https://www.epa.gov/gmi/importance-methane (accessed on 14 April 2025).
  40. European Commision—Decarbonising Maritime Transport—FuelEU Maritime. Available online: https://transport.ec.europa.eu/transport-modes/maritime/decarbonising-maritime-transport-fueleu-maritime_en (accessed on 14 April 2025).
  41. Diesel, M.A.N. Turbo, Propulsion Trends in LNG Carriers. 2013. Available online: https://www.yumpu.com/en/document/read/31495070/propulsion-trends-in-lng-carriers-man-diesel-turbo#google_vignette (accessed on 26 April 2025).
  42. DNV IMO MEPC 83: GHG Requirements Approved, Taking Effect from 2028. Available online: https://www.dnv.com/news/imo-mepc-83-ghg-requirements-approved-taking-effect-from-2028/ (accessed on 15 April 2025).
  43. Wood, D.A. The evolution of global liquefied natural gas supply chains: A review. In Sustainable Liquefied Natural Gas; Elsevier: Amsterdam, The Netherlands, 2024; pp. 23–55. [Google Scholar] [CrossRef]
  44. Ke, R.; Wang, X.; Peng, P. Analysis of the Impact of the Russia–Ukraine Conflict on Global Liquefied Natural Gas Shipping Network. J. Mar. Sci. Eng. 2024, 13, 53. Available online: https://www.mdpi.com/2077-1312/13/1/53#:~:text=Ports%20in%20LNG%20import%20countries,has%20a%20very%20limited%20change (accessed on 17 April 2025). [CrossRef]
  45. Riviera. MAN ES Cuts ME-GA from Its Two-Stroke Engine Programme. Available online: https://www.rivieramm.com/news-content-hub/news-content-hub/man-es-cuts-me-ga-from-its-two-stroke-engine-programme-82833 (accessed on 16 April 2025).
  46. Rystad Energy. Gas & LNG Markets; Rystad Energy: Oslo, Norway, 2021. [Google Scholar]
Figure 1. Number of LNG-importing countries from 2010 to 2024 [7,26,30].
Applsci 15 05973 g001
Figure 2. Number of LNG-exporting countries from 2010 to 2025 [7,26,30].
Applsci 15 05973 g002
Figure 3. Volume of LNG trade from 2010 to 2024 [7,26,30].
Applsci 15 05973 g003
Figure 4. Number of LNG ships (fleet size) from 2010 to 2024 [7,26,30].
Applsci 15 05973 g004
Figure 5. Propulsion market share prediction from the previous research [26,30].
Applsci 15 05973 g005
Figure 6. Order book of LNG vessels for 2025 [7].
Applsci 15 05973 g006
Figure 7. Number of LNG-importing countries with future prediction [7,30].
Applsci 15 05973 g007
Figure 8. Number of LNG-exporting countries with future prediction [7,30].
Applsci 15 05973 g008
Figure 9. LNG trade volume in MT with future predictions [7,30].
Applsci 15 05973 g009
Figure 10. Number of LNG vessels in use with future prediction [7,30].
Applsci 15 05973 g010
Table 1. Importing countries comparison [7,26,30].
YearPredictedRealizedDifference (%)
202039390
20214142+2.38
20224344+2.27
202346460
20244851+6.25
Table 2. Exporting countries comparison with the previous research [7,26,30].
YearPredictedRealizedDifference (%)
202020200
202120200
20222120−4.76
20232120−4.76
20242120−4.76
Table 3. LNG trade volume comparison with the previous research [7,26,30].
YearPredictedRealizedDifference (%)
2020368.6356.1−3.39
2021383.0372.3−2.79
2022398.1401.2+0.77
2023413.7401.4−2.97
2024429.9401.42−6.62
Table 4. LNG fleet size comparison with the previous research [7,26,30].
YearPredictedRealizedDifference (%)
2020584.0572−2.05
2021650.0607−6.61
2022706.0641−9.20
2023755.0668−11.52
2024803.0701−12.70
Table 5. Propulsion type characteristics [7].
Propulsion TypeFuel Consumption (tons/Day)
Steam175
DFDE/TFDE130
MEGI110
ME-GA109
XDF108
Disclaimer/Publisher’s Note: The statements, opinions and data contained in all publications are solely those of the individual author(s) and contributor(s) and not of MDPI and/or the editor(s). MDPI and/or the editor(s) disclaim responsibility for any injury to people or property resulting from any ideas, methods, instructions or products referred to in the content.

