Article

Removal of COD from Secondary Effluent Using Fenton Iron Sludge-Based Biochar/Fe(VI)/H2O2 Process

1
School of Environmental Science and Engineering, Tianjin University, Tianjin 300072, China
2
School of Mechanical Engineering, Tianjin University of Commerce, Tianjin 300134, China
*
Authors to whom correspondence should be addressed.
Appl. Sci. 2025, 15(11), 5945; https://doi.org/10.3390/app15115945 (registering DOI)
Submission received: 2 April 2025 / Revised: 10 May 2025 / Accepted: 23 May 2025 / Published: 25 May 2025
(This article belongs to the Special Issue Wastewater Treatment and Purification Technologies)

Abstract

:
The conventional Fenton process generates large amounts of Fenton sludge during wastewater treatment. Achieving effective utilization of Fenton sludge and reducing its production remain pivotal challenges. In this study, Fenton sludge biochar catalysts (Cat) were prepared using Fenton sludge via pyrolysis. In addition, chemical oxygen demand (COD) from secondary effluent was removed by Fenton sludge biochar catalysts activated with H2O2/Fe(VI). Specifically, the removal efficiency of COD could reach 46.2% in the Cat−2/H2O2/Fe(VI) system under weakly alkaline conditions. The mechanistic analysis confirmed that high-valent iron, OH, O2•−, and 1O2 all participate in the degradation process. Furthermore, a continuous-flow reactor was applied to treat secondary effluent, with COD decreasing from 65 mg/L to 36 mg/L. This study provides new insights into the resource utilization of Fenton sludge and the treatment of complex wastewater.

1. Introduction

The hydrogen peroxide (H2O2)-based Fenton-like heterogeneous system has attracted significant attention due to catalyst recyclability, strong system controllability and adaptability, as well as the absence of iron sludge [1]. Currently, natural minerals (e.g., hematite α-Fe2O3 and magnetite Fe3O4), synthetic iron oxides (e.g., FeOOH), iron-carbon composite material (e.g., sludge-derived biochar and iron-loaded carbon nanotubes), metal-organic frameworks (MOFs), and non-metallic carbon-based materials (e.g., nitrogen-doped graphene and porous carbon) have been utilized for the activation of H2O2 in the removal of organic contaminants [2]. Among them, municipal wastewater sludge-derived biochar combines the advantages of green, sustainable, and abundant active sites, making it an effective material for promoting the activation of H2O2 [3].
Fenton sludge is an inevitable byproduct of the Fenton oxidation process in wastewater treatment plants, which is considered as hazardous waste with a large yield, complex composition and secondary pollution [4]. Therefore, the generation of Fenton sludge limits the further widespread application of the Fenton process in wastewater treatment [5]. Currently, the treatment methods for Fenton sludge include landfilling, incineration, and use as an additive in construction materials. However, landfilling occupies land resources and can lead to soil and groundwater contamination due to the leaching of heavy metals, while incineration is energy-intensive and may produce toxic gases such as dioxins [6]. Additionally, the complexity of the iron sludge composition may affect the performance of the building materials when Fenton sludge is used as an additive directly in construction materials. These methods present environmental risks and hinder the efficient recycling of resources [7]. The conversion of Fenton iron sludge into catalysts has significant advantages in terms of resources and the environment. Iron species in the sludge (such as Fe2O3 and Fe3O4) combine with the heterogeneous carbon matrix to form stable active sites (Fe-O) during pyrolysis, enabling the efficient recovery and utilization of iron. Simultaneously, high-temperature treatment can stabilize heavy metals to reduce the risk of secondary pollution [8]. The obtained iron-carbon composites can enhance electron transfer efficiency and promote the activation of H2O2 to generate ·OH radicals, degrading organic pollutants effectively across a wide pH range [9]. Moreover, the pyrolysis process can achieve Fenton sludge reduction (weight reduction rate > 50%) [10] and optimize catalyst performance to meet different wastewater treatment needs [11]. This technology provides a sustainable solution for the high-value utilization of Fenton sludge and wastewater treatment.
In recent years, studies have explored the use of Fenton sludge-derived biochar in H2O2-based Fenton-like systems. Guo [12] synthesize Fe2O3 using Fenton sludge under different pyrolysis temperatures (400, 600, and 800 °C). The degradation rate of rhodamine B reached 100% within 100 min at pH = 5 in the sludge-based catalyst/H2O2 system. However, the pH of Fenton sludge biochar catalysts/H2O2 system tended to be acidic [13], which could lead to catalyst dissolution, reducing catalytic activity and causing secondary pollution. Therefore, controlling the pH of the system is crucial. Research has shown that high ferrates and H2O2 exhibited a synergistic effect. Zhang [14] found that the degradation rate of methylene blue (MB) could reach up to 91% in the Fe(VI)/H2O2 system under weakly alkaline conditions. However, studies on introducing high ferrates into the Fenton sludge biochar catalyst/H2O2 system are still lacking, which is critical for overcoming the limitations of the Fenton sludge biochar catalyst/H2O2 system.
This study aims to develop an efficient and stable Fenton sludge biochar catalyst for activating H2O2/Fe(VI) to degrade organic pollutants. In addition, the removal performance of chemical oxygen demand (COD) from actual secondary effluent by a Fenton sludge biochar/H2O2/Fe(VI) system was evaluated. First, the structure and activity of the Fenton sludge biochar catalyst under different pyrolysis times were analyzed, and the effects of operational parameters on the system were discussed. Then, the activation mechanism of H2O2/Fe(VI) by the Fenton sludge biochar catalyst was revealed through reactive oxygen species (ROS) identification. Finally, a continuous-flow reactor was designed to assess the practical application potential of the Fenton sludge biochar catalyst/H2O2/Fe(VI) system. This work provides a new perspective for the development and design of Fenton sludge biochar catalysts, advancing their practical application in complex aqueous matrices.

2. Materials and Methods

2.1. Chemicals and Materials

MB and potassium ferrate (K2FeO4) were purchased from Aladdin (analytical grade). Other chemicals, including H2O2 (30%), sodium hydroxide (NaOH), sulfuric acid (H2SO4), tert-butyl alcohol (TBA), chloroform (CF), furfural (FFA), borax, and boric acid, were obtained from Sinopharm. The radical scavengers 5,5-dimethylpyrroline-N-oxide (DMPO) and 2,2,6,6-tetramethylpiperidine-1-oxide (TEMP) were acquired from Sigma-Aldrich (St. Louis, MI, USA). All solutions were prepared using deionized water.

2.2. Preparation of Iron Sludge-Based Catalyst

Waste iron sludge was collected from a wastewater treatment plant in Wuxi and dried in a constant-temperature drying oven at 60 °C for 24 h. The dried sludge was then ground using a mortar and pestle and sieved through a 100-mesh screen. The Fenton sludge biochar catalyst was prepared via pyrolysis in a tube furnace. The furnace temperature was raised to 700 °C at a heating rate of 10 °C/min and maintained for 1, 2, 3, 4, and 5 h, respectively. Meanwhile, nitrogen gas was continuously introduced into the tube furnace at a flow rate of 150 mL/min. After the quartz tube cooled to room temperature, the Fenton sludge biochar catalyst was extracted, sealed, and stored for later use. The catalysts prepared with pyrolysis times of 1, 2, 3, 4, and 5 h were named Cat−1, Cat−2, Cat−3, Cat−4, and Cat−5, respectively. In addition, the mass of the Fenton sludge could be reduced from 20 g before pyrolysis to 5.6 g after pyrolysis. Therefore, the weight of iron sludge was reduced by more than 70% after pyrolysis, achieving “weight reduction”.

2.3. Characterization

The crystal structure of the Fenton iron-peat catalyst was characterized using an X-ray diffractometer (XRD) (Rigaku SmartLab 9 kW, Rigaku, Osaka, Japan) with Cu Kα radiation. The surface morphology of samples was captured using a scanning electron microscope (SEM, Genimi500, Zelss, Germany). Raman spectra were acquired with a Horiba Lab RAM HR Evolution spectrometer (HORIBA Jobin Yvon, Kyoto, Japan). The N2 adsorption-desorption isotherms at −196 °C were measured using an Autosorb-IQ3 automatic gas adsorption analyzer (Quantachrome Instrument, Boynton Beach, FL, USA). The specific surface area was determined by the multipoint Brunauer–Emmett–Teller (BET) method. At the same time, the single-point pore volume was estimated from the adsorption quantity at a relative pressure of 0.99 Pa. X-ray photoelectron spectroscopy (XPS) analysis was performed using a Thermo ESCALAB 250 instrument with an Al Kα radiation source (Thermo Fisher Scientific, Massachusetts, USA). The chemical oxygen demand (COD) removal efficiency of secondary effluent was evaluated using a COD analyzer (DR1010, Hach, Loveland, CO, USA). X-ray fluorescence (XRF) spectroscopy was employed to analyze the elemental composition of the raw Fenton iron sludge (ZSX PRIMUS II, Rigaku, Japan). Additionally, reactive oxygen species (ROS) in the system were qualitatively analyzed using an electron paramagnetic resonance (EPR) spectrometer (JES-FA200, JEOL, Tokyo, Japan). COD measurements were conducted with a rapid digestion instrument (DRB 200, Hach, USA) and a spectrophotometer (DR900, Hach, USA).

2.4. Catalytic Activity Measurements

At room temperature, MB solutions of 50 mg/L were prepared, and the initial pH of the reaction system was adjusted using either a 0.1 mol/L NaOH solution or a 0.1 mol/L H2SO4 solution. Specifically, 0.05 g of iron mud catalyst was dispersed uniformly into 100 mL of MB solution with stirring for 90 min to reach adsorption equilibrium. The sample with a volume of 2.5 mL was withdrawn at periodic intervals (0, 2, 5, 10, 20, 30, 40, 60, and 90 min) and filtered with a 0.22 μm polytetrafluoroethylene (PTFE) filter. Subsequently, 0.8 mM of H2O2 was injected into the reaction system instantly. The sample with a volume of 2.5 mL was withdrawn at 0, 5, 10, 20, 30, 60, 90, and 120 min. Meanwhile, 0.1 mL of 0.5 M sodium thiosulfate was added to the sample immediately to quench excess oxidant. In addition, the MB was tested by a UV-visible spectrophotometer at 664 nm. All experiments in this study were repeated three times.

2.5. The Removal Performance of COD in Secondary Effluent

The secondary effluent from a wastewater treatment plant in Wuxi, China, was selected as a real complex water matrix to evaluate the catalytic activity of the Fenton iron-peat catalyst. The initial COD of the wastewater is 70 mg/L in the study. The initial pH of the reaction system was adjusted using a borate buffer solution. In a 200 mL beaker, a specific amount of Cat−2 was mixed thoroughly with the wastewater by ultrasound. After reaching adsorption equilibrium, a predetermined amount of H2O2 and K2FeO4 was added, and stirring was continued. The concentrations of H2O2, potassium ferrate, and catalyst were 0.8 mM, 0.1 mM, and 0.5 g/L, respectively. In the experiment, to study the effect of H2O2 concentration on COD degradation, the concentrations of H2O2 were 0.8 mM, 1.0 mM and 1.5 mM, respectively. At specific time intervals, 2 mL of supernatant was sampled, filtered through a 0.22 μm aqueous filter, and mixed with Hach reagents. The low-range COD ampoules (HACH Chemical) containing the water samples were then placed in a preheated digestion instrument at 150 °C for 2 h. After cooling the digestion instrument to 120 °C, the COD ampoules were removed and shaken several times. The ampoules were then cooled to room temperature for measurement. Furthermore, the effects of key operational parameters on system performance were investigated, including catalyst dosage, pH, oxidant concentration, and the oxidant concentration ratio. All experiments in this study were repeated three times. In addition, the potential application of the Cat−2/H2O2/Fe(VI) system was evaluated in a 4 L continuous-flow reactor for COD removal from wastewater. In a small-scale continuous flow experiment, the reflux ratio is 1:4, the pH is 8.1 (±0.1), the concentration of hydrogen peroxide is 0.8 mM, the concentration of potassium ferrate is 0.1mM, and 120 g of catalyst is placed in each layer.
The reactor was shown in Figure 1. The reactor operated in a bottom-in and top-out mode with partial reflux. Initially, 3 L of sewage and 306.44 µL of H2O2 were added to the mixer. The water inlet pump flow rate was then set to maximum, and raw water was added to the reactor at the fastest possible speed. Once all the water samples from the mixer had flowed into the reactor, another 3 L of sewage, 306.44 µL of H2O2, and 200 µL of H2SO4 were added to the mixer. The raw water was again pumped into the reactor through the water inlet pump. When the water level in the reactor reached the outlet, the water inlet pump was turned off. Reflux was then initiated, and 0.09902 g of potassium ferrate was added to the upper port of the reactor. The potassium ferrate was quickly mixed evenly through reflux. After the reactor had reacted for 2.5 h, the water inlet pump was turned back on, with the flow rate set to 26.01 mL/min. Simultaneously, the potassium ferrate drug inlet pump was activated, with a flow rate of 1 mL/min, and the potassium ferrate was fed into the reactor from the upper reflux port. This process continues for 72 h.

2.6. Reactive Oxygen Capture Assay

Reactive oxygen species (ROS) were identified through scavenging experiments. In this study, TBA (2 mol/L) and CF (240 mmol/L) were used as scavengers for hydroxyl radicals (OH) and superoxide radicals (O2⁻), respectively. FFA (120 mmol/L) was employed to quench OH and singlet oxygen (1O2) (k1O2, FFA = 1.2 × 10⁸ M−1·s−1, kOH, FFA = 1.5 × 10¹⁰ M−1·s−1) [15]. After adsorption equilibrium was reached, H₂O₂ and the corresponding scavenger were added, and the remaining steps followed the MB degradation experiment protocol. Additionally, the presence of OH, O2⁻, and high valent iron was verified using the spin-trapping agent DMPO, while the existence of 1O2 was confirmed using TEMP. Moreover, the reaction between high-valent iron species and methyl phenyl sulfoxide (PMSO) generates methyl phenyl sulfone (PMSO2), allowing for the identification of potential high-valent iron species through the consumption of PMSO and the formation of PMSO2. During the experiment, a 0.1 mM PMSO solution was introduced into the system, and samples were collected at 0, 5, 15, 30, 60, and 120 min using a syringe. The samples were then filtered through a 0.22 μm membrane and analyzed. Sodium thiosulfate (0.5 M) was used as a quenching agent, and the concentrations of PMSO and PMSO2 were determined using high-performance liquid chromatography (HPLC).

3. Results and Discussion

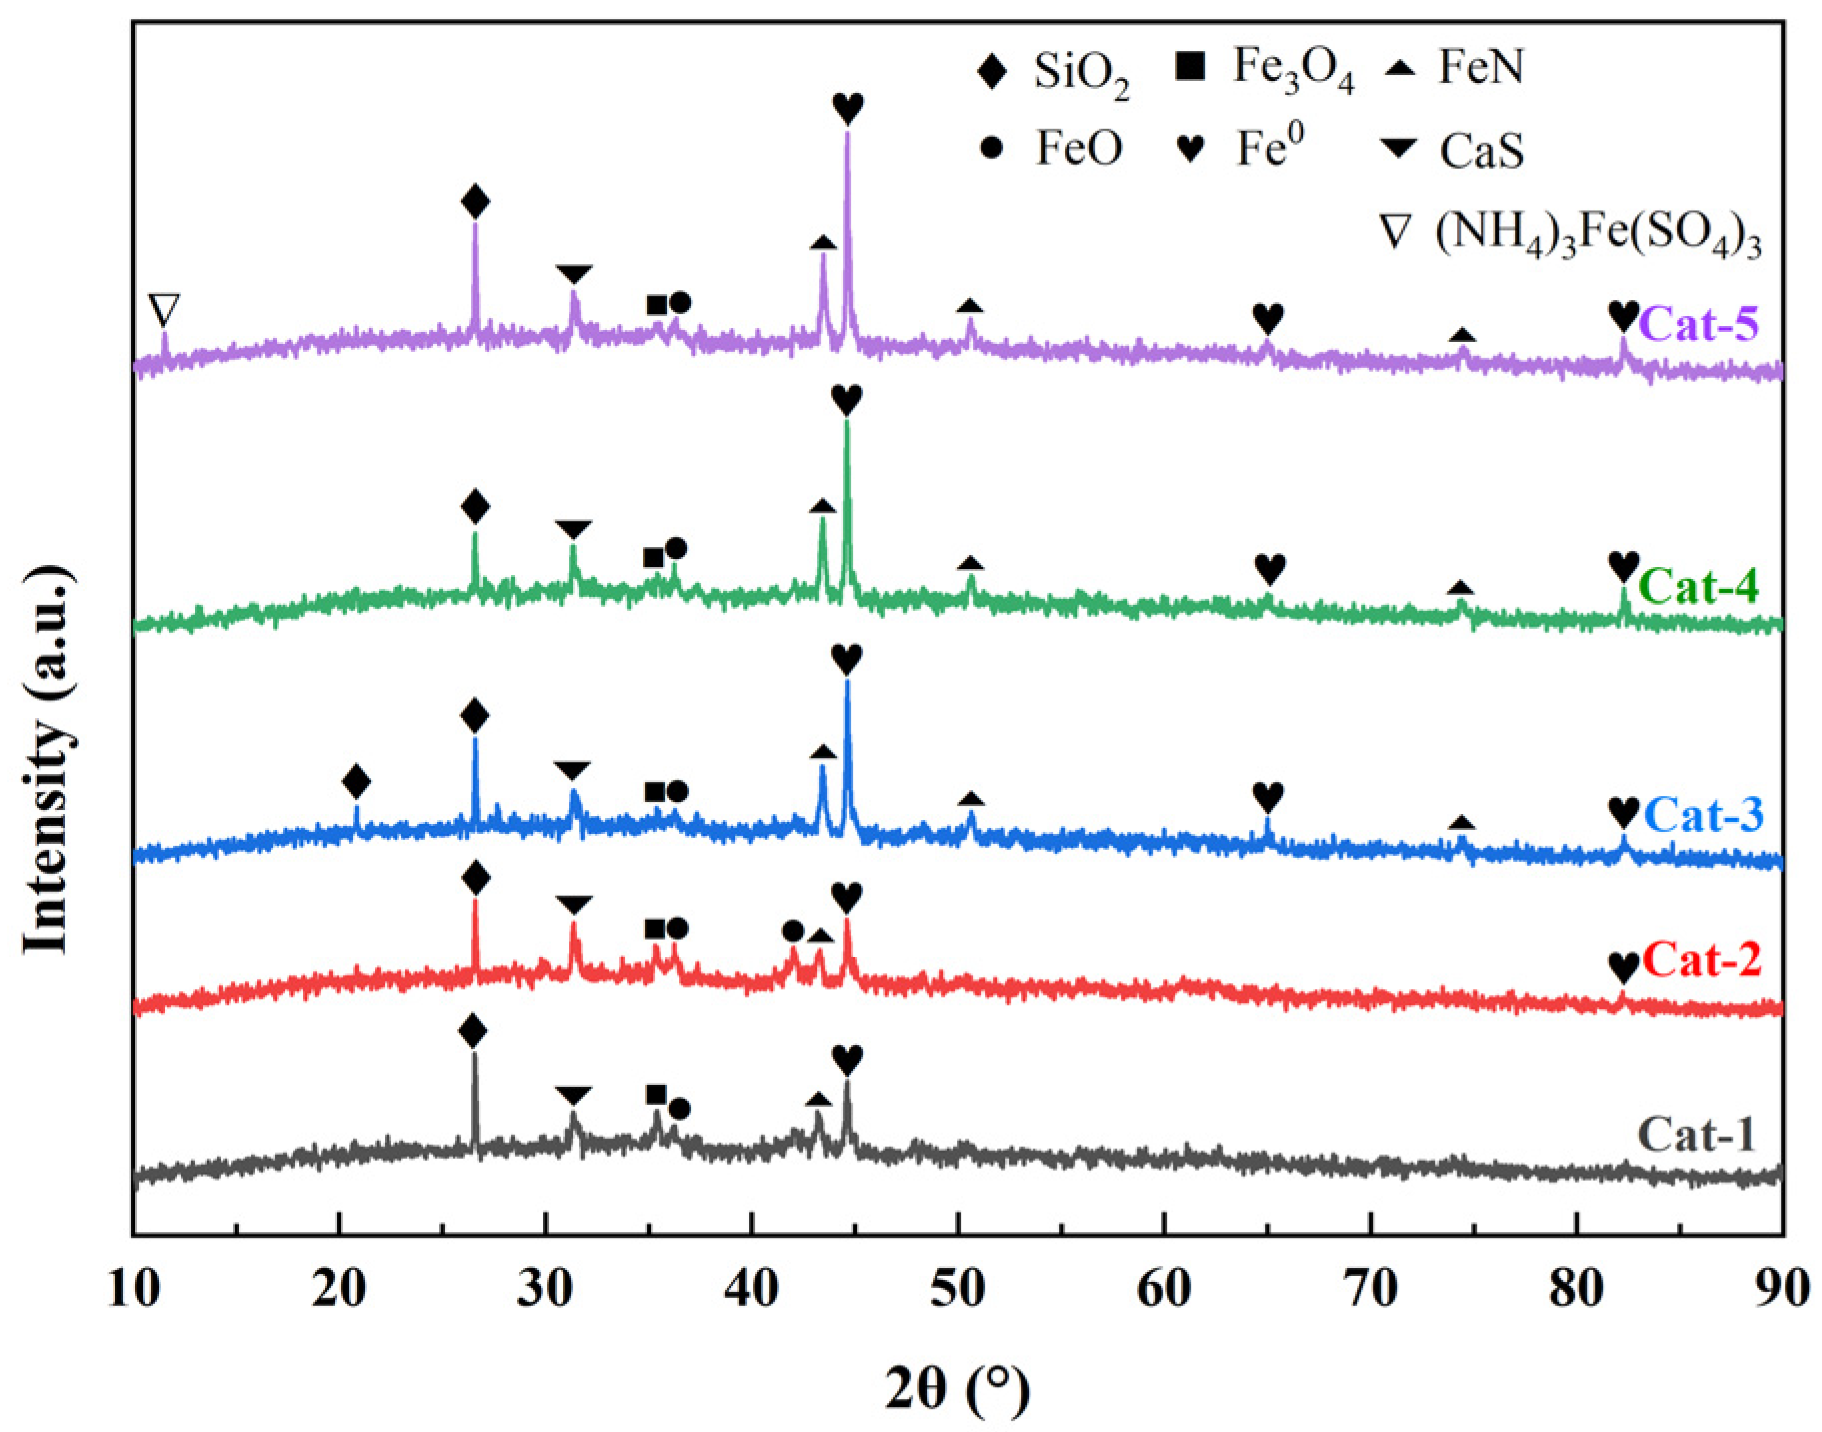
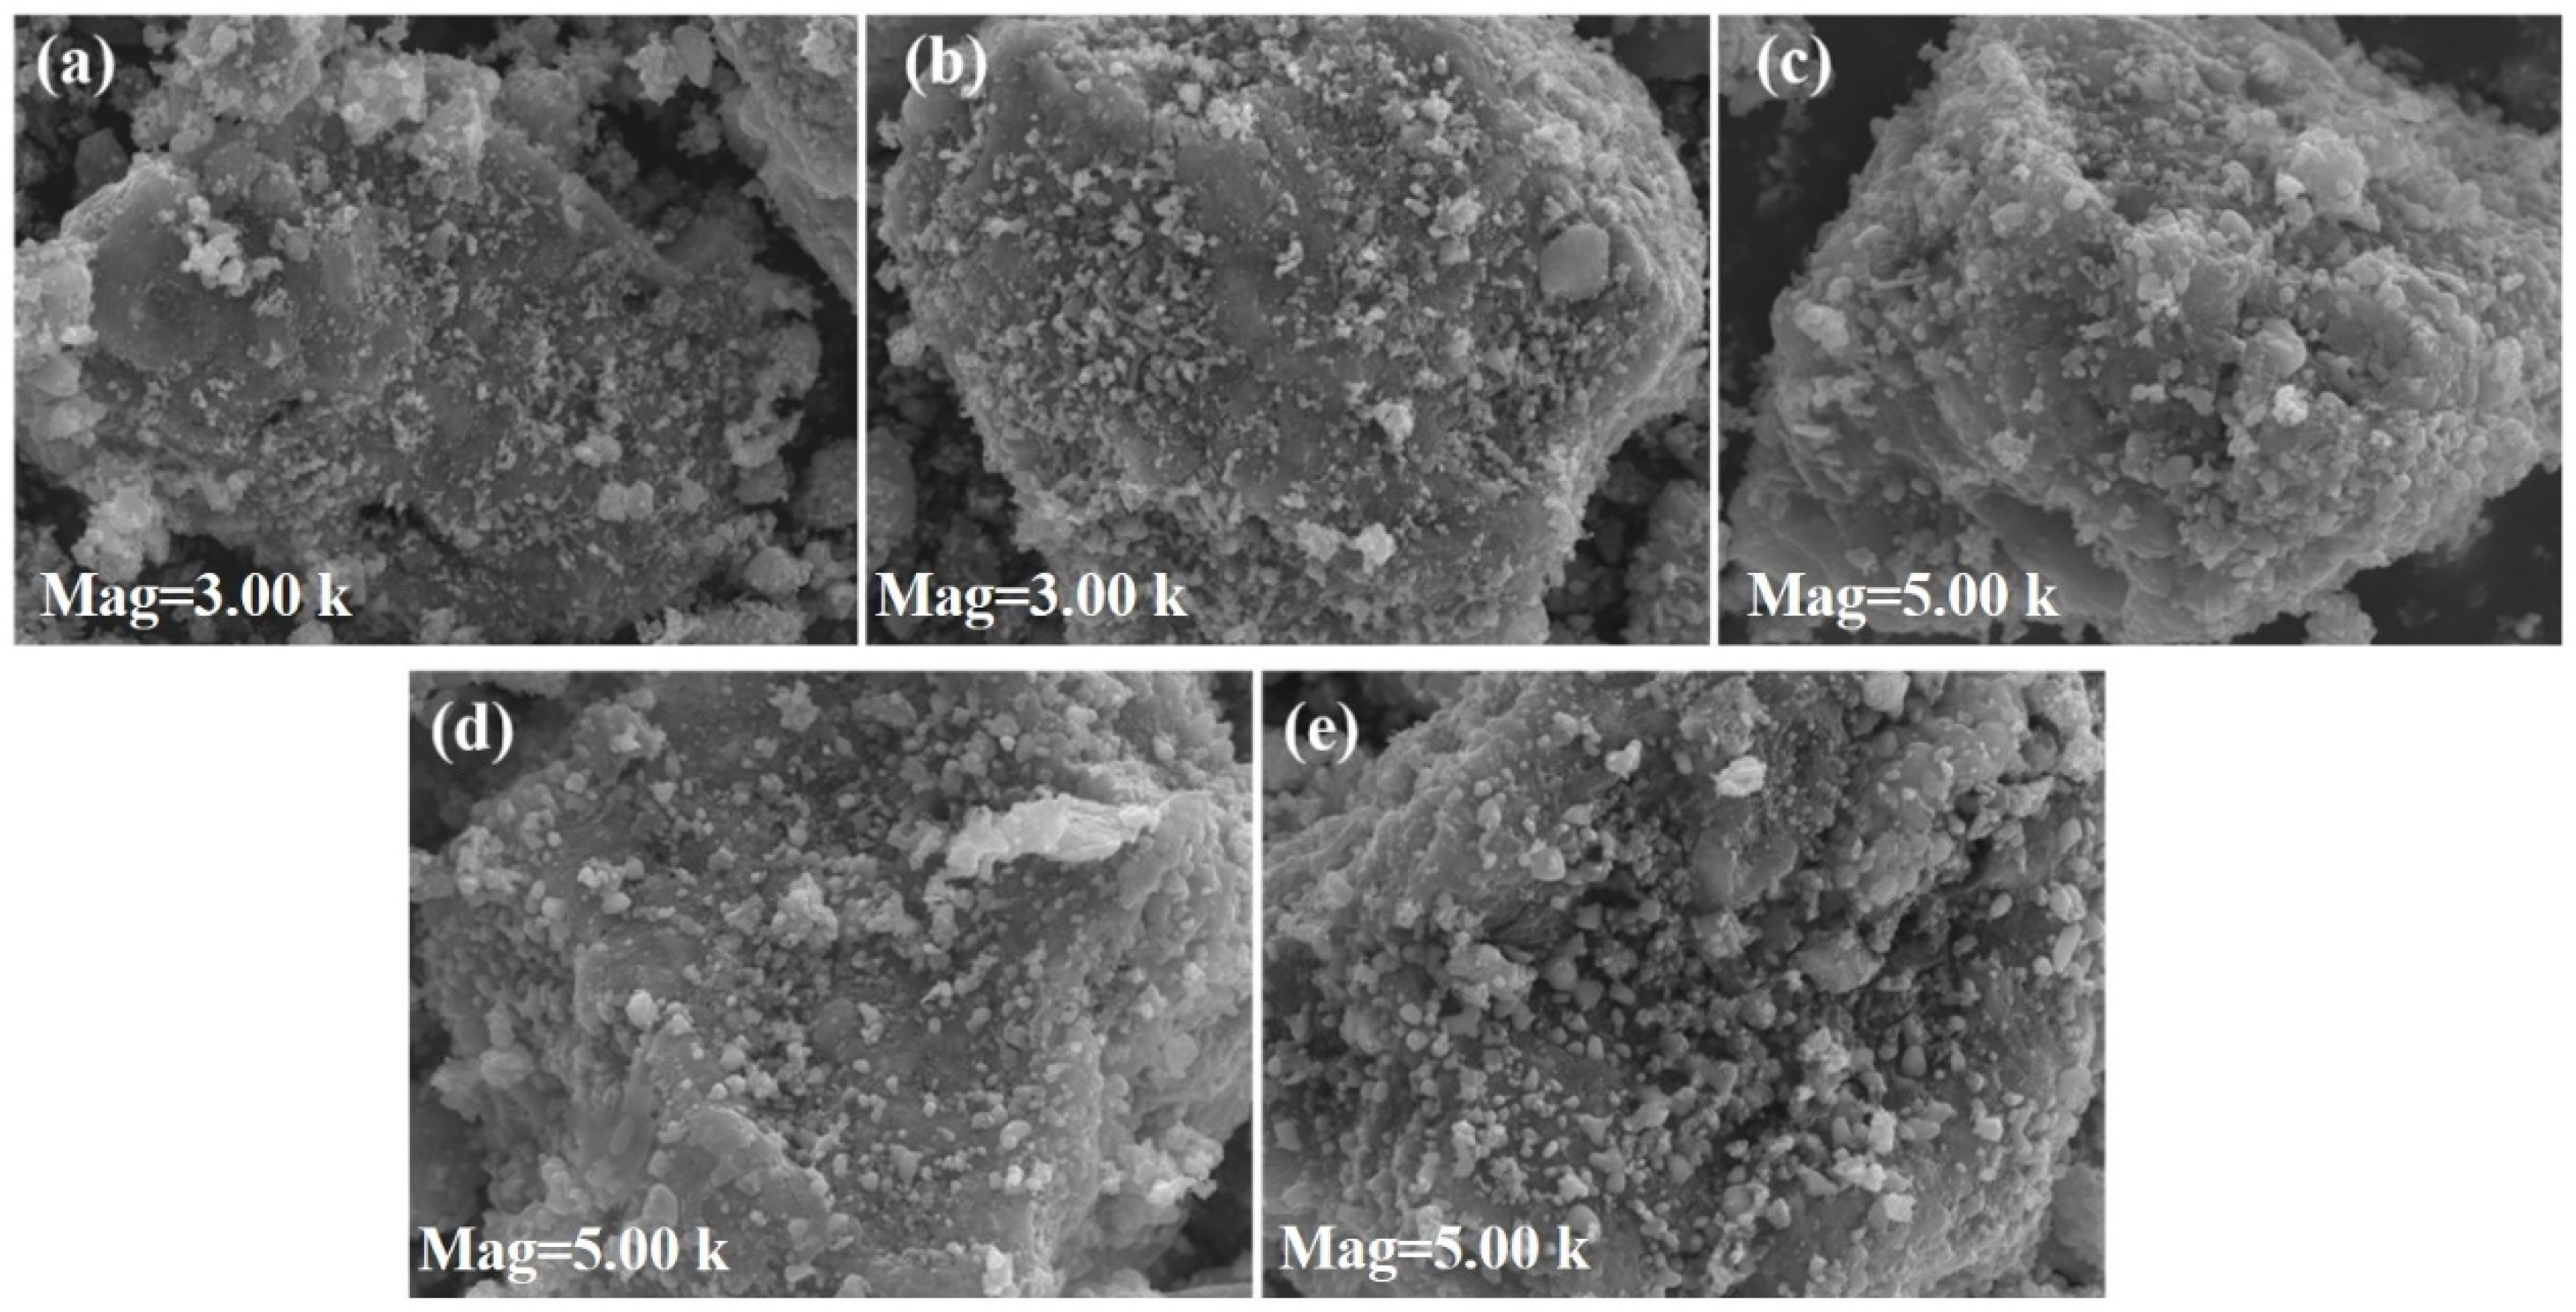
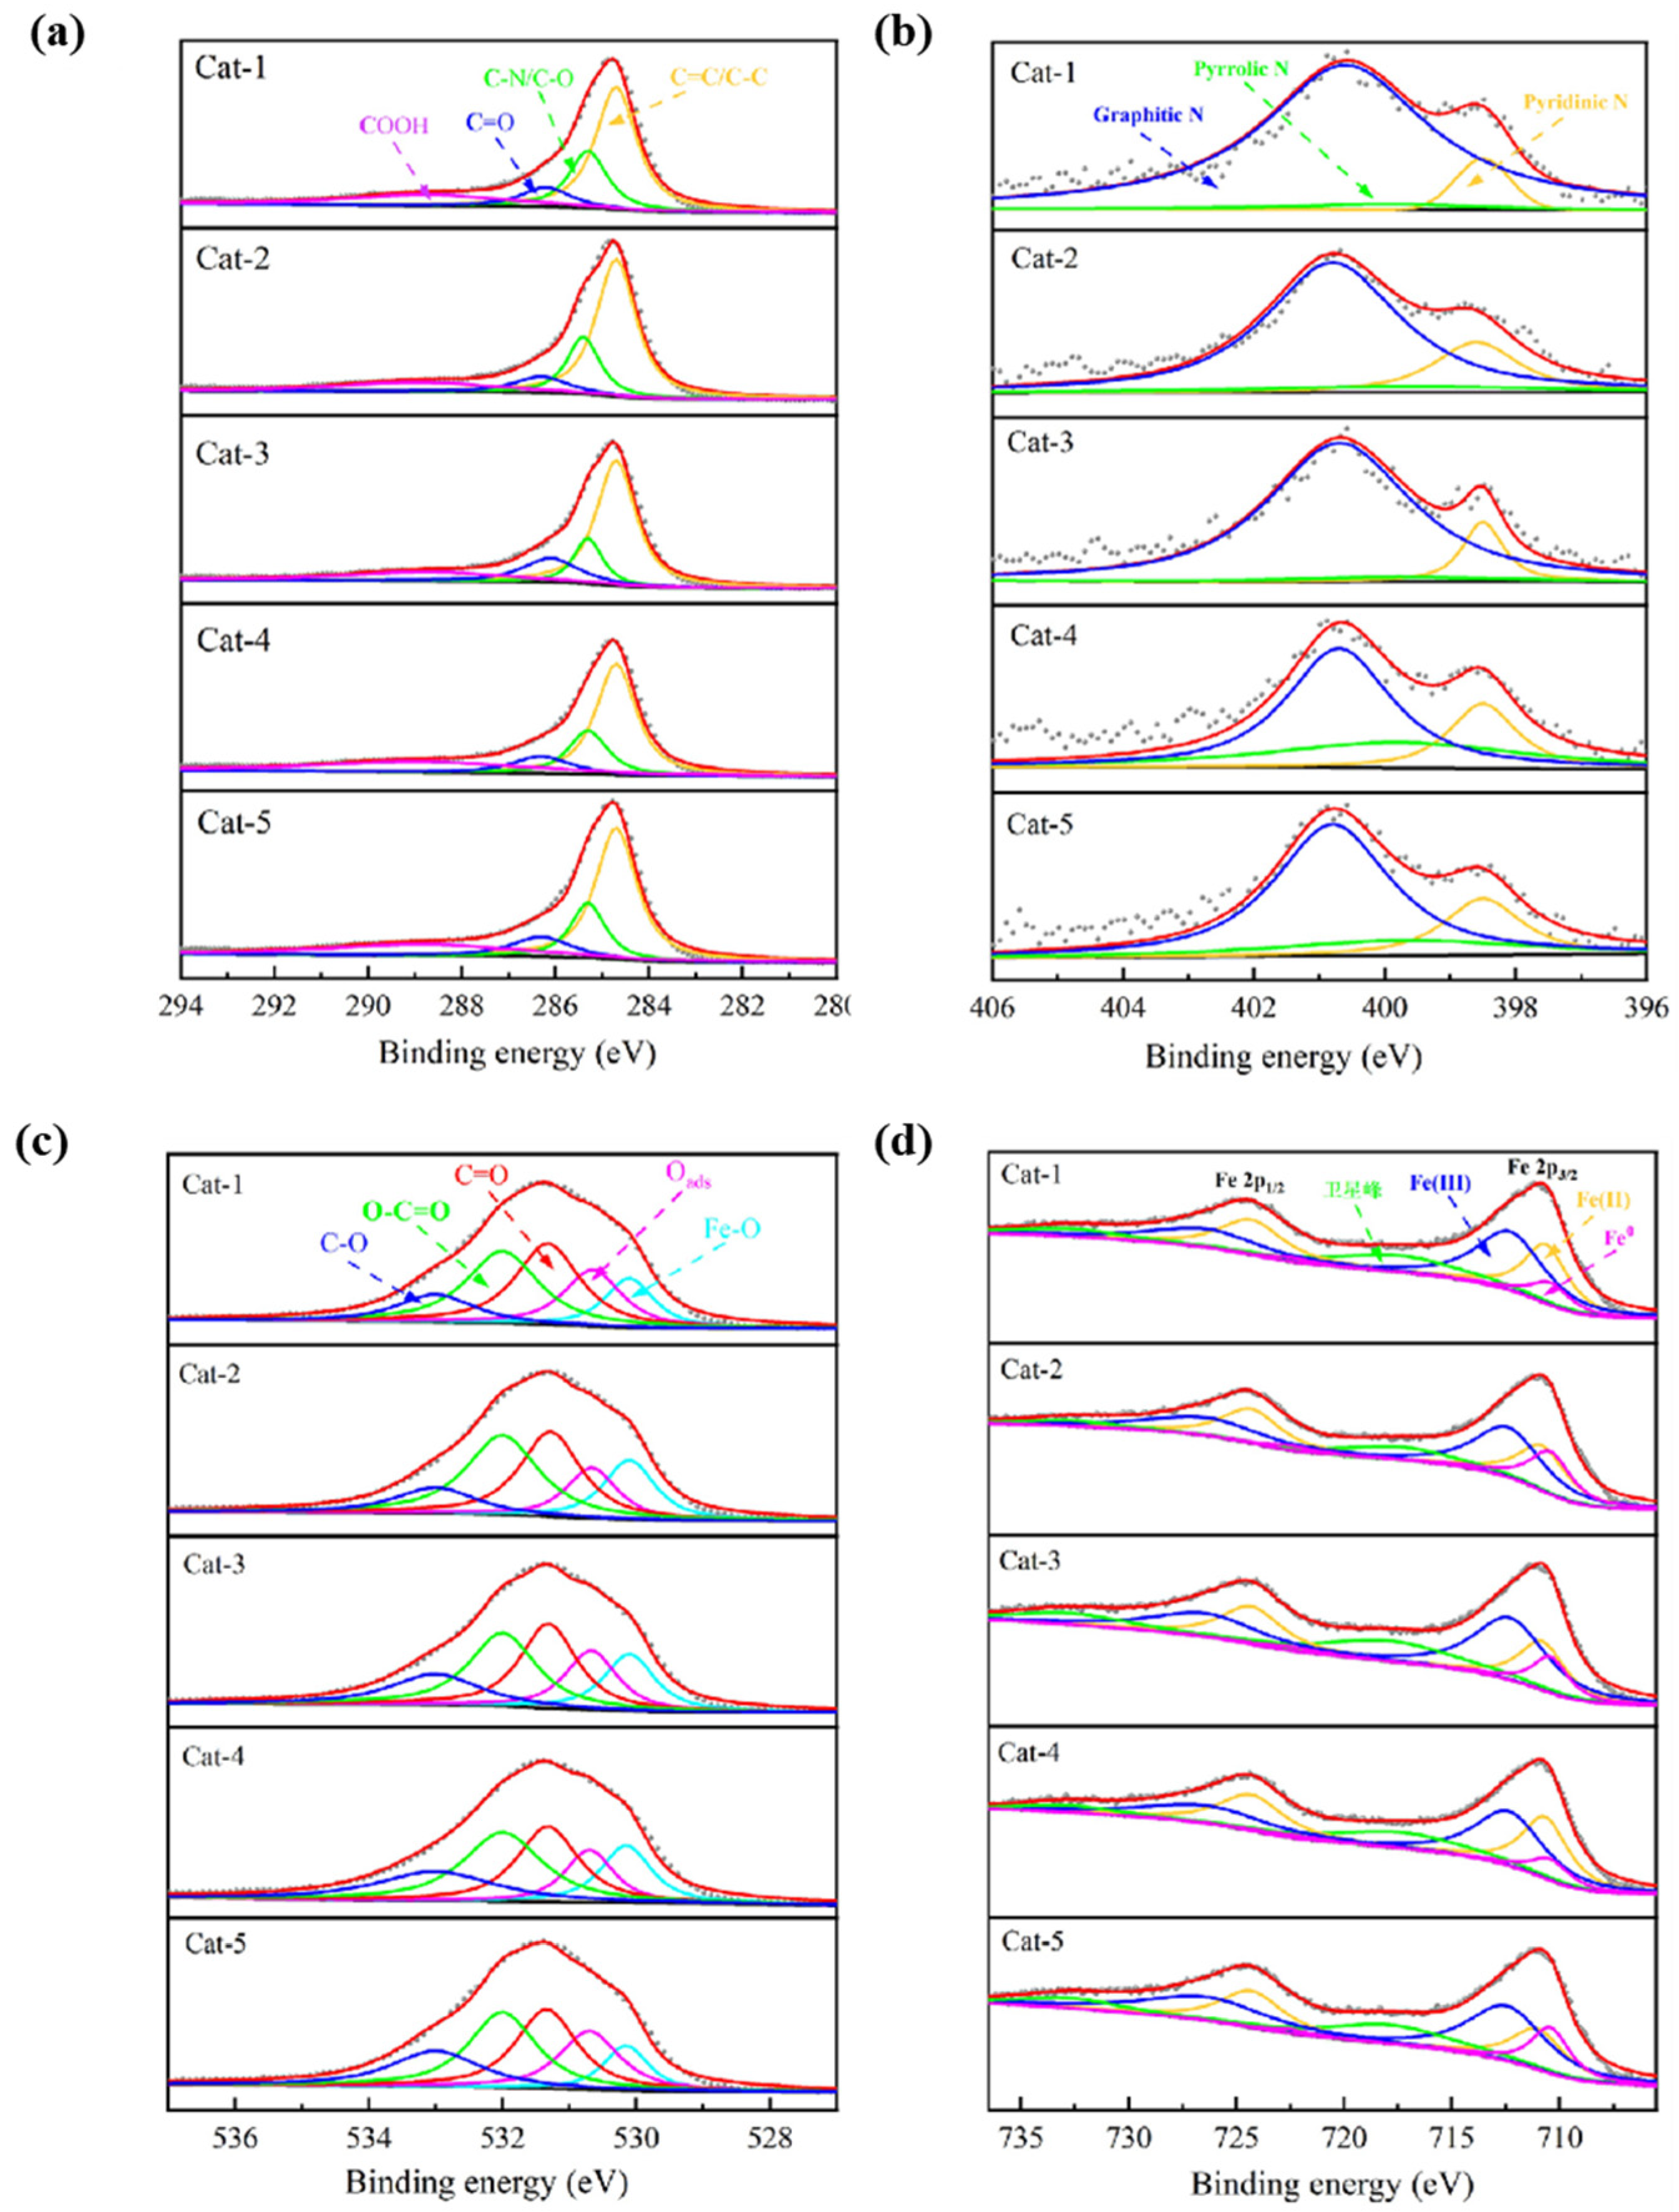
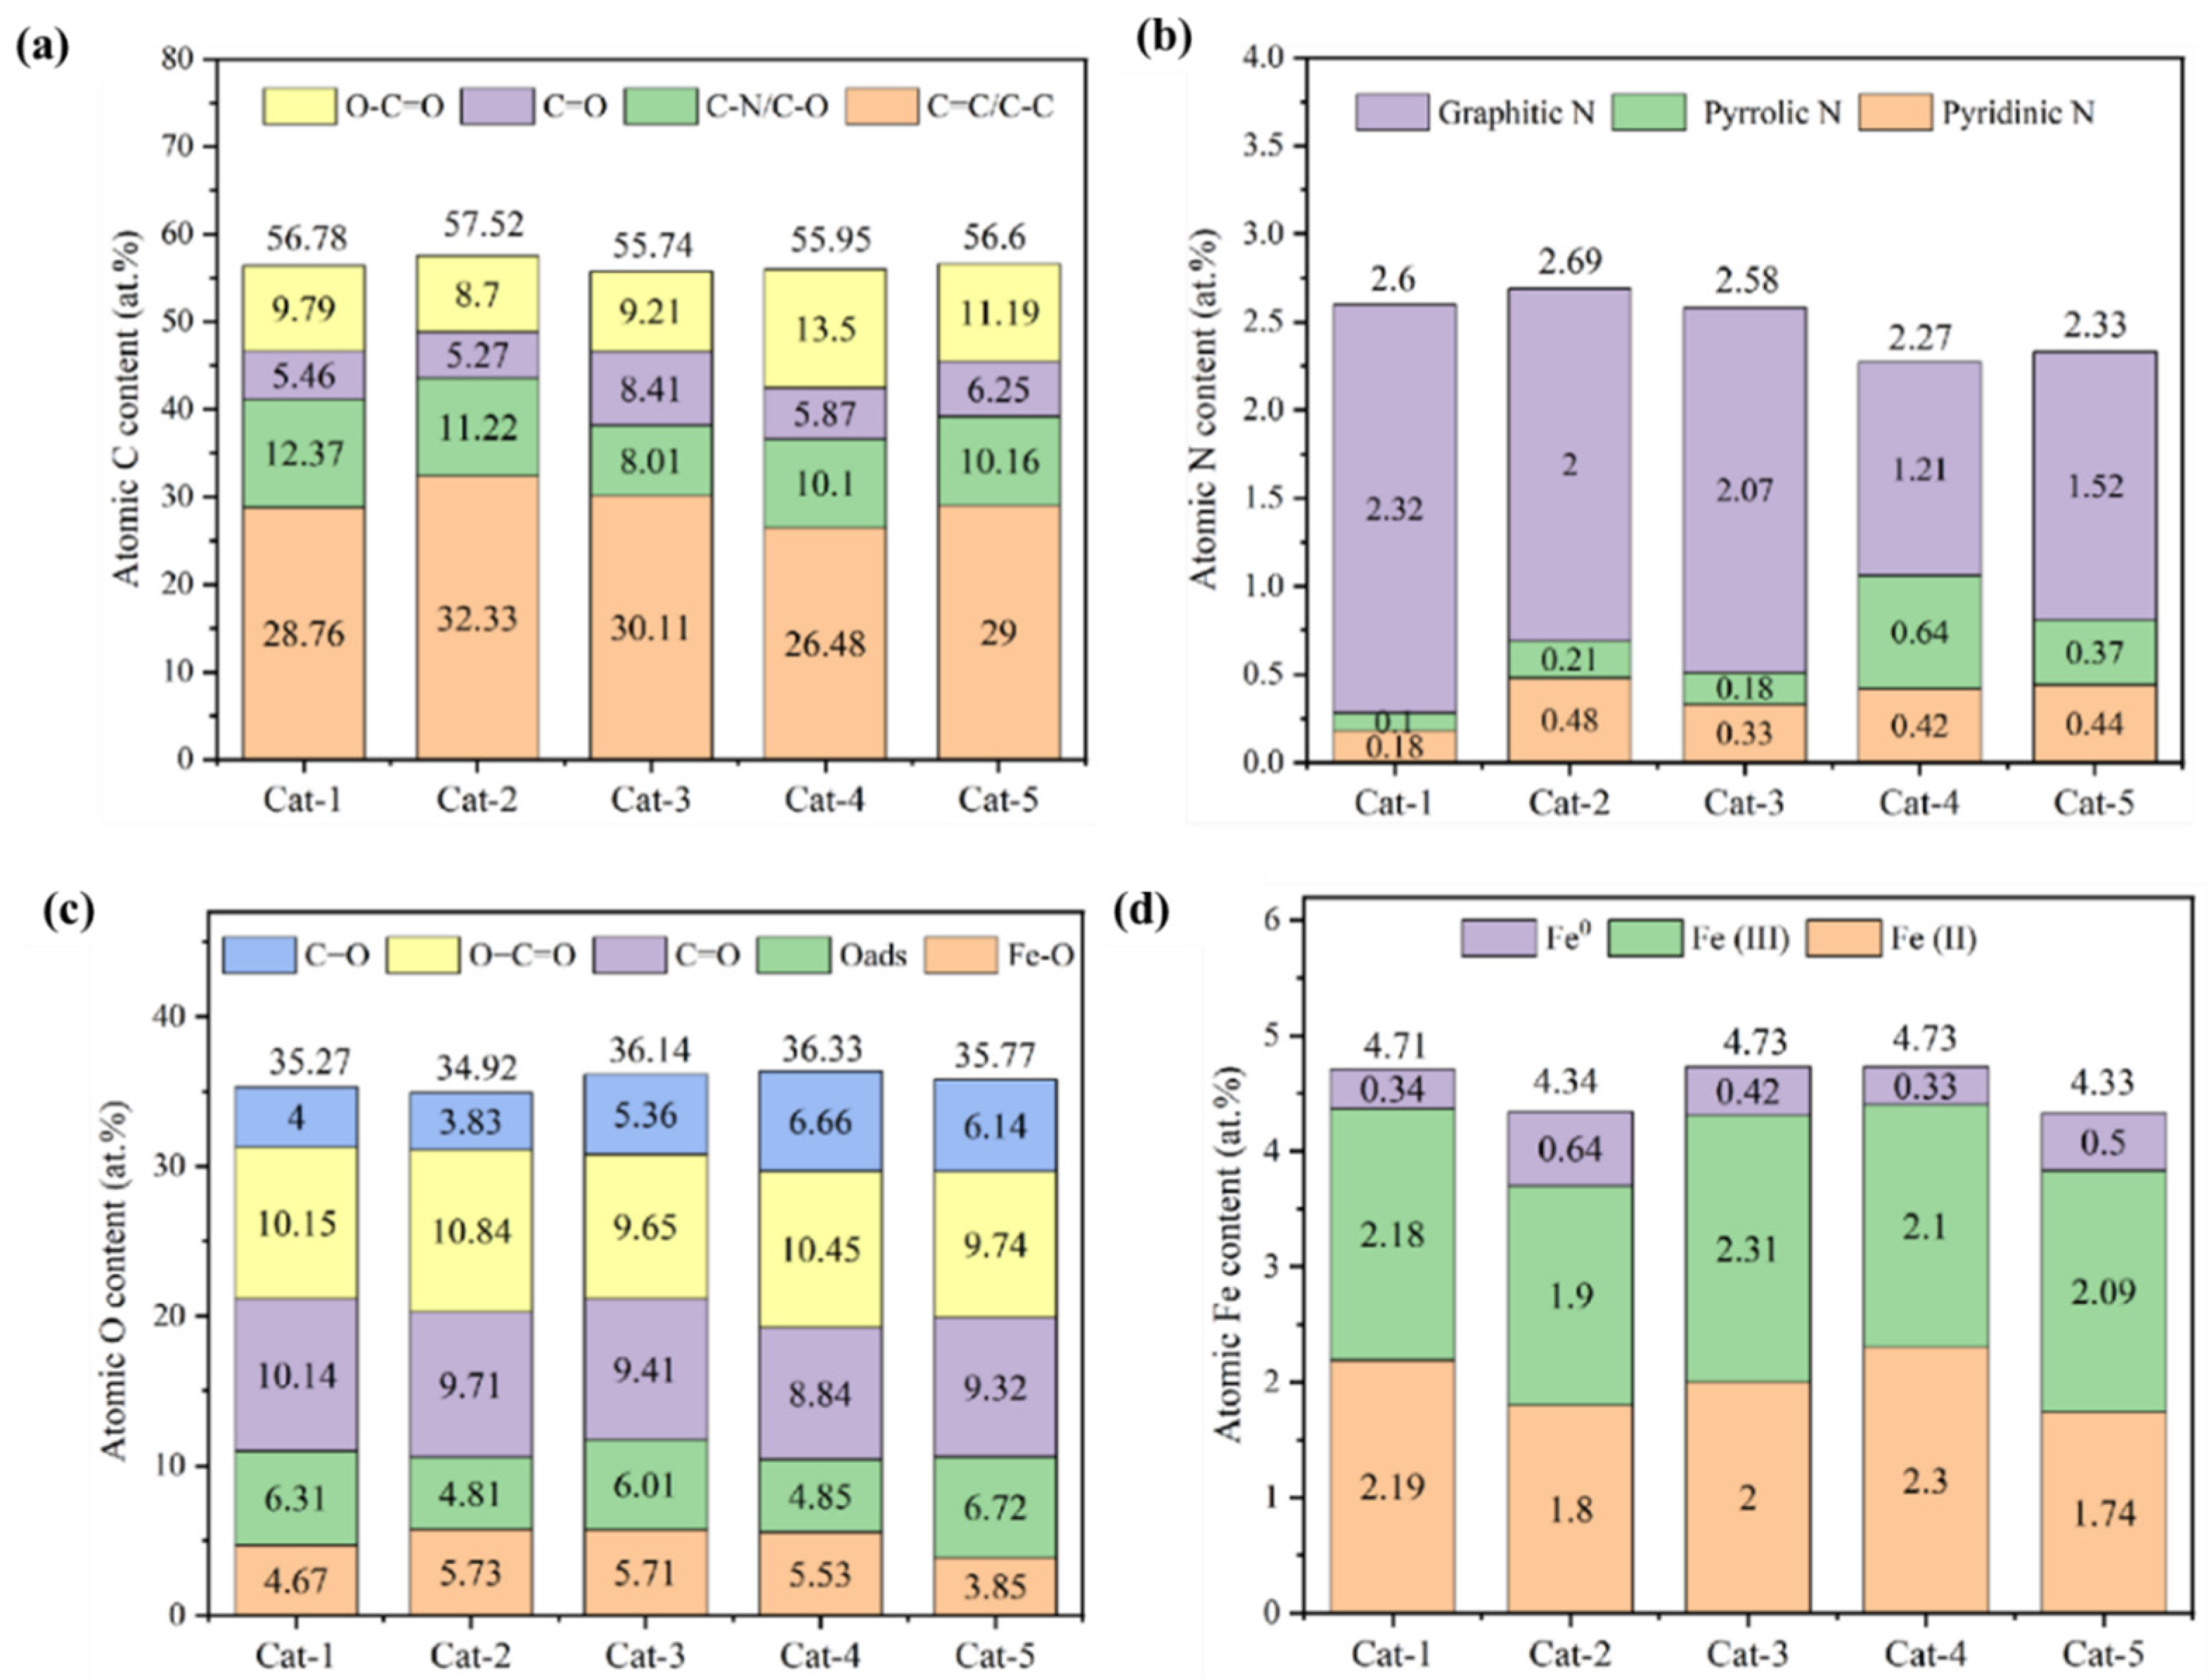
3.1. Characterization of Fenton Iron Peat Catalyst

Considering that the elemental composition of iron sludge can influence its potential for resource recovery, this study first conducted an elemental analysis of the raw Fenton iron sludge using XRF spectroscopy. The results are presented in Table 1. The most abundant element in the iron sludge was carbon (49.7%), followed by Fe (35.4%), N (3.43%), Ca (3.327%), Si (2.980%), and S (1.445%), with other elements present in relatively lower concentrations. The carbon and silicon content mainly originated from natural organic matter and colloidal particulate suspensions in the raw water. The presence of Fe and S was primarily attributed to the introduction of oxidants during the Fenton treatment process, while N mainly originated from the coagulants added in the sludge storage tank. The calcium content was largely due to the addition of alkali at the end of the Fenton reaction. These results indicate that the iron sludge contains a high proportion of iron, highlighting its significant potential for resource recovery.
Figure 2 presents the XRD patterns of Fenton iron-peat catalysts pyrolyzed for different pyrolysis times. All five samples contained SiO2 (JCPDS No. 83-2465), CaS (JCPDS No. 77-2011), Fe3O4 (JCPDS No. 75-0033), FeO (JCPDS No. 75-1550), iron nitride (JCPDS No. 75-2131), and Fe0 (JCPDS No. 87-0721) [16]. As the pyrolysis time increased, the peak intensities of Fe0 and iron nitride gradually intensified, indicating that prolonged pyrolysis facilitated complete thermal decomposition of the iron sludge, thereby promoting the reduction of iron species. The specific surface area and pore characteristics of the Fenton iron-peat catalyst samples prepared at different pyrolysis times are summarized in Table S1. The specific surface area exhibited an initial decrease followed by an increase as the pyrolysis time extended. At shorter pyrolysis times, volatile components generated from the thermal decomposition of iron sludge were not fully expelled and remained trapped between crystallites, leading to a lower specific surface area. With prolonged holding time, the pyrolysis byproducts were able to escape more completely, facilitating pore development and increasing the specific surface area. Additionally, the average pore diameter decreased with longer pyrolysis times, suggesting an increase in the number of smaller pores.
Figure 3 presents the surface morphologies of the samples prepared at different pyrolysis times. The results indicate that, compared to Cat−1 (Figure 3a), the Cat−2 sample (Figure 3b) exhibited smaller dispersed particle sizes on its surface, likely due to the escape of volatile components during pyrolysis. As shown in Figure 3c–e, further extension of the holding time led to a more developed pore structure on the sample surface, accompanied by an increase in surface roughness. Notably, the Cat−2 sample exhibited distinct groove-like or raised structures, contributing to an increased specific surface area. This structural evolution is expected to provide more active sites, which can enhance the catalyst’s performance in pollutant removal.
Figure 4 presents the deconvoluted XPS spectra of C 1s, N 1s, O 1s, and Fe 2p for Fenton iron-peat catalysts. In addition, the relative contents of the active sites obtained from Figure 4 are displayed in Figure 5. As shown in Figure 3a, the C 1s spectrum was fitted into four characteristic peaks, including C=C/C–C (284.7 eV), C–N/C–O (285.5 eV), C=O (286.5 eV), and O–C=O (288.8 eV) [17]. According to Figure 4a, the relative content of C=O in Cat−1, Cat−2, Cat−3, Cat−4, and Cat−5 was 5.46%, 5.27%, 8.41%, 5.87%, and 6.25%, respectively, indicating an initial increase followed by a decrease with prolonged pyrolysis time. The Cat−3 catalyst has the fewest carbon sites, which is not conducive to activating the oxidant. Therefore, the activity of the Cat−3 catalyst is not high. All experiments in this study were repeated three times. As depicted in Figure 4b, the N 1s spectrum exhibited three characteristic peaks corresponding to pyridinic-N (398.5 eV), pyrrolic-N (399.8 eV), and graphitic-N (400.8 eV) [18]. The proportion of pyridinic-N remained relatively stable (~0.6%) across different pyrolysis times, suggesting minimal influence of pyrolysis duration on its content. As shown in Figure 5b, the relative content of pyrrolic-N initially decreased from 0.37% to 0.08% as the pyrolysis time increased from 1 h to 3 h. As the pyrolysis time increased from 1 h to 3 h, the pyrrolic-N content decreased from 0.37% to 0.08%, followed by a slight increase to 0.17% at 5 h. The content of graphitic-N showed little variation with pyrolysis time, increasing only slightly from 1.2% at 1 h to 1.3% at 5 h.
Figure 4c shows that the O 1s spectrum was deconvoluted into five peaks: Fe–O (530.1 eV), adsorbed oxygen (Oads, 530.66 eV), C=O (531.3 eV), O–C=O (532.0 eV), and C–O (533.0 eV) [19]. The Fe–O component represents lattice oxygen bonded to Fe in the iron sludge, while Oads corresponds to surface-adsorbed oxygen species such as O⁻ or O2⁻ According to Figure 5c, the relative content of Fe–O in Cat−1, Cat−2, Cat−3, Cat−4, and Cat−5 was 4.67%, 5.73%, 5.71%, 5.53%, and 3.85%, respectively. The Fe 2p spectrum was deconvoluted into Fe(II), Fe(III), metallic Fe0, and satellite peaks. The characteristic peaks at 711.0 eV and 724.7 eV correspond to Fe 2p3/2 and Fe 2p1/2, respectively. Further deconvolution revealed that the peaks at 710.6 eV and 724.3 eV were associated with Fe(II), while those at 712.4 eV and 726.0 eV were attributed to Fe(III) [20]. Additionally, satellite peaks for Fe(II) and Fe(III) were observed at 717.8 eV and 732.7 eV, respectively. As shown in Figure 5d, the Fe content in Cat−1, Cat−2, Cat−3, Cat−4, and Cat−5 was 4.71%, 4.34%, 4.73%, 4.73%, and 4.33%, respectively, indicating that pyrolysis time had little effect on the total Fe content. However, at a pyrolysis time of 2 h, Cat−2 exhibited the highest Fe0 content (0.64%), which is favorable for H2O2 activation and organic pollutant degradation.

3.2. Performance Testing

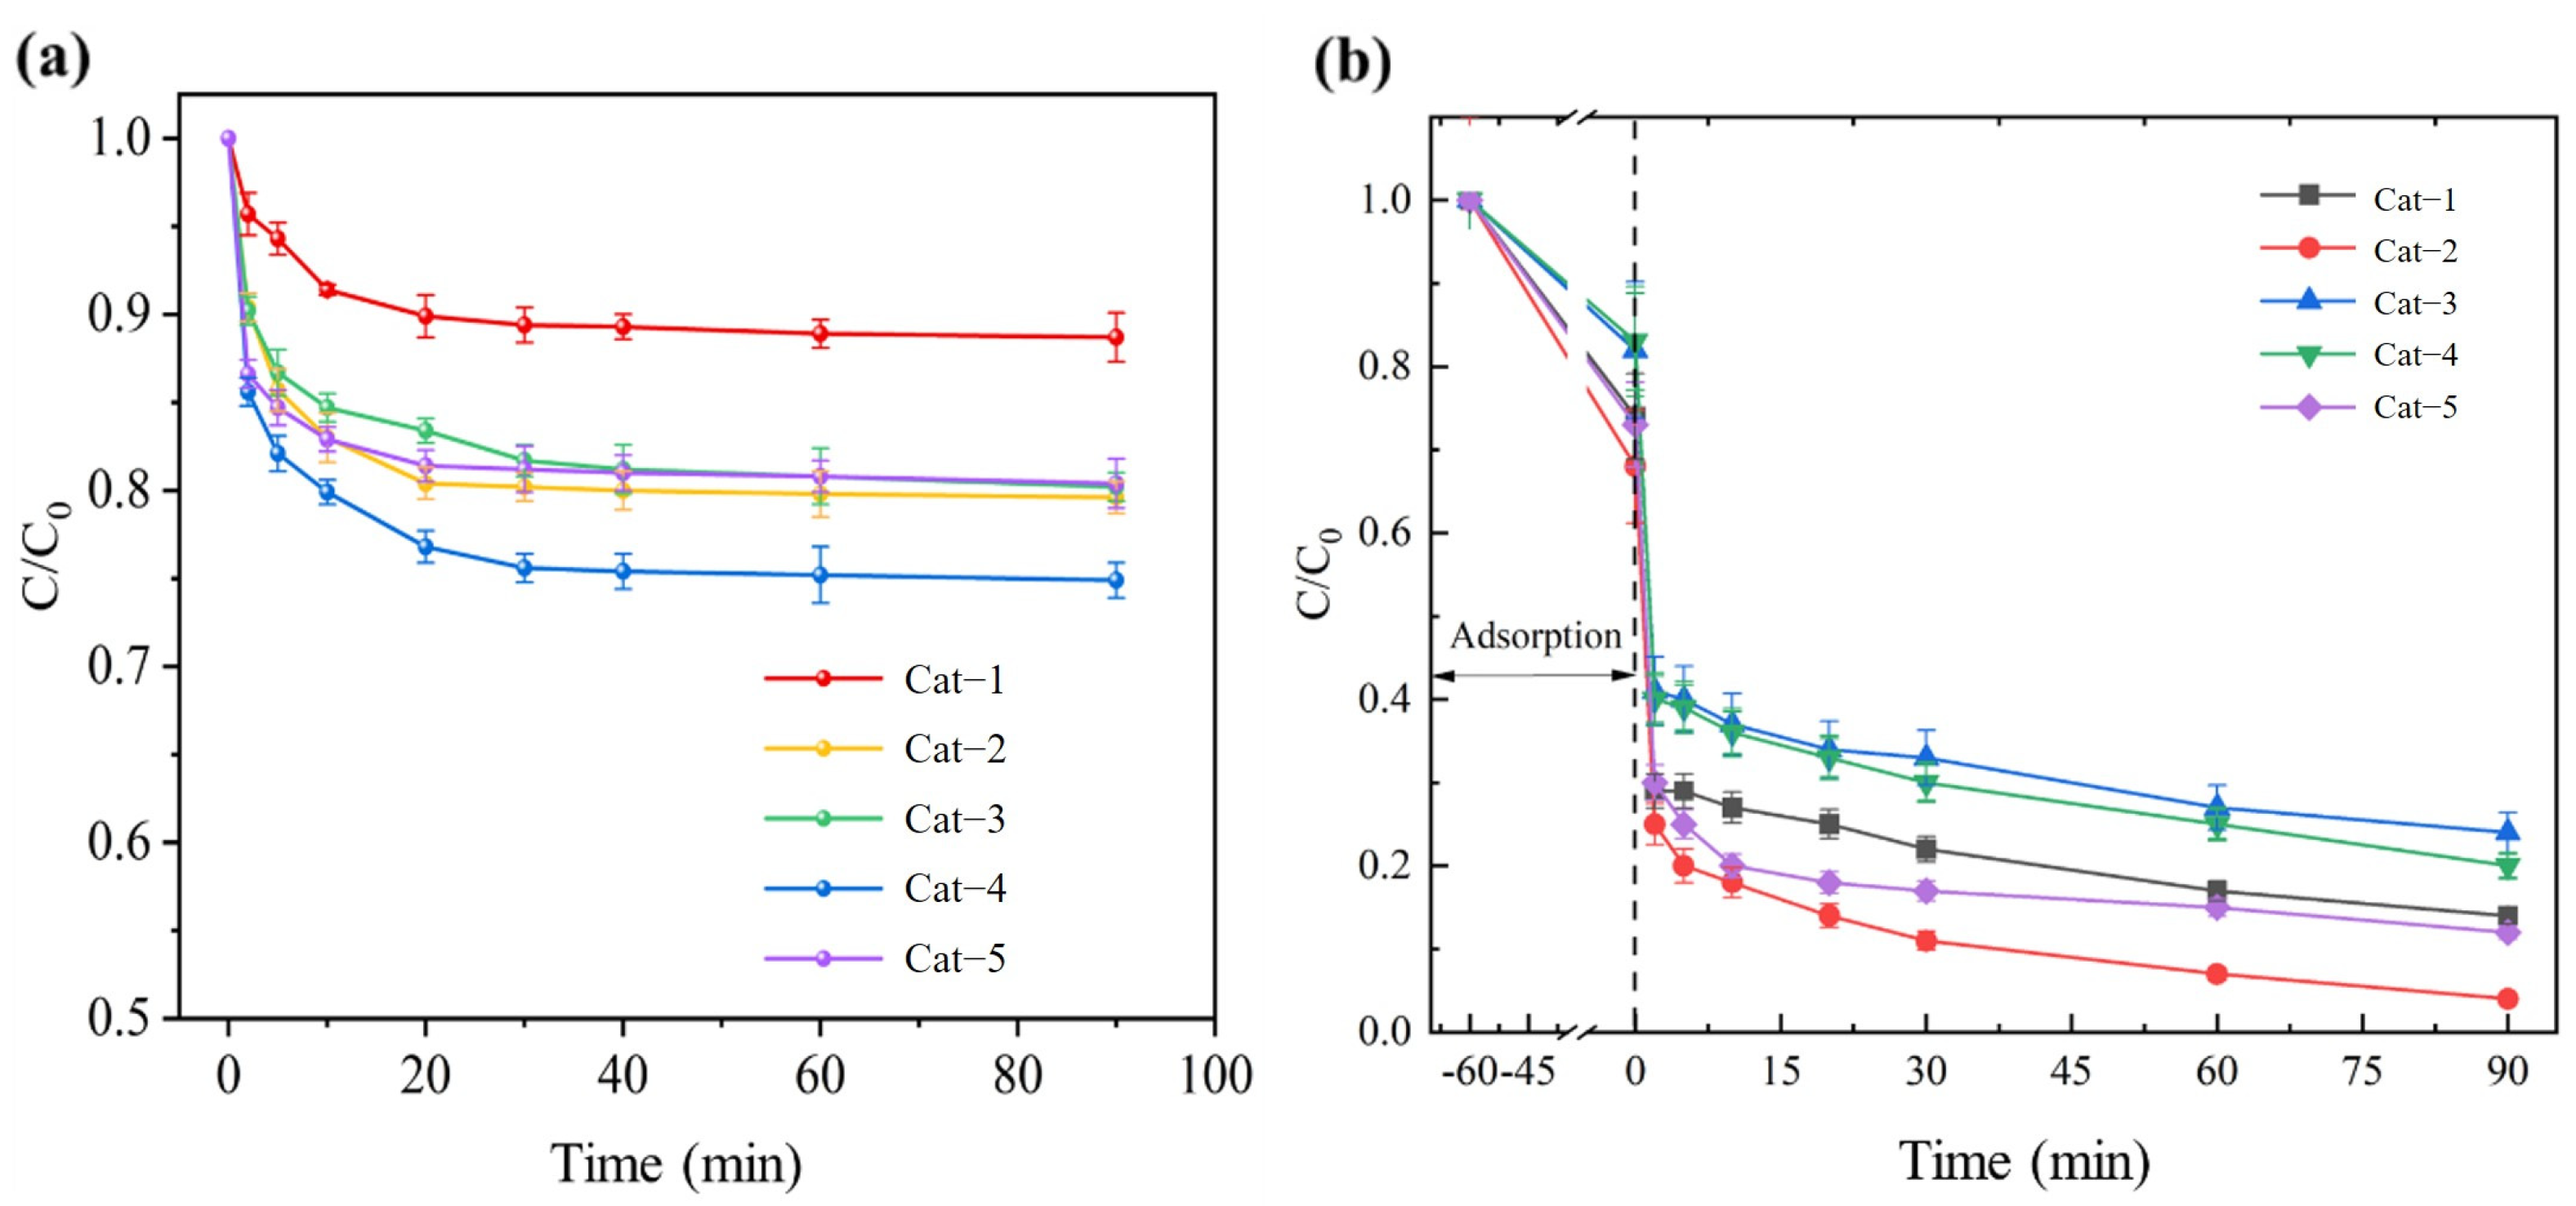
3.2.1. Effect of Pyrolysis Time on Catalyst Performance

The catalytic performance of Fenton sludge biochar catalysts prepared under different pyrolysis times is shown in Figure 6. As observed in Figure 6a, the system reached adsorption equilibrium in 60 min. As shown in Figure 6b, in the Fenton sludge biochar catalyst/H2O2 system, the concentration of MB gradually decreased within 90 min of reaction. When H2O2 was activated using Cat−1, Cat−2, Cat−3, Cat−4, and Cat−5, the MB removal efficiencies after 90 min were 86.6%, 96.1%, 76.0%, 80.3%, and 88.7%, respectively. Therefore, considering both the MB degradation efficiency and the preparation cost of the Fenton sludge biochar catalyst, Cat−2 was selected for subsequent experiments.

3.2.2. COD Removal Performance in the Cat−2/H2O2 System

Table 2 presents the COD removal efficiency of actual secondary effluent from a wastewater treatment plant under different reaction conditions in the Cat−2/H2O2 system. As shown in Table 2, in the Fenton-like system with an initial pH of 4.0, the COD removal efficiency reached 33.0%, whereas at an initial pH of 5.0, the efficiency dropped to only 13.6%. These results indicated that adjusting the initial pH to 4.0 enhanced the COD removal efficiency. Additionally, this study investigated the effect of oxidant dosage on COD removal in the Cat−2/H2O2 system. As shown in Table 2, when the oxidant concentration was 1.0 mM, the COD removal efficiency was 33.0%. However, increasing the oxidant concentration to 1.5 mM led to a decrease in COD removal efficiency to 16.5%. Therefore, an oxidant concentration of 1.0 mM was found to be optimal for maximizing COD removal. To further enhance COD removal efficiency, the effect of catalyst dosage was also examined. As shown in Table 2, increasing the catalyst concentration from 0.5 g/L to 2.0 g/L resulted in a slight decrease in COD removal efficiency from 33.0% to 29.1%. This suggests that an excessive amount of Cat−2 does not improve COD removal performance, likely due to catalyst particle aggregation. This aggregation reduces the available catalyst surface area in contact with H2O2, thereby inhibiting the generation of reactive oxygen species and ultimately lowering the COD removal efficiency. In addition, the Cat−2/H2O2 system exhibited the optimal COD removal performance under acidic conditions at pH = 4, which limited the application of the process. Therefore, it is necessary to explore the process for effective COD removal under partially neutral conditions.

3.2.3. Effect of pH on COD Removal Performance in the Cat−2/H2O2/Fe(VI) System

Studies have shown that ferrates exhibit a synergistic oxidation effect with H2O2 [13]. In this study, Fe(VI) was introduced into the Cat−2/H2O2 system to investigate the COD removal performance of the Cat−2/H2O2/Fe(VI) system. Table 3 presents the effect of different pH conditions on COD removal. The results indicate that in the Fenton-like system with an initial pH of 4.0, the COD removal efficiency was 7.7%, while at an initial pH of 5.0, no significant COD removal was observed. These findings suggest that lowering the initial pH can facilitate COD removal. However, at pH 6.0, the COD concentration remained unchanged after treatment. In addition, the COD removal efficiency increased to 11.8% at pH 7.5 and 31.3% at pH 8.1. These results demonstrate that the Cat−2/H2O2/Fe(VI) system exhibits enhanced oxidation performance under weakly alkaline conditions, which may be attributed to the greater stability of Fe(VI) in an alkaline environment.

3.2.4. Effect of Total Concentration of Fe(VI) and H2O2 on COD Removal Performance in the Cat−2/H2O2/Fe(VI) System

Table 4 presents the effect of the total concentration of ferrate and H2O2 on COD removal. The results indicate that when [Fe(VI)] + [H2O2] = 0.9 mM, the COD removal efficiency was 31.8%. As the total oxidant concentration increased to 1.2 mM, the removal efficiency decreased to 23.4%. When [Fe(VI)] + [H2O2] was further increased to 1.5 mM and 1.8 mM, the COD removal efficiencies were 32.8% and 34.4%, respectively. These findings suggest that increasing the total concentration of Fe(VI) and H2O2 does not enhance COD removal significantly. Therefore, considering cost-effectiveness, a total oxidant concentration of 0.9 mM was selected for subsequent experiments. The concentrations of H2O2, potassium ferrate, and catalyst were 0.8 mM, 0.1 mM, and 0.5 g/L, respectively.

3.2.5. Effect of Molar Ratio of Fe(VI) and H2O2 on COD Removal Performance in the Cat−2/H2O2/Fe(VI) System

Figure 7 illustrates the effect of the [Fe(VI)]:[H2O2] ratio on COD removal. The results show that as the [Fe(VI)]:[H2O2] ratio increases from 1:1 to 1:7, the COD removal efficiency increases from 17.5% to 45.1%. However, when the ratio is further increased to 1:8, the COD removal efficiency only slightly increases to 46.2%. Therefore, a [Fe(VI)]:[H2O2] ratio of 1:8 was selected as the condition for the small-scale continuous flow reactor. Fe(VI) will spontaneously decompose under acidic to neutral conditions to generate Fe(III) and O2. H2O2 may also be directly catalyzed by Fe(VI) to decompose into H2O and O2, resulting in oxidant waste. High concentrations of H2O2 will capture ·OH to generate less active superoxide radicals (HO2·), which will reduce the oxidation efficiency. If Fe(III) generated by the reduction of Fe(VI) is not reduced to Fe(II) in time, Fe(OH)3 precipitation will form, covering the active sites and hindering the Fenton cycle.
Furthermore, the Fe leaching experiments were performed. As a result, the leaching rate of Fe was only 1.0% during the reaction in the Cat−2/H2O2/Fe(VI) system, which indicated a low leakage of heavy metals.

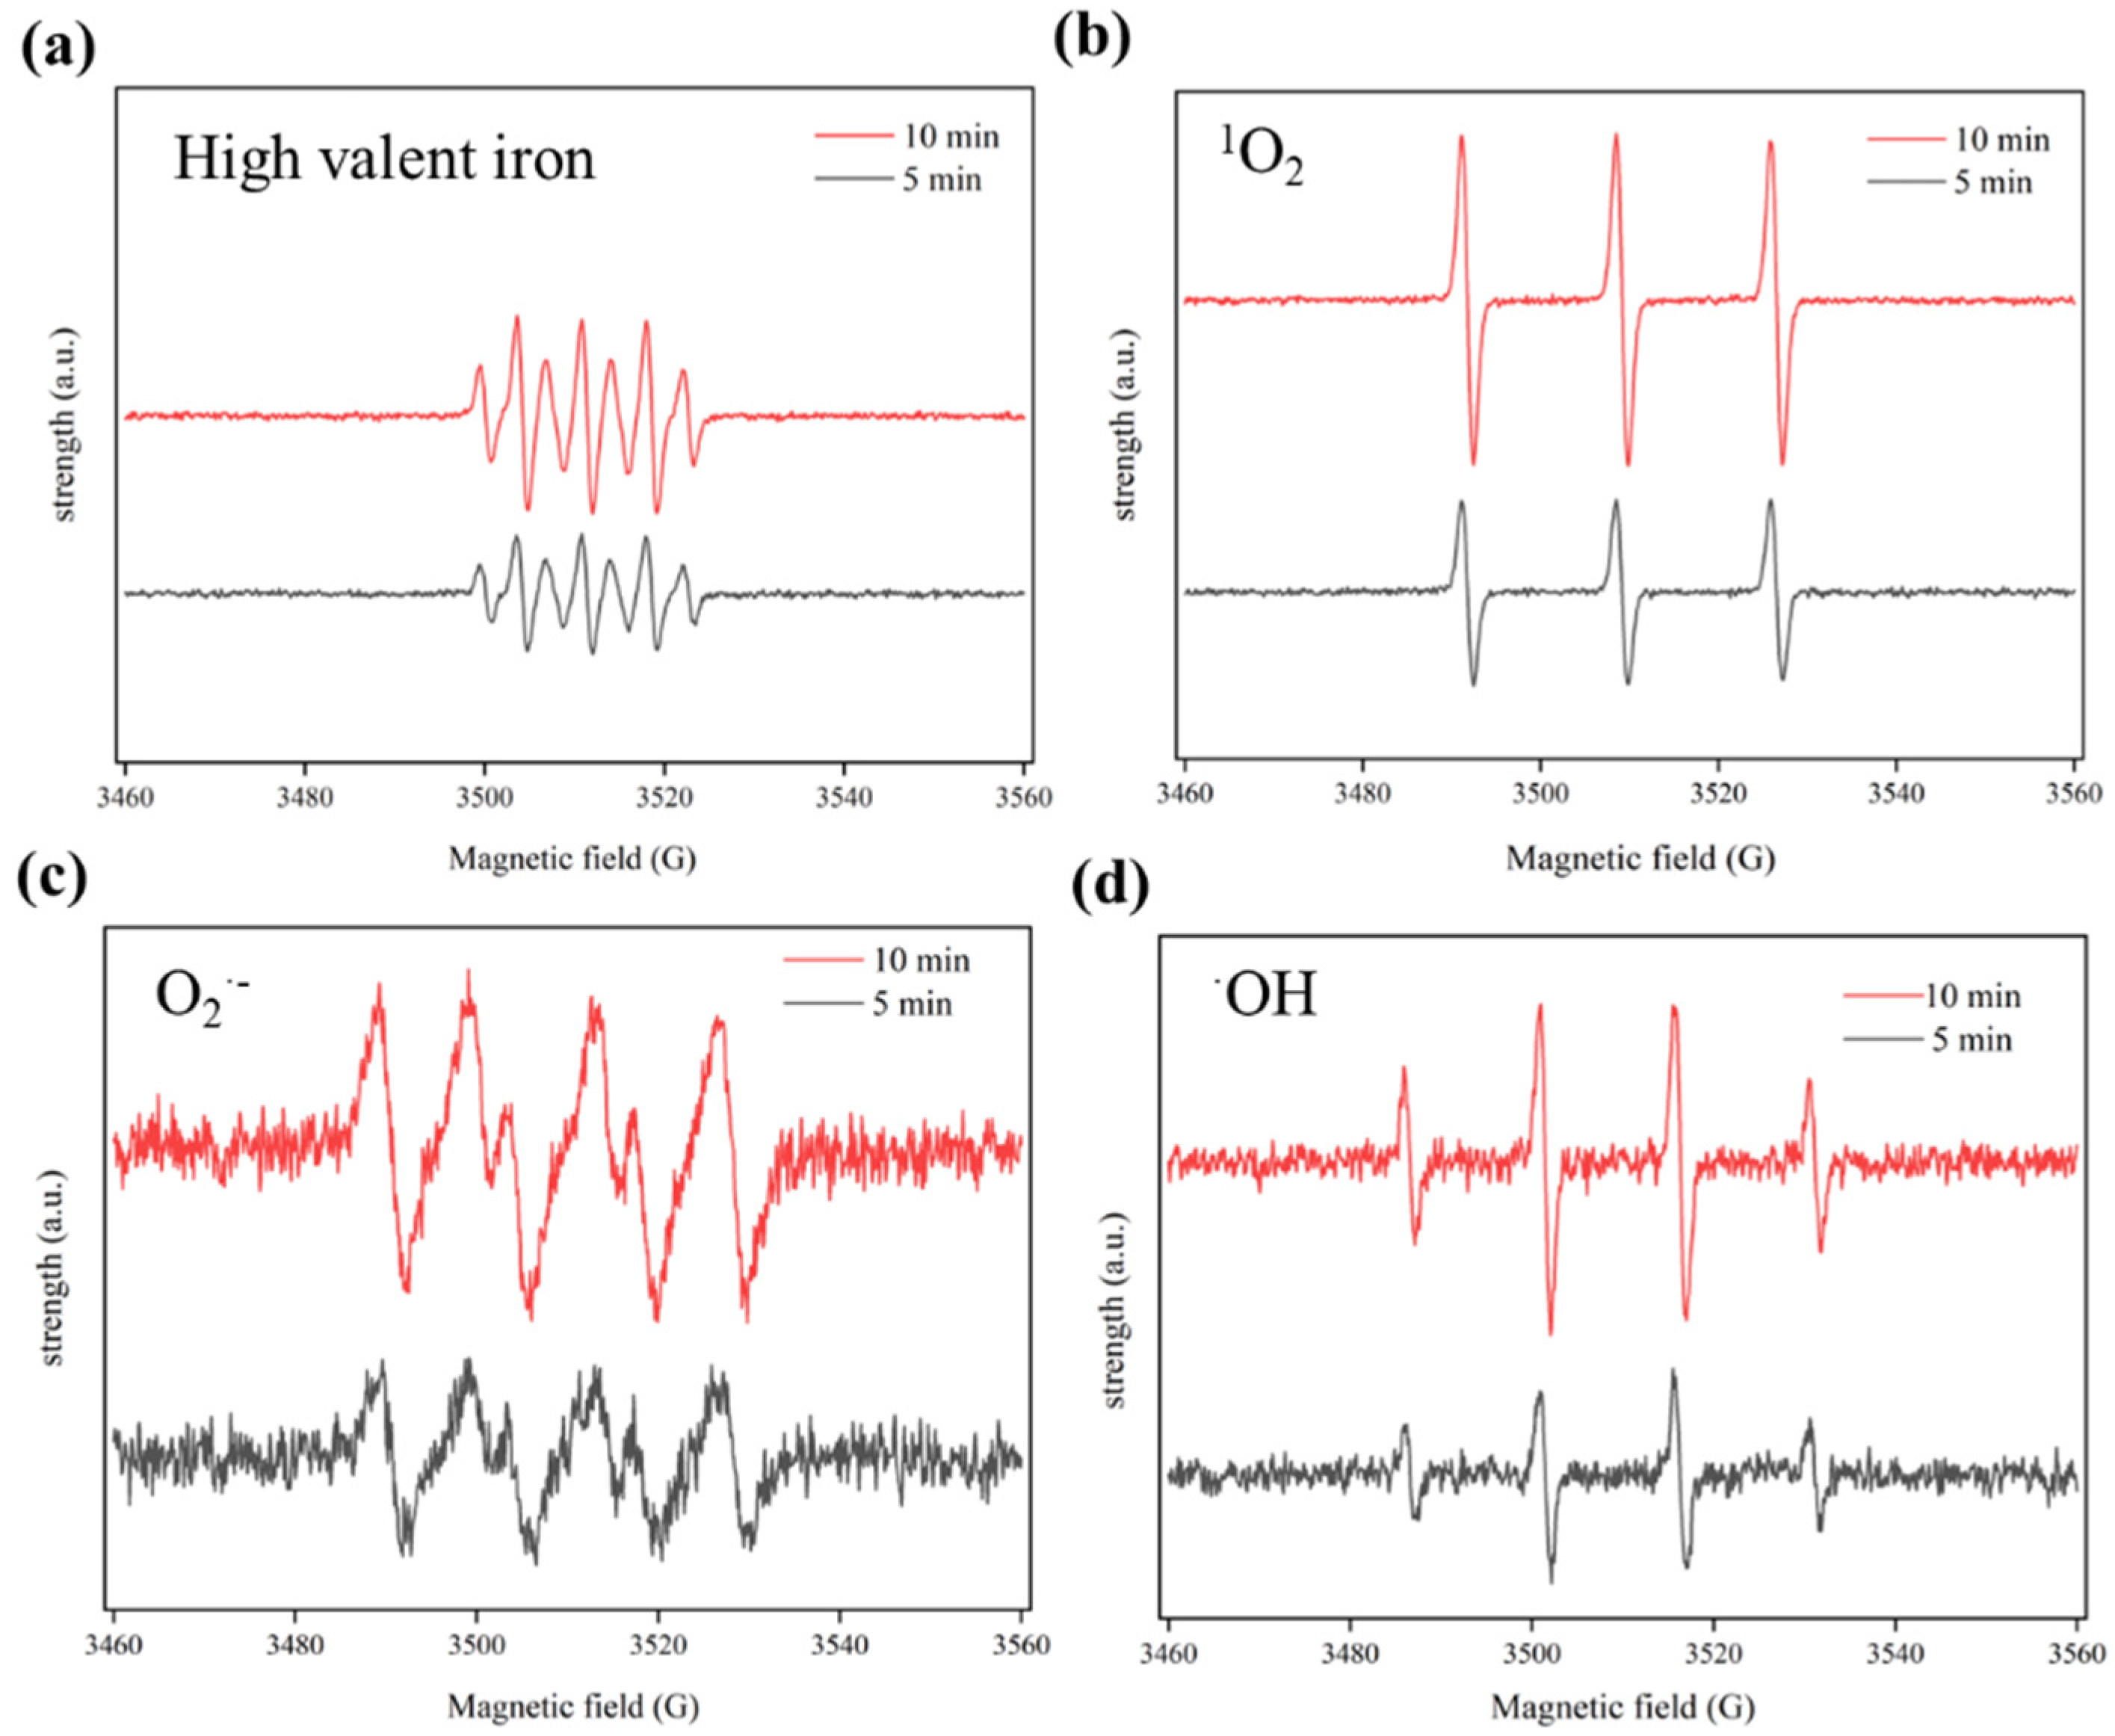
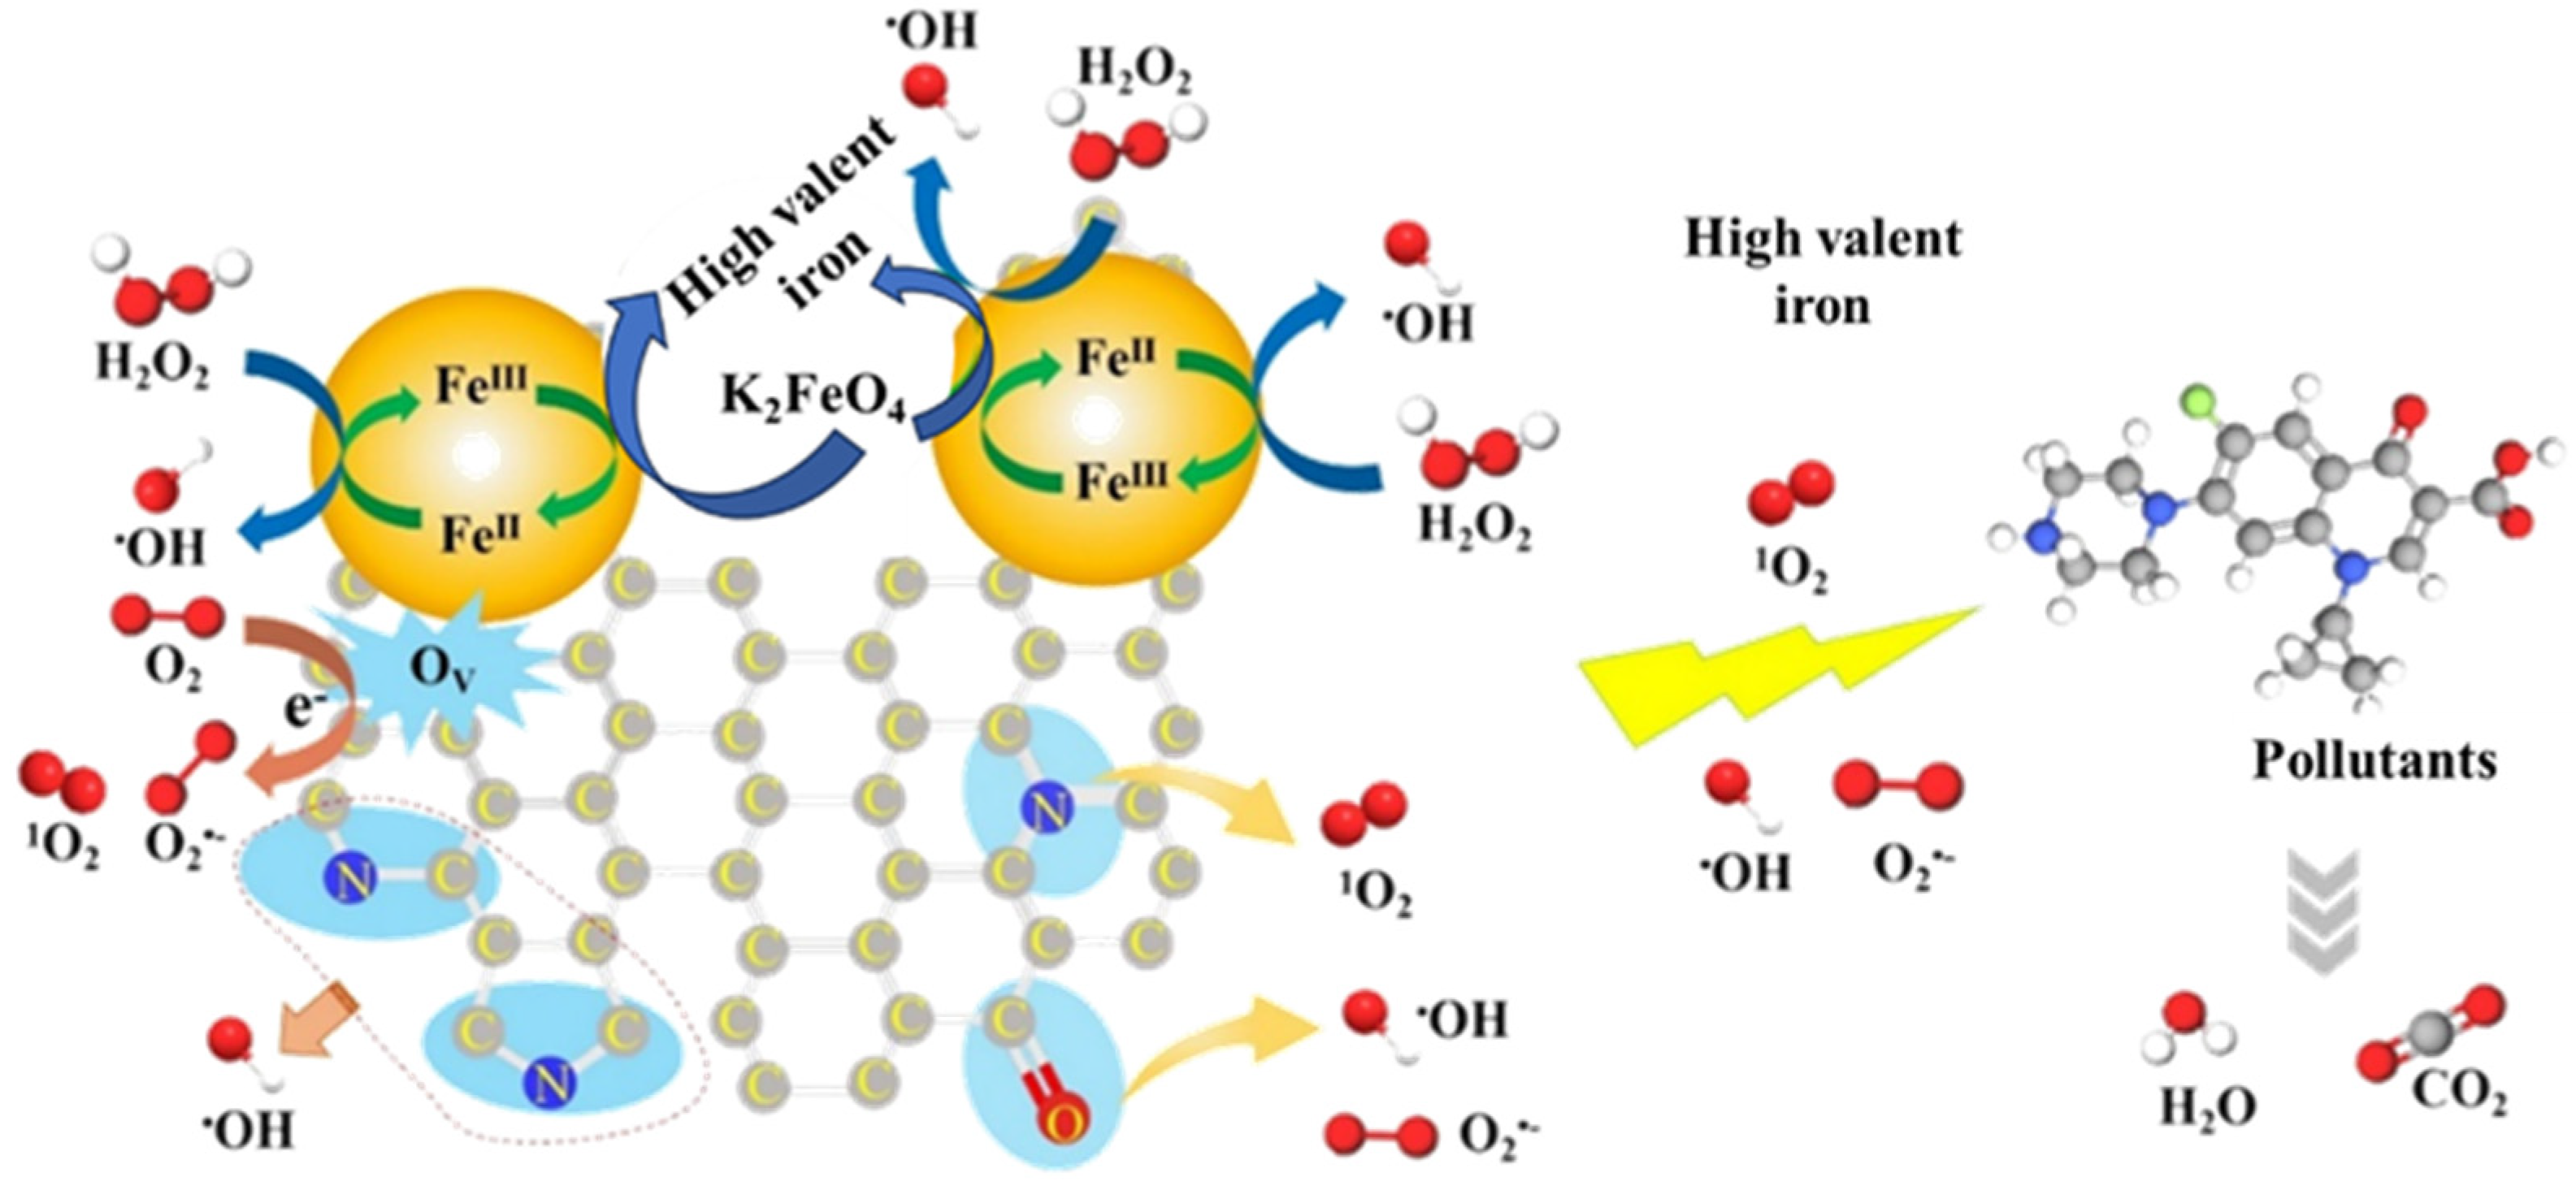
3.3. Catalytic Mechanisms in Cat−2/H2O2/Fe(VI) System

Figure 8 shows the effect of different quenching agents on the MB degradation in the Cat−2/H2O2/Fe(VI) system. As shown in Figure 8a and Table 5, when no quenching agent was added, about 98.1% of the MB was degraded within 120 min with the kinetic constants (k) of 0.0533 min−1. As indicated in Figure 8a, when FFA was added, the MB degradation rate significantly decreased to 52%. In addition, the k was reduced from 0.0533 min−1 t 0.0055 min−1. In addition, the addition of TBA and CF led to a slight decrease in the degradation rate, which dropped to 94.4% (0.0240 min−1) and 92.5% (0.0216 min−1), respectively. As shown in Figure 8b, the consumption of PMSO and the generation of PMSO2 are nearly equal, indicating the formation of high-valent iron in the system. The PMSO probing experiment confirmed the presence of high-valent iron in the Cat−2/H2O2/Fe(VI) system [17]. Therefore, the quenching experiments confirmed that high-valent iron, 1O2, OH and O2•− are the main reactive species in the Cat−2/H2O2/Fe(VI) system. To further verify the active species generated during the activation of H2O2/Fe(VI) by Cat−2, EPR spectroscopy was employed. DMPO was used to detect the presence of OH, Fe(VI), and O2•−, while TEMP was used to identify 1O2 in the reaction system. As shown in Figure 9a, the EPR spectrum reveals a signal peak for DMPO-High valent iron [21], confirming the generation of high-valent iron. Additionally, as shown in Figure 9b, a TEMP-1O2 signal peak with a 1:1:1 intensity ratio was observed, indicating the presence of 1O2 [22]. In Figure 9c, the EPR spectrum displays a sextet signal for DMPO-O2•−, confirming the existence of O2•− [23]. In Figure 9d, the EPR spectrum reveals four characteristic peaks with a 1:2:2:1 intensity ratio, which correspond to the DMPO-OH adduct, indicating the presence of OH [23]. These results are consistent with the quenching experiments. Therefore, high-valent iron, OH, O2•−, and 1O2 all participate in the degradation process.
Based on the above results, the proposed mechanism for COD degradation in the Cat−2/H2O2/Fe(VI) system is illustrated in Figure 10. The addition of Fe(VI) oxidant accelerates the Fe(III)/Fe(II) cycle [14], promoting the generation of reactive species (OH, O2•−, and 1O2). The mechanism can be described as follows: Fe(II) on the surface of the catalyst, along with the C=O group, can activate H2O2 to produce OH radicals. These OH radicals can directly oxidize and degrade organic pollutants. OH can react with H2O2 to form O2•− [18]. Additionally, Fe(III) reacts with H2O2 to produce O2•−, which further facilitates the degradation of organic pollutants. Graphitic nitrogen can act as a site for the generation of 1O2, thereby promoting the degradation of organic pollutants. H2O2, as an oxidant, can promote the conversion of Fe(VI) to high-valent iron through electron transfer, thus facilitating the Fe cycle [14]. Moreover, the abundant O2•− and OH radicals generated in the system can be converted into 1O2 [24], which further aids in COD degradation. In summary, the various reactive species continuously generated in the system can progressively degrade organic pollutants into small molecular intermediates, ultimately mineralizing them into H2O and CO2.

3.4. Comparison Between Cat−2/H2O2/Fe(VI) System and Fenton or Ozonation System

Based on the sequential batch experiment, the maximum COD removal rate (46.2%) was achieved when the concentrations of H2O2, potassium ferrate, and catalyst were 0.8 mM, 0.1 mM, and 0.5 g/L, respectively, and 32.34 mg of COD can be removed. According to Table S2, the cost of the Cat−2/H2O2/Fe(VI) system for removing COD is USD 0.63/kg COD. Previous reports have found that the costs of the Fenton and ozone processes for COD removal are USD 1.77/kg COD and USD 1.96/kg COD, respectively [25]. The Cat−2/H2O2/Fe(VI) process has great potential in cost for future applications. In addition, the Fenton and ozone processes have been used in wastewater treatment plants. Therefore, all three processes have scalability.

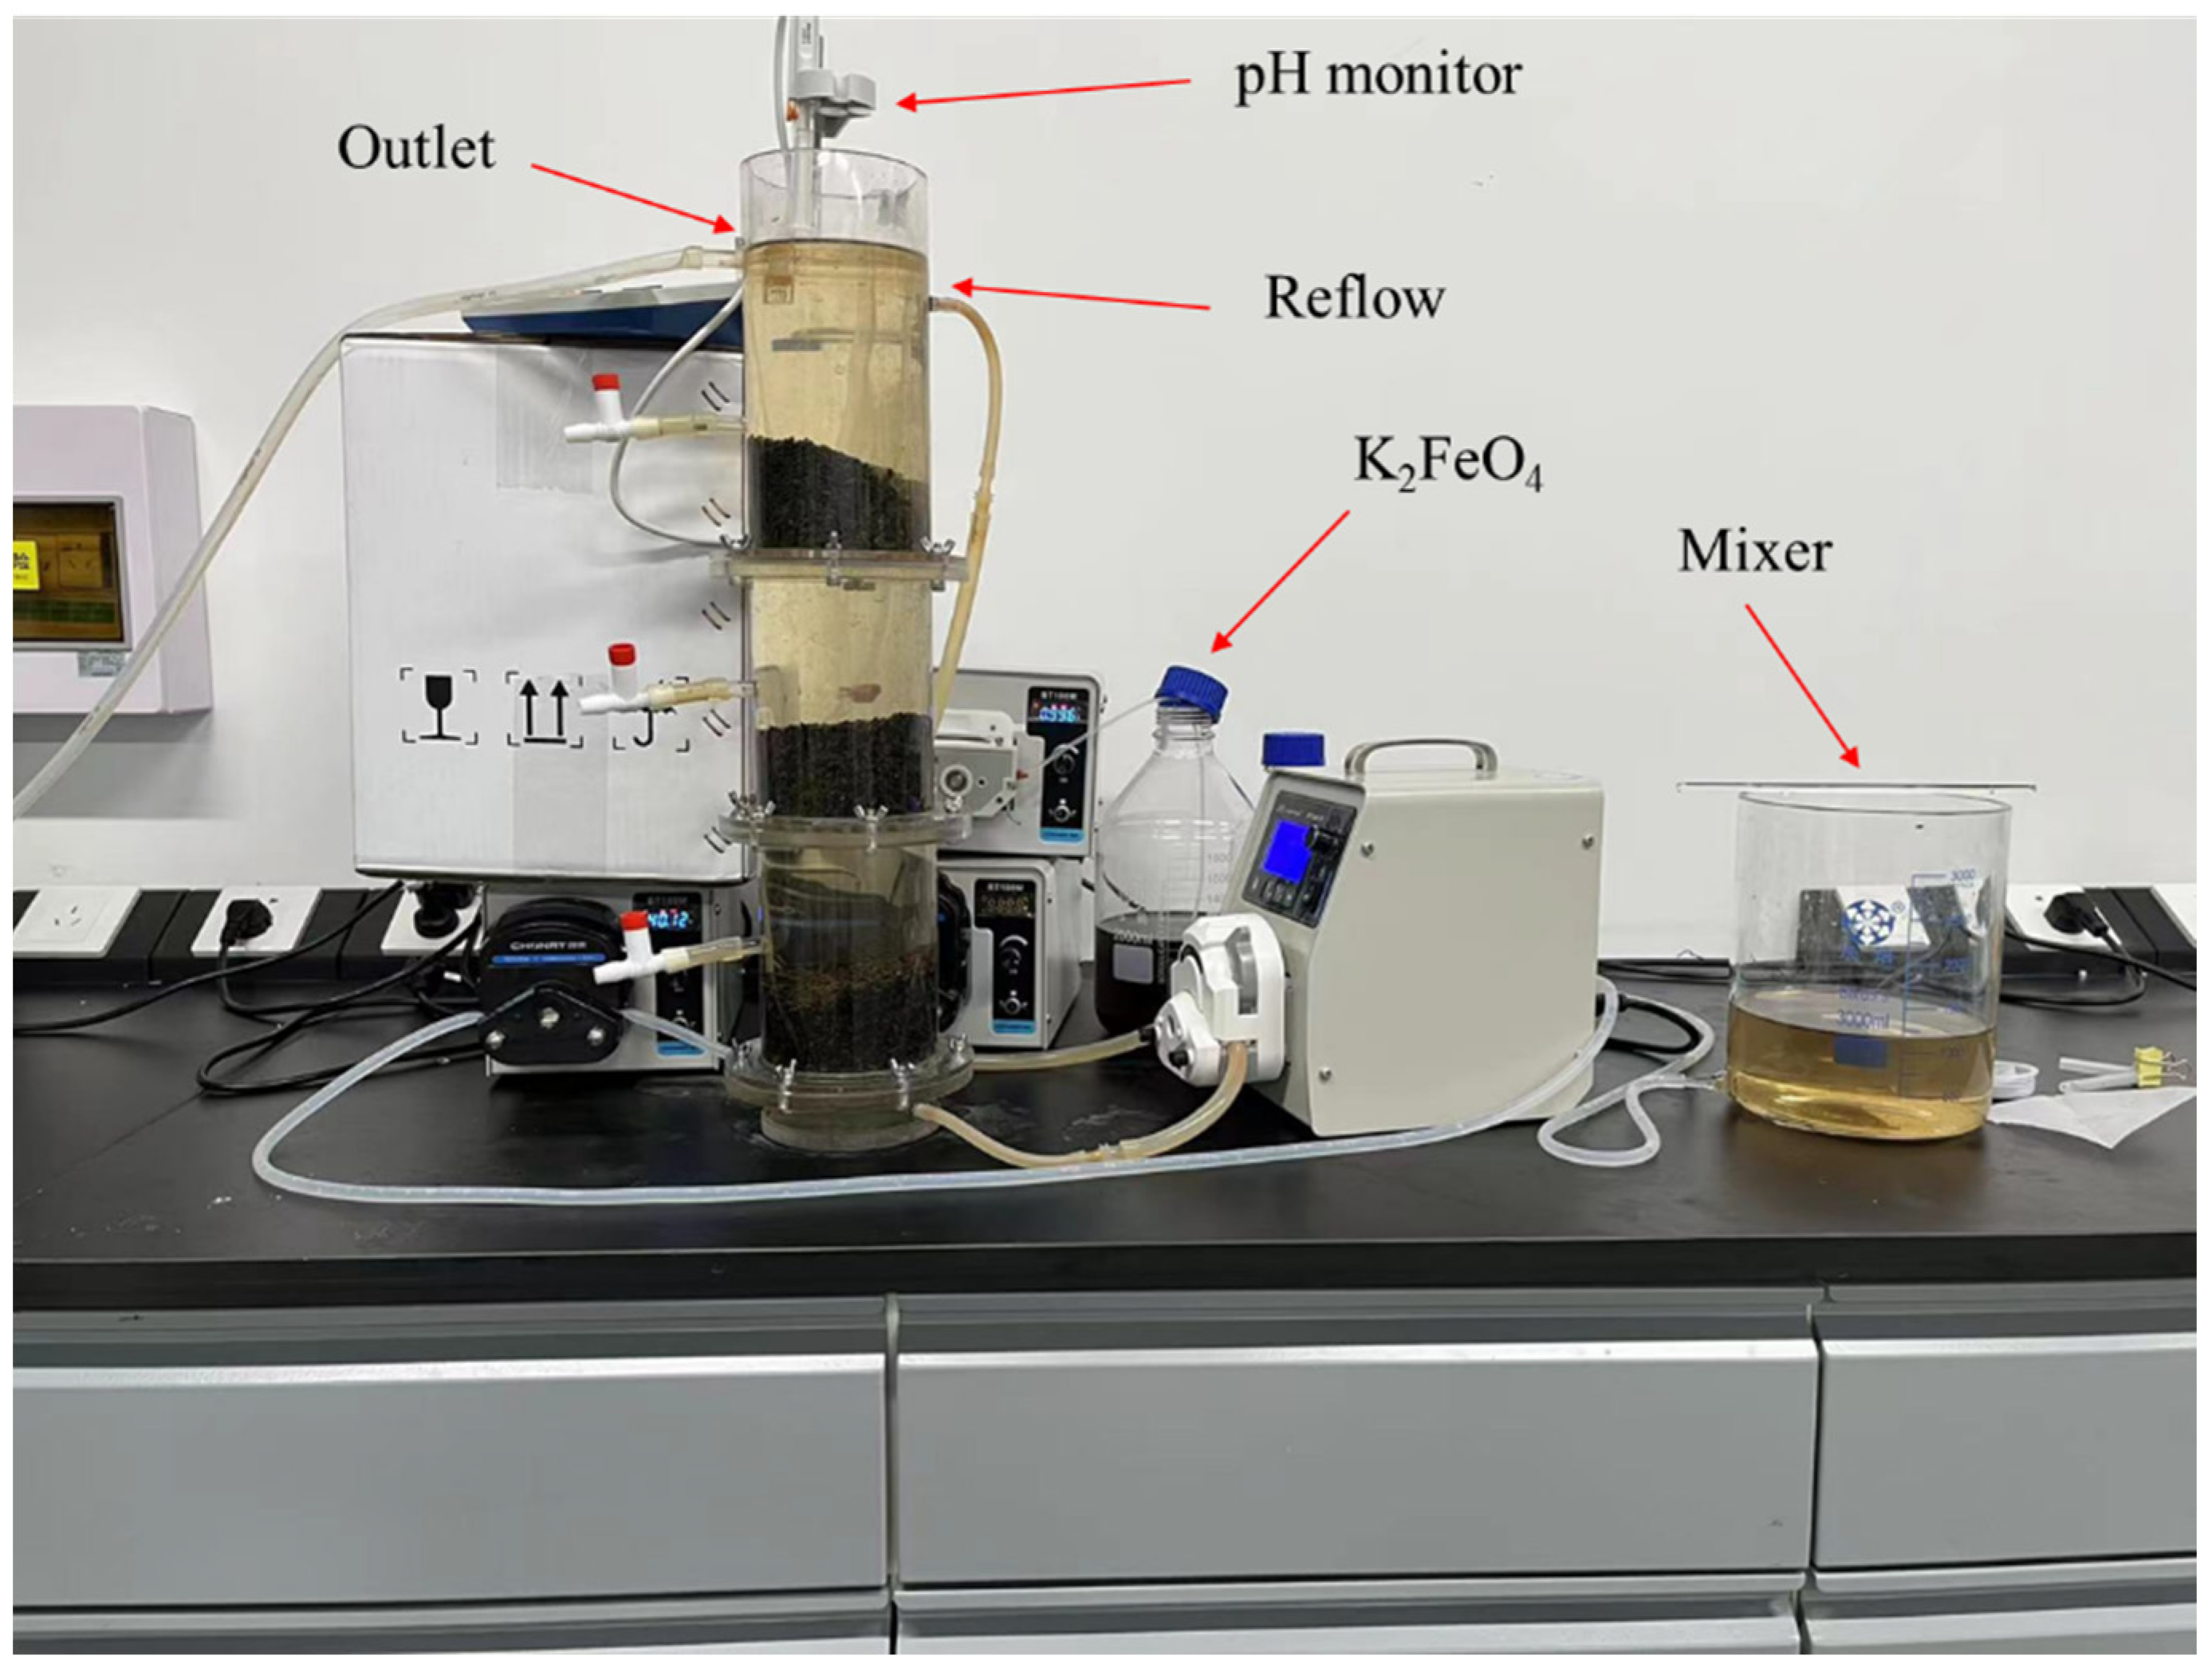
3.5. Small-Scale Continuous Flow Experiment

Table 6, Table 7, Table 8 and Table 9 demonstrate the removal performance of COD in a continuous flow reactor with different process parameters. As shown in Table 6, when the reflux ratio increased from 0 to 1:4, it resulted in a decrease in the COD of the effluent. The COD of the effluent decreased as the H2O2 concentration increased from 0.8 to 1.2 (Table 7). As presented in Table 8, the reduction in the flow rate from 2.98 mL/min to 26.01 mL/min led to a decrease in the COD of the effluent. In addition, increasing the amount of catalyst per layer to 120 g resulted in a decrease in COD (Table 9). When the [Fe(VI)]:[H2O2] ratio is 1:8, with 120 g of catalyst per layer, an inlet flow rate of 26.01 mL/min, and a reflux ratio of 1:4, the COD removal efficiency is improved, with COD decreasing from 65 mg/L to 36 mg/L.

4. Conclusions

This study transformed Fenton iron sludge into an efficient catalyst and combined it with the H2O2/Fe(VI) system to degrade COD effectively. The results showed that Cat−2 with a pyrolysis time of 2 h exhibited excellent catalytic activity. The degradation rate of MB in the Cat−2/H2O2 system was 31.6%. Fe(VI) could enhance the oxidative performance of the Cat−2/H2O2 system, with COD removal up to 46.2% under weakly alkaline conditions (pH = 8.1). Mechanistic studies indicated that high-valent iron and 1O2, OH, and O2•− are the primary active species in the degradation process. Continuous flow experiments showed that the COD in the secondary effluent could meet the discharge standard after treatment in the Cat−2/H2O2/Fe(VI) system. This study provided a scientific basis for the resource utilization of Fenton iron sludge and the application of heterogeneous Fenton-like systems in water treatment.

Supplementary Materials

The following supporting information can be downloaded at https://www.mdpi.com/article/10.3390/app15115945/s1, Table S1: Specific surface area and pore parameters of iron sludge-based catalysts at different pyrolysis times; Table S2: Cost of COD removal in sequential batch experiment.

Author Contributions

L.W.: conceptualization, methodology, analysis, writing—review. X.H.: formal analysis, writing—original draft. L.L.: writing—review and editing, writing—original draft. Y.W.: writing—review and editing. B.Y.: writing—review and editing. G.C.: writing—review and editing. N.L.: conceptualization, writing—review and editing, supervision. L.H.: formal analysis, writing—review and editing. All authors have read and agreed to the published version of the manuscript.

Funding

This work was supported by the Young Scientific and Technological Talents (Level Two) in Tianjin (QN20230214), the Tianjin Natural Science Foundation (24JCYBJC01290), the Climbing Program of Tianjin University (2023XPD-0006) and the National Key R&D Program (2024YFC3908903).

Institutional Review Board Statement

Not applicable.

Informed Consent Statement

Not applicable.

Data Availability Statement

The original contributions presented in this study are included in the article/Supplementary Material. Further inquiries can be directed to the corresponding authors.

Conflicts of Interest

The authors declare no conflicts of interest.

References

  1. Castaldi, P.; Silvetti, M.; Enzo, S.; Melis, P. Study of Sorption Processes and FT-IR Analysis of Arsenate Sorbed onto Red Muds (a Bauxite Ore Processing Waste). J. Hazard. Mater. 2010, 175, 172–178. [Google Scholar] [CrossRef] [PubMed]
  2. Yang, Y.; Wang, X.; Wang, M.; Wang, H.; Xian, P. Iron Recovery from the Leached Solution of Red Mud through the Application of Oxalic Acid. Int. J. Miner. Process. 2016, 157, 145–151. [Google Scholar] [CrossRef]
  3. Agrawal, S.; Dhawan, N. Evaluation of Red Mud as a Polymetallic Source—A Review. Miner. Eng. 2021, 171, 107084. [Google Scholar] [CrossRef]
  4. Wang, S.; Ang, H.M.; Tadé, M.O. Novel Applications of Red Mud as Coagulant, Adsorbent and Catalyst for Environmentally Benign Processes. Chemosphere 2008, 72, 1621–1635. [Google Scholar] [CrossRef] [PubMed]
  5. Wang, G.; Xiang, J.; Liang, G.; Wang, J.; Ma, S.; He, C. Application of Common Industrial Solid Waste in Water Treatment: A Review. Environ. Sci. Pollut. Res. Int. 2023, 30, 111766–111801. [Google Scholar] [CrossRef]
  6. Brunori, C.; Cremisini, C.; Massanisso, P.; Pinto, V.; Torricelli, L. Reuse of a Treated Red Mud Bauxite Waste: Studies on Environmental Compatibility. J. Hazard. Mater. 2005, 117, 55–63. [Google Scholar] [CrossRef]
  7. Pignatello, J.J.; Oliveros, E.; MacKay, A. Advanced Oxidation Processes for Organic Contaminant Destruction Based on the Fenton Reaction and Related Chemistry. Crit. Rev. Environ. Sci. Technol. 2006, 36, 1–84. [Google Scholar] [CrossRef]
  8. Neyens, E.; Baeyens, J. A Review of Classic Fenton’s Peroxidation as an Advanced Oxidation Technique. J. Hazard. Mater. 2003, 98, 33–50. [Google Scholar] [CrossRef]
  9. Babuponnusami, A.; Muthukumar, K. A Review on Fenton and Improvements to the Fenton Process for Wastewater Treatment. J. Environ. Chem. Eng. 2014, 2, 557–572. [Google Scholar] [CrossRef]
  10. Soon, A.N.; Hameed, B.H. Heterogeneous Catalytic Treatment of Synthetic Dyes in Aqueous Media Using Fenton and Photo-Assisted Fenton Process. Desalination 2011, 269, 1–16. [Google Scholar] [CrossRef]
  11. Bautista, P.; Mohedano, A.F.; Casas, J.A.; Zazo, J.A.; Rodriguez, J.J. An Overview of the Application of Fenton Oxidation to Industrial Wastewaters Treatment. J. Chem. Technol. Biotechnol. 2008, 83, 1323–1338. [Google Scholar] [CrossRef]
  12. Wang, Y.; Liang, L.; Dai, H.; Li, N.; Song, Y.; Yan, B.; Chen, G.; Hou, L. Activation of Peroxymonosulfate by Food Waste Digestate Derived Biochar for Sulfamethoxazole Degradation: Performance and Mechanism. Sep. Purif. Technol. 2023, 327, 124935. [Google Scholar] [CrossRef]
  13. Nie, X.; Li, G.; Li, S.; Luo, Y.; Luo, W.; Wan, Q.; An, T. Highly Efficient Adsorption and Catalytic Degradation of Ciprofloxacin by a Novel Heterogeneous Fenton Catalyst of Hexapod-like Pyrite Nanosheets Mineral Clusters. Appl. Catal. B 2022, 300, 120734. [Google Scholar] [CrossRef]
  14. Zhang, H.; Liu, J.; Ou, C.; Faheem; Shen, J.; Yu, H.; Jiao, Z.; Han, W.; Sun, X.; Li, J.; et al. Reuse of Fenton Sludge as an Iron Source for NiFe2O4 Synthesis and Its Application in the Fenton-Based Process. J. Environ. Sci. 2017, 53, 1–8. [Google Scholar] [CrossRef]
  15. Lei, Y.; Yu, Y.; Lei, X.; Liang, X.; Cheng, S.; Ouyang, G.; Yang, X. Assessing the Use of Probes and Quenchers for Understanding the Reactive Species in Advanced Oxidation Processes. Environ. Sci. Technol. 2023, 57, 5433–5444. [Google Scholar] [CrossRef]
  16. Zhang, N.; Yi, Y.; Lian, J.; Fang, Z. Effects of Ce Doping on the Fenton-like Reactivity of Cu-Based Catalyst to the Fluconazole. Chem. Eng. J. 2020, 395, 124897. [Google Scholar] [CrossRef]
  17. Wang, M.; Zhao, Z.; Zhang, Y. Disposal of Fenton Sludge with Anaerobic Digestion and the Roles of Humic Acids Involved in Fenton Sludge. Water Res. 2019, 163, 114900. [Google Scholar] [CrossRef]
  18. Wang, Y.; Zhou, T.; Chen, D.; Zhang, Z.-X.; Zhang, Q.; Ye, X.; Wan, J.; Zou, J.-P. Fenton-like Catalysis by MnO2 Membrane Reactor with Oxygen Vacancies for Carbamazepine Degradation. Appl. Catal. B Environ. 2024, 353, 124106. [Google Scholar] [CrossRef]
  19. Yu, Y.; Li, N.; Wang, C.; Cheng, Z.; Yan, B.; Chen, G.; Hou, L.; Wang, S. Iron Cobalt and Nitrogen Co-Doped Carbonized Wood Sponge for Peroxymonosulfate Activation: Performance and Internal Temperature-Dependent Mechanism. J. Colloid Interface Sci. 2022, 619, 267–279. [Google Scholar] [CrossRef]
  20. Cheng, Z.; Luo, S.; Li, X.; Zhang, S.; Thang Nguyen, T.; Guo, M.; Gao, X. Ultrasound-Assisted Heterogeneous Fenton-like Process for Methylene Blue Removal Using Magnetic MnFe2O4/Biochar Nanocomposite. Appl. Surf. Sci. 2021, 566, 150654. [Google Scholar] [CrossRef]
  21. Luo, X.; Zhu, R.; Zhao, L.; Gong, X.; Zhang, L.; Fan, L.; Liu, Y. Defective Nitrogen Doped Carbon Material Derived from Nano-ZIF-8 for Enhanced in-Situ H2O2 Generation and Tetracycline Hydrochloride Degradation in Electro-Fenton System. Environ. Res. 2024, 251, 118644. [Google Scholar] [CrossRef] [PubMed]
  22. da Silveira Salla, J.; Dotto, G.L.; Hotza, D.; Landers, R.; da Boit Martinello, K.; Foletto, E.L. Enhanced Catalytic Performance of CuFeS2 Chalcogenide Prepared by Microwave-Assisted Route for Photo-Fenton Oxidation of Emerging Pollutant in Water. J. Environ. Chem. Eng. 2020, 8, 104077. [Google Scholar] [CrossRef]
  23. Cai, F.; Sun, C.; Sun, Z.; Lai, Y.; Ding, H. Sulfur-Functionalized CoMn2O4 as a Fenton-like Catalyst for the Efficient Rhodamine B Degradation. Appl. Surf. Sci. 2023, 623, 157044. [Google Scholar] [CrossRef]
  24. Chen, F.; Wu, X.; Shi, C.; Lin, H.; Chen, J.; Shi, Y.; Wang, S.; Duan, X. Molecular Engineering toward Pyrrolic N-Rich M-N4 (M = Cr, Mn, Fe, Co, Cu) Single-Atom Sites for Enhanced Heterogeneous Fenton-Like Reaction. Adv. Funct. Mater. 2021, 31, 110725. [Google Scholar] [CrossRef]
  25. Chen, S.; Ran, X.; Ren, G.; Wei, Z.; Wang, Z.; Rao, T.; Li, R.; Ma, X. Comparison of Fenton and Ozone Oxidation for Pretreatment of Petrochemical Wastewater: COD Removal and Biodegradability Improvement Mechanism. Separations 2022, 9, 179. [Google Scholar] [CrossRef]
Figure 1. Reactor operation diagram.
Applsci 15 05945 g001
Figure 2. XRD patterns of iron mud-based catalysts obtained by pyrolysis at different pyrolysis times.
Applsci 15 05945 g002
Figure 3. Scanning electron microscopy images of (a) Cat−1, (b) Cat−2, (c) Cat−3, (d) Cat−4 and (e) Cat−5.
Applsci 15 05945 g003
Figure 4. XPS spectra of (a) C1s, (b) N1s, (c) O1s, and (d) Fe2p in Cat−1, Cat−2, Cat−3, Cat−4 and Cat−5.
Applsci 15 05945 g004
Figure 5. The contents of the corresponding active sites of (a) C1s, (b) N1s, (c) O1s, and (d) Fe2p in Cat−1, Cat−2, Cat−3, Cat−4, and Cat−5.
Applsci 15 05945 g005
Figure 6. (a) Adsorption removal of MB by iron mud-based catalyst under different pyrolysis times; (b) Degradation of MB via H2O2 activation by iron mud-based catalyst under different pyrolysis times.
Applsci 15 05945 g006
Figure 7. Effect of ferrate to H2O2 concentration ratio on COD removal efficiency. The reaction condition: pH = 8.1, [Fe(VI)] + [H2O2] = 0.9 mM.
Applsci 15 05945 g007
Figure 8. (a) Degradation rate under different capture agents and (b) PMSO consumption and PMSO2 production in the system.
Applsci 15 05945 g008
Figure 9. EPR spectra of (a) high valent iron, (b) 1O2, (c) O2•− and (d) OH in the Cat−2/H2O2/Fe(VI) system.
Applsci 15 05945 g009
Figure 10. Mechanism diagram of COD degradation by Cat−2/H2O2/Fe(VI) system.
Applsci 15 05945 g010
Table 1. Main elements of the original Fenton iron mud.
Elemental CompositionProportion (wt%)Elemental CompositionProportion (wt%)
C49.70S1.45
Fe35.40Al1.03
N3.43P0.89
Ca3.33Na0.61
Si2.98
Table 2. COD removal rate under different conditions in the Cat−2/H2O2 system (pH = 4).
pHCatalyst Concentration (g/L)[H2O2] (mM)Removal Rate (%)COD (mg/L) (±1)
40.51.033.048
50.51.013.660
40.51.516.558
42.01.029.150
Table 3. COD removal rate under different conditions in the Cat−2/H2O2/Fe(VI) system. (The reaction condition: [Fe(VI)] = 100 μM, [H2O2] = 1 mM, CCatalyst = 0.5 g/L, pH = 4.0).
pHRemoval RateCOD (mg/L) (±1)
4.07.7%65
5.00.0%70
6.00.0%70
7.511.8%62
8.131.3%48
Table 4. COD removal rate under different conditions in the Cat−2/H2O2/Fe(VI) system. (The reaction condition: pH = 8.1, [Fe(VI)]:[H2O2] = 1:5).
pH[H2O2] + Fe(VI)](mM)[H2O2]:[Fe(VI)]Removal Rate (%)
8.10.95:131.8
8.11.55:132.8
8.11.85:134.4
Table 5. Kinetic constants of quenching experiments.
Quencherk (min−1)
TBA0.0240
CF0.0216
FFA0.0055
black0.0533
Table 6. COD removal at different reflux ratios.
Catalyst
(g)
Wastewater COD
(mg/L)
Flow Rate
(mL/min)
pH
(±0.20)
[H2O2]
(mM)
[Fe(VI)]
(mM)
Reflux
Ratio
Outlet COD
(mg/L)
Lower layer 60,
Middle layer 50,
Upper layer 30
7140.128.100.80.1-57
6940.128.100.80.11:248
6940.128.100.80.11:443
Table 7. COD removal at different oxidant concentrations.
Catalyst
(g)
Wastewater COD
(mg/L)
Flow Rate
(mL/min)
pH
(±0.20)
[H2O2]
(mM)
[Fe(VI)]
(mM)
Reflux RatioOutlet COD
(mg/L)
Lower layer 60,
Middle layer 50,
Upper layer 30
6940.128.100.80.11:247
7040.128.101.20.151:245
6832.988.100.80.1-45
6832.988.101.20.15-44
Table 8. COD removal at different flow rates.
Catalyst
(g)
Wastewater COD
(mg/L)
Flow Rate (mL/min)pH
(±0.20)
[H2O2]
(mM)
[Fe(VI)]
(mM)
Reflux RatioOutlet COD
(mg/L)
Lower layer 60,
Middle layer 50,
Upper layer 30
6232.988.100.80.11:348
6226.018.100.80.11:343
6740.128.101.20.15-42
6832.988.101.20.15-44
Table 9. COD removal by different catalyst concentrations.
Catalyst
(g)
Wastewater COD
(mg/L)
Flow Rate
(mL/min)
pH
(±0.20)
[H2O2]
(mM)
[Fe(VI)]
(mM)
Reflux RatioOutlet COD
(mg/L)
Lower layer
Middle layer
Upper layer
606126.018.101.00.1251:442
50
30
Lower layer
Middle layer
Upper layer (Aeration)
606126.018.101.00.1251:441
50
30
Lower layer
Middle layer
Upper layer
1206226.018.101.00.1251:439
120
100
Lower layer
Middle layer
Upper layer
1206226.018.101.00.1251:436
120
120
Lower layer
Middle layer
Upper layer
1406226.018.101.00.1251:437
140
140
Disclaimer/Publisher’s Note: The statements, opinions and data contained in all publications are solely those of the individual author(s) and contributor(s) and not of MDPI and/or the editor(s). MDPI and/or the editor(s) disclaim responsibility for any injury to people or property resulting from any ideas, methods, instructions or products referred to in the content.

