Article

Facilitation of the Kinetics of Alkaline Water Electrolysis on Polycrystalline Nickel Electrode by Introduction of Acetone to 0.1 M NaOH Working Solution

by
Mateusz Kuczyński
1,
Tomasz Mikołajczyk
1,
Bogusław Pierożyński
1,* and
Bartosz Pszczółkowski
2
1
Department of Chemistry, Faculty of Agriculture and Forestry, University of Warmia and Mazury in Olsztyn, Łódzki Square 4, 10-727 Olsztyn, Poland
2
Department of Materials and Machines Technology, Faculty of Technical Sciences, University of Warmia and Mazury in Olsztyn, Oczapowskiego 11 Street, 10-719 Olsztyn, Poland
*
Author to whom correspondence should be addressed.
Appl. Sci. 2025, 15(11), 5949; https://doi.org/10.3390/app15115949
Submission received: 27 March 2025 / Revised: 10 May 2025 / Accepted: 22 May 2025 / Published: 25 May 2025
(This article belongs to the Special Issue Electrochemistry in Energy Conversion and Storage)

Abstract

:
The current work examines the effect of acetone on the electrochemical characteristics of a polycrystalline nickel electrode in a 0.1 M NaOH electrolyte, with respect to the kinetics of alkaline water electrolysis (HER: hydrogen evolution reaction, and OER: oxygen evolution reaction). Cyclic voltammetry (CV) and impedance spectroscopy (EIS) electrochemical techniques were employed to examine these processes for acetone concentrations stretching from 1.0 × 10⁻⁷ to 1.0 × 10⁻³ M. The introduction of small amounts of (CH3)2C=O clearly facilitated the catalytic efficiency of both examined electrochemical gas evolution processes. The latter is believed to result from a significant reduction in the surface tension parameter, due to the mutual interactions of acetone and water molecules, thus facilitating the detachment of gas bubbles from the nickel electrode surface. These findings suggest considerable opportunities for the introduction of tiny amounts of organic additives into alkaline electrolytes to improve the industrial alkaline water electrolysis process that is performed on technologically valuable electrode materials.

1. Introduction

The production of hydrogen through water electrolysis, powered by renewable energy sources such as solar and wind, is considered a fundamental step toward achieving sustainable hydrogen production. Given the high energy input required for this process, developing cost-effective and efficient electrocatalysts becomes a major priority for industry. Nickel, known for its excellent activity in alkaline media, is a widely adopted material in electrode assemblies for alkaline water electrolyzers [1,2,3].
Alkaline water electrolysis (AWE) remains one of the most widely applied methods for large-scale hydrogen generation, due to its operational simplicity, lower materials cost compared with proton exchange membrane (PEM) systems and extended tolerance to electrolyte impurities. However, the performance of AWE is still constrained by the relatively slow kinetics of HER and especially OER, thus necessitating additional strategies to improve the overall system’s efficiency beyond the catalyst design.
Moreover, the reaction rates of hydrogen evolution (HER) and oxygen evolution (OER) can be notably altered by introducing trace quantities of organic compounds into the electrolyte. Depending on their chemical nature, such additives may enhance or hinder the overall performance of the electrochemical setup [4,5,6]. Substances such as alcohols, ketones and organic acids are amongst those that could interact with the electrolysis system, especially because their incidental presence in industrial environments is not uncommon. For example, these molecules could effectively become adsorbed on the nickel electrode surface with some molecules experiencing potential-dependent surface electro-oxidation and electroreduction processes [7,8,9,10,11,12], possibly affecting the rates of the water electrolysis process.
On the other hand, the suitable employment of organic electrolyte additives might result in facilitated electrode reaction rates and, thus, in the enhanced performance of the green hydrogen and oxygen production processes. Among the various investigated organic additives, acetone stands out due to its strong hydrogen bonding with water and its known ability to lower surface tension, which may directly affect the kinetics of gas evolution processes [13,14,15]. Despite its promising features, the electrochemical behaviour of acetone in nickel-based systems remains largely unexplored. This knowledge gap is particularly relevant when considering nickel’s dominance in industrial AWE stacks and the growing interest in the low-cost process’s enhancement without the introduction of complex electrode modifications.
This work follows an introductory article [16] on the influence of acetone on hydrogen and oxygen evolution reactions at a polycrystalline platinum electrode in 0.1 M NaOH, as reported in a recent study conducted by this research group. By investigating cyclic voltammetry (CV) and impedance spectroscopy (EIS) characteristics, the authors of this work seek to elucidate how acetone additions [with (CH3)2C=O concentrations ranging from 1.0 × 10⁻⁷ to 1.0 × 10⁻³ M] could influence the kinetics of the HER and OER processes on the surface of a commonly used Ni catalyst material in alkaline water electrolysis. In this respect, the obtained results are markedly important for industrial alkaline water electrolysis applications.

2. Materials and Methods

The supporting electrolyte (0.1 M NaOH) was prepared using high-purity sodium hydroxide pellets (MERCK) and ultrapure water (18.2 MΩ cm resistivity), supplied by a Millipore Direct-Q3 UV system (Darmstadt, Germany). Acetone with a purity exceeding 99% was sourced from Sigma-Aldrich (Poznań, Poland).
All electrochemical measurements were conducted in a conventional three-electrode setup, using a custom-made Pyrex glass cell, consisting of an 80 mL main compartment and two side (reference- and counter-electrode) compartments, connected to the central section via glass tubings. The electrolyte was thoroughly purged with argon 6.0 grade prior to running each series of experiments and continuous Ar blanket was maintained over the cell’s main section throughout the measurements in order to prevent its oxygen contamination. The working electrode (WE) was a polycrystalline nickel wire (0.5 mm diameter, 99.99% purity, Sigma-Aldrich) with an exposed area of 1.76 cm2. A reversible hydrogen electrode (RHE), fabricated from 1.0 mm diameter palladium wire (99.99% purity, Sigma-Aldrich), served as the reference electrode. A coiled platinum wire (1.0 mm diameter, 99.9998% purity, Johnson Matthey, Chicago, USA) was employed as the counter electrode (CE). Before conducting the experiments, the nickel electrode was thoroughly washed in ultrapure water and was additionally activated in 0.1 M NaOH solution by cathodic polarization at 20 mA for 300 s in order to remove any spontaneously formed Ni oxide layering. By means of a dedicated holder, the working electrode was then mounted vertically and immersed to a defined geometric surface area. Acetone stock solutions were freshly prepared in 0.1 M NaOH by serial dilutions from a concentrated acetone–water mixture, using volumetric flasks and micropipettes to ensure accurate, low-concentration acetone dosing (1.0 × 10⁻⁷ to 1.0 × 10⁻³ M).
The PGSTAT302N AUTOLAB Electrochemical System (nLab, Warsaw, Poland) was utilized for all electrochemical experiments. The experimental approach included both cyclic voltammetry (CV) and electrochemical impedance spectroscopy (EIS). The EIS spectra were recorded for the frequency range of 100 kHz to 1 Hz, with an output ac. signal set at 5 mV. Data acquisition and equipment control were managed via the NOVA 2.1.8. software package. For each applied potential, EIS measurements were repeated three times to ensure consistency with observed variability, typically remaining below 10%. The impedance spectra were fitted by means of a complex, non-linear, least squares immittance fitting program, LEVM 6 [17]. Post-measurement iR compensation was applied, based on the recorded ac. impedance spectra.

3. Results and Discussion

3.1. Cyclic Voltammetry

Figure 1 presents cyclic voltammograms recorded for the HER on the polycrystalline nickel electrode surface, over the potential range from −0.60 to 0.20 V vs. RHE. Hence, the current density recorded at the potential of −0.60 V for the unmodified NaOH solution approached −7.0 mA cm−2 (see red plot in Figure 1). Then, the introduction of acetone into the electrolyte resulted in a considerable increase in the respective current density parameter, reaching ca. −7.5 and −7.75 mA cm−2 (current density amplification by ca. 1.07 and 1.11 times) for acetone concentrations of 1.0 × 10⁻³ and 1.0 × 10⁻⁵ M, respectively. The above could be considered in terms of significantly more hydrogen molecules being generated compared with acetone-free sodium hydroxide solution.
As the authors of this work argued in their recently published article (see Scheme 2 in [16]), the facilitation of the HER rates is believed to result from a considerable reduction in the surface tension parameter, caused by acetone-to-water hydrogen bonding interactions [14,15], leading to a significantly diminished overall reaction overpotential.
The oxygen evolution reaction was examined over the potential range from 0.00 to 1.70 V (see Figure 2). Thus, a cyclic voltammetry profile recorded on the polycrystalline Ni electrode in acetone-free 0.1 M NaOH solution exhibits an anodic peak centred at ca. 1.55 V, which illustrates the process of β-NiOOH formation from Ni(OH)2. Hence, a cathodic reduction feature, centred at about 1.35 V corresponds to the reduction of nickel oxyhydroxide, later on the Ni electrode surface [18,19,20]. Extending the anodic sweep beyond 1.60 V vs. RHE results in a pronounced increase of the anodic current, which signifies the initiation of the oxygen evolution reaction. The introduction of acetone notably alters both the redox features and the OER current response. Thus, both anodic and cathodic peak currents become more pronounced, and slight shifts in the peak positions are also observed. Moreover, for the OER activity region, a significant rise in the recorded voltammetric current density values is observed to reach, at the maximum of electrode potential (1.70 V), about 3.05 and 3.55 mA cm−2, respectively, at the acetone concentrations of 1.0 × 10⁻³, and 1.0 × 10⁻⁵ M (compared with ca. 2.55 mA cm−2 for the unmodified electrolyte, see Figure 2 again). The OER current density enhancement could be attributed to the reduced surface tension of the electrolyte, due to acetone–water hydrogen bonding interactions, which eventually results in the facilitation of the gas bubble detachment process. On the other hand, acetone is prone to undergo surface adsorption and further quasi-reversible electro-oxidation phenomenon (proceeding in line with the process of β-NiOOH formation), prior to the onset of the oxygen evolution reaction [14,15]. The latter results in significantly rising voltammetric anodic and cathodic charges for the lowest and intermediate acetone concentrations, whereas the highest (CH3)2C=O concentration (1 × 10⁻³ M) already starts contributing to the surface poisoning effect (see Figure 2). In addition, acetone, due to its molecular structure, exhibits higher polarizability than water molecules at the interface and, as such, might contribute to the increased values of the recorded interfacial capacitance [21,22].

3.2. Tafel Polarization Plots

Furthermore, Figure 3 and Figure 4 present potentiostatic Tafel cathodic and anodic polarization plots (correspondingly), recorded on the polycrystalline nickel electrode in the unmodified NaOH solution and in the presence of acetone, at the concentrations of 1.0 × 10⁻⁷, 1.0 × 10⁻⁵ and 1.0 × 10⁻³ M (CH3)2C=O. Thus, the recorded cathodic slopes, bc (for the overpotential range 150–300 mV in Figure 3) came to 96, 85 and 92 mV dec−1 for the unmodified NaOH, and in the presence of 1.0 × 10⁻⁵ and 1.0 × 10⁻³ M of acetone, respectively. Simultaneously, the above is aligned with the general facilitation of the exchange current density, j0 parameter. The corresponding Tafel-derived values of the j0 parameter came to 9.4 × 10⁻⁶, 4.6 × 10⁻⁶ and 1.2 × 10⁻⁵ A cm−2.
On the other hand, for the OER process, the derived anodic slopes, ba (for the overpotential range 250–350 mV in Figure 4) came to 43, 45, 42 and 37 mV dec−1 for the unmodified NaOH, and in the presence of 1.0 × 10⁻⁷, 1.0 × 10⁻⁵ and 1.0 × 10⁻³ M of acetone, correspondingly. Again, the latter is aligned with the facilitation of the reaction’s exchange current density parameter. The Tafel-based values of the j0 parameter amounted to 1.5 × 10⁻¹¹, 1.2 × 10⁻¹⁰, 1.6 × 10⁻¹⁰ and 1.2 × 10⁻¹¹ A cm−2, respectively (compared with the literature-based values given for the HER and OER processes in [20,23,24,25]). For the highest acetone concentration, an estimated value of the exchange current density became significantly reduced, which is in line with the cyclic voltammetry features observed in Figure 2. The latter is supposedly related to partial Ni surface blockage by acetone molecules or otherwise to increased electrode contamination by acetone-based impurities.
Interestingly, the initial anodic polarization of the polycrystalline nickel electrode revealed a typical passivation feature (observed in Figure 4 over the potential range ca. 1.43–1.48 V/RHE), which led to a temporary reduction in the current density, due to the formation of a passive oxide layer on the nickel electrode surface (see, e.g., [26] for details).

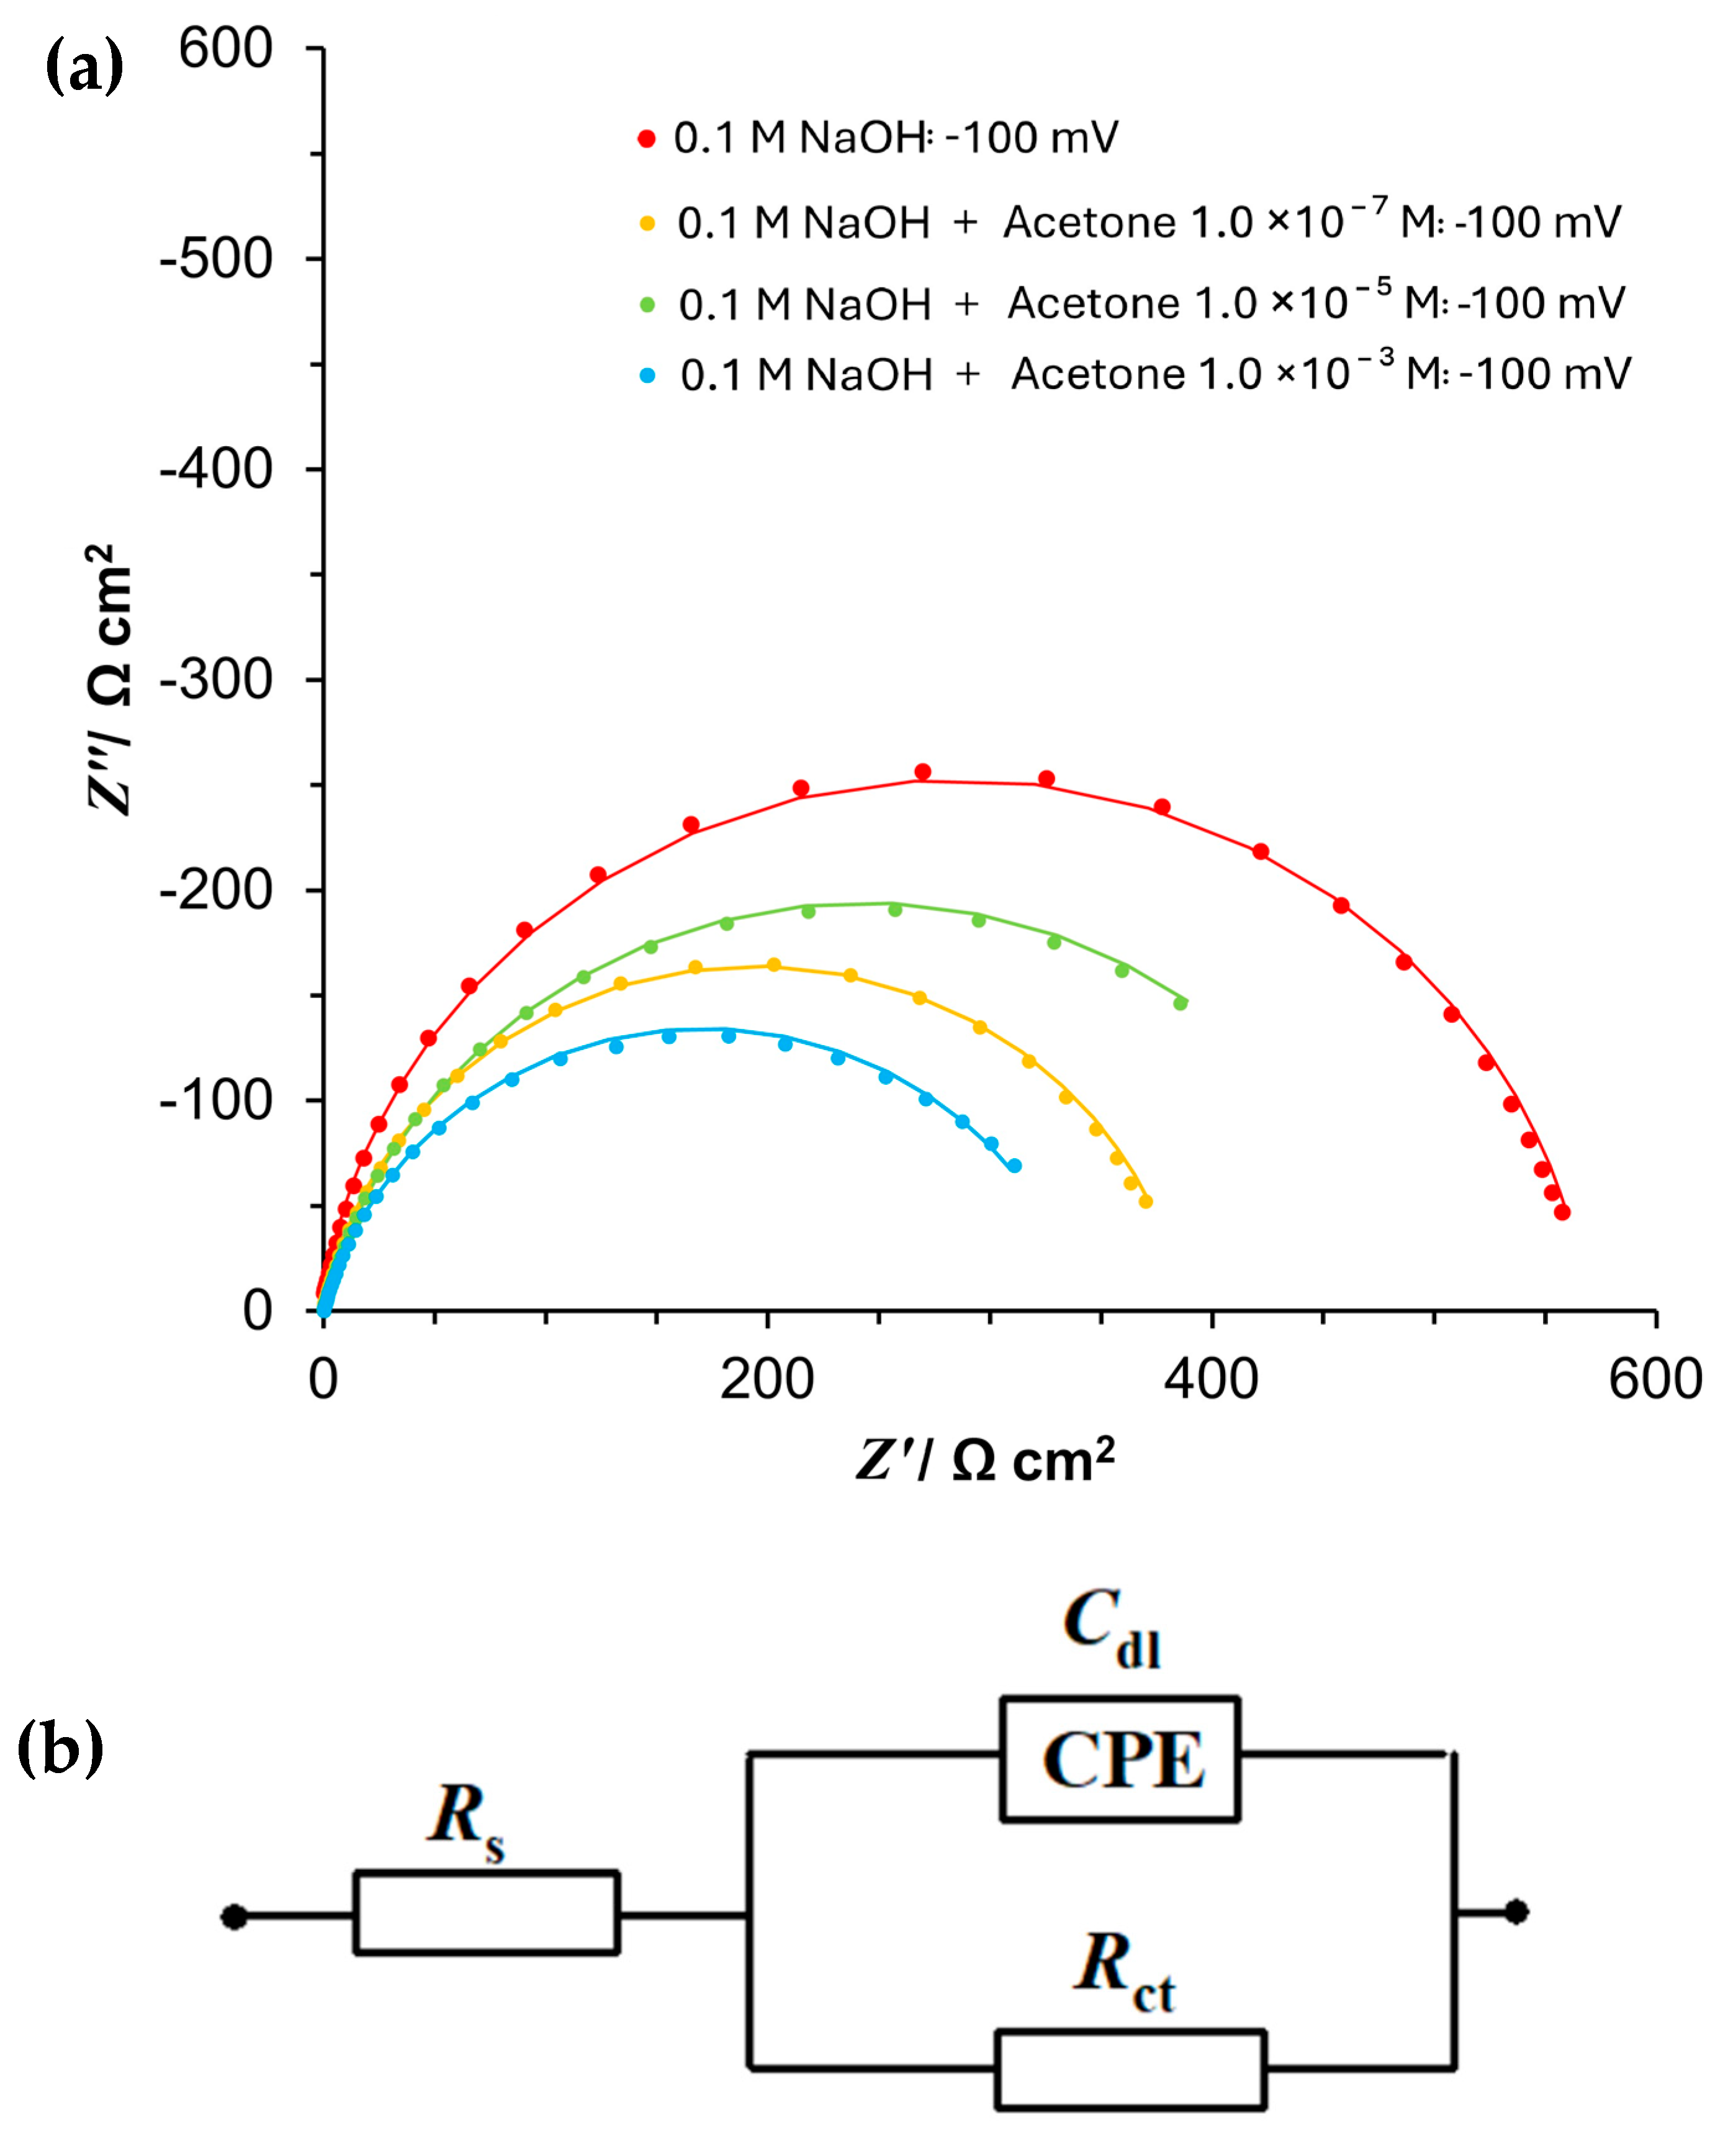
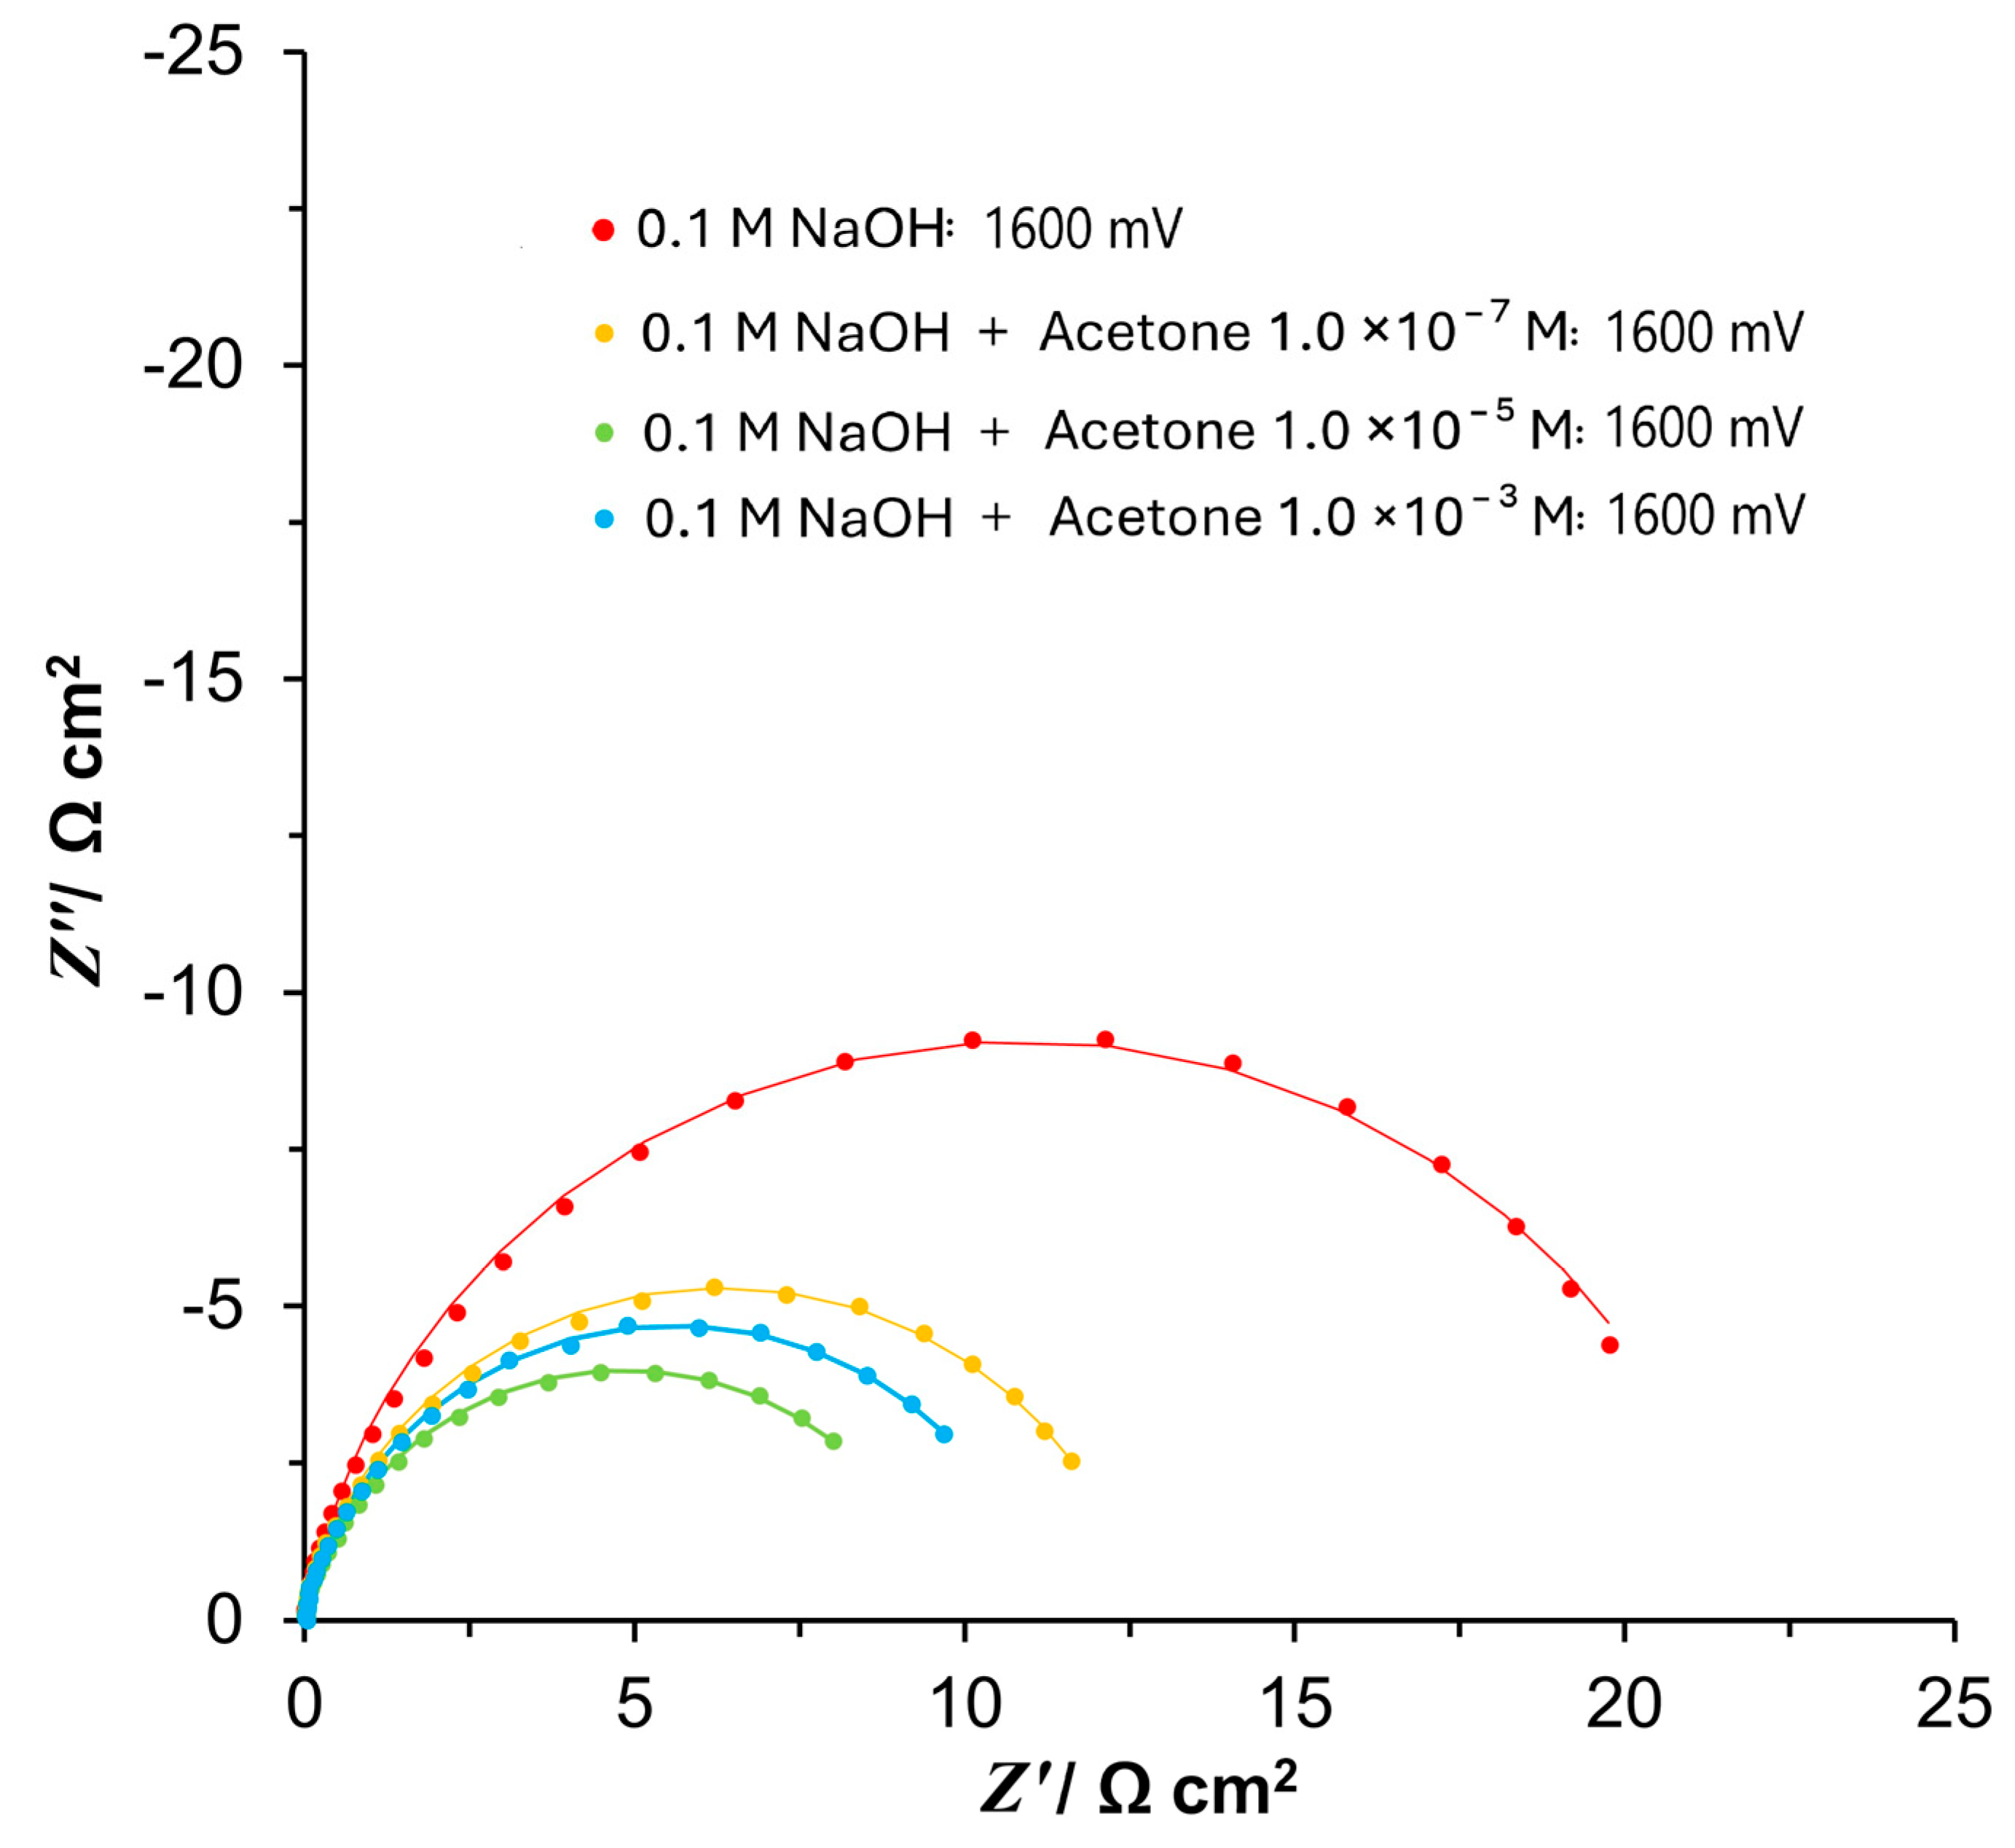
3.3. Ac. Impedance Spectroscopy

The ac. impedance electrochemical characteristics of the polycrystalline nickel electrode surface in the 0.1 M NaOH electrolyte, in the absence and presence of acetone, at the concentrations of 1.0 × 10⁻⁷, 1.0 × 10⁻⁵ and 1.0 × 10⁻³ M over the potential ranges characteristic for the HER and OER processes, is shown in the Nyquist impedance plots of Figure 5 and Figure 6, and Table 1 and Table 2 below.
Hence, for the hydrogen evolution reaction, a single (and slightly depressed) semicircle on the polycrystalline Ni electrode was present in the Nyquist impedance plots (Figure 5). The impedance measurements were performed over the potential range from −50 to −500 mV vs. RHE. For the acetone-free NaOH solution, the recorded charge transfer resistance, Rct, values reduced from 1076.2 Ω cm2 at an overpotential (η) of 50 mV to 7.7 Ω cm2 at η = 500 mV. On the other hand, for the respective potentials, the double layer capacitance, Cdl, parameter values reduced from 217.5 to 85.1 μF cm−2 (Table 1). The latter is most likely the effect of rising Ni surface blockage by vigorously evolving hydrogen microbubbles at increased overpotentials.
Then, the addition of acetone into the supporting solution caused a gradual diminution of the Rct parameter, where, for the acetone concentrations of 1.0 × 10⁻⁷ and 1.0 × 10⁻³ M, the recorded resistance values of 502.0 and 430.1 Ω cm2 (at −50 mV), and 7.4 and 6.7 Ω cm2 (at −500 mV), exhibited a 2.1× and 2.5×, and 1.04× and 1.1× Rct reduction, correspondingly. The highest decrease in the charge transfer resistance was understandably recorded at low overpotential values, where the HER undergoes kinetic control.
This behaviour (as recently argued for the polycrystalline Pt electrode by Adamicka et al. in [16]) is believed to result from the reduction in the solution’s surface tension phenomenon, caused by considerably amplified H bonding interactions between (CH3)2C=O and H2O molecules. The latter tends to facilitate the process of the H2 gas bubbles’ disengagement from the electrode surface, thus increasing the electrochemically accessible Ni electrode surface area. This interpretation is further reinforced by the observed rise in Cdl values upon increasing acetone concentration, especially at very low overpotentials (see Table 1 for details). It should also be stressed here that the significance of this nickel electrode study does not only rely on its technological importance for the process of alkaline water electrolysis, but also on nickel’s low susceptibility to the surface-induced reduction–oxidation and electrosorption phenomena involving organic molecules. In this respect, nickel stands in total contradiction to platinum and Pt-based electrocatalysts (see, e.g., [12,27]).
The ac. impedance spectra for the oxygen evolution reaction were recorded over a potential window of 1550 to 2000 mV vs. RHE. As for the HER, the obtained Nyquist impedance plots constitute single and somewhat distorted semicircles (Figure 6). Hence, for the acetone-free NaOH solution, the Rct parameter diminished from 74.1 Ω cm2 (at 1550 mV) to 2.4 Ω cm2 at 2000 mV (compared with the OER impedance results reported in [19]). Again, the introduction of acetone (compared with the two extreme acetone concentrations) resulted in considerable diminution of the charge transfer resistance, reaching 28.5 and 24.9 Ω cm2 (at 1550 mV), and 2.3 and 2.2 Ω cm2 at 2000 mV (Table 2). The above translates to a Rct reduction by ca. 2.6× and 3.0×, and 1.04× and 1.1×, correspondingly. Furthermore, the Cdl parameter exhibited significant augmentation [e.g., from ca. 2410 μF cm−2 (unmodified NaOH) to 7390 μF cm−2 (for acetone concentration of 1.0 × 10⁻³ M) at the electrode potential of 2000 mV] for the OER measurements conducted at gradually rising acetone concentrations.

4. Conclusions

The introduction of acetone over the concentration range 1.0 × 10⁻⁷ to 1.0 × 10⁻³ M into a 0.1 M NaOH working solution significantly enhanced the rates of both hydrogen and oxygen evolution processes. This improvement is likely linked to a marked reduction in the surface tension, stemming from hydrogen bonding between acetone and water molecules. As a result, gas bubbles are more readily released from the nickel electrode surface, thus improving the reactions’ kinetics. Although the current work is a spin-off of a recently published (introductory) paper on the topic from this laboratory, it is particularly important as it covers the employment of nickel catalyst material, which is technologically essential in the construction of electrode stacks, for the process of alkaline water electrolysis.
Also, the recorded results implied that simple organic molecules (such as acetone) may hold practical value in enhancing the efficiency of alkaline water electrolysis. However, to gain a comprehensive understanding of acetone’s role in the process of alkaline water splitting, supplementary studies, including long-term and temperature-based measurements, would also be necessary.

Author Contributions

Conceptualization, T.M. and B.P. (Bogusław Pierożyński); methodology, T.M.; software, B.P. (Bartosz Pszczółkowski) and M.K.; validation, T.M. and B.P. (Bogusław Pierożyński); formal analysis, B.P. (Bartosz Pszczółkowski); investigation, T.M.; resources, B.P. (Bartosz Pszczółkowski); data curation, M.K.; writing—original draft preparation, T.M.; writing—review and editing, B.P. (Bogusław Pierożyński); visualization, T.M.; supervision, T.M.; project administration, T.M.; funding acquisition, B.P. (Bogusław Pierożyński). All authors have read and agreed to the published version of the manuscript.

Funding

This work has been primarily financed by the internal research grant no. 30.610.001-110, provided by The University of Warmia and Mazury in Olsztyn.

Institutional Review Board Statement

Not applicable.

Informed Consent Statement

Not applicable.

Data Availability Statement

The raw data supporting the conclusions of this article will be made available by the authors on request.

Conflicts of Interest

The authors declare no conflicts of interest.

References

  1. Xu, X.; Shao, Z.; Jiang, S.P. High-Entropy Materials for Water Electrolysis. Energy Technol. 2022, 10, 2200573. [Google Scholar] [CrossRef]
  2. Guan, D.; Wang, B.; Zhang, J.; Shi, R.; Jiao, K.; Li, L.; Wang, Y.; Xie, B.; Zhang, Q.; Yu, J.; et al. Hydrogen Society: From Present to Future. Energy Environ. Sci. 2023, 16, 4926–4943. [Google Scholar] [CrossRef]
  3. Santos, D.M.F.; Sequeira, C.A.C.; Figueiredo, J.L. Hydrogen Production by Alkaline Water Electrolysis. Quim. Nova 2013, 36, 1176–1193. [Google Scholar] [CrossRef]
  4. Becker, H.; Murawski, J.; Shinde, D.V.; Stephens, I.E.L.; Hinds, G.; Smith, G. Impact of Impurities on Water Electrolysis: A Review. Sustain. Energy Fuels 2023, 7, 1565–1603. [Google Scholar] [CrossRef]
  5. Barwe, S.; Mei, B.; Masa, J.; Schuhmann, W.; Ventosa, E. Overcoming Cathode Poisoning from Electrolyte Impurities in Alkaline Electrolysis by Means of Self-Healing Electrocatalyst Films. Nano Energy 2018, 53, 763–768. [Google Scholar] [CrossRef]
  6. Chauhan, D.; Ahn, Y.H. Alkaline Electrolysis of Wastewater and Low-Quality Water. J. Clean. Prod. 2023, 397, 136613. [Google Scholar] [CrossRef]
  7. Rizo, R.; Ferre-Vilaplana, A.; Herrero, E.; Feliu, J.M. Ethanol Electro-oxidation Reaction Selectivity on Platinum in Aqueous Media. ACS Sustain. Chem. Eng. 2023, 11, 4960–4968. [Google Scholar] [CrossRef]
  8. Vigier, F.; Coutanceau, C.; Hahn, F.; Belgsir, E.M.; Lamy, C. On the Mechanism of Ethanol Electro-oxidation on Pt and PtSn Catalysts: Electrochemical and in situ IR Reflectance Spectroscopy Studies. J. Electroanal. Chem. 2004, 563, 81–89. [Google Scholar] [CrossRef]
  9. Bondue, C.J.; Calle-Vallejo, F.; Figueiredo, M.C.; Koper, M.T.M. Structural Principles to Steer the Selectivity of the Electrocatalytic Reduction of Aliphatic Ketones on Platinum. Nat. Catal. 2019, 2, 243–250. [Google Scholar] [CrossRef]
  10. Mekazni, D.S.; Arán-Ais, R.M.; Feliu, J.M.; Herrero, E. Understanding the Electrochemical Hydrogenation of Acetone on Pt Single Crystal Electrodes. J. Electroanal. Chem. 2022, 922, 116697. [Google Scholar] [CrossRef]
  11. Bondue, C.J.; Koper, M.T.M. Electrochemical Reduction of the Carbonyl Functional Group: The Importance of Adsorption Geometry, Molecular Structure, and Electrode Surface Structure. J. Am. Chem. Soc. 2019, 141, 12071–12078. [Google Scholar] [CrossRef] [PubMed]
  12. Pierozynski, B. Electrochemical Behaviour of Urea at Pt(111) Single-Crystal Surface in 0.1 M NaOH. Electrocatalysis 2013, 4, 37–41. [Google Scholar] [CrossRef]
  13. Enders, S.; Kahl, H.; Winkelmann, J. Surface Tension of the Ternary System Water + Acetone + Toluene. J. Chem. Eng. Data 2007, 52, 1072–1079. [Google Scholar] [CrossRef]
  14. Howard, K.S.; McAllister, R.A. Surface Tension of Acetone-water Solutions Up to Their Normal Boiling Points. AIChE J. 1957, 3, 325–329. [Google Scholar] [CrossRef]
  15. Wu, N.; Li, X.; Liu, S.; Zhang, M.; Ouyang, S. Effect of Hydrogen Bonding on the Surface Tension Properties of Binary Mixture (Acetone-Water) by Raman Spectroscopy. Appl. Sci. 2019, 9, 1235. [Google Scholar] [CrossRef]
  16. Adamicka, A.; Mikołajczyk, T.; Kuczyński, M.; Pierożyński, B. The Influence of Acetone on the Kinetics of Water Electrolysis Examined at Polycrystalline Pt Electrode in Alkaline Solution. Catalysts 2024, 14, 488. [Google Scholar] [CrossRef]
  17. Macdonald, J.R. Impedance Spectroscopy, Emphasizing Solid Materials and Systems; John Wiley & Sons: New York, NY, USA, 1987; pp. 1–368. ISBN 0-471-83122-0. [Google Scholar]
  18. Ferreira, E.B.; Tahmasebi, S.; Jerkiewicz, G. On the Catalytic Activity and Corrosion Behavior of Polycrystalline Nickel in Alkaline Media in the Presence of Neutral and Reactive Gases. Electrocatalysis 2021, 12, 146–164. [Google Scholar] [CrossRef]
  19. Foroughi, F.; Faid, A.Y.; Sunde, S.; Pollet, B.G. Sonoactivated polycrystalline Ni electrodes for alkaline oxygen evolution reaction. Ultrason. Sonochem. 2022, 86, 106013. [Google Scholar] [CrossRef] [PubMed]
  20. Slis, A.; Mikolajczyk, T.; Pierozynski, B. Influence of Electrooxidation of Ni Wire Electrodes on the Kinetics of Oxygen Evolution Reaction Studied in 0.1 mol dm−3 NaOH. J. Braz. Chem. Soc. 2019, 30, 305–309. [Google Scholar] [CrossRef]
  21. Liu, Y.; Zeng, Y.; Liu, R.; Wu, H.; Wang, G.; Cao, D. Poisoning of acetone to Pt and Au electrodes for electrooxidation of 2-propanol in alkaline medium. Electrochim. Acta 2012, 76, 174–178. [Google Scholar] [CrossRef]
  22. Guan, Y.; Kumper, J.; Kumari, S.; Heiming, N.; Murtz, S.D.; Steinmann, S.N.; Palkovitz, S.; Palkovitz, R.; Sautet, P. Probing the Electric Double-Layer Capacitance to Understand the Reaction Environment in Conditions of Electrochemical Amination of Acetone. ACS Appl. Mater. Interfaces 2025, 17, 4087–4097. [Google Scholar] [CrossRef]
  23. Kibria, M.F.; Mridha, M.S. Electrochemical Studies of the Nickel Electrode for the Oxygen Evolution Reaction. Int. J. Hydrogen Energy 1996, 21, 179–182. [Google Scholar] [CrossRef]
  24. Lu, Y.; Wang, W.; Xie, F. Investigation of oxygen evolution reaction kinetic process and kinetic parameters on iridium electrode by electrochemistry impedance spectroscopy analysis. J. Electroanal. Chem. 2020, 871, 114281. [Google Scholar] [CrossRef]
  25. Pierozynski, B.; Mikolajczyk, T.; Kowalski, I.M. Hydrogen evolution at catalytically-modified nickel foam in alkaline solution. J. Power Sources 2014, 271, 231–238. [Google Scholar] [CrossRef]
  26. Pierozynski, B.; Smoczynski, L. Electrochemical Corrosion Behavior of Nickel-Coated Carbon Fiber Materials in Various Electrolytic Media. J. Electrochem. Soc. 2008, 155, C427–C436. [Google Scholar] [CrossRef]
  27. Pierozynski, B.; Kowalski, I.M. Electrochemical reactivity of formamidoxime on Pt(111) and (100) single-crystal surfaces in 0.1 M NaOH solution. J. Electroanal. Chem. 2011, 662, 432–436. [Google Scholar] [CrossRef]
Figure 1. The cyclic voltammograms recorded on the surface of polycrystalline Ni electrode (at 50 mV s−1, on the second cycle), within the potential range for HER in 0.1 M NaOH electrolyte, in the absence and presence of acetone, at the indicated (CH3)2C=O concentrations.
Applsci 15 05949 g001
Figure 2. The cyclic voltammograms recorded on the surface of polycrystalline Ni electrode (on the second cycle), presenting the potential range for OER in 0.1 M NaOH solution, in the absence and presence of acetone, at the indicated (CH3)2C=O concentrations.
Applsci 15 05949 g002
Figure 3. Quasi-potentiostatic cathodic Tafel polarization plots (recorded at a scan rate of 0.5 mV s−1) for polycrystalline Ni wire electrode, recorded in 0.1 M NaOH solution (in the absence and presence of acetone, at the indicated concentrations). Appropriate iR correction was made based on the solution resistance derived from the impedance measurements.
Applsci 15 05949 g003
Figure 4. Quasi-potentiostatic anodic Tafel polarization plots (recorded at a scan rate of 0.5 mV s−1) for polycrystalline Ni wire electrode, recorded in 0.1 M NaOH solution (in the absence and presence of acetone, at the indicated concentrations). Appropriate iR correction was made based on the solution resistance derived from the impedance measurements.
Applsci 15 05949 g004
Figure 5. (a) The Nyquist impedance plots for HER performed on polycrystalline nickel electrode surface at −100 mV vs. RHE in 0.1 M NaOH, in the absence and presence of acetone, at the specified concentrations; (b) equivalent circuit used to fit the data for HER and OER processes, where Rct is charge transfer resistance and Cdl, and Rs correspond to CPE (constant-phase element)-modified double layer capacitance and solution resistance parameters, respectively.
Applsci 15 05949 g005
Figure 6. The Nyquist impedance plots for OER conducted on the surface of polycrystalline nickel electrode at 1600 mV vs. RHE in 0.1 M NaOH, in the absence and presence of acetone, at the denoted concentrations.
Applsci 15 05949 g006
Table 1. The resistance and capacitance parameters for the process of HER on polycrystalline nickel electrode surface in 0.1 M NaOH solution, obtained in the absence and presence of acetone at the specified concentrations, acquired by fitting the equivalent circuit (Figure 5b) to the recorded impedance data (values of dimensionless φ parameter for the CPE circuit fluctuated between 0.84 and 0.97; χ2 = 3 × 10⁻⁵–4 × 10⁻³).
0.1 M NaOH
E/mVRct/Ω cm2Cdl/μF cm−2
−501076.2 ± 3.7217.5 ± 1.3
−100567.3 ± 1.4179.3 ± 1.2
−150227.8 ± 0.9159.1 ± 1.9
−20080.7 ± 0.3132.2 ± 2.5
−25036.5 ± 0.1120.2 ± 2.5
−30022.6 ± 0.1113.8 ± 3.0
−35015.3 ± 0.1108.2 ± 2.7
−40011.5 ± 0.089.3 ± 2.6
−4509.3 ± 0.089.9 ± 3.3
−5007.7 ± 0.085.1 ± 0.0
0.1 M NaOH + 1.0 × 10⁻⁷ M acetone
−50502.0 ± 1.5321.5 ± 1.0
−100349.0 ± 1.4277.8 ± 2.2
−150162.1 ± 0.5250.2 ± 2.3
−20076.2 ± 0.2213.0 ± 2.7
−25031.3 ± 0.1182.0 ± 3.6
−30020.2 ± 0.1138.1 ± 3.7
−35013.9 ± 0.1129.9 ± 5.1
−40010.0 ± 0.1130.4 ± 6.4
−4507.8 ± 0.1119.3 ± 6.6
−5007.4 ± 0.1111.0 ± 1.3
0.1 M NaOH + 1.0 × 10⁻⁵ M acetone
−50613.4 ± 3.3338.9 ± 1.7
−100482.4 ± 0.9266.8 ± 0.9
−150239.0 ± 0.7205.6 ± 1.5
−200104.4 ± 0.4142.2 ± 2.2
−25044.1 ± 0.295.8 ± 2.9
−30029.3 ± 0.284.8 ± 3.7
−35017.5 ± 0.166.8 ± 3.2
−40011.4 ± 0.166.3 ± 3.4
−4508.7 ± 0.172.9 ± 3.5
−5007.5 ± 0.157.1 ± 0.3
0.1 M NaOH + 1.0 × 10⁻³ M acetone
−50430.1 ± 4.2371.3 ± 4.1
−100341.1 ± 1.2318.7 ± 2.4
−150189.2 ± 0.3213.3 ± 1.2
−20080.6 ± 0.4138.0 ± 2.6
−25040.2 ± 0.3119.1 ± 3.7
−30023.4 ± 0.294.9 ± 4.2
−35011.8 ± 0.184.1 ± 4.3
−40012.2 ± 0.158.4 ± 4.2
−4508.1 ± 0.153.3 ± 4.5
−5006.7 ± 0.157.4 ± 1.0
Table 2. The resistance and capacitance parameters for the process of OER, conducted on polycrystalline Ni electrode surface in 0.1 M NaOH solution, in the absence and presence of acetone at the specified concentrations, attained by fitting the equivalent circuit (Figure 5b) to the recorded impedance data (values of dimensionless φ parameter for the CPE circuit oscillated between 0.84 and 0.95; χ2 = 2 × 10⁻⁵–2 × 10⁻³).
0.1 M NaOH
E/mVRct/Ω cm2Cdl/μF cm−2
155074.1 ± 0.62406.8 ± 23.3
160021.5 ± 0.12217.8 ± 26.2
165011.2 ± 0.02182.0 ± 26.7
17007.4 ± 0.02220.5 ± 29.7
17505.5 ± 0.02274.6 ± 34.3
18004.3 ± 0.02178.1 ± 67.4
18503.6 ± 0.02215.5 ± 59.0
19003.1 ± 0.02423.7 ± 20.2
19502.6 ± 0.02167.4 ± 70.2
20002.4 ± 0.02412.6 ± 129.2
0.1 M NaOH + 1.0×10⁻⁷ M acetone
155028.5 ± 0.33959.7 ± 59.4
160012.7 ± 0.13774.8 ± 39.6
16508.4 ± 0.03909.2 ± 67.4
17005.3 ± 0.04143.2 ± 76.5
17504.3 ± 0.04334.3 ± 82.3
18003.4 ± 0.04345.0 ± 169.3
18503.0 ± 0.04353.7 ± 216.6
19002.5 ± 0.04316.0 ± 125.6
19502.5 ± 0.04039.5 ± 182.5
20002.3 ± 0.04795.0 ± 242.6
0.1 M NaOH + 1.0 × 10⁻⁵ M acetone
155019.6 ± 0.17897.5 ± 37.2
160010.0 ± 0.17855.6 ± 77.3
16506.8 ± 0.07918.5 ± 115.7
17004.8 ± 0.07442.3 ± 109.0
17503.9 ± 0.07932.6 ± 209.6
18003.3 ± 0.08871.9 ± 188.8
18502.8 ± 0.08536.7 ± 266.0
19002.4 ± 0.09459.6 ± 213.2
19502.1 ± 0.19268.2 ± 840.0
20001.8 ± 0.16252.8 ± 640.5
0.1 M NaOH + 1.0 × 10⁻³ M acetone
155024.9 ± 0.16070.5 ± 31.3
160011.2 ± 0.05906.9 ± 53.5
16507.0 ± 0.06116.9 ± 94.7
17005.3 ± 0.15783.4 ± 250.5
17504.5 ± 0.16303.2 ± 202.7
18003.7 ± 0.06324.7 ± 208.0
18502.7 ± 0.14525.9 ± 552.1
19002.6 ± 0.14982.4 ± 125.2
19502.2 ± 0.14573.2 ± 356.6
20002.2 ± 0.17389.7 ± 1254.1
Disclaimer/Publisher’s Note: The statements, opinions and data contained in all publications are solely those of the individual author(s) and contributor(s) and not of MDPI and/or the editor(s). MDPI and/or the editor(s) disclaim responsibility for any injury to people or property resulting from any ideas, methods, instructions or products referred to in the content.

