Article

Astronomical Orbital Cycle-Driven Coevolution of Paleoclimate and Sea Level with Sedimentary Response: A Case Study from the Upper Member of the Miocene Zhujiang Formation in the Enping Depression, South China Sea

1
School of GeoSciences, Yangtze University, Wuhan 430100, China
2
Key Laboratory of Exploration Technologies for Oil and Gas Resources, Ministry of Education, Yangtze University, Wuhan 430100, China
3
South China Oil and Gas Exploration and Development Corporation, Haikou 570100, China
*
Author to whom correspondence should be addressed.
Appl. Sci. 2025, 15(11), 5922; https://doi.org/10.3390/app15115922 (registering DOI)
Submission received: 26 March 2025 / Revised: 11 May 2025 / Accepted: 22 May 2025 / Published: 24 May 2025
(This article belongs to the Section Marine Science and Engineering)

Abstract

:
This study focuses on the upper section of the Zhujiang Formation in the Enping Sag of the Zhujiangkou Basin in the South China Sea, investigating the mechanisms by which astronomical orbital cycles drive paleoclimate, sea-level fluctuations, and sedimentary development. In this study, a cyclic stratigraphic analysis was performed using natural gamma-ray logging data and geochemical proxies (Chemical Index of Alteration (CIA); Al2O3 content) in combination with depositional noise modeling (DYNOT Dynamic Orbital Tuning Model and ρ1 noise factor). High-resolution time series analysis revealed three key findings: (1) a 15.98–19.09 Ma astronomical timescale was established through the identification of Milankovitch cycles including 405 kyr eccentricity, 100 kyr eccentricity, 40 kyr obliquity, and 20 kyr precession; (2) sea-level changes exhibited 405 kyr eccentricity-driven cyclicity, with high-eccentricity phases corresponding to warm-humid climates and transgressive mudstone deposition, and low-eccentricity phases reflecting arid conditions and regressive sandstone development; and (3) orbital-scale precession modulation regulated sediment source-to-sink processes through climate–sea level coupling. This work provides a quantitative framework for predicting astronomical cycle-controlled reservoirs, offering critical insights for deepwater hydrocarbon exploration in the Zhujiangkou Basin.

1. Introduction

The evolution of cyclostratigraphy commenced with Milankovitch’s theory of climate driven by Earth’s orbital cycles at the beginning of the 20th century. This theory elucidated that cyclical variations in eccentricity, the angle of intersection of the yellow and red angles, and age differences govern the cyclotaxy of the ice ages [1,2]. This theory was empirically confirmed in 1982 by the Imbrie team through the study of oxygen isotopes in deep-sea sediments, demonstrating the pivotal role of orbital parameters in controlling ice sheet advances and retreats as well as sea-level fluctuations [3]. In the 1990s, Berger reconstructed the evolution of the Earth–Moon orbital dynamics over 500 million years using fossil corals, elucidating the dynamical linkages between obliquity and the Earth–Sun distance and providing a novel method for geological dating [4]. At the beginning of the 21st century, the Laskar team developed a high-precision solar system orbital model, confirming the super-stability of the 405 kyr eccentricity cycle and reducing the error in the Mesozoic orbital calculations to within 0.2%, thus establishing the ‘astronomical ruler’ for geological time calibration [5,6]. In 2013, the Hinnov team innovatively coupled sedimentary cyclicity analysis with astronomical cycles, developing sub-orbital precision astronomical tuning techniques that expanded the discipline’s applications from stratigraphic dating to paleoclimate reconstruction and comparative planetary climatology [7].
The Zhujiangkou Basin is situated in the Cenozoic basin on the continental margin in the northern part of the South China Sea. It is abundant in oil and gas resources, primarily concentrated in the upper section of the Early Eocene Zhujiang Formation, which exhibits significant exploration potential [8,9]. As oil and gas exploration and development in this basin have progressed, the demand for precise chronostratigraphic division has increased. In recent years, cyclostratigraphy has demonstrated extensive application value and scientific significance in the study of the Zhujiangkou Basin. Through spectral analysis and wavelet transformation of natural gamma-ray logging data, researchers have identified Milankovitch cycle signals and established high-resolution astronomical timescales, significantly improving the precision of stratigraphic division and correlation. For example, Liu Yang et al. calibrated the sedimentation duration of the Hanjiang Formation–Wanshan Formation to the 0.1 Ma level using short eccentricity cycles, revealing the correlation between sedimentation rates and sea-level changes [10]. Zhu Chunxia et al. combined biostratigraphic frameworks to construct an absolute astronomical timescale for the Hanjiang Formation in the Lufeng Sag, providing an independent constraint for estimating the duration of carbon isotope events [11]. Additionally, astronomical cycles have been used to analyze the evolution of sedimentary environments. Wang Hua et al. revealed the spatiotemporal evolution patterns of deltaic sedimentary microfacies by examining the response relationship between the sandstone volume fraction and sea-level changes, confirming the control of astronomical drivers on sedimentary processes [12]. These studies have not only deepened the understanding of the chronostratigraphy and paleoclimate evolution of the South China Sea during the Cenozoic but also provided theoretical support for reservoir prediction in oil and gas exploration. Most existing studies focus on the independent effects of individual orbital parameters, leaving a theoretical gap in understanding the coupling mechanisms of multiple cycles and their cascading effects. Quantifying the synergistic control mechanisms of astronomical orbital cycles on the ‘climate-source-sedimentation’ system remains a challenge. In this context, the sedimentary system development model established in this paper, which is based on sea-level fluctuations under a specific astronomical cycle, provides an in-depth discussion of the control mechanisms exerted by different climatic phases on the development of sedimentary features and sand bodies. Furthermore, it offers new perspectives and methods for understanding the coupling relationships among astronomical orbital forces, climate, sea level, and sedimentary systems.
The upper section of the Zhujiang Formation in the Enping Sag offers unique research advantages, characterized by continuous sedimentary sequences that preserve abundant intercalations of terrigenous clastic and marine sediments. This provides an ideal material basis for identifying high-frequency astronomical cycles, such as Milankovitch orbital periods [13]. In this study, the theory of cyclostratigraphy was applied to investigate this area in depth. A high-precision ‘absolute’ astronomical timescale was established by selecting natural gamma-ray data sequences (GR) as proxies for paleoclimate indicators and performing time series analysis and astronomical tuning. Based on this, the DYNOT (Dynamic Noise after Orbit Tuning) sedimentary noise model was applied to reconstruct the sea-level change curve during this period and elucidate the relationship between sea-level change and astronomical orbit. Additionally, the paleoclimate characteristics of the depositional period were analyzed in detail by integrating data on lithological changes, sand–silt ratios, and major geochemical elements, evaluating the impact of astronomical orbital cycles on paleoclimate. Ultimately, the coevolution of paleoclimate and sea-level change driven by astronomical orbital cycles and their depositional responses is revealed. This study contributes to understanding how astronomical factors drive climate and sea-level changes, thereby influencing sedimentary processes and the development and distribution patterns of sand bodies, providing new ideas and examples for oil and gas exploration in the Pearl River Formation of the Epping Depression.

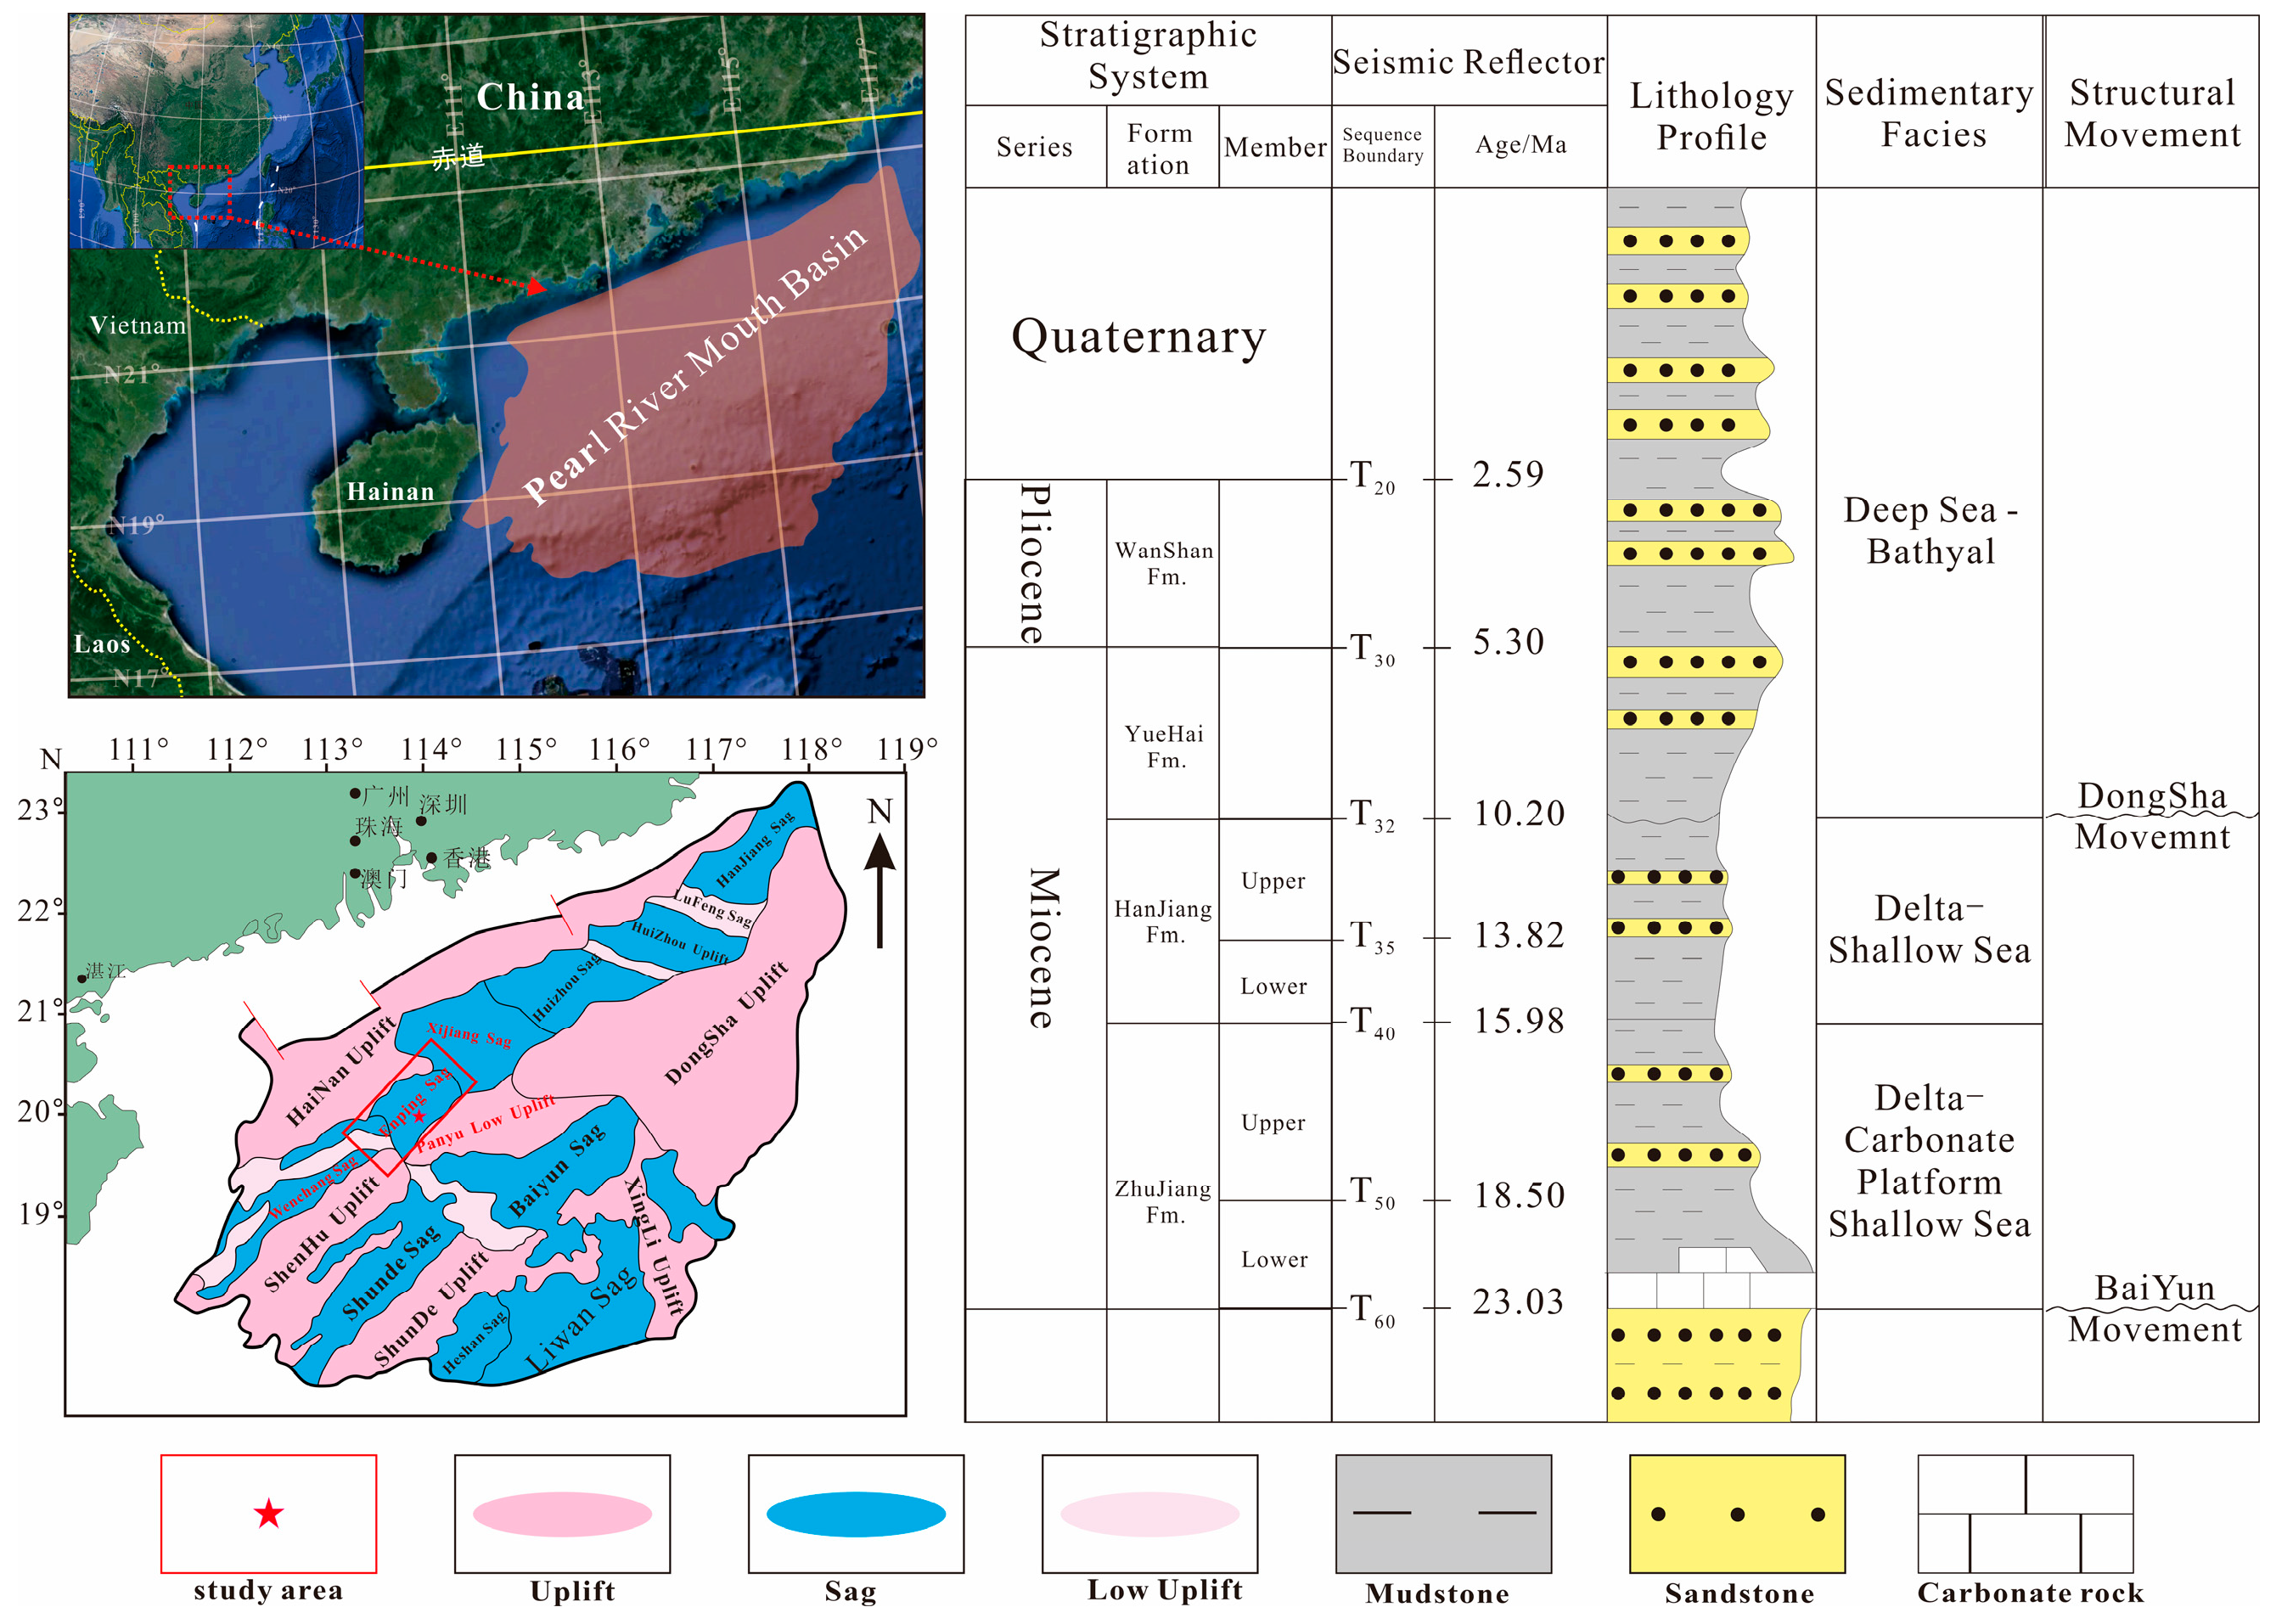
2. Regional Geological Setting

The Pearl River Mouth Basin is located on the northern continental margin of the South China Sea, extending subparallel to the shelf–slope system along the coastline of mainland South China (refer to Figure 1). As a submerged extension of the South China continent, this basin spans approximately 17.7 × 10⁴ km2 and has been shaped by compressional collision between the Indian and Eurasian plates, combined with subduction-related compression from the Pacific Plate, resulting in a distinctive tectonic stress regime and a complex evolutionary history [14,15]. Structurally, the basin comprises five first-order tectonic units stretching from north to south: the Northern Uplift Belt, Northern Depression Belt, Central Uplift Belt, Southern Uplift Belt, and Southern Depression Belt [16].
The Enping Depression, located at the western terminus of the Pearl River Mouth Basin, covers an area of approximately 5000 km2 with a NE-SW trending geometry. It is bounded by the Northern Fault Terrace Belt to the north, adjacent to the Xijiang Depression to the east, flanked by the Panyu Low Uplift to the south, and connected to the Yangjiang Depression and Yangjiang Low Uplift to the west (Figure 1). This region represents a critical depocenter for the paleo-Pearl River Delta’s marine progradation. Its structural architecture is governed by NE-NEE- and NWW-trending fault systems, forming a characteristic fault-controlled basin with a ‘northern faulting and southern onlap’ configuration [17]. The tectonic evolution of the Enping Depression can be categorized into three distinct phases: Early Eocene syn-rift phase, dominated by extensional faulting with intense NE-striking fault activity, leading to the formation of initial rift basins; Late Eocene detachment-dominated phase, marked by waning fault slip and transition to crustal detachment, triggering southward migration of depocenters; and Oligocene post-rift sag phase, characterized by tectonic quiescence and regional subsidence, accommodating deltaic-shallow marine sedimentation under transgressive conditions [18,19].
The target interval of this study is situated within the Upper Member of the Zhujiang Formation (Lower Miocene), exhibiting a stratigraphic thickness ranging from 600 to 1200 m. This succession developed in a transitional marine–terrestrial setting during the South China Sea spreading phase, dominated by shallow-water deltaic to neritic depositional systems [13,20]. The provenance system is jointly controlled by the Northern Uplift Belt and the paleo-Pearl River Delta, with primary detrital components derived from Yanshanian granitic rocks and metamorphic suites of the South China Fold Belt. Sedimentary architectures include subaqueous distributary channel sands, mouth bars, and wave-reworked coastal sand ridges [12,21], characterized by thin-bedded sandstone–mudstone alternations that provide optimal lithological cyclicity for high-frequency astronomical cycle identification.

3. Materials and Methods

3.1. Paleoclimate Proxies

Cyclostratigraphic investigations impose rigorous requirements on stratigraphic sections: sedimentary successions must exhibit continuity and integrity while avoiding fault-prone zones to minimize noise interference from stratigraphic hiatuses or tectonic disruptions [22]. When selecting paleoclimate proxies, two critical criteria govern the decision-making process: (1) sensitivity to climatic oscillations and fidelity in recording cyclic signals, and (2) sampling resolution sufficient to resolve target orbital periodicities [23]. Comparative analysis of multiple high-resolution proxies demonstrates that natural gamma-ray (GR) logging data exhibit superior signal-to-noise ratios and exceptional stability. The GR technique quantifies the gamma radiation intensity from sedimentary deposits, effectively discriminating lithological variations and decoding paleoenvironmental shifts. This method has become the preferred proxy for Milankovitch cycle extraction, widely employed in time-series analysis due to its robust stratigraphic continuity and orbital-scale resolution [24,25].
The Enping Depression primarily receives sediments from the paleo-Pearl River drainage system and adjacent tectonic uplifts, with a sustained supply of terrigenous clastic materials dominating the depositional regime. Given the relatively stable provenance, the variations in grain size and compositional maturity of sedimentary deposits predominantly reflect paleoclimatic fluctuations, thereby providing high-fidelity geological archives for reconstructing regional climate evolution. This study selects natural gamma-ray (GR) logging data from Well EP17 in the Enping Depression as the primary dataset. Strategically located in the central basin area, distal from the fault zones, Well EP17 penetrates continuous delta-front successions characterized by mudstone–siltstone lithologies, representing a stable depositional environment ideal for cyclostratigraphic analysis. The 0.125 m sampling interval satisfies the Nyquist sampling theorem, ensuring adequate resolution for detecting Milankovitch-band signals [26].

3.2. Geochemical Information

To comprehensively understand the sedimentary geochemical characteristics of the upper vertical section of the Pearl River Formation, the author collected 16 core samples from the bottom to the top of the profile. All samples were first crushed to 200 mesh, followed by treatment in a high-temperature furnace at a constant temperature of 650 °C for 2 h to eliminate organic matter and interlayer water from the clay minerals in the sediment. Subsequently, trace elements were analyzed using inductively coupled plasma spectroscopy (IRIS ADVANTAGE ICP-AES) and inductively coupled plasma mass spectrometry (VGX7 ICP-MS). The inductively coupled plasma spectrometer (IRIS ADVANTAGE ICP-AES) was employed for major elements, while the VGX7 ICP-MS was utilized for trace elements. Calibration of the samples was conducted using international standard samples (GSR5, GSR6, GSR9) and blank samples, with the sample accuracy monitored through these standards. The precision and accuracy of the analyses were ensured by the use of international standards and blank samples. Sample processing and testing were carried out at the State Key Laboratory of Marine Geology, Tongji University.

3.3. Cyclostratigraphic Analysis

Astronomical cycle analysis was performed using Acycle 2.8 software [27]. The analysis commenced with the preprocessing of paleoclimate proxy data: the Outlier Removal module eliminated anomalous values, the Interpolation module applied linear resampling to equidistant intervals of 0.125 m, and the De-trending module removed long-term trends using LOWESS (locally weighted scatterplot smoothing) to isolate orbital-scale signals. Subsequently, the COCO (correlation coefficient) method quantified spectral coherence between the depth-domain gamma-ray (GR) series and La2004 astronomical solutions. This process involved iteratively optimizing sedimentation accumulation rates (SARs) across a range of 5–20 cm/kyr until maximum correlation was achieved, thereby establishing the astronomically tuned age model [28].
Under the optimal sedimentation accumulation rate (SAR) constraint, spectral analysis was conducted using the Multi-Taper Method (MTM) to identify Milankovitch cycles, including eccentricity, obliquity, and precession. Evolutionary power spectra and wavelet transforms were employed to visualize temporal variations in the cyclic signals. Gaussian bandpass filters were utilized to extract dominant orbital periods: 405 kyr long eccentricity, 100 kyr short eccentricity, 40 kyr obliquity, and 20 kyr precession. These periods were cross-validated against theoretical La2004 orbital solutions to confirm their astronomical origins. By leveraging the 405 kyr eccentricity cycles as a chronostratigraphic backbone, a ‘floating’ astronomical timescale was constructed through time–depth conversion, which was then anchored to absolute radiometric ages (e.g., biostratigraphic datums) to establish a high-resolution calibrated astronomical timescale with an uncertainty of ±20 kyr [29].

3.4. Reconstruction of Relative Sea-Level Change

Marine stratigraphic architecture is fundamentally governed by tectonic subsidence, relative sea-level fluctuations, and sediment supply flux, where tectonic subsidence and sea-level changes jointly regulate accommodation space while sediment influx dictates depositional volume [30]. The Upper Zhujiang Member in the Pearl River Mouth Basin developed atop inherited lacustrine rift basins, maintaining pre-existing basin geometry with relative sea-level oscillations and sediment flux emerging as dominant controls on depositional system evolution [31]. The DYNOT model quantifies non-orbital noise in climate and sea-level proxies, calculates the ratio of the non-orbital signal variance to the total signal variance, extracts astronomical orbital cycle-related signals from sedimentary records, and reveals long-term sea-level fluctuation patterns. Simultaneously, it dynamically tunes cyclic components in sedimentary records to clarify the relationship between climatic cycles and sea-level changes. The ρ1 model, based on the lag-1 autocorrelation coefficient of time series, characterizes the noise properties in climate change and uses noise variance as an indicator of relative sea-level variations when noise and other influencing factors are minimal [32]. A total of 5000 Monte Carlo simulations were applied to reconstruct sea-level change curves, uncovering potential long-term, million-year-scale astronomical orbital cycles within sedimentary noise (and sea-level fluctuations). By employing the Dynamic Noise after Orbital Tuning (DYNOT) model coupled with Lag-1 autocorrelation coefficient (ρ1) analysis, this study reconstructs relative sea-level variations, enabling the systematic investigation of sequence stratigraphic patterns, internal depositional architectures, and their linkages to paleoclimate dynamics.

4. Results

4.1. Time Series Analysis

The natural gamma-ray (GR) series from Well EP17 underwent LOESS smoothing to eliminate a long-term trend spanning 251.906 m (Figure 2c). Subsequent spectral analysis using the 2π Multi-Taper Method (MTM) revealed significant cyclicities at depths of 94.3 m, 27.4 m, 10.4 m, and 4.6 m (Figure 2a), with amplitude peaks surpassing the 95% confidence level. The thickness ratios of these cycles (20.5:5.9:2.2:1) closely correspond to the theoretical orbital period ratios (405 kyr:126 kyr:40 kyr:20 kyr) derived from the astronomical solution by Laskar et al. (2010d) [33] for the 15–20 Ma interval (theoretical ratio: 20.15:6.3:2.1:1). These cycles are interpreted as follows: 405 kyr long eccentricity (94.3 m), 100 kyr short eccentricity (27.4 m), 40 kyr obliquity (10.4 m), and 20 kyr precession (4.6 m). The Evolutionary Fast Fourier Transform (eFFT) analysis further confirmed the high stability of the 94.3 m cycle thickness (Figure 2b), providing robust evidence for the preservation of Milankovitch signals within the GR series.
The COCO analysis identified an optimal sedimentation rate of 23.4 cm/kyr for Well EP17 (Figure 3a). The corresponding cyclic thicknesses and periods are as follows: 94.3 m (402 kyr), 27.4 m (118 kyr), 10.4 m (44 kyr), and 4.6 m (19.6 kyr). These measurements align closely with theoretical astronomical cycles, thereby confirming the reliability of the astronomical signals identified in the Zhujiang Formation of Well EP17.
Based on the interpretation of astronomical cycles and the tracking of sedimentation rates, the detrended gamma-ray (GR) data were astronomically tuned using the Laskar 2010d scheme [6]. The results indicate that the duration of the upper section of the Zhujiang Formation in Well EP17 is 3.11 million years (Myr). The Multi-Taper Method (MTM) spectrum of the calibrated GR sequence reveals significant peaks at 405 kyr, 100 kyr, 40 kyr, and 20 kyr, which correspond to the theoretical eccentricity timescale (ETP) astronomical solution proposed by Laskar (2010d) [33] (Figure 4a,b). Gaussian bandpass filtering was employed to extract 18 cycles of the 405 kyr long eccentricity and 72 cycles of the 100 kyr short eccentricity (Figure 4c).

4.2. Astronomical Chronology Analysis

According to the biostratigraphy and stratigraphy of the well, the results of zircon 206Pb/238U dating in the area, and the Geologic Time Scale 2020 [34,35], the absolute age of the top interface of Well EP17 is about 15.98 Ma for the Early-Middle Miocene top interface, which is used as an anchor point in this paper to establish an absolute timescale (ATS) for the upper section of the Pearl River Formation in Well EP17 (Figure 5). The sedimentary record from the upper section of the Zhujiang Formation in Well EP17 preserves seven stable 405 kyr eccentricity cycles. These cycles were compared with the 405 kyr filtered curve of the La2010d theoretical astronomical orbital periods spanning from 15 to 20 Ma. The results indicate a strong consistency between the 405 kyr eccentricity cycle curve of Well EP17 and the theoretical astronomical orbital cycle curve (Figure 5c,d), thereby further validating the accuracy and reliability of the time series analysis.

4.3. Sedimentary Noise Modeling and Astronomical Forcing

The sedimentary noise modeling of the 405 kyr tuned GR time series was conducted using the DYNOT and ρ1 models (Figure 6c,d). The results of the analysis reveal that the DYNOT and ρ1 curves exhibit similarities, displaying seven intervals indicative of increased sedimentary noise, which may correspond to relative sea-level falls (as indicated by the red sub-bars in the figure). A comparison of the 405 kyr filtered curve with variations in sea-level rise and fall (Figure 6b,c) demonstrates that these sea-level changes are predominantly controlled by the 405 kyr long eccentricity cycle. This pattern suggests that the sea-level fluctuations during the depositional period of the upper section of the Zhujiang Formation were primarily influenced by astronomical orbital forcing.

4.4. Paleoclimate Indicators

The content, combination, and ratios of elements in sedimentary strata are closely related to the surrounding physicochemical conditions and can indicate changes in paleoclimate [36]. The distribution of the Chemical Index of Alteration (CIA) values is significantly correlated with climatic conditions [37]. The CIA value is proportional to the degree of chemical weathering. Studies have shown that when the CIA value ranges from 50 to 65, it indicates moderate chemical weathering, typically corresponding to semi-arid or seasonally arid climatic conditions. When the CIA value increases to the range of 65–85, it reflects significantly enhanced chemical weathering, representing warm and humid climatic characteristics [38,39]. Within the study area, the CIA values range from 60 to 85, indicating a moderate degree of weathering and suggesting that the Enping Depression during the depositional period of the Zhujiang Formation was in a warm and humid sedimentary environment (Figure 7d).
The differences in the input of terrigenous clastic materials during different periods are usually caused by climatic changes. Therefore, the intensity of terrigenous clastic input can also reflect the climate to some extent. Elements such as Ti and Al are commonly used to trace the source of sediments [40]. In this study, TiO2 and Al2O3 were selected as geochemical tracers for the flux of terrigenous clastic materials. In Well EP17, the TiO2 content ranges from 0.2% to 1.4% (mean 0.677), and the Al2O3 content ranges from 5% to 25% (mean 12.038) (Figure 7e,f). Comparative analysis of the CIA curve and the TiO2 and Al2O3 content curves shows consistency in their vertical variations. This result indicates that when the intensity of chemical weathering increases (higher CIA values), the input of terrigenous clastic materials also increases (Figure 7d–f). This phenomenon reflects a shift in climatic conditions towards a warmer and more humid environment. Conversely, when the CIA value decreases, the intensity of weathering weakens, and the input of terrigenous clastic materials decreases, indicating a shift towards a relatively dry and hot climate.

5. Discussion

5.1. Paleoclimate Change Under Astronomical Forcing

Astronomical orbital cycles (eccentricity, obliquity, and precession of Earth’s orbit) significantly influence the global climate system by modulating the distribution of solar radiation [41]. These climatic changes further control surface weathering, erosion intensity, sediment transport capacity, and so on [42,43]. In this study, it was found that the 405 kyr long eccentricity cycle in the study area has a pronounced modulation effect on the 20 kyr short eccentricity cycle, characterized by similar amplitude variations between the long eccentricity and precession cycles. To explore the impact of astronomical orbital cycles on sedimentary environmental changes, the astronomical orbital cycle curves were compared with major elements representing environmental changes. The results show that the long eccentricity significantly regulates the monsoon intensity driven by precession, thereby affecting the sedimentary process. This reveals that the long eccentricity cycle controls sand body development through the ‘climate-weathering-sediment source’ cascade effect.
When the 405 kyr long eccentricity is at a high value (Figure 7, 2237–2274 m), the climate is generally more humid (CIA values range from 65 to 80). With the increased precession amplitude, seasonal rainfall intensifies, chemical weathering dominates, clay minerals become enriched, and combined with rising sea levels and weakened hydrodynamics, muddy sediments prevail. Sand body development is limited, characterized by thin layers (sand body thickness of 2 m) and fine grains.
When the 405 kyr long eccentricity is at a low value (Figure 7, 2163 m–2237 m), the climate is dry and hot (CIA values range from 55 to 65), the precession amplitude decreases, seasonal rainfall weakens, physical erosion is enhanced, and in combination with a high-energy shallow-water sedimentary environment, coarse clastic supply surges. Sand body development is favorable, with thick sand bodies (maximum thickness reaching 16 m) and wide distribution. The vertical stacking and lateral connectivity are significant, forming high-quality reservoirs in the study area.

5.2. Sea-Level Fluctuations Under Astronomical Forcing

Global sea-level changes are typically closely related to climate changes, and orbital forcing has been demonstrated to modulate Earth’s climate system [44,45]. Based on the DYNOT and ρ1 sedimentary noise models, the relative sea-level changes during the deposition of the upper section of the Zhujiang Formation were reconstructed. The analysis results show a significant consistency between the sea-level change trend and the 405 kyr long eccentricity cycle filter results, indicating that the sea-level fluctuations in the study area are controlled by astronomical orbital cycles. Sea-level changes regulate the accommodation space scale and the distribution range of sediment sources in the sedimentary area, thereby constraining the sediment supply and controlling the development and spatial configuration of the sedimentary system, as well as influencing the distribution characteristics of reservoir sand bodies [46].
Through analysis, it was found that the development of sand bodies is closely related to the low values of the long eccentricity cycle. Further comparison of the 405 kyr filter curve with the sea-level change curve and the position of sand body development shows that during the high-value period of the 405 kyr long eccentricity (e.g., Stage E1 in Figure 8), high solar radiation drives a warm and humid climate and sea-level rise, reducing the sediment source area and sharply decreasing the sediment supply, leading to the development of the maximum flooding surface sedimentary system. At this time, the delta retreats landward, forming a continuous mudstone layer up to 45 m thick with a clay content of >85%, and the sand bodies are mainly fine-grained and thin-layered. In contrast, during the low eccentricity period (e.g., Stage E4 in Figure 8), reduced solar radiation triggers a dry and hot climate and sea-level fall, reducing the sediment source area and restoring the sediment supply to the baseline level, which promotes delta progradation and the formation of 6–15 m thick massive sandstone units.

5.3. Sedimentary Patterns Driven by Astronomical Orbital Cycles

This study proposes two typical sedimentary patterns in the upper section of the Zhujiang Formation in the Enping Sag, the formation mechanisms of which are closely related to paleoclimate changes controlled by Milankovitch orbital parameters (Figure 9). Pattern I (Figure 9a) develops during the low phase of the 405 kyr long eccentricity cycle, when the decrease in Earth’s orbital eccentricity makes the orbit more circular, reducing the distance difference between perihelion and aphelion and thereby attenuating the precession amplitude. The orbital dynamic effects lead to a decrease in the annual mean solar radiation in mid-latitude regions, a reduction in seasonal temperature differences, and a weakening of monsoonal rainfall, creating an arid and hot paleoclimate background. Under these conditions, the source area is dominated by physical weathering, the supply of terrigenous clastics increases, and combined with the shelf exposure effect caused by sea-level fall, a progradational deltaic sedimentary system is formed. This system develops massive sandstone units with thicknesses of 8–15 m, and the sand–shale ratio significantly increases. Pattern II (Figure 9b) corresponds to the high phase of the 405 kyr long eccentricity cycle, when the increase in Earth’s orbital eccentricity makes the orbit more elliptical and enhances the precession amplitude, leading to an increase in the seasonal differences in solar radiation in low-latitude regions. The climate system response is characterized by warm and humid features, with an increase in the chemical weathering index (CIA), reflecting strong chemical weathering and an increase in the clay mineral content. Accompanying the retreat of the source area caused by rising sea levels, a retrogradational deltaic system is formed. This sedimentary unit is dominated by thick mudstone layers (single-layer thickness of 3–5 m) intercalated with thin layers of fine sandstone.

6. Conclusions

(1)
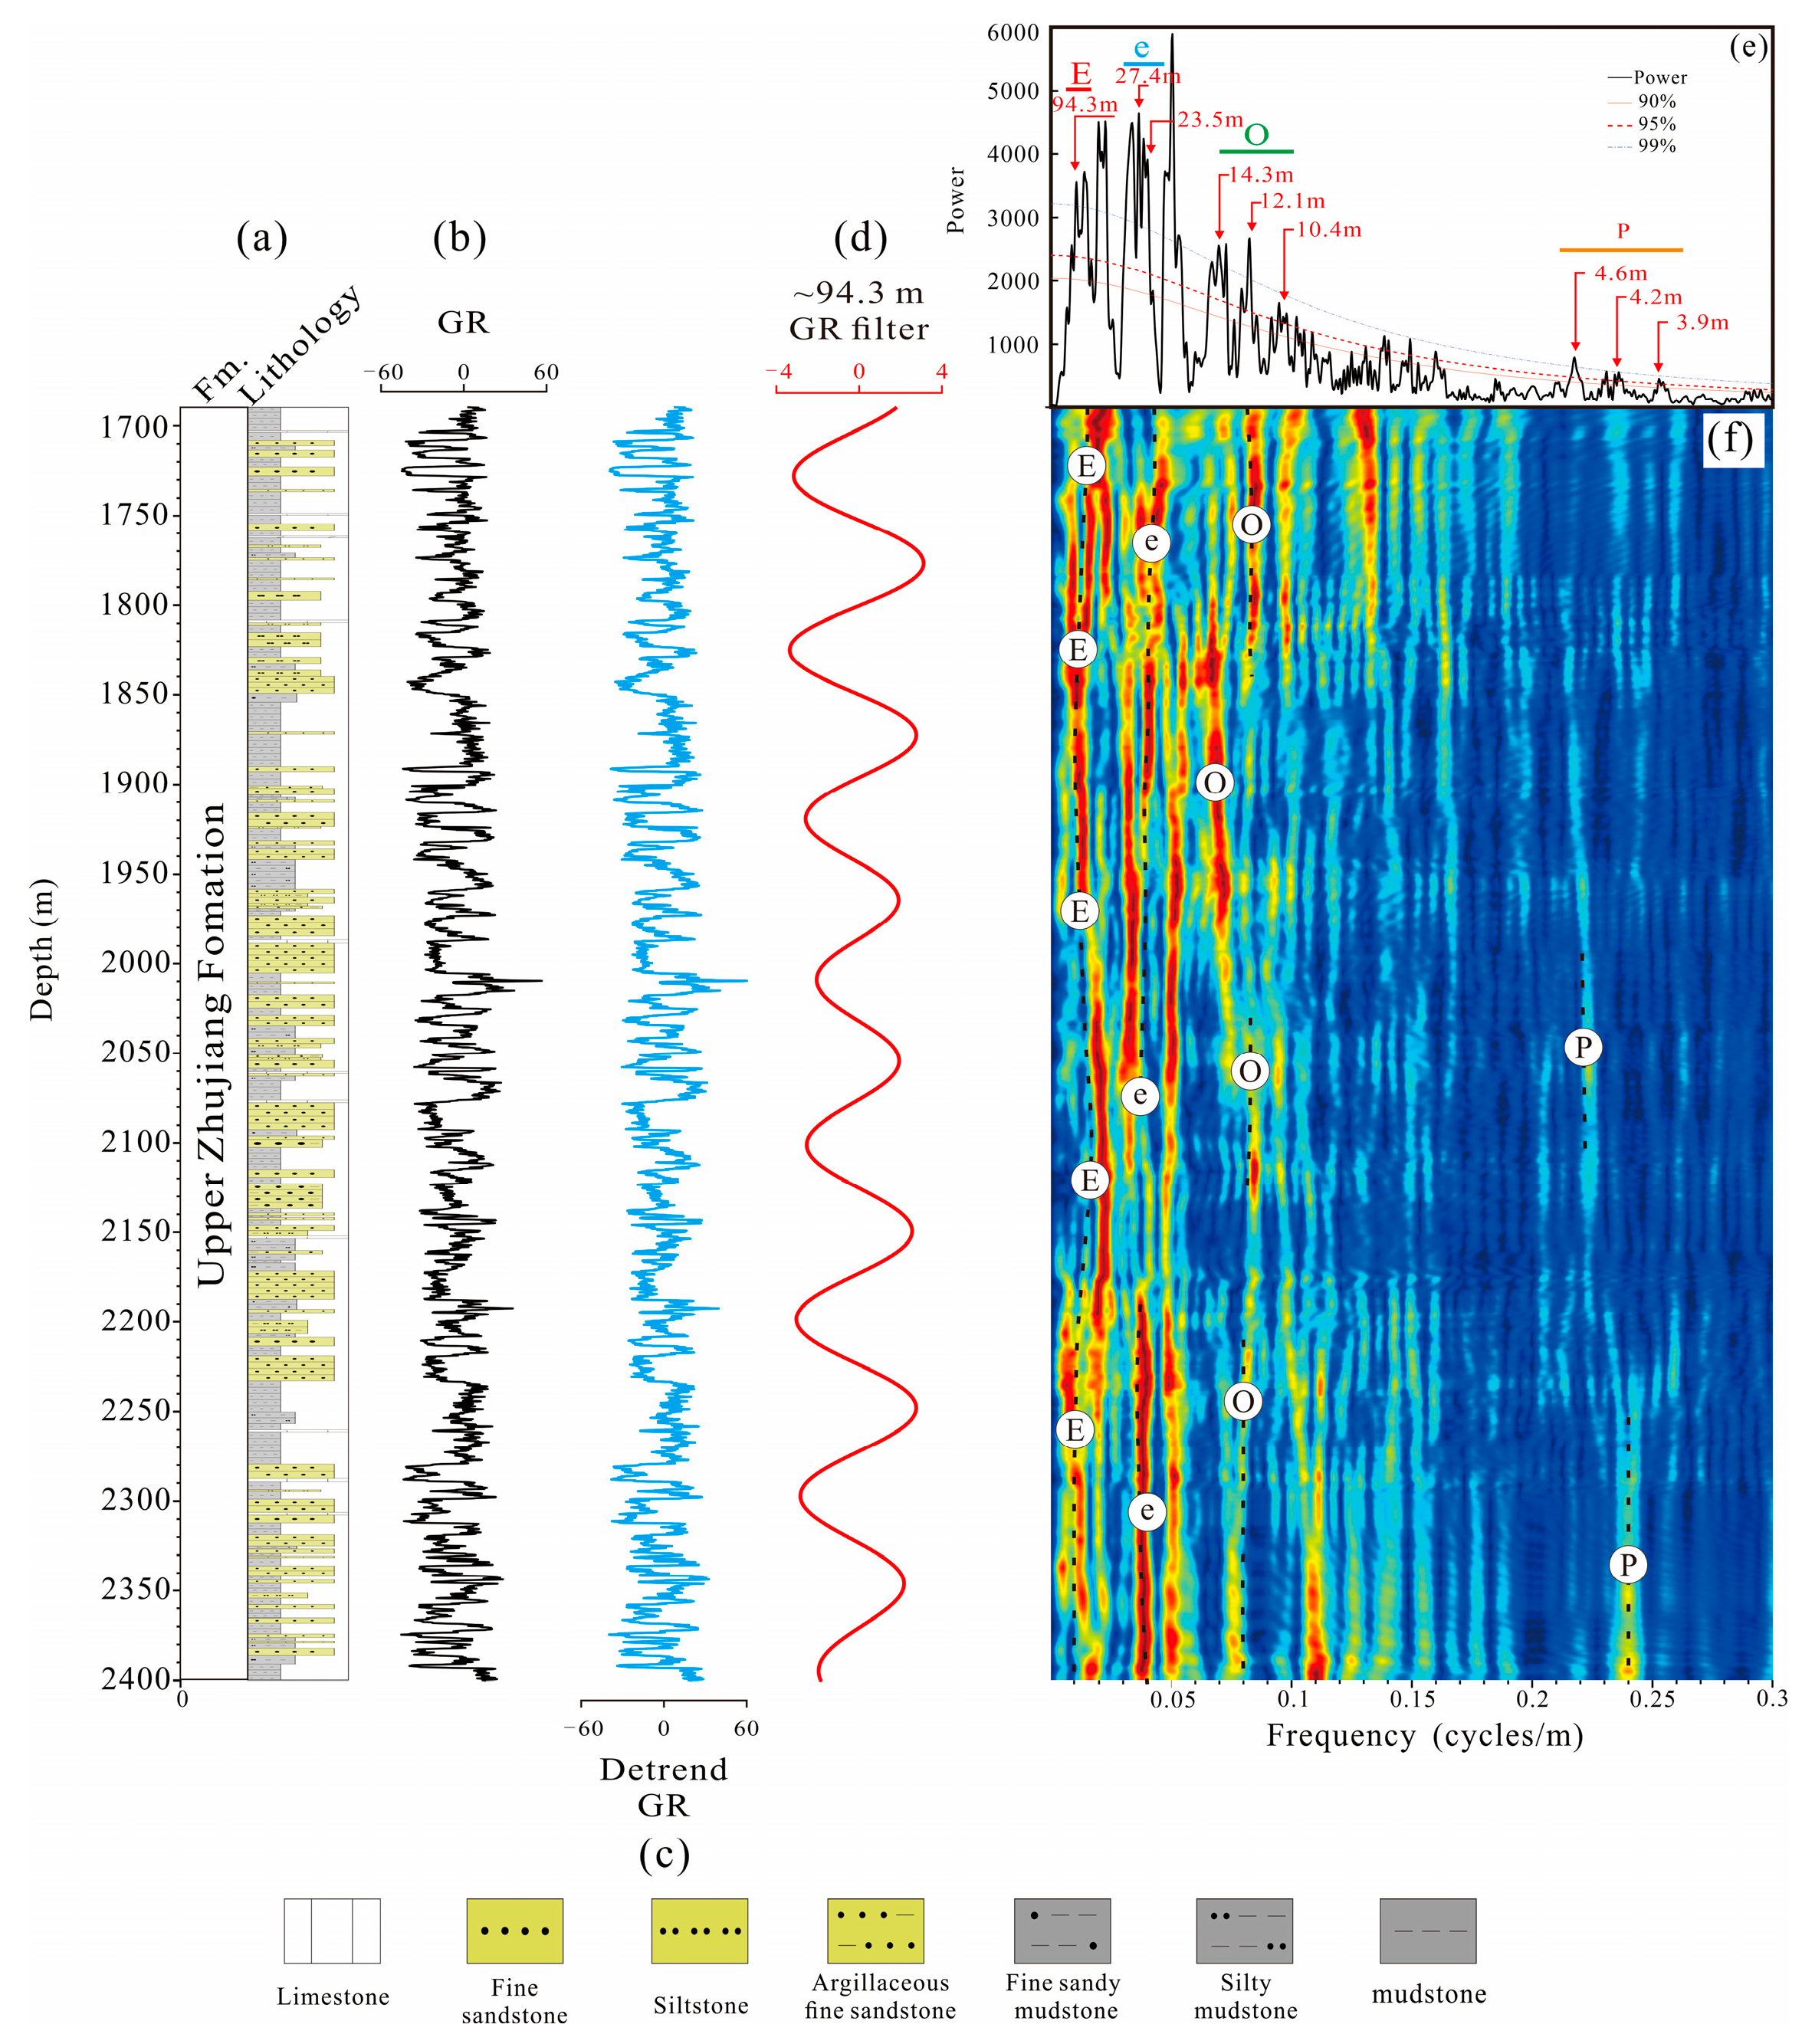
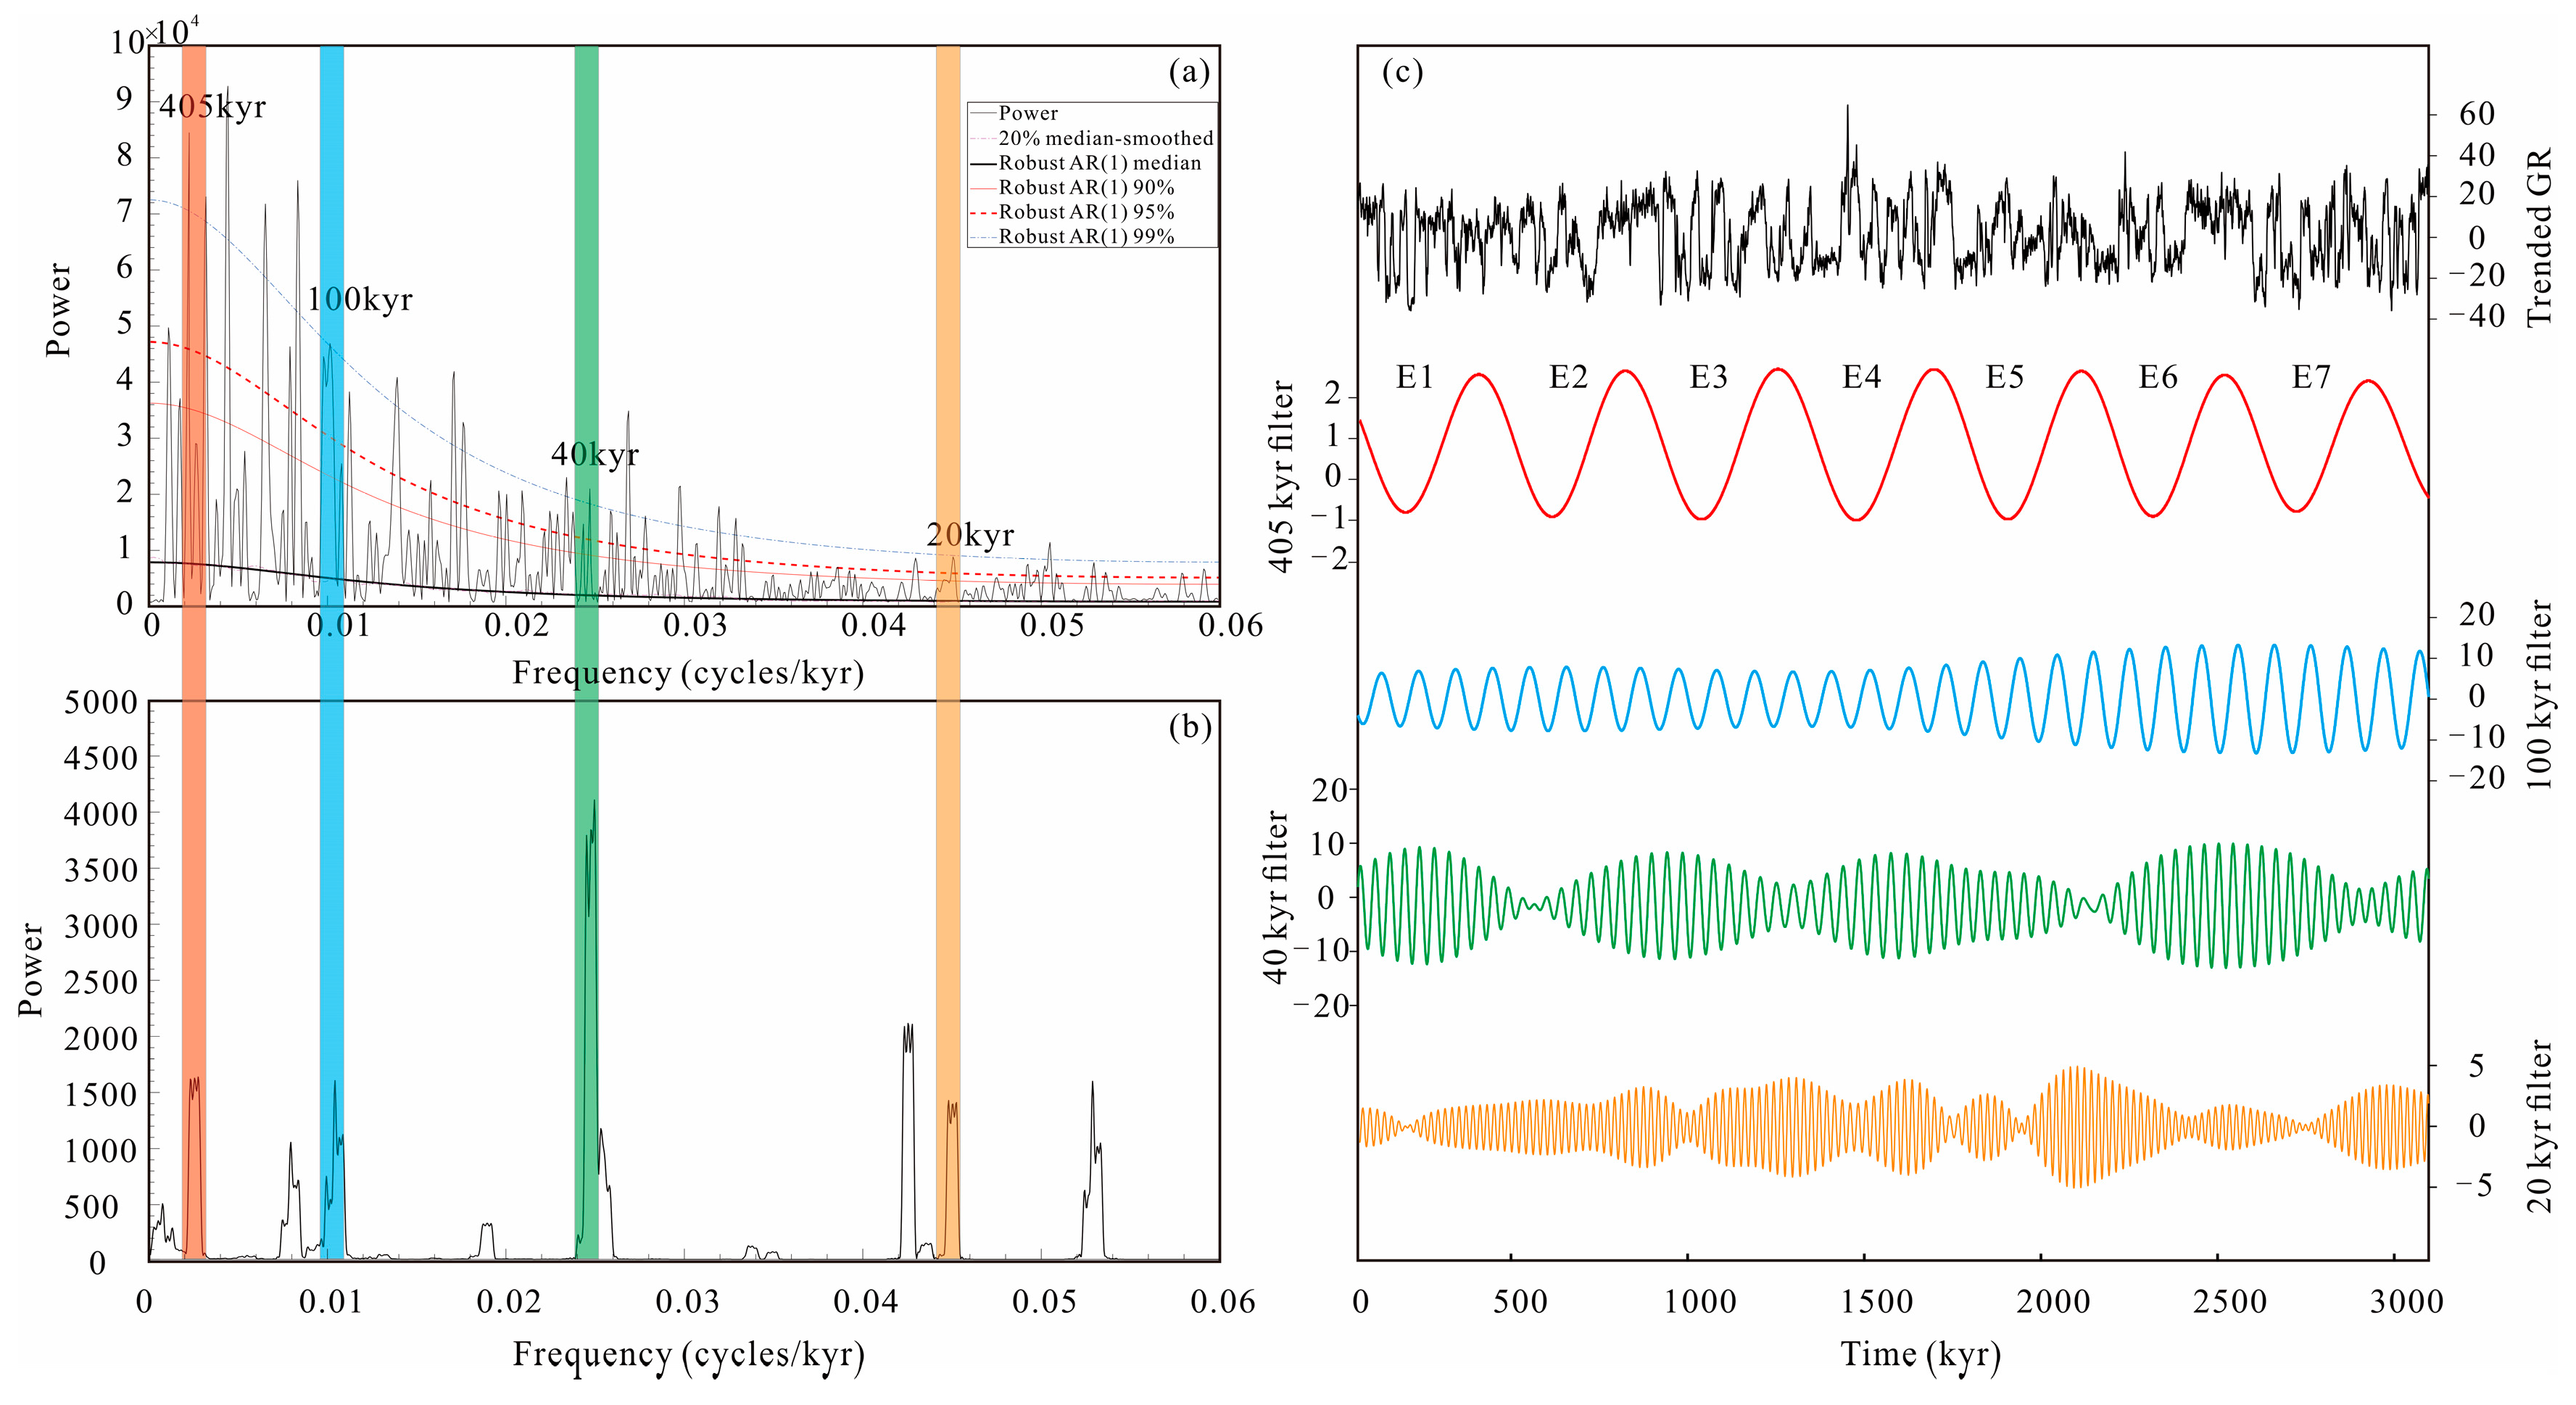
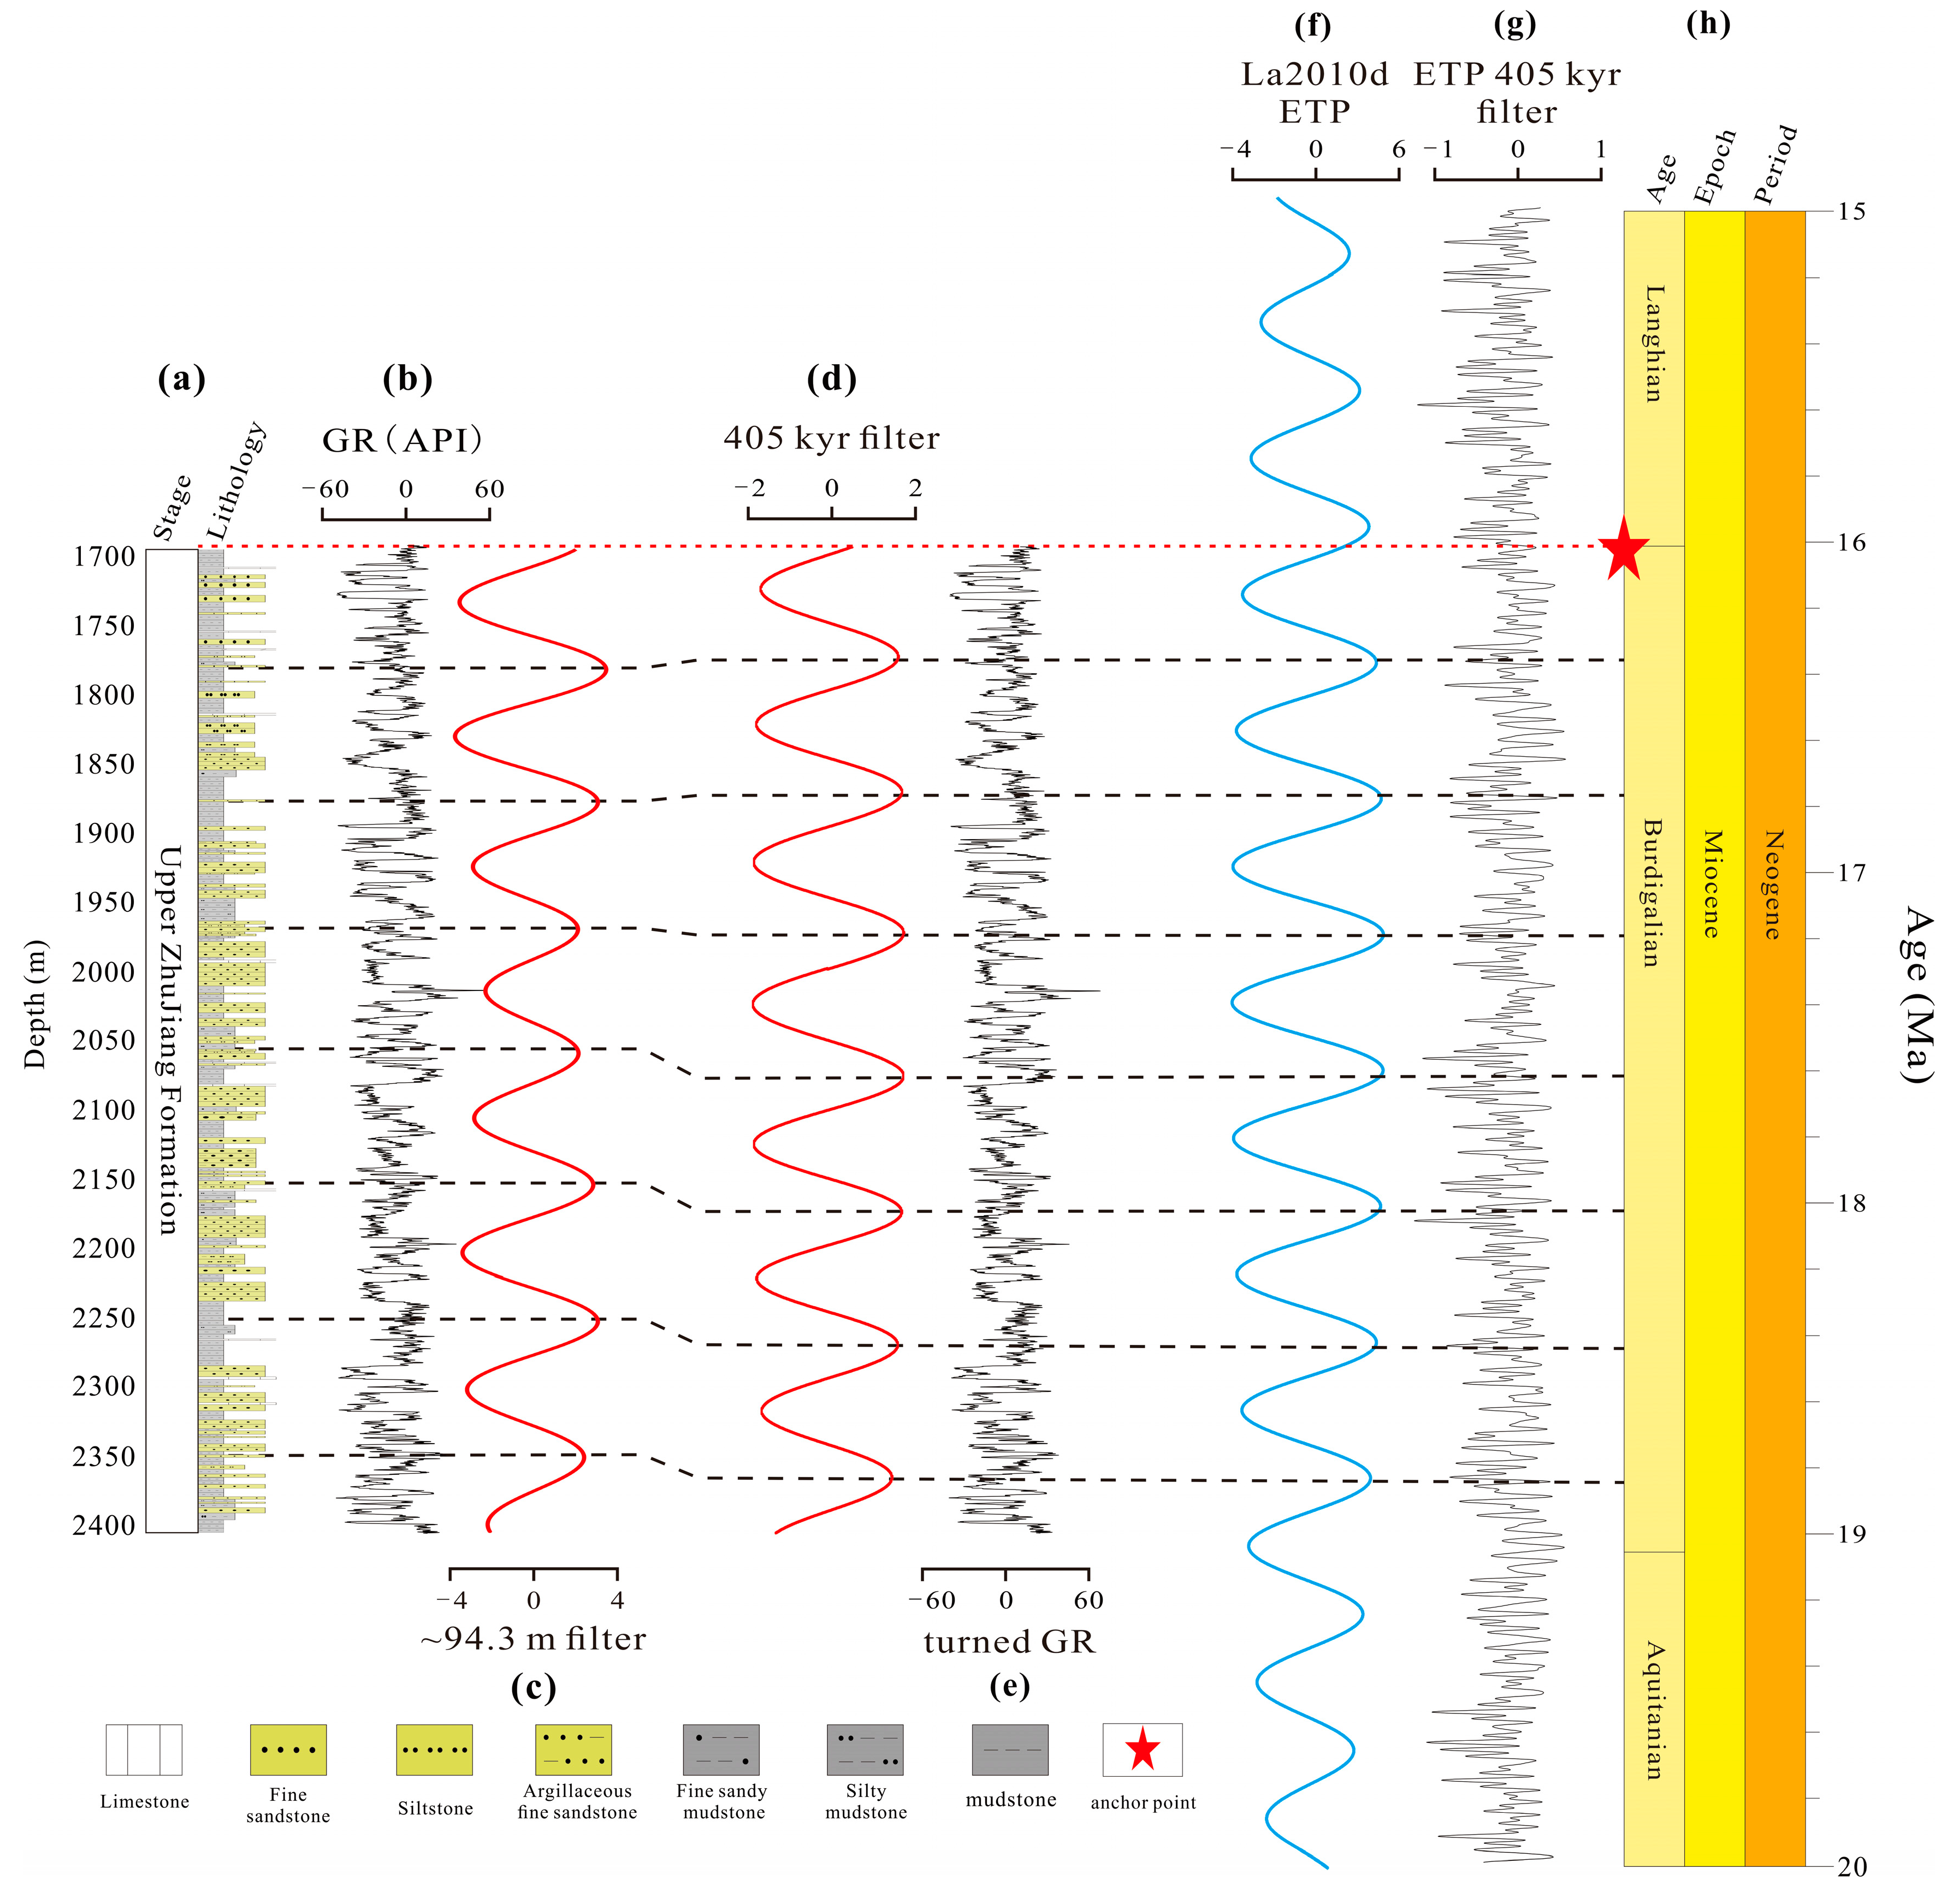
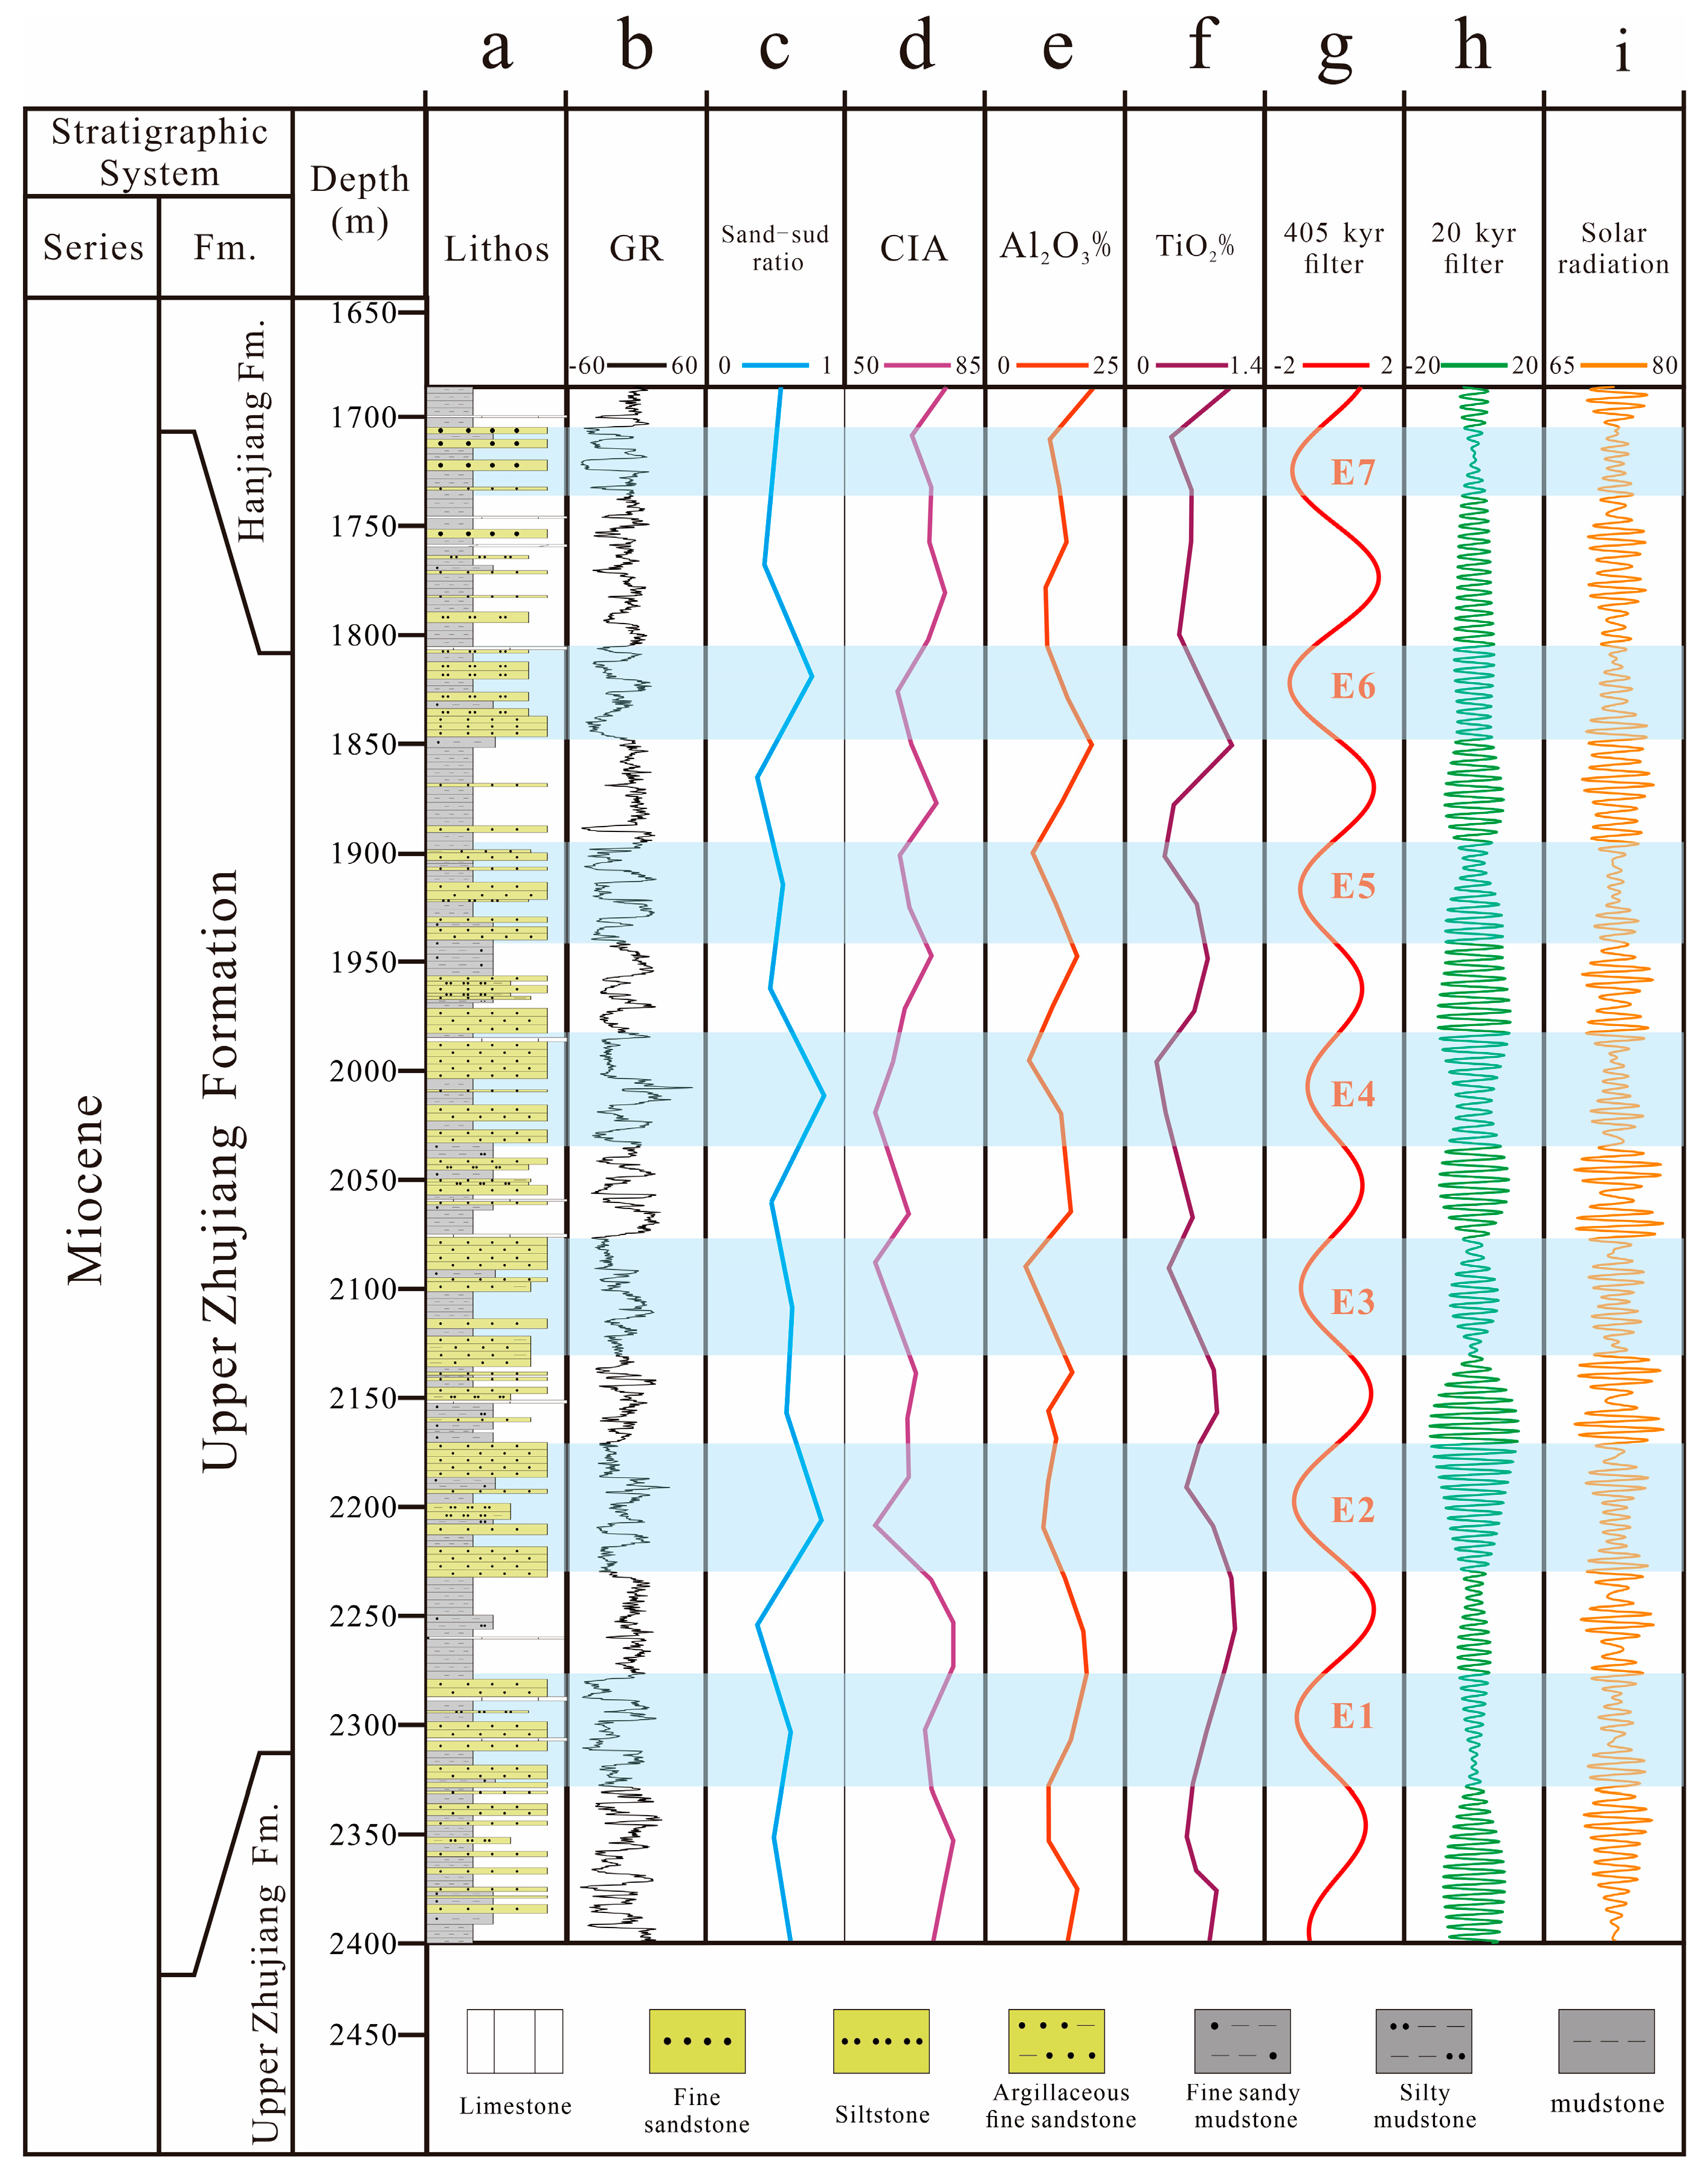
Based on the principles of cyclostratigraphy, the Milankovitch cycle signals preserved in the 15.98–19.09 Ma stratigraphic sequence of the Upper Zhujiang Formation in the Enping Depression have been extracted systematically by using spectral analysis, wavelet transform, and astronomical tuning techniques of natural gamma-ray loggings. Through sliding window spectral analysis and dynamic correction of sedimentation rates, an astronomical age scale containing 405 kyr long eccentricity, 100 kyr short eccentricity, 40 kyr obliquity, and 20 kyr precession cycles was successfully constructed. Its resolution is more accurate than that of traditional biostratigraphy, and it provides a key calibration standard for high-precision isochronous stratigraphic correlation of the Neogene in the northern South China Sea.
(2)
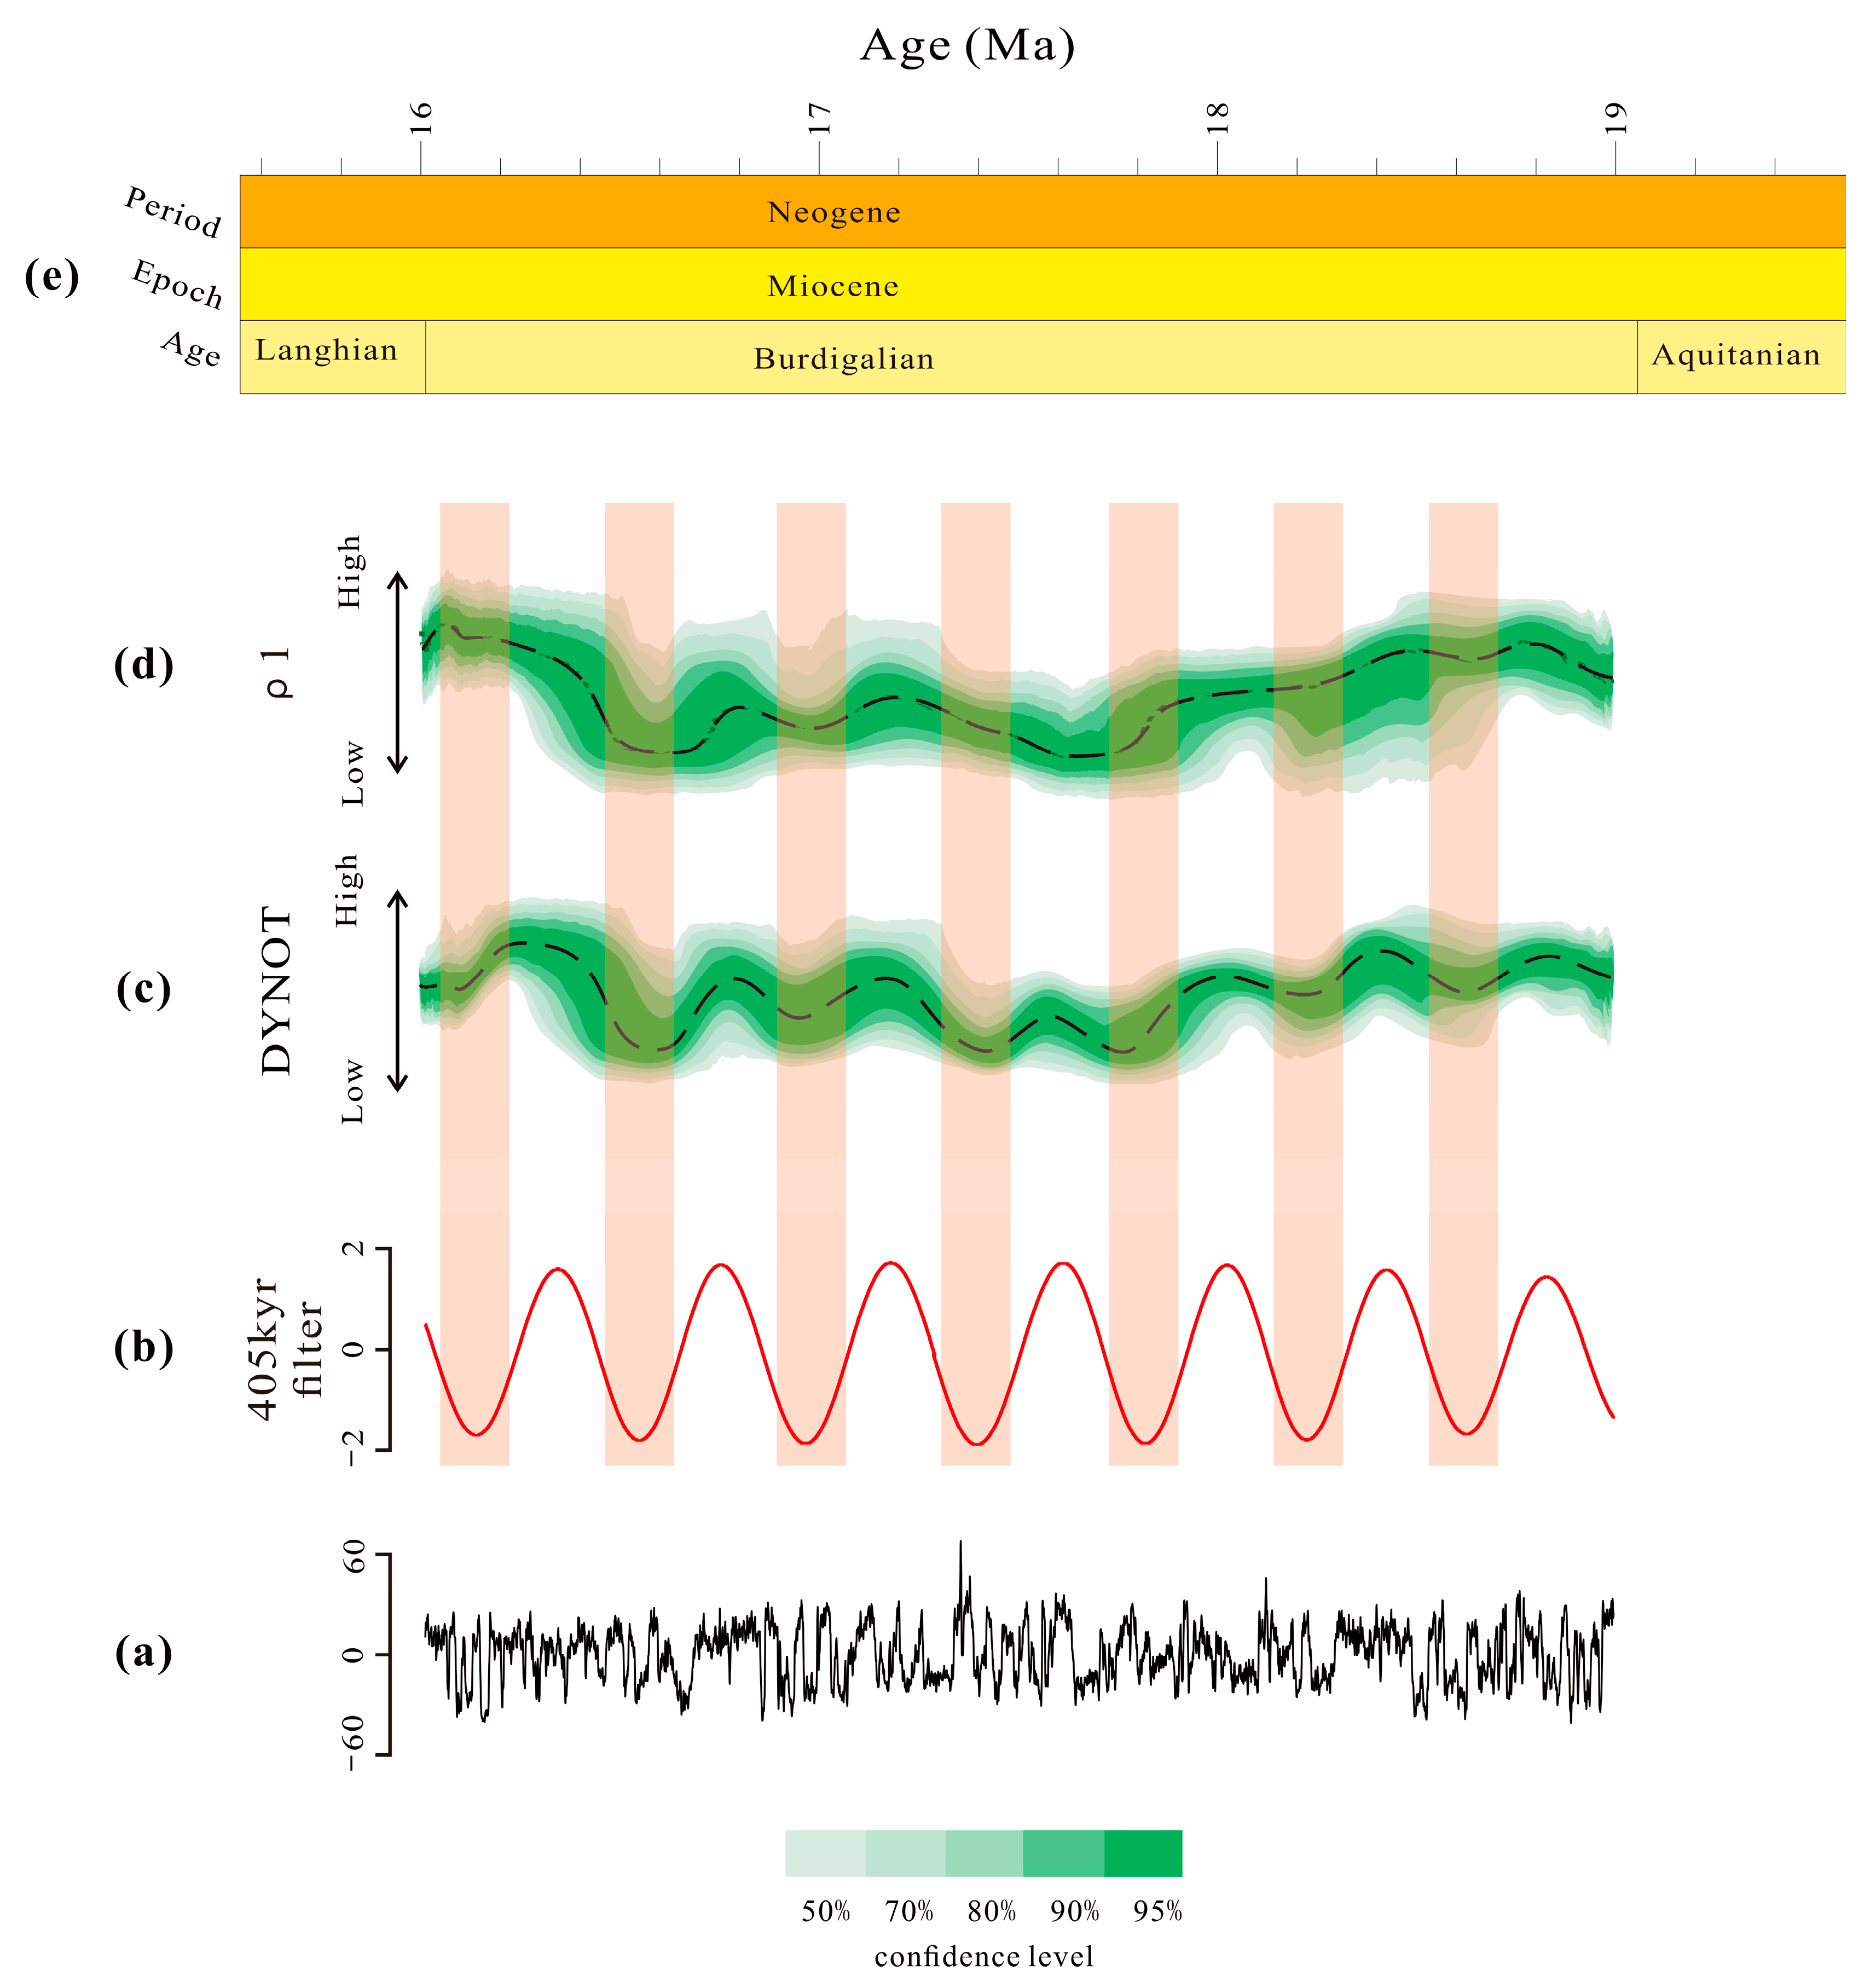
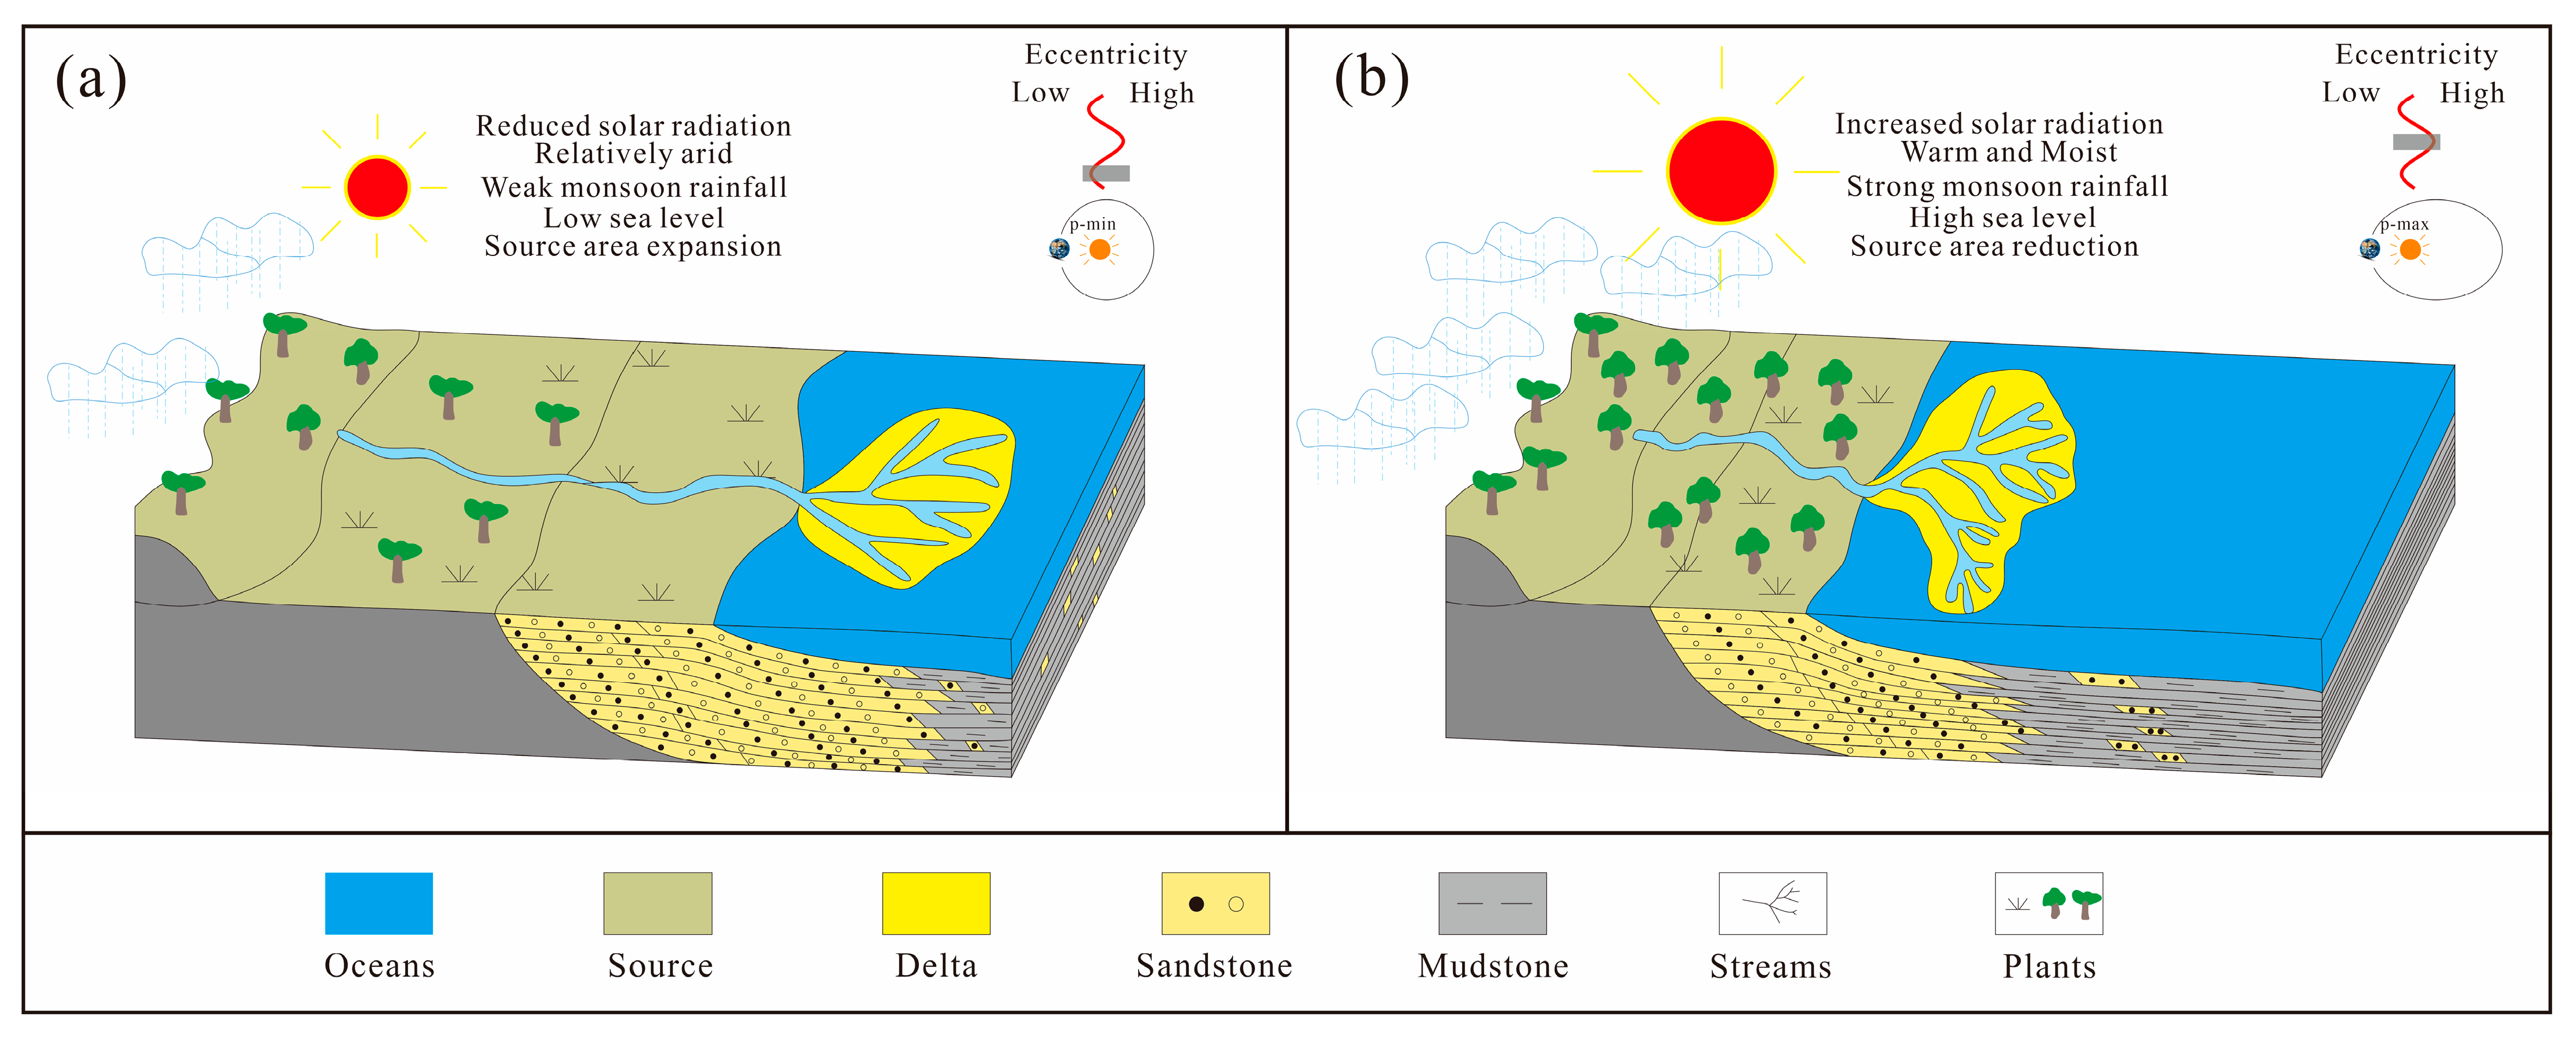
The inversion results based on the DYNOT orbital period decomposition algorithm and ρ1 sediment noise model show that the study interval has a significant 405 kyr long eccentricity period dominant characteristic relative to sea-level variation. The quantitative correlation analysis between cycle thickness and sedimentary flux shows that the high value period of long eccentricity (corresponding to a high insolation phase) is coupled with the warm and wet period of global climate, which promotes the extensive deposition of fine mudstone under the background of transgression, while the low value period (low insolation phase) triggers the regional dry and cold climate, enhances the supply of terrigenous debris, and forms the dominant sedimentary sequence of coarse delta-coastal sandstone. This law establishes a dynamic response model for the prediction of reserve-cap combination under the interaction of land and sea.
(3)
The correspondence between the constant elements indicating environmental changes and astronomical cycle curves reveals that the 405 kyr long eccentricity period regulates the “periodic modulation” effect of precession amplitude, and both of them affect environmental changes such as climate change, weathering intensity, and rainfall variation in the study area, further affecting the sedimentary process. During the period of high eccentricity, the intensity of monsoon precipitation and chemical weathering increased sharply due to the increase in precession amplitude, and the base level rose due to the retreat of the ice sheet, which significantly altered the spatial distribution of the denudation flux and the sedimentary system in the source area.
(4)
The methodology and high-resolution timescale presented here lay a foundation for future comparative studies of orbital-scale sedimentary responses in monsoon-dominated systems, both within SE Asia and globally. This study is constrained by its regional focus on a single borehole in the Enping Depression, limiting direct comparisons with contemporaneous SE Asian basins due to scarce orbital-scale datasets. The temporal resolution of the astronomical timescale may overlook sub-Milankovitch events, while model assumptions (e.g., DYNOT attributing noise solely to sea level) might oversimplify tectonic or diagenetic influences. The reliance on GR and geochemical proxies (CIA, Al2O3) could underrepresent complex climate feedbacks, and restricted data accessibility hinders full reproducibility. Future work should integrate multi-proxy analyses and expand to adjacent basins to enhance regional and global applicability.

Author Contributions

Conceptualization, S.Z. and C.Z.; methodology, E.X.; software, C.Z.; validation, S.Z., C.Z. and E.X.; formal analysis, Y.W.; investigation, R.Z.; resources, R.H.; data curation, G.G.; writing—original draft preparation, S.Z.; writing—review and editing, C.Z.; visualization, C.Z.; supervision, E.X.; project administration, Y.W.; funding acquisition, S.Z. All authors have read and agreed to the published version of the manuscript.

Funding

This research was funded by National Natural Science Foundation of China (NSFC) “Sea level change and stratigraphic modeling of biplane folding zone on the northern gently sloping continental shelf of the South China Sea”, grant number 41472098.

Institutional Review Board Statement

Not applicable.

Informed Consent Statement

Not applicable.

Data Availability Statement

The data presented in this study are available on request from the corresponding author. The data are not publicly available due to content of vital national interest and security.

Conflicts of Interest

The authors declare no conflicts of interest.

References

  1. Berger, A. Milankovitch Theory and climate. Rev. Geophys. 1988, 26, 624–657. [Google Scholar] [CrossRef]
  2. Berger, A. Milankovitch, the father of paleoclimate modelling. Clim. Past 2021, 17, 123–145. [Google Scholar] [CrossRef]
  3. Imbrie, J. Astronomical theory of the Pleistocene ice ages: A brief historical review. Icarus 1982, 50, 408–422. [Google Scholar] [CrossRef]
  4. Berger, A.; Loutre, M.F. Astronomical Forcing Through Geological Time. In Orbital Forcing and Cyclic Sequences; De Boer, P.L., Smith, D.G., Eds.; Blackwell Scientific Publications: Oxford, UK, 1994; pp. 15–38. [Google Scholar]
  5. Laskar, J.; Robutel, P.; Joutel, F.; Gastineau, M.; Correia, A.C.M. A long-term numerical solution for the insolation quantities of the Earth. Astron. Astrophys. 2004, 428, 261–285. [Google Scholar] [CrossRef]
  6. Laskar, J.; Fienga, A.; Gastineau, M.; Manche, H. La2010: A new orbital solution for the long-term motion of the Earth. Astron. Astrophys. 2011, 532, 784–785. [Google Scholar] [CrossRef]
  7. Hinnov, L.A. Cyclostratigraphy and its revolutionizing applications in the earth and planetary sciences. Geol. Soc. Am. Bull. 2013, 125, 1703–1734. [Google Scholar] [CrossRef]
  8. Shi, H.; He, M.; Zhang, L.; Yu, Q.; Pang, X.; Zhong, Z.; Liu, L. Hydrocarbon geology, accumulation pattern and the next exploration strategy in the eastern Pearl River Mouth basin. China Offshore Oil Gas 2014, 26, 12–25. [Google Scholar]
  9. Shi, H.; Dai, Y.; Liu, L.; Jiang, H.; Li, H.; Bai, J. Geological characteristics and distribution model of oil and gas reservoirs in Zhu I depression, Pearl River Mouth Basin. Acta Pet. Sin. 2015, 36, 120–133+155. [Google Scholar]
  10. Liu, Y.; Wu, H.; Zhang, S.; Fang, N. Cyclostratigraphy Research on the Hanjiang-Wanshan Formations in Zhuyi Depression, Pearl River Mouth Basin. Earth Sci. 2012, 37, 13. [Google Scholar]
  11. Zhu, C.; Zhang, S.; Wang, Y.; XU, E. Cyclical stratigraphic analysis and establishment of astronomical chronograph of Hanjiang Formation in Lufeng Sag. Mar. Geol. Front. 2022, 38, 11. [Google Scholar]
  12. Wang, H.; Dai, J.; Chai, Y.; Heng, L.; Song, G.; Sun, S.; Ni, R. Detailed Characterization of Neogene Relative Sea Level Change in Pearl River Mouth Basin and Its Control over Delta Sedimentary Evolution:Taking Hanjiang Formation and Zhujiang Formation of Oilfield A in Enping Sag as an Example. J. Jilin Univ. (Earth Sci. Ed.) 2024, 54, 359–370. [Google Scholar] [CrossRef]
  13. Li, Z.; Ding, L.; Li, X.; Li, X.; Wu, Y. Division of high-resolution stratigraphy in sedimentary sequence theory and prediction of lithological traps: A case study of the Neogene in Enping Sag, Pearl River Mouth Basin. Mar. Geol. Front. 2023, 39, 73–82. [Google Scholar] [CrossRef]
  14. Sun, Z.; Pang, X.; Zhong, Z.; Zhou, D.; Chen, C.; Hao, H. Dynamics of Tertiary tectonic evolution of the Baiyun Sag in the Pearl River Mouth Basin. EarthScience Front. 2005, 12, 10. [Google Scholar]
  15. Liu, H. Rift Style Controlled by Basement Attributeand Regional Stress in Zhu I Depression, Pearl River Mouth Basin. Earth Sci. 2018. [Google Scholar]
  16. Ma, L.; Shan, X.; Xiang, X.; Hao, G.; Zhang, P.; Yan, B.; Yi, B. Fault Activity and Dynamic Mechanisms During theRifting Stage in the Baiyun Depression of the Pearl River Mouth Basin. J. Jilin Univ. (Earth Sci. Ed.) 2024, 54, 1968–1985. [Google Scholar]
  17. Liu, Y.; Wu, Z.; Cheng, Y.; Wu, K.; He, M.; Zhang, J.; Chen, M. Spatial and temporal difference of Paleogene rift structure and its controlling factors in the northern South China Sea:A case study of Pearl River Mouth basin. J. China Univ. Min. Technol. 2019, 48, 367–376. [Google Scholar]
  18. Wang, C. The analysis of marine Neogene sequence stratigraphy in the Zhujiangkou Basin and its significance. China Offshore Oil Gas 1996, 10, 10. [Google Scholar]
  19. Wang, J.; Jin, S.; Wei, X.; Hao, J.; Chen, Y.; Li, L.; Ma, C. Orbital cycle recognition and sequence stratigraphic divisionof the Lower Carboniferous Dawuba Formation shales in Southwest Guizhou. Bull. Geol. Sci. Technol. 2024. [Google Scholar]
  20. Zhang, X.; Wu, J.; Peng, G.; Xu, X.; Zhen, X. Miocene river-wave dominated sedimentary system in south belt of Enping Sag and its significance. Lithol. Reserv. 2022, 34, 95–104. [Google Scholar]
  21. Du, W.; Zhu, R.; Xiong, L.; Zhu, H.; Shu, Y.; Huang, Z. Analysis of provenance systems of the EnpingFormation in the Enping sag, Pearl River Mouth basin and future ocean drilling proposals. Acta Geol. Sin. 2022, 96, 12. [Google Scholar]
  22. DU, W.; Ji, Y.; Ji, M.; Jin, Z.; Hao, L. Establishment and significance of high-resolution Early Oligocene chronostratigraphic framework in Raoyang Sag, Bohai Bay Basin. J. China Univ. Pet. (Ed. Nat. Sci.) 2020, 44, 10. [Google Scholar]
  23. Wu, H.; Zhang, S.; Feng, Q.; Fang, N.; Yang, T.; Li, H. Theoretical Basis Research Advancement and Prospects of Cyclostratigraphy. Earth Sci. J. China Univ. Geosci. 2011, 36, 20. [Google Scholar]
  24. Li, M.; Huang, C.; Ogg, J.; Zhang, Y.; Hinnov, L.; Wu, H.; Chen, Z.Q.; Zou, Z. Paleoclimate proxies for cyclostratigraphy: Comparative analysis using a Lower Triassic marine section in South China. Earth Sci. Rev. 2019, 189, 125–146. [Google Scholar] [CrossRef]
  25. Wu, H.; Zhang, S.; Jiang, G.; Huang, Q. The floating astronomical time scale for the terrestrial Late Cretaceous Qingshankou Formation from the Songliao Basin of Northeast China and its stratigraphic and paleoclimate implications. Earth Planet. Sci. Lett. 2009, 278, 308–323. [Google Scholar] [CrossRef]
  26. Zhao, Q.; Wu, H.; Li, H.; Zhang, S. Determining optimal sampling intervals for cyclotron analysis using the sampling theorem and deposition rates. Earth Sci. 2011, 36, 12–16. [Google Scholar]
  27. Li, M.; Hinnov, L.; Kump, L. Acycle: Time-series analysis software for paleoclimate research and education. Comput. Geosci. 2019, 127, 12–22. [Google Scholar] [CrossRef]
  28. Wei, X.; Yan, D.; Liu, E.; Jiang, P.; Zhou, J.; Huang, H.G.; Zhang, B.; Fu, H.; Gong, Y. Organic Matter Enrichment in Asia’s Paleolake Controlled by the Middle Eocene Global Warming and Astronomically Driven Precessional Climate. SSRN Electron. J. 2022, 154, 106342. [Google Scholar] [CrossRef]
  29. Zhang, R.; Huang, C.; Kemp, D.B.; Wang, Z.; Zhang, Z.; Chen, W. Astronomical forcing of the hydrological cycle in the Weihe Basin (North China) during the middle to late Eocene. Glob. Planet. Change 2023, 228, 104208. [Google Scholar] [CrossRef]
  30. Chen, S.; Cai, S.; Liang, Y.; Hu, Q.; Xiao, Q. Bulletin of Geological Science and Technology. Bull. Geol. Sci. Technol. 2023, 42, 189–200. [Google Scholar]
  31. Jiang, H.; Wang, H.; Li, J.; Chen, S.; Du, Z.; Fang, X.; Cai, J. Analysis on Sequence Formation Styles of Zhu-3 Depression in Pearl River Mouth Basin. Mar. Geol. Quat. Geol. 2009, 29, 87–93. [Google Scholar] [CrossRef]
  32. Li, M.; Hinnov, L.A.; Huang, C.; Ogg, J.G. Sedimentary noise and sea levels linked to land–ocean water exchange and obliquity forcing. Nat. Commun. 2018, 9, 1004. [Google Scholar] [CrossRef] [PubMed]
  33. Laskar, J.; Gastineau, M.; Delisle, J.B.; Farrés, A.; Fienga, A. Strong chaos induced by close encounters with Ceres and Vesta. Astron. Astrophys. 2011, 532. [Google Scholar] [CrossRef]
  34. Xuan, C.; Li, Q.; Liu, C. Oligocene Biostratigraphy of Well W22 in the Liwan sag of the pearl river mouth basin. Acta Micropalaeontologica Sin. 2024, 41, 45–52. [Google Scholar] [CrossRef]
  35. Gradstein, F.M.; Ogg, J.G. The chronostratigraphic scale. In Geologic Time Scale 2020; Elsevier: Amsterdam, The Netherlands, 2020; pp. 21–32. [Google Scholar]
  36. Deng, H.; Qian, K. Sedimentary Geochemistry and Environmental Analysis. In Sedimentary Geochemistry and Environmental Analysis; Springer: Berlin/Heidelberg, Germany, 1993. [Google Scholar]
  37. Nesbitt, H.W.; Young, G.M. Early Proterozoic climates and plate motions inferred from major element chemistry of lutites. Nature 1982, 299, 715–717. [Google Scholar] [CrossRef]
  38. Sun, Y.D.; Wignall, P.B.; Joachimski, M.M.; Bond, D.P.; Grasby, S.E.; Lai, X.L.; Wang, L.N.; Zhang, Z.T.; Sun, S. Climate warming, euxinia and carbon isotope perturbations during the Carnian (Triassic) Crisis in South China. Earth Planet. Sci. Lett. 2016, 444, 88–100. [Google Scholar] [CrossRef]
  39. Helland-Hansen, W.; Hampson, G.J. Trajectory analysis: Concepts and applications. Basin Res. 2010, 21, 454–483. [Google Scholar] [CrossRef]
  40. Wang, G.; Zhang, Y.; Huo, Z.; Jia, L. Ratios of Specific Elements and Their Implications for Original Source of Sediments and Redox Condition within Sedimentation Profile of the Marsh in Semi-arid Areas. J. Jilin Univ. (Earth Sci. Ed.) 2006, 36, 449–454. [Google Scholar] [CrossRef]
  41. Ogi, M.; Rigor, I.G.; Mcphee, M.G.; Wallace, J.M. Summer retreat of Arctic sea ice: Role of summer winds. Geophys. Res. Lett. 2008, 35. [Google Scholar] [CrossRef]
  42. Lisiecki, L.E.; Stern, J.V. Regional and global benthic δ 18 O stacks for the last glacial cycle: Last Glacial Cycle Benthic δ 18 O. Paleoceanogr. Paleoclimatol. 2016, 31. [Google Scholar]
  43. Maher, K.; Chamberlain, C.P. Hydrologic regulation of chemical weathering and the geologic carbon cycle. Science 2014, 343, 1502–1504. [Google Scholar] [CrossRef]
  44. Huang, C.; Hinnov, L. Astronomically forced climate evolution in a saline lake record of the middle Eocene to Oligocene, Jianghan Basin, China. Earth Planet. Sci. Lett. 2019, 528, 115846. [Google Scholar] [CrossRef]
  45. Weppe, R.; Condamine, F.L.; Guinot, G.; Maugoust, J.; Orliac, M.J. Drivers of the artiodactyl turnover in insular western Europe at the Eocene–Oligocene Transition. Proc. Natl. Acad. Sci. USA 2023, 120, 11. [Google Scholar] [CrossRef] [PubMed]
  46. Gao, Z.; Fan, T.; Li, Y.; Liu, W.; Chen, Y. Study on Eustatic Sea-Level Change Rule in Cambrian-Ordovician in Tarim Basin. J. Jilin Univ. (Earth Sci. Ed.) 2006, 36, 549–556. [Google Scholar]
  47. Rohling, E.J.; Yu, J.; Heslop, D.; Foster, G.L.; Roberts, A.P. Sea level and deep-sea temperature reconstructions suggest quasi-stable states and critical transitions over the past 40 million years. Sci. Adv. 2021, 7, eabf5326. [Google Scholar] [CrossRef]
  48. Westerhold, T.; Marwan, N.; Drury, A.; Liebrand, D.; Agnini, C.; Anagnostou, E.; Barnet, J.; Bohaty, S.; Vleeschouwer, D.D.; Florindo, F. An astronomically dated record of Earth’s climate and its predictability over the last 66 million years. Science 2020, 369, 1383–1387. [Google Scholar] [CrossRef]
Figure 1. Geological background of the Pearl River Mouth Basin area.
Applsci 15 05922 g001
Figure 2. Depth–domain analysis of the GR data series in the EP17 borehole. (a) Lithostratigraphy and lithology; (b) GR data series; (c) GR data series detrended using the LOESS filter to remove the 251.906 m trend; (d) ~94.3 m Gaussian bandpass filter (passband: 0.0010344 ± 0.0001 cycles/m); (e) 2πMTM spectral analysis of the detrended GR series, where E represents long eccentricity, e represents short eccentricity, O represents obliquity, and P represents precession.; (f) eFFT evolutionary spectral analysis of the detrended GR series, where E represents long eccentricity, e represents short eccentricity, O represents obliquity, and P represents precession.
Applsci 15 05922 g002
Figure 3. Correlation coefficient method (COCO) analyses of geophysical logging data from the EP17 borehole. (a) COCO analysis of Well EP17, testing sedimentation rates within the range of 10–30 cm/kyr with a step size of 0.1 cm/kyr and 5000 Monte Carlo simulations,ρ Indicates the size of the correlation coefficient; (b) Null hypothesis of Well EP17; (c) Astronomical orbital matching numbers of Well EP17.
Applsci 15 05922 g003
Figure 4. Time-domain data series analysis of the EP17 borehole. (a) 2πMTM spectral analysis of the ETP (eccentricity, tilt, precession) components in the 405 kyr tuned GR time series, where red represents long eccentricity, blue represents short eccentricity, green represents obliquity, and orange represents precession; (b) ETP (eccentricity, tilt, precession) components of the La2010d theoretical astronomical orbital periods; (c) Time-domain filtering of the Zhujiang Formation in Well EP17: Gaussian bandpass filter curves for the 405 kyr long eccentricity (red) (passband: 0.0024656 ± 0.0001 cycles/kyr), 100 kyr short eccentricity (blue) (passband: 0.0095238 ± 0.0002 cycles/kyr), 40 kyr obliquity (green) (passband: 0.023934 ± 0.001 cycles/kyr), and 20 kyr precession (orange) (passband: 0.05263168 ± 0.002 cycles/kyr), E1–E7 represents that the seven extracted 405 kry long eccentricity.
Applsci 15 05922 g004
Figure 5. Astronomic chronology analysis of the Upper Zhujiang Formation in the EP17 borehole. (a) Lithologic profile of Well EP17; (b) Detrended GR; (c) ~94.3 m filtered curve (passband: 0.0010344 ± 0.0001); (d) 405 kyr filtered curve (passband: 0.0024656 ± 0.0001 cycles/kyr); (e) Tuned GR; (f) 405 kyr filtered curve of the La2010d theoretical astronomical orbital periods for 15–20 Ma (passband: 0.00247 ± 0.0002); (g) Eccentricity solution from the La2010d theoretical orbital solution for 15–20 Ma; (h) International Chronostratigraphic Chart.
Applsci 15 05922 g005
Figure 6. Astronomical forcing analysis of sedimentary noise models. (a) Tuned GR data curve; (b) 405 kyr filtered curve (passband: 0.0024656 ± 0.0001 cycles/kyr); (c) DYNOT sedimentary noise model; (d) ρ1 correlation coefficient model; (e) International Chronostratigraphic Chart.
Applsci 15 05922 g006
Figure 7. Climatic characteristics and sedimentary responses driven by astronomical orbits. (a) Lithologic profile of Well EP17; (b) Detrended GR data curve; (c) Sand–shale ratio curve; (d) Vertical distribution curve of CIA values; (e) Vertical distribution curve of Al2O3 content; (f) Vertical distribution curve of TiO2 content; (g) 405 kyr filtered curve (passband: 0.0024656 ± 0.0001 cycles/kyr), E1–E7 represents 7 eccentricity cycles; (h) 20 kyr filtered curve (passband: 0.0024656 ± 0.0001 cycles/kyr); (i) Average summer insolation at 20° N [5].
Applsci 15 05922 g007
Figure 8. Characteristics of sea-level changes driven by astronomical orbits and sedimentary responses. (a). Stratigraphic boundary ages calibrated by the astronomical timescale (ATS); (b) Lithologic profile of Well EP17; (c) Tuned GR data curve; (d) 405 kyr filtered curve; (e) 20 kyr filtered curve, E1–E7 represents 7 eccentricity cycles; (f) Average summer insolation at 20° N [5]; (g) Global sea-level change curve [47]; (h) Global benthic foraminiferal oxygen isotope curve (δ18O) [48]; (i) DYNOT sea-level change curve; (j) ρ1 sea-level change curve.
Applsci 15 05922 g008
Figure 9. Sedimentary pattern diagram of the upper section of the Zhujiang Formation in the Enping Sag. (a) Mode I—low-eccentricity progradational delta; (b) Mode II—high-eccentricity retrogradational delta.
Applsci 15 05922 g009
Disclaimer/Publisher’s Note: The statements, opinions and data contained in all publications are solely those of the individual author(s) and contributor(s) and not of MDPI and/or the editor(s). MDPI and/or the editor(s) disclaim responsibility for any injury to people or property resulting from any ideas, methods, instructions or products referred to in the content.

