Article

A Chest Strap-Based System for Electrocardiogram Monitoring

1
Chongqing Key Laboratory on Optoelectronic Functional Materials, College of Physics and Electronic Engineering, Chongqing Normal University, Chongqing 401331, China
2
Chongqing Municipal Key Laboratory of Photo-Electronic Materials and Engineering of Higher Education, College of Physics and Electronic Engineering, Chongqing Normal University, Chongqing 401331, China
3
Key Laboratory of Optoelectronic Technology and Systems, Department of Optoelectronic Engineering, Chongqing University, Ministry of Education, Chongqing 400044, China
*
Authors to whom correspondence should be addressed.
Appl. Sci. 2025, 15(11), 5920; https://doi.org/10.3390/app15115920
Submission received: 30 April 2025 / Revised: 22 May 2025 / Accepted: 23 May 2025 / Published: 24 May 2025

Abstract

To address the issues of poor comfort and limited mobility associated with traditional ECG monitoring systems, this study developed a chest strap ECG monitoring system (CEMS) utilizing silver-coated polyamide yarn. This system can continuously capture high-quality ECG signals during daily activities such as walking and running, without restricting the user’s movement. Real-time data display and storage are enabled through a built-in Bluetooth module. Furthermore, leveraging these high-quality ECG signals, a classification model based on a fully connected neural network was constructed to evaluate exercise intensity by analyzing key ECG features. After 100 training epochs, the model achieved a classification accuracy of 98.7% for running intensity. The integration of this model with the CEMS enables effective tracking of ECG signals and accurate assessment of exercise intensity, offering a promising and practical solution for next-generation wearable signal monitoring systems.

1. Introduction

Nowadays, sudden cardiac events during physical activity have become a major hidden threat to human health, drawing increasing attention to the real-time monitoring of cardiac function. Electrocardiogram (ECG) monitoring, as the most direct and effective method for assessing cardiac activity, plays a critical role in evaluating heart function [1,2]. Although traditional ECG monitoring systems offer accurate signal acquisition, their bulky and restrictive designs hinder user mobility, limiting their suitability for continuous and portable daily monitoring [3]. Furthermore, the Ag/AgCl gel electrodes commonly used in conventional systems exhibit poor breathability during prolonged use, often leading to skin irritation or allergic reactions, which further constrains the widespread adoption of portable monitoring systems [4,5,6]. In recent years, advances in flexible electronics, sensor materials, and integrated circuit technologies have paved the way for the development of flexible wearable monitoring systems as a promising solution [7,8,9,10,11,12,13,14,15]. Numerous studies have demonstrated that by optimizing electrode materials and structural design, combined with low-power, high-performance signal conditioning circuits and algorithms, high-quality, real-time ECG monitoring can be achieved [16,17,18,19,20,21,22,23,24].
Ozkan et al. proposed a vest-type wearable wireless Tele-ECG monitoring system based on fabric electrodes, enabling remote physiological signal monitoring while ensuring user comfort. The filtered digital signal achieved a signal-to-noise ratio (SNR) of up to 45.62 [25]. Tu et al. designed a printed fabric-based hybrid electric circuit that remains conductive and reliable under repeated stretching and bending. This flexible circuit provides 1600-times amplification and multi-stage filtering, effectively capturing and processing weak electrophysiological signals [26]. Chu et al. developed a portable ECG monitoring device using flexible non-hydrogel electrodes, demonstrating its potential for long-term ECG monitoring in real-world scenarios [27]. However, current research still faces challenges, including low system integration, bulky device designs, and limited wearability. Moreover, most studies emphasize ECG signal acquisition, with insufficient focus on advanced signal analysis and intelligent processing. These shortcomings hinder the development of practical ECG monitoring systems that meet modern demands for portability, intelligence, and rich information extraction. During physical activity, signal quality and system stability are more susceptible to motion artifacts, unstable electrode contact, and sweat interference [28,29]. Therefore, developing a portable system capable of acquiring high-quality ECG signals under dynamic conditions remains a key challenge in current research. At the same time, with the continuous advancement of artificial intelligence, particularly deep learning, analyzing physiological signals using deep learning techniques has become a major research focus [30,31,32,33]. Castillo-Atoche et al. proposed a self-powered, wearable AIoT system for athletes, which uses a convolutional neural network (CNN) to accurately analyze and classify ECG signals during exercise. However, the system still faces issues such as large size and limited portability [34]. Guerra et al. introduced an algorithm that employs an autoencoder with long short-term memory network (LSTM) layers and incorporates an adaptive filter to extract ECG features, enabling high-precision automatic identification and classification of ECG signals [35]. Sun et al. developed a classification and prediction model for cardiac arrhythmia based on a CNN-LSTM-SE fusion algorithm, achieving high classification accuracy and recall [36].
To address the limitations of current wearable ECG monitoring systems, this study aims to develop a real-time ECG monitoring system tailored for daily use and to construct an individualized exercise intensity assessment model, thereby enhancing the system’s intelligence and practicality. To this end, we propose a chest strap design incorporating flexible textile electrodes and evaluate its feasibility and stability in physiological signal acquisition. Additionally, by integrating deep learning algorithms, we develop an exercise intensity assessment model that uses multiple ECG-derived features as inputs to assess a user’s exercise intensity.
The main contributions of this work are as follows:
  • The development of a miniaturized, low-cost, and highly comfortable chest strap ECG monitoring system that meets the requirements for daily wearability.
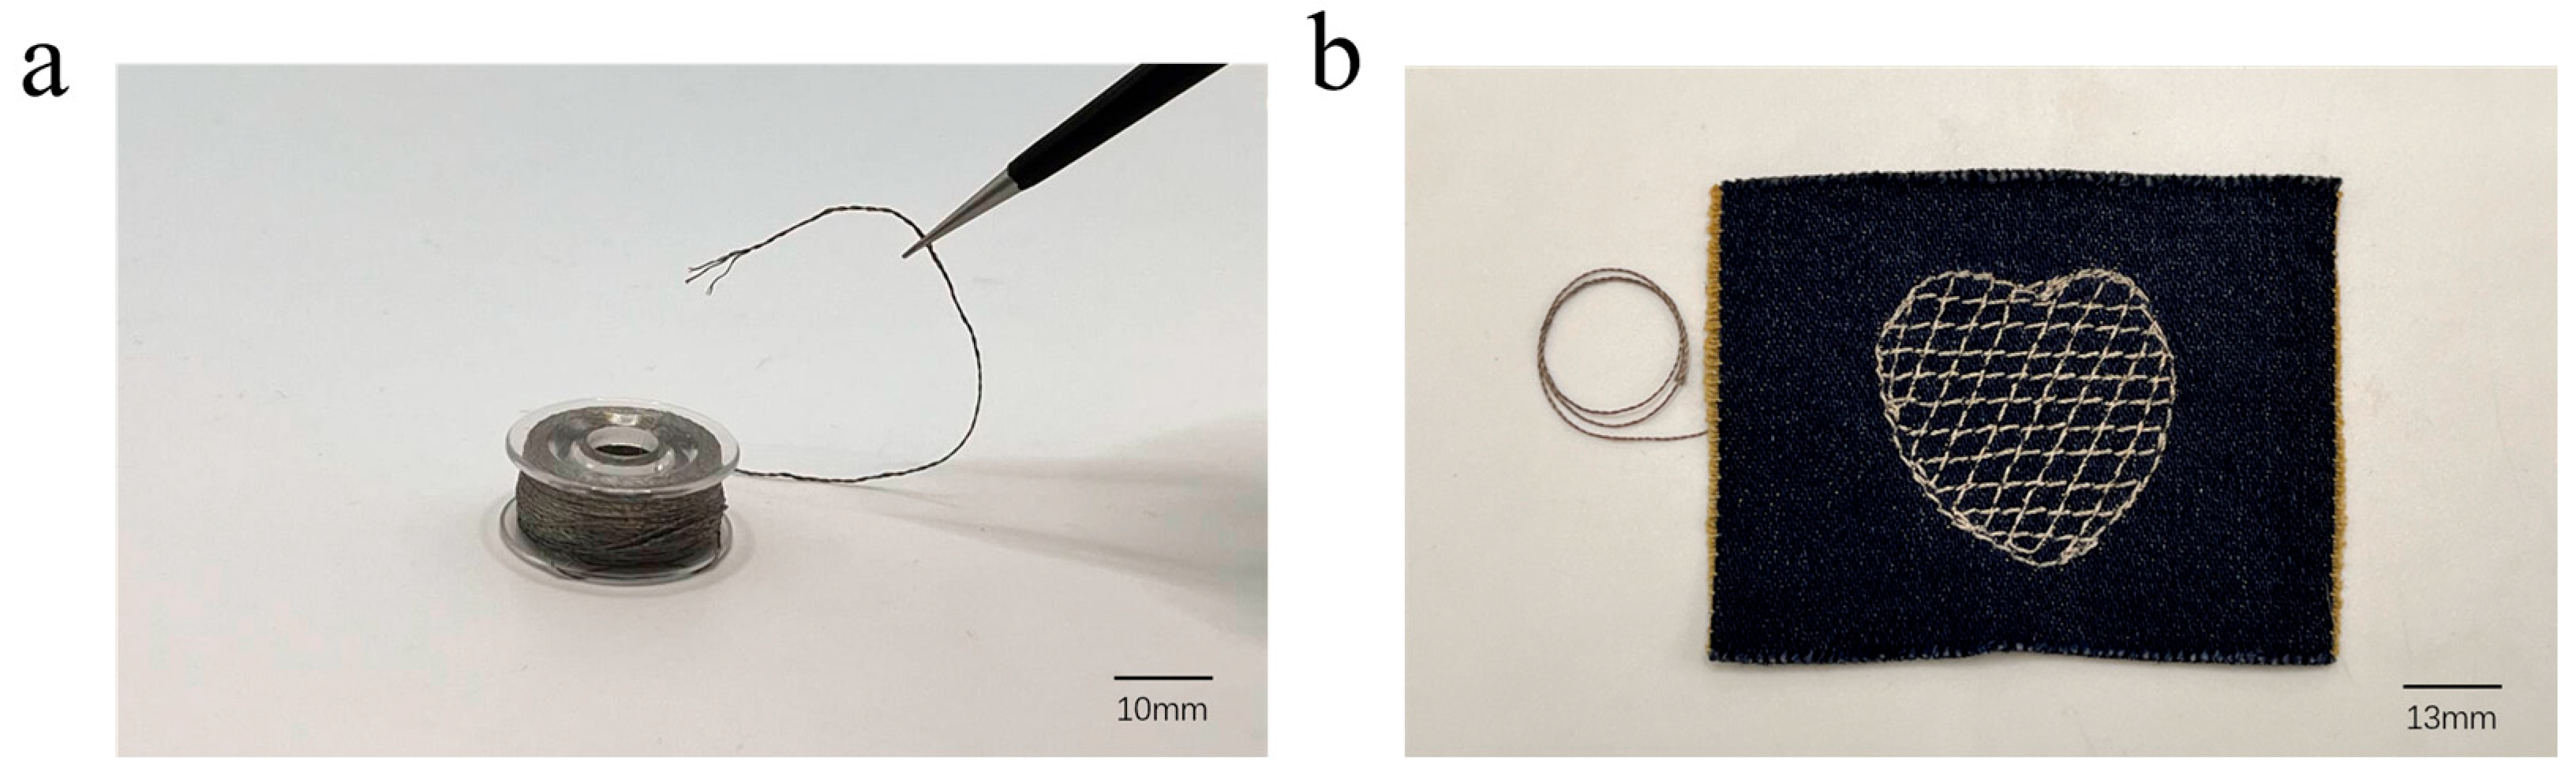
  • The design of flexible textile electrodes fabricated by integrating silver-coated polyamide yarn with breathable and elastic substrates, offering excellent flexibility, comfort, and signal quality, significantly enhancing wearability and measurement performance.
  • The construction of a deep learning model for accurately assessing individual exercise intensity based on ECG signal features, thereby expanding the application potential of ECG signals in smart health monitoring.
The remainder of this paper is organized as follows: Section 2 describes the methodology, including the system design, the signal conditioning circuit, and the deep learning model. Section 3 presents the experimental setup. Section 4 reports and discusses the results. Section 5 concludes the study.

2. Methodology

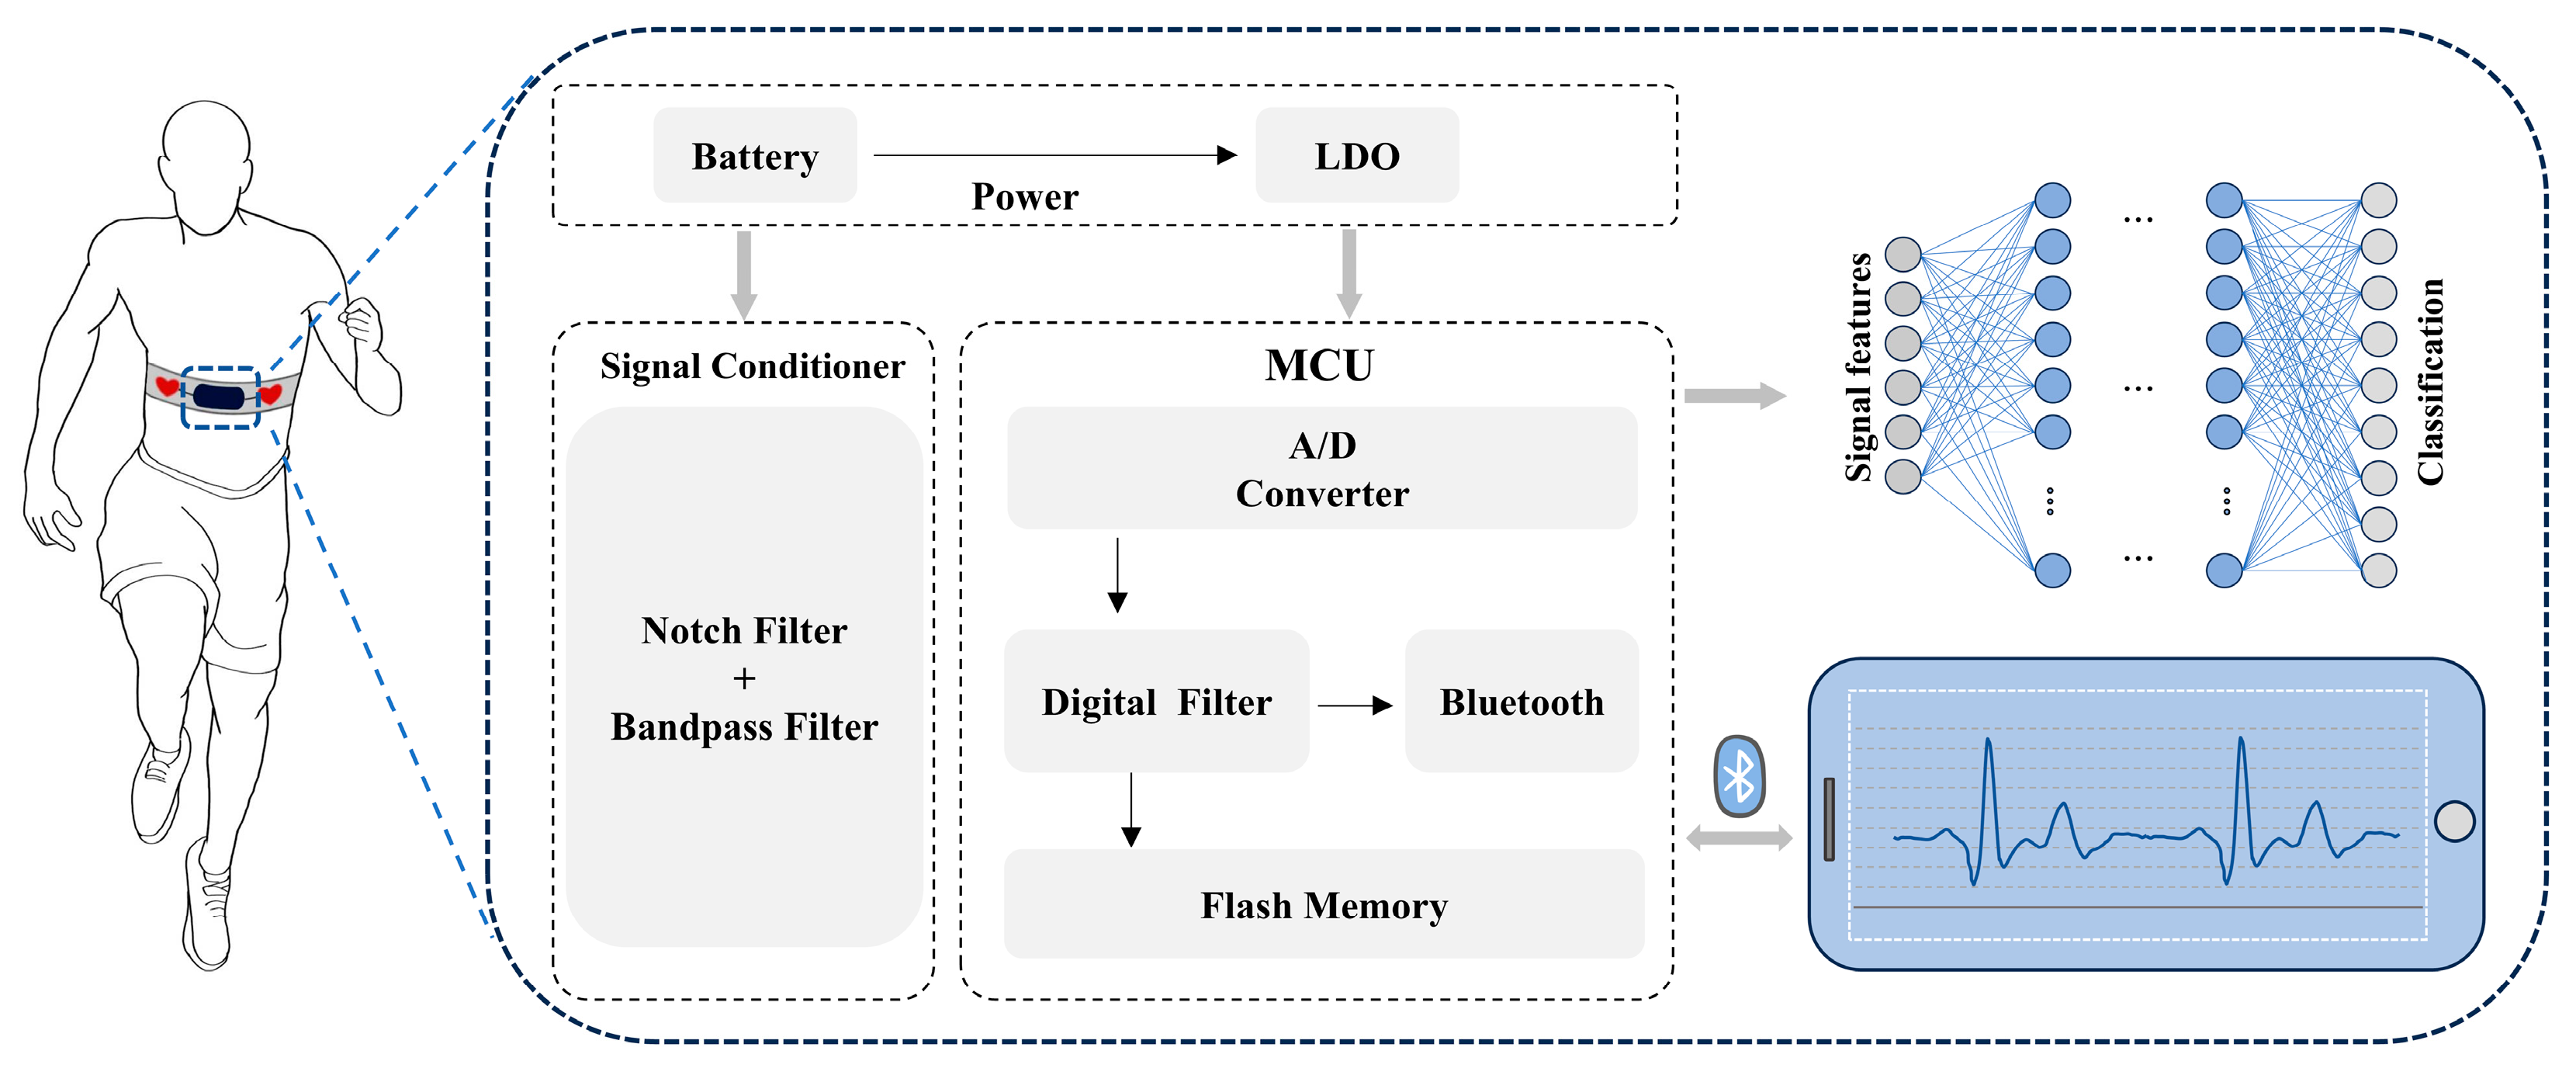
2.1. The System Architecture of the ECG Monitoring System

In recent years, growing public awareness of exercise has increased attention to health monitoring during physical activity. To enable comfortable physiological signal monitoring during exercise, this study proposes a portable chest strap ECG monitoring system (CEMS). The CEMS can monitor a high-quality ECG signal without interfering with daily activities. As illustrated in Figure 1, ECG signals are collected via the silver-coated textile electrode (STE) embedded in the chest strap and transmitted to an embedded system. The signals are first processed through a dual-stage filtering circuit, comprising a notch filter to remove industrial frequency interference and a bandpass filter to eliminate baseline drift and high-frequency noise. After filtering, the signals are digitized by the analog-to-digital converter (ADC) of the microcontroller unit (MCU) and transmitted via a Bluetooth module to a mobile device for real-time ECG waveform visualization. Meanwhile, the ECG data are also stored in the system’s flash memory for subsequent input into an exercise intensity assessment model, allowing for accurate evaluation of the user’s exercise intensity.
Unconstrained physiological signal monitoring is essential during physical activity. The structure of the proposed CEMS is illustrated in Figure 2a. The STE is sewn onto an elastic band, and its excellent flexibility allows it to stretch freely with the band. The soft and comfortable texture of the textile enables the CEMS to be worn securely around the chest, ensuring good contact with the skin. Figure 2b displays the printed circuit board (PCB) of the CEMS, which is enclosed in a plastic housing and attached to the elastic band using Velcro. The system’s compact size meets the needs of individual users and allows high-quality ECG monitoring without adding weight or restricting movement. This design provides a novel and practical solution for wearable ECG monitoring during daily exercise.

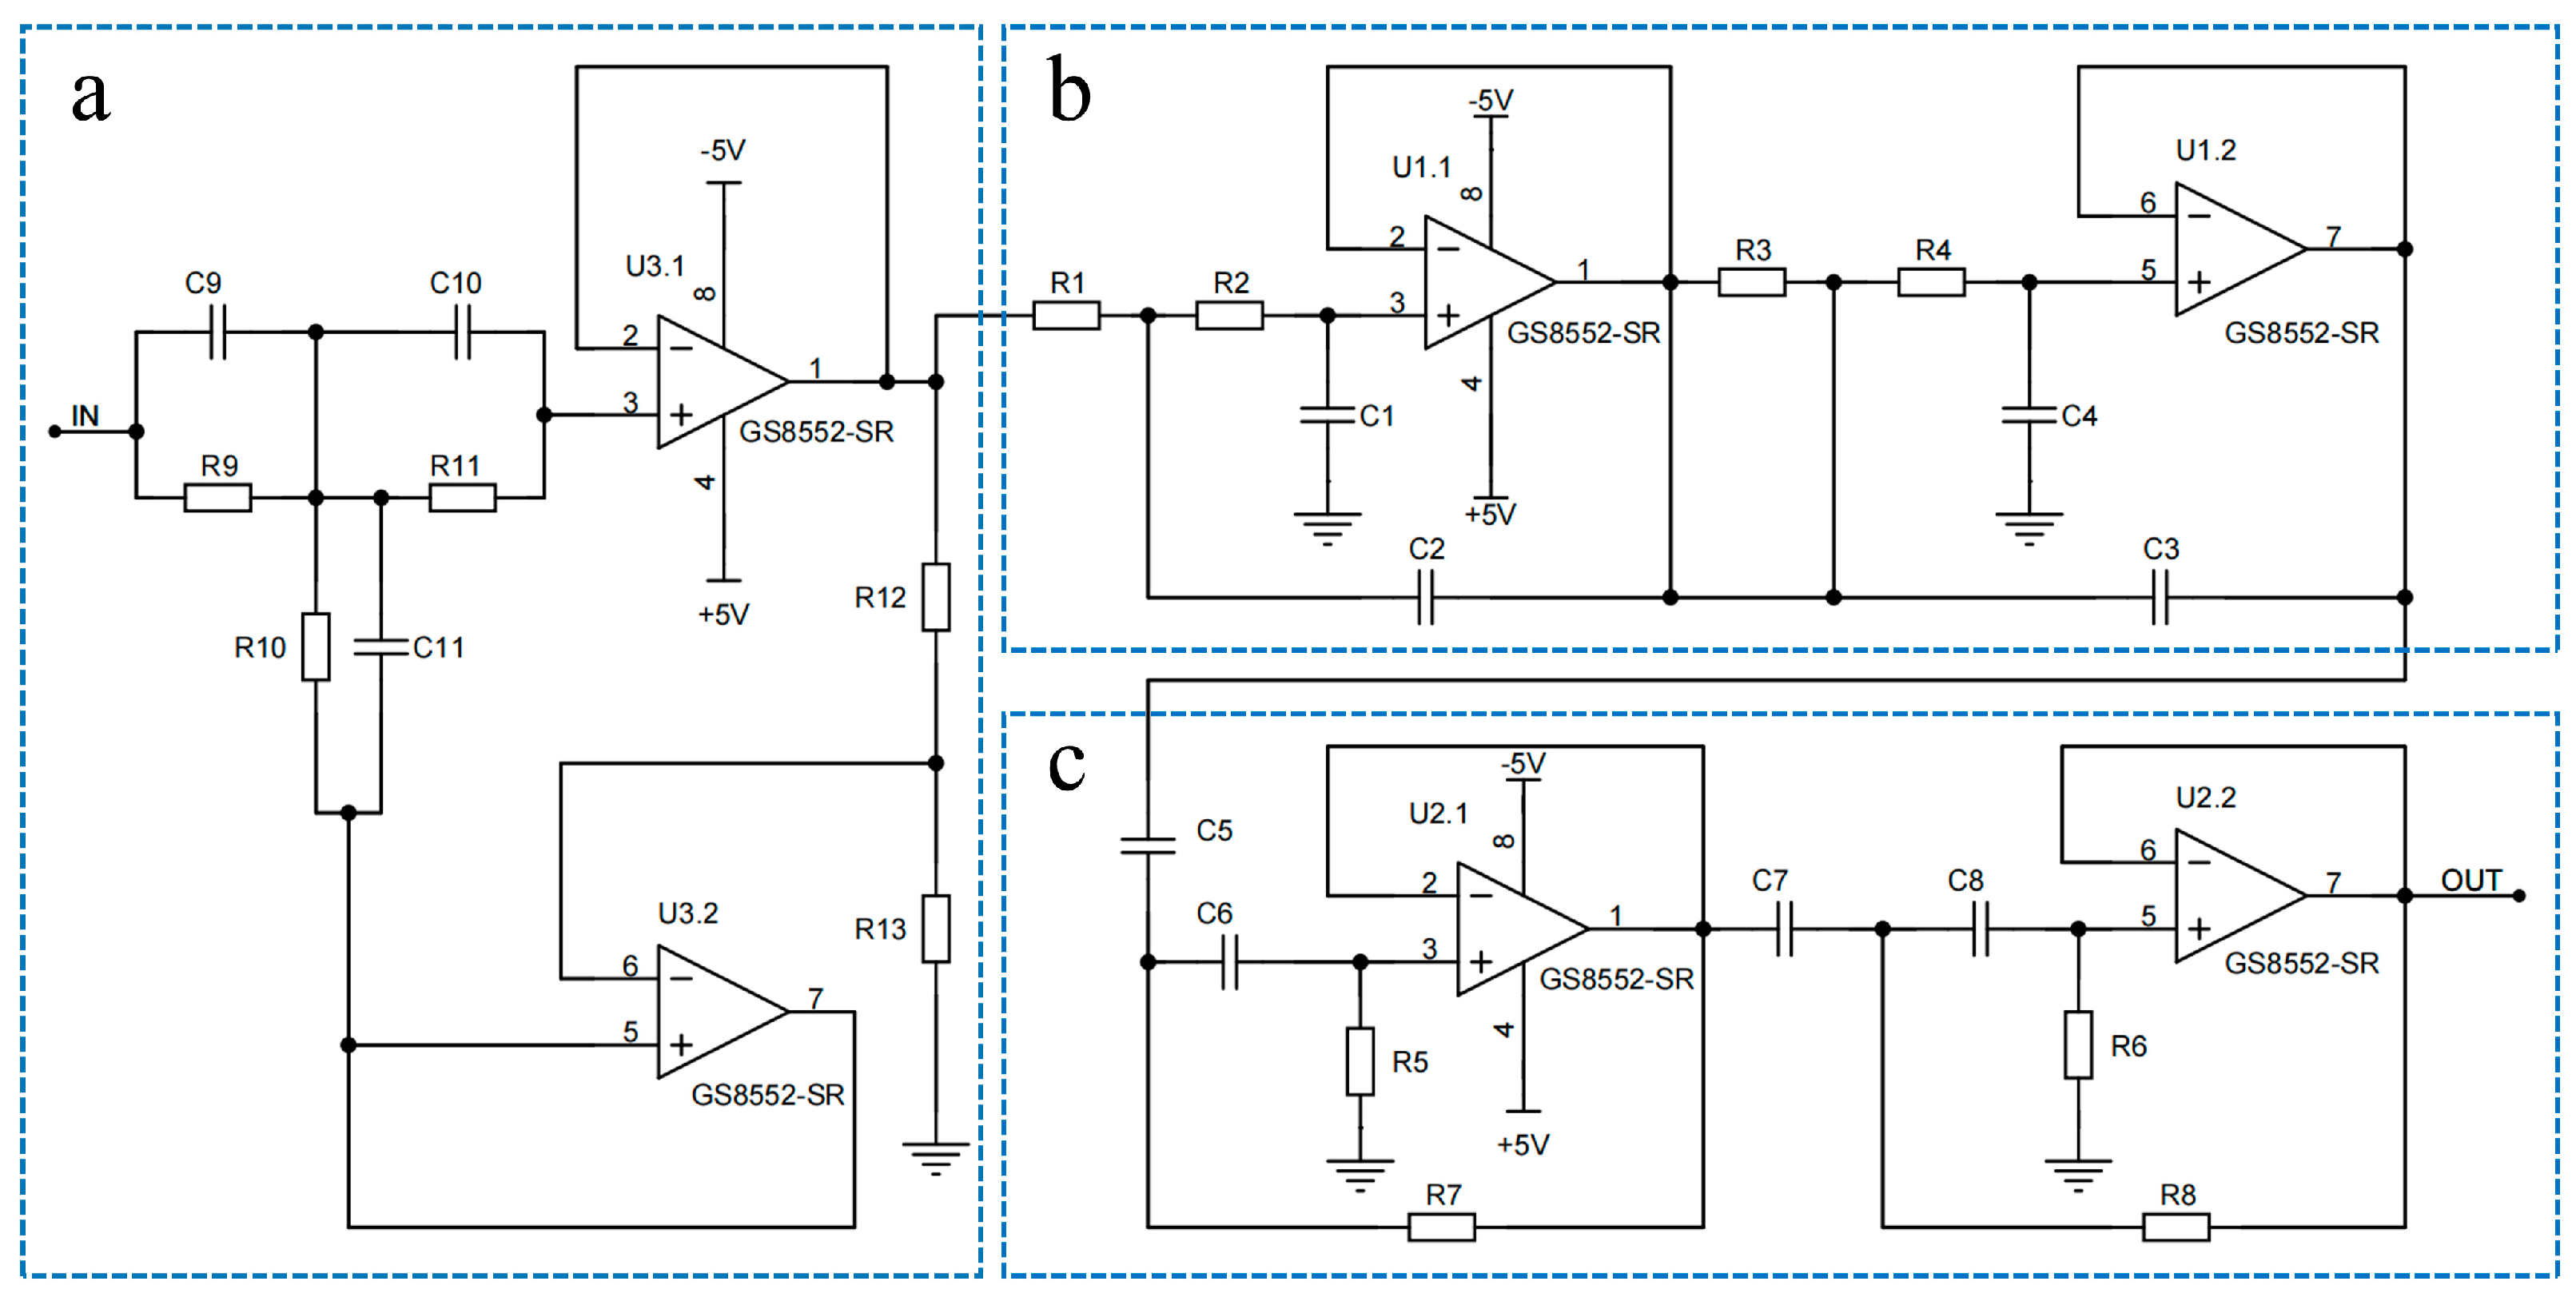
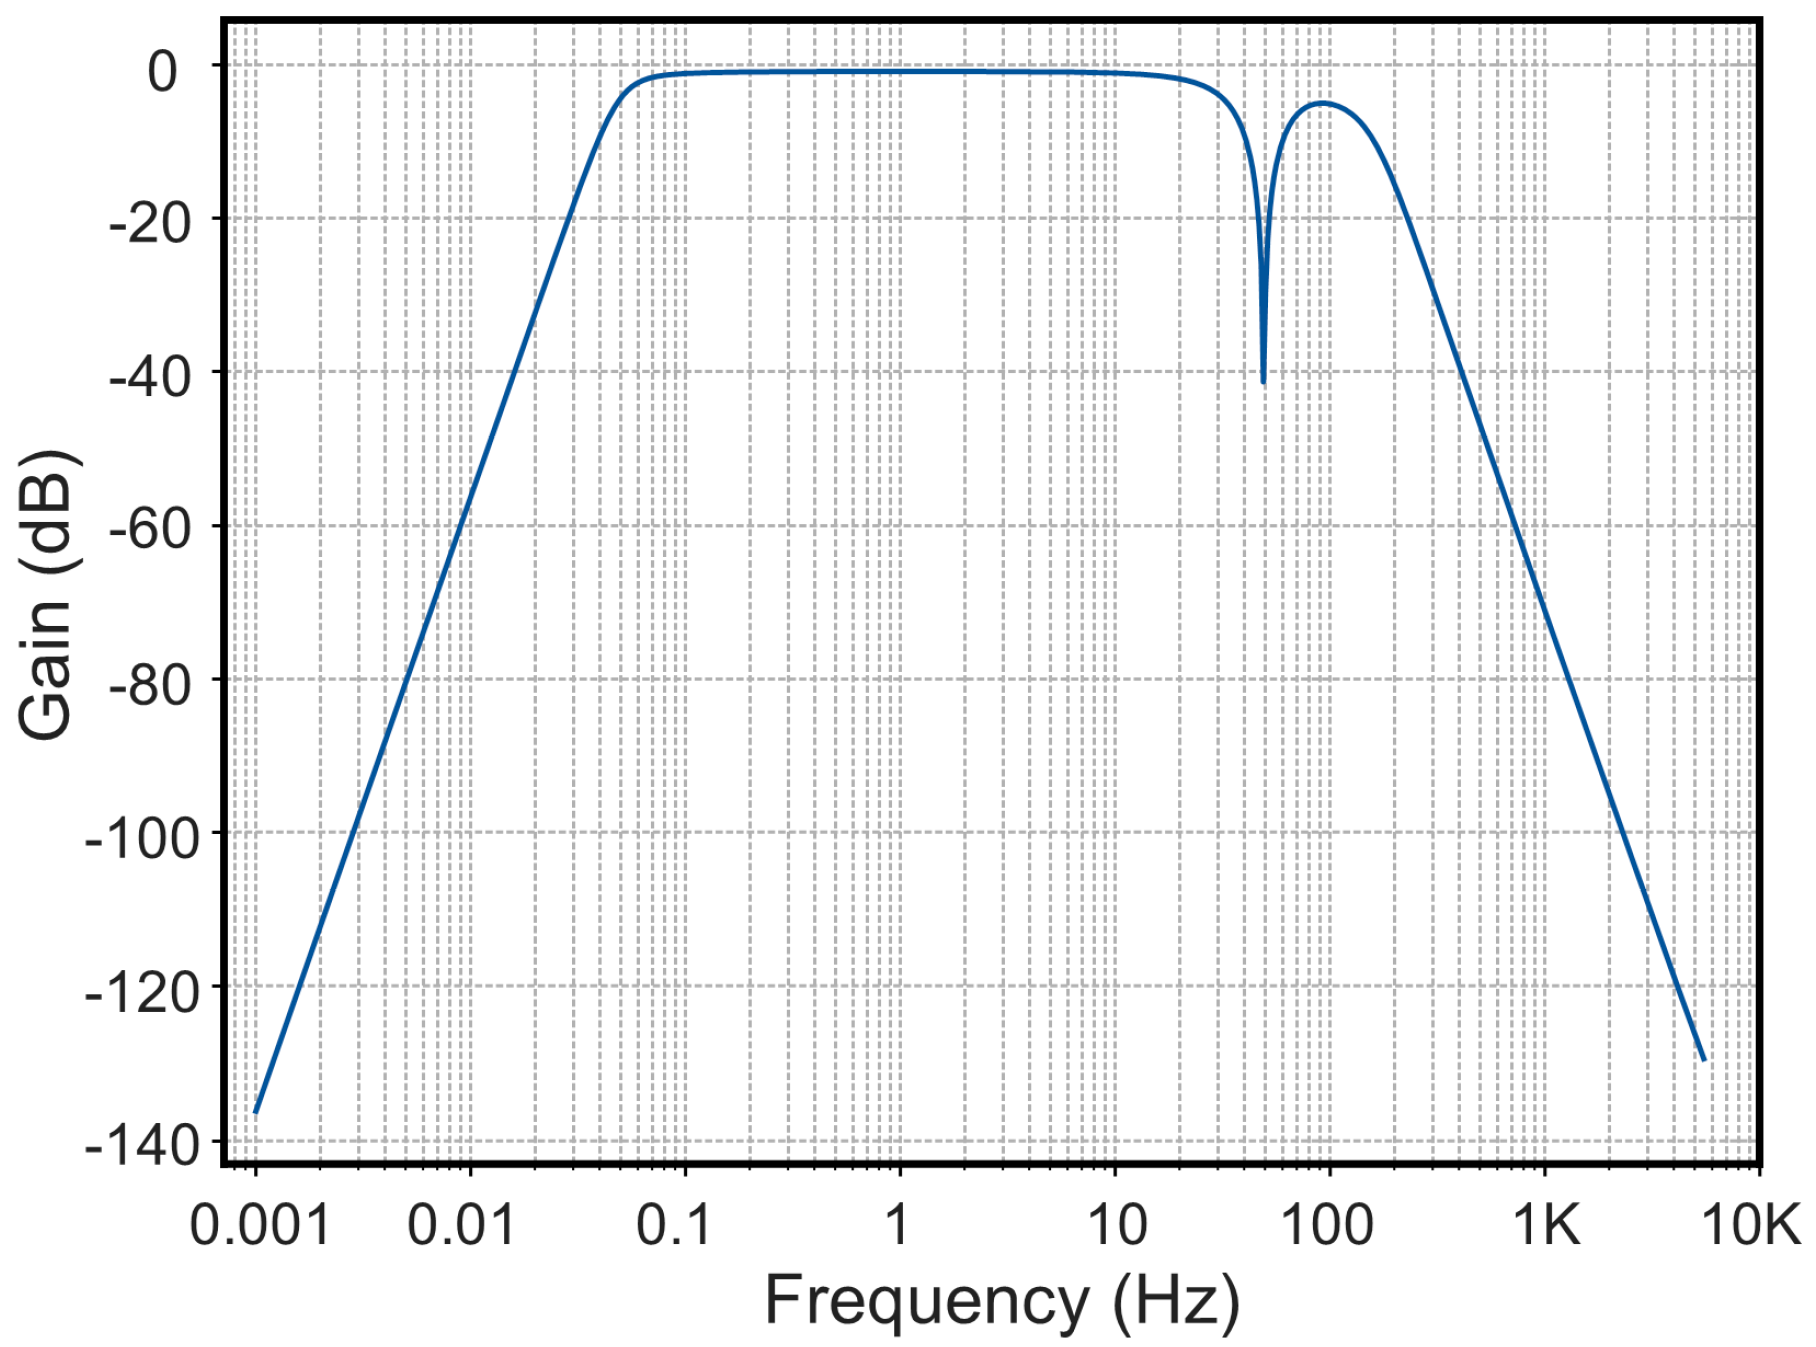
2.2. Signal Conditioning Circuit

During physiological signal acquisition, ambient electromagnetic interference can significantly affect low-amplitude ECG signals, potentially compromising subsequent signal analysis [37,38,39]. Additionally, myoelectric interference, baseline drift, and high-frequency noise generated during individual movement can further degrade ECG signal quality, ultimately affecting the accuracy of physical health assessments. Therefore, the design of efficient filtering circuits is critical in ECG monitoring systems. In this study, the CEMS integrates three key filtering components, as shown in Figure 3: a notch filter for suppressing industrial frequency interference at 50 Hz (Figure 3a), a fourth-order linear-phase low-pass filter with a cutoff frequency f c = 100   Hz to eliminate high-frequency noise (Figure 3b), and a fourth-order linear-phase high-pass filter with a cutoff frequency f c = 100   Hz to remove baseline drift (Figure 3c). These filters effectively suppress various types of noise while preserving the critical features of the ECG signal, thereby enabling high-quality ECG acquisition.
The frequency response of the filter circuit is illustrated in Figure 4. It exhibits passband characteristics within the ranges of 0.05–50 Hz and 50–100 Hz, while effectively attenuating signals in the remaining frequency bands. Notably, the notch filter demonstrates a pronounced suppression effect at 50 Hz, achieving a gain of −40.9 dB, which efficiently eliminates industrial frequency interference and ensures high-quality acquisition of the user’s ECG signals.

2.3. Classification Model for Exercise Intensity Assessment

Appropriate exercise intensity is essential for achieving effective outcomes during daily physical activity. In this study, we developed an exercise intensity assessment model that integrates heart rate metrics based on target heart rate (THR) theory with heart rate variability (HRV) indicators to reflect autonomic nervous system activity. The model utilizes high-quality ECG signals collected by the CEMS. By simulating varying exercise intensities through different activity durations across users, we evaluated exercise intensity using temporal and frequency domain features extracted from the ECG signals, achieving accurate classification and assessment.

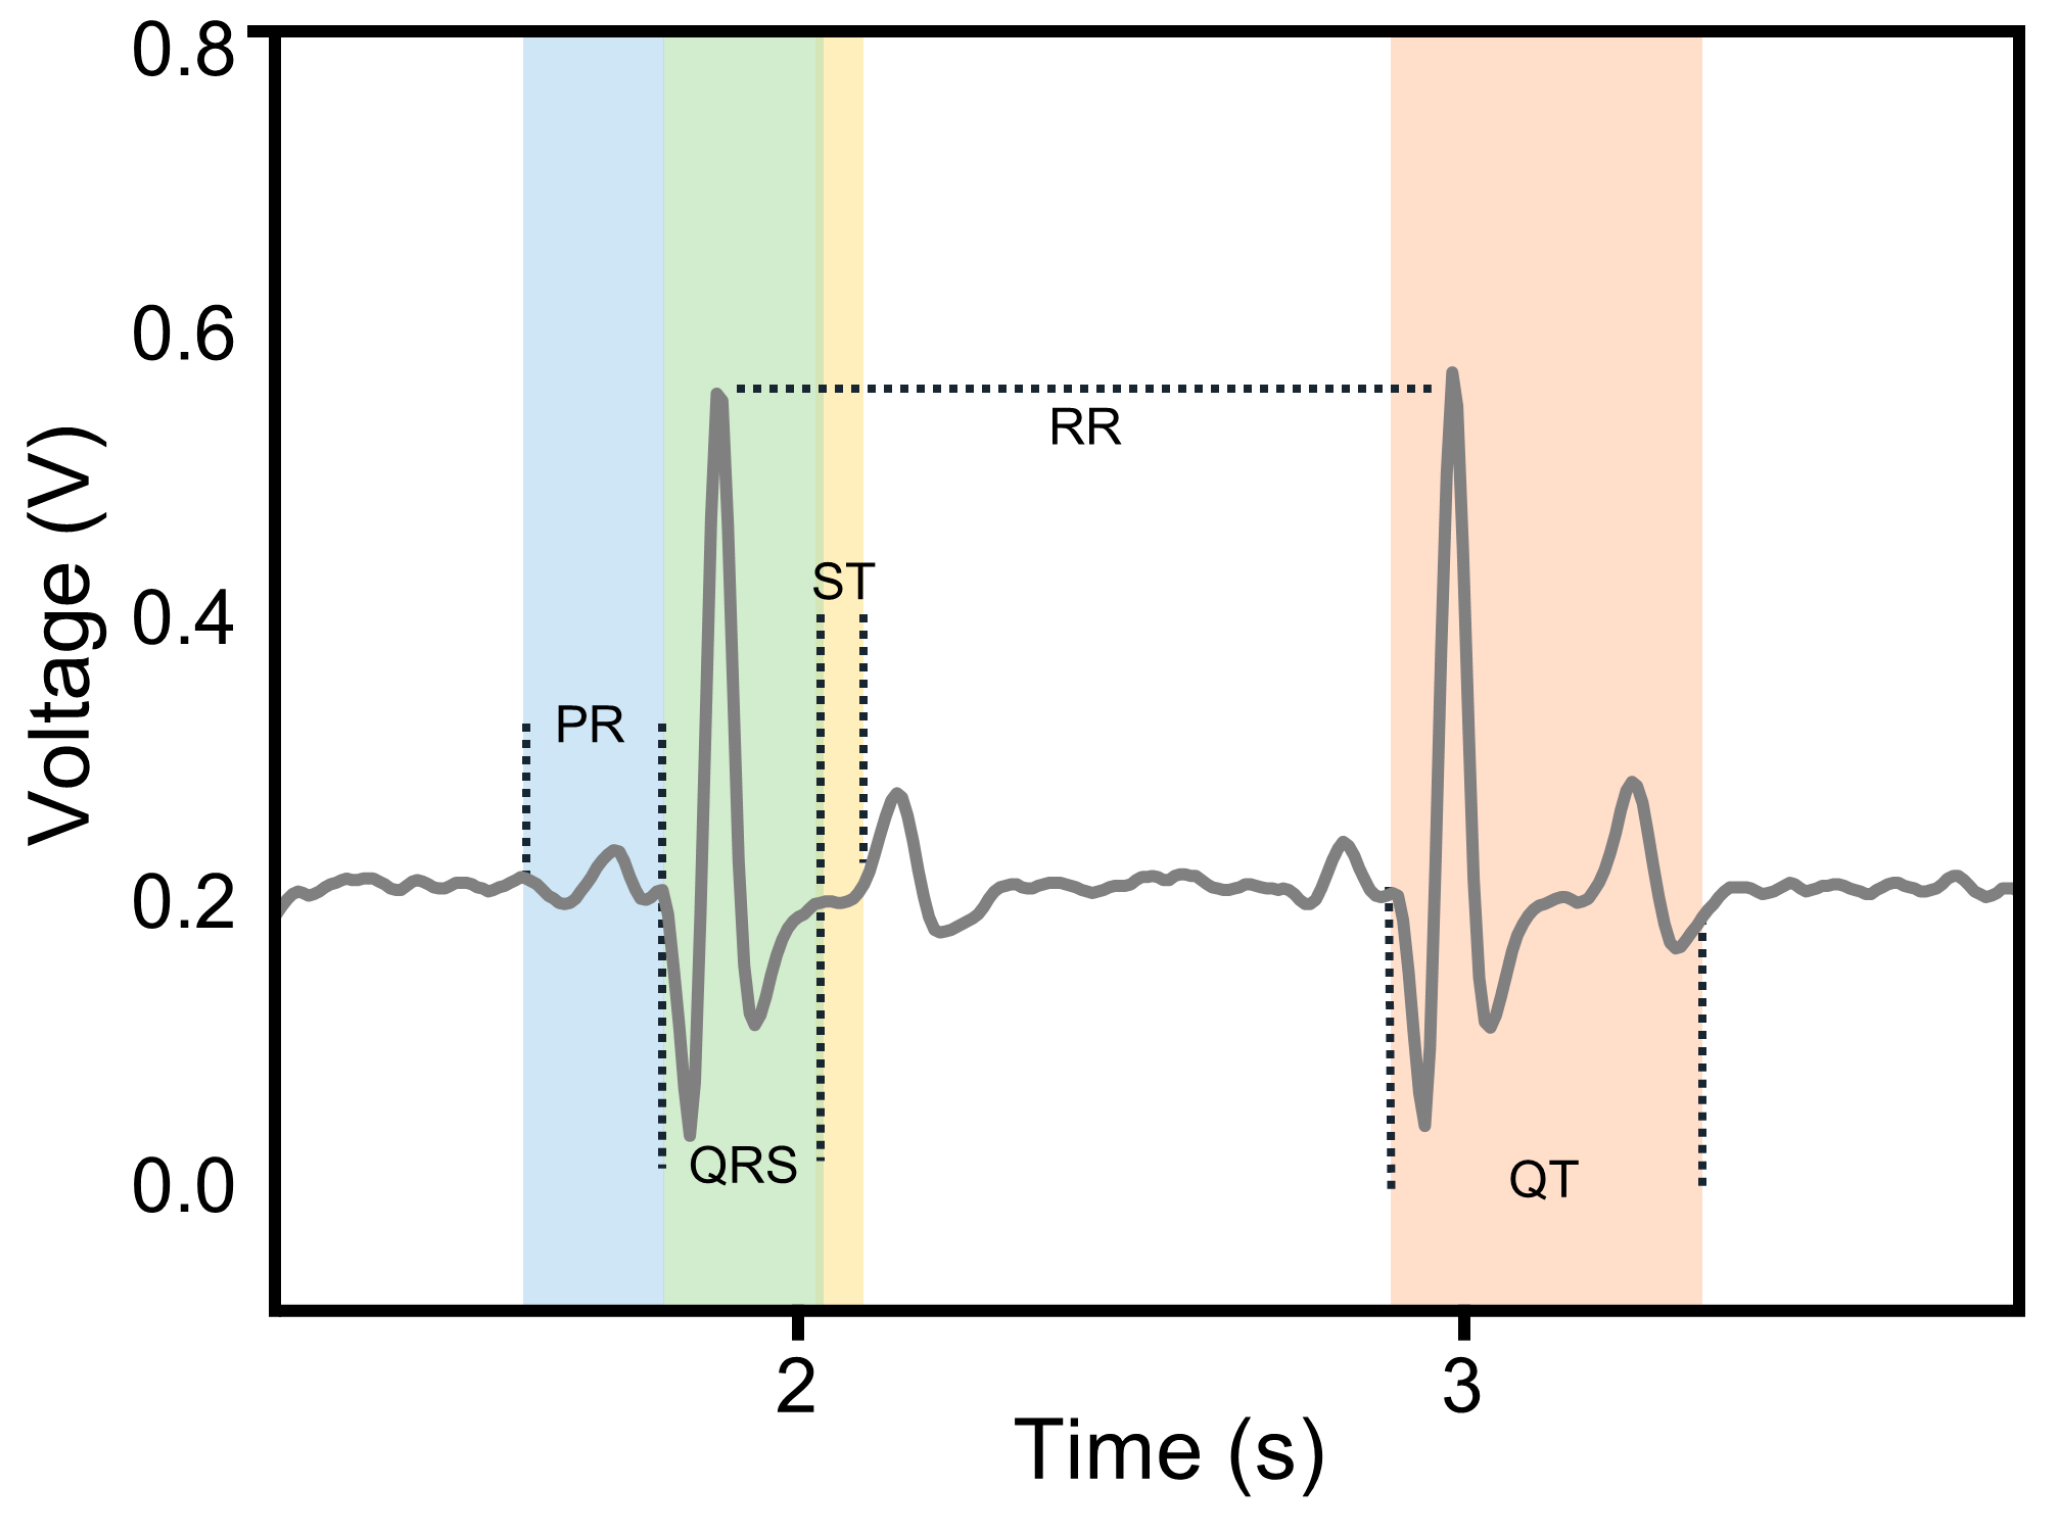
2.3.1. Theoretical Basis of Feature Extraction

As illustrated in Figure 5, a typical ECG cycle comprises several characteristic waveforms, including three primary components: the P wave, the QRS complex, and the T wave. The voltage amplitudes and time phase parameters of these waveforms serve as quantitative indicators for ECG signal analysis. In this study, five time domain features, including P-wave to R-wave (PR) interval, S-wave to T-wave (ST) segment, R-wave to R-wave (RR) interval, Q-wave to T-wave (QT) interval, and QRS duration, were extracted and used as part of the input features for model training [40].
In addition, HRV reflects the subtle fluctuations in the time intervals between consecutive heartbeats and serves as a key indicator for evaluating the autonomic regulation of cardiac rhythm [41,42]. In time domain analysis, HRV is commonly characterized by parameters such as the standard deviation of normal-to-normal intervals (SDNN), the root mean square of successive differences (RMSSD), and heart rate (HR). In this study, SDNN was selected as the primary metric to represent HRV [43], and it was calculated as follows:
S D N N = 1 N 1 i = 1 N T R R i μ
where T R R i represents the RR interval and μ denotes the arithmetic mean of all RR intervals.
Since time domain analysis provides limited differentiation between the regulatory roles of the sympathetic and parasympathetic nervous systems, this study further explores the frequency-domain characteristics of the individual ECG signals. The analysis includes the low-frequency (LF) component (0.04 Hz–0.15 Hz), which corresponds to sympathetic activity, and the high-frequency (HF) component (0.15 Hz–0.4 Hz), which reflects parasympathetic activity [44]. These components are calculated as follows:
L F = f 0.04 , 0.15 P f
H F = f 0.15 , 0.4 P f
where P ( f ) is the power density spectrum of the preprocessed ECG signal, which is calculated as follows:
P f = F F T x t 2 L
where x ( t ) is the time series signal obtained by interpolating the RR interval sequence from the continuous ECG signal, which responds to the trend of heart rate over time, and L is the length of the sequence.

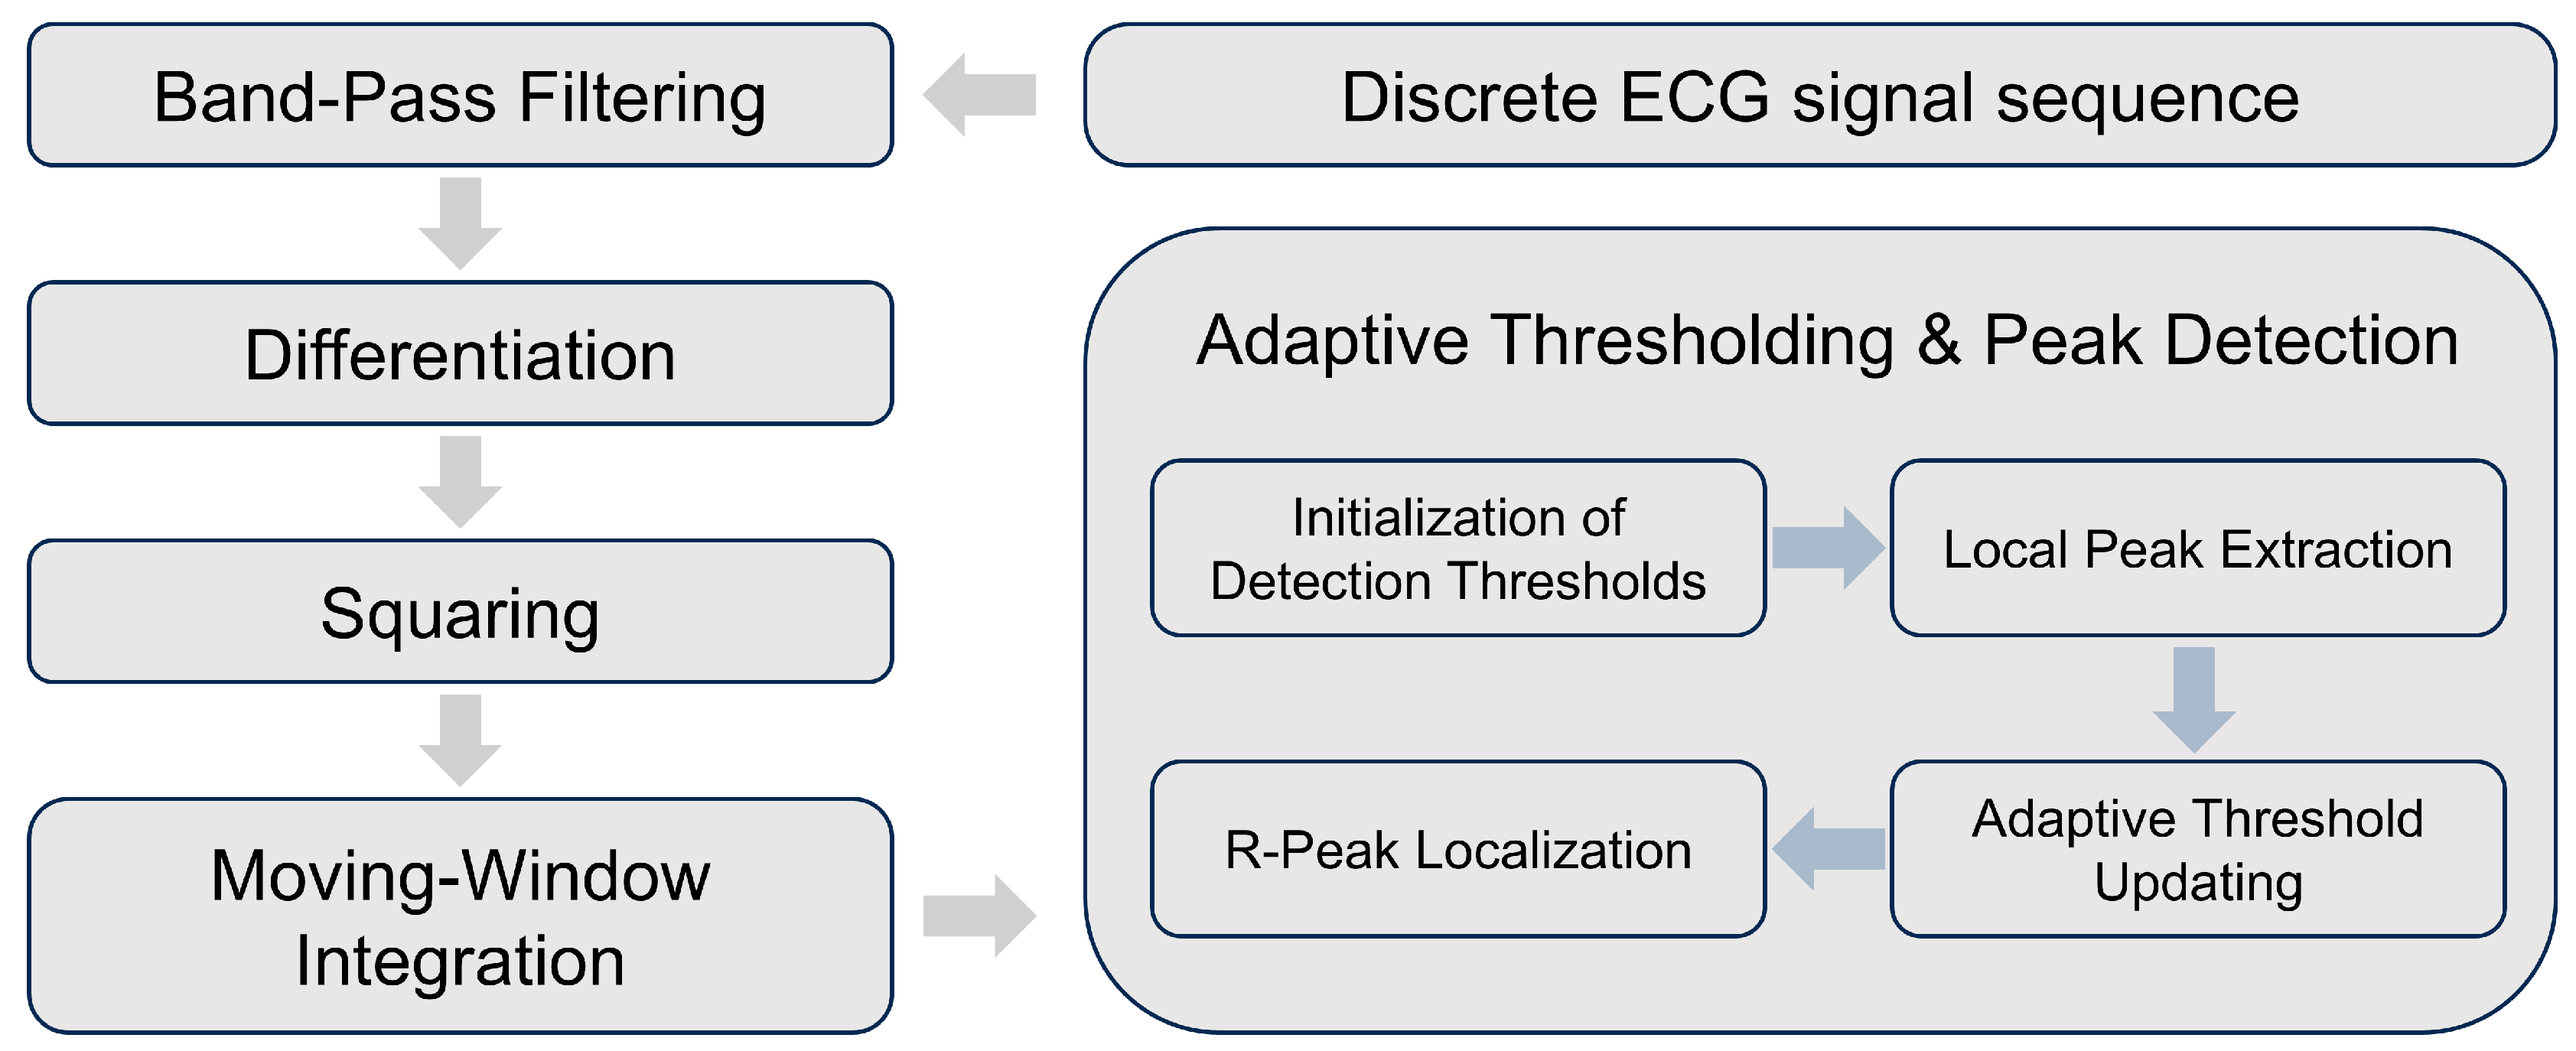
2.3.2. The Calculation of the Positions of Time Domain Feature Waves in ECG Signals

ECG signals contain numerous and densely distributed time domain feature waves, making it challenging to identify each wave type individually and determine their precise positions. However, since the relative positions of these feature waves remain consistent across cycles, this study employs an R-wave localization approach to identify the time-domain features of ECG signals:
  • Apply a first-order derivative to the filtered ECG time series signal. The zero-crossing points of the derivative sequence are used to locate all characteristic waves.
  • Use the Pan–Tompkins algorithm to identify the R-wave positions within the signal.
  • Treat each R-wave as a reference point and determine the positions of the other feature waves in each cardiac cycle based on their relative locations to the R-wave.
The Pan-Tompkins algorithm is an adaptive R-wave detection method that maintains a low false detection rate, even when R-wave amplitudes fluctuate [45]. Its process is illustrated in Figure 6. By applying a dynamic threshold to the moving window integral of the signal and updating this threshold in real time, the algorithm identifies candidate R-peaks that exceed the threshold. It then searches within a specified window in the original signal to locate the highest value among the candidates and confirms it as the true R-peak. The algorithm then proceeds to search for the next R-peak in the following cycle.

2.3.3. Dataset Preparation

To obtain the test data, the subjects ran at a constant speed for 30 min, and the ECG signals of the subjects at 0, 10, 20, and 30 min of exercise were measured using the CEMS and saved. The test results are shown in Figure 7, where the changes in exercise time are observed: the waveform of their ECG signals displayed significant variability, and the amplitude of their Fourier transform spectra gradually increased. This indicates that as the exercise time progressed, the subject’s nervous system became increasingly active.

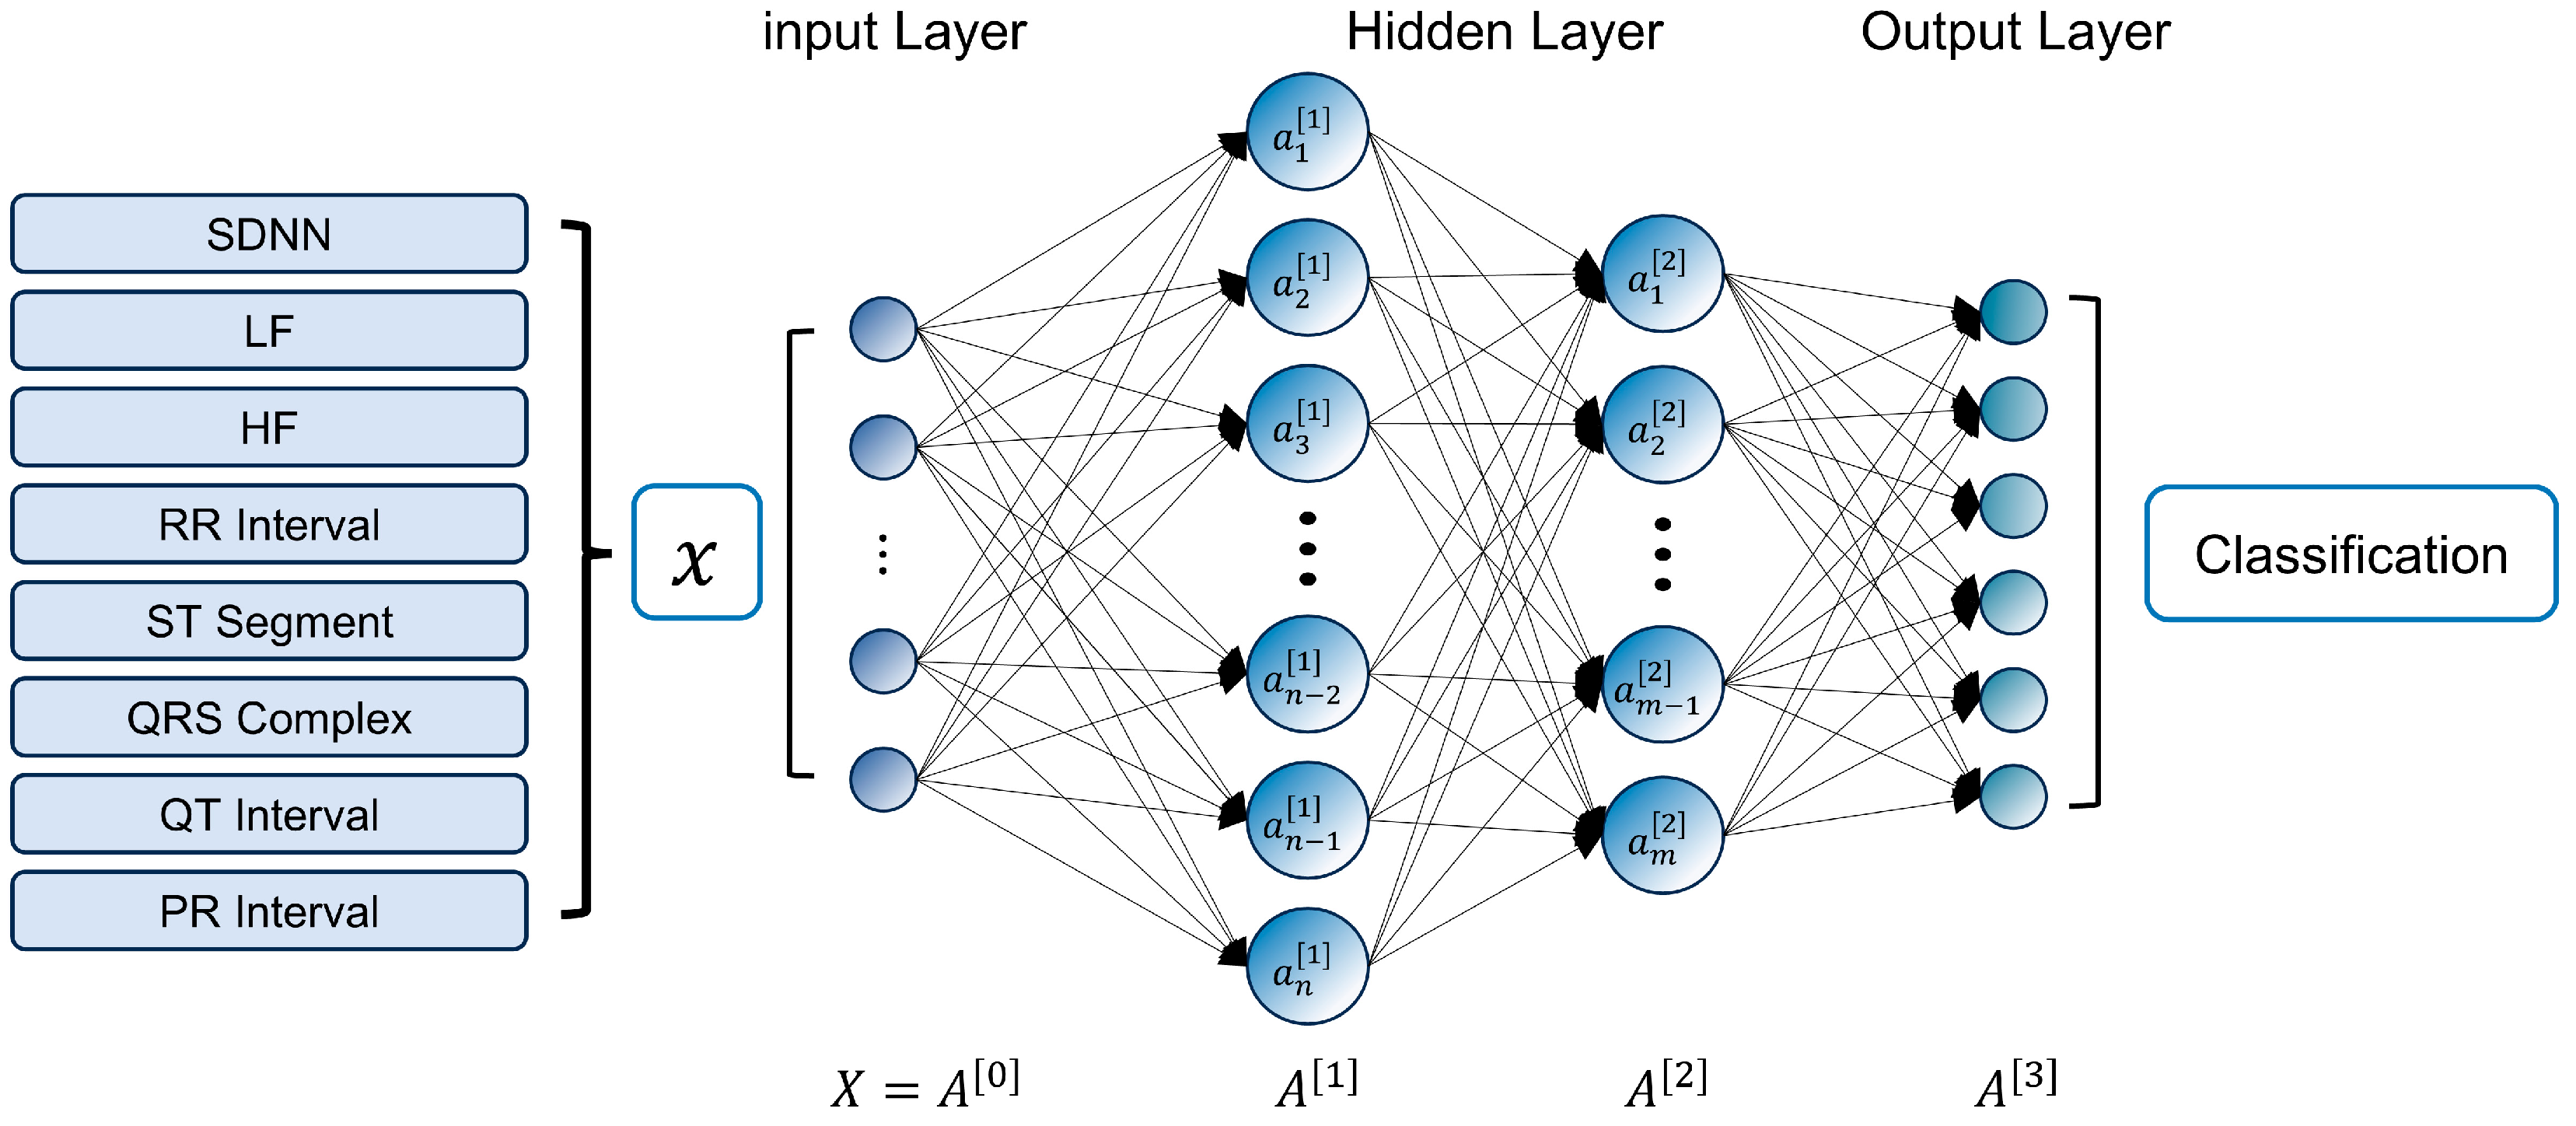
2.3.4. Neural Network Framework Employed

In this study, the eight ECG signal features mentioned above are used as inputs to build a classification model based on the fully connected neural network (FCNN) algorithm, as shown in Figure 8. The FCNN is a classical deep learning model, where all neurons in adjacent layers are globally connected through a weight matrix, and the network parameters are optimized using the back-propagation (BP) algorithm. Unlike a CNN, which focuses on spatially localized feature extraction [46], FCNN achieves nonlinear combinatorial mapping of features through a densely connected layer structure (comprising the input, hidden, and output layers). This structure allows FCNN to offer advantages such as fast fitting speeds and high accuracy, particularly in solving low-dimensional nonlinear classification problems [47].

3. Experimental Section

3.1. Impedance Testing

The interface impedance between each bioelectrode and the subject’s skin was measured with an impedance analyzer (WK6500, Wayne Kerr Electronics, Bognor Regis, UK) to evaluate the electrode’s ability to capture physiological electrical signals and thus ensure high-quality recordings. The measurement protocol was as follows:
  • Skin preparation: The skin on the volunteer’s forearm was cleaned with ethanol to remove surface oils and contaminants.
  • Electrode placement: Two bioelectrodes, each having the same contact area, were affixed to the skin at a fixed inter-electrode distance.
  • Circuit configuration: Metallic leads were attached to each electrode and connected to the two terminals of the impedance analyzer, thereby forming an electrode-skin-electrode measurement circuit.
  • Frequency sweep: The analyzer was programmed to perform a frequency sweep from 20 Hz to 100 kHz, and the impedance spectrum was subsequently recorded.

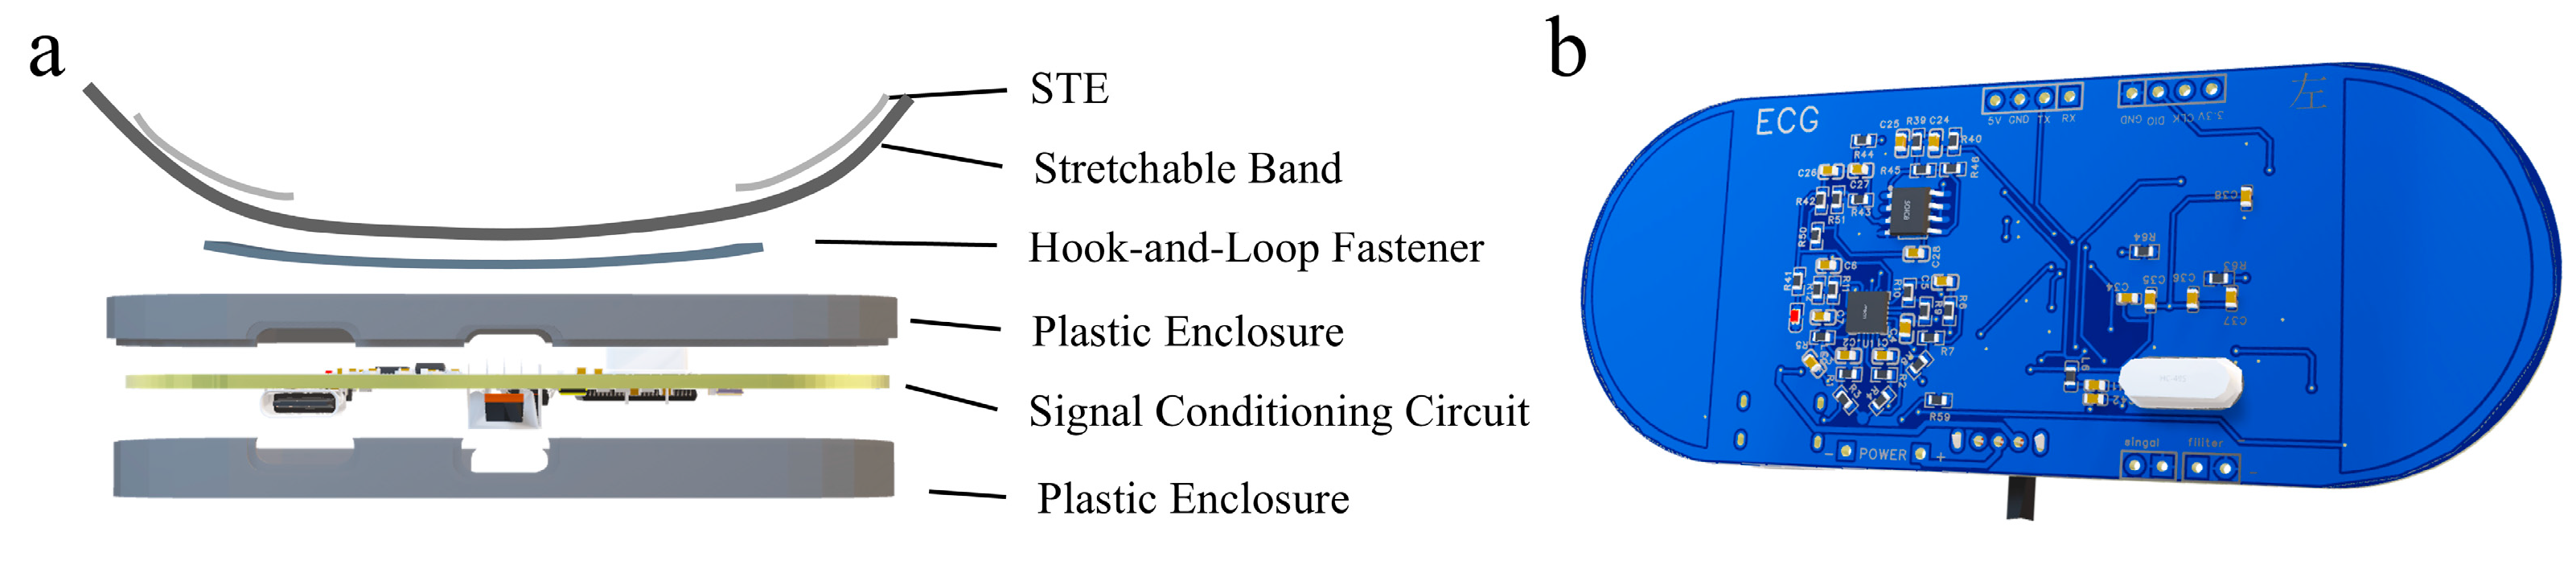
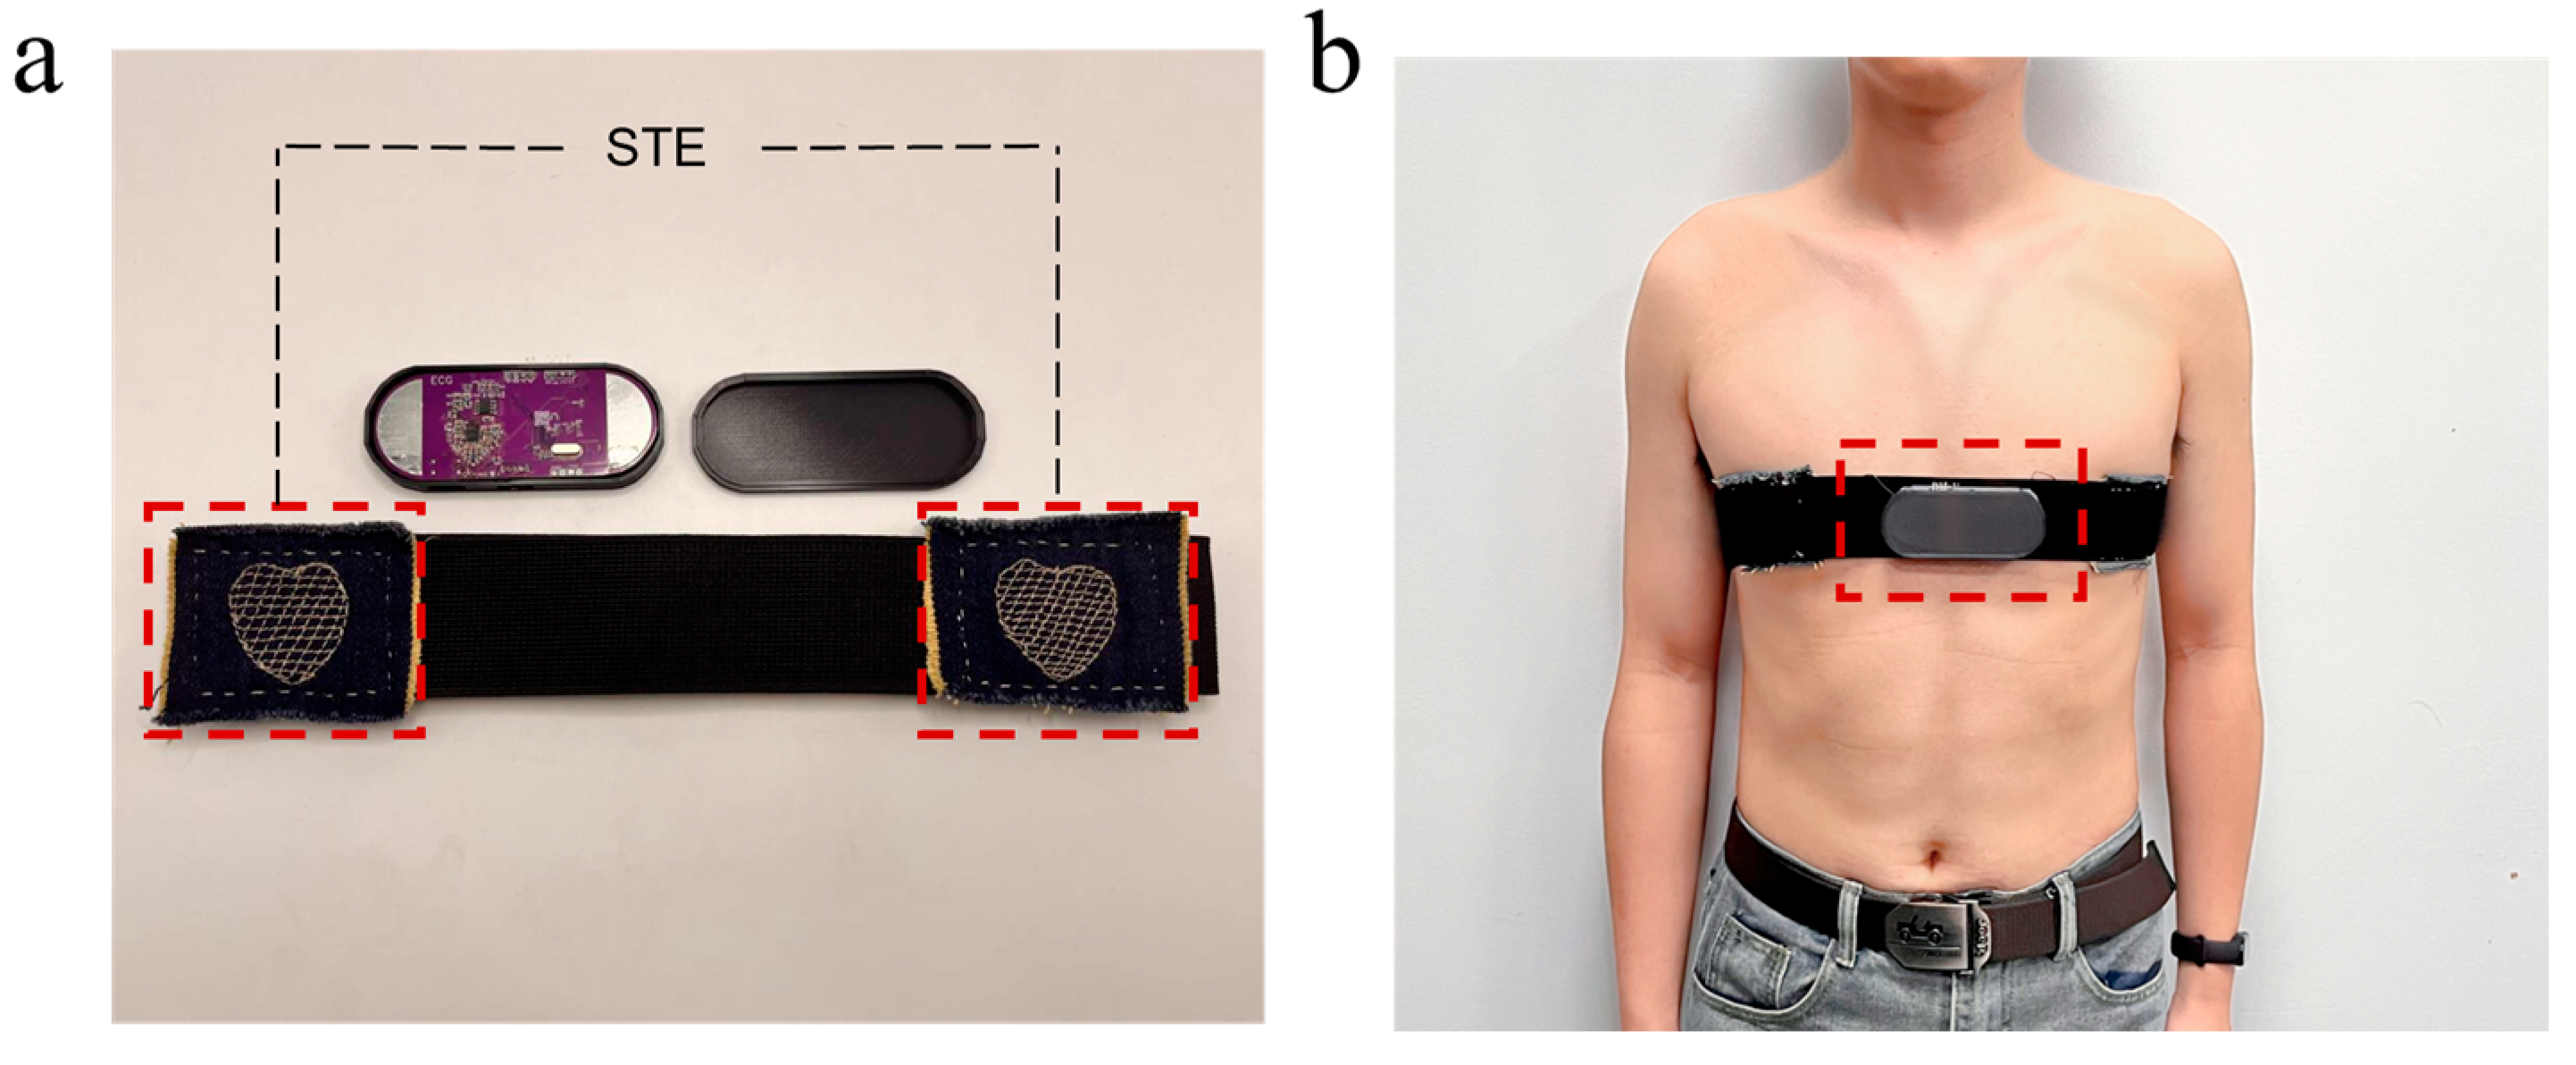
3.2. The Composition of the CEMS

The CEMS is powered by a 3.7 V lithium battery. Voltage regulation and charge management are handled by the LGS5500EP (Legend-Si, Shenzhen, China) chip, which boosts and stabilizes the battery’s 3.7 V output to 5 V, ensuring reliable operation of the filtering circuitry and enabling system reusability. A ME6206 (Microne Semiconductor Co., Ltd, Nanjing, China) low-dropout linear regulator (LDO) then delivers a stable 3.3 V rail to the STM32F407VET6 (STMicroelectronics, Geneva, Switzerland) microcontroller, the ECB02 Bluetooth module, and the W25Q64 (Winbond Electronics Corporation, Taiwan, China) serial flash memory. The filter stage employs the GS8552-SR (Gainsil Semiconductor Technology Co., Ltd., Shanghai, China) precision operational amplifier, whose ultra-low quiescent current of just 180 µA satisfies the system’s stringent low-power and miniaturization requirements.

4. Results and Discussion

4.1. Structure and Performance Test for the STE

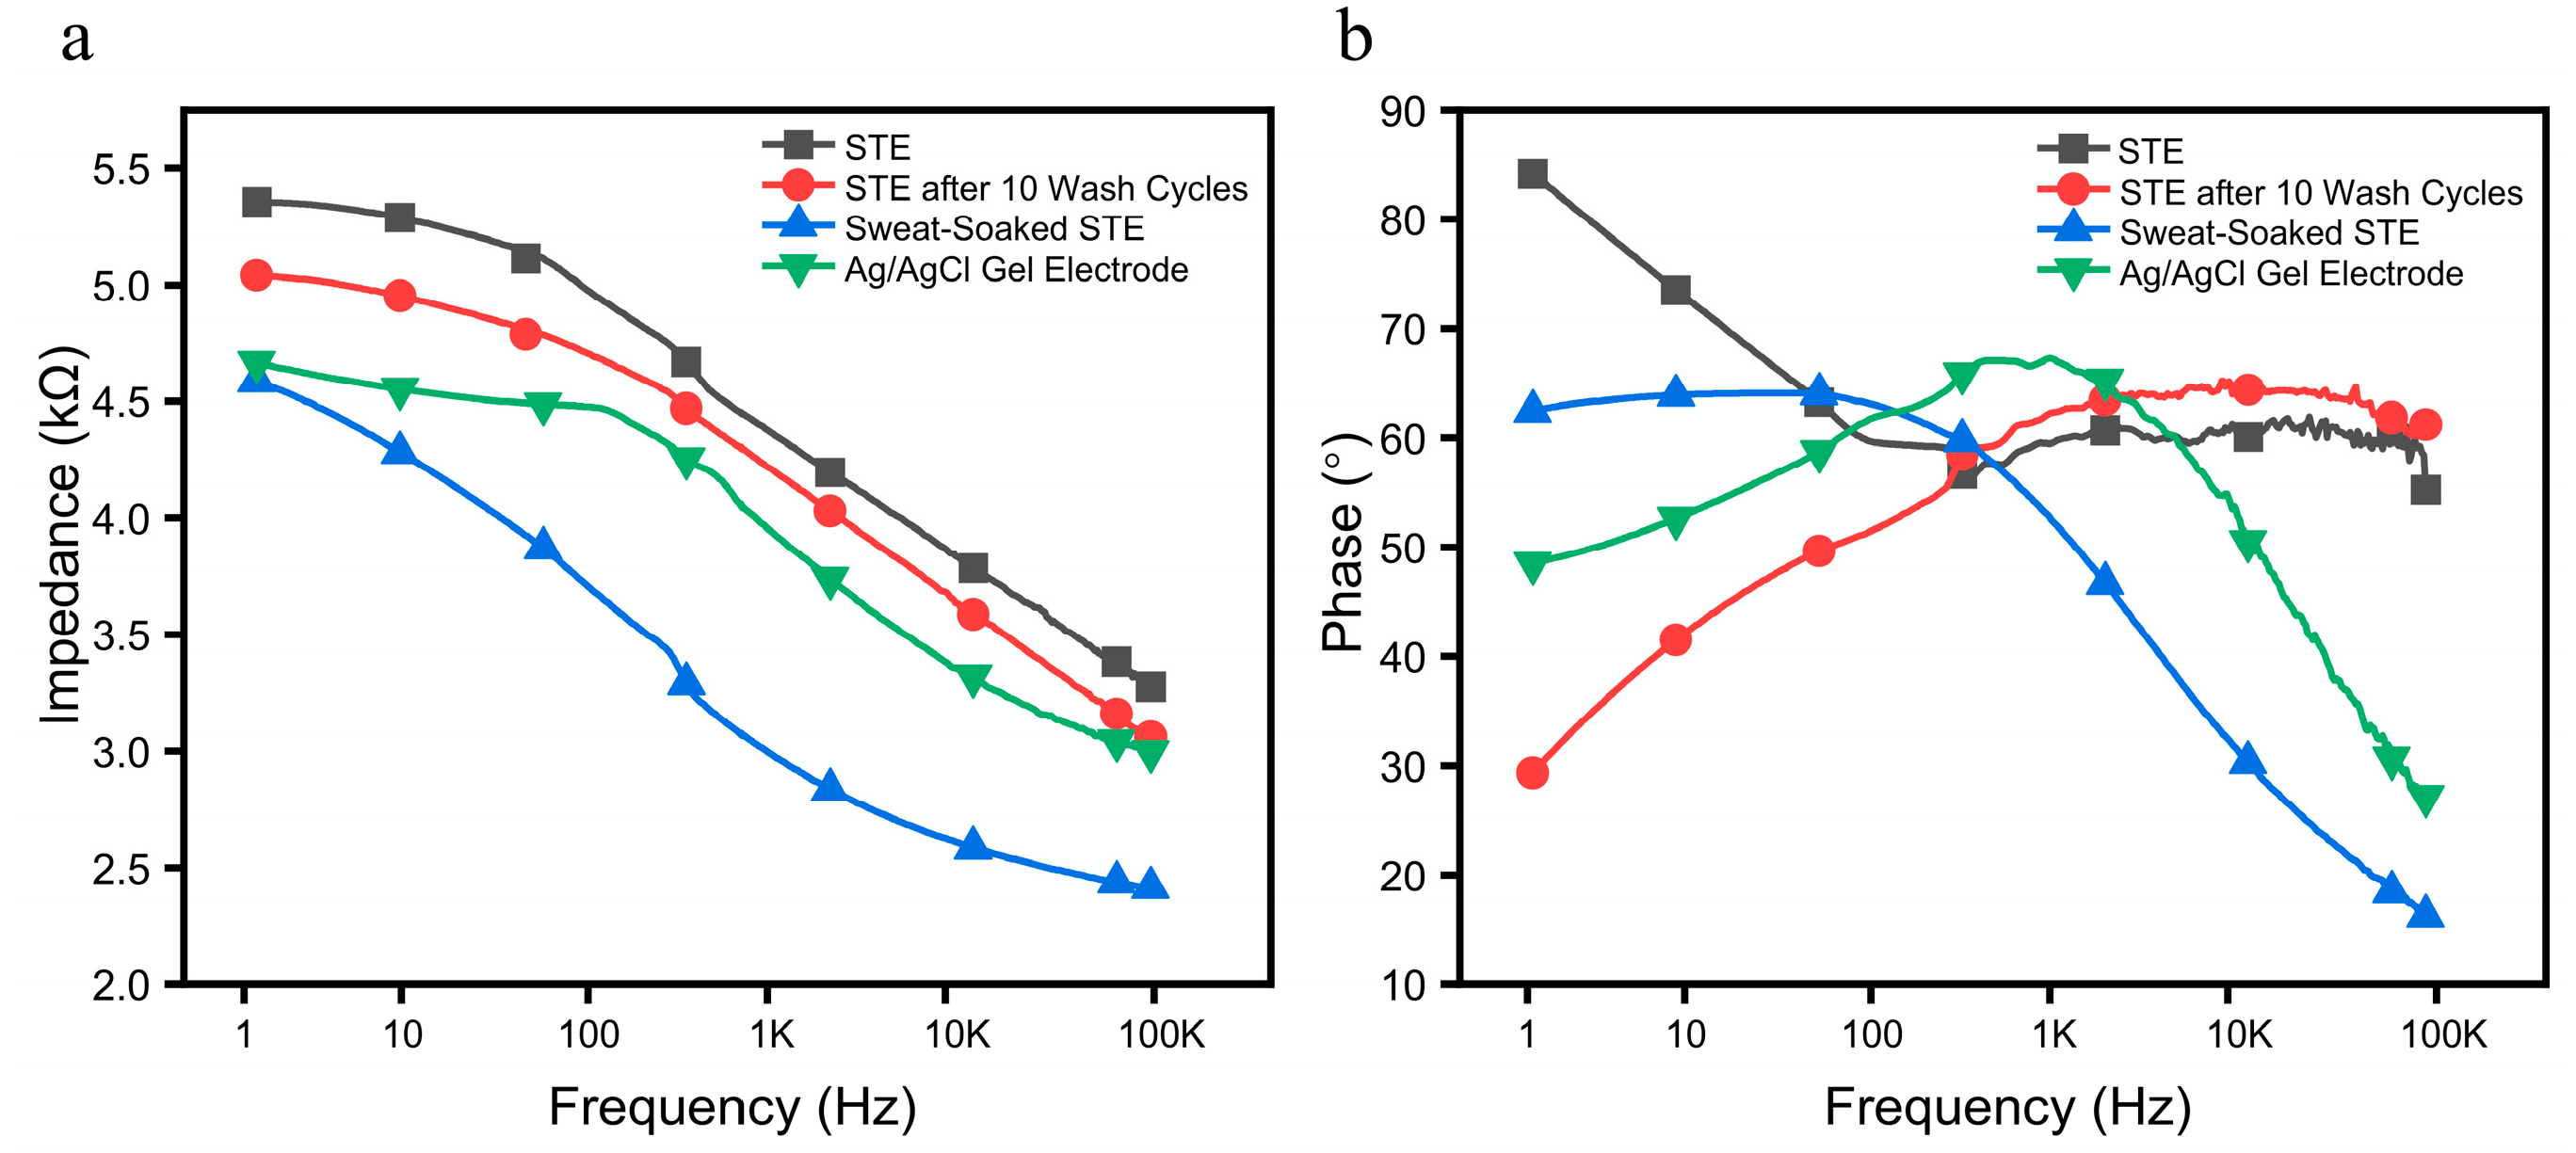
4.1.1. Introduction and Impedance Evaluation for the STE

During exercise, the human body produces a substantial amount of sweat. The commercial Ag/AgCl gel electrodes are poorly ventilated, making them unsuitable for perspiration. Prolonged use can lead to skin irritation and allergic reactions. To address this issue, the STE shown in Figure 9b was fabricated using machine weaving, with silver-coated polyamide yarn (a commercially available conductive thread composed of polyamide fibers uniformly coated with metallic silver, with approximately 18 wt% silver content, manufactured by THINKER, Qingdao, China; see Figure 9a) as the conductive element and common denim fabric (cotton fiber) as the substrate. The conductive yarn is a ready-to-use, off-the-shelf product and is readily available via standard laboratory procurement channels. This textile-like bioelectrode offers excellent breathability and sweat absorption, providing high wearing comfort for daily ECG monitoring.
To evaluate the performance of the STE as a bioelectrode, impedance measurements were conducted using an impedance analyzer to compare the electrode-skin contact impedance of the Ag/AgCl gel electrodes and the STE under various conditions. Two identical electrodes were placed 10 cm apart on the lateral side of the subject’s right arm and connected to the impedance analyzer to form a loop [48]. Detailed experimental procedures are described in the Experimental section. To assess the long-term stability and environmental adaptability of the STE, the following test conditions were applied using the same method:
  • Sweat corrosion simulation: The STE was moistened with 0.9% NaCl solution to simulate sweating during physical activity.
  • Mechanical durability test: The STE underwent 10 complete wash-dry cycles using commercially available neutral detergents without bleach.
The measured impedance and phase angle characteristics under different conditions are presented in Figure 10a,b. The STE exhibited slightly higher baseline contact impedance than the Ag/AgCl gel electrode due to its limited dielectric properties. However, after physical activity, the absorption of sweat, containing water and inorganic ions, significantly improved its conductivity, reducing the contact impedance with the skin. Experimental results indicate that the STE outperforms the Ag/AgCl electrode in conductivity following exercise. Furthermore, even after multiple wash cycles, the STE maintained low contact impedance, demonstrating excellent durability. Overall, the STE is flexible, sweat-resistant, and highly durable, making it a promising candidate for wearable physiological signal monitoring systems.

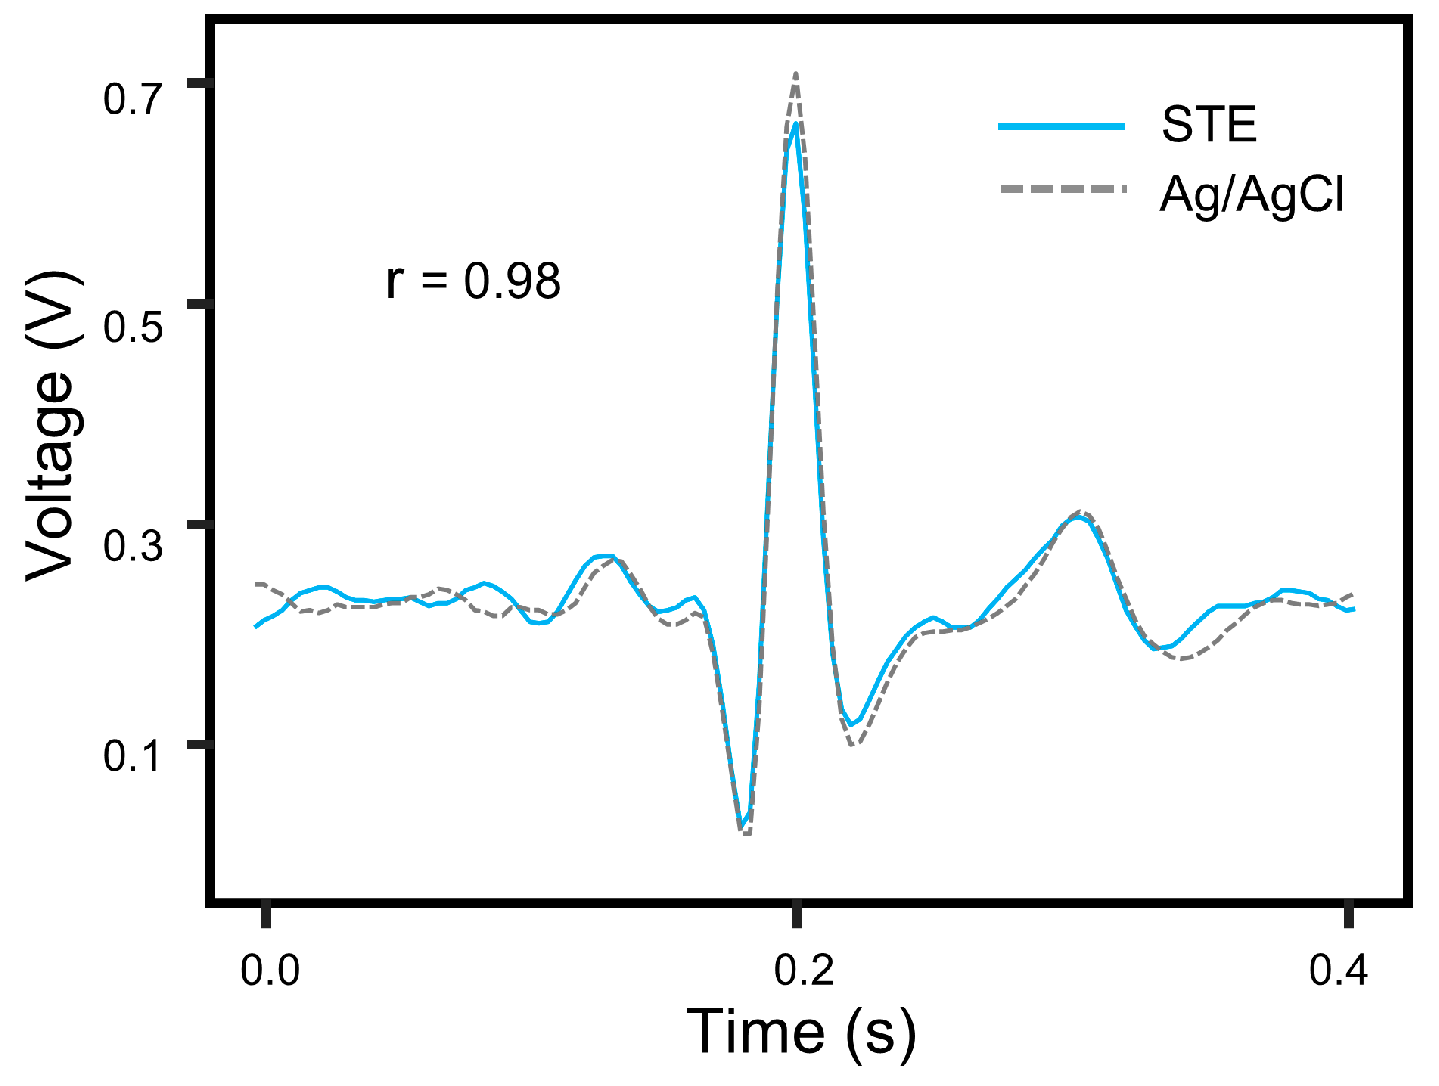
4.1.2. The Signal Monitoring Comparison of the STE and AgCl/Ag Gel Electrodes

To further assess the performance of the STE in ECG signal acquisition, we conducted a comparative experiment using commercial Ag/AgCl gel electrodes as a reference.
ECG waveforms were collected separately using the STE and the commercial electrodes within a short time interval, ensuring consistent experimental conditions. Both sets of signals were acquired through the same signal conditioning circuit. From each acquisition, one representative cardiac cycle was extracted for analysis. A Pearson correlation analysis was then performed on the two signal sets, yielding a correlation coefficient of R = 0.98 (Figure 11), indicating a high degree of similarity between the signals obtained from the two electrode types. This result highlights the effectiveness of the STE in accurately capturing physiological signals and suggests its potential as a viable alternative to commercial Ag/AgCl gel electrodes.

4.2. System Evaluation

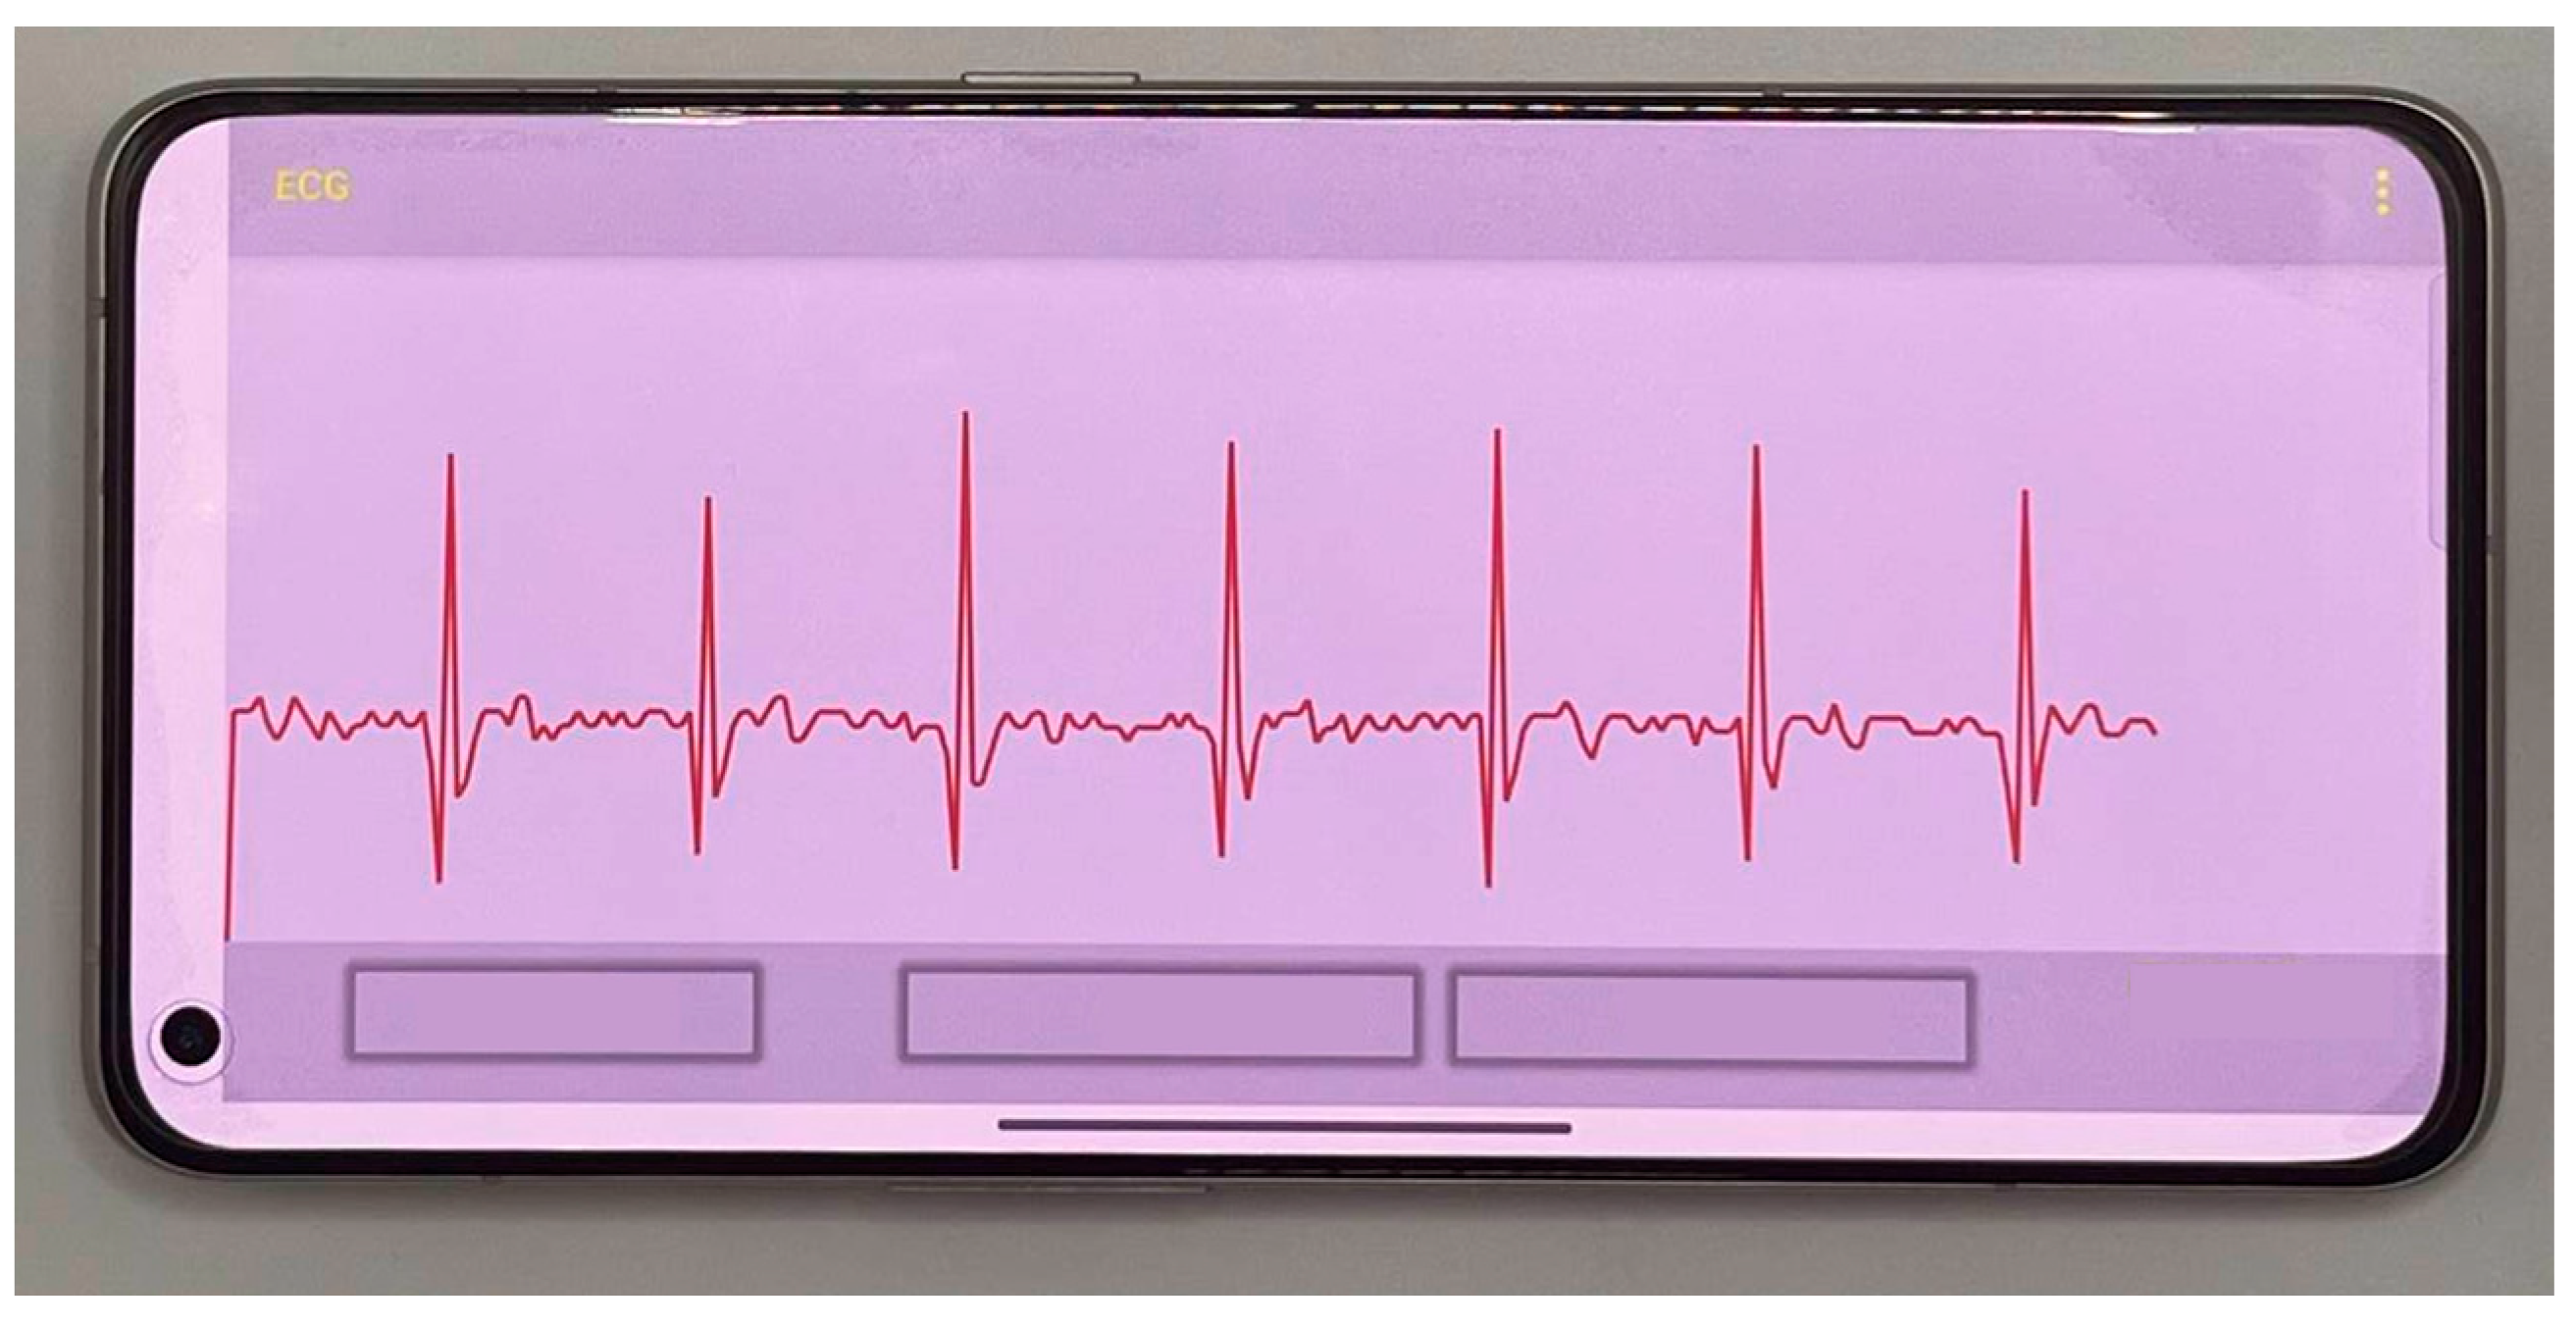
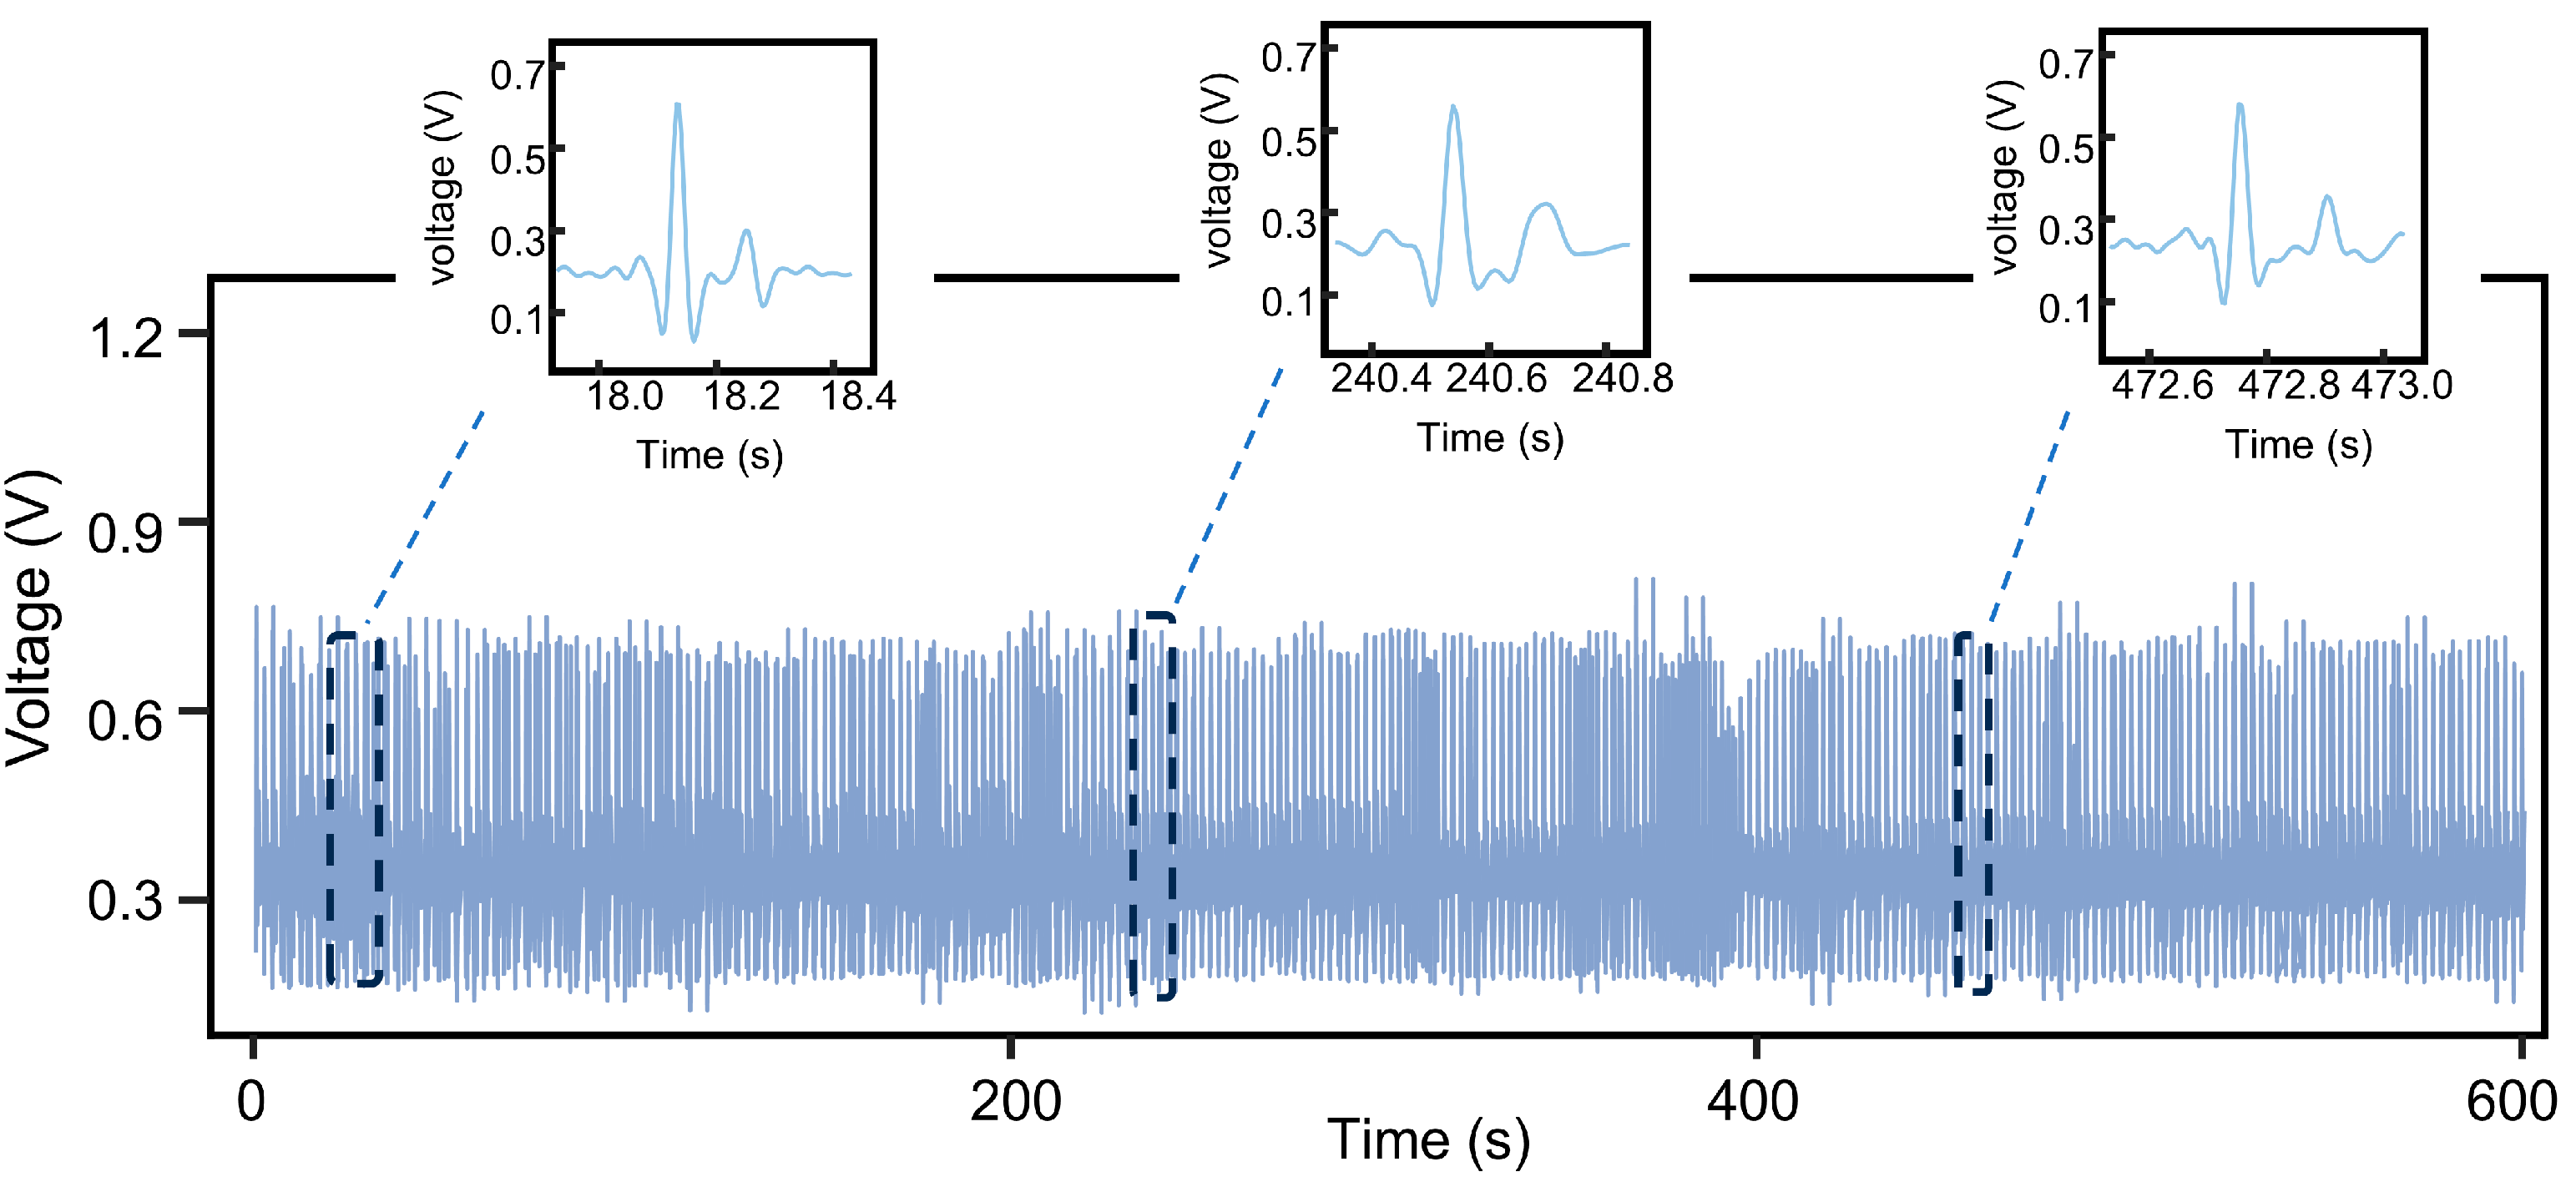
4.2.1. Assessment of the Monitoring Stability of the CEMS

Traditional ECG monitoring devices often impose physical constraints that hinder users’ daily activities, significantly compromising user comfort. As shown in Figure 12a, the physical structure of the CEMS addresses this limitation. The STE is sewn onto the inner surface of an elastic band, enabling direct contact with the skin to facilitate ECG signal acquisition. The embedded system circuit board responsible for signal processing is housed in a compact plastic enclosure and is attached to the elastic band via Velcro, as illustrated in Figure 12b. The high flexibility of the STE ensures comfortable wearability, while the miniaturized design of the system allows users to wear it unobtrusively even during exercise. The subject’s ECG signals are transmitted from the skin surface to the CEMS via the STE. After passing through the filtering circuitry, the signals are acquired by the MCU and subsequently transmitted to a mobile device via a Bluetooth module (Figure 13), enabling users to observe and analyze the data in real time.
To evaluate the monitoring stability of the CEMS, a continuous testing experiment was conducted on subjects for over 600 s under a low-activity state. The results are presented in Figure 14. Throughout the test, the circuit operated continuously without interruption. The amplitude decay of the subject’s ECG signal was less than 0.08 V, and the standard deviation of the RR interval, a key ECG characteristic parameter, was 0.189 s. Additionally, the system successfully captured complete characteristic waveforms of the subject’s ECG signals. These results demonstrate that the CEMS exhibits excellent stability and is capable of providing reliable ECG monitoring during daily activities.

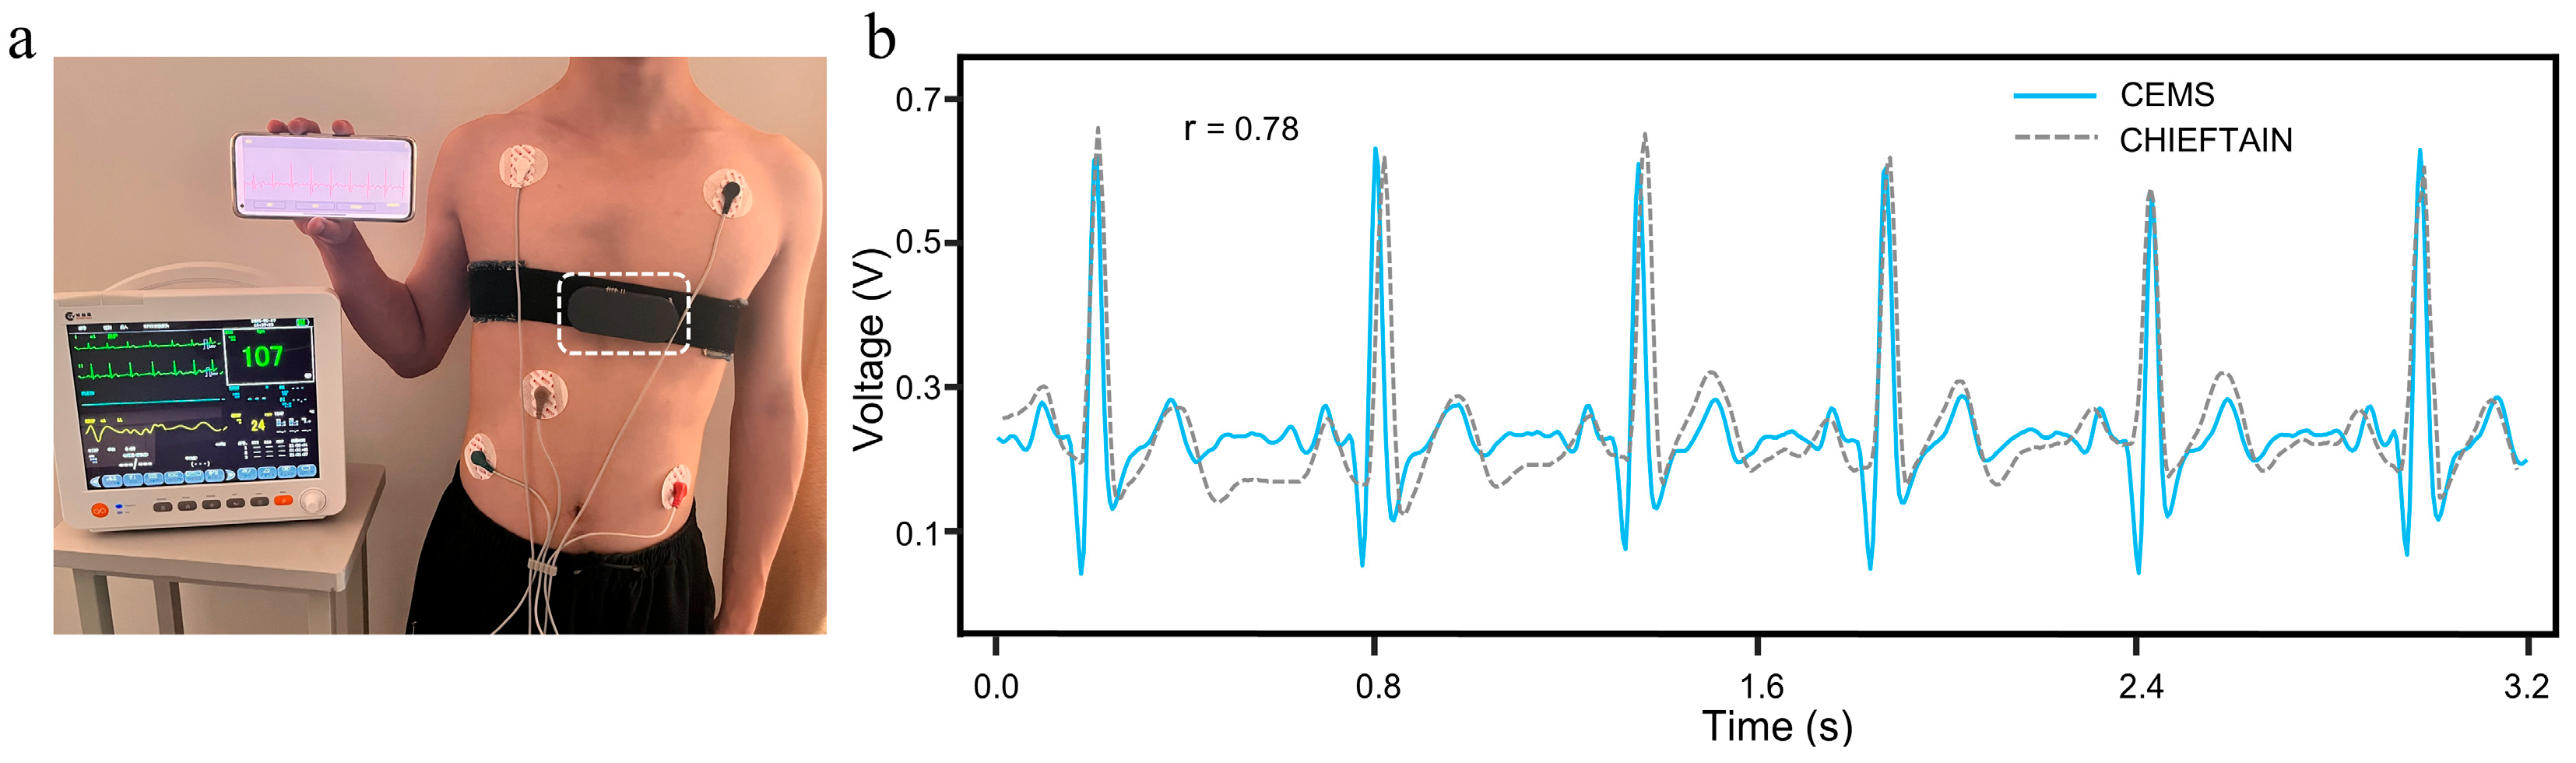
4.2.2. Comparison Between the CEMS and a Commercial ECG Monitoring Device

To further validate the accuracy of ECG signals acquired by the CEMS, we conducted a comparative experiment using the PM12B multi-parameter patient monitor (CHIETAIN, Changsha Innovo Medical Technology Co., Ltd., Changsha, China) as the reference device.
The subject simultaneously wore both the CEMS and the PM12B (Figure 15a), enabling synchronous ECG data acquisition under identical physiological conditions. Correlation analysis and waveform feature comparison between the two signal sets indicated that (Figure 15b), although slight morphological differences were observed, primarily due to variations in lead configurations, the positions of key characteristic waves remained highly consistent. The Pearson correlation coefficient of 0.78 confirmed a strong correlation between the two devices. In addition, the mean RR interval difference of 0.015 s and PP interval difference of 0.012 s further supported the high accuracy of the CEMS in ECG monitoring.

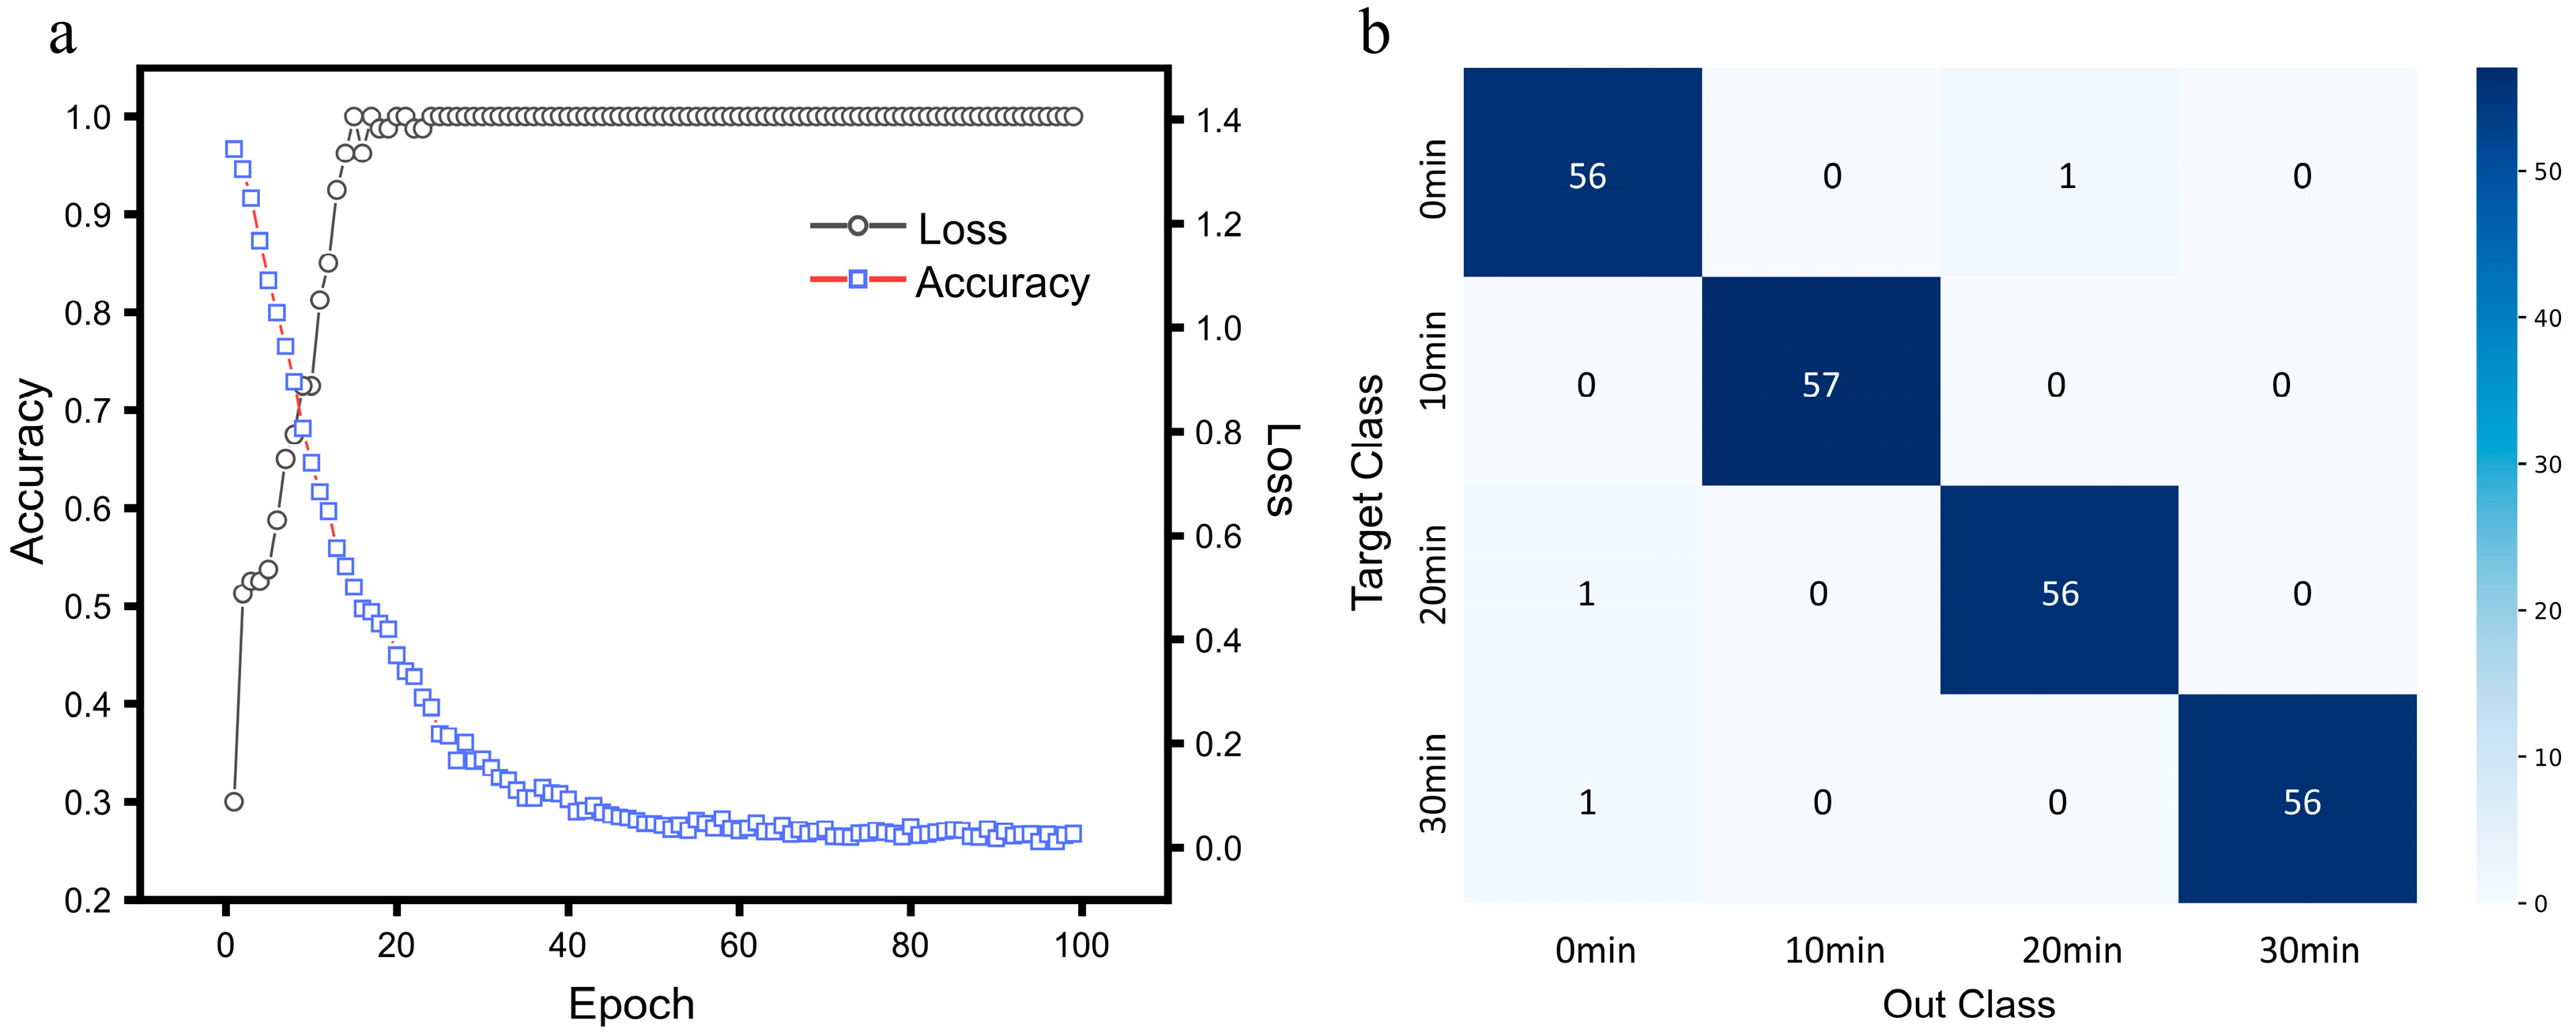
4.3. Model Training and Evaluation

In this study, two hidden layers containing ReLU activation functions were setup, with 12 neurons in the first hidden layer and 8 neurons in the second hidden layer. For the experiment, a stratified sampling method was used: 70% of the original dataset was allocated to the training set, 30% to the testing set, and 20% of the training set was further divided into a validation set. The datasets were independent of each other, without duplication. During training, the cross-entropy loss function was employed as the optimization objective function, and parameters were updated using the Adam adaptive optimizer. The learning rate was set to 0.005, and the Dropout layer discard ratio was set to 0.1. After 100 epochs of training, the FCNN model exhibited stable convergence characteristics. The change curves of the loss rate and accuracy are shown in Figure 16a, where the loss function values for the training set showed a monotonically decreasing trend, and the classification accuracy of the validation set stabilized at about 98.7%. To quantitatively evaluate the classification performance of the model, Figure 16b presents the confusion matrix for the test set, showing the classification of each example in the test set. The model demonstrated high classification accuracy and good overall performance.

4.4. Comparison Between the CEMS and Similar ECG Monitoring Products

To further assess the innovation and practicality of the CEMS, we conducted a comparative analysis of several advanced chest strap ECG monitoring devices currently available on the market. Key aspects such as electrode materials, system portability, and sweat resistance as summarized in Table 1.
Although commercial ECG monitoring systems now provide reliable signal quality, they still face limitations in portability, wearing comfort, and resistance to sweat.
As shown in the comparison, the reusable and washable STE used in the CEMS, comprising silver-coated polyamide yarn interwoven with a cotton fiber base, exhibits exceptional sweat resistance. Even during high-intensity physical activity or heavy sweating, the STE retains excellent breathability and adheres securely to the skin, effectively preventing detachment, contact instability, or signal degradation. Its soft, flexible structure also ensures enhanced skin comfort compared to metal electrodes embedded in an elastic band, such as the metal-based designs used in the CHILEAF system, which may exert localized pressure. Moreover, unlike the disposable ECG electrodes used in EkgMove, which require frequent replacement due to reduced adhesion and breathability, the STE offers durable reusability without sacrificing performance. In terms of portability, the thin, flexible, and detachable design of the CEMS electrode allows for easy cleaning and unobtrusive integration into daily wear. In contrast, systems such as Underwear with 12 channels adopt an embedded undergarment structure that, while mechanically stable, increases device bulk and wiring complexity, thereby reducing portability and user convenience.
In summary, the CEMS demonstrates strong potential for application in portable wearable ECG monitoring due to its comprehensive advantages in sweat resistance, wearing comfort, and portability.

5. Conclusions

In this work, we propose a wearable ECG monitoring system utilizing cotton fiber cloth sewn with silver-coated polyamide yarn as bioelectrodes. The CEMS is specifically designed to overcome the limitations of conventional ECG monitoring devices, which often restrict users’ daily activities. The system offers an effective solution for the continuous monitoring of ECG signals during various daily activities while also serving as a tool for assessing exercise intensity. The CEMS features a chest strap design, which allows it to be comfortably worn on the human body and ensures accurate ECG signal capture without hindering the user’s movement. The built-in high-efficiency filter effectively removes various sources of noise, such as industrial frequency interference, while retaining the essential information of the ECG signal. This ensures high-quality signal capture even in challenging environments. The bioelectrode used in the CEMS, the STE, adheres closely to the skin, ensuring comfort and breathability. When wetted by sweat, it demonstrates lower contact impedance compared to conventional Ag/AgCl gel electrodes, which enhances its performance and durability. Furthermore, based on the high-quality ECG signals collected by the system, an exercise intensity classification model was developed. After 100 training epochs, the model achieved an impressive accuracy of 98.7%, showcasing the potential of the CEMS in real-world applications. Due to its high portability and comfortable wearability, the CEMS is anticipated to serve as a significant driving force in the development of physiological signal monitoring technologies.

Author Contributions

X.Z.: investigation, writing—original draft, methodology, visualization, funding acquisition. Y.Z.: investigation, data curation, visualization. X.W.: conceptualization, supervision, project administration, funding acquisition. J.Y.: conceptualization, supervision, project administration, funding acquisition. All authors have read and agreed to the published version of the manuscript.

Funding

This research was funded by the Science and Technology Research Program of Chongqing Municipal Education Commission (Grant No. KJQN202400560), the Natural Science Foundation of Chongqing (Grant No. CSTB2024NSCQ-MSX0888), the Dr. Scientific Research Fund of Chongqing Normal University (23XLB014), the Fundamental Research Funds for the Central Universities (2024CDJYXTD-004), the Natural Science Foundation Projects of Chongqing (cstc2022ycjh-bgzxm0206), and the Chongqing Natural Science Foundation Innovation and Development Joint Fund (CSTB2023NSCQ-LZX0063).

Institutional Review Board Statement

The study involved human participants but was non-invasive and conducted with the informed consent of all subjects. Data were collected anonymously in accordance with national ethical guidelines, and the protocol qualified for exemption from full ethical review. An exemption was granted by the Institutional Review Board of the School of Physics and Electronic Engineering, Chongqing Normal University (exemption issued on 28 March 2025).

Informed Consent Statement

Informed consent was obtained from all subjects involved in the study.

Data Availability Statement

The data that support the findings of this study are available from the corresponding author upon reasonable request.

Conflicts of Interest

The authors declare no conflicts of interest.

References

  1. Di Paolo, Í.F.; Castro, A.R. Intra- and Interpatient ECG Heartbeat Classification Based on Multimodal Convolutional Neural Networks with an Adaptive Attention Mechanism. Appl. Sci. 2024, 14, 9307. [Google Scholar] [CrossRef]
  2. Qi, T.; Zhang, H.; Zhao, H.; Shen, C.; Liu, X. Research on ECG Signal Classification Based on Hybrid Residual Network. Appl. Sci. 2024, 14, 11202. [Google Scholar] [CrossRef]
  3. Kang, T.W.; Lee, J.; Kwon, Y.; Lee, Y.J.; Yeo, W.-H. Recent Progress in the Development of Flexible Wearable Electrodes for Electrocardiogram Monitoring During Exercise. Adv. NanoBiomed Res. 2024, 4, 2300169. [Google Scholar] [CrossRef]
  4. Lee, M.S.; Paul, A.; Xu, Y.; Hairston, W.D.; Cauwenberghs, G. Characterization of Ag/AgCl Dry Electrodes for Wearable Electrophysiological Sensing. Front. Electron. 2022, 2, 700363. [Google Scholar] [CrossRef]
  5. Nunes, T.; Da Silva, H.P. Characterization and Validation of Flexible Dry Electrodes for Wearable Integration. Sensors 2023, 23, 1468. [Google Scholar] [CrossRef]
  6. Tu, H.; Li, X.; Lin, X.; Lang, C.; Gao, Y. Washable and Flexible Screen-Printed Ag/AgCl Electrode on Textiles for ECG Monitoring. Polymers 2023, 15, 3665. [Google Scholar] [CrossRef]
  7. Cui, T.-R.; Li, D.; Huang, X.-R.; Yan, A.-Z.; Dong, Y.; Xu, J.-D.; Guo, Y.-Z.; Wang, Y.; Chen, Z.-K.; Shao, W.-C.; et al. Graphene-Based Flexible Electrode for Electrocardiogram Signal Monitoring. Appl. Sci. 2022, 12, 4526. [Google Scholar] [CrossRef]
  8. Fernandes, S.; Ramos, A.; Vega-Barbas, M.; García-Vázquez, C.; Seoane, F.; Pau, I. Smart Textile Technology for the Monitoring of Mental Health. Sensors 2025, 25, 1148. [Google Scholar] [CrossRef] [PubMed]
  9. Gao, J.; Hu, M.; Sun, H.; Wang, Y.; Wei, Y.; Li, W.; Zheng, L.; Xu, M.; Lu, Q.; Liu, Z.; et al. Disposable and flexible smart electronic tapes for long-term biopotential monitoring. npj Flex. Electron. 2025, 9, 6. [Google Scholar] [CrossRef]
  10. Li, C.; Xu, K.; Chen, Y. Study on the Anti-Interference Performance of Substrate-Free PEDOT: PSS ECG Electrodes. Appl. Sci. 2024, 14, 6367. [Google Scholar] [CrossRef]
  11. Niu, L.; Shen, Z.; Wang, Z.; Qi, L.; Niu, H.; Zhou, H.; Zhang, C.; Xu, J.; Fang, J. Low-Contact Impedance Textile Electrode for Real-Time Detection of ECG Signals. ACS Appl. Mater. Interfaces 2024, 16, 57860–57869. [Google Scholar] [CrossRef] [PubMed]
  12. Rwei, P.; Shiu, J.-W.; Senel, M.; Hajiaghajani, A.; Qian, C.; Chen, C.-W.; Tseng, P.; Khine, M. A Waterborne, Flexible, and Highly Conductive Silver Ink for Ultra-Rapid Fabrication of Epidermal Electronics. Sensors 2025, 25, 2092. [Google Scholar] [CrossRef] [PubMed]
  13. Ramasamy, S.; Balan, A. Wearable sensors for ECG measurement: A review. Sens. Rev. 2018, 38, 412–419. [Google Scholar] [CrossRef]
  14. Wang, X.; Feng, Z.; Li, P.; Wang, L.; Chen, L.; Wu, Y.; Yang, J. A Flexible Pressure Sensor with a Mesh Structure Formed by Lost Hair for Human Epidermal Pulse Wave Monitoring. Sensors 2023, 23, 45. [Google Scholar] [CrossRef]
  15. Zhang, J.; Ding, H. Exploration on flexible wearable sensor motion monitoring based on novel functional polymer conjugated materials. Front. Chem. 2023, 11, 1265211. [Google Scholar] [CrossRef]
  16. Alimbayeva, Z.; Alimbayev, C.; Ozhikenov, K.; Bayanbay, N.; Ozhikenova, A. Wearable ECG Device and Machine Learning for Heart Monitoring. Sensors 2024, 24, 4201. [Google Scholar] [CrossRef]
  17. Dahiya, E.S.; Kalra, A.M.; Lowe, A.; Anand, G. Wearable Technology for Monitoring Electrocardiograms (ECGs) in Adults: A Scoping Review. Sensors 2024, 24, 1318. [Google Scholar] [CrossRef]
  18. Deng, Z.; Guo, L.; Chen, X.; Wu, W. Smart Wearable Systems for Health Monitoring. Sensors 2023, 23, 2479. [Google Scholar] [CrossRef] [PubMed]
  19. Hou, X.; Qi, B. Basketball Training Posture Monitoring Based on Intelligent Wearable Device. Mob. Inf. Syst. 2022, 2022, 4945534. [Google Scholar] [CrossRef]
  20. Nigusse, A.B.; Malengier, B.; Van Langenhove, L. Development and Evaluation of a Wearable ECG Monitoring System. Eng. Proc. 2023, 52, 9. [Google Scholar]
  21. Ramandha, A.; Distya, M.N.I.; Zafira, Z.; Harefa, Y.E.; Rahman, S.F.; Basari. Development of Compact 3-Lead Electrode Electrocardiogram Vest for Vital Sign Monitoring. In Proceedings of the 6th International Conference on Biomedical Engineering (ICOBE 2023), Kuala Lumpur, Malaysia, 19–20 September 2023; Lee, H.L., Yazid, H., Ibrahim, F., Eds.; IFMBE Proceedings. Springer: Cham, Switzerland, 2025; Volume 115, pp. 47–53. [Google Scholar]
  22. Wang, X.; Liu, S.; Zhu, M.; He, Y.; Wei, Z.; Wang, Y.; Xu, Y.; Pan, H.; Huang, W.; Chen, S.; et al. Flexible Non-contact Electrodes for Wearable Biosensors System on Electrocardiogram Monitoring in Motion. Front. Neurosci. 2022, 16, 900146. [Google Scholar] [CrossRef] [PubMed]
  23. Zang, J.; An, Q.; Li, B.; Zhang, Z.; Gao, L.; Xue, C. A novel wearable device integrating ECG and PCG for cardiac health monitoring. Microsyst. Nanoeng. 2025, 11, 7. [Google Scholar] [CrossRef]
  24. Trummer, S.; Ehrmann, A.; Buesgen, A. Development of Underwear with Integrated 12 Channel ECG for Men and Women. Autex Res. J. 2017, 17, 344–349. [Google Scholar] [CrossRef]
  25. Ozkan, H.; Ozhan, O.; Karadana, Y.; Gulcu, M.; Macit, S.; Husain, F. A Portable Wearable Tele-ECG Monitoring System. IEEE Trans. Instrum. Meas. 2020, 69, 173–182. [Google Scholar] [CrossRef]
  26. Tu, H.; Li, Z.; Chen, Z.; Gao, Y.; Xuan, F. A Step Forward for Smart Clothes: Printed Fabric-Based Hybrid Electronics for Wearable Health Monitoring. Sensors 2024, 24, 6991. [Google Scholar] [CrossRef]
  27. Chu, H.; Yang, C.; Xing, Y.; Li, J.; Liu, C. A Portable ECG Patch Monitor Based on Flexible Non-hydrogel Electrode. J. Med. Biol. Eng. 2022, 42, 364–373. [Google Scholar] [CrossRef]
  28. Cömert, A.; Hyttinen, J. Investigating the possible effect of electrode support structure on motion artifact in wearable bioelectric signal monitoring. Biomed. Eng. Online 2015, 14, 44. [Google Scholar] [CrossRef]
  29. Joutsen, A.; Cömert, A.; Kaappa, E.; Vanhatalo, K.; Riistama, J.; Vehkaoja, A.; Eskola, H. ECG signal quality in intermittent long-term dry electrode recordings with controlled motion artifacts. Sci. Rep. 2024, 14, 8882. [Google Scholar] [CrossRef]
  30. Bi, S.; Lu, R.; Xu, Q.; Zhang, P. Accurate Arrhythmia Classification with Multi-Branch, Multi-Head Attention Temporal Convolutional Networks. Sensors 2024, 24, 8124. [Google Scholar] [CrossRef]
  31. Byeon, Y.-H.; Kwak, K.-C. An Ensemble Deep Neural Network-Based Method for Person Identification Using Electrocardiogram Signals Acquired on Different Days. Appl. Sci. 2024, 14, 7959. [Google Scholar] [CrossRef]
  32. Feng, K.; Pi, X.; Liu, H.; Sun, K. Myocardial Infarction Classification Based on Convolutional Neural Network and Recurrent Neural Network. Appl. Sci. 2019, 9, 1879. [Google Scholar] [CrossRef]
  33. Hussein, O.; Jameel, S.M.; Altmemi, J.M.; Abbas, M.A.; Uğurenver, A.; Alkubaisi, Y.M.; Sabry, A.H. Improving automated labeling with deep learning and signal segmentation for accurate ECG signal analysis. SOCA 2024. [Google Scholar] [CrossRef]
  34. Castillo-Atoche, A.; Caamal-Herrera, K.; Atoche-Enseñat, R.; Estrada-López, J.J.; Vázquez-Castillo, J.; Castillo-Atoche, A.C.; Palma-Marrufo, O.; Espinoza-Ruiz, A. Energy Efficient Framework for a AIoT Cardiac Arrhythmia Detection System Wearable during Sport. Appl. Sci. 2022, 12, 2716. [Google Scholar] [CrossRef]
  35. Guerra, R.D.T.; Yamaguchi, C.K.; Stefenon, S.F.; Coelho, L.D.S.; Mariani, V.C. Deep Learning Approach for Automatic Heartbeat Classification. Sensors 2025, 25, 1400. [Google Scholar] [CrossRef]
  36. Sun, A.; Hong, W.; Li, J.; Mao, J. An Arrhythmia Classification Model Based on a CNN-LSTM-SE Algorithm. Sensors 2024, 24, 6306. [Google Scholar] [CrossRef]
  37. Khalili, M.; Gholamhosseini, H.; Lowe, A.; Kuo, M.M.Y. Motion artifacts in capacitive ECG monitoring systems: A review of existing models and reduction techniques. Med. Biol. Eng. Comput. 2024, 62, 3599–3622. [Google Scholar] [CrossRef] [PubMed]
  38. Huamaní, R.; Talavera, J.R.; Mendoza, E.A.S.; Dávila, N.M.; Supo, E. Implementation of a Real-Time 60 Hz Interference Cancella-tion Algorithm for ECG Signals Based on ARM Cortex M4 and ADS1298. In Proceedings of the 2017 IEEE XXIV International Conference on Electronics, Electrical Engineering and Computing (INTERCON 2017), Cusco, Peru, 15–18 August 2017; IEEE: Piscataway, NJ, USA, 2017; pp. 1–4. [Google Scholar]
  39. Bui, N.T.; Vo, T.H.; Kim, B.-G.; Oh, J. Design of a Solar-Powered Portable ECG Device with Optimal Power Consumption and High Accuracy Measurement. Appl. Sci. 2019, 9, 2129. [Google Scholar] [CrossRef]
  40. Becker, D.E. Fundamentals of electrocardiography interpretation. Anesth. Prog. 2006, 53, 53–63. [Google Scholar] [CrossRef]
  41. Ortega, E.; Bryan, C.Y.X.; Christine, N.S.C. The Pulse of Singapore: Short-Term HRV Norms. Assoc. Appl. Psychophysiol. Biofeedback 2024, 49, 55–61. [Google Scholar] [CrossRef]
  42. Shaffer, F.; Ginsberg, J.P. An Overview of Heart Rate Variability Metrics and Norms. Front. Public. Health. 2017, 5, 258. [Google Scholar] [CrossRef]
  43. Draghici, A.E.; Taylor, J.A. The physiological basis and measurement of heart rate variability in humans. J. Physiol. Anthropol. 2016, 35, 22. [Google Scholar] [CrossRef] [PubMed]
  44. Kleiger, R.E.; Stein, P.K.; Bigger, J.T., Jr. Heart rate variability: Measurement and clinical utility. Ann. Noninvasive Electrocardiol. 2005, 10, 88–101. [Google Scholar] [CrossRef] [PubMed]
  45. Pan, J.; Tompkins, W.J. A Real-Time QRS Detection Algorithm. IEEE Trans. Biomed. Eng. 1985, 32, 230–236. [Google Scholar] [CrossRef]
  46. Ramesh, J.; Solatidehkordi, Z.; Aburukba, R.; Sagahyroon, A.; Aloul, F. Transferring Learned ECG Representations for Deep Neural Network Classification of Atrial Fibrillation with Photoplethysmography. Appl. Sci. 2025, 15, 4770. [Google Scholar] [CrossRef]
  47. Azimi, S.M.; Britz, D.; Engstler, M.; Fritz, M.; Mücklich, F. Advanced Steel Microstructural Classification by Deep Learning Methods. Sci. Rep. 2018, 8, 2128. [Google Scholar] [CrossRef]
  48. Ali, B.; Cheraghi Bidsorkhi, H.; D’aloia, A.G.; Laracca, M.; Sarto, M.S. Wearable graphene-based fabric electrodes for enhanced and long-term biosignal detection. Sens. Actuators Rep. 2023, 5, 100161. [Google Scholar] [CrossRef]
Figure 1. The overall operational architecture of the CEMS.
Applsci 15 05920 g001
Figure 2. Structure of the CEMS. (a) Wearable configuration of the CEMS. (b) PCB of the CEMS signal conditioning circuit.
Applsci 15 05920 g002
Figure 3. The topology of the built-in filters in the CEMS. (a) Notch filter. (b) The fourth-order linear-phase low-pass filter. (c) The fourth-order linear-phase high-pass filter.
Applsci 15 05920 g003
Figure 4. Frequency response of the filter circuit.
Applsci 15 05920 g004
Figure 5. The time domain characteristic waveforms of the ECG signal.
Applsci 15 05920 g005
Figure 6. A Flowchart of the Pan-Tompkins algorithm.
Applsci 15 05920 g006
Figure 7. CEMS testing on the subject was conducted at different exercise durations. (a) t = 0 min. (b) t = 10 min. (c) t = 20 min. (d) t = 30 min.
Applsci 15 05920 g007
Figure 8. The structure of the exercise intensity classification model.
Applsci 15 05920 g008
Figure 9. Fabrication of the STE. (a) Silver-coated polyamide yarn. (b) Silver-coated polyamide yarn stitched onto cotton fabric.
Applsci 15 05920 g009
Figure 10. Interface impedance and phase between the STE and the Ag/AgCl gel electrodes on skin. (a) Impedance spectrum. (b) Phase spectrum.
Applsci 15 05920 g010
Figure 11. Signal comparison between the STE and Ag/AgCl gel electrodes within a single cycle.
Applsci 15 05920 g011
Figure 12. Photographs of the CEMS hardware. (a) The CEMS is in a partially assembled state. (b) The CEMS is being worn on the body.
Applsci 15 05920 g012
Figure 13. The smartphone display of the subject’s ECG signal.
Applsci 15 05920 g013
Figure 14. Results of a 600 s stability test of the CEMS on the subject.
Applsci 15 05920 g014
Figure 15. Comparison between the CEMS and the PM12B. (a) Measurement methods. (b) Measurement results.
Applsci 15 05920 g015
Figure 16. Training performance of the exercise intensity classification model. (a) Accuracy and loss. (b) Confusion matrix.
Applsci 15 05920 g016
Table 1. Performance comparison of different ECG monitoring devices.
ProductEkgMoveUnderwear with
12 Channels
CHILEAFCEMS
Wearing StyleChest strapUnderwearChest strapChest strap
ElectrodeDisposable ECG
electrode
Textile electrodeConventional metal
electrode
Silver-coated
textile electrode
Sweat-proof
performance
NOYESYESYES
WearabilityYESNOYESYES
Disclaimer/Publisher’s Note: The statements, opinions and data contained in all publications are solely those of the individual author(s) and contributor(s) and not of MDPI and/or the editor(s). MDPI and/or the editor(s) disclaim responsibility for any injury to people or property resulting from any ideas, methods, instructions or products referred to in the content.

