Article

A Real-Time Semi-Supervised Log Anomaly Detection Framework for ALICE O2 Facilities

by
Arnatchai Techaviseschai
1,
Sansiri Tarnpradab
1,*,
Vasco Chibante Barroso
2 and
Phond Phunchongharn
1
1
Department of Computer Engineering, King Mongkut’s University of Technology Thonburi, Bangkok 10140, Thailand
2
Experimental Physics Department, European Organization for Nuclear Research (CERN), 1211 Geneva, Switzerland
*
Author to whom correspondence should be addressed.
Appl. Sci. 2025, 15(11), 5901; https://doi.org/10.3390/app15115901
Submission received: 12 April 2025 / Revised: 13 May 2025 / Accepted: 14 May 2025 / Published: 23 May 2025
(This article belongs to the Section Computing and Artificial Intelligence)

Abstract

:
The ALICE (A Large Ion Collider Experiment) detector at the Large Hadron Collider (LHC), operated by the European Organization for Nuclear Research (CERN), is dedicated to heavy-ion collisions. Within ALICE, the application logs of the online computing systems are consolidated through a logging system known as Infologger, which integrates data from various sources. To identify potential anomalies, shifters in the control room manually review logs for anomalies, which require significant expertise and pose challenges due to the frequent onboarding of new personnel. To address this issue, we propose a real-time semi-supervised log anomaly detection framework designed to automatically detect anomalies in ALICE operations. The framework leverages BERTopic, a topic modeling technique, to provide real-time insights for incoming log messages for shifters. This includes an analytical dashboard that represents the anomaly status in log messages, facilitating informative monitoring for shifters. Through evaluation, including Infologger and BGL (BlueGene/L supercomputer), we analyze the effects of word embeddings, clustering algorithms, and HDBSCAN hyperparameters on model performance. The result demonstrates that the BERTopic can enhance the log anomaly detection process over traditional topic models, achieving remarkable performance metrics and attaining F1-scores of 0.957 and 0.958 for the InfoLogger and BGL datasets, respectively, even without the preprocessing technique.

1. Introduction

The European Organization for Nuclear Research (CERN) is the world’s leading institution for particle physics research, conducting extensive experiments aimed at understanding the fundamental nature of matter and energy. Over the years, a variety of high-energy physics experiments have been performed with CERN using different particle accelerator complexes, each addressing different key scientific questions. One of these experiments was a Large Ion Collider Experiment (ALICE) [1], which was dedicated to the study of heavy-ion physics at the Large Hadron Collider (LHC). It was designed to investigate the properties of strongly interacting matter under extreme energy densities, wherein a phase of matter called quark–gluon plasma is formed.
In ALICE, the ALICE O2 (Online–Offline) facilities [2] are designed to handle the exceptionally high data rates generated via the ALICE detector during heavy-ion collisions. It utilizes a scalable, distributed computing architecture to enable real-time processing and analysis of massive data streams, allowing the ALICE collaboration to monitor automated system logging and ensure any issue that arises during experimental runs is promptly addressed.
The importance of real-time capability becomes even more evident when the high-stakes nature of experiments at CERN is considered. Any downtime in the system, especially during an active experimental run, could lead to severe consequences, compromised experiment integrity, or even the loss of crucial scientific insights. Hence, logging messages plays a vital role in both system monitoring and troubleshooting, providing essential information on runtime events and activities to detect anomalies in a timely manner. In a single ALICE data-taking run, the volume of log messages generated can reach up to one million. This challenge is amplified during system upgrades, when numerous software modifications may introduce new types of logs, leading to new failure points. Real-time log anomaly detection addresses this issue by identifying anomalies as they occur and providing immediate feedback, enabling operators to take corrective actions before problems escalate and thus enhancing the reliability of the system.
Current trends in log anomaly detection have leveraged deep learning and unsupervised methods to improve accuracy and reduce dependency on labeled data. Techniques such as Autoencoders with Isolation Forest [3], LSTM-based models like DeepLog [4], CNNs [5], and transformer-based approaches like NeuralLog [6] have achieved notable success. However, these systems often lack interpretability and diagnostic capabilities, offering only binary anomaly flags. To address this limitation, topic modeling has emerged as a promising solution, enabling the categorization of anomalous log entries into interpretable topics. By integrating methods such as NMF, LDA, and clustering on latent vectors, recent research [7,8,9] has demonstrated improved context awareness in anomaly detection.
Given these challenges, we present a real-time log anomaly detection framework based on BERTopic [10] for detecting anomalous activities in log data generated via ALICE. We placed emphasis on investigating the scalability of the model when provided with a large amount of data and on exploring the factors that contribute to performance improvement. This study offers the following contributions:
  • We present a complete framework for automatic log anomaly detection with a focus on explaining semantics inside each topic and automatically labeling the incoming log messages.
  • We developed a semi-supervised real-time log anomaly detection model designed to provide actionable insights for shifters as new log messages arrive.
  • We provide a monitoring dashboard to analyze distribution of topics in log messages, which helps identify anomalies effectively.
This paper is organized as follows. In Section 2, we summarize the related works on topic modeling in log anomaly detection. Section 3 explains in detail our proposed framework for real-time semi-supervised log anomaly detection and experimental setup. Section 4 describes and discusses our analytical results. Section 5 finally concludes the paper.

2. Literature Review

Recent advancements in log anomaly detection have explored diverse techniques to enhance system reliability and security. Farzad and Gulliver [11] combined autoencoders [12] with isolation forest [3] to create a two-stage unsupervised framework that extracts features from logs and classifies anomalies, reducing reliance on labeled data but lacking root cause analysis. DeepLog [4] employed LSTM [13] to learn sequential patterns in logs using log parsing [14], offering effective anomaly detection but limited adaptability and interpretability. Lu et al. [5] utilized a CNN [15] with Logkey2Vec to capture short-range dependencies in logs, outperforming LSTM and MLP [16] in certain scenarios, although this approach was still reliant on log parsing. LogRobust [17] addressed log instability with semantic vectorization and attention-based Bi-LSTM [18], providing robustness to evolving logs but struggling with drastic changes. LogAnomaly [19] combined sequential and quantitative data using template2vec and LSTM to detect anomalies while mitigating false alarms from unseen templates, yet it still lacked diagnostic capability. Lastly, NeuralLog [6] proposed an approach without log parsing using BERT [20] and Transformer models to directly extract semantic representations from raw logs, achieving state-of-the-art results across datasets but still failing to offer detailed insights into anomaly causes.
Despite all significant advances in log anomaly detection techniques, existing approaches exhibit a notable limitation, as they typically provide only binary classification outputs that indicate whether an anomaly exists without delivering contextual information necessary for effective troubleshooting. This creates significant challenges for system administrators who require more comprehensive insights to diagnose and resolve issues efficiently.
Topic modeling offers a promising approach to overcoming the limitations of current systems by extracting meaningful topics from log messages. By applying topic modeling techniques to anomalous log entries, it is possible to develop systems that not only detect anomalies but also categorize them into interpretable topics. This enables shifters to quickly comprehend the nature of issues and direct their attention to the most relevant system components or facilities for further investigation. This research [7] has demonstrated that combining topic modeling techniques such as non-negative matrix factorization (NMF) and latent Dirichlet allocation (LDA) with anomaly detection can effectively cluster outlier messages into coherent topics. Other research [8,9] has applied clustering strategies to detect abnormal behavior in latent vectors. Given the advancements in topic modeling, it is now feasible to combine topic modeling with the ability to detect anomalies within log messages.
In what follows, we provide a review of key concepts and methodologies in log anomaly detection, with a focus on the topic modeling algorithms employed in previous works, including latent Dirichlet allocation (LDA) [21], latent semantic analysis (LSA), and non-negative matrix factorization (NMF) [22]. We analyze their strengths, limitations, and applicability to log data analysis, illustrating how topic modeling contributes to uncovering patterns and identifying anomalies. Additionally, this section discusses word embeddings, a crucial foundation for topic modeling, and their role in enhancing the effectiveness of these algorithms.

2.1. Latent Dirichlet Allocation (LDA)

Latent Dirichlet allocation (LDA) [21] is one of the basic probabilistic models for topic modeling. It identifies latent topics in text data by modeling the data as a mixture of topics, where each topic is a distribution over words. These models rely on input representations (e.g., bag-of-words (BoW), or word frequency) to construct the topic distributions, summarizing term occurrences to facilitate topic extraction.
LDA has been extensively applied to detect anomalies by identifying log messages with topic distributions that deviate significantly from the normal. For instance, Kasliwal et al. [23] proposed a hybrid anomaly detection model combining LDA with Gaussian mixtures (G-LDA) to identify anomaly packets in network traffic. Similarly, Elkhadir et al. [24] utilized median-based LDA alongside principal component analysis (R1-PCA) to detect anomalies in network traffic logs. These studies highlight LDA’s versatility in handling structured textual data (e.g., log messages), where patterns and semantic structures play a crucial role in identifying anomalies.
The strength of LDA lies in its ability to provide interpretable topic distributions, making it suitable for analyzing log data. Additionally, its probabilistic framework supports extensions for incorporating contextual information, as shown in Mahapatra et al. [25], who applied LDA for contextual anomaly detection in a variety of text forms (i.e., emails, blogs, papers, and video tags). However, LDA is not without limitations. Its performance heavily depends on the length of the documents, as a sufficient number of words is required to generate meaningful topic distributions. When it is applied to very short documents, the word frequency becomes sparse and unreliable, reducing the effectiveness of LDA’s probabilistic modeling [26].

2.2. Latent Semantic Analysis (LSA)

Latent semantic analysis (LSA) [27] is a widely recognized method for dimensionality reduction and topic modeling in text data. In the context of anomaly detection, LSA analyzes the underlying structure of text data by mapping them into a lower-dimensional semantic space. This representation allows the identification of anomalies by detecting deviations from established patterns in the semantic space.
Lefoane et al. [28] utilized LSA for decomposition and cluster representation in network traffic logs, demonstrating its capability to enhance model performance by reducing irrelevant features and effectively classifying anomalies. Similarly, Fawaz and Sanders [29] applied LSA to establish behavioral baselines for process anomaly detection, showing its effectiveness in distinguishing normal behavior from anomalous activities by constructing LSA matrices from the normal training set. Additionally, McCulloh et al. [30] further highlighted the utility of LSA in analyzing free text data by detecting changes in social groups through email analysis, emphasizing its strength in uncovering hidden patterns in structured textual datasets.
The primary strength of LSA lies in its ability to handle high-dimensional log data and reveal latent patterns, making it especially useful for understanding the underlying structure of log messages. However, LSA faces several drawbacks [31]. It assumes a joint Gaussian distribution between words and documents, making it less consistent with the observed data. The factorized matrix also contains negative values that lack a clear meaning in the context of word distributions. Moreover, choosing the number of latent dimensions in LSA typically relies on ad hoc heuristics, rather than formal statistical methods, leading to a less systematic approach to determining model complexity.

2.3. Non-Negative Matrix Factorization (NMF)

Non-negative matrix factorization (NMF) [22] is a dimensionality reduction and clustering technique widely applied to text data for uncovering latent features and patterns. By approximating a non-negative data matrix as the product of two lower-dimensional matrices, NMF can extract meaningful topics or clusters from textual datasets. This property has made NMF particularly effective for log anomaly detection, where the sparse nature of log data aligns well with the method’s non-negativity constraint. Its ability to decompose log data into interpretable components allows for identifying anomalous patterns and behaviors in structured datasets.
Although there are no direct applications of NMF specifically targeting log message analysis, its use in related domains highlights its potential for anomaly detection. For example, Wang et al. [32] utilized NMF to detect anomalies in profiling a program and user behavior by identifying deviations from typical patterns in user commands. Similarly, Alshammari et al. [33] applied NMF to outlier detection in wireless sensor networks, showcasing its capability to manage large-scale and distributed systems. These studies demonstrate NMF’s relevance for tasks that share similarities with log anomaly detection.
Recent advancements in NMF methodologies focus on enhancing its robustness to noise and sparsity in text data. Li et al. [34] introduced an anomaly-aware symmetric NMF for short text clustering. This approach demonstrates the adaptability of NMF for anomaly detection in which one could consider short text as a log message.
The primary strength of NMF lies in its ability to uncover hidden patterns in log data while maintaining interpretability by decomposing the data into meaningful matrices. However, NMF is highly sensitive to the initialization of the factor matrices. Poor initialization can lead to local optima instead of the global solution [35]. Additionally, NMF is computationally expensive. An alternative approach employs an alternating minimization cost function, which enhances its efficiency and scalability for large datasets [36].

2.4. Word Embeddings

Word embeddings serve as a crucial foundation for topic modeling by converting text into numerical vectors within latent semantic dimensions. This transformation is essential, as it enables machines to process and analyze textual data mathematically [37]. The quality of word embeddings directly impacts a topic model’s performance. Additionally, these embeddings reduce dimensionality while preserving key semantic information, making the topic modeling process both efficient and effective.

2.4.1. Bag of Words (BoW)

The bag of words (BoW) [38] representation forms a foundational preprocessing technique for latent Dirichlet allocation (LDA) topic modeling by transforming documents into numerical vectors based on term frequencies. This approach constructs a document–term matrix in which each document vector represents word abundance, disregarding syntactic structure. While BoW’s computational efficiency facilitates LDA’s topic inference, its inability to capture semantic relationships and contextual information presents inherent limitations for a sophisticated topic analysis.

2.4.2. Term Frequency-Inverse Document Frequency (TF-IDF)

Term frequency-inverse document frequency (TF-IDF) [39] represents a statistical weighting mechanism that quantifies term significance within document collections by balancing local frequency with global document frequency. This weighted representation facilitates dimensionality reduction techniques in topic modeling, specifically through LSA and NMF. While LSA employs singular value decomposition on the TF-IDF matrix to extract latent semantic dimensions, NMF decomposes it into interpretable non-negative components representing topical structures. Both methodologies exploit TF-IDF’s discriminative properties to identify coherent thematic patterns within a document’s body.

2.4.3. Sentence Transformer (SBERT)

SBERT is a word-embedding model that complements the topic modeling process by enabling semantic understanding and similarity computations between textual data points. It leverages transformer architectures (i.e., bidirectional encoder representations from transformers (BERTs) [20]) to generate dense vector embeddings for textual data, enhancing topic modeling by capturing contextual and semantic features.
By embedding text into a high-dimensional vector space, the framework facilitates grouping semantically similar sentences, overcoming the limitations of traditional methods like LDA, which rely heavily on surface-level word co-occurrence. This semantic approach significantly improves the clustering and interpretability of complex datasets, as well as unstructured and varied log messages, in topic modeling applications.
Although algorithms such as LDA, LSA, and NMF have demonstrated utility in log anomaly detection, they exhibit notable limitations. These methods predominantly rely on bag-of-words representations, which are insufficient for capturing the contextual and sequential information inherent to log messages. Additionally, their generalizability to unseen data is constrained, particularly when the underlying log distribution evolves over time. These challenges underscore the need for advancements in topic modeling techniques. In this context, approaches leveraging deep learning or contextual embeddings offer a promising avenue for addressing the shortcomings of traditional algorithms. In the following section, we introduce our proposed log anomaly detection framework, which utilizes sentence transformer embeddings (SBERTs) and the BERTopic model to overcome these limitations effectively.

3. Methodology

3.1. Proposed Framework

To address the limitations identified in existing log anomaly detection methodologies, we propose a framework for log anomaly detection, emphasizing the real-time detection and categorization of anomalies. Central to this framework is the use of topic clustering, which organizes log messages into distinct topics, allowing users to better understand the structure and nature of anomalies as they emerge. By leveraging BERTopic [10], a powerful topic clustering technique that integrates BERT embeddings, the framework enables users to identify indicative keywords of anomalous behavior. This real-time categorization provides crucial insights into anomaly groups, empowering users to analyze and respond to potential issues quickly. The results generated by BERTopic are seamlessly integrated into an informative dashboard, which displays detailed information for each topic, including relevant words, classified log messages, and the probability of messages being anomalies. This unified presentation ensures that users can monitor, analyze, and act on anomalies in real time, providing an all-in-one framework for streamlined anomaly management. An overview of the proposed framework is presented in Figure 1.
In the following sections, Section 3.1.1, Section 3.1.2, Section 3.1.3 and Section 3.1.4, we provide a description of each process, ranging from data preprocessing and BERTopic to anomaly classification and the analytic dashboard.

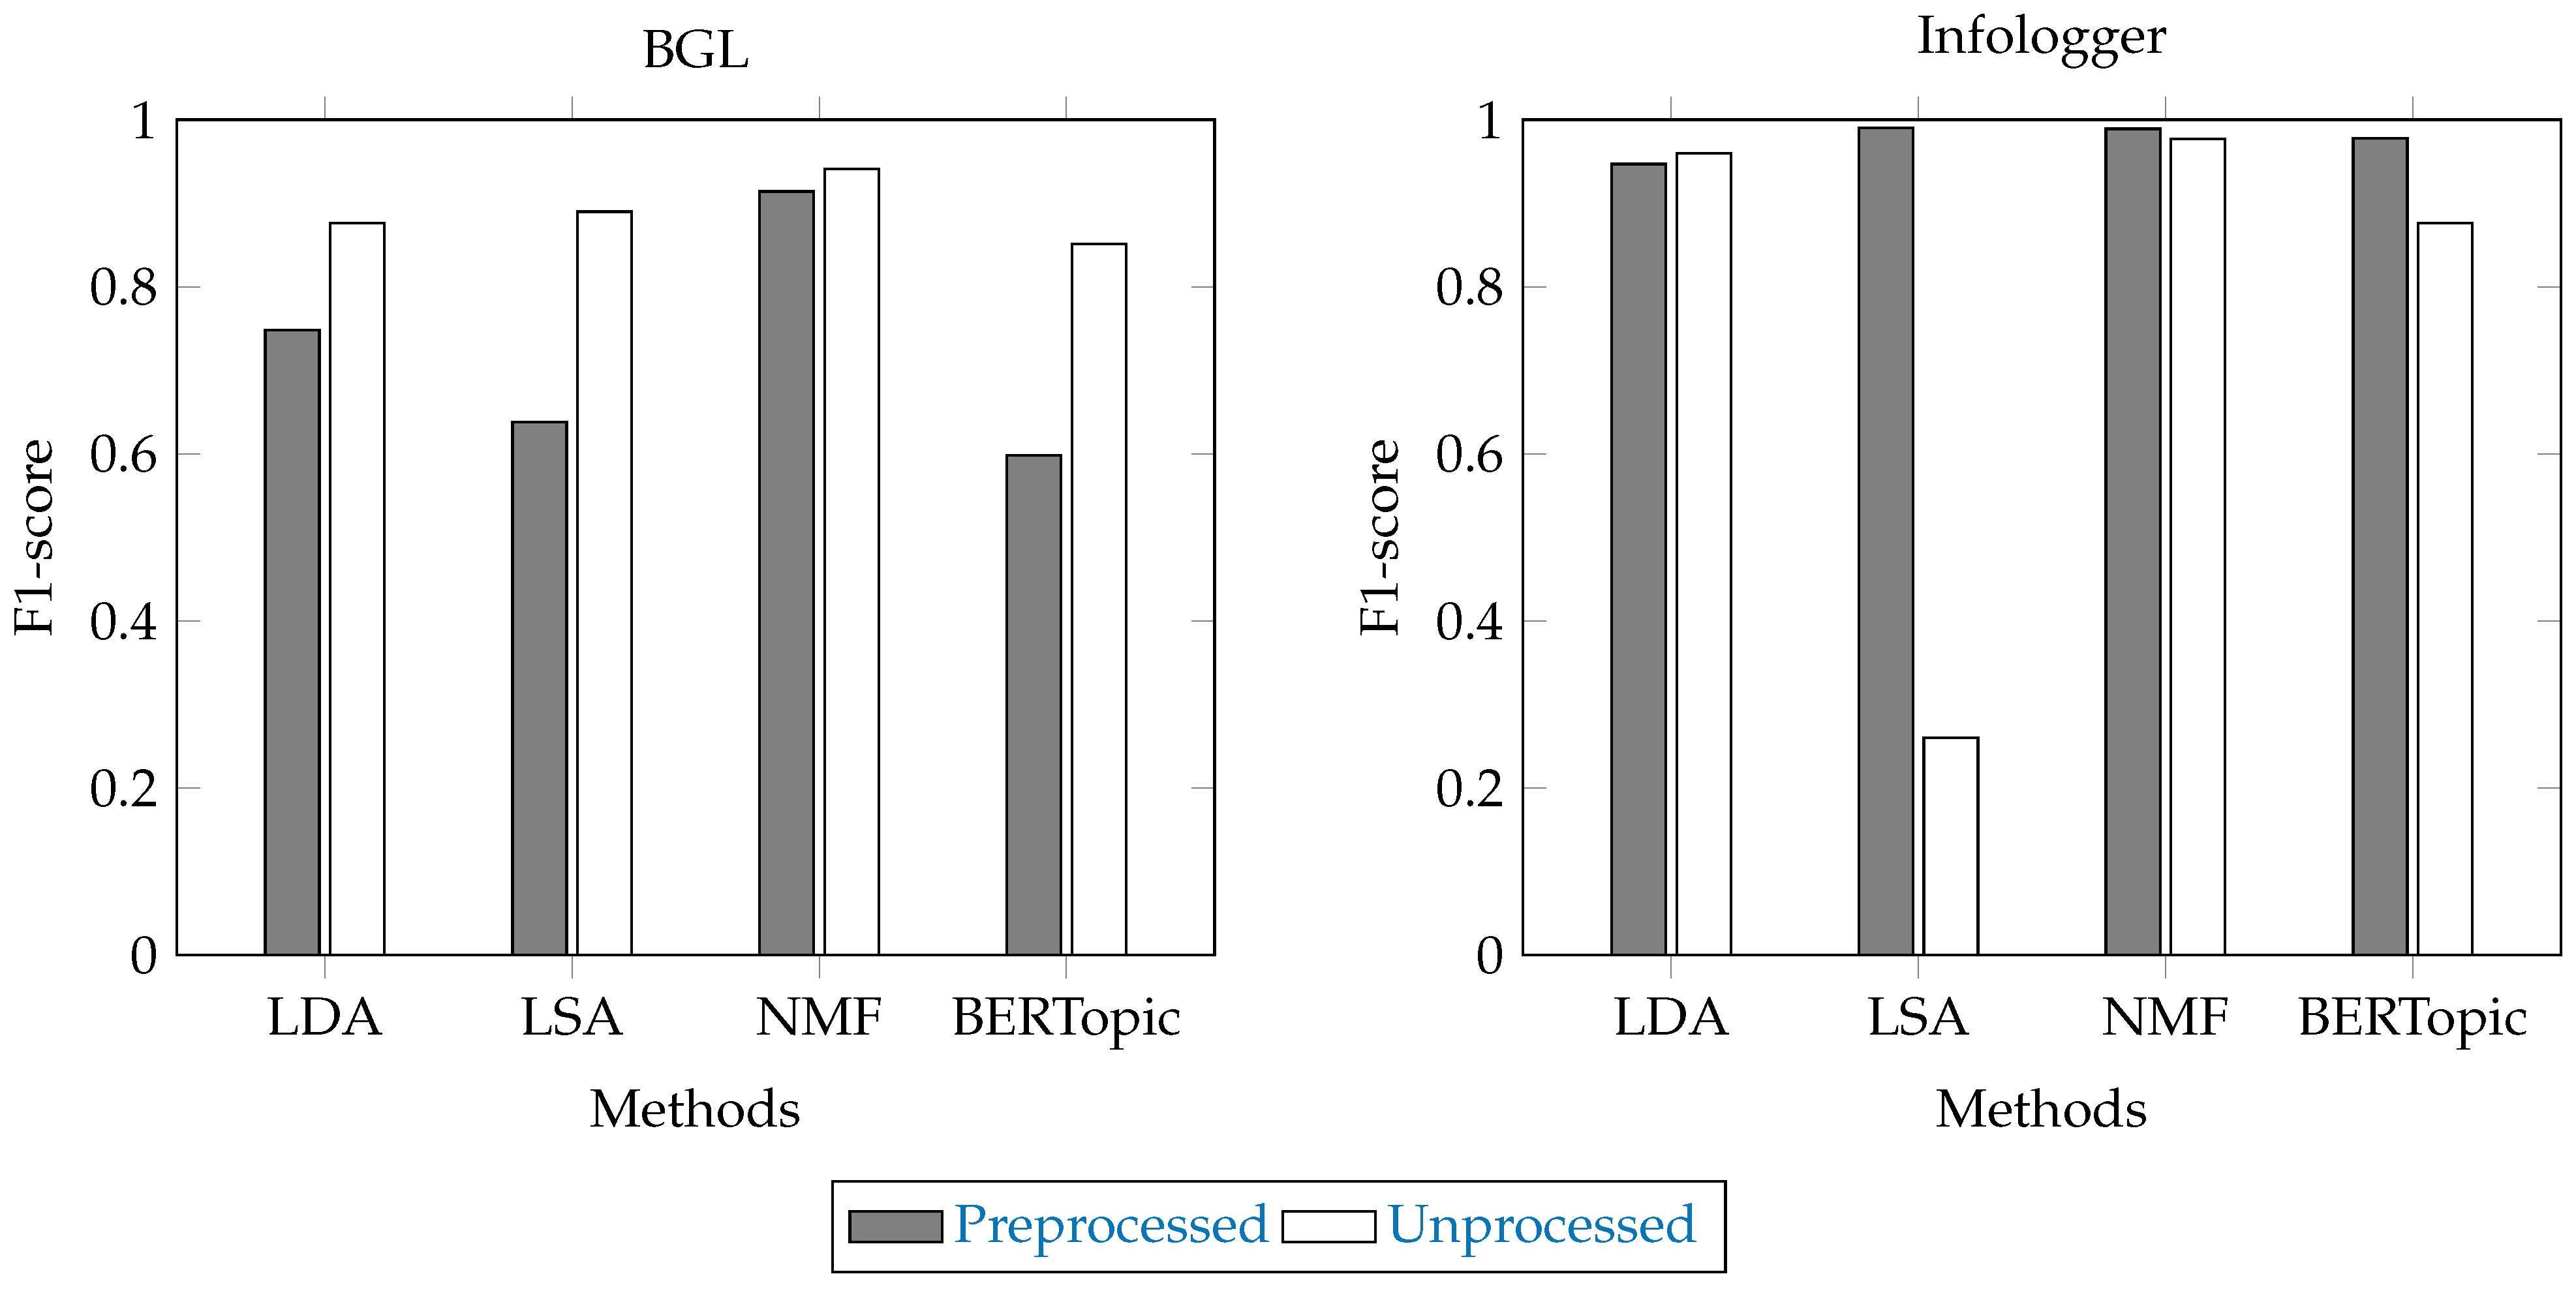
3.1.1. Data Preprocessing
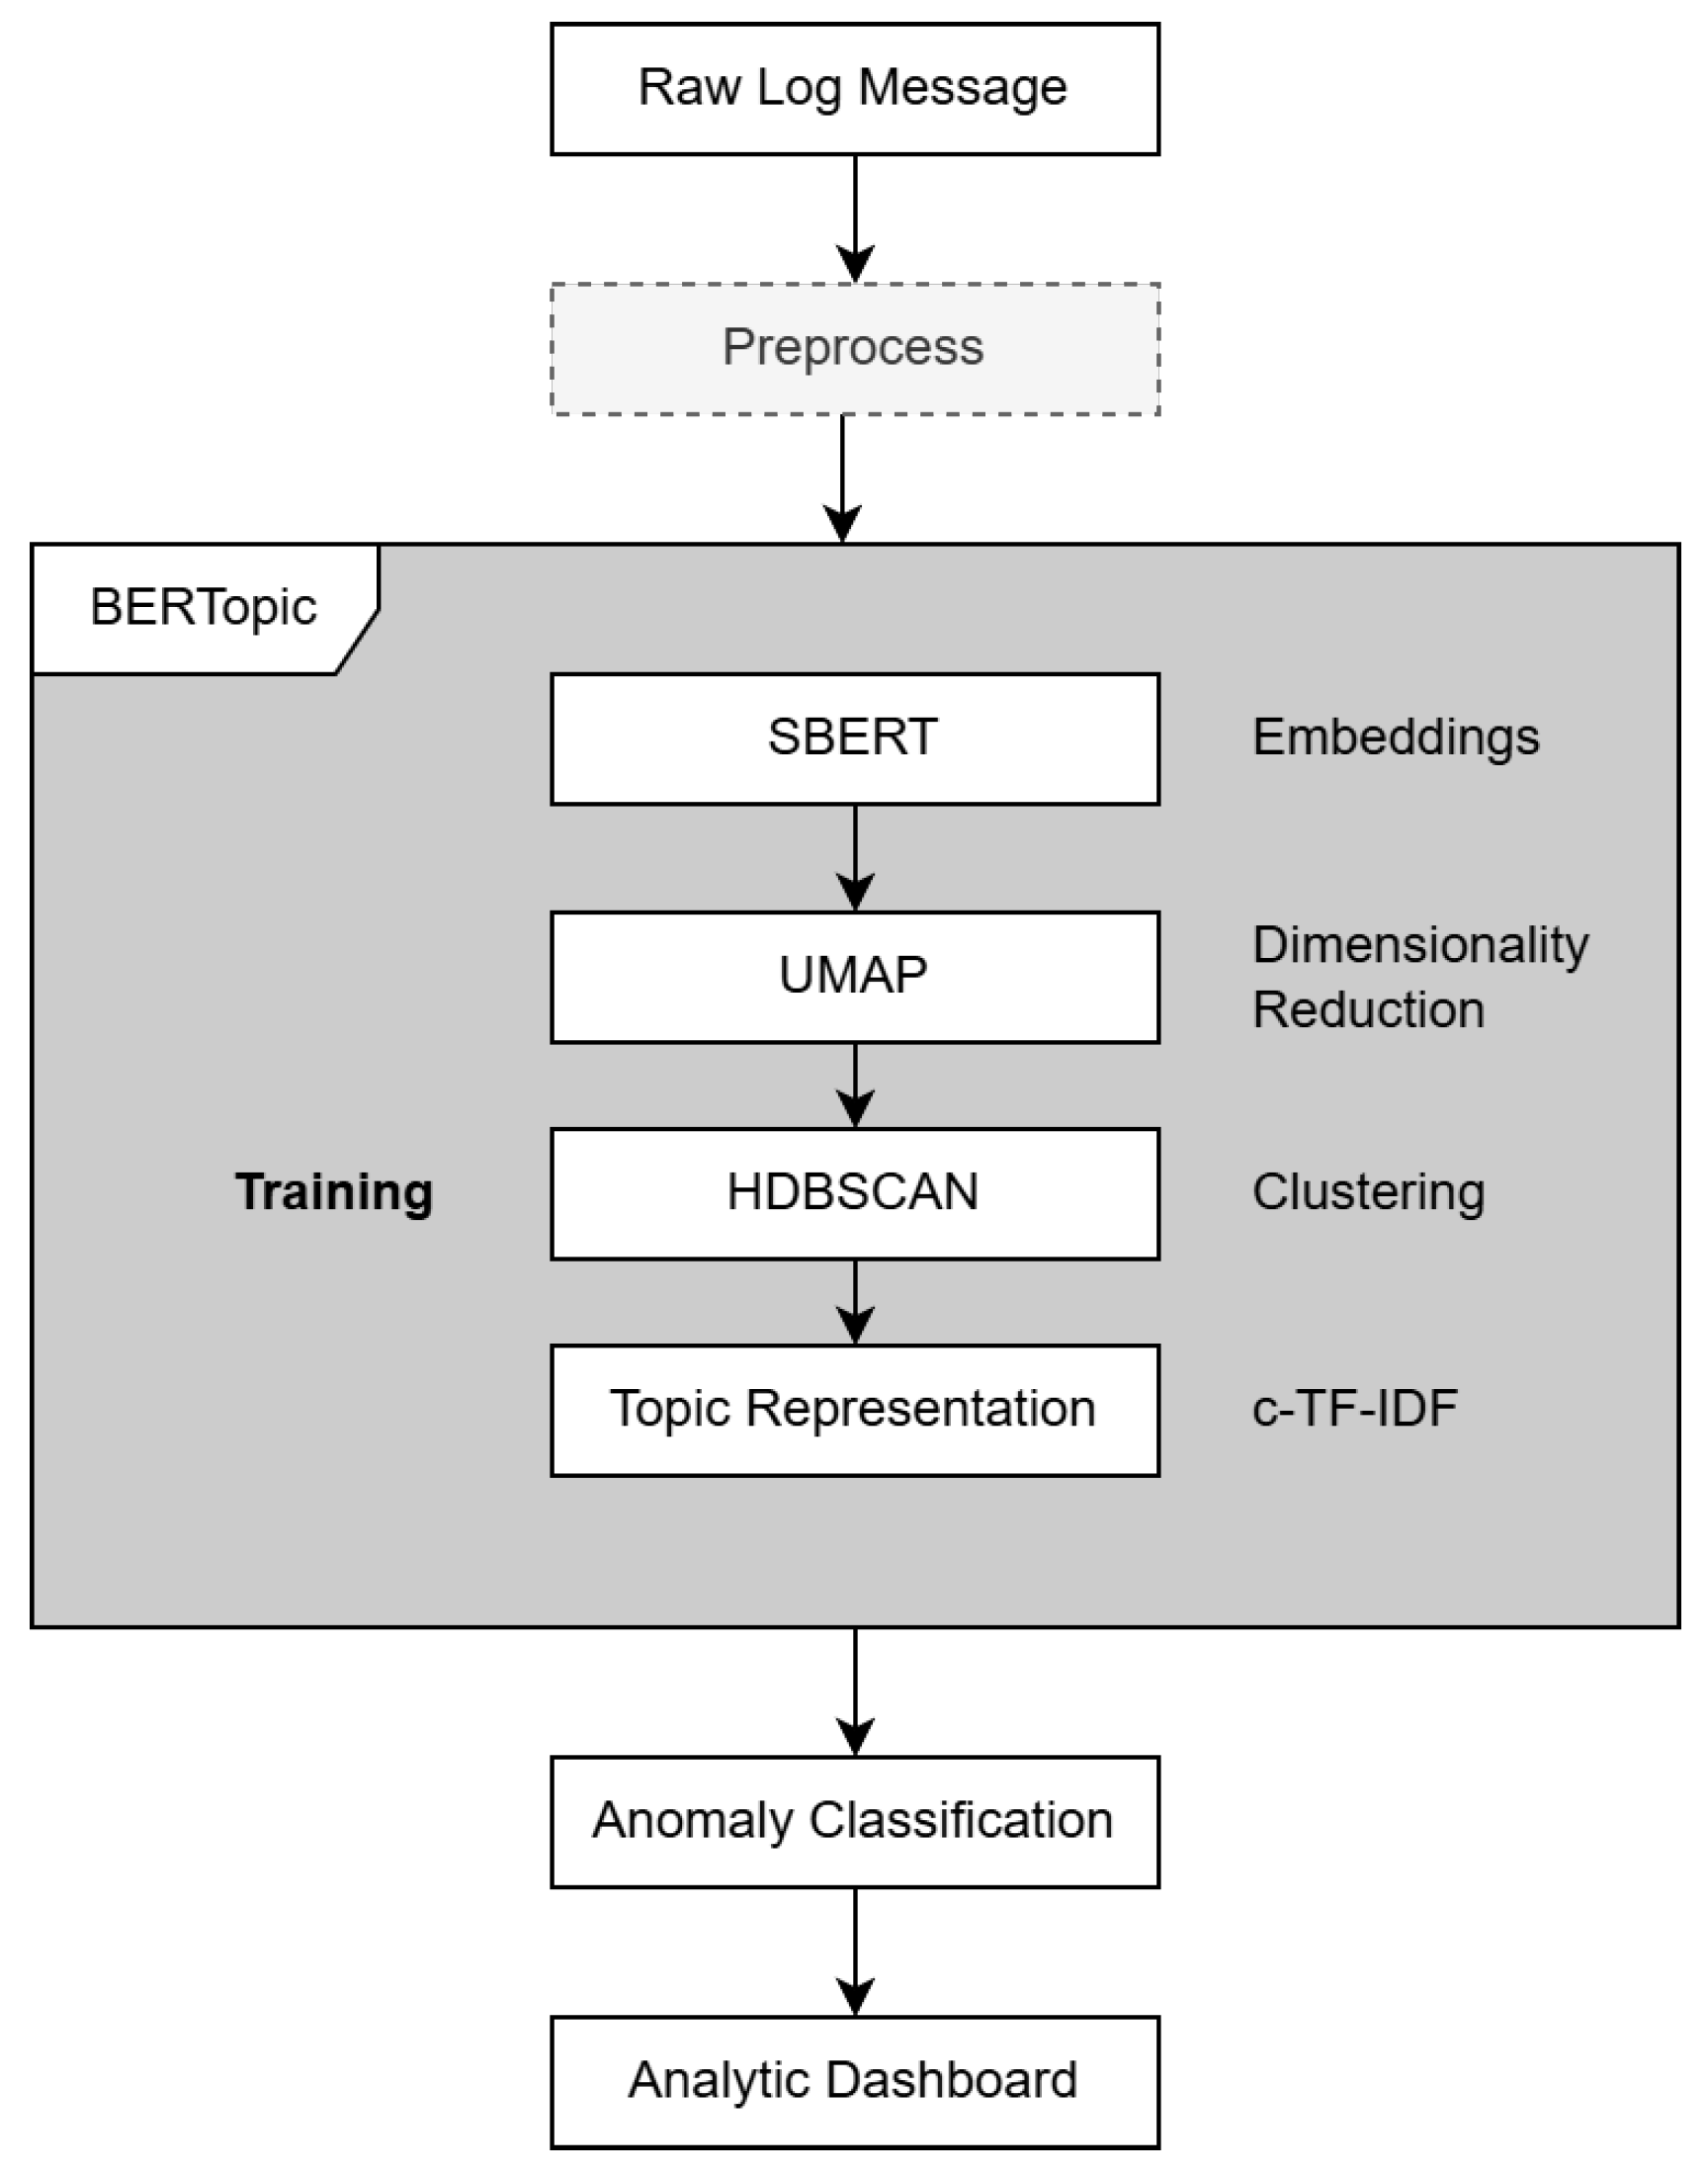
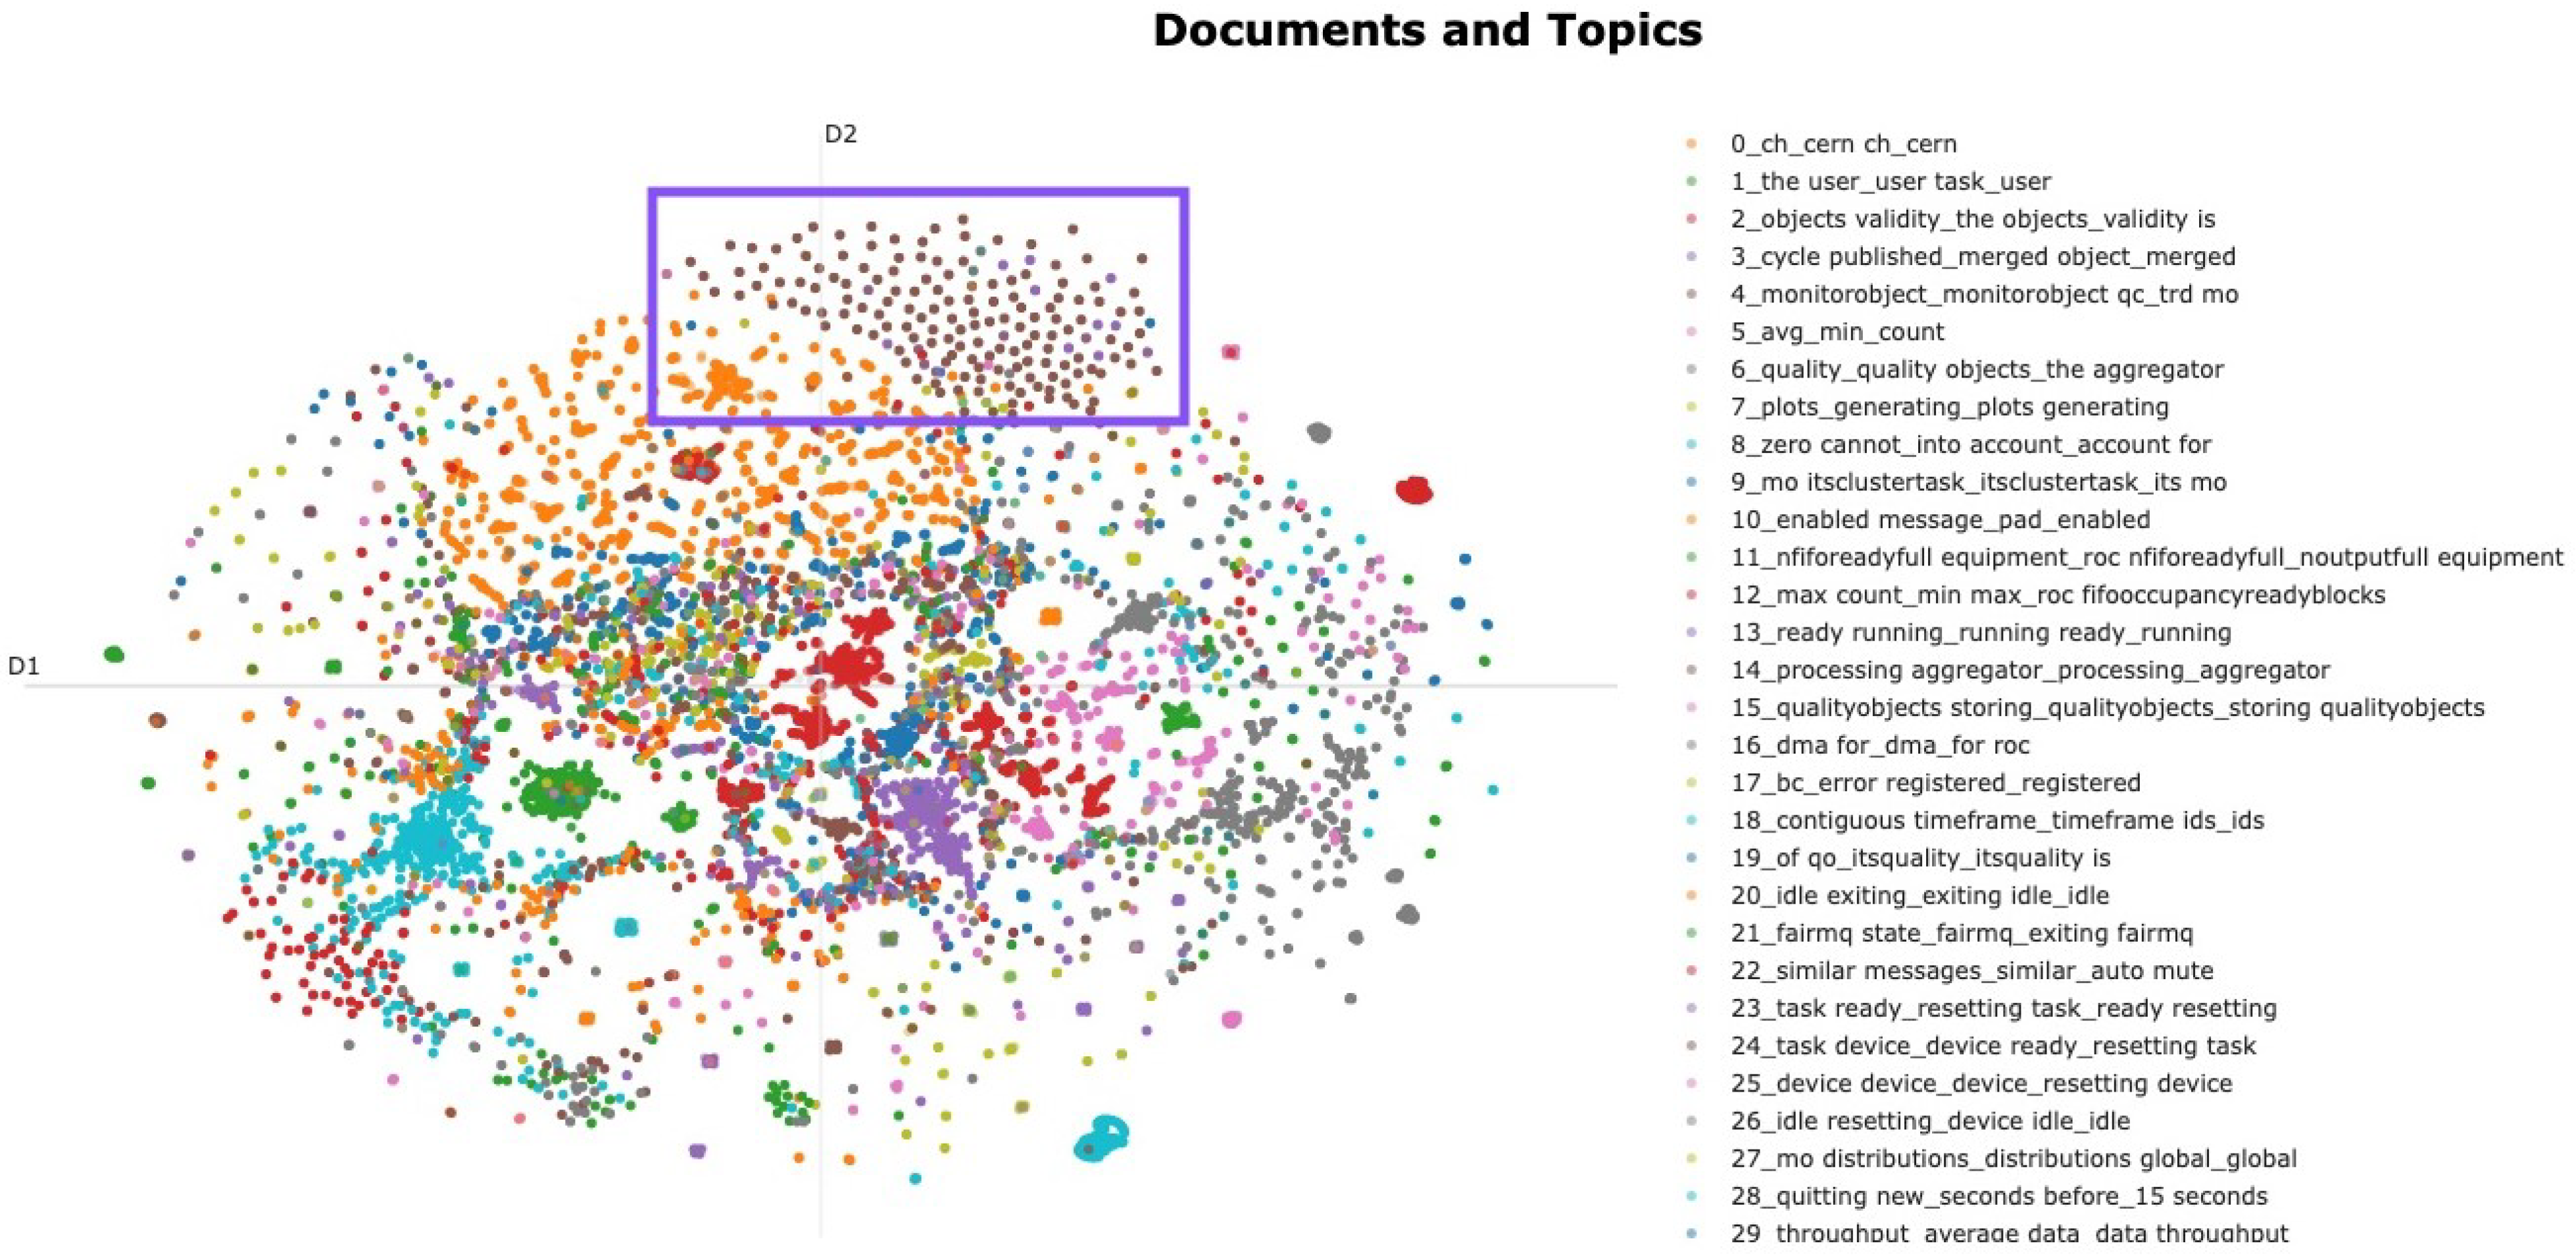
In our data preprocessing pipeline, we utilize Drain [40] and regular expressions to identify and extract non-dictionary elements such as usernames, hostnames, IP addresses, URL paths, and numerical values. This step helps remove noise and irrelevant tokens, improving the model’s ability to capture meaningful semantic patterns for topic modeling. However, as shown with the dashed line in Figure 1, preprocessing is an optional step, rather than a strict requirement. To assess its impact, we conducted experiments to evaluate the effects of preprocessing on model performance. The results demonstrate that our proposed framework can achieve high accuracy even without preprocessing, as discussed in Section 4.1.

3.1.2. BERTopic

BERTopic [10] is a topic modeling technique that utilizes transformers for embedding representations and clustering algorithms to discover topics in textual data. It stands as a significant advancement from traditional topic modeling approaches such as LDA and NMF, particularly in handling contextual and semantic information in large-scale text corpora. As illustrated in Figure 1, BERTopic can be divided into the following components:
  • Text embedding: BERTopic utilizes pre-trained transformer models, sentence transformer embeddings (SBERTs), to convert textual data into dense vector representations, capturing the contextual relationships between words and sentences.
  • Dimensionality reduction: BERTopic applies dimensionality reduction techniques (i.e., uniform manifold approximation and projection (UMAP) [41]). This reduces the complexity of the embedding space while preserving the essential structure of the data, facilitating efficient and meaningful clustering in subsequent steps.
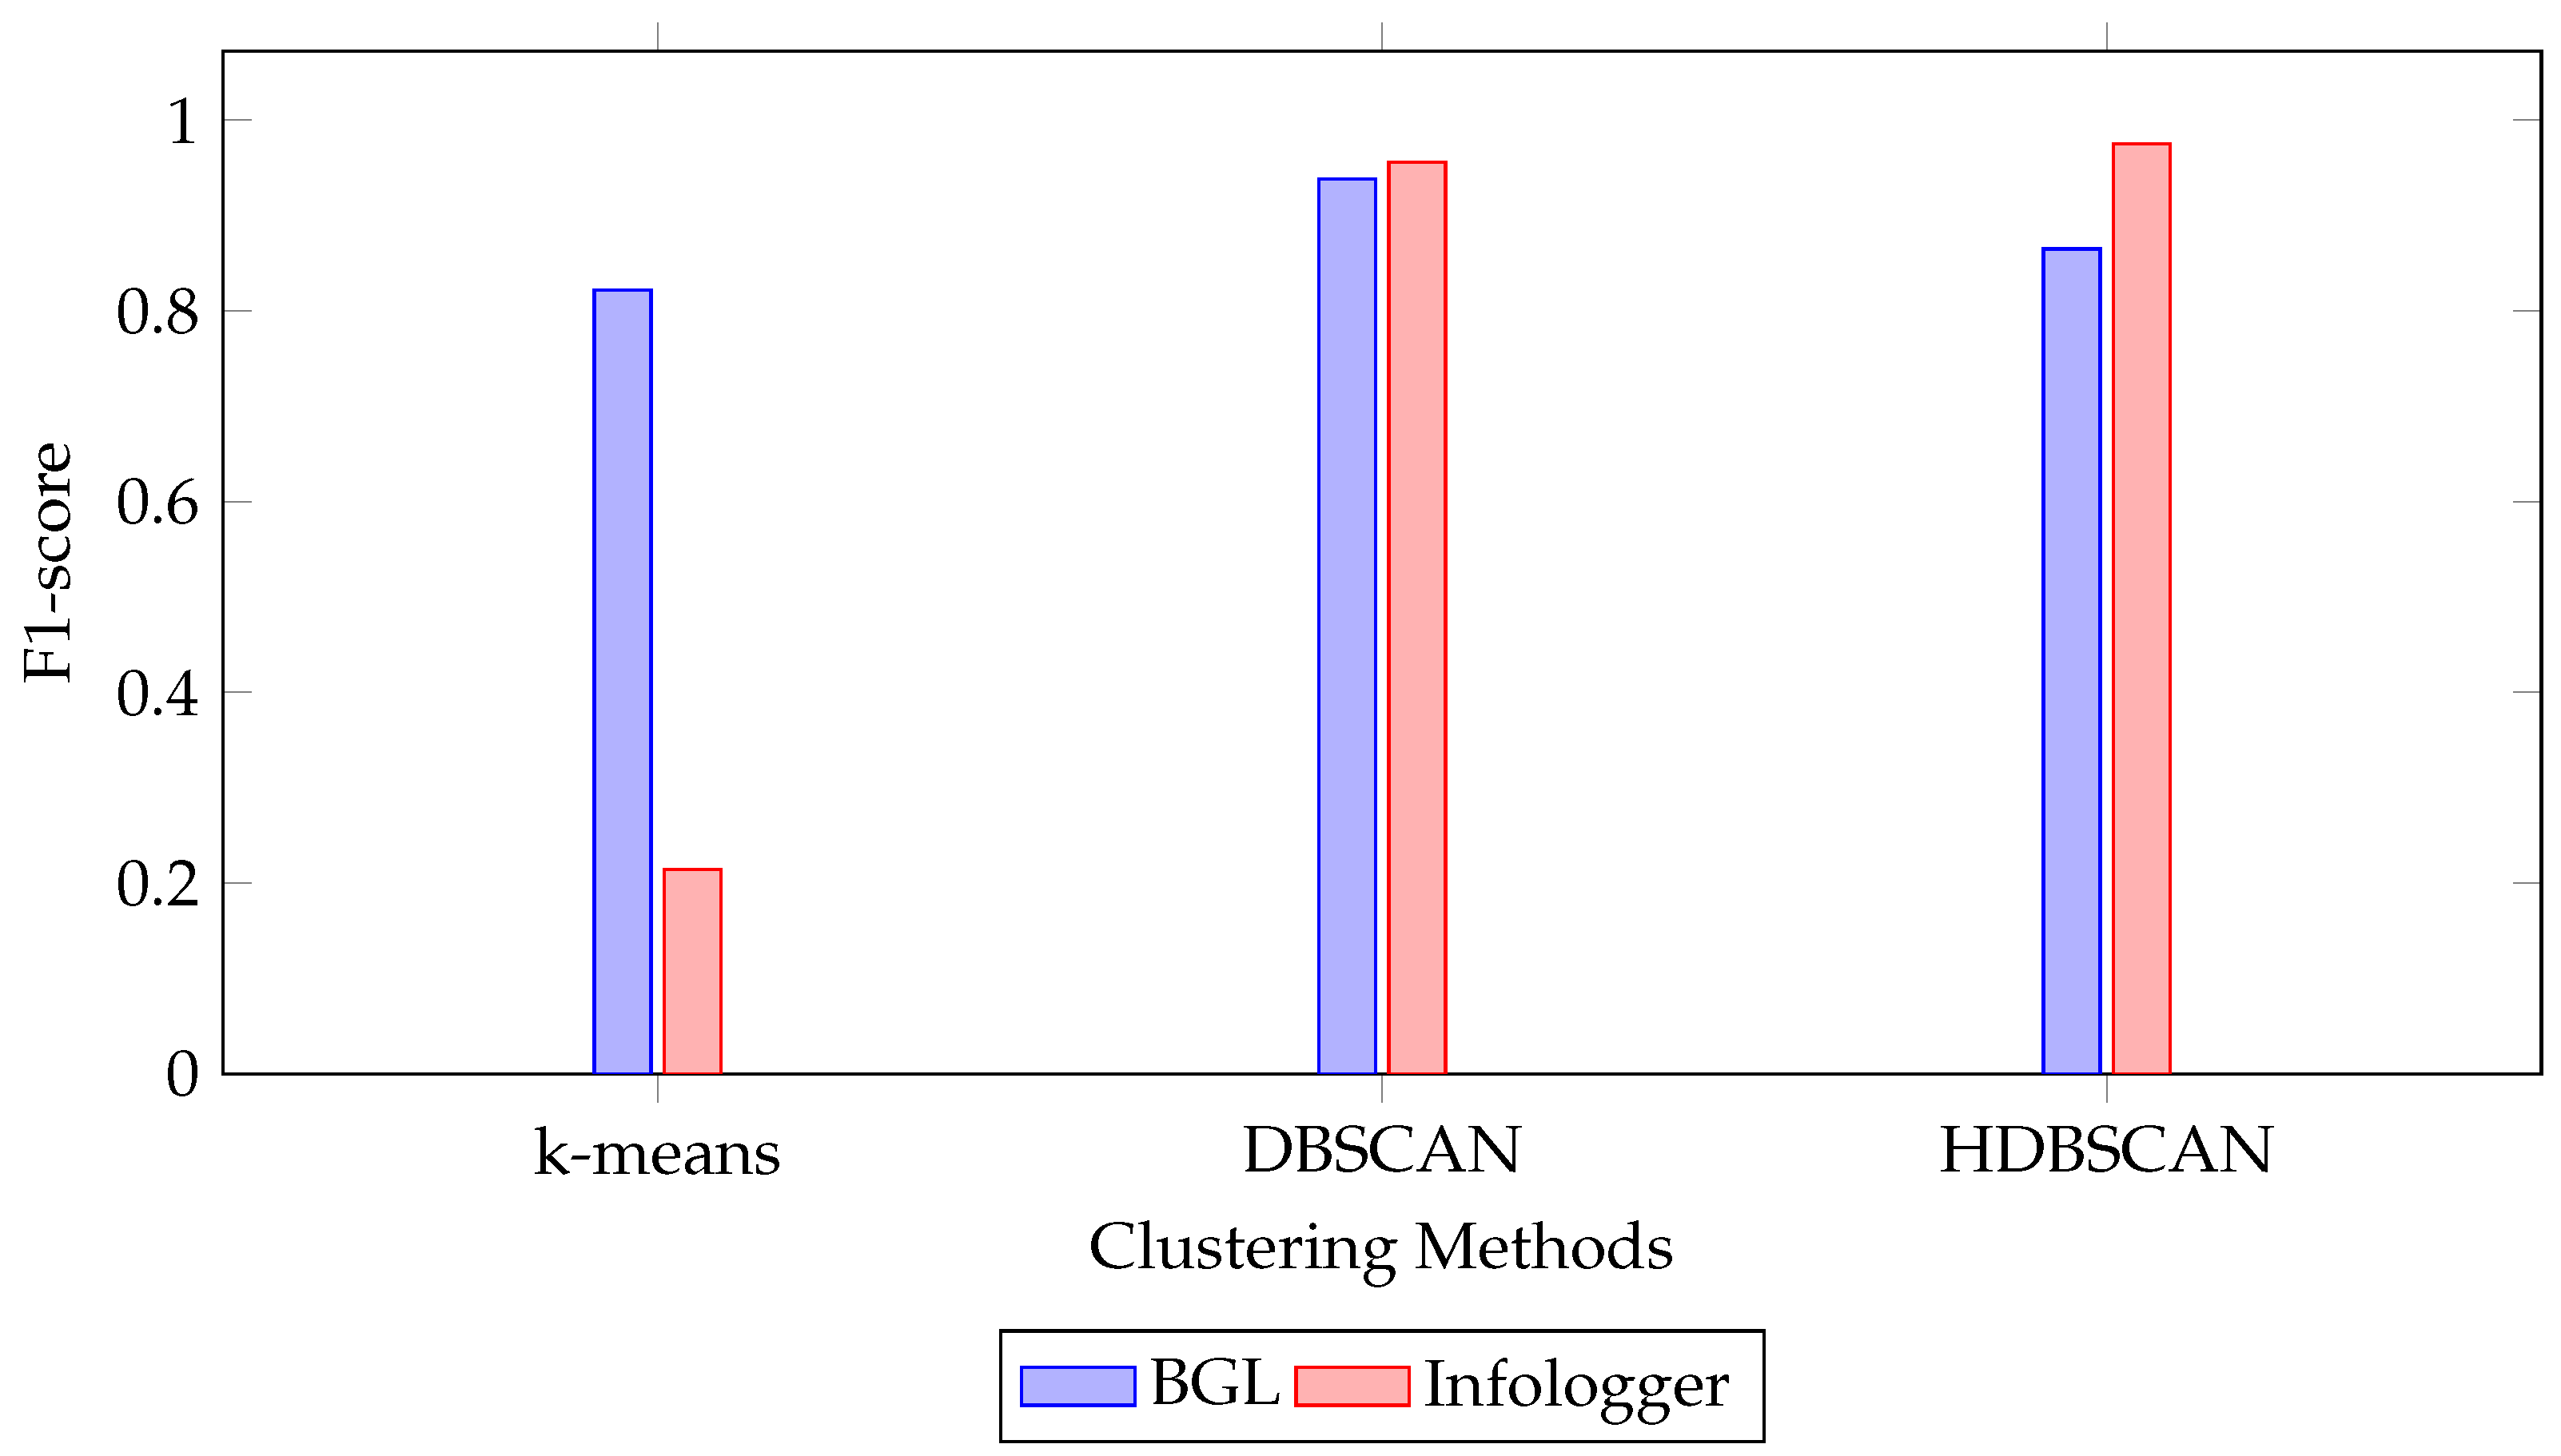
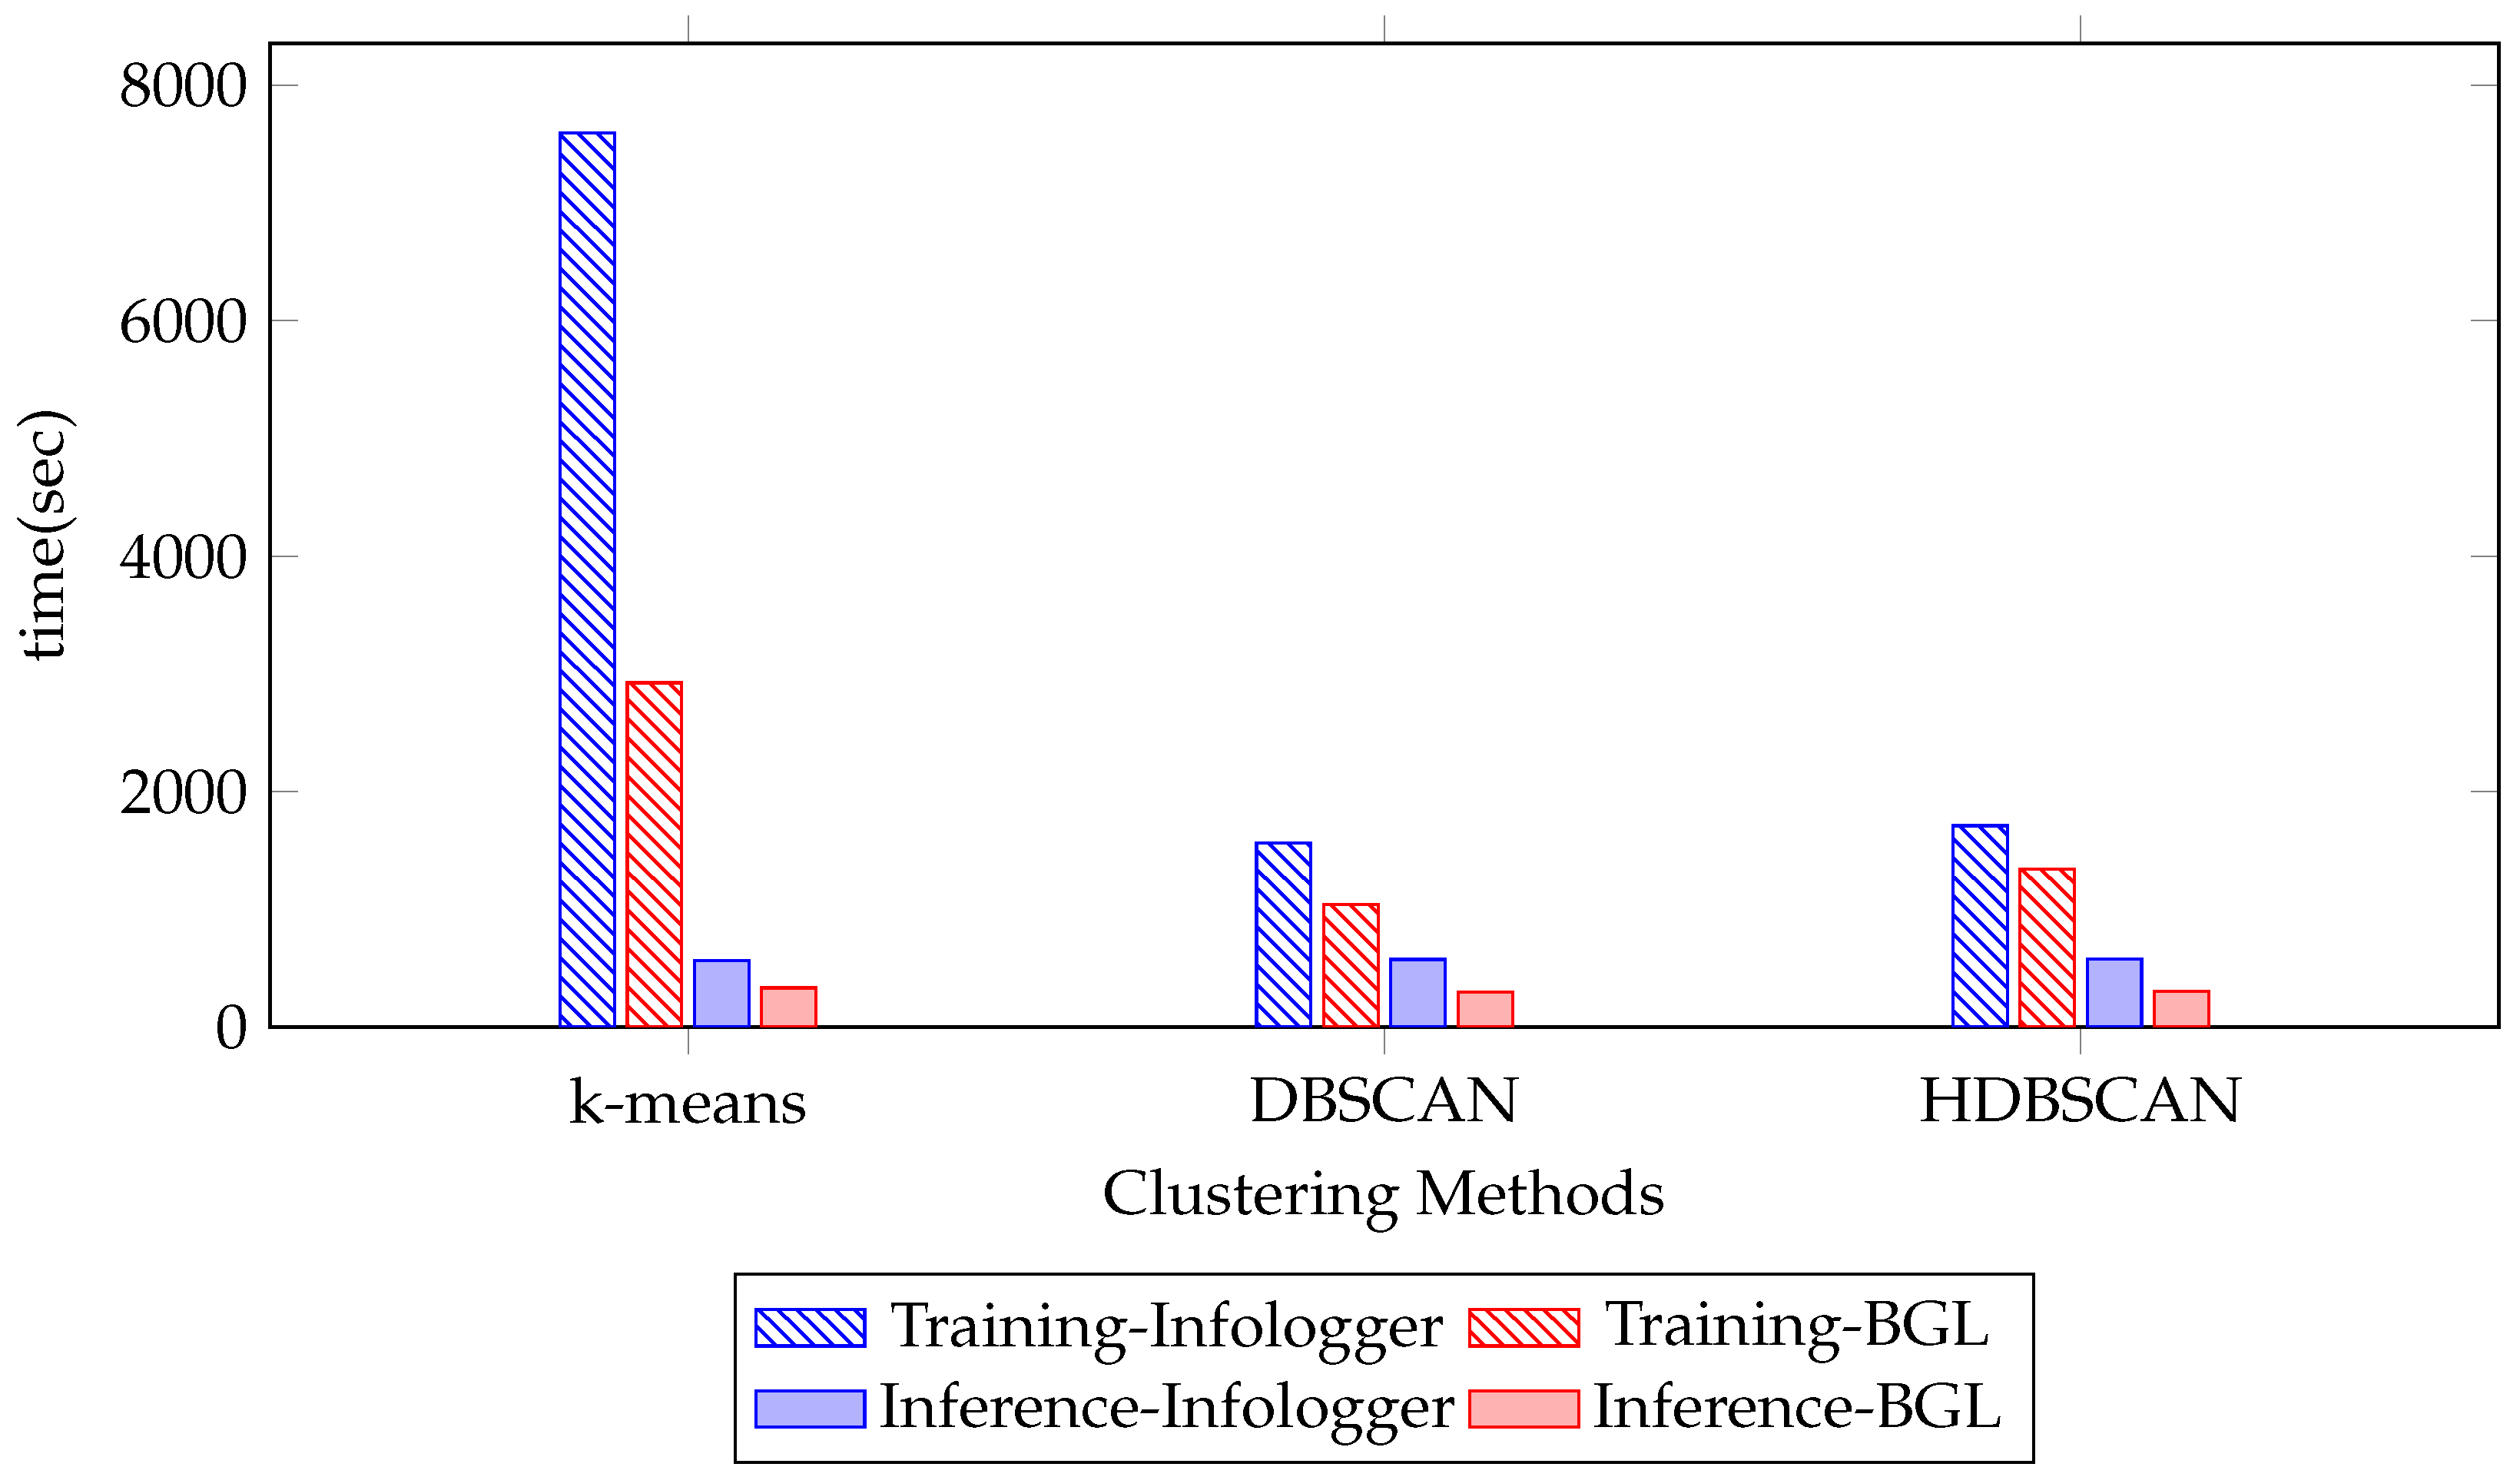
  • Clustering: The embedded vectors are clustered using Hierarchical Density-Based Spatial Clustering of Applications with Noise (HDBSCAN) [42] as a default algorithm in BERTopic. HDBSCAN excels at identifying clusters of varying densities, handling noise, and automatically determining the optimal number of clusters, making it ideal for complex data. Alternatively, other algorithms can be applied. DBSCAN [43], another density-based method, performs well for uniform-density clusters but requires manual parameter tuning and struggles with varying densities. K-means [44,45], a centroid-based algorithm, is computationally efficient but assumes spherical clusters and requires the number of clusters to be predefined.
  • Topic representation: Class-based Term Frequency-Inverse Document Frequency (c-TF-IDF) has been introduced in BERTopic for topic representation. It is an adaptation of the traditional TF-IDF technique designed for topic modeling. Unlike TF-IDF, c-TF-IDF calculates term significance within specific clusters or classes (e.g., topics). It aggregates term frequencies within a class and adjusts for their rarity across other classes, highlighting terms that define each topic. This approach is particularly effective in methods such as BERTopic, as it emphasizes the key terms that characterize each topic. This approach provides a meaningful representation of the underlying clusters by highlighting the terms that are used to define the cluster. The c-TF-IDF score for a term x within topic c is computed as follows:
    W x , c = t f x , c · l o g ( 1 + A f x )
    where tfx,c is the frequency of word x in class c, fx is the frequency of word x across all classes, and A is the average number of words per class.
In anomaly detection within logging systems, BERTopic can be employed to uncover latent topics in log entries, aiding in the identification of anomalous patterns or events. By extracting semantic topics from logs, the model can help distinguish between normal system behavior and potential anomalies, where an anomalous event might correspond with an unusual topic. For instance, logs containing error messages, system failures, or security breaches can be categorized into distinct topics that represent unusual activity, which can then be flagged as anomalies.
Figure 1 illustrates the proposed framework, which begins by ingesting raw log messages from the logging system. A preprocessing stage ensures consistency by standardizing log messages through data preprocessing tasks, as mentioned. After preprocessing, preprocessed log messages are transformed into high-dimensional embeddings using SBERT, which encodes their semantic content. These embeddings are then reduced in dimensionality using UMAP, preserving intrinsic structures while reducing computational complexity. Next, the reduced embeddings are clustered using HDBSCAN, which identifies topics and labels outliers as potential anomalies. Then, c-TF-IDF generates interpretable topic representations by extracting key terms for each cluster, enhancing user understanding. As a result, the framework produces two key outcomes for users which are anomaly classification results and an analytic dashboard for detailed log analysis.

3.1.3. Anomaly Classification

Anomaly classification is a crucial component of our proposed framework. Since the topic model operates in an unsupervised manner, it generates a topic distribution that represents the probability of a given log message belonging to all possible topics. Based on this distribution, the framework assigns the log message to the topic with the highest probability. In each topic, n-grams of words are extracted from log messages related to that topic, facilitating downstream applications such as text analysis and the study of log message behavior. However, when applied to anomaly classification, this approach does not inherently produce a binary decision indicating whether a log message is anomalous. To address this, we integrate topic representations with rule-based criteria for anomaly assessment. Specifically, log severity levels (e.g., INFO, WARNING, ERROR, and CRITICAL), which are already included within system-generated log messages, are leveraged to distinguish errors and prioritize critical issues.
The classification process produces the topic prediction. Log messages that do not align with the identified normal topics and are assigned as a high-severity level (e.g., ERROR and CRITICAL) are flagged as anomalies. This approach ensures that anomalies are not only identified based on their deviation from normal patterns but are also filtered by their potential impact or urgency, as indicated by their severity. Each flagged anomaly is accompanied by its corresponding log message content, providing context for further analysis and rapid response. This combination of topic modeling and log message severity enhances the reliability and interpretability of the anomaly classification.

3.1.4. Analytic Dashboard

Another outcome of our proposed framework is an interactive analytic dashboard, as shown in Figure 2, which visualizes the results of topic modeling using BERTopic. The dashboard is designed to support rapid diagnostics and anomaly classification by presenting detailed information about individual log messages through the following six components:
  • Anomaly status: This section prominently displays whether the analyzed log message is classified as an anomaly or normal. It enables operators to immediately assess the urgency of the issue.
  • Log message content: This part presents the original content of the log message, allowing users to understand the raw system output. It provides a whole context for interpreting the detected anomaly.
  • Classified topic: This shows the topic number assigned to the log message by BERTopic, indicating the cluster it belongs to. This helps group similar incidents and track recurring issues.
  • Log message information: This section contains key metadata fields extracted from the log, including severity, system, detector, and facility. These metadata elements are crucial for routing alerts to the correct subsystem experts and understanding the operational scope of the issue.
  • Topic terms: This panel lists the top keywords and multi-word expressions that define the assigned topic, along with their corresponding c-TF-IDF scores. These terms offer insight into the semantic themes captured via the model and aid in identifying anomaly terms.
  • Topic distribution: This pie chart illustrates the probabilistic topic distribution for the log message, showing how strongly the message aligns with other topics beyond the primary one. This probabilistic view supports uncertainty estimation and highlights potential overlaps or ambiguities in the message’s classification.
Together, these components provide a comprehensive and interpretable interface for analyzing log data, supporting both high-level system monitoring and in-depth anomaly investigation.
According to both outcomes, this framework aims to enhance the anomaly detection process significantly, improving both the detection accuracy and comprehension of log messages. The framework enables a deeper understanding of anomalous behaviors by offering detailed insights through an intuitive dashboard. This facilitates more effective identification and mitigation of potential issues, advancing log analytics and contributing to the development of more reliable systems.

3.2. Datasets

In this study, two datasets were utilized for experimental evaluation: InfoLogger [46], which comprises ALICE O2 application logs that document activities within the modular architecture of the ALICE facility, and BGL (BlueGene/L), one of the benchmark datasets in the Loghub [47] repository that offers a vast collection of system log datasets for log analytics research. Both examples of datasets are shown in Table 1, which illustrates the shared structure between InfoLogger and BGL logs, highlighting key fields such as timestamps, log levels, component identifiers, and message contents. More detailed information on each of the datasets is provided in the following subsections.

3.2.1. Infologger

InfoLogger serves as a critical infrastructure component for the collection, storage, and visualization of log messages generated via diverse processes operating across multiple machines in the ALICE detector. This system acts as a core broker, facilitating the aggregation of log data from a wide array of applications and services distributed throughout machines. As the ALICE detector evolves, newly introduced components are seamlessly integrated into this logging framework, ensuring comprehensive coverage of system activities. During active physics operations, the system experiences a high volume of log generation, which can be up to one million in each run due to the concurrent operation of multiple detectors and associated applications. The scale and complexity of the InfoLogger system present significant challenges for effective monitoring and anomaly detection.

3.2.2. BGL

The BlueGene/L (BGL) dataset represents a significant resource in the field of large-scale computing system analysis and anomaly detection research. This open-access dataset comprises logs collected from the BlueGene/L supercomputer system, a high-performance computing (HPC) infrastructure operated by Lawrence Livermore National Labs (LLNL) in Livermore, CA, USA. The system’s architecture is characterized by its impressive scale, incorporating 131,072 processors and 32,768 GB of memory and thus providing a rich source of operational data from a complex, distributed computing environment. BGL logs are particularly valuable due to their comprehensive nature, encompassing both alert and non-alert messages, which are distinctly identified through alert category tags. This binary classification is facilitated via a simple labeling scheme: non-alert messages are denoted with a “-” in the first column of the log, while alert messages are indicated with alternative markers. Such a clear delineation of alert statuses within the dataset renders it exceptionally suitable for research in anomaly detection. The BGL dataset has consequently gained prominence in the academic community, serving as a benchmark in numerous studies focusing on log-parsing techniques, anomaly detection algorithms, and failure prediction models in large-scale computing environments.
The statistics for both datasets are presented in Table 2, with a focus on anomaly sessions. InfoLogger contains only 387 confirmed anomalous sessions (0.48%), reflecting the limited availability of expert-verified anomalies, which poses challenges for evaluation. In contrast, BGL provides a more balanced distribution with 31,374 anomalous sessions (45.31%), making it well suited for comparative analysis. Both datasets share a key characteristic: the inclusion of a property that indicates the severity level of log content. Specifically, this property is referred to as “severity” in InfoLogger and “level” in BGL. We utilize this attribute to identify anomalies in log messages, serving as the ground truth labels for evaluation. This shared property forms a robust foundation for benchmarking our methodology. By leveraging the similarities between InfoLogger and BGL, we ensure a fair basis for experimental comparison.

3.3. Data Labeling

In the ALICE experiment, the InfoLogger dataset lacked predefined log labels. Addressing this necessitates an understanding of the operational context. During operations, shifters are responsible for managing the data collection process, which involves starting and stopping the collection of physics data from the detector as particle collisions occur. Shifters serve in different functions, such as quality control (QC), first-level processing (FLP), and the detector team, depending on their specific responsibilities. However, all shifters are required to perform a common task: logging actions and errors that occur during the experimental run. These logs are referred to as “Bookkeeping” logs, which document all actions undertaken by shifters during a given run. The structure of the bookkeeping logs enables the InfoLogger data to be categorized into potential anomaly topics. In this study, we manually explored the bookkeeping data and mapped them into the InfoLogger dataset to identify log messages associated with anomalous behavior. These manually labeled anomalous logs were then used for model training. For the BGL dataset, the labels were already provided, making the labeling process unnecessary in this case.

3.4. Baseline Methods

In this work, we selected LDA, LSA, and NMF as traditional algorithms for baseline methods. LDA’s parameters include n_components, doc_topic_prior, topic_word_prior, and learning_method. LSA’s parameters are n_components, n_iter, and n_oversamples. NMF’s parameters are n_components, solver, beta_loss, and other parameters. However, we focused solely on the n_components parameter, which determines the number of topics, and left other parameters at their default states. In upcoming experiments, other algorithms, such as LDA, LSA, and NMF, were not considered for hyperparameter tuning due to their inherent limitations when dealing with unprocessed log data and their dynamic density. These algorithms rely on fixed or rigid structures, making them less effective in capturing the evolving and non-uniform characteristics of log messages.

3.5. Hyperparameter Tuning on HDBSCAN
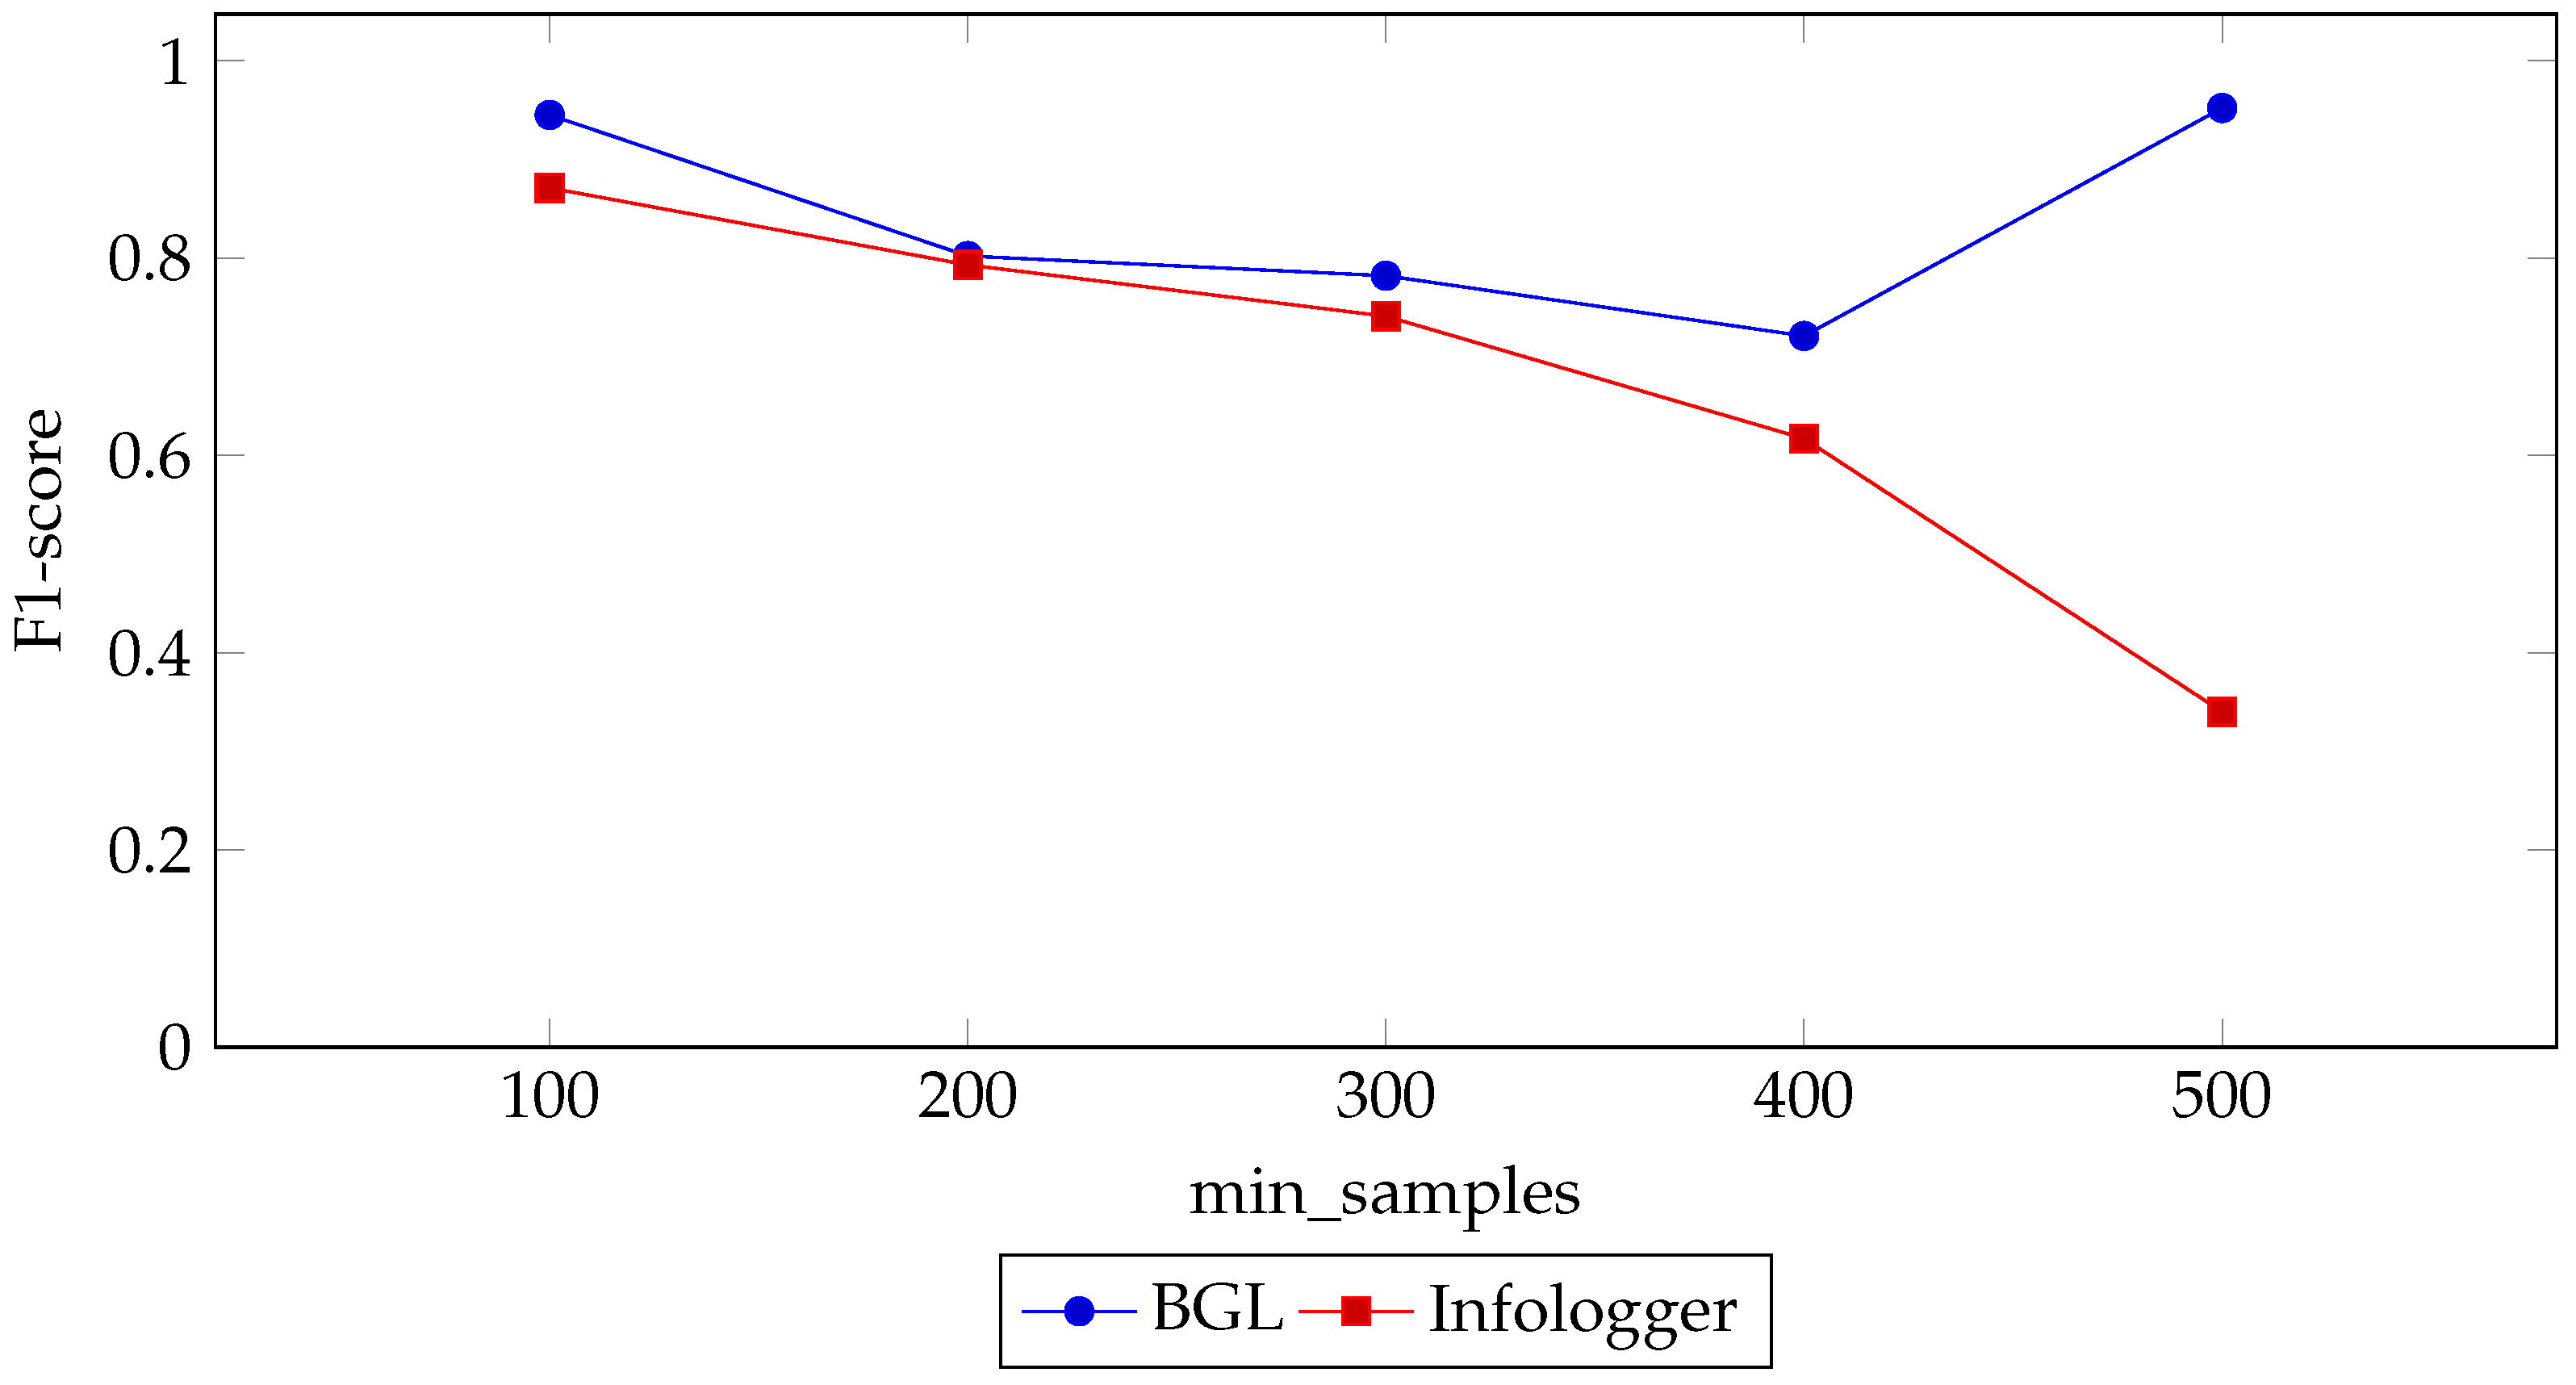
To optimize the performance of our framework, we focused our hyperparameter tuning exclusively on the HDBSCAN algorithm, which serves as a core component of the system. Density-based clustering approach in HDBSCAN is particularly well suited to this type of data, allowing for more adaptive anomaly detection.

3.5.1. Min_Samples

Min_samples is a parameter that is identical in both HDBSCAN and DBSCAN, as HDBSCAN is an extension of DBSCAN. The min_samples parameter determines the algorithm’s sensitivity to density variations within the data. In DBSCAN, it specifies the minimum number of points required to consider a point as a core point (i.e., a point surrounded by a minimum number of nearby points within a certain distance which the algorithm uses to identify clusters with high point density), effectively influencing how the algorithm differentiates between dense regions and sparse regions. This parameter indirectly controls the minimum-density threshold for forming clusters, with higher values resulting in stricter density requirements. Conversely, lower values relax the density criteria, enabling the detection of clusters in less dense areas.

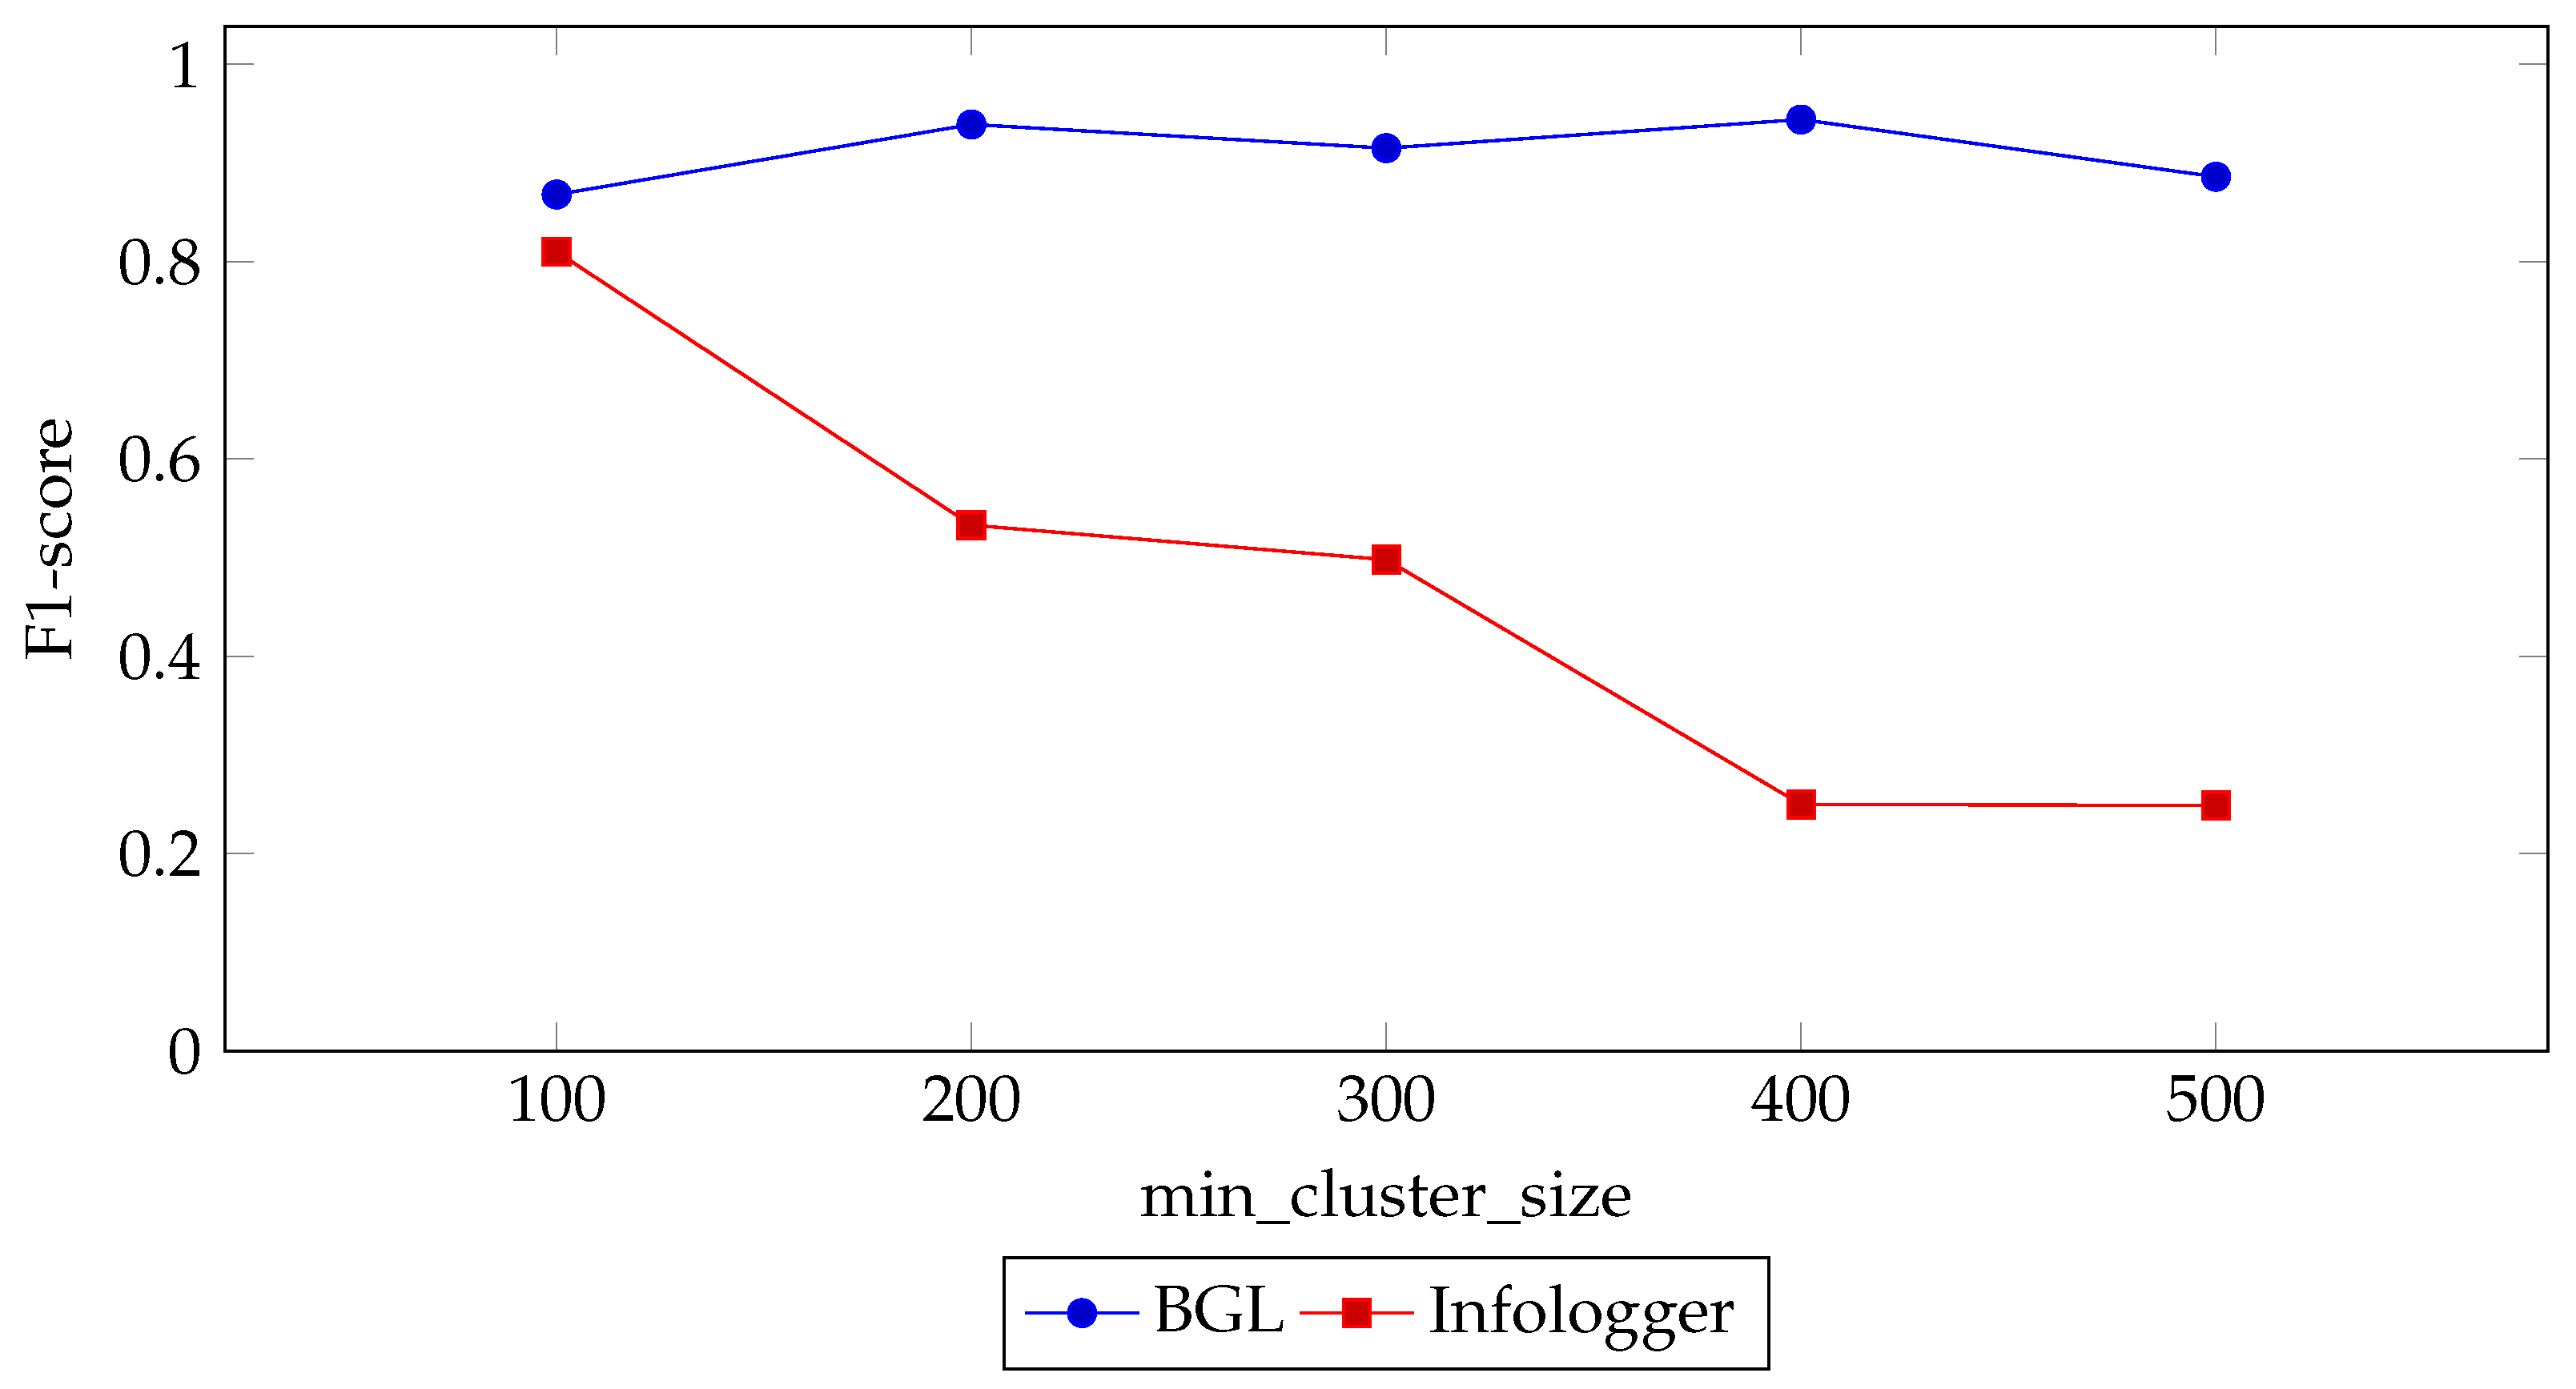
3.5.2. Min_Cluster_Size

The HDBSCAN introduces min_cluster_size as an additional parameter to DBSCAN. It serves as a critical determinant for the minimum number of points required to form a cluster by establishing the smallest number of log messages that the algorithm will recognize as a valid cluster, thereby influencing the resolution of clustering results. This parameter ensures that clusters are composed of a sufficiently dense group of points, avoiding the identification of noise or outliers as separate clusters. A smaller min_cluster_size allows the algorithm to detect finer-grained, potentially smaller clusters, while a larger value promotes the formation of broader and more robust clusters. However, a larger value also ignores small clusters if it is excessively large. This parameter is particularly important in controlling the granularity and reliability of clustering outcomes.

3.5.3. Cluster_Selection_Epsilon

Unlike DBSCAN, HDBSCAN also includes the cluster_selection_epsilon parameter. The cluster_selection_epsilon extends the hierarchical cluster selection process in HDBSCAN by merging clusters that are in close proximity to each other within the spanning tree. It essentially defines a distance threshold that determines how far apart clusters can be before being considered for merging. A smaller cluster_selection_epsilon results in sparse boundaries, preserving more distinct and separate clusters, whereas a larger value allows for broader merging, potentially combining closely related clusters into a single, larger cluster. In relation to min_cluster_size, this mechanism is particularly useful in applications where the smaller cluster is considered but where we want to avoid micro-clusters inside the large cluster, as it provides additional control to adapt the clustering results to the specific needs of the dataset or the analysis objectives.
In the experiment, we systematically evaluated HDBSCAN’s performance by modifying individual hyperparameters while maintaining all other parameters at their scikit-learn default values (https://scikit-learn.org/1.5/modules/generated/sklearn.cluster.HDBSCAN.html (accessed on 17 March 2025)), as shown in Table 3.

3.6. Evaluation

To evaluate our experiment, five evaluation metrics were used to measure the performance of the proposed framework in detecting anomalous log messages. These metrics were precision, recall, F1-score, the false positive rate (FPR), and the false negative rate (FNR), all of which can be computed based on values provided in the confusion matrix (i.e., true positives (TPs), false positives (FPs), false negatives (FNs), and true negatives (TN)).
In particular, for this study, the main focus was on recall, which measures the ability of the framework to detect all anomalous log messages in the dataset. Maximizing recall is critical in high-stakes environments like the ALICE experiment, where detecting every anomaly is essential to minimize the risk of undetected system failures. Recall can be computed using the following formula:
R e c a l l = T r u e P o s i t i v e T r u e P o s i t i v e + F a l s e N e g a t i v e .
Precision is also important, as it evaluates the proportion of correctly identified anomalies among all messages flagged as anomalous. High precision ensures fewer false positives, reducing unnecessary alerts and making the system more practical for real-world monitoring. Precision can be computed as follows:
P r e c i s i o n = T r u e P o s i t i v e T r u e P o s i t i v e + F a l s e P o s i t i v e .
While recall is prioritized, the F1-score is used to balance recall and precision by providing a single measure of overall performance. As the harmonic mean of precision and recall, the F1-score ensures that the model not only captures anomalies effectively but also maintains accuracy in its predictions. This combination of metrics enables a robust evaluation of the framework, ensuring its effectiveness in detecting anomalies and its reliability in operational contexts. The F1-score can be computed as follows:
F 1 s c o r e = 2 × P r e c i s i o n × R e c a l l P r e c i s i o n + R e c a l l .
In addition to the above metrics, the anomalies mostly occur rarely and lead to an imbalanced class problem. Precision and recall can be biased towards the majority class as a simple strategy of always predicting the majority class can yield high precision and recall scores, but this is not a desirable outcome, as it fails to capture the model’s ability to identify the minority class instances correctly. Therefore, the other two metrics included in this work were the false positive rate (FPR) and the false negative rate (FNR).
FPR is commonly termed the false alarm rate. It quantifies the proportion of negative instances (e.g., normal cases) that are incorrectly classified as positive (e.g., anomalous cases) through the classification model. A high FPR can be problematic because it leads to an increased number of false alerts, which can pose an inconvenience to system administrators, who receive erroneous alerts generated via the model. FPR is defined as follows:
F P R = F a l s e P o s i t i v e T r u e N e g a t i v e + F a l s e P o s i t i v e .
FNR, commonly termed the misdetection rate, quantifies the likelihood that the model will fail to detect or identify a positive instance, resulting in a missed detection or a false negative prediction. A high false negative rate can be problematic because it carries severe implications for administrators, leading to unexpected system failures. FNR is defined as follows:
F N R = F a l s e N e g a t i v e T r u e P o s i t i v e + F a l s e N e g a t i v e .
Incorporating FPR and FNR alongside precision, recall, and F1-score provides valuable insights into the model’s ability to identify the minority class instances correctly while minimizing false alarms.

3.7. Experimental Setup

Our experiments were performed on a virtual machine simulating from a Linux server with 16 Intel(R) Xeon(R) Gold 6126 CPUs, 64 GB of RAM, and a single NVIDIA TESLA V100 with 32 GB of vRAM. All development was performed using the Python programming language (https://www.python.org/downloads/release/python-31016 (accessed on 17 March 2025)), including the Pandas, Scikit-Learn, Gensim, and BERTopic packages.

4. Results and Discussion

In this section, we present the results of three experiments. First, we evaluate the performance of our model in comparison to existing topic modeling techniques. Second, we investigate the impact of different clustering algorithms within the modular BERTopic framework to identify the most effective algorithm. Third, we perform hyperparameter tuning, focusing on three key parameters: min_cluster_size, min_samples, and cluster_selection_epsilon in order to optimize the model’s configuration. All experiment results are averaged across the five time runs conducted in each experiment to ensure the reliability of the results.

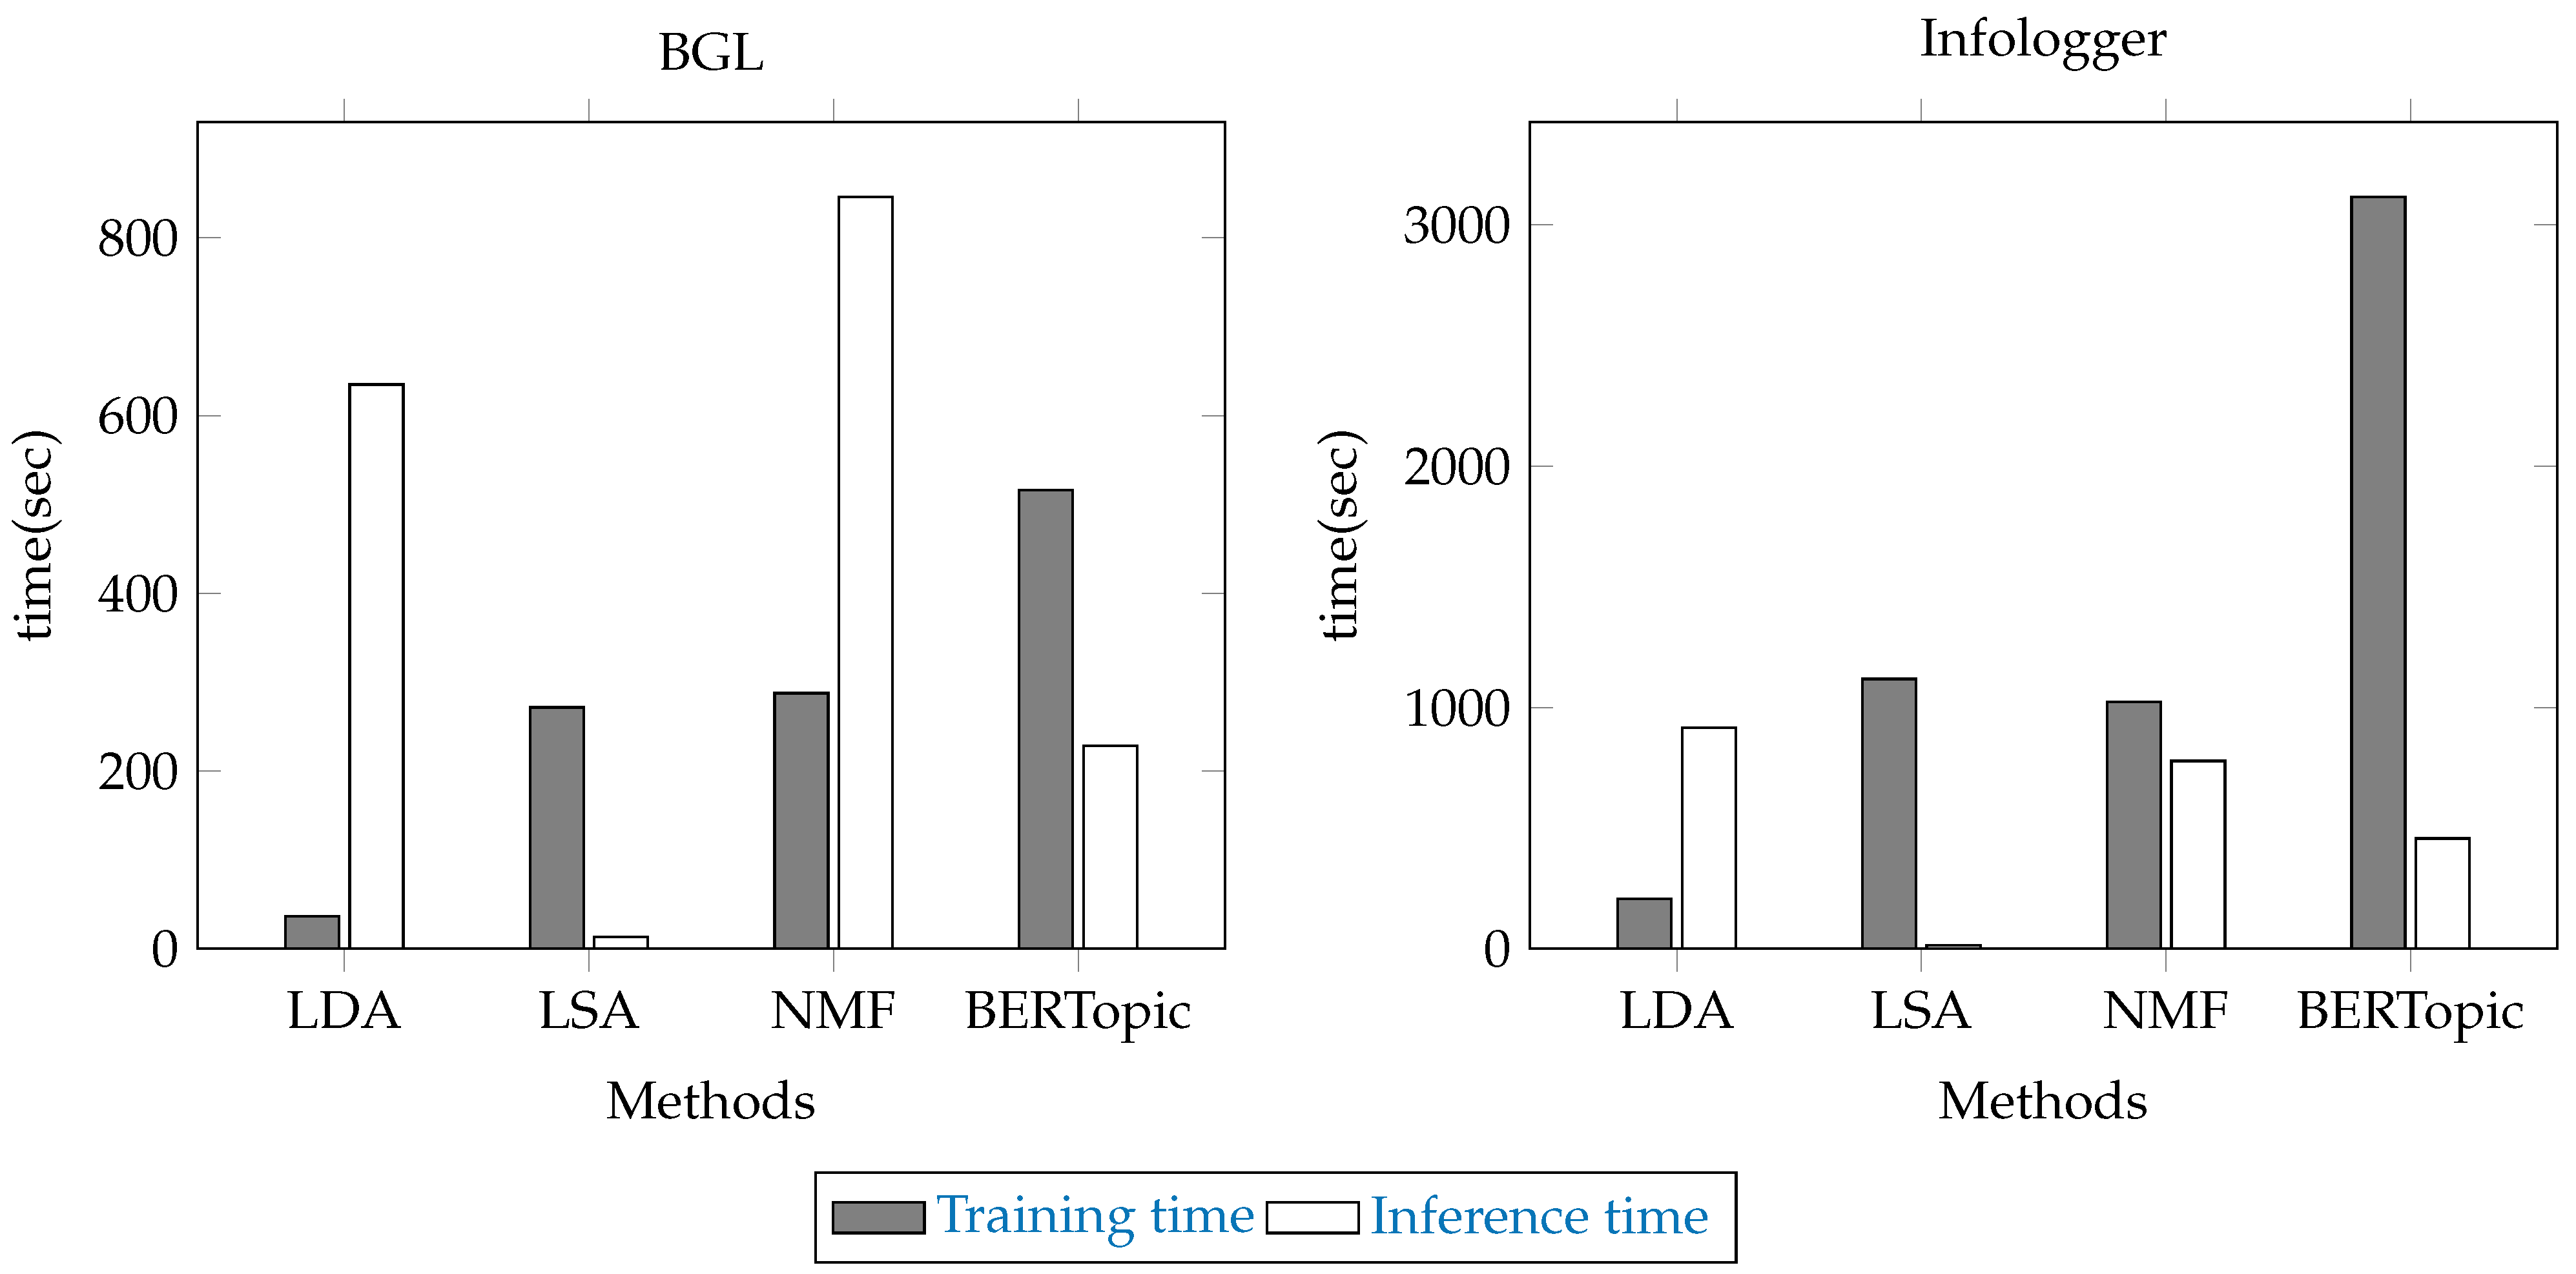
4.1. Comparison with Traditional Topic Models

In the first experiment, we evaluated the capability of various models, including traditional approaches and BERTopic, to handle raw data. Traditional approaches such as LDA requires a predetermined number of topics, making it necessary to establish a fixed number of topics for a fair comparison and to investigate the performance when the number of topics varies. However, in subsequent experiments with BERTopic, we leveraged its ability to determine the optimal number of topics dynamically based on the dataset. This approach provided insights into how BERTopic adapts to different data distributions compared to traditional models. The results of this experiment are presented in two tables: Table 4 shows the performance on unprocessed data, while Table 5 presents the results from preprocessed data.
In terms of preprocessing, it significantly enhanced model performance in specific datasets, particularly for InfoLogger. Overall metrics showed marked improvements, with FPR and FNR decreasing notably after the preprocessing, as the best settings of each algorithm are presented in Figure 3. LSA achieved the highest F1-score at 0.990 in the InfoLogger dataset, followed closely by LSA at 0.989. In contrast, the unprocessed datasets exhibited significantly low performance, with the lowest F1-score at 0.247 in LDA. For the BGL dataset, the results were different. All preprocessed data revealed the worst performance across all models, with the lowest F1-score at 0.587 in LDA. This contrast can be explained by differences in the structure and content of the datasets, particularly in relation to the preprocessing strategy employed. The preprocessing pipeline relied on a fixed regular expression format to clean and standardize log messages before modeling. While this approach was effective for the InfoLogger dataset, where the log structure was relatively consistent and the regular expression could reliably remove noise without affecting informative content, it proved harmful for the BGL dataset. The BGL logs have a different structure, often embedding crucial information in positions or formats not accounted for by the fixed regular expression. As a result, important tokens and contextual cues were inadvertently removed or distorted during preprocessing. This negatively impacted the topic modeling process, leading to poor topic coherence and degraded classification performance. Therefore, the gap in results underscores a key limitation of using one preprocessing format to fit all datasets, resulting in reduced effectiveness. These findings emphasize the importance of customizing preprocessing techniques to better align them with the requirements of each dataset, ensuring consistent and reliable model performance.
In terms of computational efficiency, traditional topic modeling methods exhibited varying training and inference times. The training time defines the time required to train the entire dataset, while the inference time defines the time required to classify new topics based on the trained model on the entire dataset. As illustrated in Figure 4, the results indicate that the LDA and NMF tended to have relatively high inference times compared to other approaches, with the highest inference time 915.51 s in Infologger. As a generative model, LDA requires computationally intensive inference and sampling procedures. Similarly, NMF’s multiplicative update rule can be costly, particularly for large datasets. In contrast, LSA achieves the lowest inference time at 14.49 s in Infologger since it relies on precomputed matrices, enabling efficient topic assignment through simple matrix multiplication. Regarding BERTopic, its training time is generally longer than that of traditional methods due to the integration of clustering algorithms, which involve more complex update rules. However, its inference time remains moderate at 456.91 s, as it still requires embedding and dimensionality reduction, which introduce some computational overhead.
Among the models evaluated, NMF emerged as the most effective approach. On the unprocessed InfoLogger dataset, NMF achieved the highest F1-score (0.977) at 300, demonstrating its ability to classify log messages accurately. Similarly, LDA and BERTopic also delivered high precision and recall, making them competitive alternatives to NMF. In the BGL dataset, NMF was still the most effective approach in both before and after preprocessing. NMF achieved an F1-score of 0.941 at 200 in the unprocessed BGL dataset, while LSA and LDA followed closely with F1-scores ranging from 0.876 to 0.890.
These empirical findings demonstrate that preprocessing procedures have more influence than models and the number of topics, highlighting their importance in the analysis workflow. Nevertheless, preprocessing remains inherently dataset-specific and requires careful consideration for each specific case. Despite their performance, traditional methods still incurred substantial computational overheads during inference time. This is because traditional algorithms needed to update their results multiple times to converge to an optimal solution, excluding the LSA matrices, which had already been computed. While this trade-off enhanced performance, it still resulted in significant computational costs. However, BERTopic achieved moderate results in both performance and time consumption. Consequently, the next experiments explored BERTopic’s capacity to handle unprocessed data through parameter optimization, potentially providing insights into more robust topic modeling solutions.

4.2. The Effect of Clustering Algorithm

As illustrated in Figure 1, the BERTopic architecture employs a modular design that can be decomposed into distinct functional components. The clustering mechanism serves as the algorithm’s core element, responsible for cluster identification and topic assignments. To assess BERTopic’s performance characteristics, a comprehensive comparative analysis was conducted. As detailed in Table 6, this analysis evaluated three distinct clustering methodologies across the two datasets: K-means, DBSCAN, and HDBSCAN.
For the InfoLogger dataset, HDBSCAN demonstrated superior performance with an F1-score of 0.975 while maintaining minimal FPR and FNR. DBSCAN also achieved competitive effectiveness with an F1-score of 0.956, whereas K-means showed significantly diminished performance, suggesting its inadequacy for density-based clustering requirements. In the BGL dataset analysis, DBSCAN emerged as the optimal clustering method, followed closely by the HDBSCAN. The K-means again demonstrated suboptimal performance, indicating its limitations in the efficiency of clustering the embeddings.
Figure 5 reveals that the density-based clustering algorithms, specifically DBSCAN and HDBSCAN, demonstrated superior performance compared to K-means across both datasets. In particular, DBSCAN achieved optimal results when applied to the BGL dataset, whereas HDBSCAN exhibited maximum effectiveness in processing the InfoLogger dataset. Nevertheless, DBSCAN’s functionality was limited by its requirement to yield uniform density across clusters, presenting a limitation for complex datasets. With HDBSCAN’s hierarchical architecture, it was able to handle variable density distributions across different clusters which means it can effectively accommodate complex datasets like InfoLogger.
Figure 6 presents the time consumption of each algorithm. The results indicate that K-means exhibited the longest training time compared to DBSCAN and HDBSCAN. Notably, when applied to larger datasets such as InfoLogger, the training time of K-means increased exponentially, highlighting its major limitation as a computationally expensive algorithm. In contrast, DBSCAN and HDBSCAN demonstrated less time consumption, with HDBSCAN requiring slightly more training time than DBSCAN due to its hierarchical clustering mechanisms. Regarding inference time, both datasets exhibited competitive time consumption across all three algorithms.
According to the common structure of HDBSCAN and DBSCAN, as mentioned in Section 3.5, the third experiment focused on the parameter optimization of HDBSCAN to investigate whether fine-tuning could address the limitations observed in the current default setting.

4.3. The Effect of Hyperparameter in the HDBSCAN

In the last experiment, we investigated the effects of the key hyperparameters in HDBSCAN on clustering results and performance. Specifically, we focused on the three main parameters: min_cluster_size, which determines the smallest size of clusters; cluster_selection_epsilon, which controls the density level for cluster separation; and min_samples, which influences the minimum number of points required to define a dense region. By systematically testing these parameters, we aimed to understand their impact on the effectiveness of clustering outcomes.

4.3.1. Min_Cluster_Size

First, we examined how min_cluster_size affected HDBSCAN’s topic-clustering behavior. This parameter controls the minimum number of samples required for establishing new topics within the dataset. The results are presented in Table 7.
For the InfoLogger dataset, a progressive increase in min_cluster_size decreased the model’s precision while maintaining high recall values. The optimal configuration was achieved at 100, yielding the highest F1-score (0.810) and minimal error rates. Conversely, the BGL dataset exhibited different behavior, reaching peak performance at 400 with exceptional F1-score (0.944) as illustrated in Figure 7. However, a further increase to 500 led to a slight degradation in all performance metrics. These findings emphasize the delicate fine-tuning in parameter selection. While larger min_cluster_size values generally improved precision and reduced false positives, excessive values sometimes led to cluster overgeneralization, compromising the model’s ability to maintain high recall. This analysis established dataset-specific optimal values, with InfoLogger and BGL performing best at 100 and 400, respectively.

4.3.2. Cluster_Selection_Epsilon (ε)

Second, we examine cluster_selection_epsilon (ε), which determines the granularity of topic clustering. The various configurations are evaluated in Table 8.
The cluster_selection_epsilon (ε) parameter demonstrated distinct effects across the two datasets. For the InfoLogger dataset, the lowest configuration (0.01) established a strong baseline with exceptional performance across all metrics. The moderate configuration resulted in fair performance in cluster_selection_epsilon up to 0.05, demonstrating acceptable performance across this range. However, a critical threshold was observed at 0.09, where the model experienced a substantial degradation in precision and F1-score, suggesting that excessive epsilon values lead to over-generalization in topic assignment. The BGL dataset exhibited notably different behavior, as illustrated in Figure 8. Lower epsilon values (0.01 and 0.03) yielded fair performance, while moderate values (0.05–0.07) showed slightly lower performance compared with lower previous scores, with optimal results at 0.09. This pattern indicates that the BGL dataset requires larger epsilon values to consolidate dispersed embeddings effectively into coherent topics.

4.3.3. Min_Samples

Third, we examined min_samples, which represents a fundamental property shared between the DBSCAN and the HDBSCAN algorithms. This parameter defines the minimum number of neighboring points required for a data point to be considered a core point. The core distance refers to the distance from a core point to its min_samples-th nearest neighbor. This directly affects how clusters form and how densely packed points need to be in order to be grouped together. By adjusting min_samples, we can control the algorithm’s sensitivity to clusters, influencing both their size and structure. The various configurations of min_samples are presented in Table 9.
The min_samples parameter exhibited distinct performance patterns across both datasets. The InfoLogger dataset showed optimal performance at the lowest min_samples values (100), achieving high precision while maintaining a high recall rate. However, a critical threshold was observed at min_samples equal to 500, where the model experienced a severe performance degradation across all metrics. This pattern suggests that, while higher min_samples values can enhance precision and reduce FPR, excessive values may lead to overgeneralization and missed cluster identification. Conversely, the BGL dataset displayed optimal performance at lower and higher min_samples values (100 and 500), with peak metrics achieved at 500, followed by degradation performance in moderate min_samples (200–400). The different behaviors of the two datasets, as visualized in Figure 9, indicate that min_samples optimization is highly dataset-dependent, with InfoLogger favoring lower values for optimal performance while BGL benefits from higher min_samples settings.
The comprehensive analysis of the HDBSCAN’s three primary parameters revealed a hierarchical influence on model performance. For the InfoLogger dataset, the cluster_selection_epsilon demonstrated the most substantial impact, followed by min_samples, while min_cluster_size exhibited the least significant effect for an optimal solution. For the BGL dataset, the min_samples had the most effect, followed by min_cluster_size and cluster_selection_epsilon, sequentially. This finding underscores the necessity of specific parameter tuning. In the case of InfoLogger, the primary challenge lies in the identification of small clusters, necessitating a precise adjustment of cluster_selection_epsilon, which directly aggregates these clusters into larger, more related groups. Conversely, for the BGL dataset, min_samples appears to be more highly influenced by regulating cluster density. As a result, cluster_selection_epsilon had a minimal impact to no impact on the BGL dataset. Through the optimal parameter configuration derived from these experimental iterations, BERTopic achieved remarkable performance metrics, attaining F1-scores of 0.957 and 0.958 for the InfoLogger and BGL datasets, respectively, demonstrating the model’s robust capability when properly tuned.
An alternative approach to evaluating BERTopic’s performance involves analyzing log message embeddings through the two-dimensional visualizations of reduced-dimensionality embeddings. As illustrated in Figure 10, the transformer architecture demonstrated remarkable capability in learning robust representations prior to the clustering phase. The visualization, generated using UMAP for dimensionality reduction, represents log message embeddings in a two-dimensional space. In this figure, each dot corresponds to a log message, and its position is determined by the UMAP’s projection from a high-dimensional embedding space. Dots with the same color belong to the same topic, as assigned via BERTopic, and their proximity reflects the semantic similarity of the log messages. The visualization reveals distinctly delineated regions for individual clusters, indicating effective semantic separation. Nevertheless, the inherent limitations of the two-dimensional representation manifest in regions where multiple topics overlap. This can be categorized into two primary scenarios. The first scenario involves semantically distinct topics appearing in close proximity due to dimensional constraints, where additional dimensions might provide better separation. Additionally, some clusters may have merged, as the number of topics was limited to 300 for clearer presentation. The second scenario encompasses related topics that are differentiated through HDBSCAN’s hierarchical clustering. As shown in Figure 11, the log messages within the rectangular area in Figure 10 share the same prefix, “Storing MonitorObject”, with variations in the path’s suffix. Although most of this area is assigned the same brown color, some log messages are assigned different colors, indicating that BERTopic identified subtle differences in the path suffix and classified them as distinct topics. Addressing this may require more refined hyperparameter tuning or manual post-processing to consolidate these log messages into a single topic. The quality of these learned representations extends beyond anomaly detection, offering opportunities for integration with other machine learning algorithms and applications in future research and development initiatives.
In summary, the proposed framework proved to be highly effective when applied to the InfoLogger system, primarily due to the characteristics of the anomalies and the operational workflow within the ALICE facilities. One of the primary needs of the shifter is access to meaningful anomaly-related terms. These terms are crucial not only for identifying known anomalies but also for recognizing previously unseen ones, supporting rapid decision-making during physics runs. Moreover, the framework demonstrates a degree of generalizability, especially in its clustering component. For instance, the cluster_selection_epsilon parameter used within the HDBSCAN algorithm plays a key role in balancing sensitivity to both dense and sparse clusters. This makes it particularly suitable as an initial hyperparameter for tuning across different datasets or monitoring systems. Its adaptive nature allows the algorithm to capture both small, fine-grained anomaly clusters and broader, more diffuse patterns, which enhances the framework’s applicability beyond the InfoLogger dataset.
Furthermore, an understanding of the topic distribution across log messages is essential for conducting thorough investigations into the underlying causes of anomalies. By employing BERTopic, the framework generates interpretable topic representations along with relevant terms, allowing the shifter to analyze anomalies without requiring prior knowledge of the specific operational context. This stands in contrast to conventional frameworks based on binary classification, which simply flag anomalies without providing actionable insights. Such approaches are insufficient in complex environments like the ALICE facilities, where shifters must take responsibility for diagnosing errors and tracing their root causes. The integration of topic modeling into anomaly detection thus represents a significant methodological advancement that not only enhances the interpretability of log analysis but also offers a scalable and informative solution that can be extended to other complex logging systems.

5. Conclusions

In conclusion, this research has presented a framework for log-based anomaly detection that effectively combines natural language processing techniques with density-based clustering algorithms. Through comprehensive experimental evaluation, we demonstrated several key contributions to the field. First, our framework demonstrated remarkable resilience in processing raw log messages, delivering exceptional performance metrics. It achieved F1-scores of 0.957 and 0.958 for the InfoLogger and BGL datasets, respectively. This remarkable performance eliminated the need for complex preprocessing configurations that often require dataset-specific tuning. This capability significantly enhances the framework’s practical applicability in real-world scenarios.
Second, our comparative analysis established the superiority of density-based clustering approaches over traditional methods. Both DBSCAN and HDBSCAN demonstrated more competitive performance compared to K-means clustering, with DBSCAN proving particularly effective as a default configuration for datasets with static density distributions, such as InfoLogger. Additionally, HDBSCAN excelled in handling varying cluster densities, a critical feature for real-world log analysis, for which log message distributions are inherently heterogeneous. The integration of SBERT embeddings with BERTopic further enhanced this framework, enabling the sophisticated semantic representation of log messages without requiring extensive preprocessing.
Our research extends the application of topic modeling techniques to anomaly detection, equipping system administrators with interpretable topic distributions that enhance log message classification and analysis. The framework integrates real-time intervention capabilities through a comprehensive dashboard, enabling users to detect anomalies and respond to potential issues with minimal delay. Since logging systems vary and require dedicated tuning based on dataset characteristics, as discussed in the sections on InfoLogger and BGL in this study, our framework is built for adaptability. This flexibility makes it suitable for different real-world logging environments, providing a robust solution for log-based anomaly detection.
These findings not only validate our approach but also contribute to the understanding of log-based anomaly detection systems. Future research could explore the framework’s adaptability to different log sources and its potential integration with real-time monitoring systems. Additionally, since our current approach relies on a semi-supervised setup by guiding the model with seed words, future work could investigate the feasibility of an unsupervised method or an automated approach to generating seed words to reduce human dependency in the system.

Author Contributions

Methodology, A.T.; Validation, S.T., V.C.B. and P.P.; Writing—original draft, A.T.; Writing—review & editing, S.T., V.C.B. and P.P.; Project administration, V.C.B. All authors have read and agreed to the published version of the manuscript.

Funding

This research was funded by NSRF via the Program Management Unit for Human Resources & Institutional Development, Research and Innovation under grant number B39G670016, and this research was funded by the National Science and Technology Development Agency grant number P-19-51650.

Institutional Review Board Statement

Not applicable.

Informed Consent Statement

Not applicable.

Data Availability Statement

The data presented in this study are both available publicly and available upon request from the corresponding author. For the BGL dataset, the data are publicly available at https://github.com/logpai/loghub (accessed on 17 March 2025). For the InfoLogger dataset, the data are not publicly available due to CERN’s privacy.

Acknowledgments

This work was supported in part by King Mongkut’s University of Technology Thonburi through the Petchra Pra Jom Klao Master’s Degree Scholarship Program, in part by the Big Data Experience Center, Thailand, and in part by the European Organization for Nuclear Research (CERN), Switzerland.

Conflicts of Interest

The authors declare no conflicts of interest.

Abbreviations

The following abbreviations are used in this manuscript:
ALICEA Large Ion Collider Experiment
BERTBidirectional Encoder Representations from Transformers
BGLBlueGene/L Supercomputer System
Bi-LSTMBidirectional Long Short-Term Memory
BoWBag-of-Words
CERNThe European Organization for Nuclear Research
CNNConvolutional Neural Network
c-TF-IDFClass-based Term Frequency-Inverse Document Frequency
DBSCANDensity-Based Spatial Clustering of Applications with Noise
FLPFirst-Level Processing
FNFalse Negative
FNRFalse Negative Rate
FPFalse Positive
FPRFalse Positive Rate
HDBSCANHierarchical Density-Based Spatial Clustering of Applications with Noise
LDALatent Dirichlet Allocation
LHCLarge Hadron Collider
LSALatent Semantic Analysis
LSTMLong Short-Term Memory
MDPIMultidisciplinary Digital Publishing Institute
MLPMulti-Layer Perceptron
NMFNon-Negative Matrix Factorization
O2Online–Offline
PCAPrincipal Component Analysis
QCQuality Control
SBERTSentence Transformer Embeddings
TF-IDFTerm Frequency–Inverse Document Frequency
TNTrue Negative
TPTrue Positive
TPRTrue Positive Rate
UMAPUniform Manifold Approximation and Projection

References

  1. The ALICE Collaboration; Aamodt, K.; Abrahantes, A.; Achenbach, R.; Acounis, S.; Adamova, D.; Adler, C.; Aggarwal, M.; Agnese, F.; Aglieri Rinella, G.; et al. The ALICE experiment at the CERN LHC. J. Instrum. 2008, 3, S08002. [Google Scholar] [CrossRef]
  2. Buncic, P.; Krzewicki, M.; Vande Vyvre, P. Technical Design Report for the Upgrade of the Online-Offline Computing System; Technical Report CERN-LHCC-2015-006; CERN: Geneva, Switzerland, 2015. [Google Scholar]
  3. Liu, F.T.; Ting, K.M.; Zhou, Z.H. Isolation Forest. In Proceedings of the 2008 8th IEEE International Conference on Data Mining, Pisa, Italy, 15–19 December 2008; pp. 413–422. [Google Scholar] [CrossRef]
  4. Du, M.; Li, F.; Zheng, G.; Srikumar, V. DeepLog: Anomaly Detection and Diagnosis from System Logs Through Deep Learning. In Proceedings of the 2017 ACM SIGSAC Conference on Computer and Communications Security (CCS ’17), Dallas, TX, USA, 30 October–3 November 2017; pp. 1285–1298. [Google Scholar] [CrossRef]
  5. Lu, S.; Wei, X.; Li, Y.; Wang, L. Detecting Anomaly in Big Data System Logs Using Convolutional Neural Network. In Proceedings of the 2018 IEEE 16th International Conference on Dependable, Autonomic and Secure Computing, 16th International Conference on Pervasive Intelligence and Computing, 4th International Conference on Big Data Intelligence and Computing and Cyber Science and Technology Congress (DASC/PiCom/DataCom/CyberSciTech), Athens, Greece, 12–15 August 2018; pp. 151–158. [Google Scholar] [CrossRef]
  6. Le, V.H.; Zhang, H. Log-Based Anomaly Detection Without Log Parsing. In Proceedings of the 2021 36th IEEE/ACM International Conference on Automated Software Engineering (ASE 2021), Melbourne, Australia, 15–19 November 2021; pp. 492–504. [Google Scholar] [CrossRef]
  7. Alsini, R.; Alsaedi, N.; Alarifi, A.; Alsulaiman, M. Topic Modeling for Anomaly Detection on Twitter. Appl. Sci. 2022, 12, 11059. [Google Scholar] [CrossRef]
  8. Song, Y.J.; Nam, K.H.; Yun, I.D. Anomaly Detection through Grouping of SMD Machine Sounds Using Hierarchical Clustering. Appl. Sci. 2023, 13, 7569. [Google Scholar] [CrossRef]
  9. Mazarbhuiya, F.A.; Shenify, M. A mixed clustering approach for real-time anomaly detection. Appl. Sci. 2023, 13, 4151. [Google Scholar] [CrossRef]
  10. Grootendorst, M. BERTopic: Neural topic modeling with a class-based TF-IDF procedure. arXiv 2022, arXiv:2203.05794. [Google Scholar]
  11. Farzad, A.; Gulliver, T.A. Unsupervised log message anomaly detection. ICT Express 2020, 6, 229–237. [Google Scholar] [CrossRef]
  12. Bank, D.; Koenigstein, N.; Giryes, R. Autoencoders. In Machine Learning for Data Science Handbook: Data Mining and Knowledge Discovery Handbook; Rokach, L., Maimon, O., Shmueli, E., Eds.; Springer International Publishing: Cham, Switzerland, 2023; pp. 353–374. [Google Scholar] [CrossRef]
  13. Hochreiter, S.; Schmidhuber, J. Long Short-Term Memory. Neural Comput. 1997, 9, 1735–1780. [Google Scholar] [CrossRef]
  14. He, P.; Zhu, J.; He, S.; Li, J.; Lyu, M.R. An Evaluation Study on Log Parsing and Its Use in Log Mining. In Proceedings of the 2016 46th Annual IEEE/IFIP International Conference on Dependable Systems and Networks (DSN 2016), Toulouse, France, 28 June–1 July 2016; pp. 654–661. [Google Scholar] [CrossRef]
  15. Fukushima, K. Visual Feature Extraction by a Multilayered Network of Analog Threshold Elements. IEEE Trans. Syst. Sci. Cybern. 1969, 5, 322–333. [Google Scholar] [CrossRef]
  16. Rosenblatt, F. The perceptron: A probabilistic model for information storage and organization in the brain. Psychol. Rev. 1958, 65, 386–408. [Google Scholar] [CrossRef]
  17. Zhang, X.; Xu, Y.; Lin, Q.; Qiao, B.; Zhang, H.; Dang, Y.; Xie, C.; Yang, X.; Cheng, Q.; Li, Z.; et al. Robust Log-Based Anomaly Detection on Unstable Log Data. In Proceedings of the 2019 27th ACM Joint Meeting on European Software Engineering Conference and Symposium on the Foundations of Software Engineering (ESEC/FSE 2019), Tallinn, Estonia, 26–30 August 2019; pp. 807–817. [Google Scholar] [CrossRef]
  18. Graves, A.; Schmidhuber, J. Framewise phoneme classification with bidirectional LSTM and other neural network architectures. Neural Netw. 2005, 18, 602–610. [Google Scholar] [CrossRef]
  19. Meng, W.; Liu, Y.; Zhu, Y.; Zhang, S.; Pei, D.; Liu, Y.; Chen, Y.; Zhang, R.; Tao, S.; Sun, P.; et al. Loganomaly: Unsupervised Detection of Sequential and Quantitative Anomalies in Unstructured Logs. In Proceedings of the 28th International Joint Conference on Artificial Intelligence, Macao, China, 10–16 August 2019. [Google Scholar]
  20. Devlin, J.; Chang, M.W.; Lee, K.; Toutanova, K. BERT: Pre-training of Deep Bidirectional Transformers for Language Understanding. arXiv 2019, arXiv:1810.04805. [Google Scholar]
  21. Blei, D.M.; Ng, A.Y.; Jordan, M.I. Latent Dirichlet allocation. J. Mach. Learn. Res. 2003, 3, 993–1022. [Google Scholar]
  22. Lee, D.D.; Seung, H.S. Learning the parts of objects by non-negative matrix factorization. Nature 1999, 401, 788–791. [Google Scholar] [CrossRef]
  23. Kasliwal, B.; Bhatia, S.; Saini, S.; Thaseen, I.S.; Kumar, C.A. A Hybrid Anomaly Detection Model Using G-LDA. In Proceedings of the 2014 IEEE International Advance Computing Conference (IACC), Gurgaon, India, 21–22 February 2014; pp. 288–293. [Google Scholar] [CrossRef]
  24. Elkhadir, Z.; Chougdali, K.; Benattou, M. Combination of R1-PCA and Median LDA for Anomaly Network Detection. In Proceedings of the 2017 Intelligent Systems and Computer Vision (ISCV 2017), Fez, Morocco, 17–19 April 2017; pp. 1–5. [Google Scholar] [CrossRef]
  25. Mahapatra, A.; Srivastava, N.; Srivastava, J. Contextual Anomaly Detection in Text Data. Algorithms 2012, 5, 469–489. [Google Scholar] [CrossRef]
  26. Wu, X.; Li, C. Short Text Topic Modeling with Flexible Word Patterns. In Proceedings of the 2019 International Joint Conference on Neural Networks (IJCNN 2019), Budapest, Hungary, 14–19 July 2019; pp. 1–7. [Google Scholar] [CrossRef]
  27. Furnas, G.W.; Deerwester, S.; Dumais, S.T.; Landauer, T.K.; Harshman, R.A.; Streeter, L.A.; Lochbaum, K.E. Information Retrieval Using a Singular Value Decomposition Model of Latent Semantic Structure. In Proceedings of the 11th Annual International ACM SIGIR Conference on Research and Development in Information Retrieval (SIGIR ’88), Grenoble, France, 13–15 June 1988; pp. 465–480. [Google Scholar] [CrossRef]
  28. Lefoane, M.; Ghafir, I.; Kabir, S.; Awan, I.U. Latent Semantic Analysis for Feature Selection: A Proposed Approach for Anomaly Detection in Network Traffic. In Proceedings of the 2024 14th International Conference on Advanced Computer Information Technologies (ACIT 2024), Ceske Budejovice, Czech Republic, 19–21 September 2024; pp. 517–522. [Google Scholar] [CrossRef]
  29. Fawaz, A.M.; Sanders, W.H. Learning Process Behavioral Baselines for Anomaly Detection. In Proceedings of the 2017 IEEE 22nd Pacific Rim International Symposium on Dependable Computing (PRDC 2017), Christchurch, New Zealand, 22–25 January 2017; pp. 145–154. [Google Scholar] [CrossRef]
  30. McCulloh, I.; Daimler, E.; Carley, K.M. Using Latent Semantic Analysis of Email to Detect Change in Social Groups. In Proceedings of the 2008 International Conference on Data Mining (DMIN 2008), Las Vegas, NV, USA, 14–17 July 2008; pp. 613–618. [Google Scholar]
  31. Hofmann, T. Probabilistic Latent Semantic Analysis. arXiv 2013, arXiv:1301.6705. [Google Scholar]
  32. Wang, W.; Guan, X.; Zhang, X. Profiling Program and User Behaviors for Anomaly Intrusion Detection Based on Non-Negative Matrix Factorization. In Proceedings of the 2004 43rd IEEE Conference on Decision and Control (CDC 2004), Nassau, Bahamas, 14–17 December 2004; Volume 1, pp. 99–104. [Google Scholar]
  33. Alshammari, H.; Ghorbel, O.; Aseeri, M.; Abid, M. Non-Negative Matrix Factorization (NMF) for Outlier Detection in Wireless Sensor Networks. In Proceedings of the 2018 14th International Wireless Communications & Mobile Computing Conference (IWCMC 2018), Limassol, Cyprus, 25–29 June 2018; pp. 506–511. [Google Scholar] [CrossRef]
  34. Li, X.; Guan, Y.; Fu, B.; Luo, Z. Anomaly-aware symmetric non-negative matrix factorization for short text clustering. Knowl. Inf. Syst. 2024, 67, 1481–1506. [Google Scholar] [CrossRef]
  35. Esposito, F. A Review on Initialization Methods for Nonnegative Matrix Factorization: Towards Omics Data Experiments. Mathematics 2021, 9, 1006. [Google Scholar] [CrossRef]
  36. Wang, Y.X.; Zhang, Y.J. Nonnegative Matrix Factorization: A Comprehensive Review. IEEE Trans. Knowl. Data Eng. 2013, 25, 1336–1353. [Google Scholar] [CrossRef]
  37. Jurafsky, D.; Martin, J.H. Speech and Language Processing: An Introduction to Natural Language Processing, Computational Linguistics, and Speech Recognition; Prentice Hall: Hoboken, NJ, USA, 2000; p. 106. [Google Scholar]
  38. McTear, M.; Callejas, Z.; Griol, D. The Conversational Interface: Talking to Smart Devices; Springer: Cham, Switzerland, 2016; p. 167. [Google Scholar]
  39. Sparck Jones, K. A Statistical Interpretation of Term Specificity and Its Application in Retrieval. J. Doc. 1972, 28, 11–21. [Google Scholar] [CrossRef]
  40. He, P.; Zhu, J.; Zheng, Z.; Lyu, M.R. Drain: An Online Log Parsing Approach with Fixed Depth Tree. In Proceedings of the 2017 IEEE International Conference on Web Services (ICWS 2017), Honolulu, HI, USA, 25–30 June 2017; pp. 33–40. [Google Scholar] [CrossRef]
  41. McInnes, L.; Healy, J.; Melville, J. UMAP: Uniform Manifold Approximation and Projection for Dimension Reduction. arXiv 2020, arXiv:1802.03426. [Google Scholar]
  42. Campello, R.J.G.B.; Moulavi, D.; Sander, J. Density-based clustering based on hierarchical density estimates. In Advances in Knowledge Discovery and Data Mining; Pei, J., Tseng, V.S., Cao, L., Motoda, H., Xu, G., Eds.; Springer: Berlin/Heidelberg, Germany, 2013; pp. 160–172. [Google Scholar]
  43. Ester, M.; Kriegel, H.P.; Sander, J.; Xu, X. A Density-Based Algorithm for Discovering Clusters in Large Spatial Databases with Noise. In Proceedings of the 2nd International Conference on Knowledge Discovery and Data Mining (KDD’96), Portland, OR, USA, 2–4 August 1996; pp. 226–231. [Google Scholar]
  44. Lloyd, S. Least squares quantization in PCM. IEEE Trans. Inf. Theory 1982, 28, 129–137. [Google Scholar] [CrossRef]
  45. MacQueen, J. Some Methods for Classification and Analysis of Multivariate Observations. In Proceedings of the 5th Berkeley Symposium on Mathematical Statistics and Probability, Berkeley, CA, USA, 21 June–18 July 1965; University of California Press: Berkeley, CA, USA, 1967. [Google Scholar]
  46. Chapeland, S.; Carena, F.; Carena, W.; Barroso, V.C.; Costa, F.; Dénes, E.; Divià, R.; Fuchs, U.; Grigore, A.; Ionita, C.; et al. The ALICE DAQ infoLogger. J. Phys. Conf. Ser. 2014, 513, 012005. [Google Scholar] [CrossRef]
  47. Zhu, J.; He, S.; He, P.; Liu, J.; Lyu, M.R. Loghub: A Large Collection of System Log Datasets for AI-Driven Log Analytics. In Proceedings of the IEEE International Symposium on Software Reliability Engineering (ISSRE), Florence, Italy, 9–12 October 2023. [Google Scholar]
Figure 1. An overview of the proposed framework. Raw log messages optionally undergo preprocessing (dashed-line box) before topic modeling with BERTopic. The extracted topics are then utilized for anomaly classification with the results presented in an analytic dashboard.
Applsci 15 05901 g001
Figure 2. Dashboard information: (1) anomaly’s status, (2) log message’s content, (3) classified topic, (4) log message’s information, (5) topic terms, (6) topic distribution.
Applsci 15 05901 g002
Figure 3. Comparison of preprocessed vs. unprocessed performance based on F1-score.
Applsci 15 05901 g003
Figure 4. Comparison of computational efficiency based on training and inference time.
Applsci 15 05901 g004
Figure 5. Overall performance of the BERTopic’s algorithms.
Applsci 15 05901 g005
Figure 6. Time consumption of the BERTopic’s algorithm.
Applsci 15 05901 g006
Figure 7. Effect of min_cluster_size.
Applsci 15 05901 g007
Figure 8. Effect of cluster_selection_epsilon.
Applsci 15 05901 g008
Figure 9. Effect of min_samples.
Applsci 15 05901 g009
Figure 10. Representation of InfoLogger’s two-dimensional log message embeddings (the rectangular area is magnified in Figure 11).
Applsci 15 05901 g010
Figure 11. Magnified rectangular area of Figure 10, highlighting the examples of log message’s content in a brown cluster.
Applsci 15 05901 g011
Table 1. Example of datasets.
Infologger Dataset
Line Idseverityleveltimestamphostnamerolenamepidusernamesystemfacilitydetectorpartitionruncontent
1E21716783000alio2-cr1-qc03alio2-cr1-qc031649194qcQCpost/TOFQualityTaskTOF2nenhEPazQ4552028Requested resource does not exist:
BGL Dataset
Line Idlabeltimestampdatenodetimenoderepeattypecomponentlevelcontent
1KERNDTLB11185363272005.06.11R30-M0-N9-C:J16-U012005-06-11-17.32.07.581048R30-M0-N9-C:J16-U01RASKERNELFATALdata TLB error interrupt
Table 2. Dataset properties.
DatasetMax #
Logs/Sequence
Normal # SessionsAnomaly # SessionsTotal # Sessions
Infologger2,194,07379,528 (99.52%)387 (0.48%)79,915 (100%)
BGL152,32937,875 (54.69%)31,374 (45.31%)69,249 (100%)
Table 3. The default hyperparameters setting.
No.ParameterValue
1.min_cluster_size5
2.min_samples5
3.cluster_selection_epsilon0.0
Table 4. Performance of different models (unprocessed data).
DatasetModelNo. of TopicsPRF1FPRFNR
InfologgerLDA1000.9330.9940.9600.00020.0064
(CERN) 2000.7570.9930.8110.00300.0065
3000.1410.9940.2470.01490.0058
LSA1000.1480.9930.2580.01410.0070
2000.1440.9960.2520.01460.0041
3000.1500.9960.2600.01400.0041
NMF1000.9480.9760.9620.00010.0239
2000.1470.9870.2570.01410.0130
3000.9620.9940.9770.00010.0064
BERTopic1000.7750.9880.8680.00070.0123
2000.7820.9960.8760.00070.0043
3000.7830.9950.8760.00070.0048
BGLLDA1000.8260.9320.8760.01380.0678
2000.4381.0000.6090.09030.0000
3000.4151.0000.5870.09870.0000
LSA1000.7470.7060.7260.01680.2942
2000.7780.9910.8720.01980.0089
3000.8080.9900.8900.01650.0098
NMF1000.6180.7060.6590.03060.2944
2000.8950.9910.9410.00810.0090
3000.8690.9880.9250.01050.0115
BERTopic1000.6790.9700.7900.03650.0305
2000.7660.9700.8510.02230.0303
3000.7030.9720.8110.03090.0285
P = Precision; R = Recall.
Table 5. Performance of different models (processed data).
DatasetModelNo. of TopicsPRF1FPRFNR
InfologgerLDA1000.9060.9960.9460.00030.0040
(CERN) 2000.9030.9960.9470.00030.0039
3000.9060.9960.9460.00030.0040
LSA1000.1490.9960.2590.01410.0039
2000.1490.9960.2590.01410.0039
3000.9840.9960.9900.00000.0039
NMF1000.1490.9920.2590.01400.0084
2000.1480.9920.2580.01410.0080
3000.9850.9920.9890.00000.0080
BERTopic1000.1490.9960.2590.01410.0039
2000.9590.9950.9760.00010.0050
3000.9600.9960.9780.00010.0045
BGLLDA1000.8310.6800.7480.00970.3196
2000.4151.0000.5870.09870.0000
3000.4151.0000.5870.09880.0000
LSA1000.4860.9230.6360.06860.0770
2000.4870.9220.6380.06800.0779
3000.4870.9220.6380.06800.0779
NMF1000.8990.9250.9120.00730.0752
2000.9070.9220.9140.00670.0778
3000.9070.9220.9140.00670.0778
BERTopic1000.4300.9470.5920.08780.0533
2000.4410.9310.5980.08330.0688
3000.4280.9330.5870.08750.0668
P = Precision; R = Recall.
Table 6. Performance of BERTopic’s clustering algorithms.
DatasetClustering MethodPRF1FPRFNR
InfologgerHDBSCAN0.9550.9950.9750.0000.005
(CERN)DBSCAN0.9230.9950.9560.0000.005
K-means0.1230.8210.2140.0140.179
BGLHDBSCAN0.8140.9300.8650.0160.070
DBSCAN0.9530.9240.9380.0030.076
K-means0.7890.9030.8220.0230.097
P = Precision; R = Recall.
Table 7. Effect of min_cluster_size.
Datasetmin_cluster_sizePRF1FPRFNR
Infologger1000.7860.8810.8100.00090.1186
(CERN)2000.3730.9630.5330.00430.0367
3000.3330.9920.4980.00490.0085
4000.1430.9920.2500.01470.0078
5000.1420.9930.2490.01480.0067
BGL1000.7960.9720.8680.02000.0284
2000.9090.9740.9390.00740.0259
3000.8590.9860.9150.01260.0143
4000.9100.9870.9440.00790.0129
5000.8620.9320.8860.01220.0676
P = Precision; R = Recall.
Table 8. Effect of cluster_selection_epsilon.
DatasetCluster_Selection_EpsilonPRF1FPRFNR
Infologger0.010.9570.9950.9760.00010.0046
(CERN)0.030.7610.9960.8400.00120.0043
0.050.7970.9950.8640.00100.0048
0.070.4680.9960.6370.00280.0039
0.090.2030.9960.3380.00960.0039
BGL0.010.7920.9410.8530.02000.0588
0.030.7650.9830.8580.02220.0172
0.050.6830.9730.8010.03250.0270
0.070.7650.8490.7960.01420.1514
0.090.8390.9970.9080.01440.0033
P = Precision; R = Recall.
Table 9. Effect of min_samples.
Datasetmin_samplesPRF1FPRFNR
Infologger1000.8100.9460.8710.00060.0539
(CERN)2000.9030.7510.7930.00030.2487
3000.8310.7160.7410.00040.2843
4000.6860.5620.6170.00060.4380
5000.2110.9630.3400.01020.0366
BGL1000.9200.9720.9450.02960.0279
2000.8830.7460.8020.00690.2540
3000.9180.6950.7820.00500.3048
4000.9370.5860.7210.01370.4144
5000.9580.9470.9520.00290.0534
P = Precision; R = Recall.
Disclaimer/Publisher’s Note: The statements, opinions and data contained in all publications are solely those of the individual author(s) and contributor(s) and not of MDPI and/or the editor(s). MDPI and/or the editor(s) disclaim responsibility for any injury to people or property resulting from any ideas, methods, instructions or products referred to in the content.

