Article

Shear Strength of Sand: Integrated Analysis of Initial Porosity and Stress Effects

by
Krzysztof Żarkiewicz
*,† and
Roman Bednarek
*,†
Department of Geotechnical Engineering, Faculty of Civil and Environmental Engineering, West Pomeranian University of Technology, 70-310 Szczecin, Poland
*
Authors to whom correspondence should be addressed.
These authors contributed equally to this work.
Appl. Sci. 2025, 15(11), 5902; https://doi.org/10.3390/app15115902
Submission received: 17 April 2025 / Revised: 15 May 2025 / Accepted: 19 May 2025 / Published: 23 May 2025

Abstract

:
This paper investigates the effects of initial porosity index and load range on the shear strength of a sand sample using direct shear tests performed with a standard direct shear apparatus under varying densities, from loose to compacted. This study focuses on the distinction between the peak ( ϕ p ) and critical ( ϕ c v ) internal friction angles and their variation with stress level and initial porosity. Results show that the internal friction angle of sand depends on the stress state and initial porosity, reaching a peak value at maximum shear stresses and a critical value at constant sample volume. Higher initial compaction increases the peak friction angle, while higher effective stresses reduce the critical porosity index. The critical state line (CSL) defines the contraction and dilation behaviour of soils, with the critical porosity index varying with average soil stress. The analysis confirmed Bolton’s empirical relationship, linking the peak friction angle with the critical state angle and the dilation angle. This study emphasizes the importance of accurately defining the internal friction angle and considering the nonlinear relationship between shear strength and normal stresses. These findings are significant for geotechnical engineering, particularly in foundation bearing capacity, earth pressure, and slope stability analysis.

1. Introduction

Shear strength of soil is a fundamental material property used in calculations for foundation bearing capacity, earth pressure, and slope stability analysis. One of the criteria for soil failure is the Coulomb–Mohr criterion, which is defined by two geotechnical parameters: the internal friction angle and soil cohesion. The most important parameter determining the strength of non-cohesive soils in this model is the internal friction angle, which is widely used in geotechnical structure analyses. There are many methods for determining soil shear strength, which are detailed in [1]. They stated that different methods of testing soil shear strength yield results with significant discrepancies, regardless of the shearing mechanism. The greatest differences concern the value of cohesion, which can vary up to sixfold depending on the measurement equipment used. Common tests for soil strength include direct shear tests and triaxial compression tests. Castellanos et al. [2] compared results from triaxial compression and direct shear tests and concluded that the direct shear apparatus provides lower values of the internal friction angle. Issues related to comparing the internal friction angle in triaxial compression and extension tests and direct shear tests are further discussed in [3,4].
Laboratory triaxial compression and direct shear tests clearly show that shear stresses can reach a maximum value during shearing. After reaching this value, the stresses either remain constant or decrease to a critical value with continued shearing. The same type of soil in direct shear testing can sometimes exhibit significant strength surpassing and then dropping to a residual value, while under different testing conditions, it may behave differently. This means that the peak value achieved is not solely dependent on the type of soil. This phenomenon necessitates a precise definition of the soil’s internal friction angle. Two concepts are commonly accepted: ϕ p , the peak internal friction angle corresponding to the maximum shear stresses during testing, and ϕ c v , the critical internal friction angle corresponding to the strength obtained at constant sample volume. Ref. [5] indicated that the peak internal friction angle was influenced by soil compaction, average effective stresses, stress path, and basic soil shear strength defined by the critical state internal friction angle. Many studies [6,7,8] indicated that soil changed its volume during shearing. Initially highly compacted soils exhibited an increase in porosity during shearing, while initially loose soils showed a decrease in porosity. Shearing soil in the critical state occurred at a porosity index known as the critical porosity index. Studies indicated that the higher the average effective stresses, the lower the critical porosity index. Analyses of this phenomenon allowed for the determination of the critical state line (CSL). Soils above the CSL exhibited contractive behaviour, while soils below it exhibited dilative behaviour. Ref. [6] showed how the soil porosity index changes depending on the logarithm of average soil stresses. It was indicated that the change in grain shape significantly affects the value of the critical internal friction angle and the slope of the CSL. The CSL also allowed for a deeper analysis of phenomena related to soil liquefaction, as described in [9,10].
The CSL pertains to the critical state and is directly related to the critical internal friction angle. The issue of the peak internal friction angle in relation to the critical internal friction angle is described in the literature by the state parameter defined as the difference between the initial porosity index and the critical porosity index [7]. Research results indicated that the difference between the peak and critical friction angles, reaching up to 20 degrees, was greatest at negative state parameter values and decreased to a range of 0 to 4 degrees at state parameter values greater than or equal to 0 [7,11,12]. This means that the higher the initial compaction of the soil sample, the greater the increase in soil volume during shearing and the greater the peak angle in relation to the critical soil friction angle. Conversely, for initially loose soil samples, a progressive decrease in sample volume was observed during shearing, and the peak soil friction angle was equal to or slightly (up to 4 degrees) greater than the critical friction angle value. The slope of the relationship between soil sample height during shearing and horizontal displacement determined the dilation angle defined by Bolton [13]. In this approach, the peak internal friction angle was the sum of the critical internal friction angle and 80% of the dilation angle value. This relationship was verified and used in [3,4,8], obtaining similar dependencies. There are many studies aimed at explaining what affects the value of the internal friction angle. Factors such as initial compaction, water content, roughness, grain size, grain uniformity, fine fraction admixtures, and grain crushing were studied.
The peak internal friction angle increases with initial soil compaction [14]. Ref. [15] shows that both increased water content and fine particle content reduce soil strength. In studies of the relationship between the measured internal friction angle and the sand grain uniformity index, it is indicated that soil strength defined by the internal friction angle increases with the uniformity coefficient [16]. Further studies provided solid evidence that the critical internal friction angle does not depend on grain size but on grain shape [17], and the commonly accepted practical relationship between the internal friction angle and soil uniformity index is more an attribute of variable grain shape than variable grain size. Direct shear tests of coarse-grained materials showed that the ratio of peak strength to strength determined at a given deformation increased exponentially with the increase in the equivalent grain diameter d 50 [18]. This meant that grain size affected the rate of increase in shear stresses during shearing.
During soil shearing, despite low stresses ranging from 0 to 400 kPa, grain crushing occurred due to significant contact stresses reaching up to 15 MPa [19]. The greatest impact of grain crushing on shear strength was observed at high effective stresses in the soil. As studies [20] showed, it is grain destruction that causes a significant reduction in strength after reaching peak strength. Grain destruction also caused less change in volumetric deformations of the sample during shearing. The roundness of soil grains was also an important factor, primarily affecting the critical internal friction angle, as demonstrated in [21]. The linear Coulomb–Mohr criterion, which involves two geotechnical parameters—the internal friction angle and cohesion—is widely used in geotechnics. However, experimental studies indicated that the development of soil strength had a nonlinear relationship with respect to normal stresses. This nonlinearity was particularly evident at low normal stresses to the shear plane [22,23]. In studies conducted on sands over a wide range of stresses, including low stresses below 50 kPa, it was observed that both the peak and critical internal friction angles increased with decreasing normal stress [24] and could reach up to 50 degrees. Similar studies confirmed these relationships and additionally noted that soil dilation was more pronounced with larger grain sizes. It was also observed that the peak strength value of soils with larger grain sizes was achieved at greater deformations, which could be explained by the greater distance needed to be overcome in relation to grain diameter [25]. In further studies on direct shear testing at low normal stresses, it was found that the more rounded the sand particles, the smaller the decrease in strength after reaching the peak value for low stresses ranging from 4 kPa to 50 kPa [26].
Based on the literature review, it can be stated that the phenomenon of sand shear strength is very complex. Even after extensive studies and analyses, the most recent research continues to uncover valuable new findings. The reason for often divergent interpretations in soil strength is the overly general definition of the internal friction angle and the lack of information on whether it is the peak internal friction angle or the critical one. These values, especially in highly compacted soils, differ significantly from each other. The second issue is the application of a simplified linear relationship of shear strength depending on normal stresses. Despite numerous studies on the shear strength of cohesionless soils, the application of one of the key strength parameters—the internal friction angle—still raises certain concerns. One of the fundamental questions is whether this parameter can be considered constant. While in practical engineering applications, a cautious estimation of the internal friction angle using a linear strength envelope may be acceptable, scientific research and advanced numerical analyses require that this parameter account for all factors influencing its value. One such factor is the stress state, which is also examined in this study. This approach is particularly important for the optimisation and design of geotechnical systems, where the accurate characterisation of shear strength parameters is critical for ensuring safety, reliability, and performance [27,28].
The main objective of the present study is to propose an integrated approach to the shear strength of cohesionless soils by investigating the relationships between the initial porosity index, the critical porosity index, and the stress range. All dependencies are expressed through nonlinear mathematical relationships, representing an extension of existing models.
This article presents research findings that elucidate the disparities in the peak and critical angle of internal friction. Furthermore, it demonstrates the manner in which these values are contingent on stress range and initial soil porosity index.

2. Materials and Methods
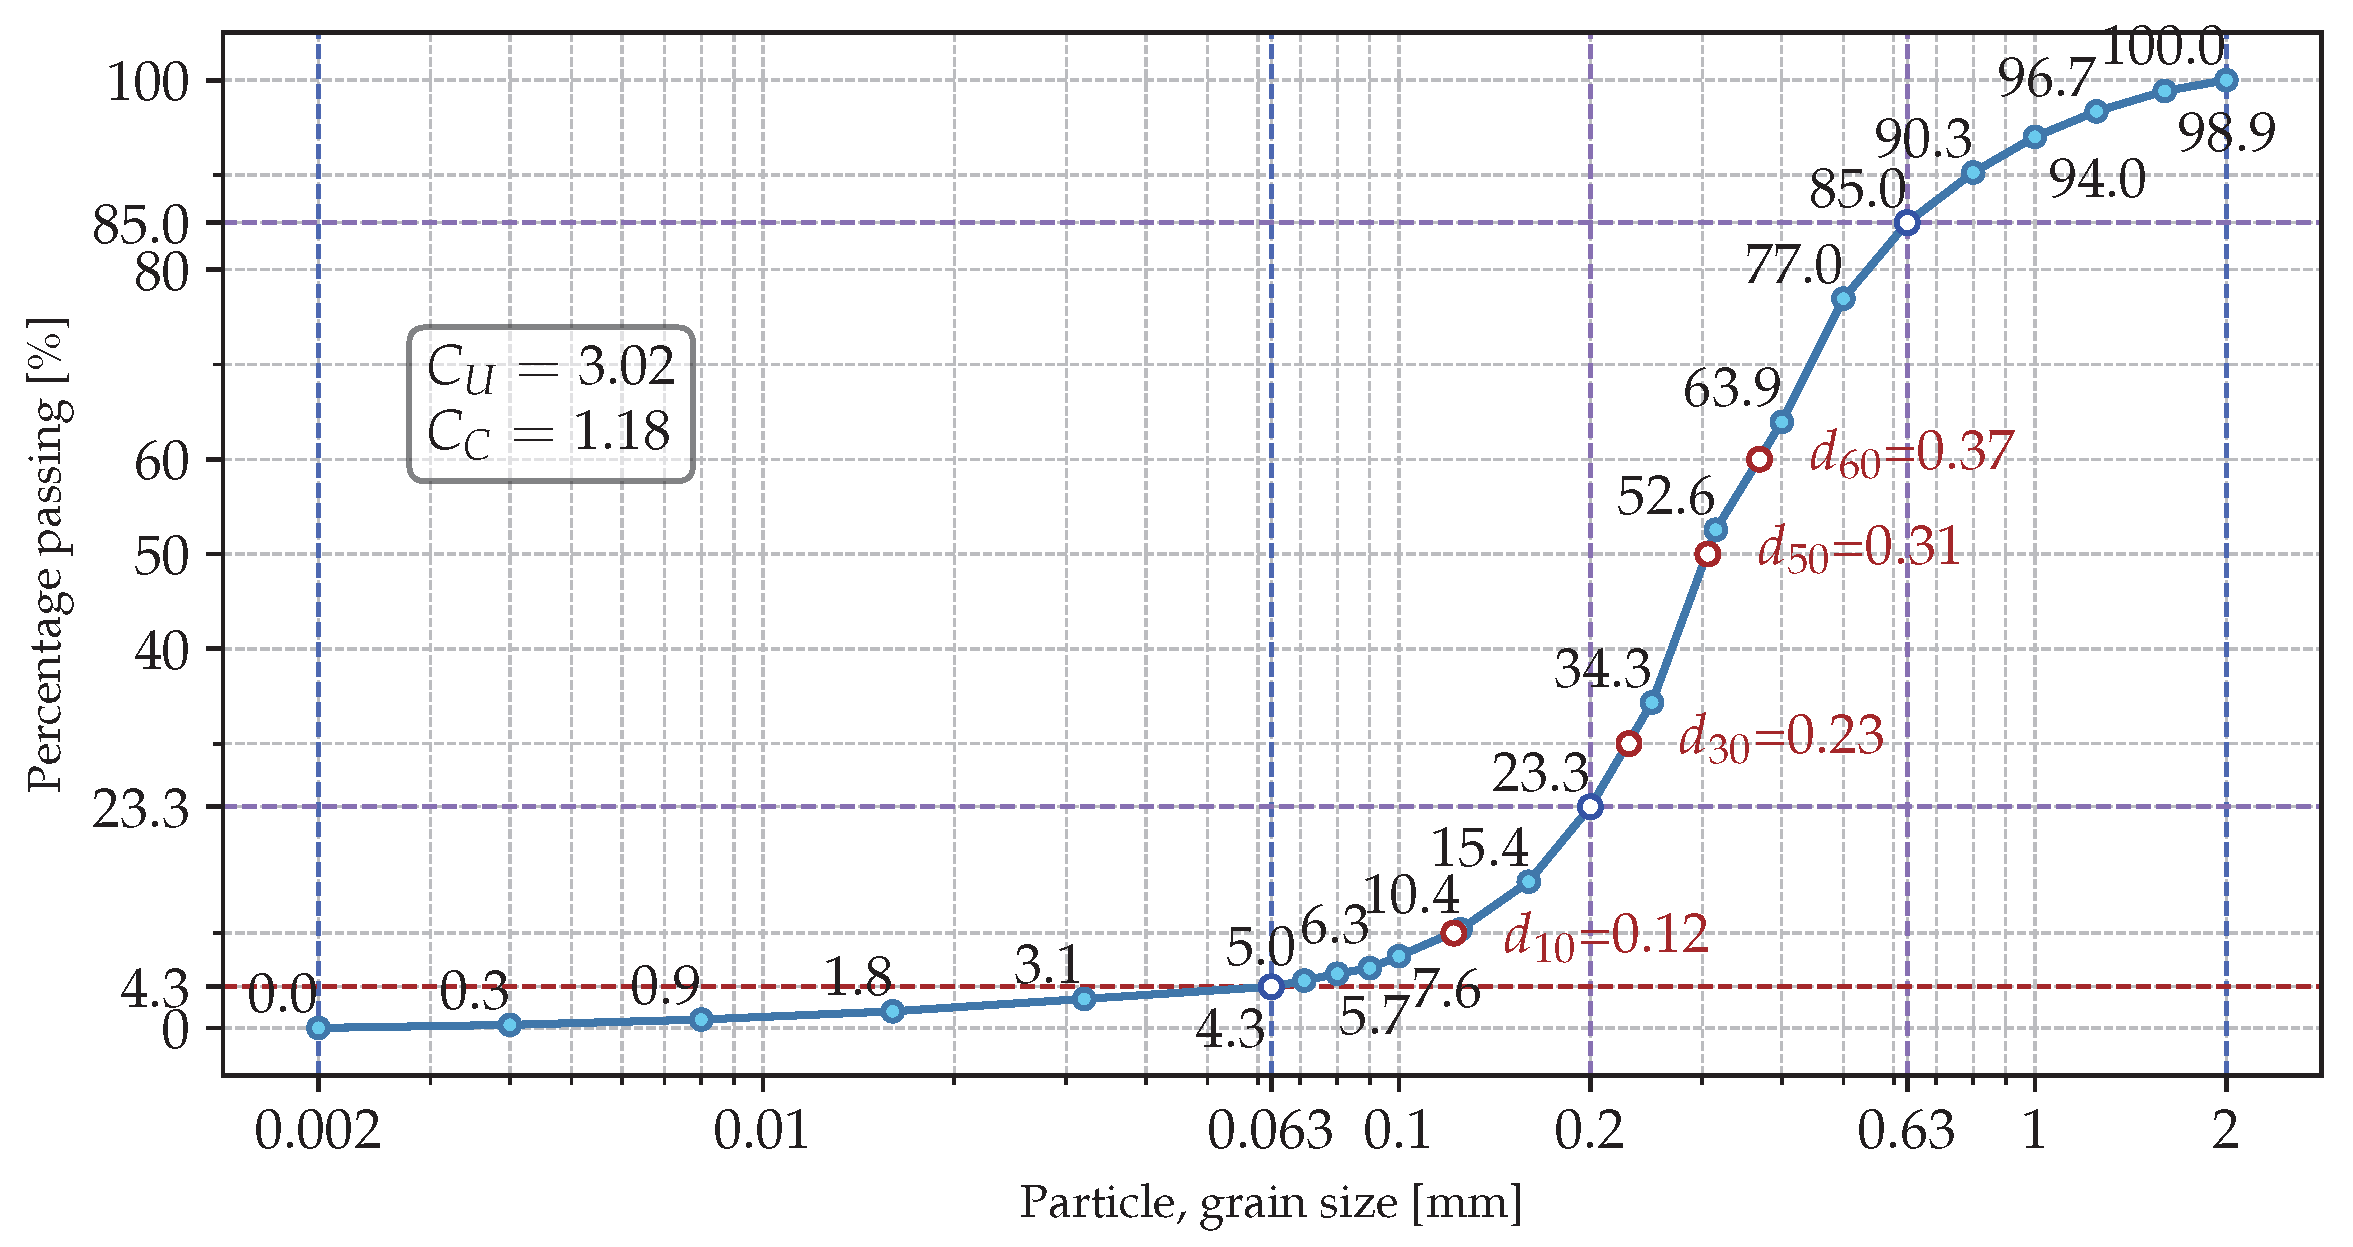
2.1. Soil Samples

The soil sample came from a mine where glacial deposits are predominant. These deposits were formed on plains of a melting ice sheet where fast-flowing water left behind sandy material with small amounts of dust and very fine gravel. To standardise the samples, the material was sieved through a 2 mm mesh sieve, which was dictated both by the dimensions of the apparatus (8 × 8 cm) and the desire to exclude the influence of much larger grains that could locally disturb the distribution of shear stresses on the plane of failure. In the area where large grains are present, the shear stresses induced could reach a critical value that is faster and much higher or disturb the course of the test, making it unrepresentative of the homogeneous failure plane that was intended to be obtained for the analysis of the results in this study. The investigated soil was sand in an air-dry condition, with a water content ranging from 0.21% to 0.23%. Figure 1 shows the grain size distribution curve of the investigated sand.
The divided fractions of the sand sample are shown in Figure 2. The microscopic images were taken at two magnifications: 43 × and 162 × . The sand grains were classified as sub-rounded.

2.2. Test Procedure

The tests were carried out using a direct shear apparatus (Figure 3) on 21 samples with different densities, from loose to compacted. The vertical load applied was σ { 4.87 , 9.81 , 14.75 , 50.00 , 100.00 , 200.00 } kPa. A compaction index of e max = 0.753 was determined for the loose sample, and e min = 0.432 for the most compacted sample. Table 1 shows the results of the physical tests on the sand.
Figure 3 presents a schematic and photographs of the apparatus used for the experiments. The testing procedure is described below, followed by a discussion of the results summarised in Table 1.
Each soil specimen was prepared by placing the material into a shear box with internal dimensions of 8 cm × 8 cm and a height of 4.55 cm, followed by layer-by-layer compaction. The prepared sample was then mounted in a direct shear apparatus. The vertical load was applied using a gravitational loading system consisting of calibrated weights. After configuring the measurement system, including strain gauge and optoelectronic displacement sensors, the shearing process was initiated at a constant displacement rate of v = 1 (mm/min) applied to the upper part of the shear box. The verified consolidation conditions enabled the selection of a sliding speed that prevented the generation of excess pore water pressure during shearing, thereby maintaining drained conditions throughout the test. The test involved the continuous monitoring of shear force, horizontal displacement, and vertical deformation. Upon completion of the test, the mass of the soil sample was measured to determine the initial porosity index. The critical porosity index was subsequently calculated based on the initial porosity and the volumetric change inferred from the final specimen height. The change in volume was determined from the change in height of the specimen represented by the stabilised value of the specimen height after reaching the critical shear strength from the graph u y = f ( u x ) shown in Figure 4. The remaining results are presented in Appendix A in the form of plots. Based on the data obtained from these plots, Table 1 was prepared.
Figure 4 presents the results for the loose and compacted sample. The graph shows how the shear stress τ (kPa) increased during the test with the displacement of the upper part of the box u x (mm). At the same time, the vertical displacement of the piston u y (mm) was plotted against the horizontal displacement of the box u x (mm). The test was carried out at a sliding speed of the upper part of the box v = 1 (mm/min). The influence of the initial compaction of the sample was very important for the generation of shear stresses. Two completely different patterns of shear stress mobilisation were shown as an example. In the loose sample (Figure 4a), the shear stress increased slowly until it reached its maximum value. At the same time, a decrease in the height of the sample was observed. This behaviour was typical for a soil sample in a contractive state. In the compacted sample (Figure 4b), the shear stresses increased rapidly until the peak value was reached, after which they decreased until they stabilised at the critical value. At the same time, an initial decrease and then a significant increase in the height of the sample was observed. This behaviour was typical of a soil sample in a dilative state.

3. Results

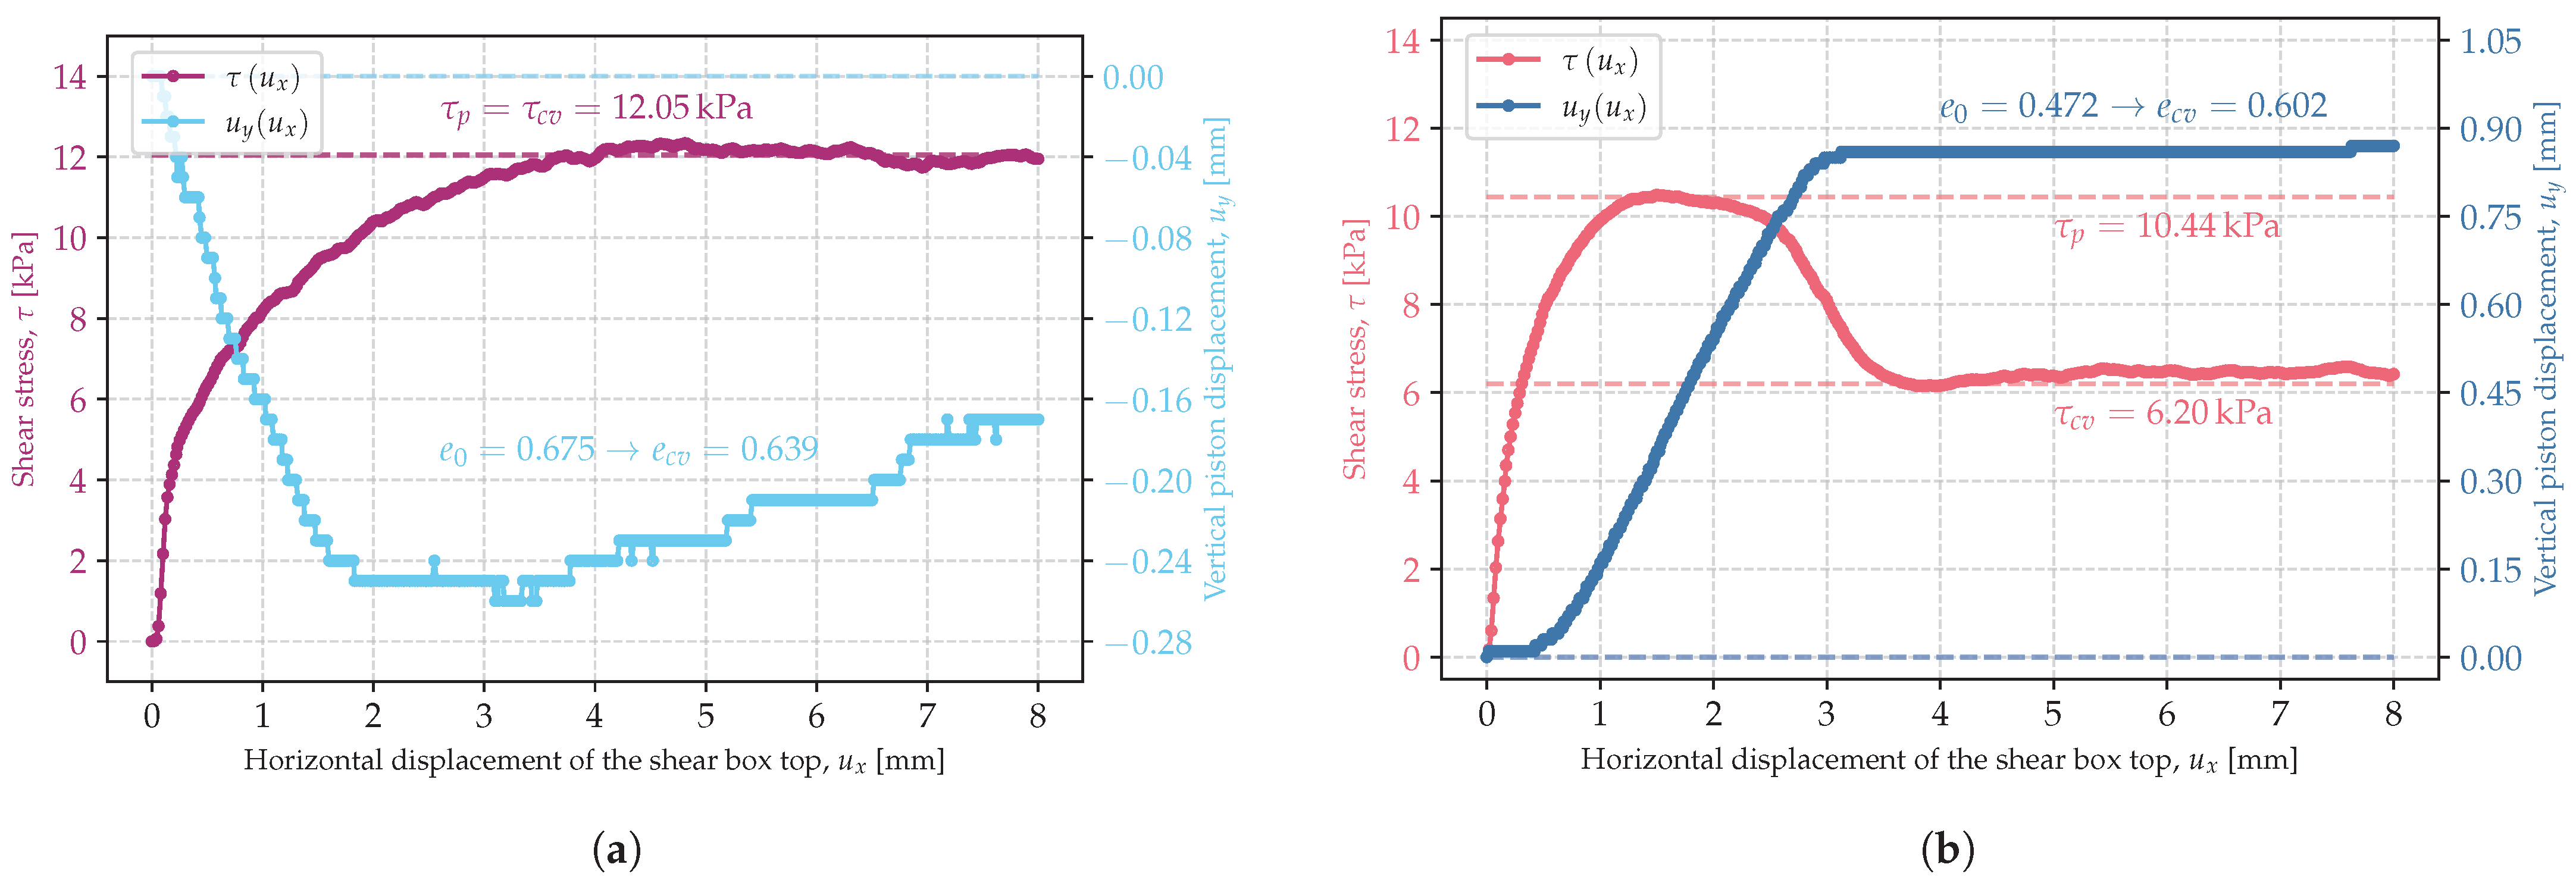
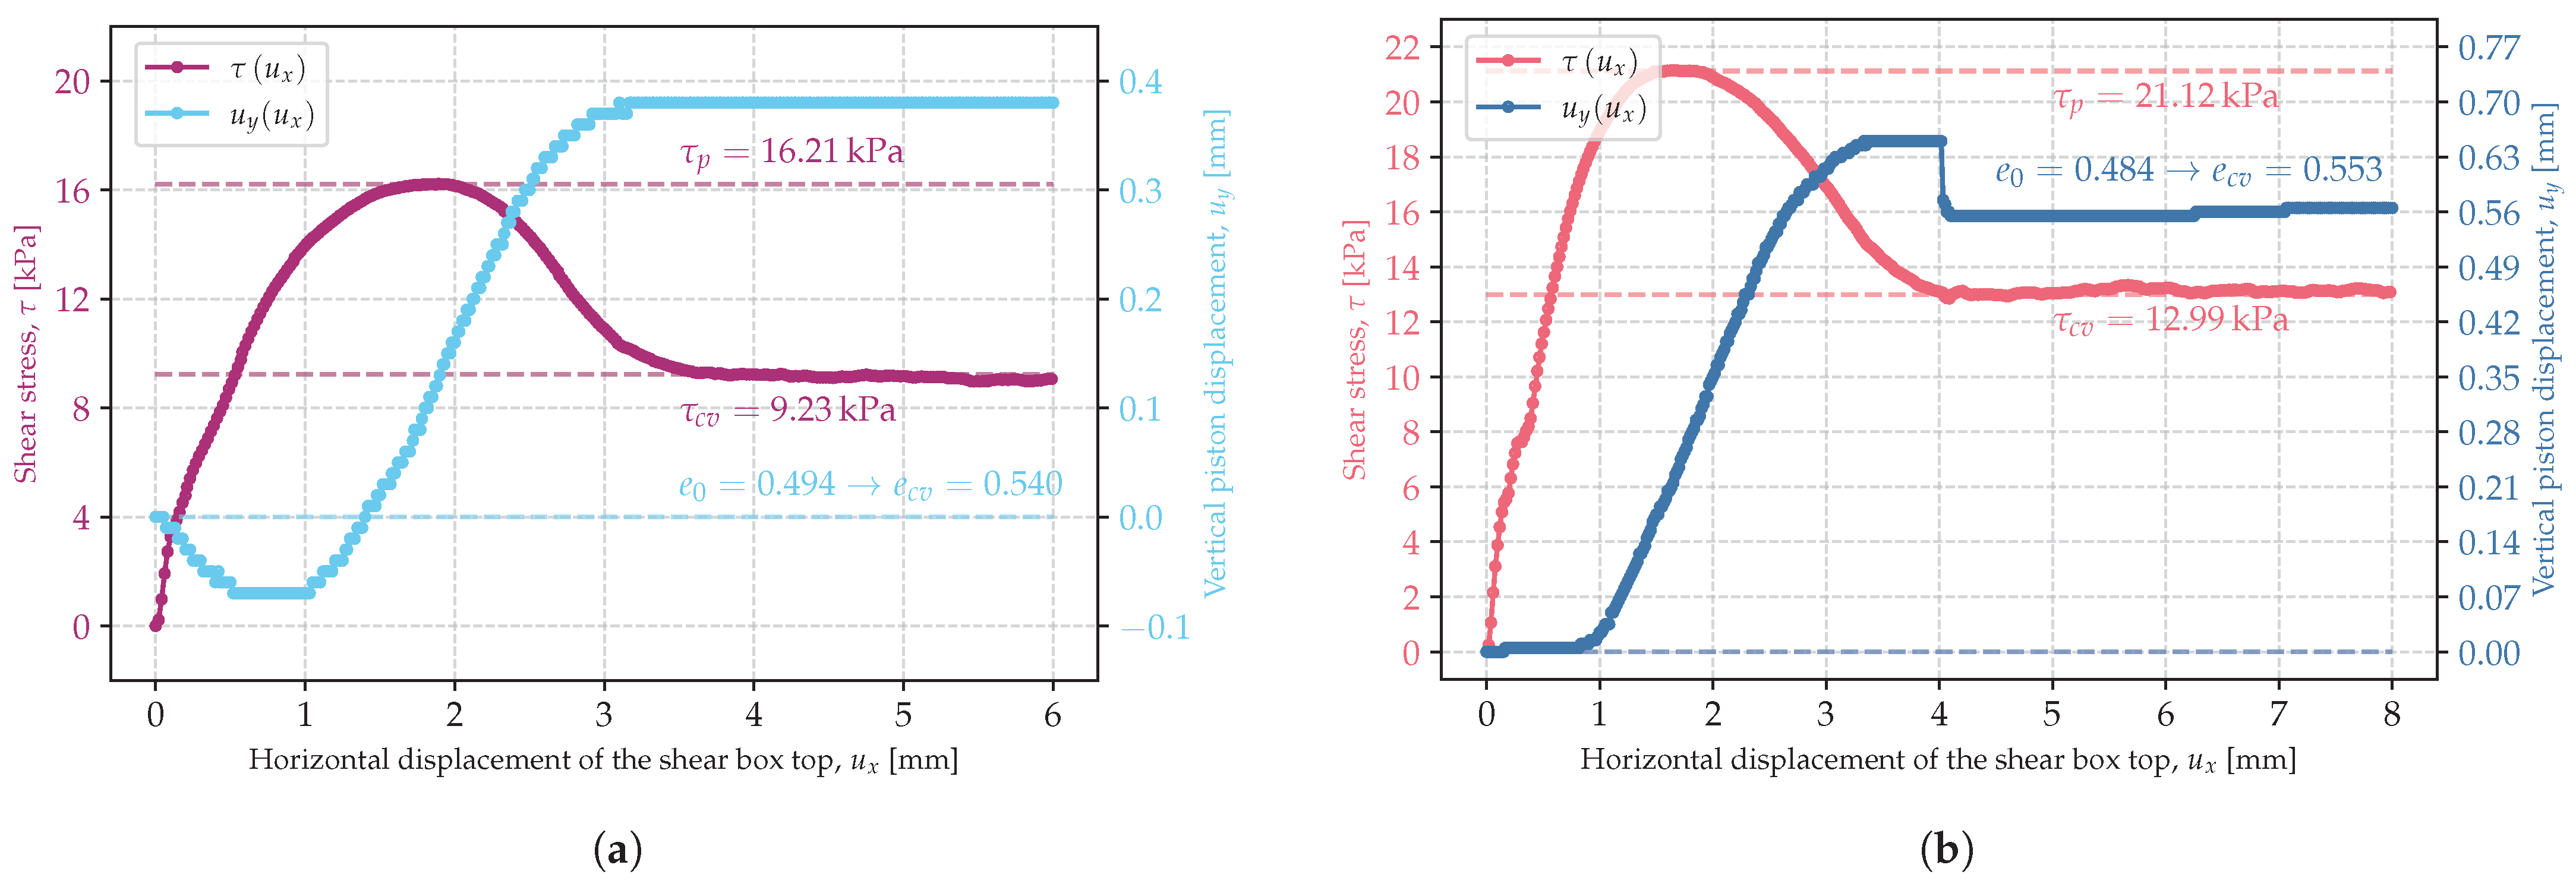
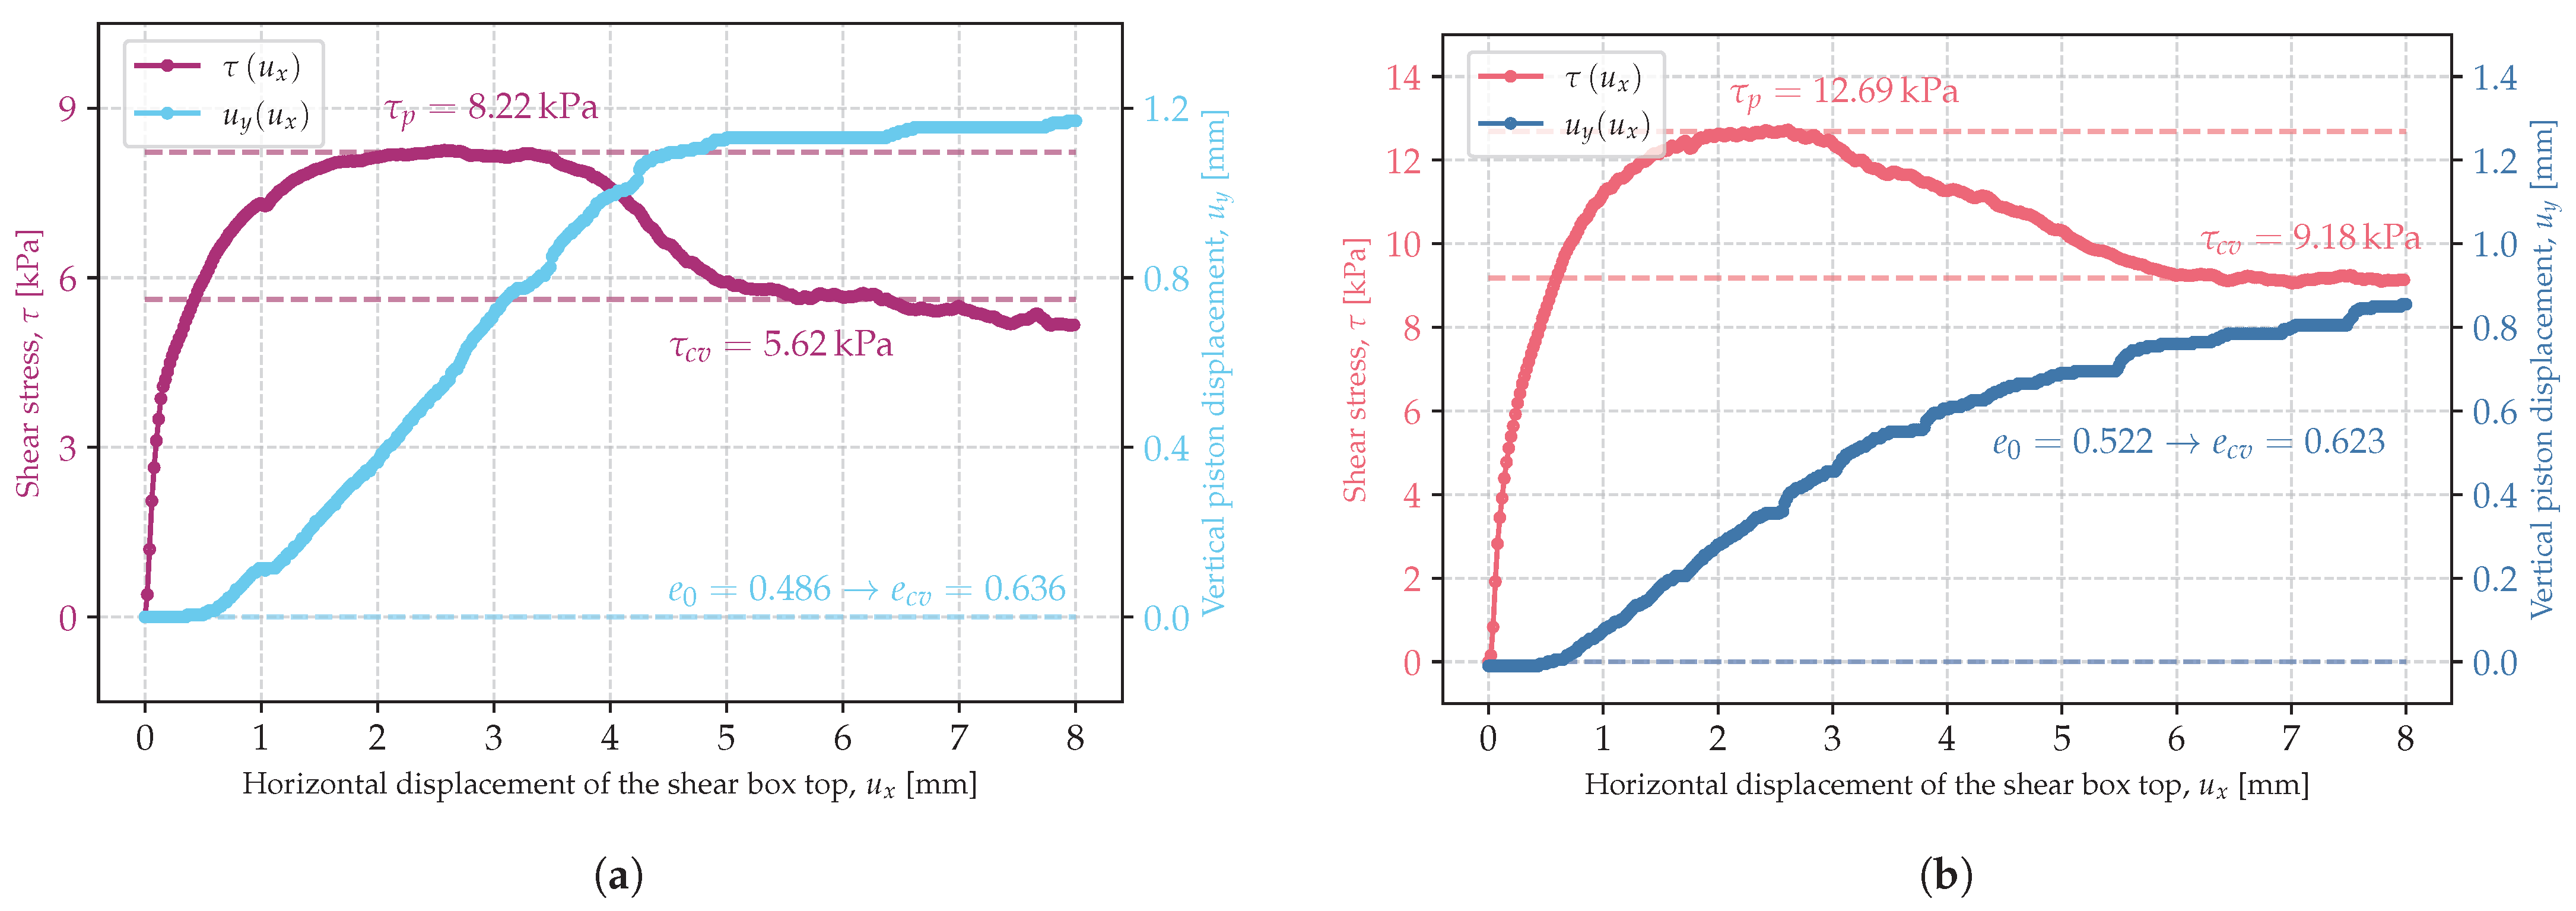
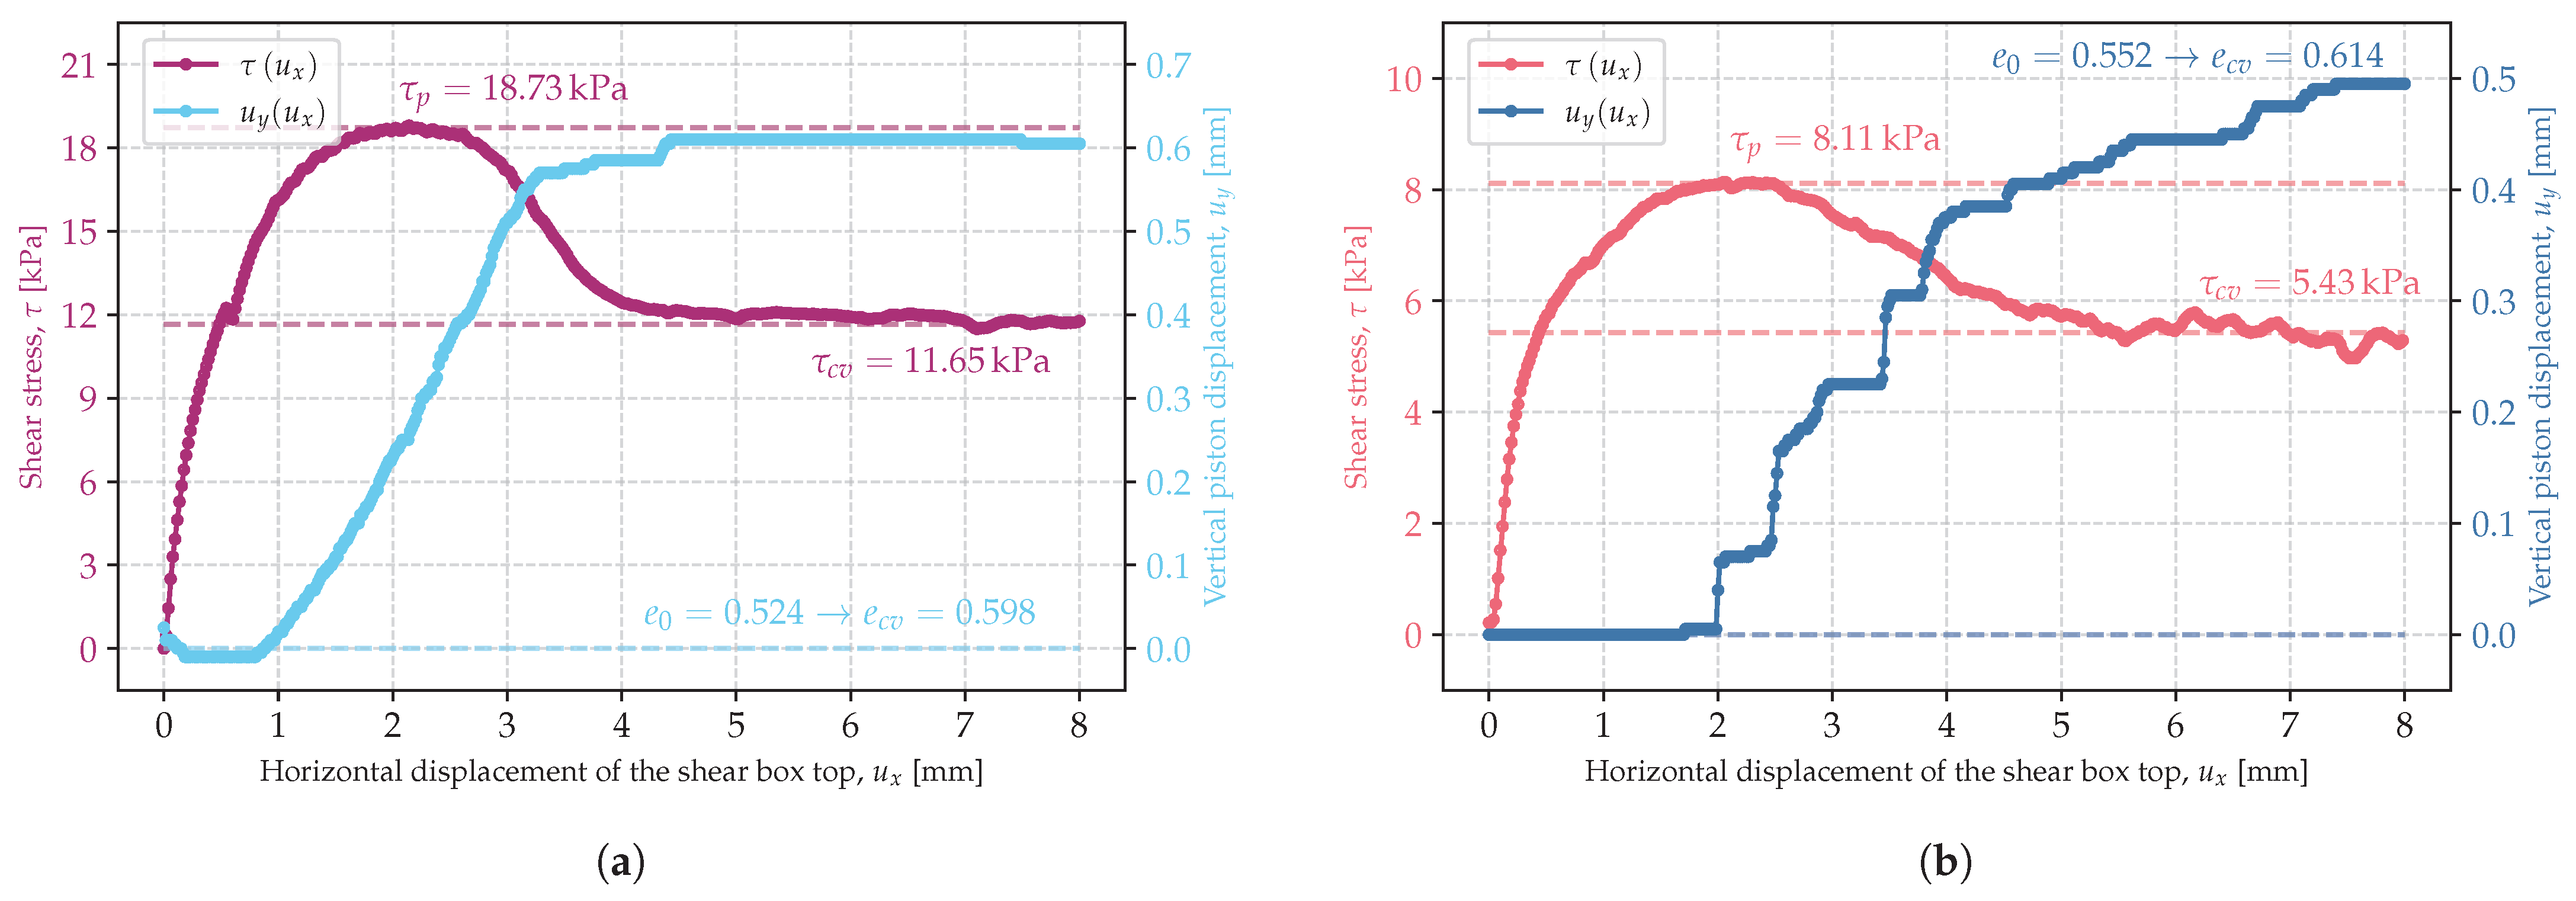
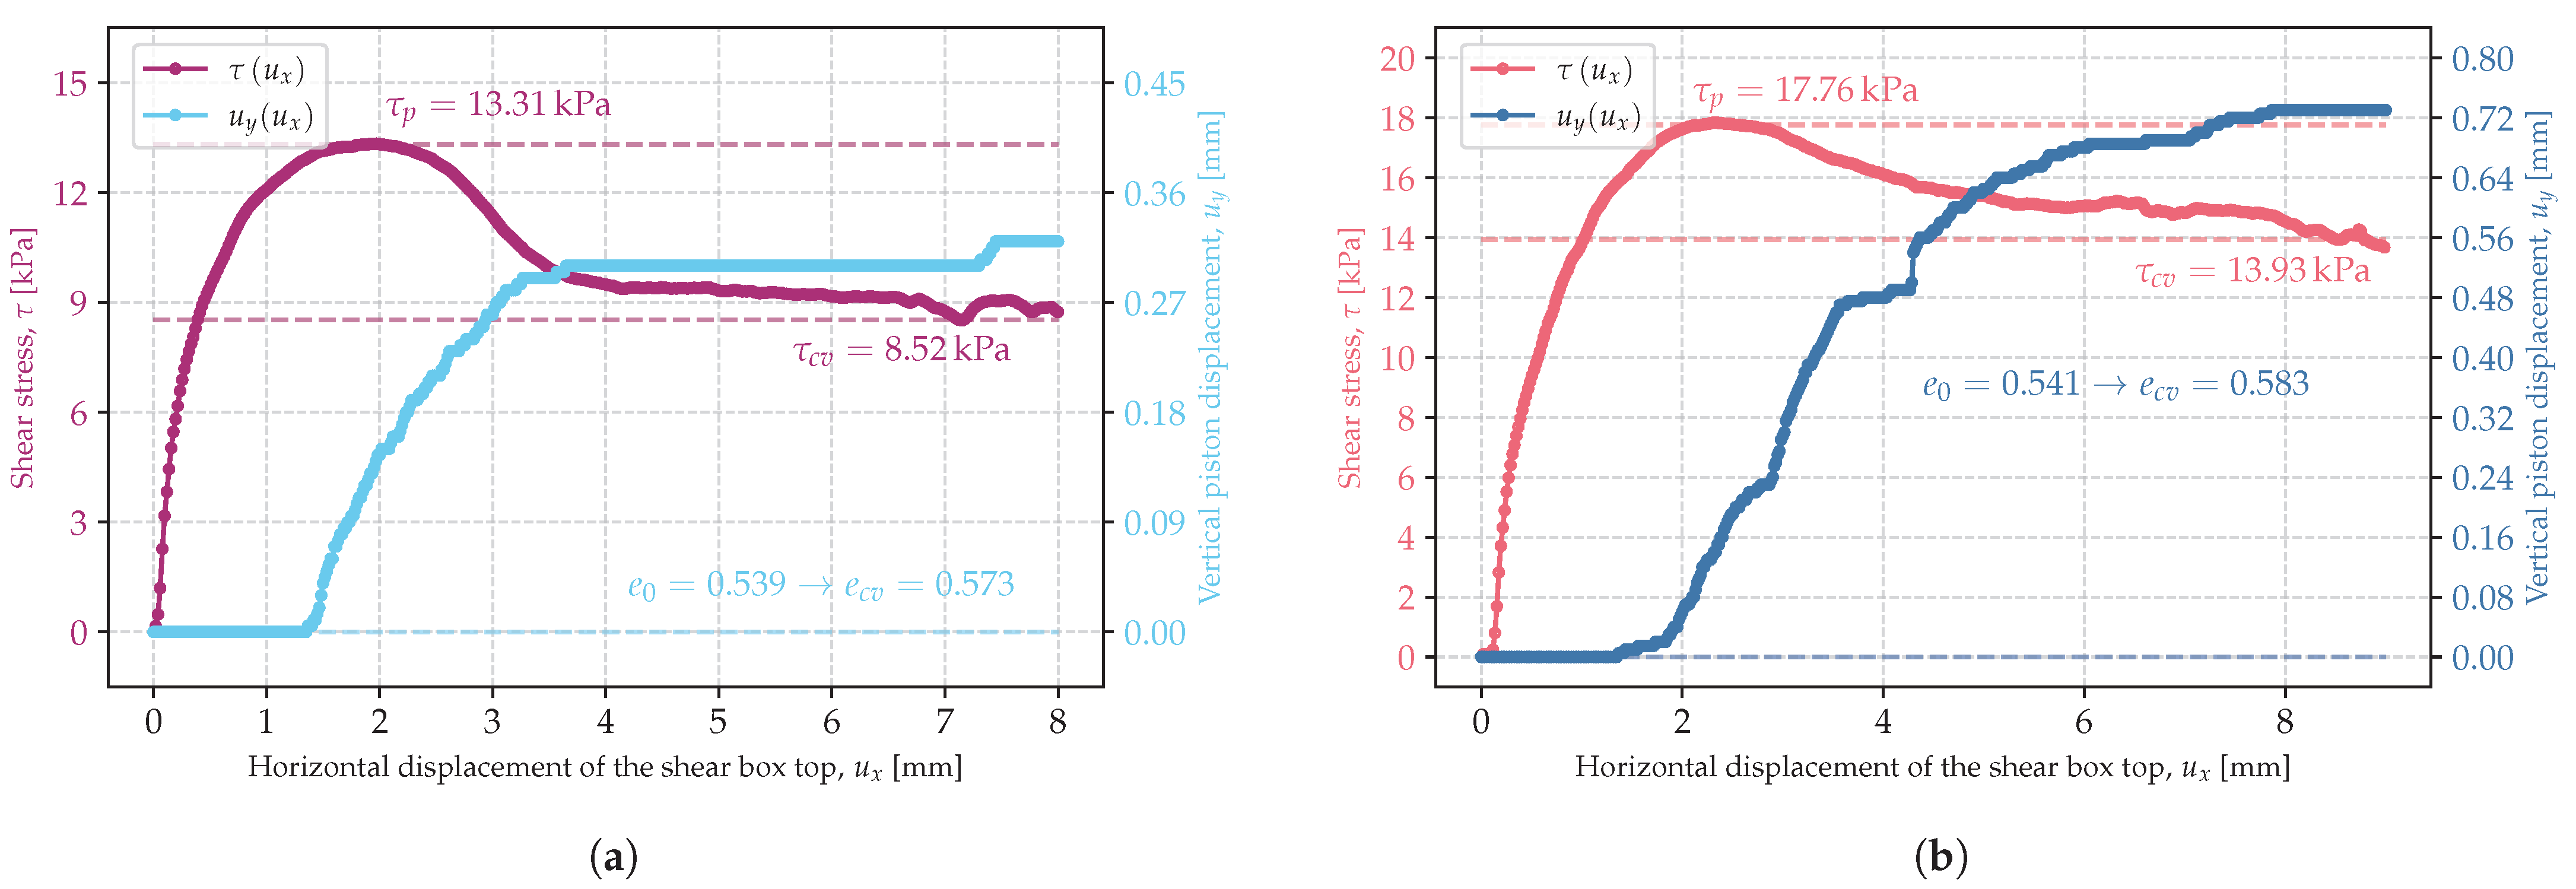
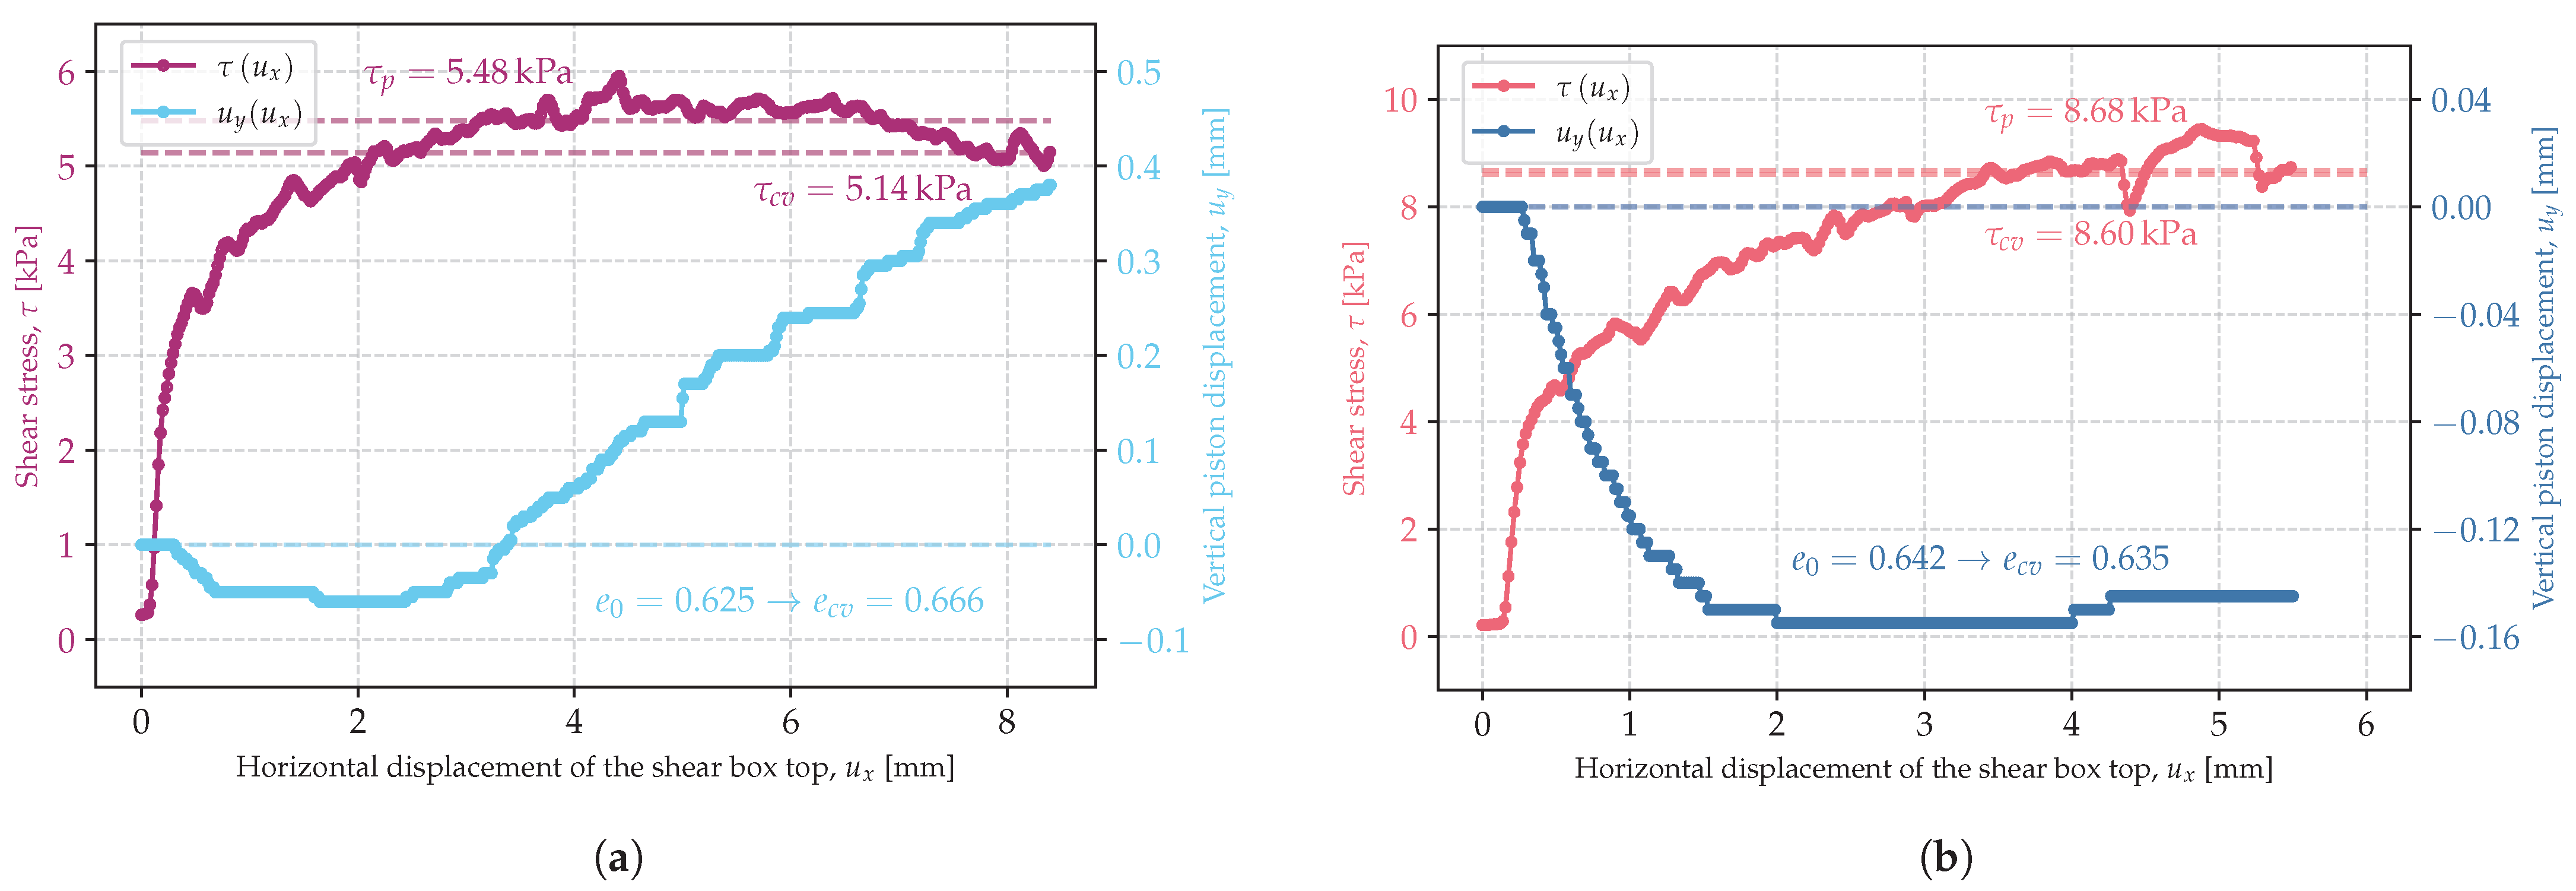
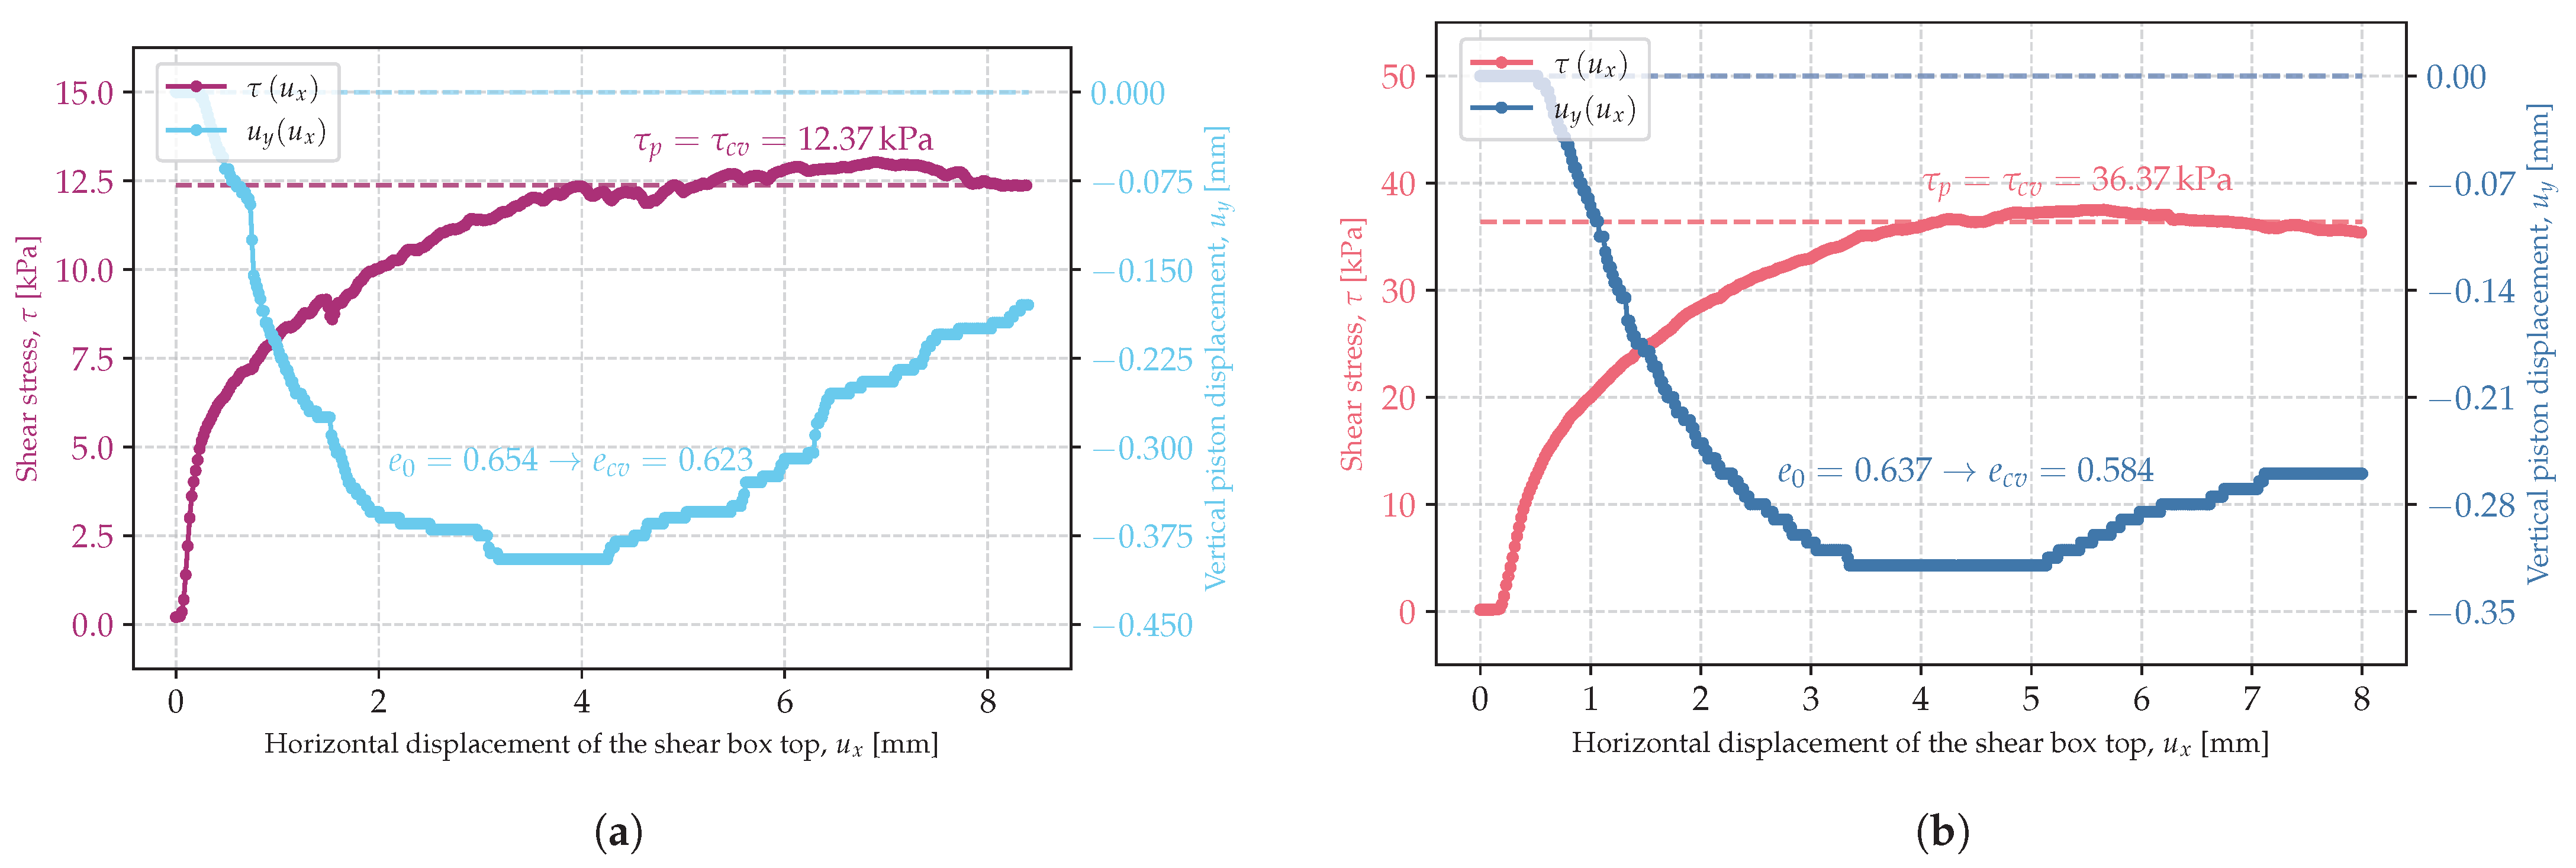
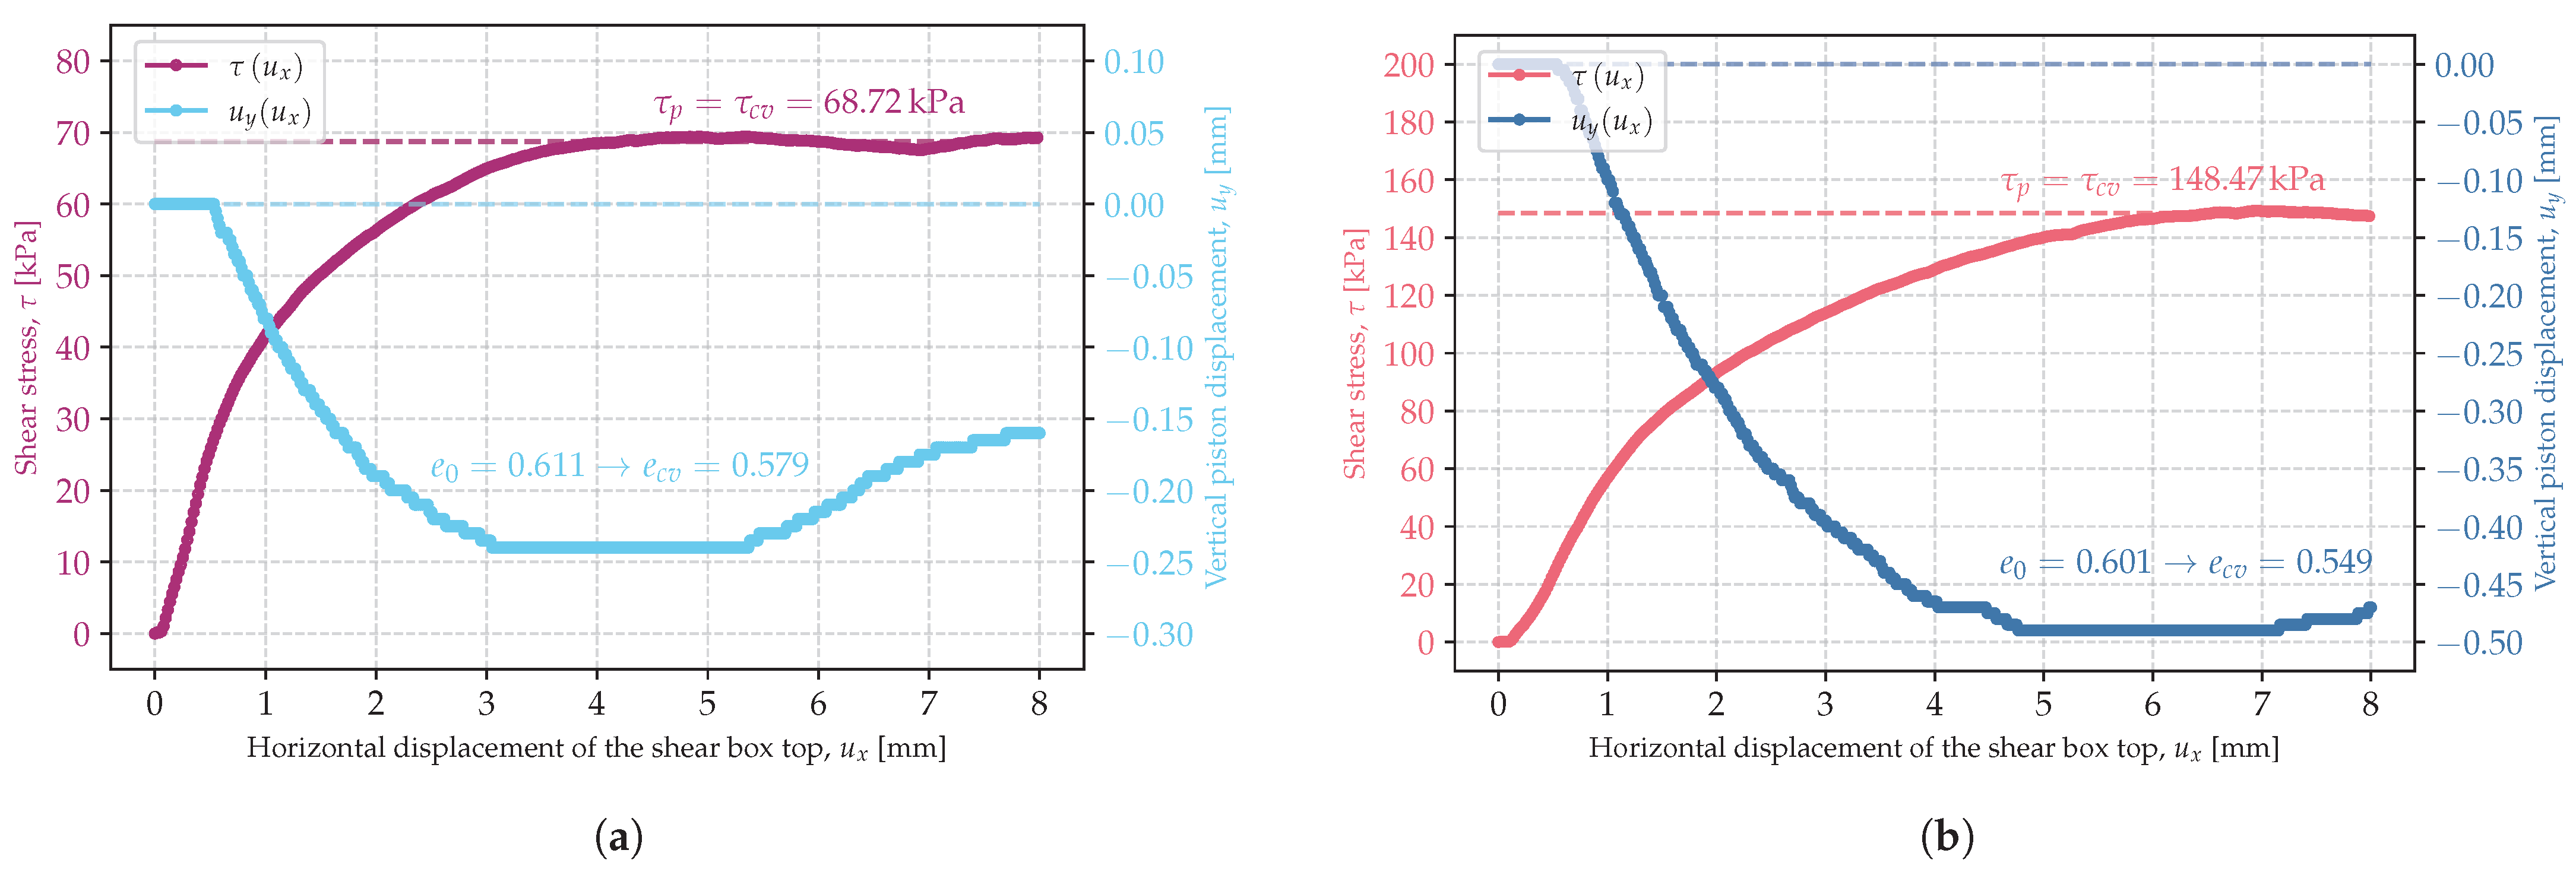
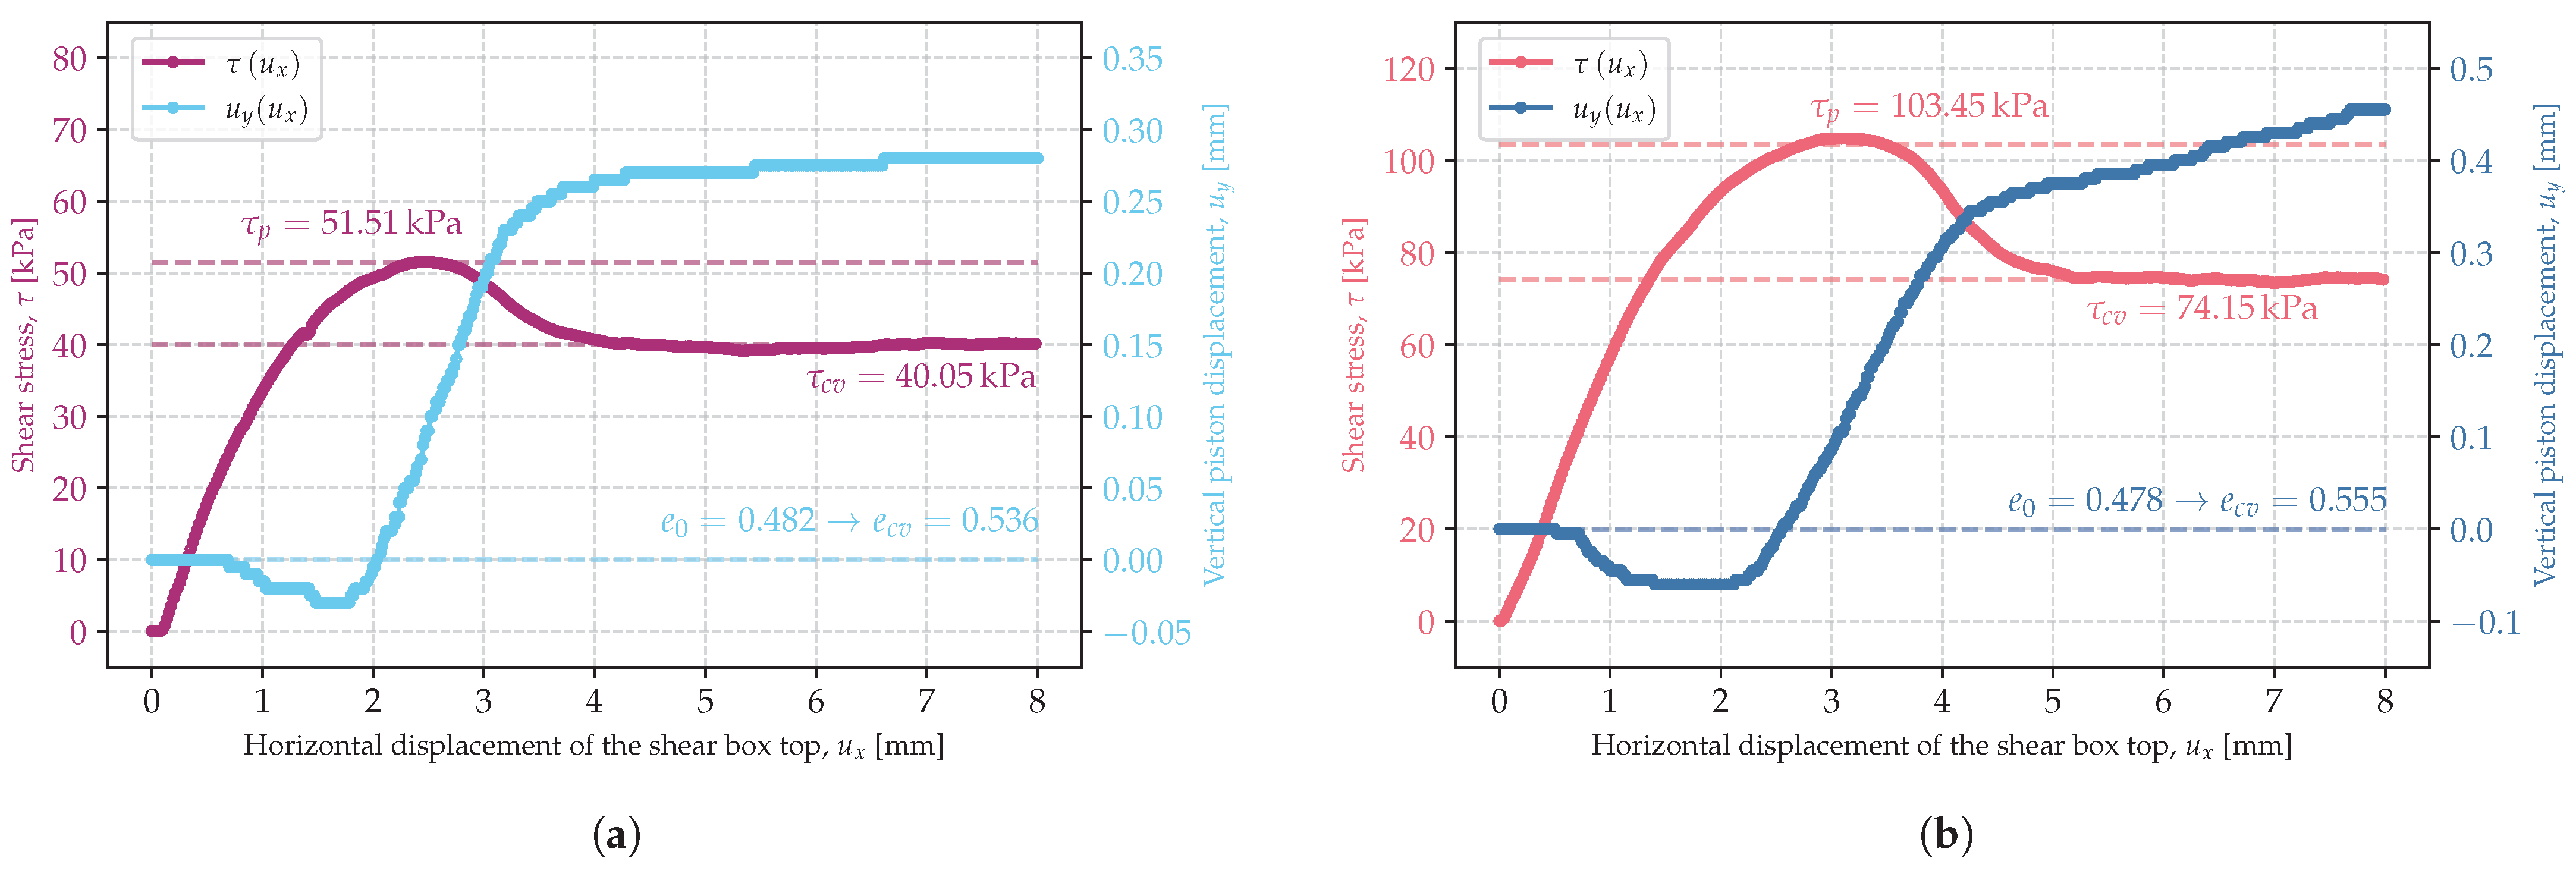
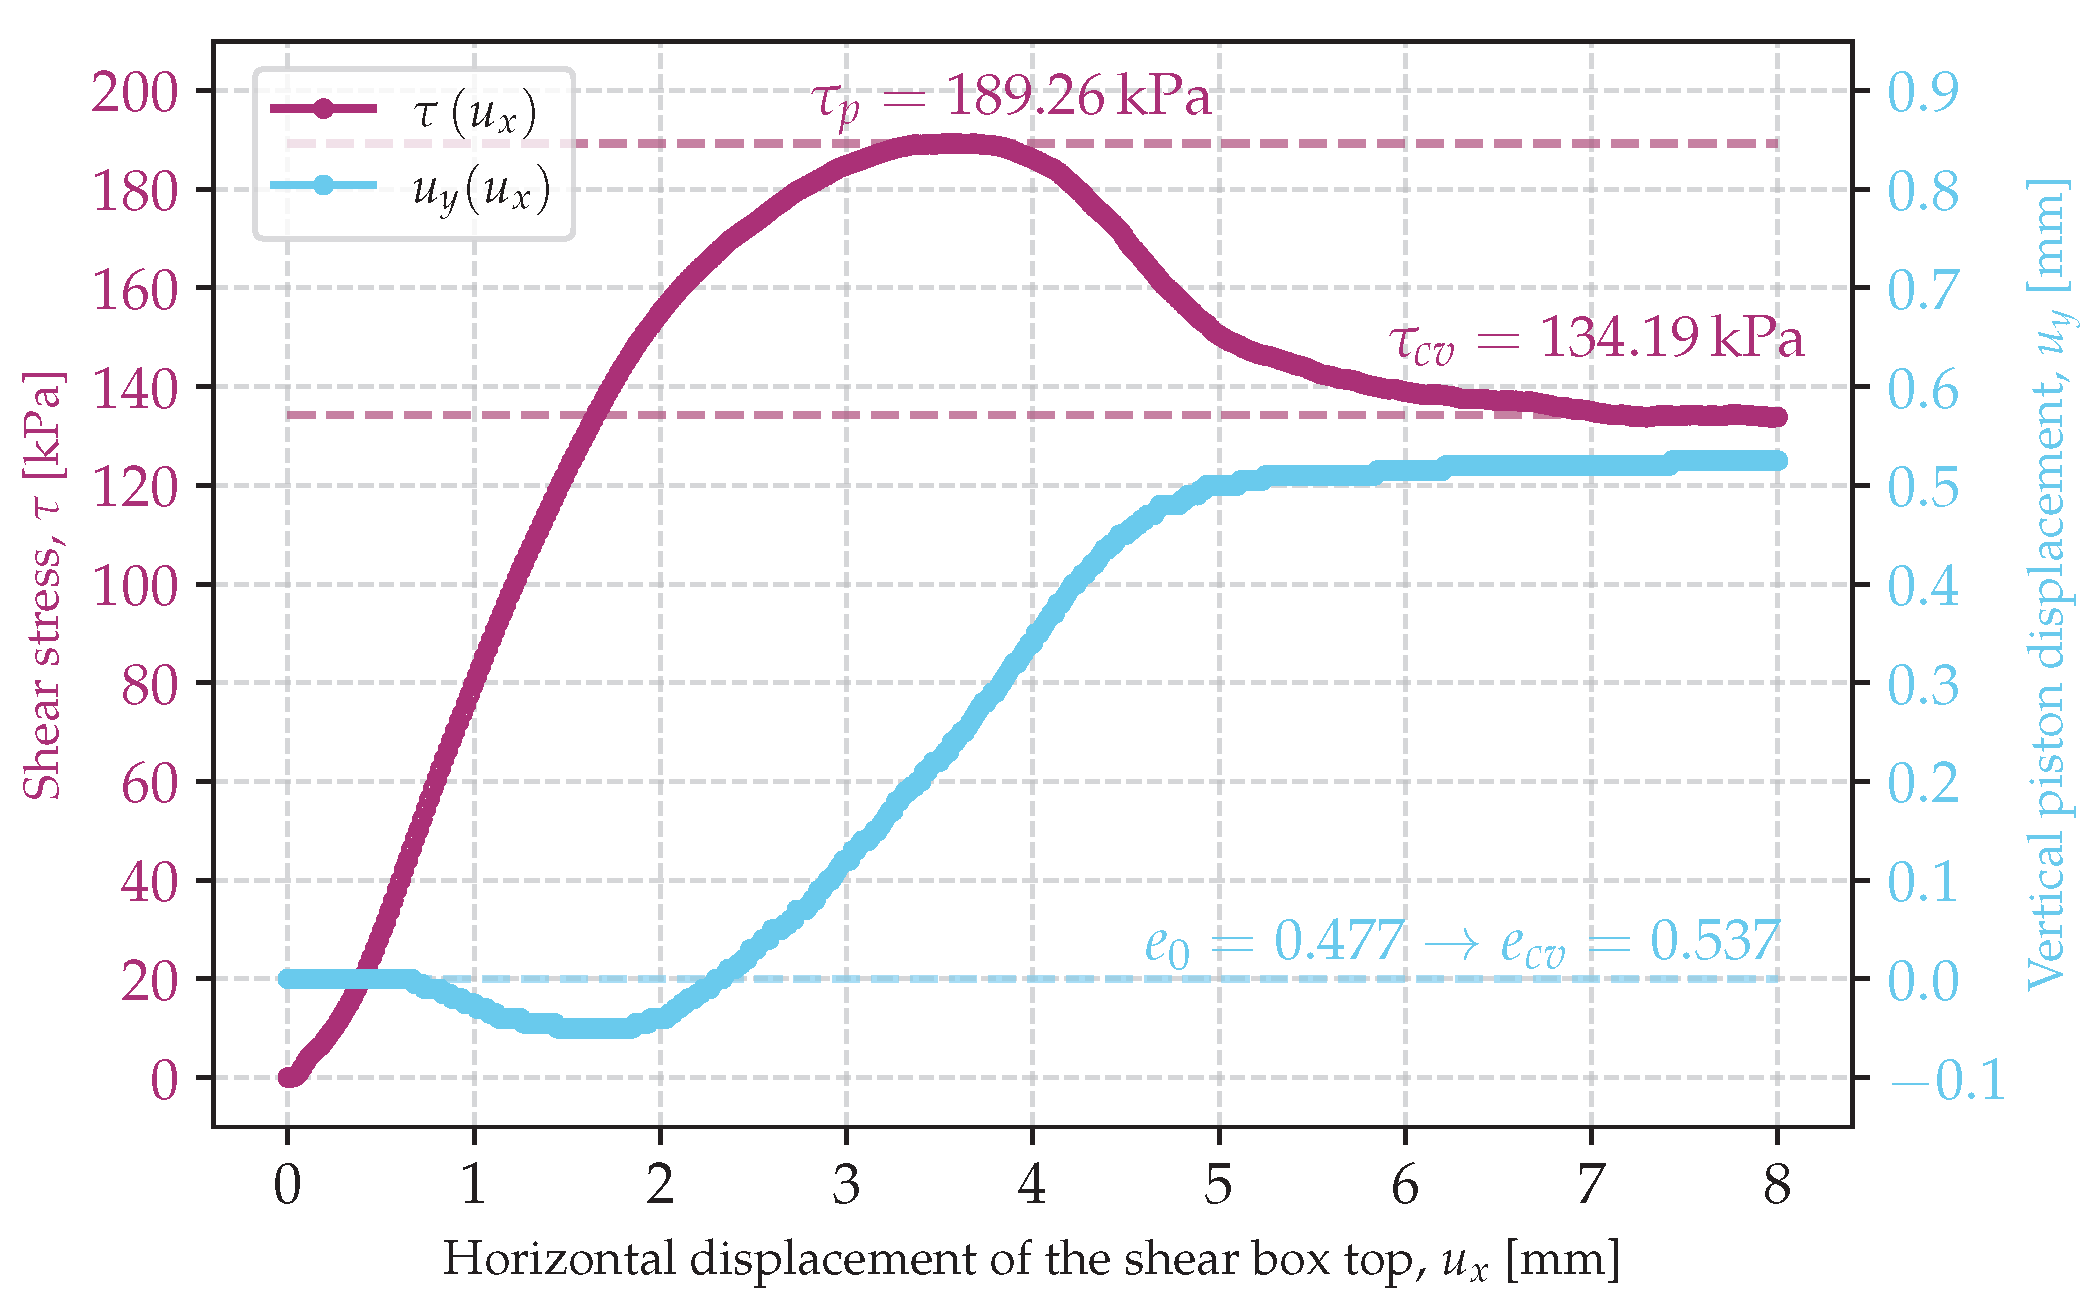
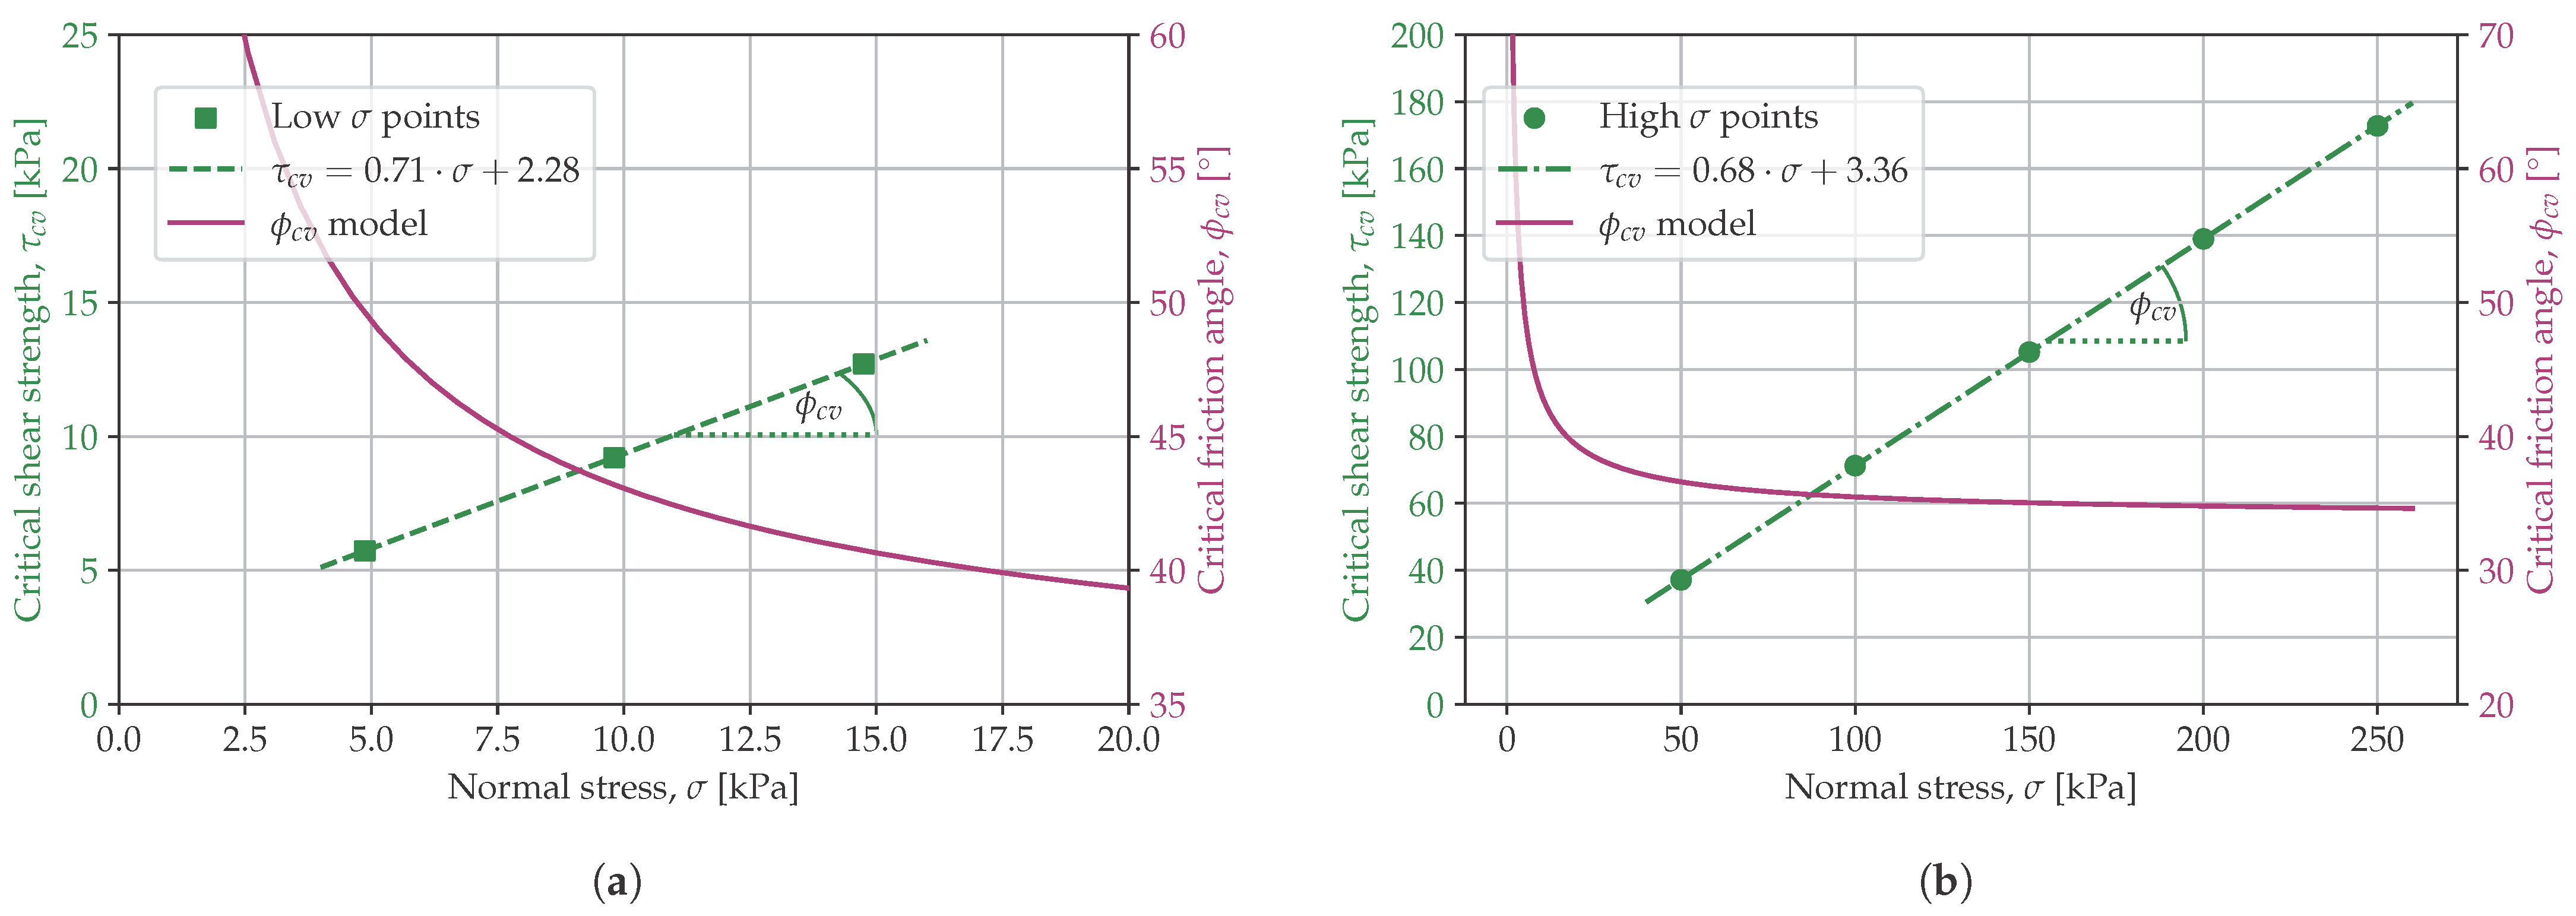
3.1. Critical State of Shearing

When each sample was examined, it was observed that once the critical shear strength value was reached, the sample no longer changed its volume, and further shearing took place at a constant volume. The change in volume of the sample caused a change in the porosity index e from initial value of porosity index e 0 to critical value of porosity index e c v . The value of the porosity index obtained from the critical shear strength was defined as the critical porosity index e c v . Figure 5 presents the relationship between the porosity indexes of the soil and the stresses, indicating the initial and critical porosity indices. The critical values of the porosity indexes tended to a line known in the literature as the critical state line (CSL).
The critical porosity index e c v and stress σ in the soil sample was approximated by Formula (1), which was developed by the authors of [9,10]:
e c v = 0.022 ln ( σ ) + 0.659
where σ denotes the normal stress in the soil sample [kPa].

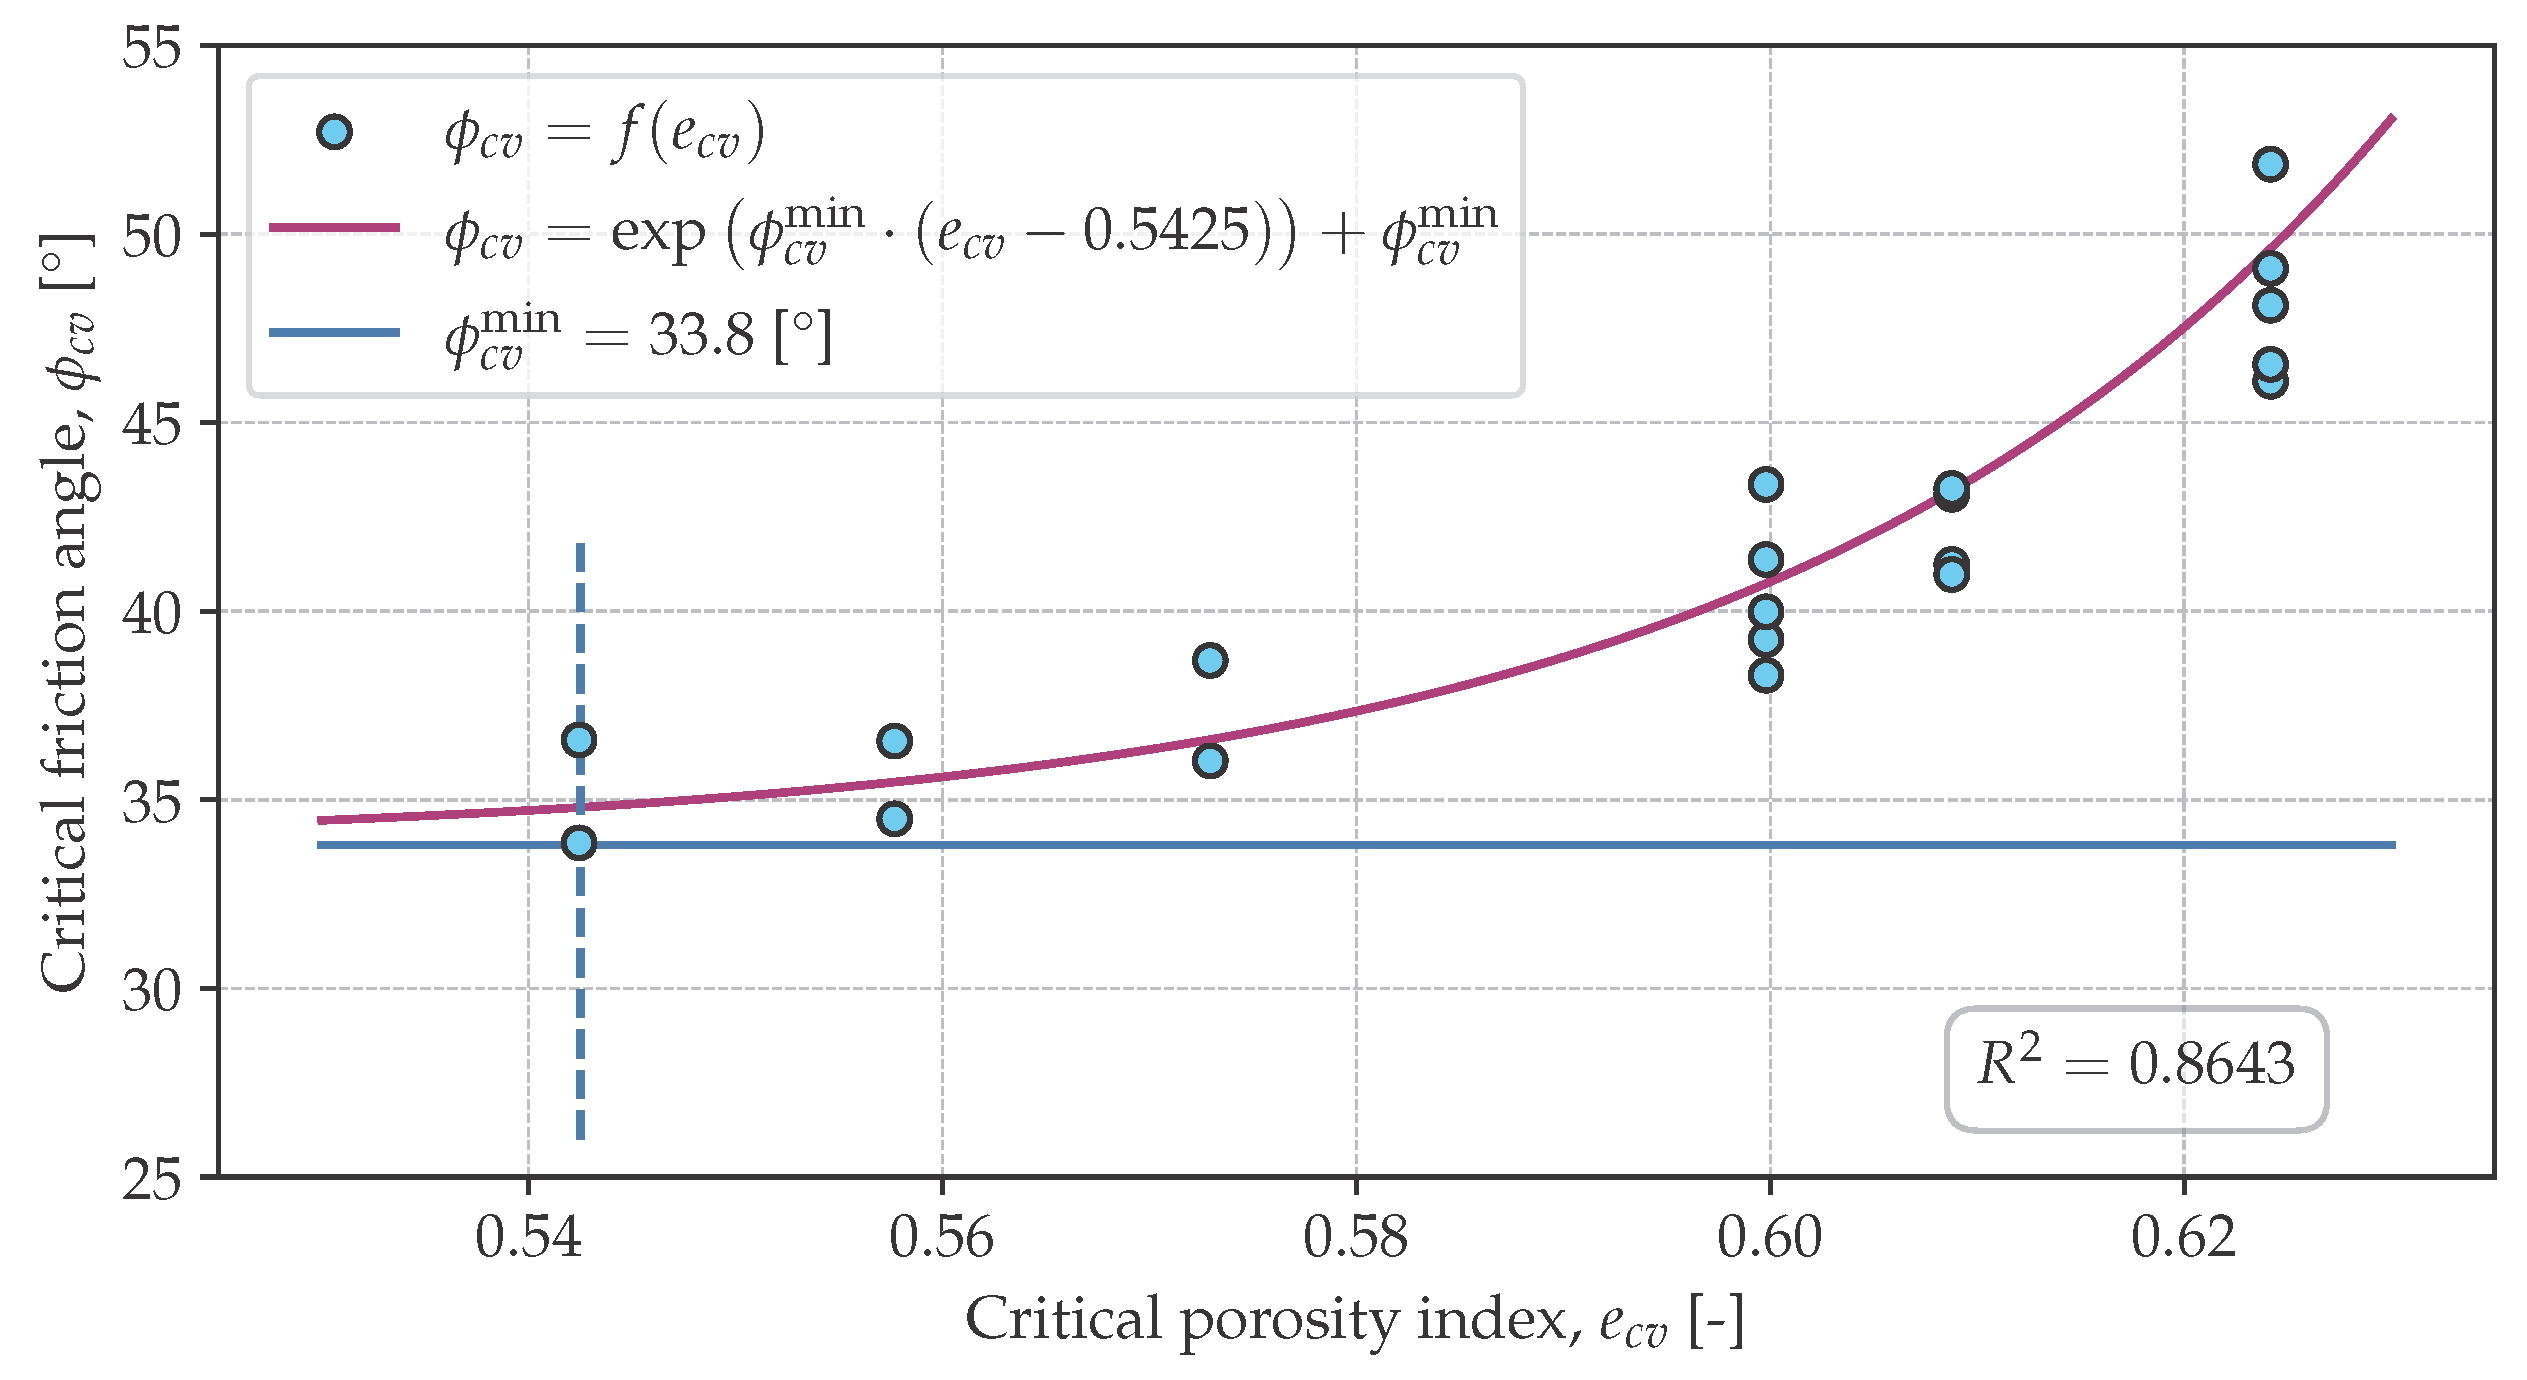
3.2. Critical Friction Angle

Critical friction angle ϕ c v is defined as the friction angle determined by the shear strength of soil at the critical porosity index. Since dry, cohesionless soil was examined, the cohesion was assumed to be zero. The critical friction angle can be calculated from each test based on Formula (2), which is derived from Coulomb’s theory in reference to cohesionless soils:
ϕ c v = arctan τ c v σ
where τ c v is the shear strength of the soil at the critical porosity index [kPa].
The relationship between the critical friction angle and the critical porosity index calculated from (1) was approximated by the proposed Formula (3) and presented in Figure 6:
ϕ c v = exp ϕ c v min · ( e c v 0.5425 ) + ϕ c v min
where ϕ c v min represents the minimum critical friction angle determined by the horizontal asymptote [°].
The critical friction angle of the soil increased nonlinearly with an increase in the critical porosity index. As was observed in Figure 5, the highest values of the porosity index were obtained under low stress. At low stresses, grain crushing was negligible and grain roughness and shape were of paramount importance, as was reflected in the high value of the critical angle of soil friction. At high stresses, the contact forces between the grains were large enough to cause the grains to be crushed and rounded. This meant that a high porosity index was not required to achieve the critical shear strength, as was the case at low stresses, and thus, the critical soil friction angle was smaller, as presented in Figure 6.

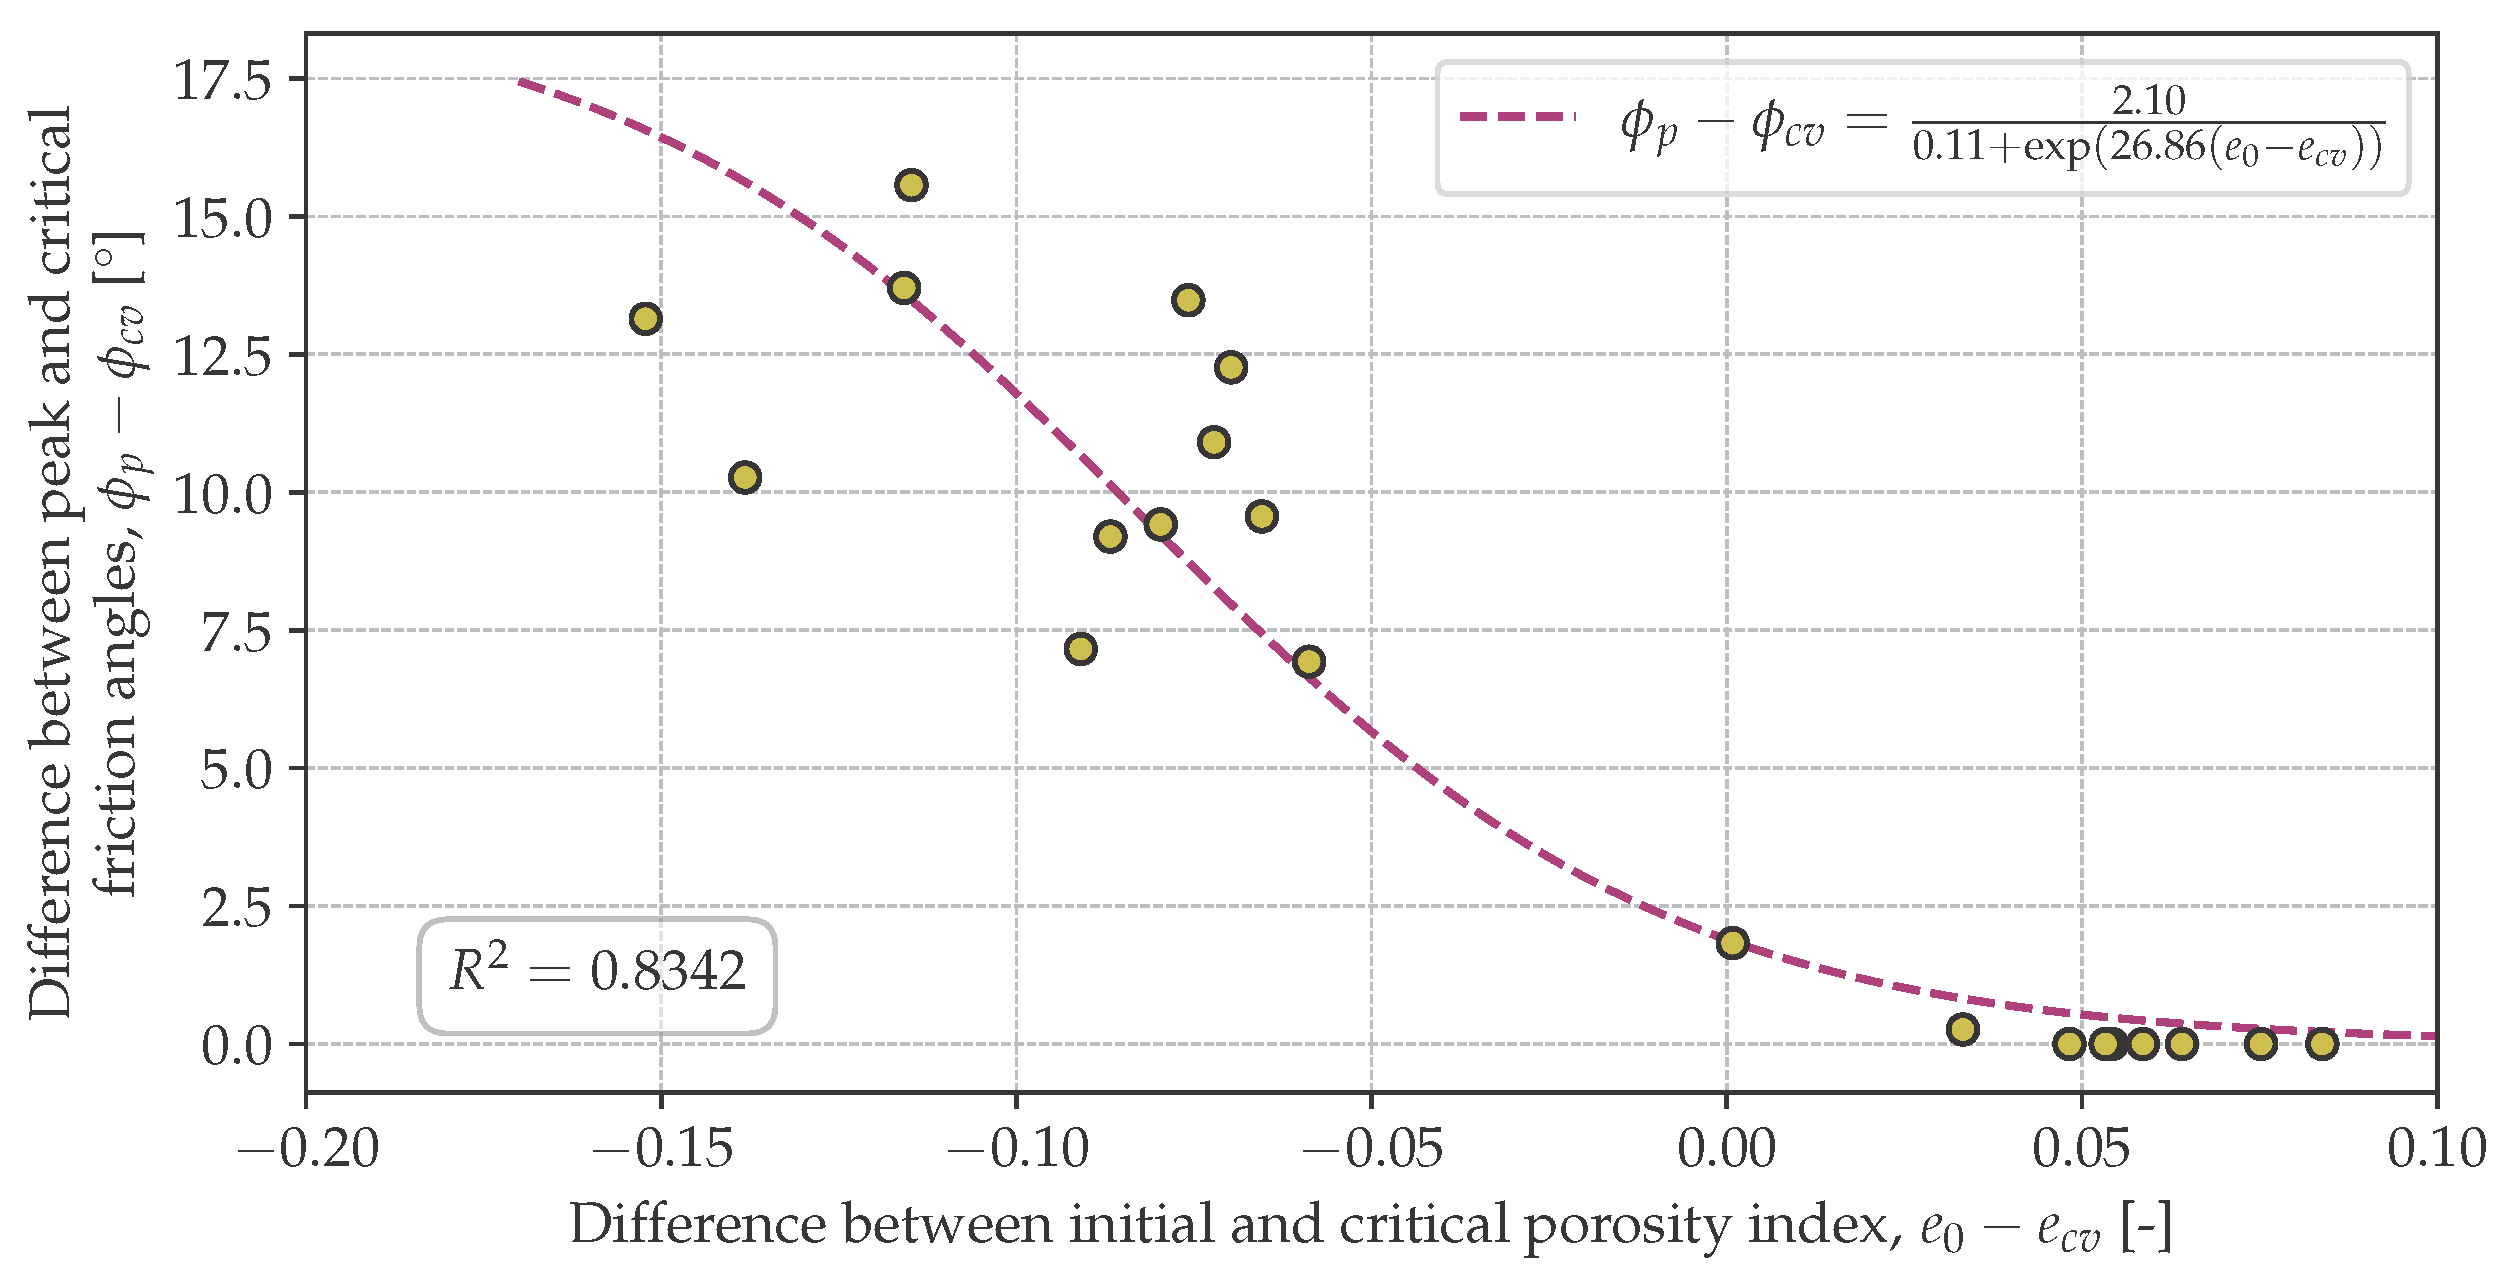
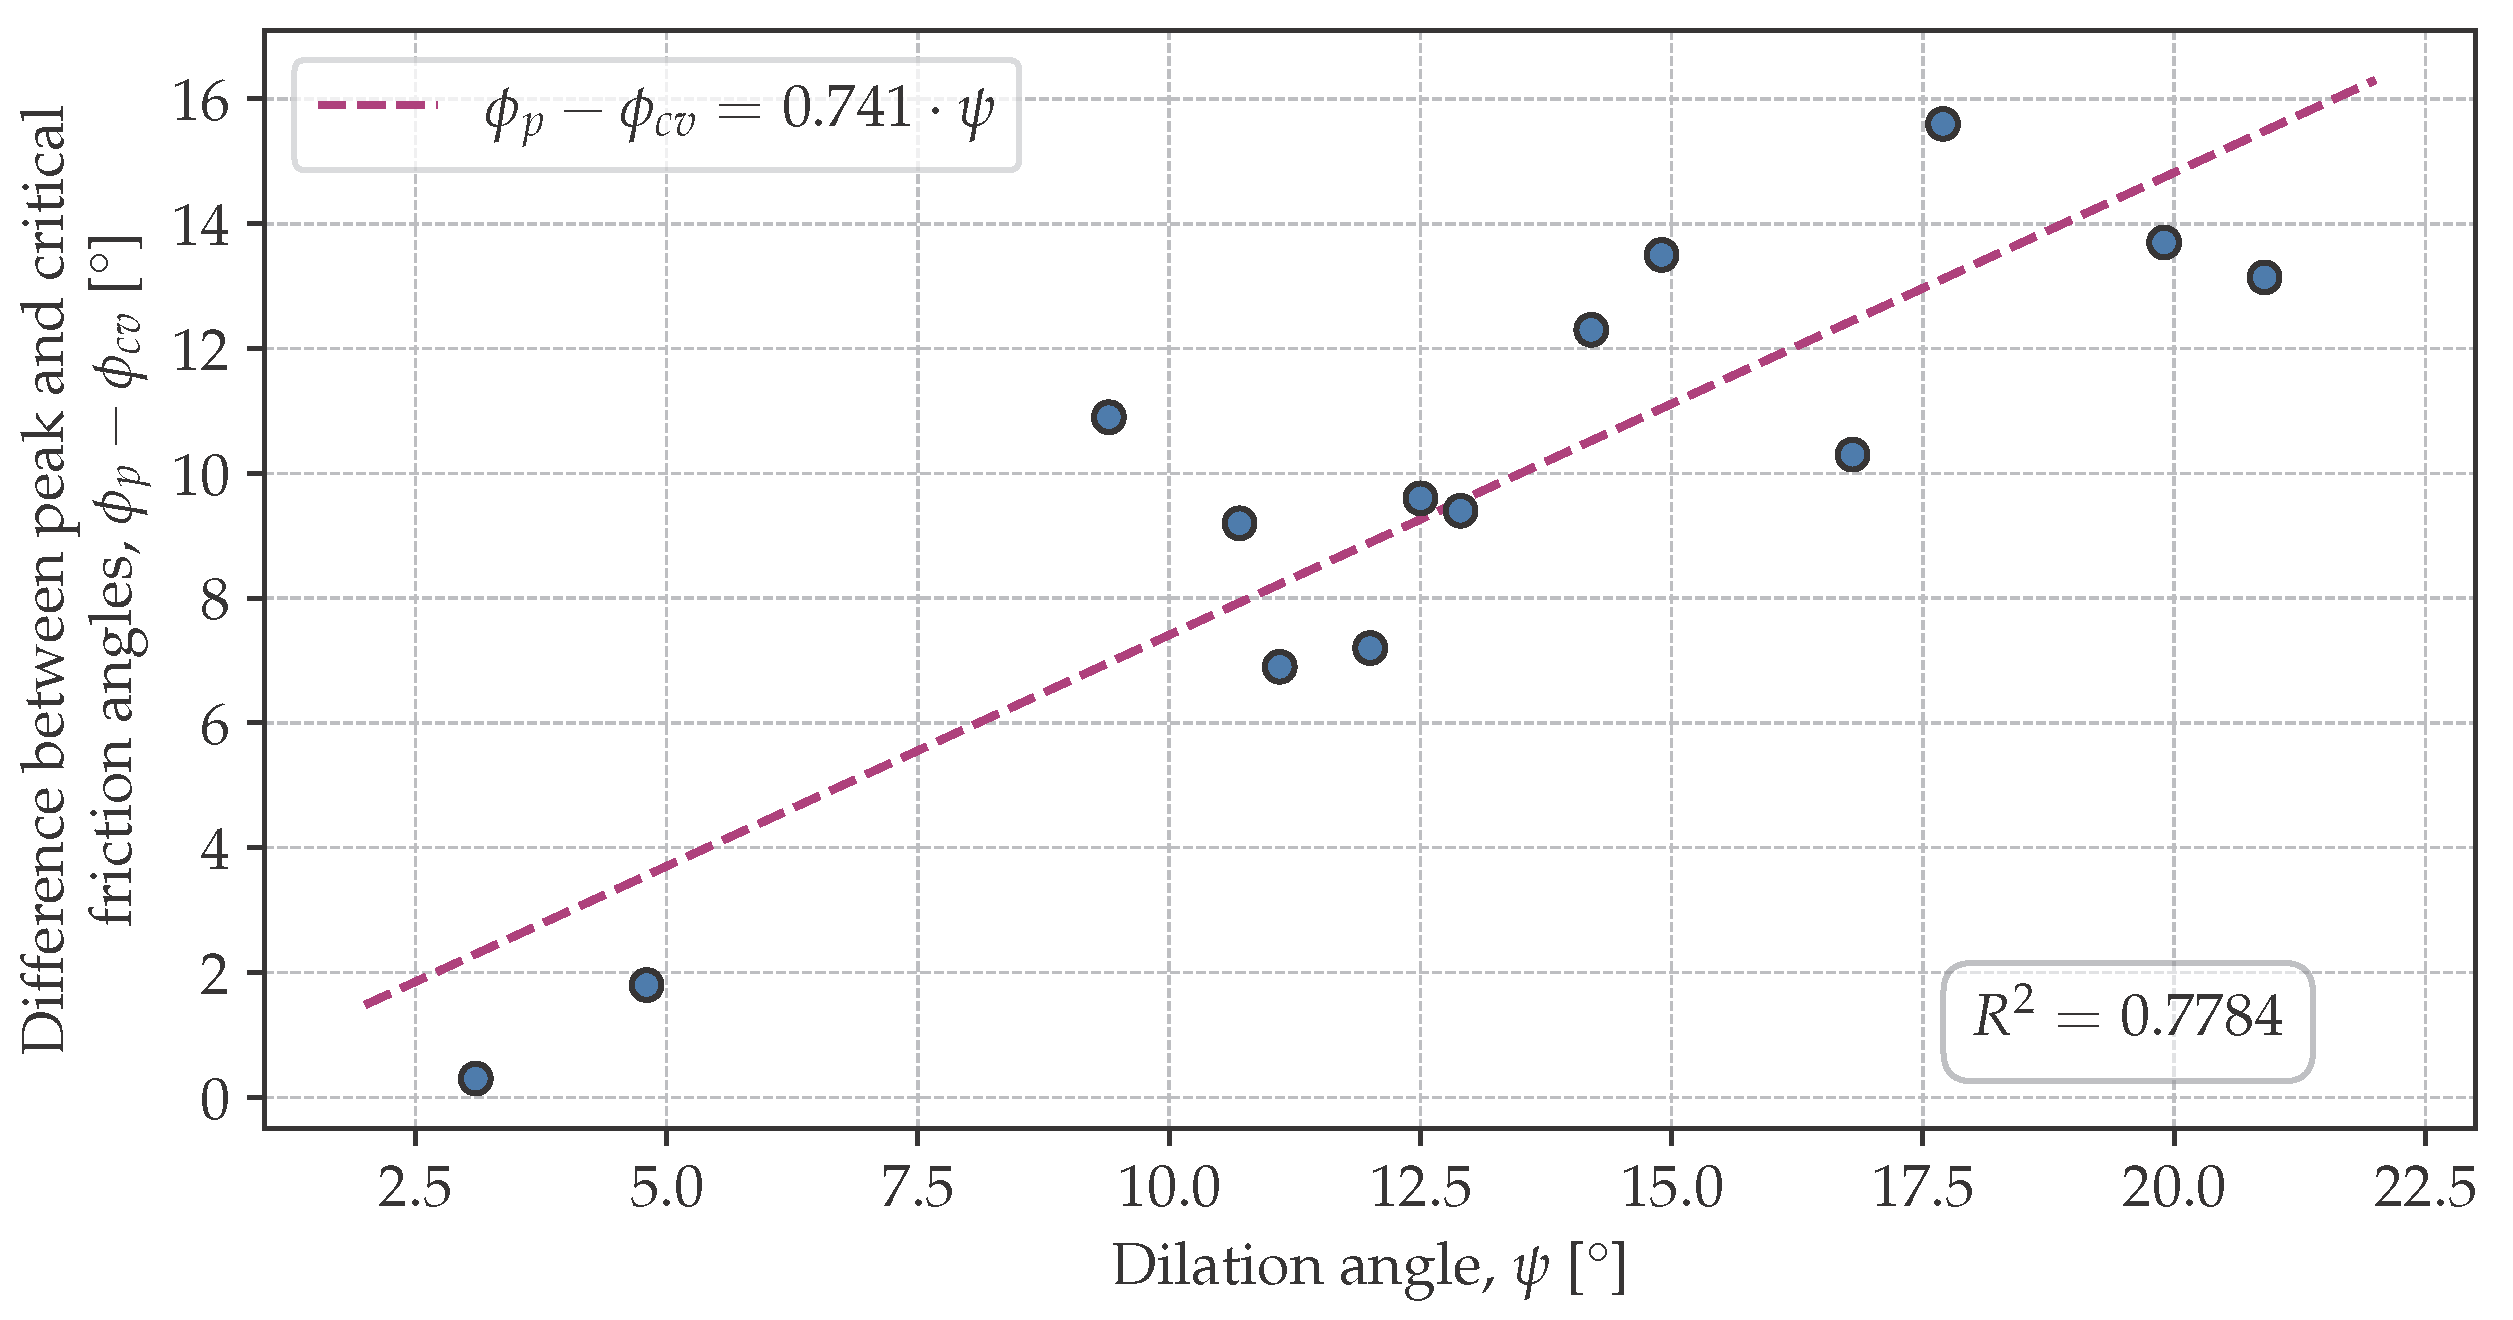
3.3. Peak Friction Angle

Peak friction angle was defined as the friction angle determined by the maximum shear strength of the soil. The peak friction angle can be calculated from each test based on Formula (4):
ϕ p = arctan τ p σ
where τ p denotes the peak shear strength of soil as a maximum shear stress in soil [kPa].
In contractive samples, the peak shear stress was equal to the critic shear stress; but especially in dilative samples, peak stresses significantly exceeded the critical value. The difference between the peak and critical values of the soil friction angle shown in Figure 7, related to the difference between the initial and critical porosity index, also known as the state parameter [11].
The smaller the initial porosity index was in relation to the critical porosity index, the greater the difference observed between the peak and critical internal friction angles.
For the purposes of further analysis, this relationship was approximated by the proposed Formula (5):
ϕ p ϕ c v = 2.10 0.11 + exp ( 26.86 · ( e 0 e c v ) )
where e 0 is the initial porosity index of the sample [-].
Following Bolton’s theory [13,29], the difference between the peak and critical soil friction angle could be represented in terms of the dilation angle, which was defined as the slope of the graph of the change in sample height versus horizontal displacement. Bolton’s equation had the following forms in (6) and (7) [13]:
ϕ p = ϕ c v + 0.8 · ψ
and
ψ = arctan δ u y δ u x
where u x and u y are the vertical and horizontal displacement values of the soil sample in a direct shear test, respectively.
The results obtained from laboratory tests according to Bolton’s theory are presented in Figure 8.
In the shear tests carried out, a high correlation was observed between the dilation angle and the difference between the peak and the critical soil friction angle. Based on the results, a coefficient of 0.74 was obtained, which was close to the value of 0.8 proposed by Bolton.

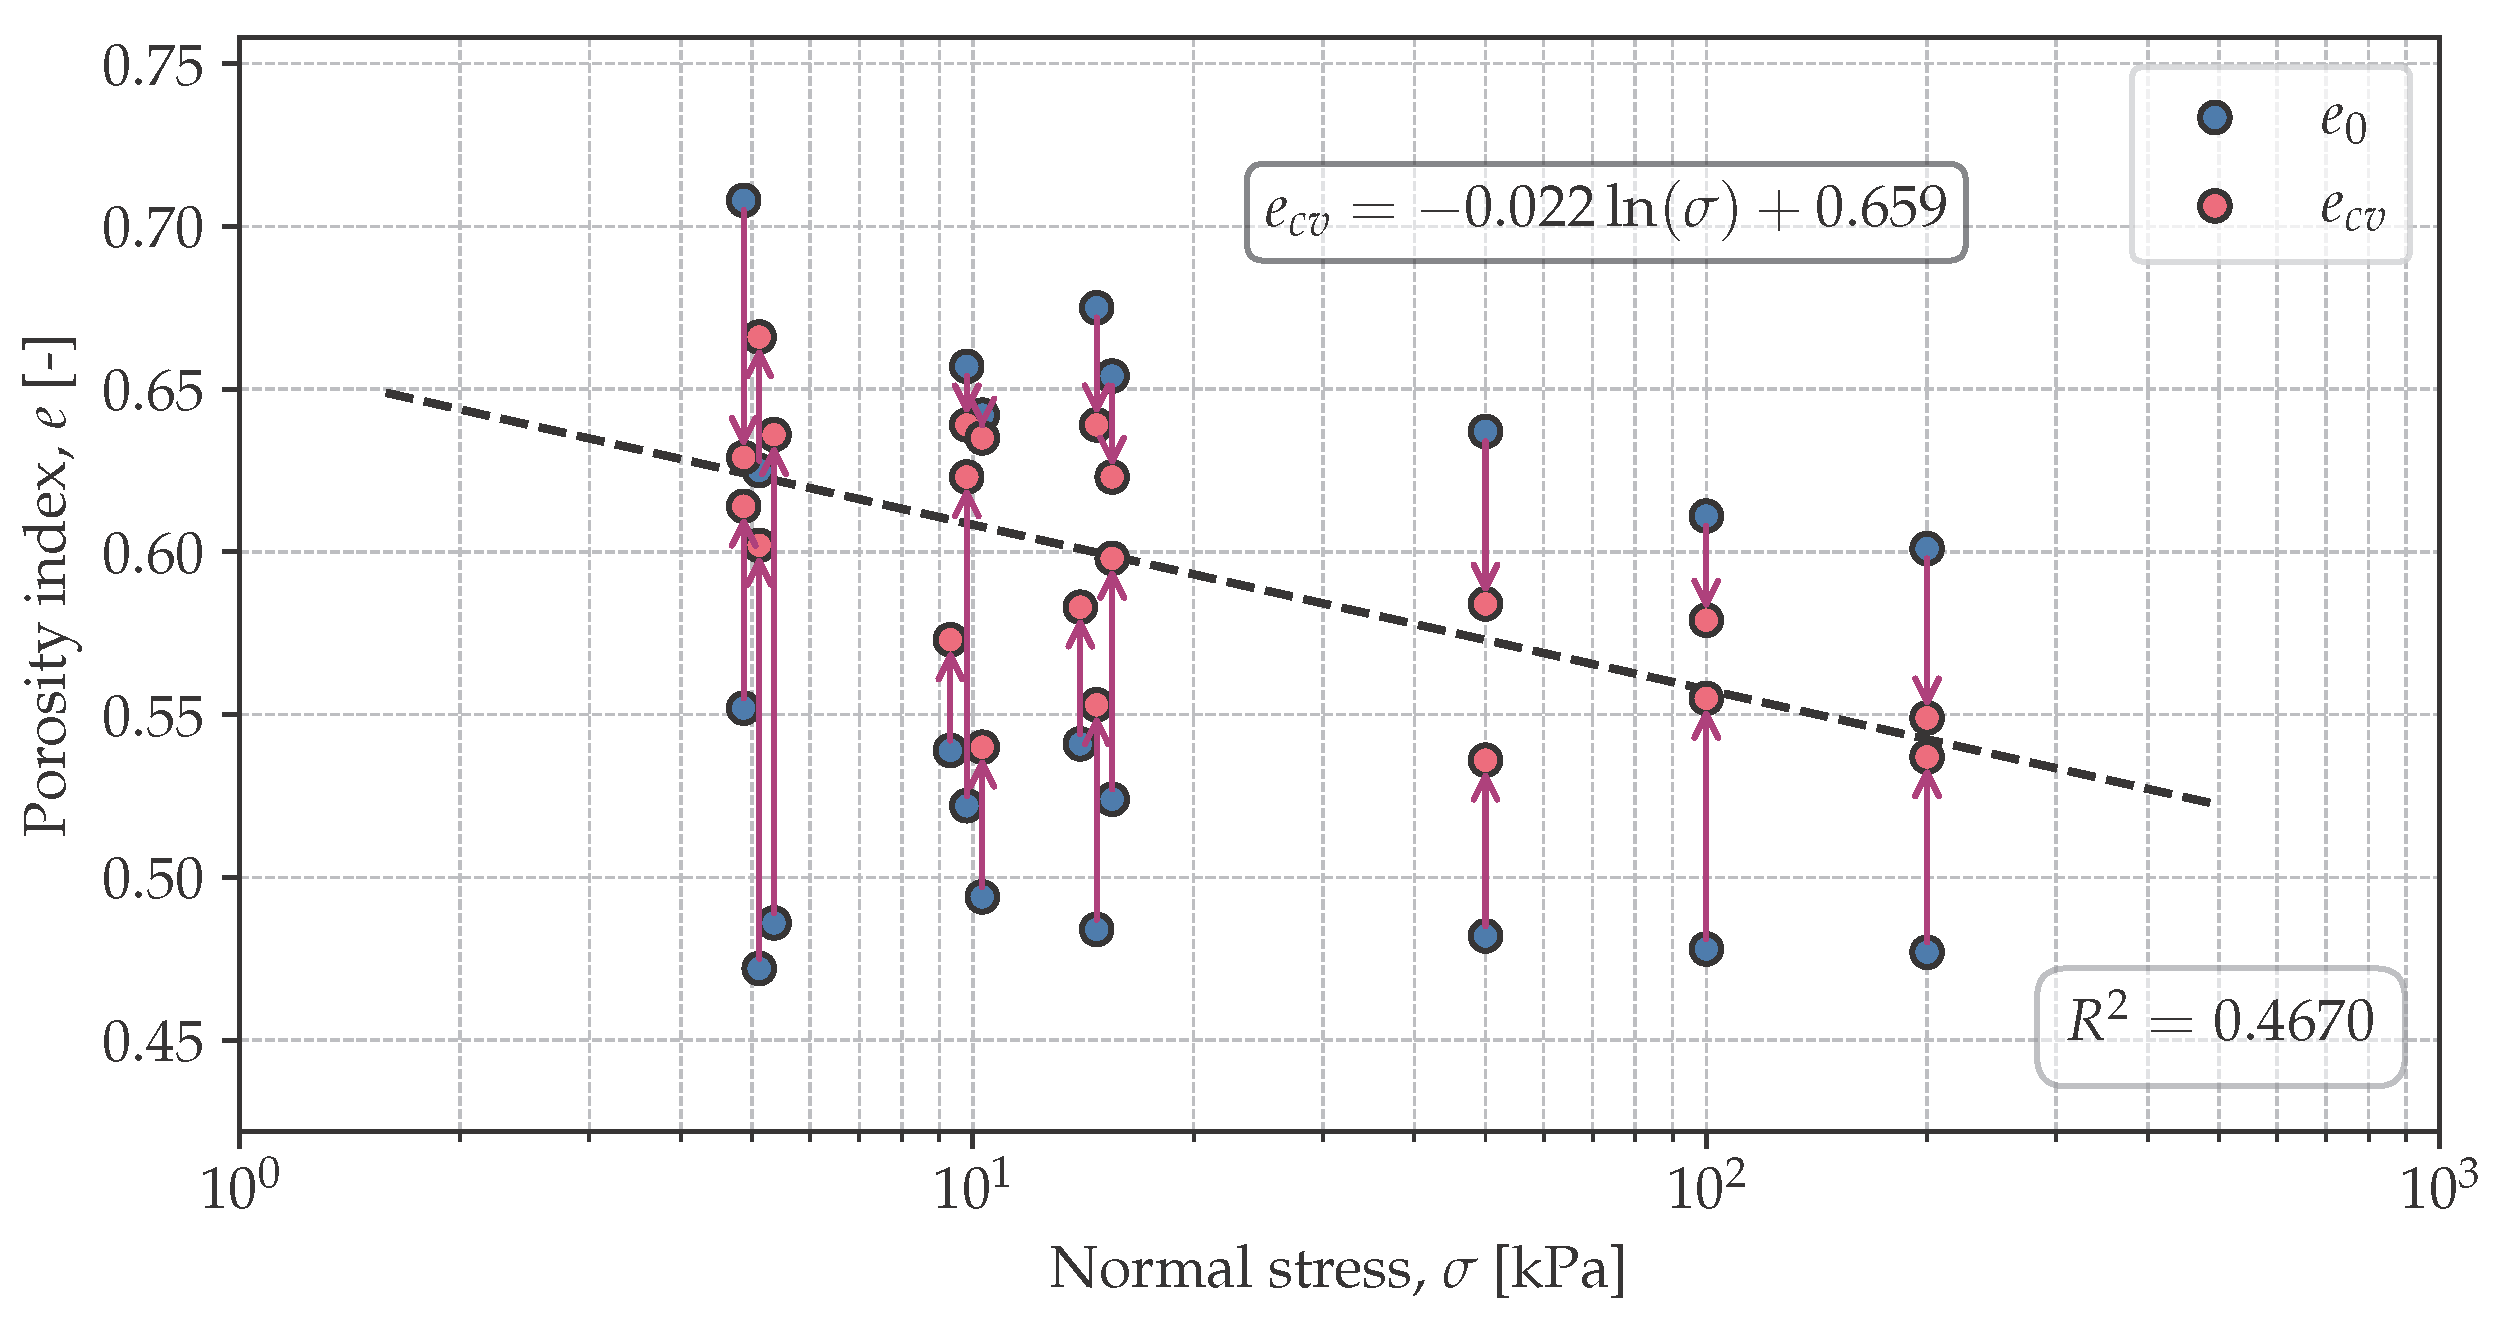
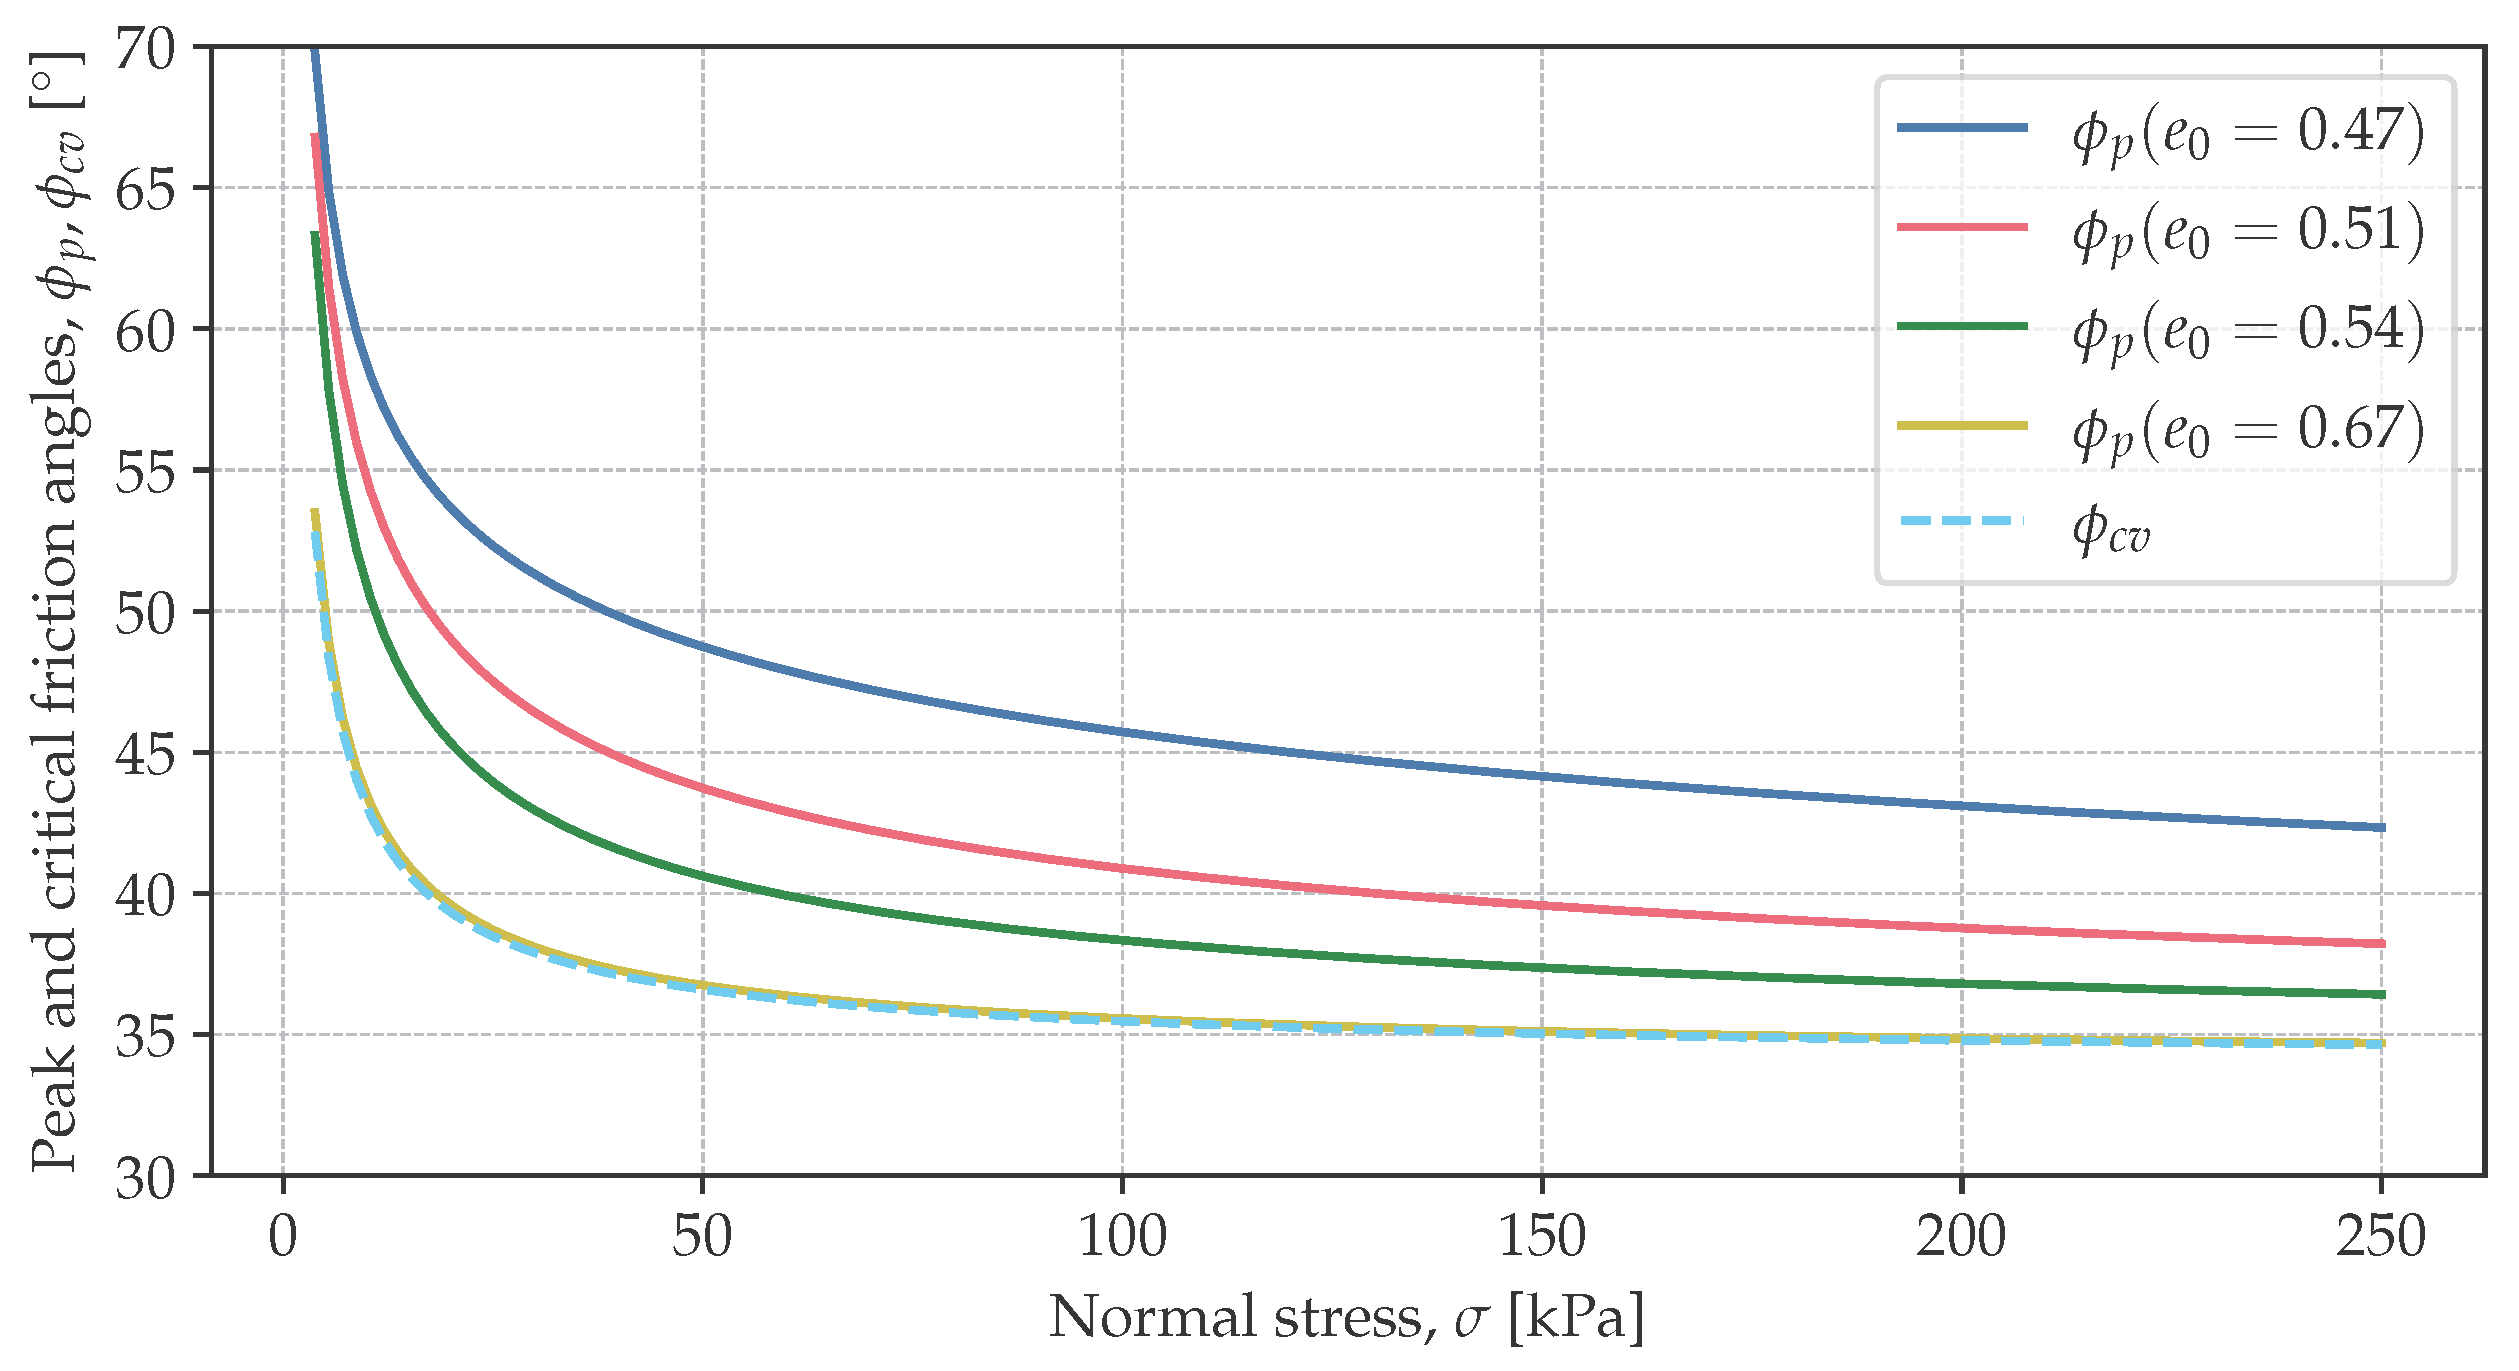
3.4. Critical and Peak Friction Angles in Relation to Stress Range and Initial Porosity Index

Considering Formula (2) within Formula (3), the critical friction angle depended only on the stress. This phenomenon was also observed by the authors of [24,26]. This relationship is presented in Figure 9 by the sky-blue dashed line. The peak friction angle depended on both the critical friction angle and initial porosity index. Therefore, following Formulas (1), (3), and (5), the peak friction angle depended on normal stress in the soil sample and initial porosity index, as is presented in Figure 9 through dashed lines, respectively.
As Figure 9 shows, both the critical and peak angles of internal friction decreased as the normal stress in the sand sample tested increased. The change was most pronounced at low stresses up to 50 kPa, where the critical soil friction angle decreased from a value close to 50 degrees to 36 degrees. A further increase in normal stress caused a less significant decrease in the critical angle of friction to 34 degrees at a stress of 300 kPa. The lower the initial porosity index, the higher the peak angle of internal friction.
Figure 9 is a synthetic summary of the tests carried out, illustrating the effect of the initial soil porosity index and the normal stress acting on the shear plane on the value of the peak friction angle. An analysis of the graph indicates that both the critical and peak friction angles are not constant quantities but show a dependence on the level of normal stress. One of the key conclusions from the interpretation of the data presented is that assuming a constant value for the internal friction angle in advanced numerical analyses can lead to significant computational errors, especially in areas with low stress levels.
Figure 10 presents the peak shear strength and peak friction angle versus normal stress of sand with an initial porosity index of e 0 = 0.54 .
The difference in the peak angle of internal friction of a medium-dense sand sample, measured under stress levels commonly used in engineering research, i.e., from 50 to 300 kPa, was 40 and 36 degrees, respectively. In standard direct shear tests, a friction angle was determined for multiple points (e.g., 4). This gave an average value of 35 degrees over the stress range studied and an additional cohesion of 8 kPa, as shown in Figure 10b. In the case of low stress levels, as presented in Figure 10a, the peak internal friction angle was higher and the cohesion was lower, which confirms the nonlinear relationship between soil shear strength and normal stress. This observation is further supported by the red curve, which illustrates the variation in the peak internal friction angle.
Figure 11 presents the approach related to the critical internal friction angle, revealing a similar trend, albeit with lower values. The cohesion obtained with this approach is due to the use of the linear Coulomb–Mohr function for the nonlinear analysis of the peak shear strength envelope with respect to normal stress. Consequently, the cohesion obtained in this way was the result of a mathematical approximation and not a physical soil parameter.
In soil shear tests, it was observed that when approximating the results in the low stress range ( 5 ÷ 20 kPa), the friction angle was higher than when approximating the shear results of the same soil (Figure 10a and Figure 11a) in the higher stress range ( 50 ÷ 300 kPa) (Figure 10b and Figure 11b).
The use of geotechnical parameters determined under specific stress conditions within a linear strength model may result in an overestimation of shear strength at both low and high stress levels. Due to the nonlinear relationship between shear strength and normal stress, it is advisable to employ nonlinear strength models in geotechnical analyses that encompass a wide range of stress conditions.

4. Conclusions

Soil shear strength, the most important soil property in geotechnical engineering calculations, was investigated by a direct shear testing of a cohesionless soil sample. The research presented in this paper did not investigate the influence of roughness, soil grain roundness, grain size distribution, and water content as these were constant values in each study.
The main components analysed by the laboratory tests were the influence of initial porosity index and state of stress on the values of peak and critical internal friction of soil.
The following major conclusions were drawn based on the investigated sample:
  • Considering the soil friction angle, it is important to specify whether it is the peak or critical soil friction angle because they apply to different deformation ranges and, in many cases, especially in dilative soils, they differ considerably.
  • The peak soil friction angle increased with decreasing initial soil porosity index.
  • The critical soil friction angle was independent of the initial porosity index.
  • Both the peak and the critical soil friction angle depended on the stress state. The lower the stress, the larger the soil friction angle. This might have been due to the lower energy required to induce shear deformation of the specimen, which was also indicated by the decreasing critical porosity index with increasing stress. At high stresses, grain breakage became more important, which also resulted in a reduction in the strength described by the internal friction angle.
The analysis and conclusions were drawn based on a studied sample of cohesionless soil and could not be directly applied to describe the behaviour of all soils, including cohesive soils. Additional experiments should be carried out on sand with different grain size distribution, roughness, and roundness to draw more general conclusions.

Author Contributions

Conceptualization, K.Ż. and R.B.; methodology, K.Ż. and R.B.; validation, K.Ż. and R.B.; formal analysis, K.Ż. and R.B.; investigation, K.Ż. and R.B.; resources, K.Ż.; data curation, K.Ż.; writing—original draft preparation, K.Ż. and R.B.; writing—review and editing, K.Ż. and R.B.; visualization, K.Ż. and R.B.; project administration, R.B. All authors have read and agreed to the published version of the manuscript.

Funding

This research received no external funding.

Institutional Review Board Statement

Not applicable.

Informed Consent Statement

Not applicable.

Data Availability Statement

Data are contained within the article. The raw data supporting the conclusions of this article will be made available by the authors on request.

Conflicts of Interest

The authors declare no conflicts of interest.

Appendix A

Figure A1. Shear stress τ and u y vs. u x for (a) ln-1-A , σ = 4.87 kPa and (b) ln-1-B, σ = 9.81 kPa.
Applsci 15 05902 g0a1
Figure A2. Shear stress τ and u y vs. u x for (a) ln-1-C, σ = 14.75 kPa and (b) zg-1-A, σ = 4.87 kPa.
Applsci 15 05902 g0a2
Figure A3. Shear stress τ and u y vs. u x for (a) zg-1-B, σ = 9.81 kPa and (b) zg-1-C, σ = 14.75 kPa.
Applsci 15 05902 g0a3
Figure A4. Shear stress τ and u y vs. u x for (a) szg-1-A, σ = 4.87 kPa and (b) szg-1-B, σ = 9.81 kPa.
Applsci 15 05902 g0a4
Figure A5. Shear stress τ and u y vs. u x for (a) szg-1-C, σ = 14.75 kPa and (b) szg-2-A, σ = 4.87 kPa.
Applsci 15 05902 g0a5
Figure A6. Shear stress τ and u y vs. u x for (a) szg-2-B, σ = 9.81 kPa and (b) szg-2-C, σ = 14.75 kPa.
Applsci 15 05902 g0a6
Figure A7. Shear stress τ and u y vs. u x for (a) ln-2-A, σ = 4.87 kPa and (b) ln-2-B, σ = 9.81 kPa.
Applsci 15 05902 g0a7
Figure A8. Shear stress τ and u y vs. u x for (a) ln-2-C, σ = 14.75 kPa and (b) ln-3-A, σ = 50 kPa.
Applsci 15 05902 g0a8
Figure A9. Shear stress τ and u y vs. u x for (a) ln-3-B, σ = 100 kPa and (b) ln-3-C, σ = 200 kPa.
Applsci 15 05902 g0a9
Figure A10. Shear stress τ and u y vs. u x for (a) zg-2-A, σ = 50 kPa and (b) zg-2-B, σ = 100 kPa.
Applsci 15 05902 g0a10
Figure A11. Shear stress τ and u y vs. u x for zg-2-C, σ = 200 kPa.
Applsci 15 05902 g0a11

References

  1. Stefanow, D.; Dudziński, P.A. Soil shear strength determination methods – State of the art. Soil Tillage Res. 2021, 208, 104881. [Google Scholar] [CrossRef]
  2. Castellanos, B.A.; Brandon, T.L. A comparison between the shear strength measured with direct shear and triaxial devices on undisturbed and remolded soils. In Proceedings of the 18th International Conference on Soil Mechanics and Geotechnical Engineering: Challenges and Innovations in Geotechnics, ICSMGE 2013, Paris, France, 2–6 September 2013; Volume 1, pp. 317–320. [Google Scholar]
  3. Szypcio, Z. Relation between the Friction Angle of Sand at Triaxial Compression and Triaxial Extension and Plane Strain Conditions. Geosciences 2020, 10, 29. [Google Scholar] [CrossRef]
  4. Dołżyk-Szypcio, K. Direct Shear Test for Coarse Granular Soil. Int. J. Civil Eng. 2019, 17, 1871–1878. [Google Scholar] [CrossRef]
  5. Chakraborty, T.; Salgado, R. Dilatancy and shear strength behavior of sand at low confining pressures. In Proceedings of the 17th International Conference on Soil Mechanics and Geotechnical Engineering: The Academia and Practice of Geotechnical Engineering; IOS Press: Amsterdam, The Netherlands, 2009; Volume 1, pp. 652–655. [Google Scholar] [CrossRef]
  6. Yang, J.; Luo, X.D. Exploring the relationship between critical state and particle shape for granular materials. J. Mech. Phys. Solids 2015, 84, 196–213. [Google Scholar] [CrossRef]
  7. Wood, D.M. Soil Behaviour and Critical State Soil Mechanics; Cambidge University Press: New York, NY, USA, 1992. [Google Scholar] [CrossRef]
  8. Truyen, P.N.; Thinh, P.N.D.; Hung, H.T.; Phong, L.T.; Nhat, V.D. Evaluation of the Shear Strength and Dilatancy Behavior of Sand-Clay Mixtures Under Direct Shear Tests. In Proceedings of the 7th International Conference on Geotechnics, Civil Engineering and Structures, CIGOS 2024, Ho Chi Minh City, Vietnam, 4–5 April 2024; pp. 823–832. [Google Scholar] [CrossRef]
  9. Been, K.; Jefferies, M. Stress-dilatancy in very loose sand. Can. Geotech. J. 2004, 41, 972–989. [Google Scholar] [CrossRef]
  10. Sawicki, A.; Świdziński, W. Drained against undrained behaviour of sand. Arch. Hydroengineering Environ. Mech. 2007, 54, 207–222. [Google Scholar]
  11. Dołżyk-Szypcio, K. Naturalny Parametr Stanu. Grunty Niesposite; Oficyna Wydawnicza Politechniki Białostockiej: Białystok, Poland, 2021. [Google Scholar] [CrossRef]
  12. Been, K.; Hachey, J.; Jefferies, M.G. The critical state of sands. Geotechnique 1991, 41, 365–381. [Google Scholar] [CrossRef]
  13. Bolton, M.D. The strength and dilatancy of sands. Geotechnique 1986, 36, 65–78. [Google Scholar] [CrossRef]
  14. Simoni, A.; Houlsby, G.T. The direct shear strength and dilatancy of sand-gravel mixtures. Geotech. Geol. Eng. 2006, 24, 523–549. [Google Scholar] [CrossRef]
  15. Bouri, D.; Krim, A.; Brahim, A.; Arab, A. Shear strength of compacted Chlef sand: Effect of water content, fines content and others parameters. Stud. Geotech. Mech. 2019, 42, 18–35. [Google Scholar] [CrossRef]
  16. Rasti, A.; Adarmanabadi, H.R.; Pineda, M.; Reinikainen, J. Evaluating the Effect of Soil Particle Characterization on Internal Friction Angle. Am. J. Eng. Appl. Sci. 2021, 14, 129–138. [Google Scholar] [CrossRef]
  17. Yang, J.; Luo, X.D. The critical state friction angle of granular materials: Does it depend on grading? Acta Geotech. 2018, 13, 535–547. [Google Scholar] [CrossRef]
  18. Stacho, J.; Sulovska, M. Shear Strength Properties of Coarse-Grained Soils Determined Using Large-Size Direct Shear Test. Civ. Environ. Eng. 2022, 18, 244–257. [Google Scholar] [CrossRef]
  19. Żarkiewicz, K.; Qatrameez, W. Assessment of Stress in the Soil Surrounding the Axially Loaded Model Pile by Thin, Flexible Sensors. Sensors 2021, 21, 7214. [Google Scholar] [CrossRef]
  20. Zhu, Q.Z.; Shao, J.F.; Mainguy, M. A micromechanics-based elastoplastic damage model for granular materials at low confining pressure. Int. J. Plast. 2010, 26, 586–602. [Google Scholar] [CrossRef]
  21. Carlos Santamarina, J.; Park, J.; Terzariol, M.; Cardona, A.; Castro, G.M.; Cha, W.; Garcia, A.; Hakiki, F.; Lyu, C.; Salva, M.; et al. Soil Properties: Physics Inspired, Data Driven; Number May; Springer International Publishing: Cham, Switzerland, 2019; pp. 67–91. [Google Scholar] [CrossRef]
  22. Zhao, L.; Yang, F.; Zhang, Y.; Dan, H.; Liu, W. Effects of shear strength reduction strategies on safety factor of homogeneous slope based on a general nonlinear failure criterion. Comput. Geotech. 2015, 63, 215–228. [Google Scholar] [CrossRef]
  23. Siahkouhi, M.; Pletzer, C.; Marcher, T.; Schneider-Muntau, B. Investigation on shear strength parameters of soil and soft rock material in the low stress range. Int. J. Geotech. Eng. 2024, 18, 66–74. [Google Scholar] [CrossRef]
  24. Al Tarhouni, M.A.; Hawlader, B. Monotonic and cyclic behaviour of sand in direct simple shear test conditions considering low stresses. Soil Dyn. Earthq. Eng. 2021, 150, 106931. [Google Scholar] [CrossRef]
  25. Tim, H. The Effects of Suppression of Dilation on the Shear Strength of Sands Tim House a Thesis Submitted To the Faculty of Graduate Studies in Partial Fulfillment of the Requirements for the Degree of Master of Science Graduate Program in Civil Engineering Toro. Ph.D. Thesis, York University, Toronto, ON, Canada, 2019. [Google Scholar]
  26. Rousé, P.C. Relation between the critical state friction angle of sands and low vertical stresses in the direct shear test. Soils Found. 2018, 58, 1282–1287. [Google Scholar] [CrossRef]
  27. Rad, M.M.; Ibrahim, S.K. Optimal plastic analysis and design of pile foundations under reliable conditions. Period. Polytech. Civ. Eng. 2021, 65, 761–767. [Google Scholar] [CrossRef]
  28. Benmebarek, M.A.; Benmebarek, S.; Rad, M.M.; Ray, R. Pile optimization in slope stabilization by 2D and 3D numerical analyses. Int. J. Geotech. Eng. 2022, 16, 211–224. [Google Scholar] [CrossRef]
  29. Sfriso, A.O. The friction angle and critical state void ratio of sands. In Proceedings of the 17th International Conference on Soil Mechanics and Geotechnical Engineering: The Academia and Practice of Geotechnical Engineering; IOS Press: Amsterdam, The Netherlands, 2009; Volume 1, pp. 433–435. [Google Scholar] [CrossRef]
Figure 1. Grain size distribution of soil sample.
Applsci 15 05902 g001
Figure 2. Microscopic images of fractionated sand sample. Zoom 43 × for d 0.2 mm and 162 × for d < 0.2 mm.
Applsci 15 05902 g002
Figure 3. (a) Schematic of the direct shear test setup; (b) photograph of the apparatus.
Applsci 15 05902 g003
Figure 4. Development of shear stress τ and vertical piston displacement u y as a function of horizontal displacement u x of the shear box top, for loose (a) and compacted (b) samples subjected to σ = 9.81 kPa (ln-1-B and szg-2-B).
Applsci 15 05902 g004
Figure 5. Changes in the porosity index and the CLS steady state line (represented by the dashed line) of the tested sand.
Applsci 15 05902 g005
Figure 6. Measured critical friction angle versus calculated critical porosity index.
Applsci 15 05902 g006
Figure 7. The difference between the peak and critical friction angles versus difference between the initial and critical porosity index of the examined sand.
Applsci 15 05902 g007
Figure 8. The difference between the peak and critical friction angles versus dilation angle on the investigated sand.
Applsci 15 05902 g008
Figure 9. Peak and critical friction angles versus normal stress in soil sample and different initial porosity index values.
Applsci 15 05902 g009
Figure 10. Shear strength of soil and friction angle in relation to normal stress in soil sample e 0 = 0.54 . Peak shear strength and friction angle determined (a) under low normal stress conditions and (b) under high normal stress conditions.
Applsci 15 05902 g010
Figure 11. Shear strength of soil and friction angle in relation to normal stress in soil sample e 0 = 0.54 . Critical shear strength and critical friction angle determined (a) under low normal stress conditions and (b) under high normal stress conditions.
Applsci 15 05902 g011
Table 1. Table of measurements of sand samples.
No.nr σ [kPa] e 0 [- ] τ p [kPa] τ cv [kPa] e cv [- ]
1ln-1-A4.870.7085.065.060.629
2ln-1-B9.810.6579.189.180.639
3ln-1-C14.750.67512.0512.050.639
4zg-1-A4.870.47210.446.20.602
5zg-1-B9.810.49416.219.230.54
6zg-1-C14.750.48421.1212.990.553
7szg-1-A4.870.4868.225.620.636
8szg-1-B9.810.52212.699.180.623
9szg-1-C14.750.52418.7311.650.598
10szg-2-A4.870.5528.115.430.614
11szg-2-B9.810.53913.318.520.573
12szg-2-C14.750.54117.7613.930.583
13ln-2-A4.870.6255.485.140.666
14ln-2-B9.810.6428.688.60.635
15ln-2-C14.750.65412.3712.370.623
16ln-3-A500.63736.3736.370.584
17ln-3-B1000.61168.7268.720.579
18ln-3-C2000.601148.47148.470.549
19zg-2-A500.48251.5140.050.536
20zg-2-B1000.478103.4574.150.555
21zg-2-C2000.477189.26134.190.537
Disclaimer/Publisher’s Note: The statements, opinions and data contained in all publications are solely those of the individual author(s) and contributor(s) and not of MDPI and/or the editor(s). MDPI and/or the editor(s) disclaim responsibility for any injury to people or property resulting from any ideas, methods, instructions or products referred to in the content.

