
Study on the Influencing Factors of Grouting Anchorage for Self-Drilling Bolts in Sandy Pebble Strata

Abstract
1. Introduction
2. Experimental Study on Slurry Diffusion
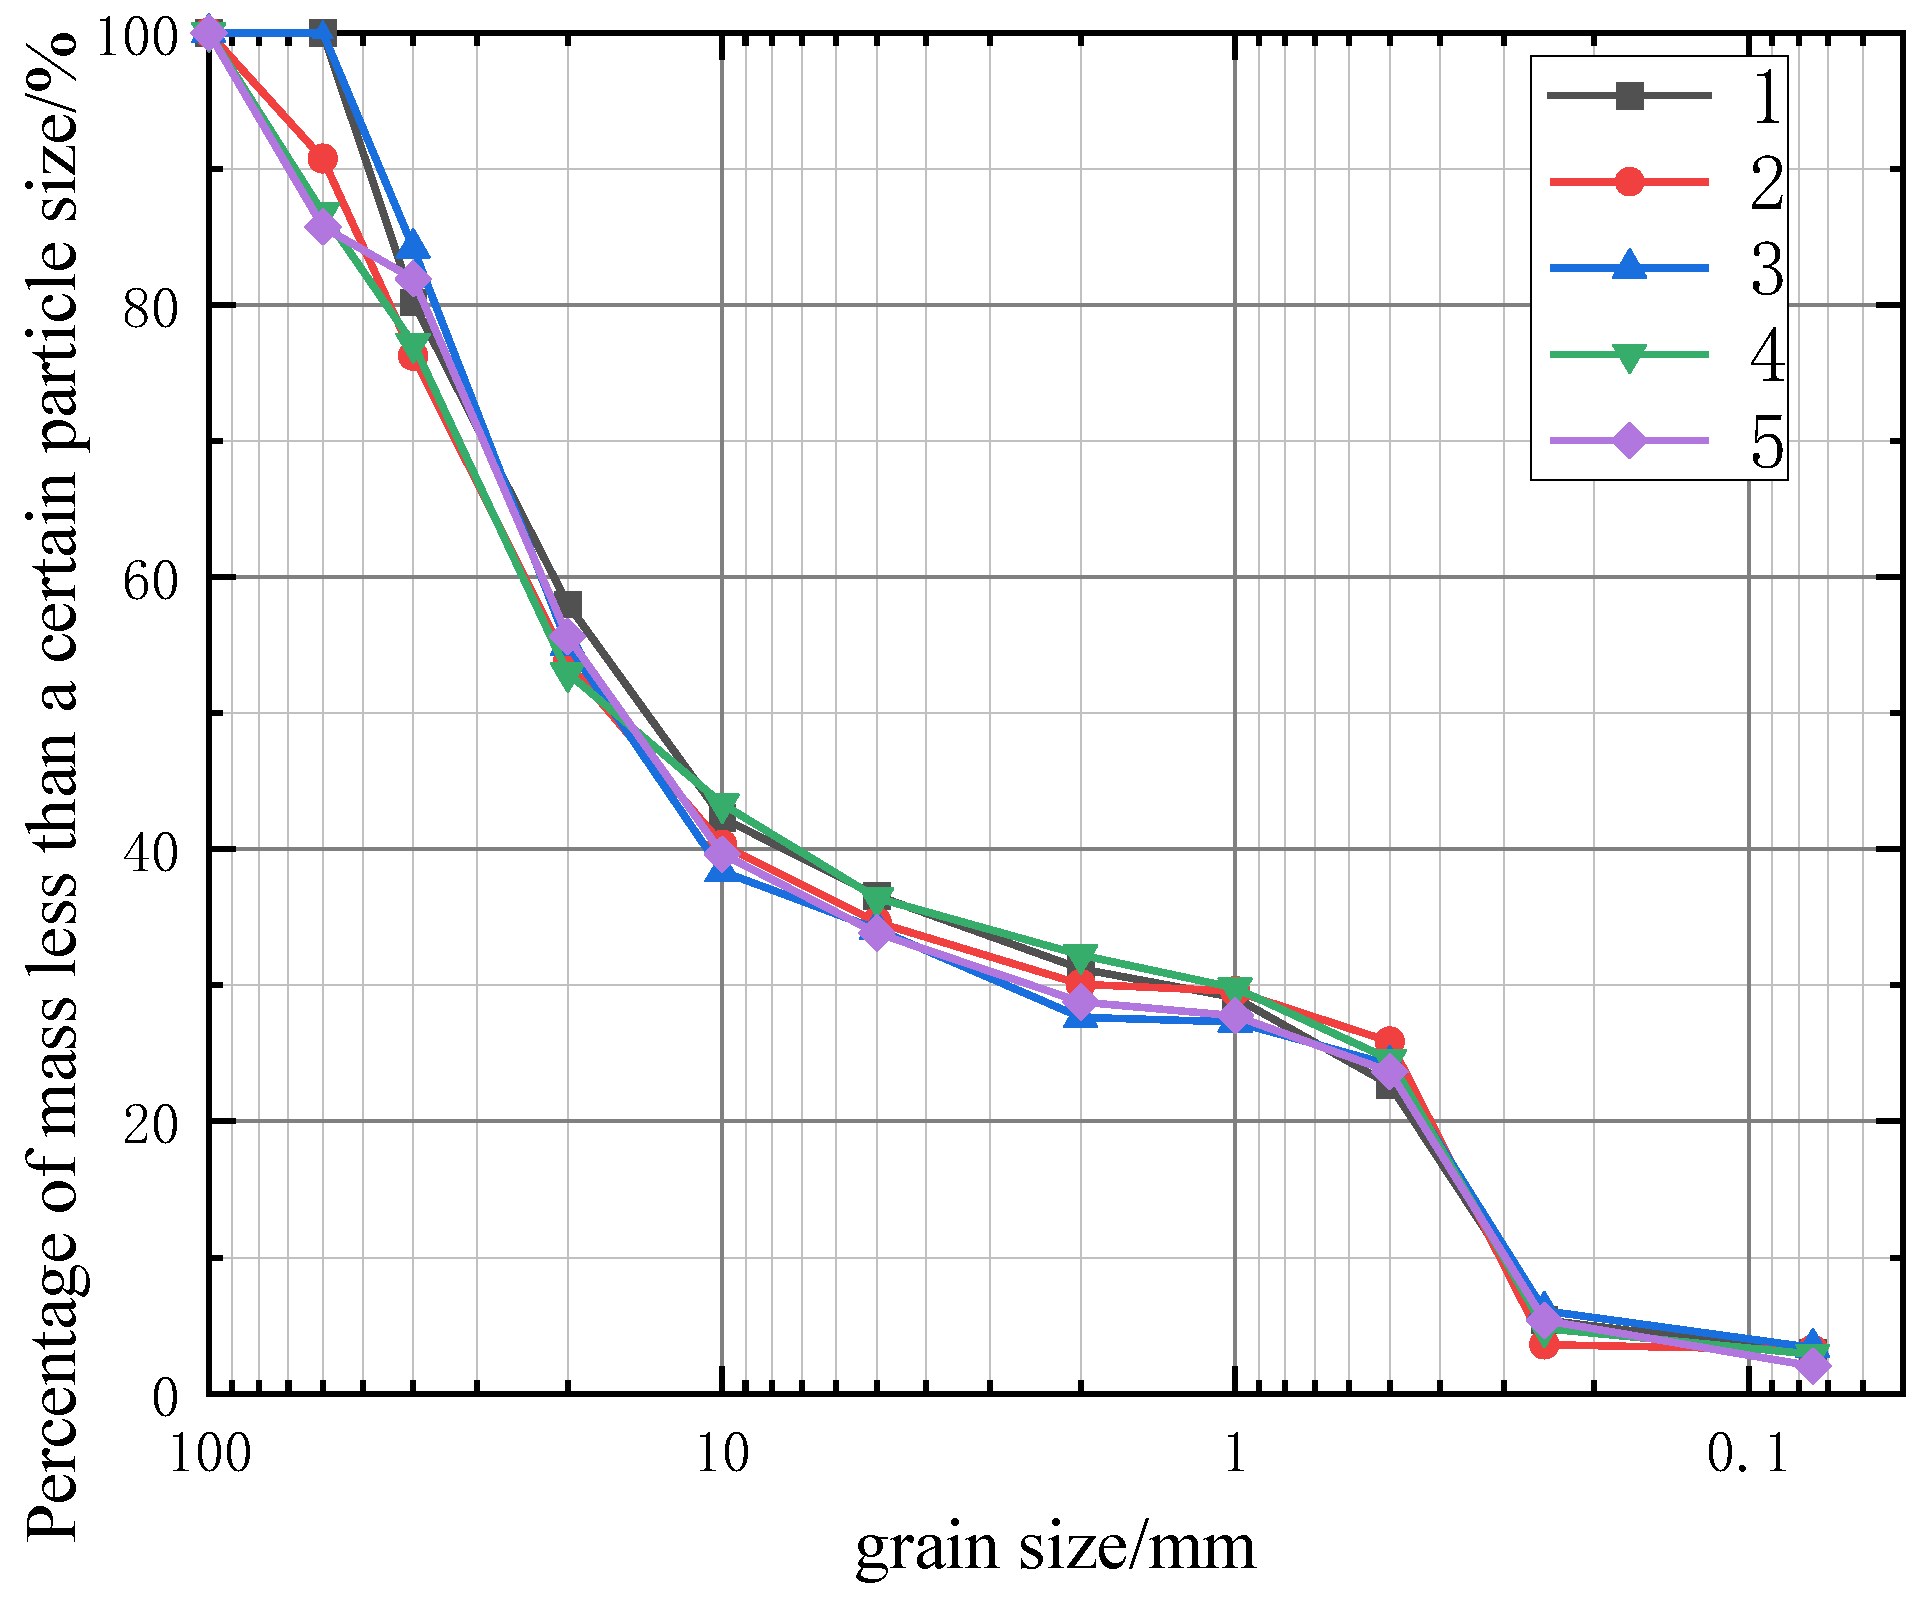
2.1. Testing Material
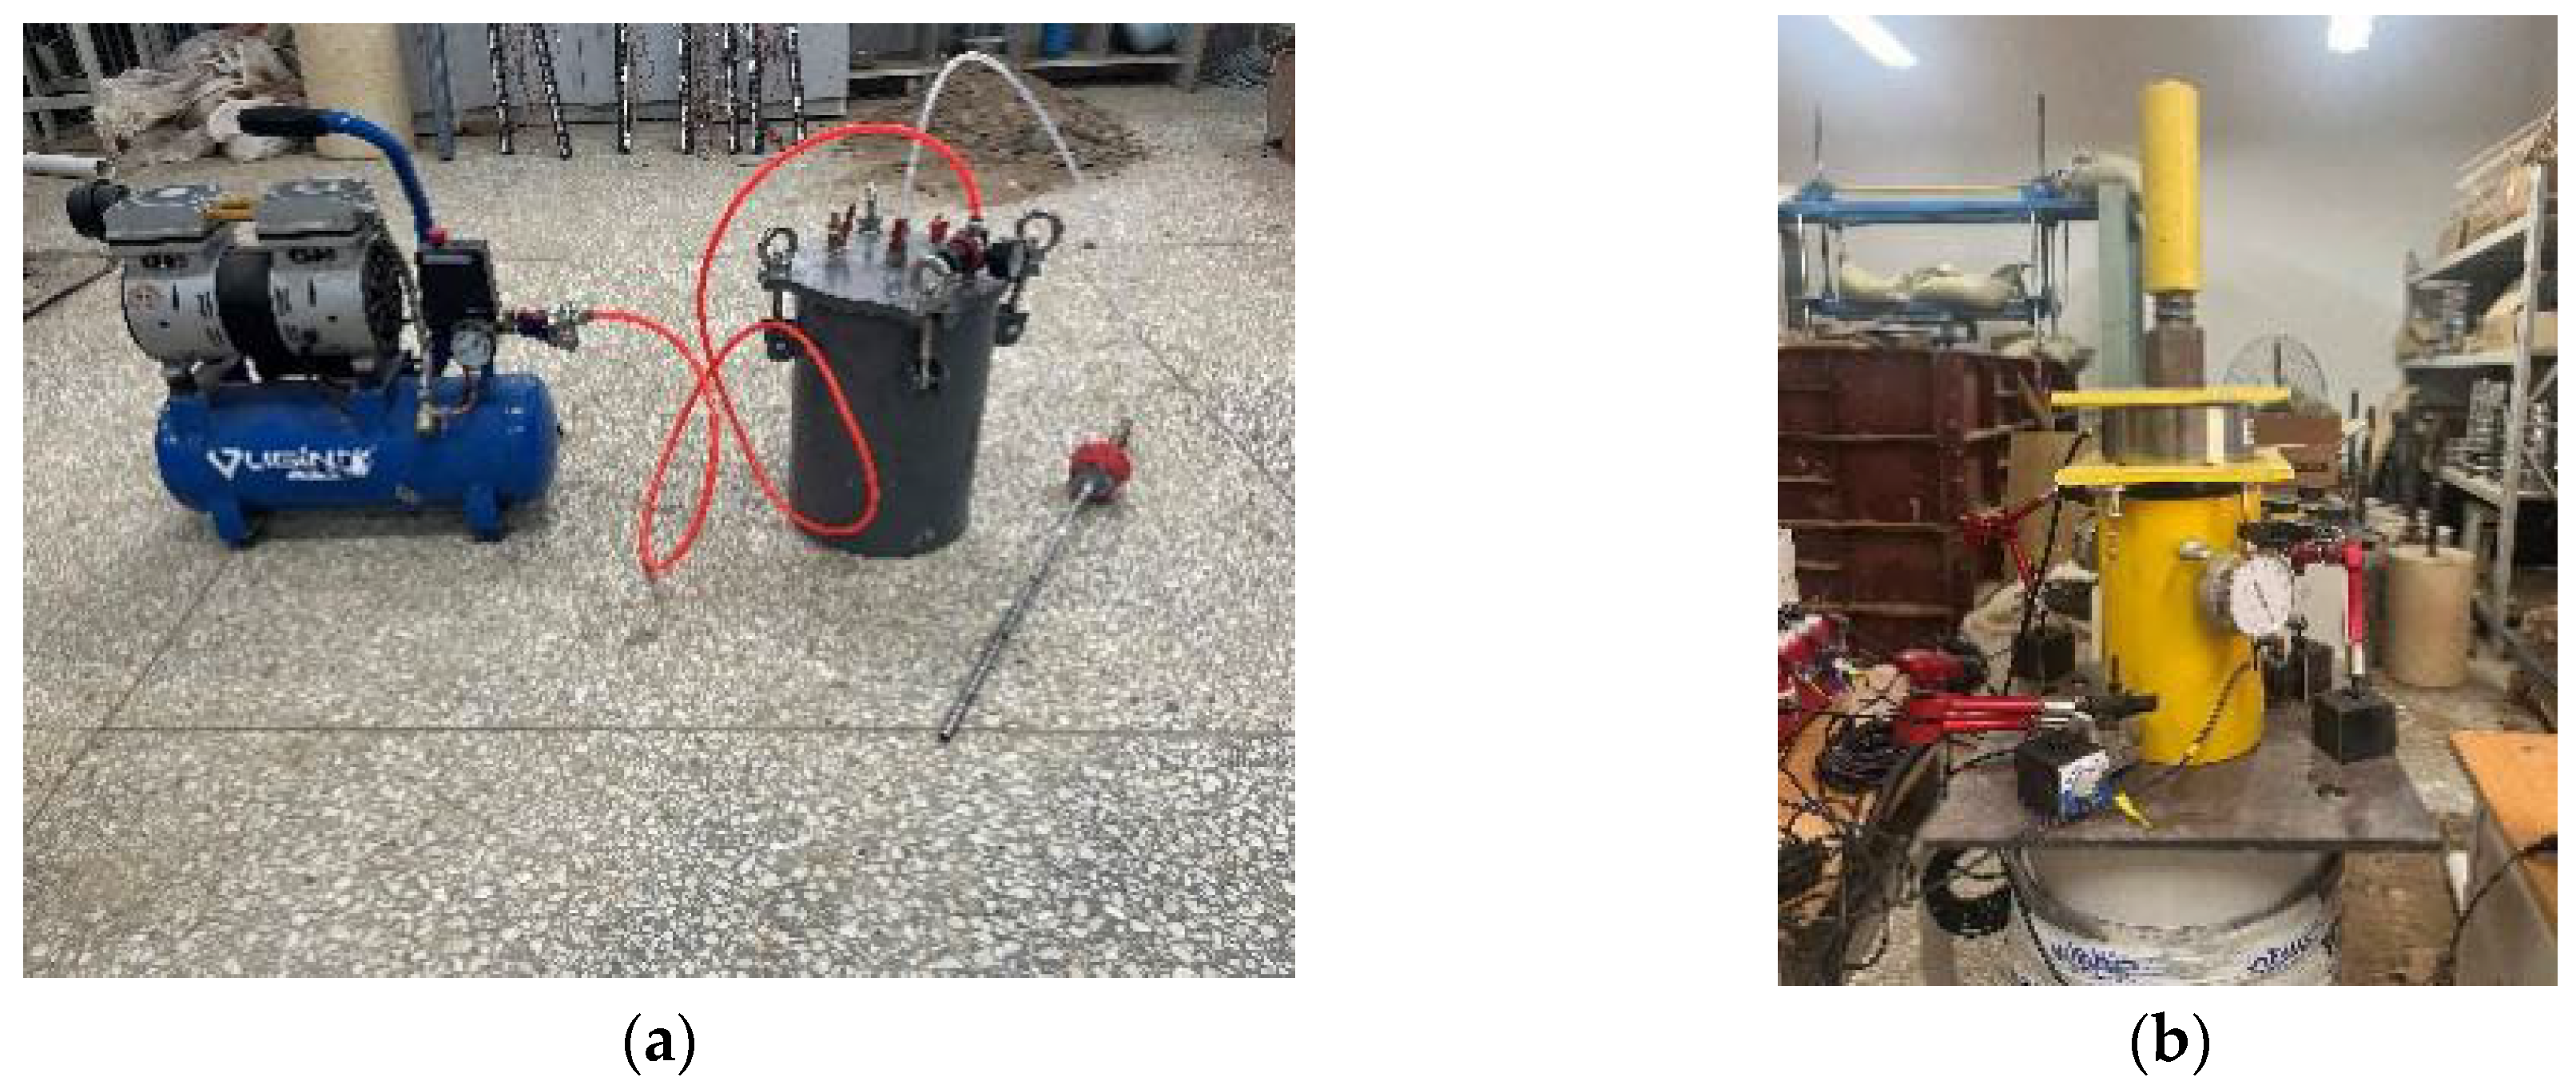
2.2. Testing Equipment
2.3. Specimen Making
2.4. Test Scheme
3. Analysis of Slurry Diffusion Test Results
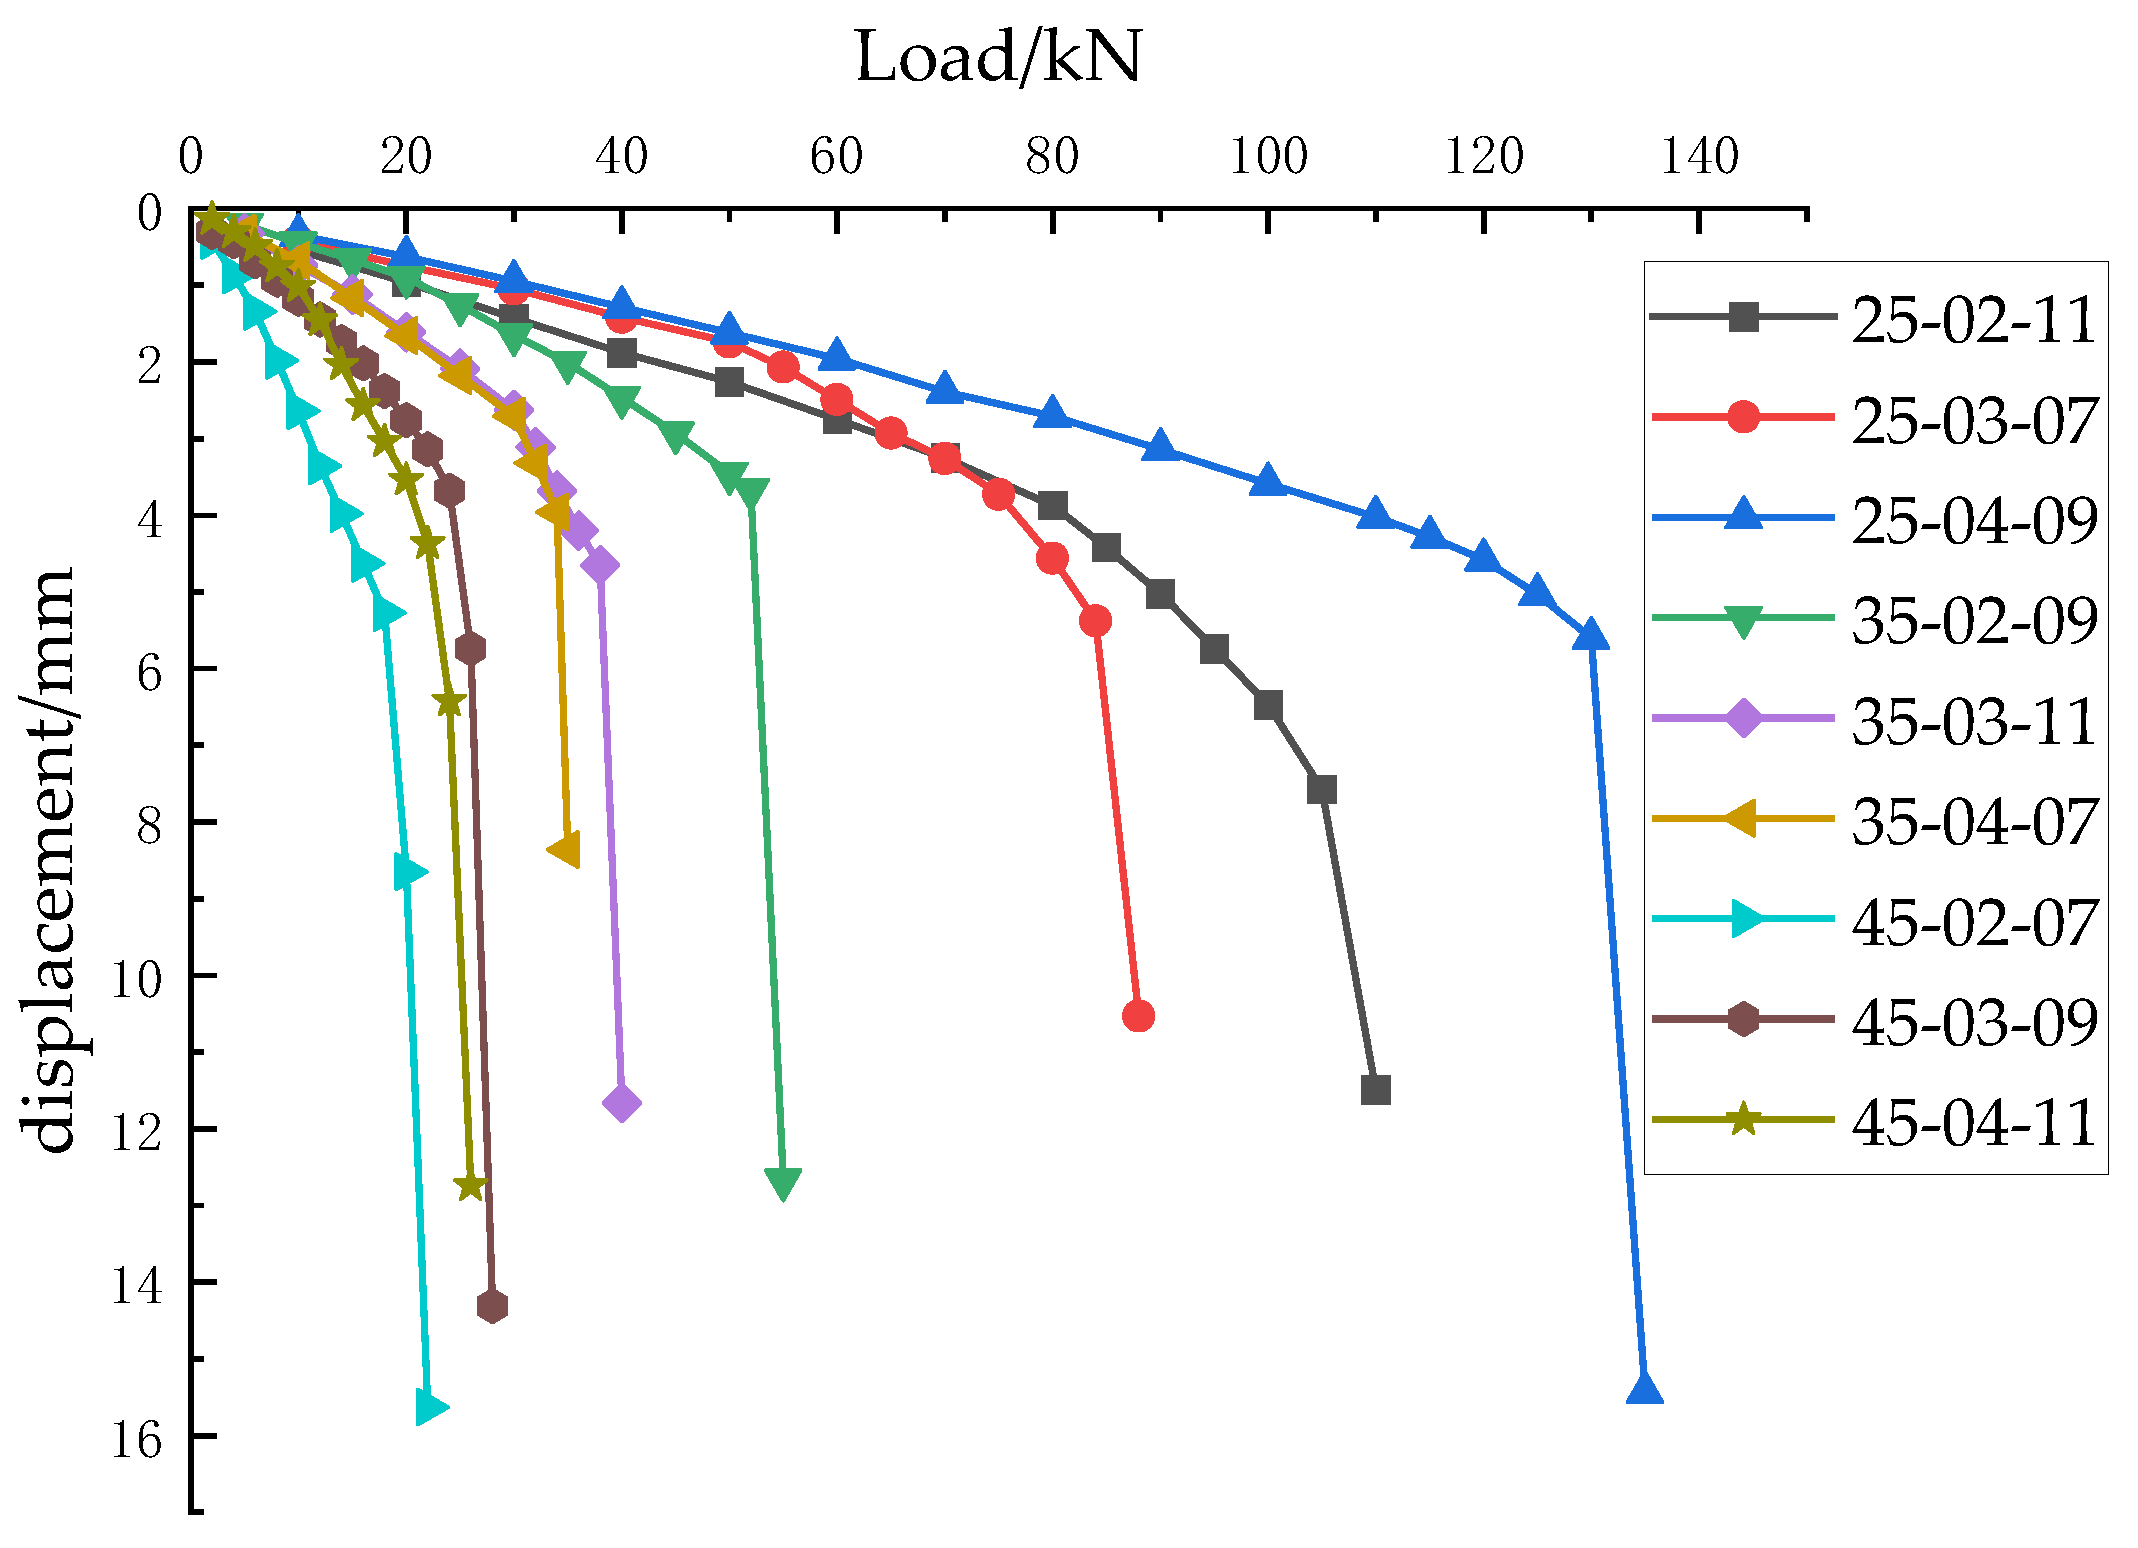
3.1. Test Result Analysis
3.2. Analysis of the Influence Degree of Independent Variables
3.2.1. Extremum Difference Analysis
3.2.2. Analysis of Variance
3.2.3. Variable Sensitivity Analysis
4. Basic Theory of Grouting Simulation
4.1. Flow Equation
4.2. Pressure Equation
4.3. Solution Method
5. Simulation Calculation Model of Grouting
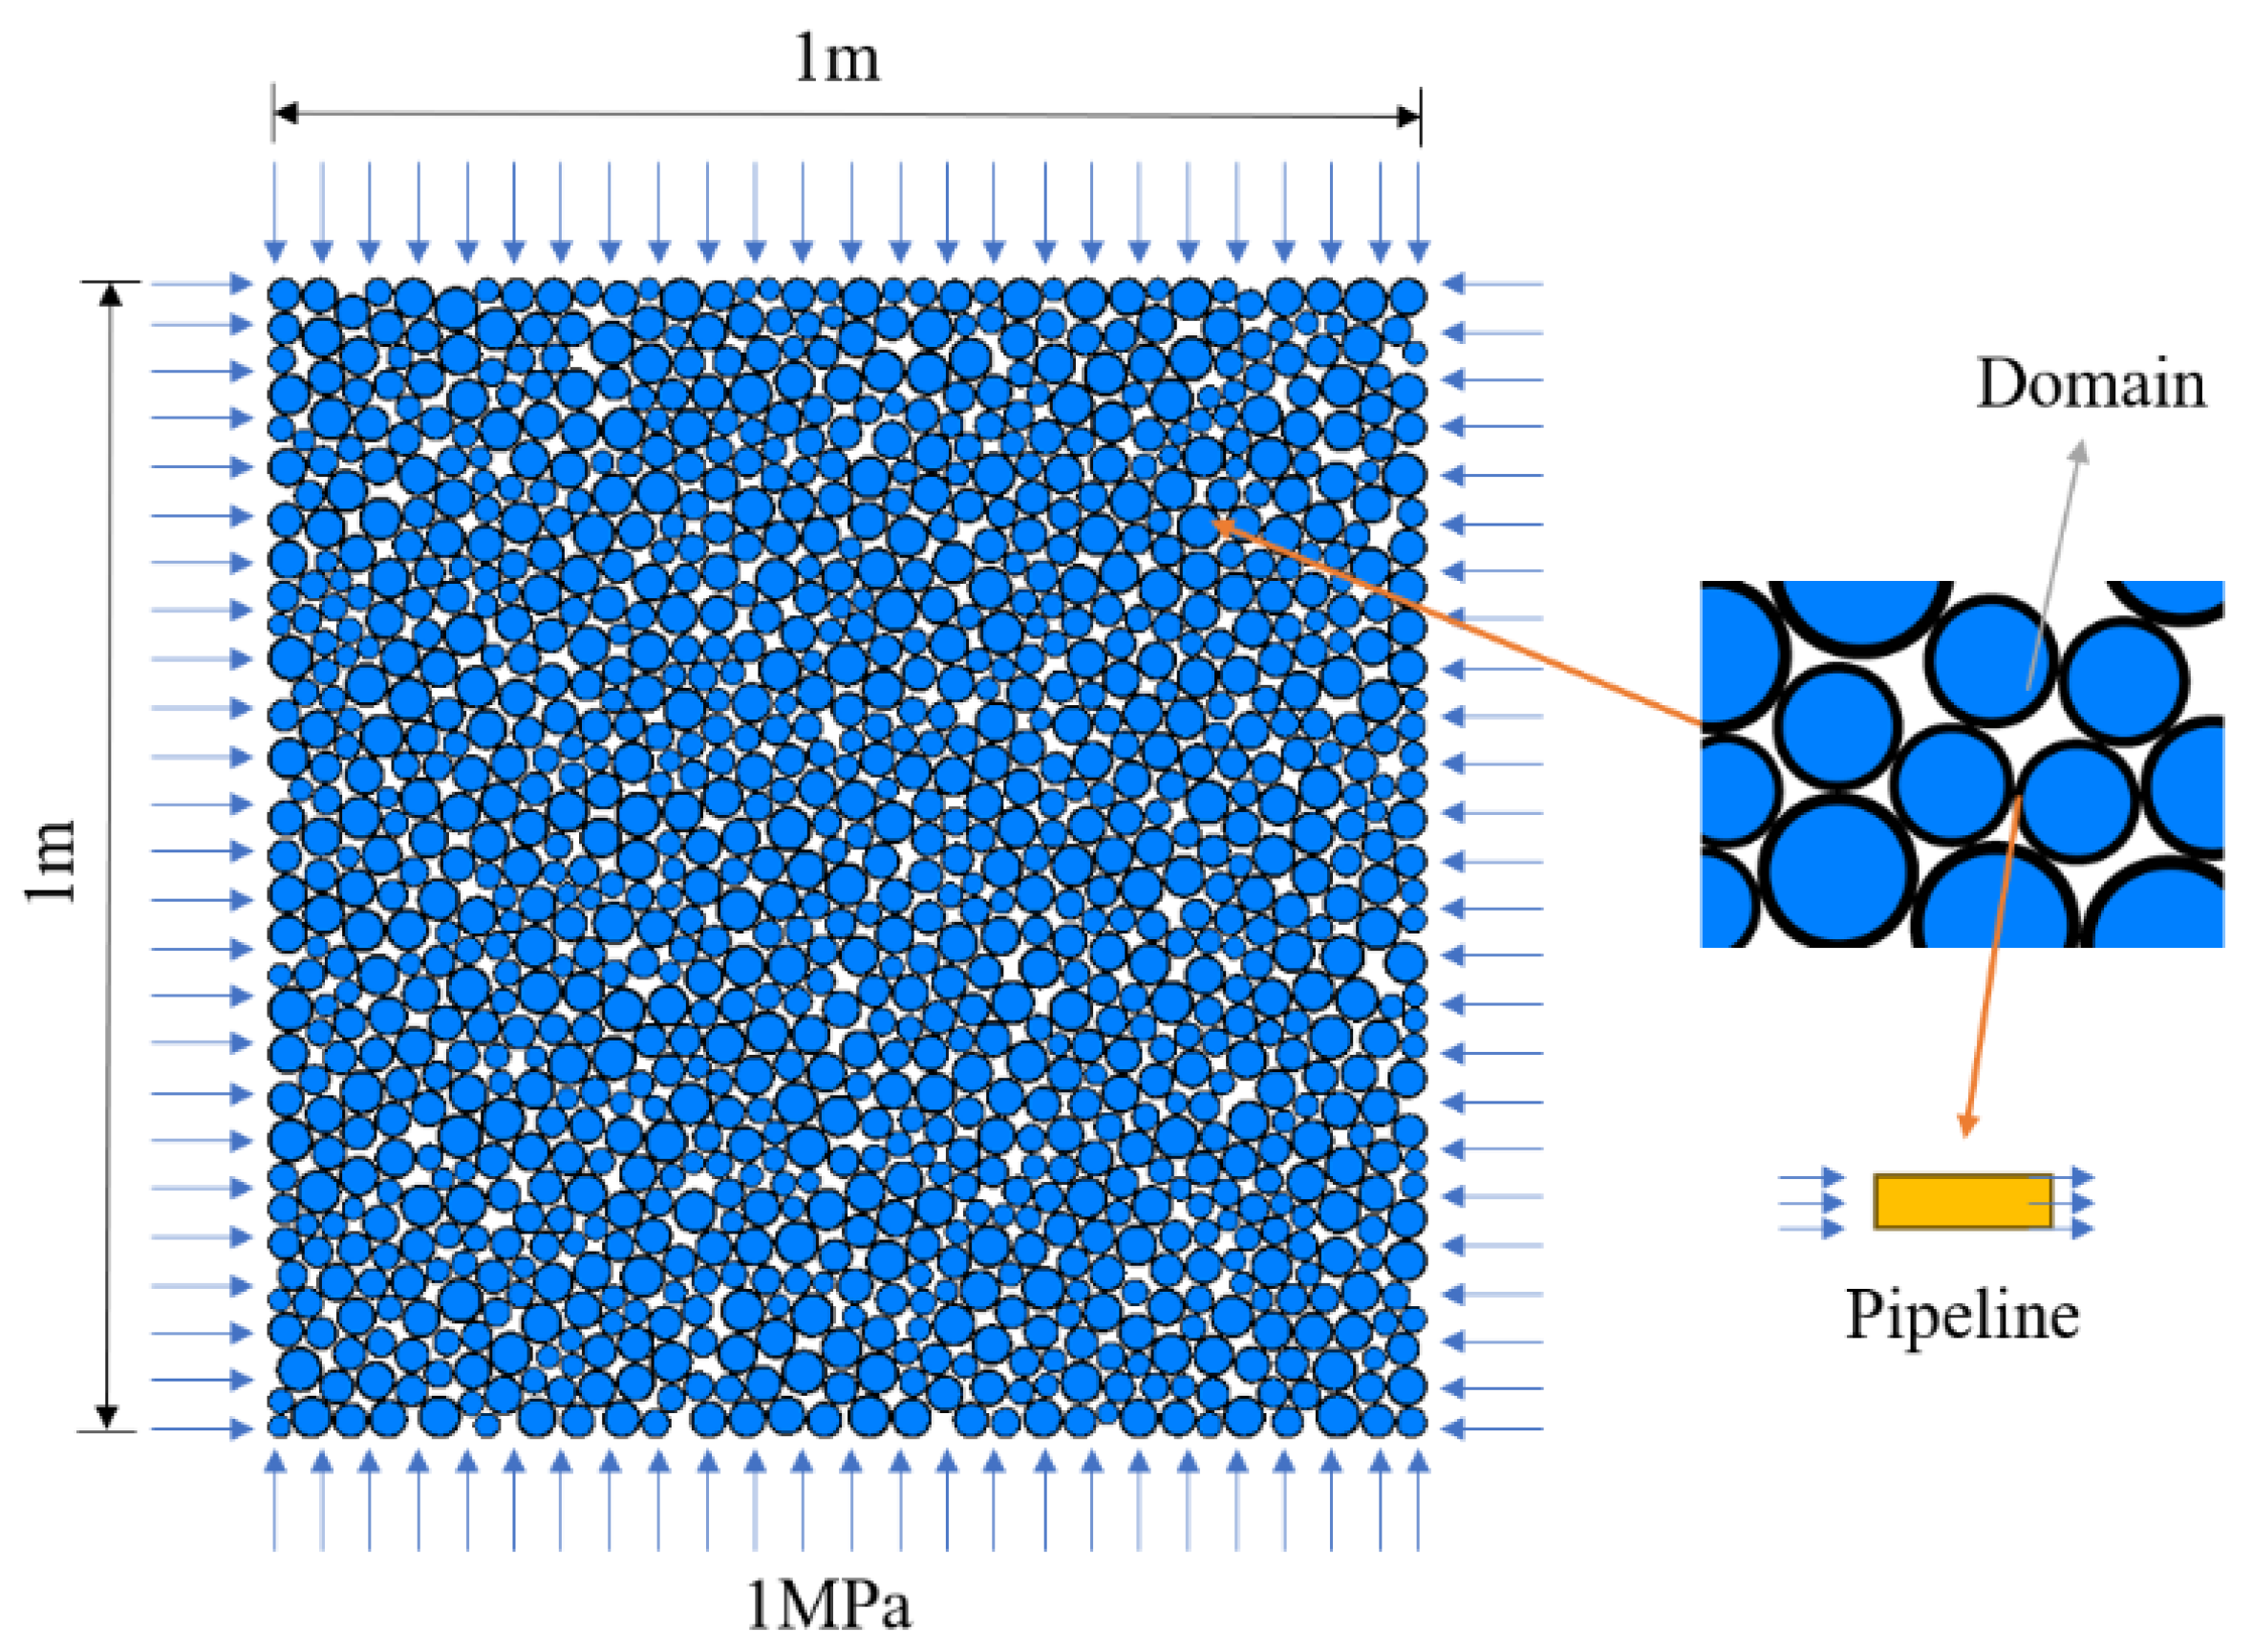
5.1. Modelling
5.2. Particle Parameters
5.3. Analysis of Influencing Factors of Slurry Diffusion Radius
5.4. The Impact of Various Factors on the Slurry Diffusion Radius
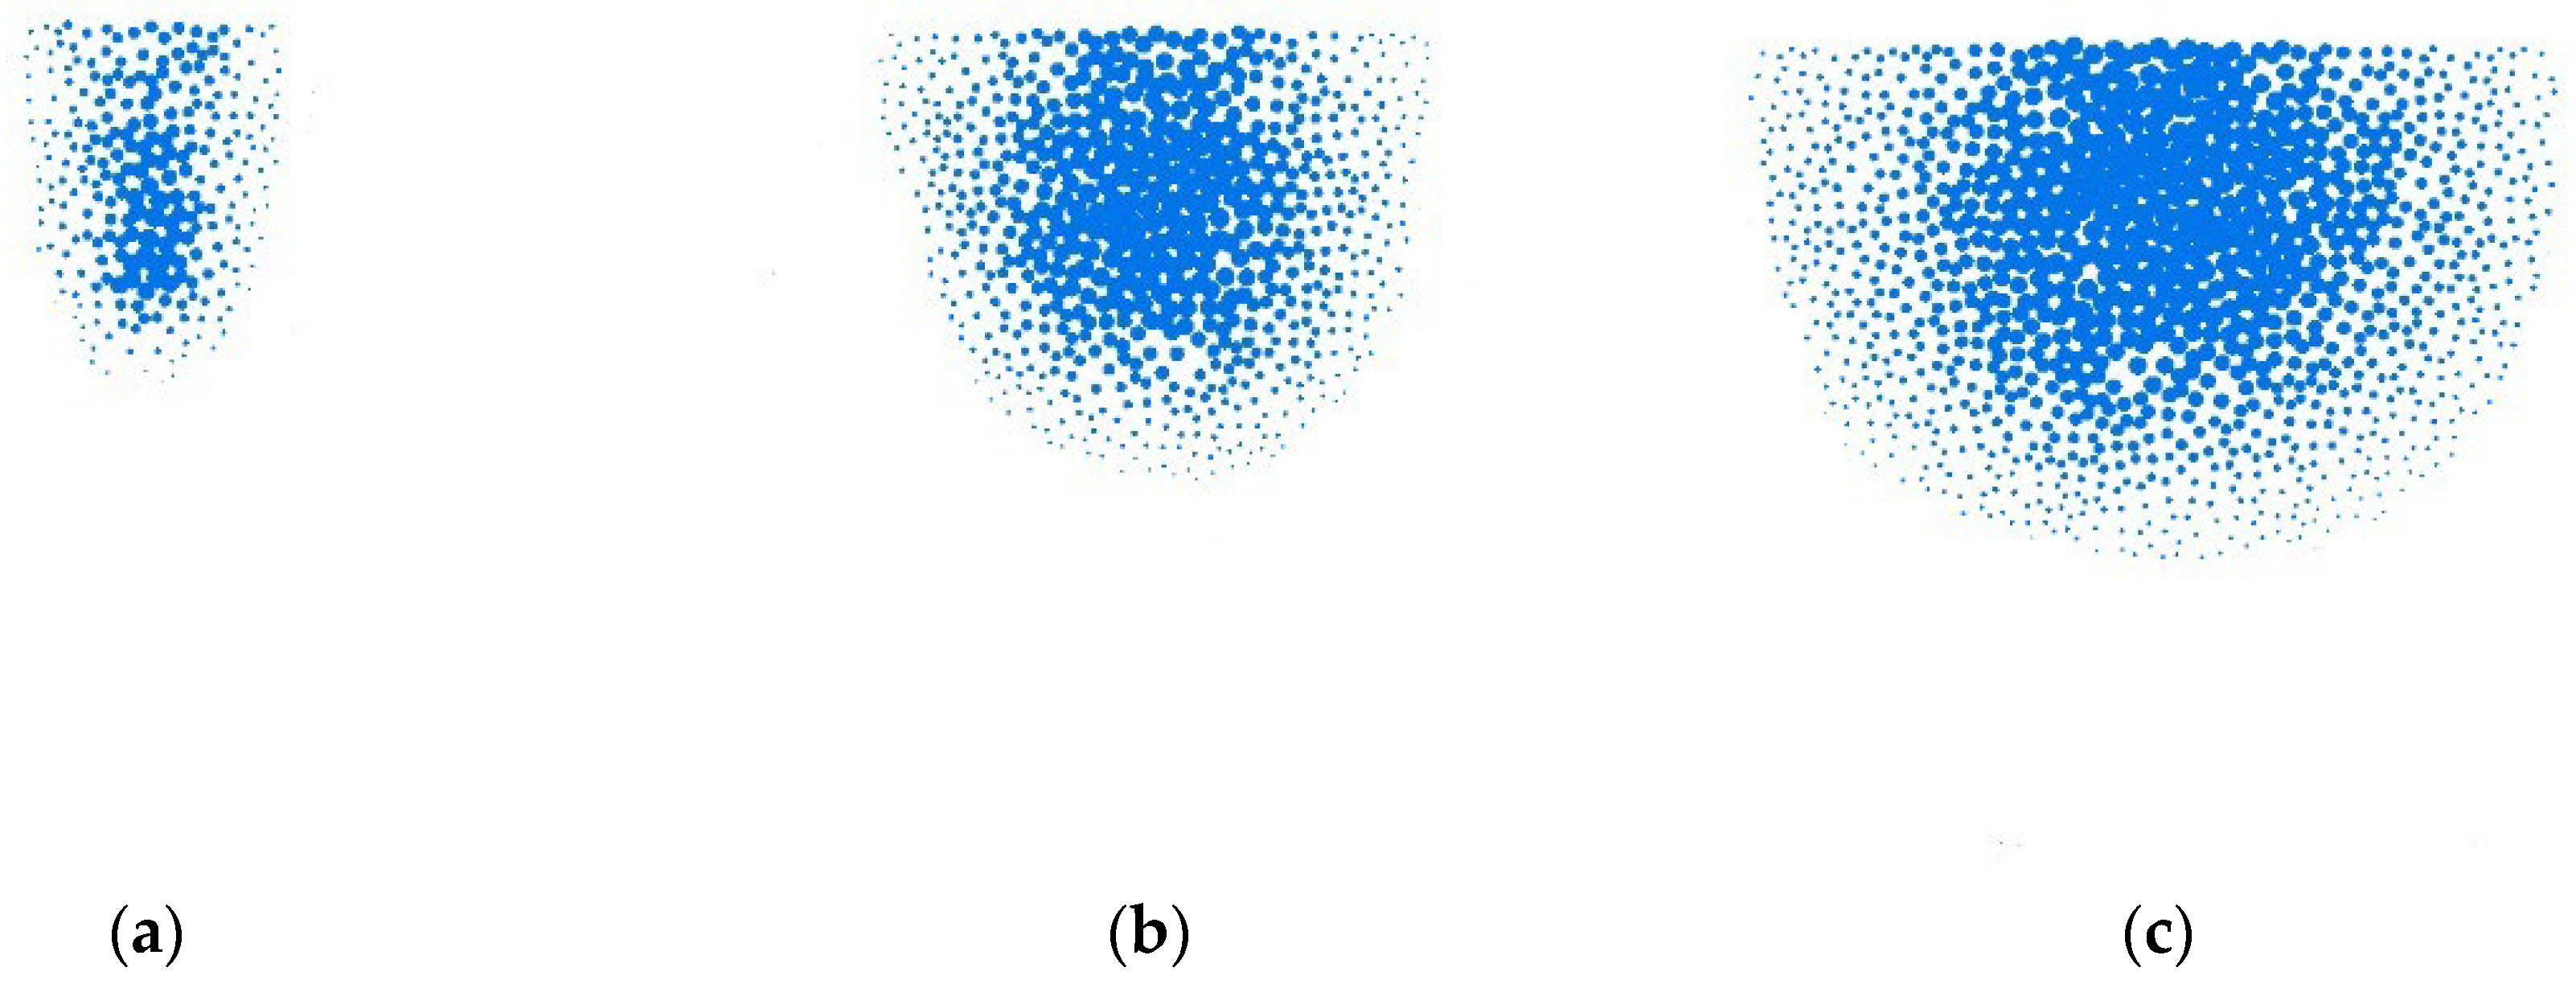
5.4.1. The Influence of Different Grouting Pressure on Slurry Diffusion Radius
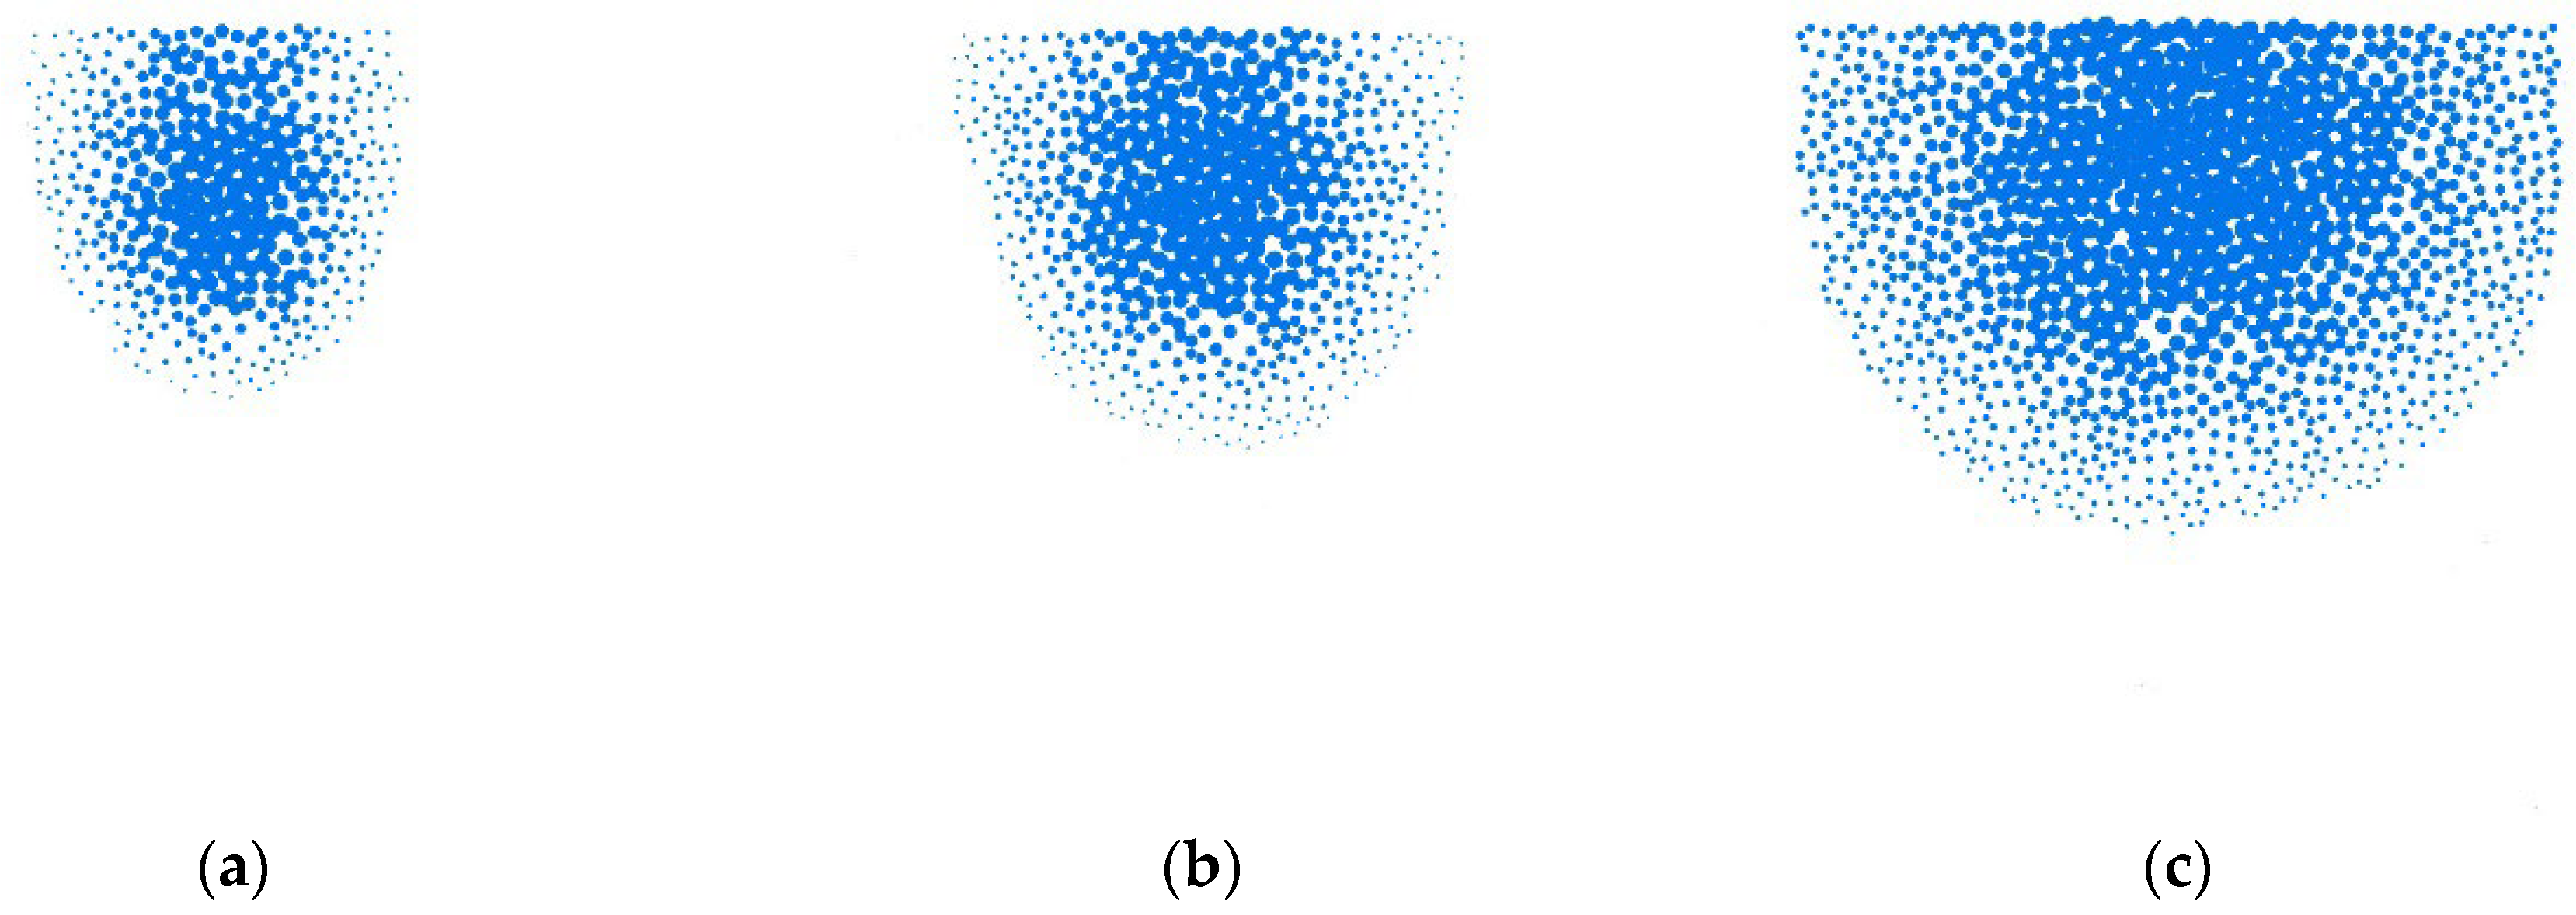
5.4.2. The Influence of Different Drilling Speed on Slurry Diffusion Radius
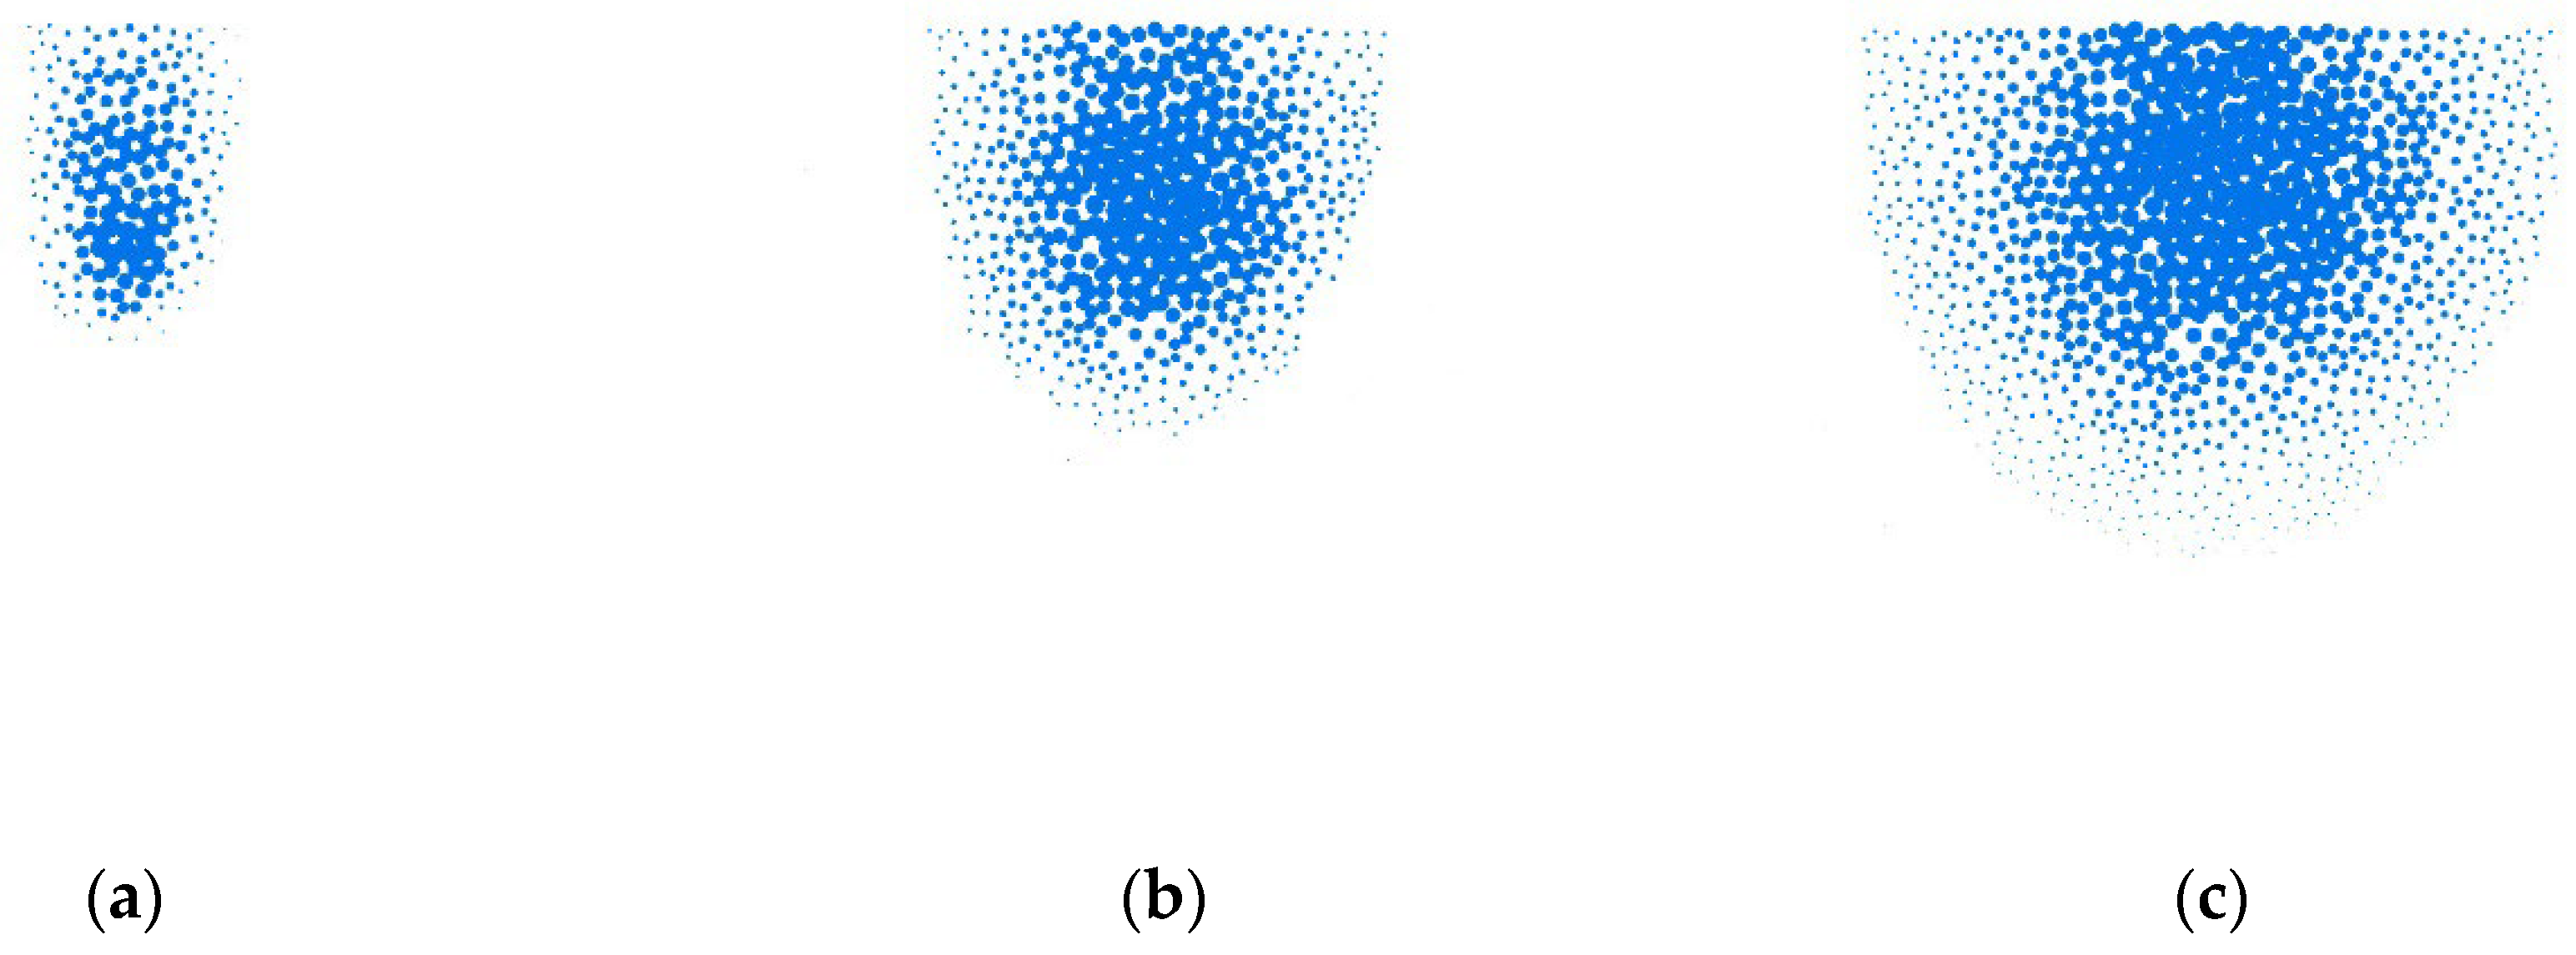
5.4.3. The Influence of Different Slurry Viscosity on Slurry Diffusion Radius
6. Nonlinear Fitting of Indoor Test Results
7. Conclusions
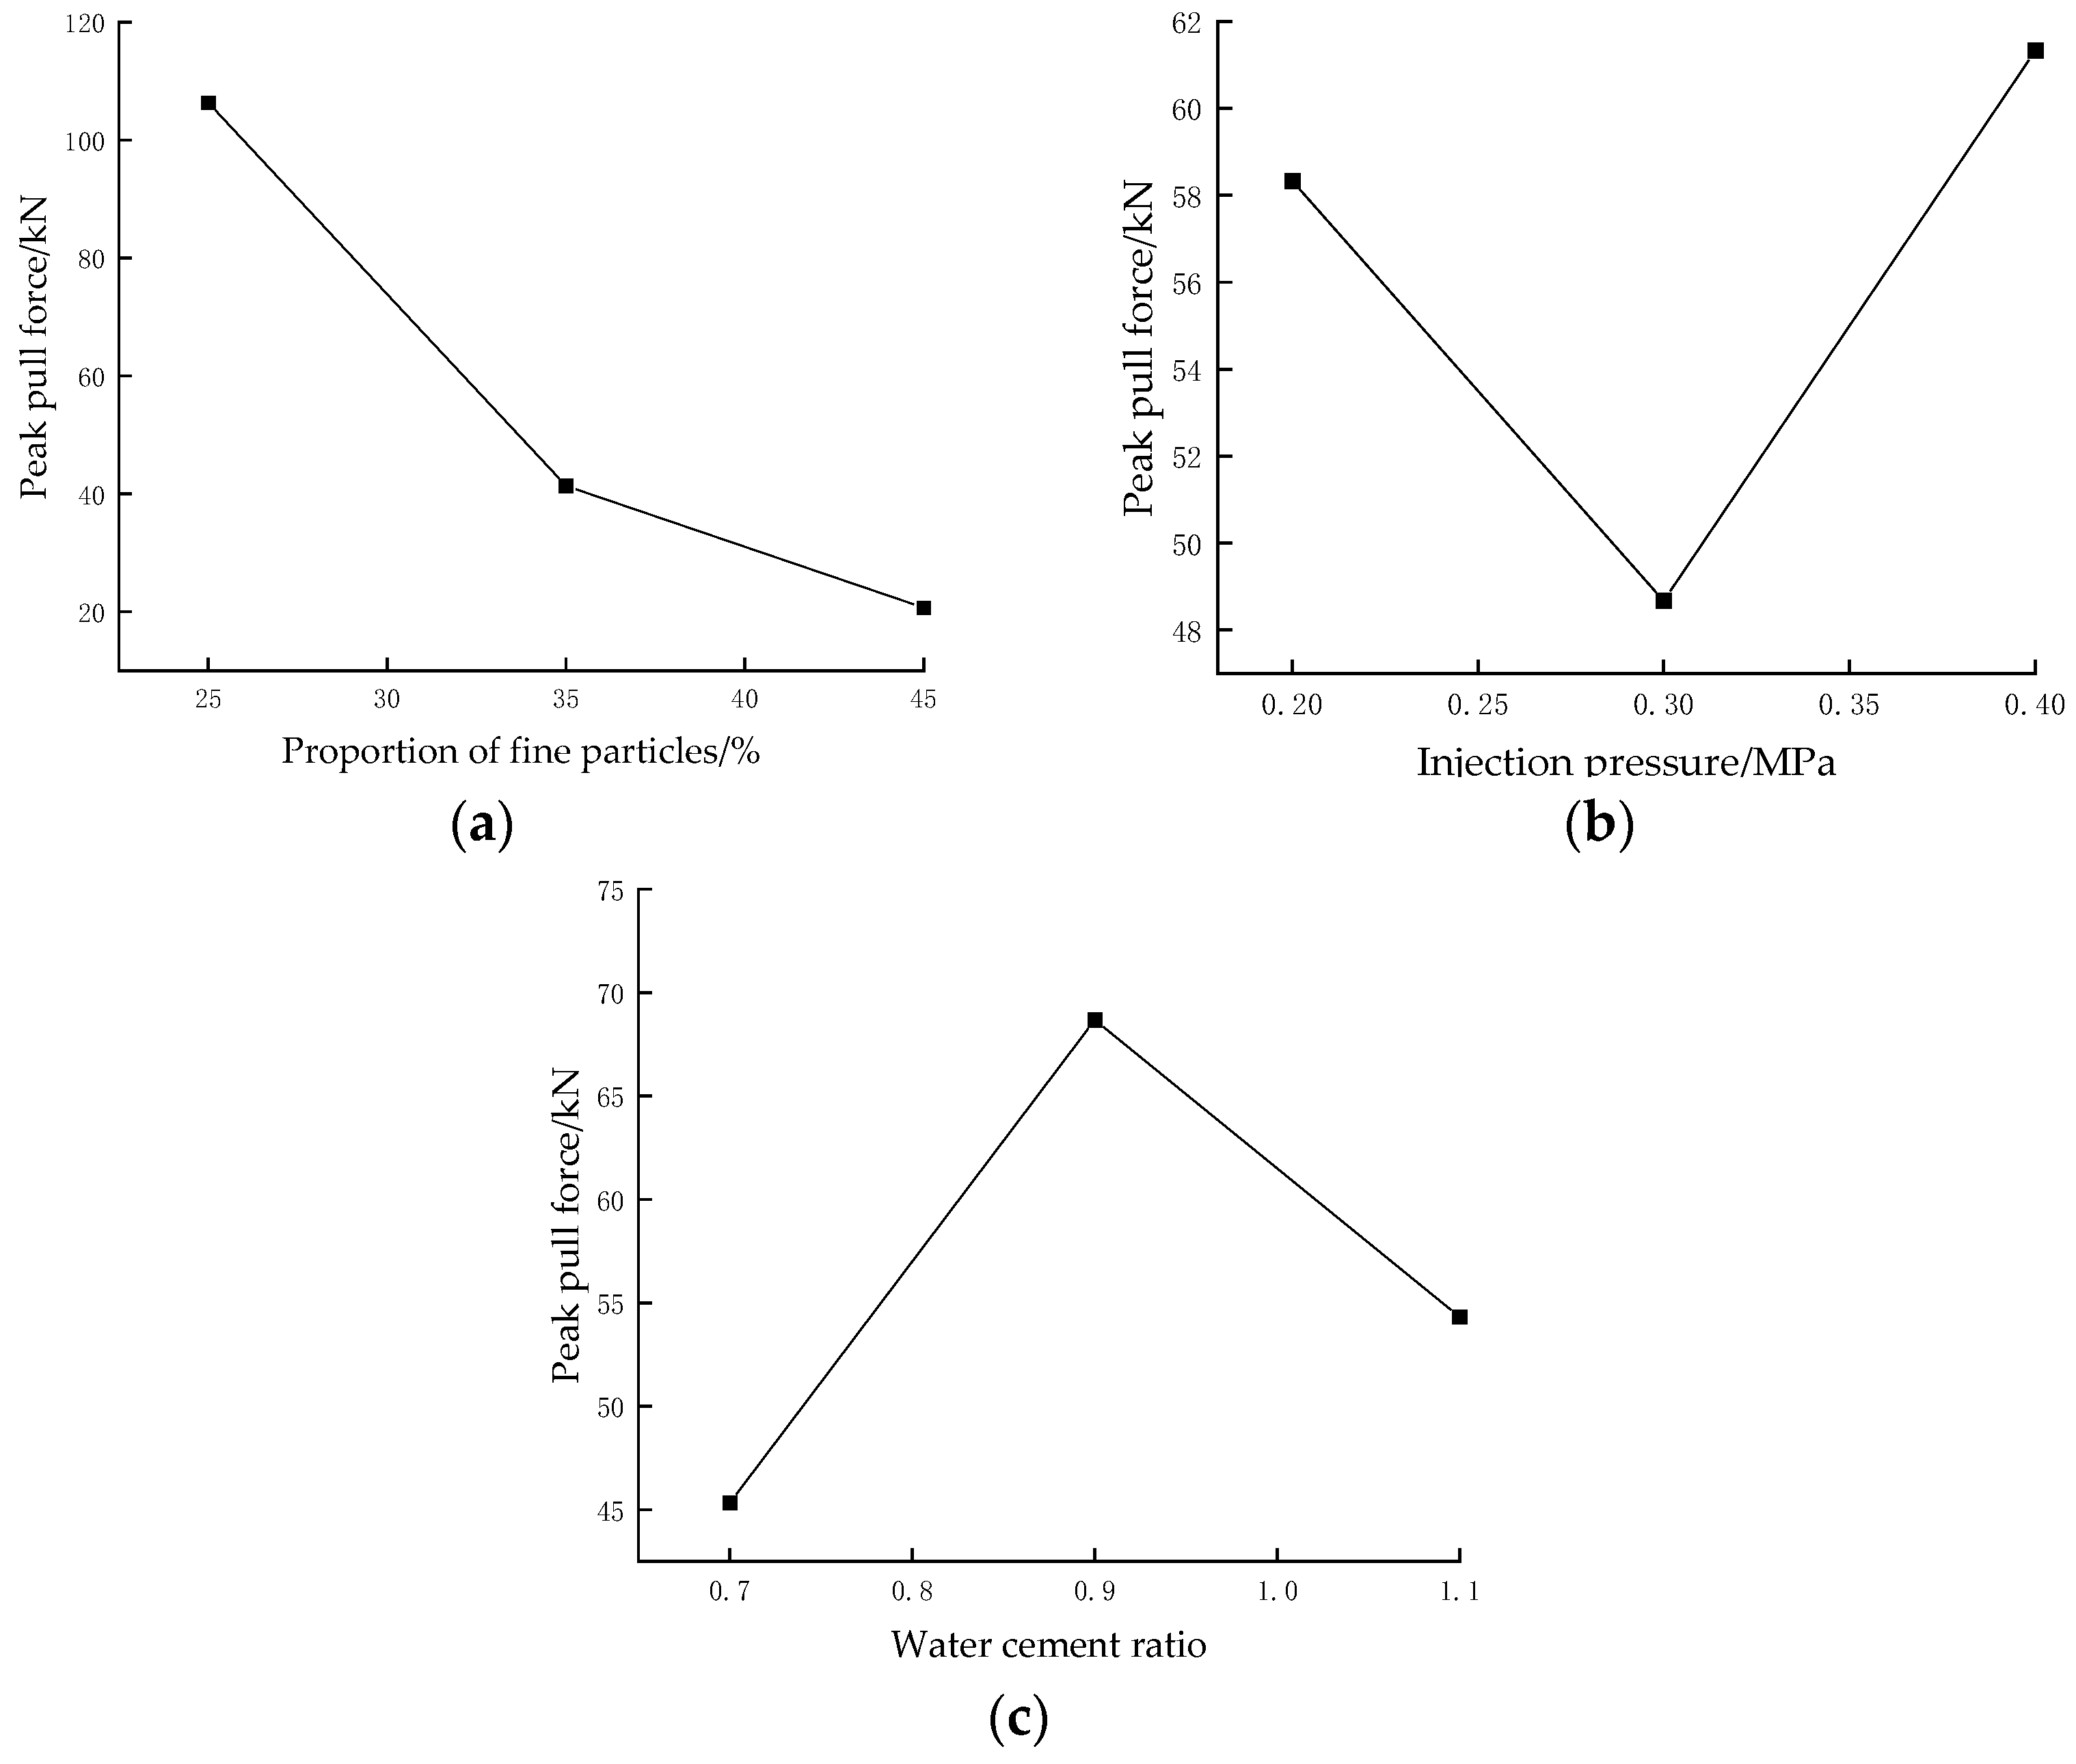
- The orthogonal test results revealed the following order of influencing factors on peak pull-out force: fine particle ratio > water-cement ratio > grouting pressure. A similar dominance pattern was observed for ultimate displacement and anchorage body diameter: fine particle ratio > grouting pressure > water-cement ratio. Through optimization of water-cement ratio and grouting pressure according to particle size gradation in sandy pebble strata, the stability of self-drilling anchor bolts can be substantially improved.
- The peak pull-out force exhibits three distinct characteristic relationships with the investigated parameters: it decreases monotonically with increasing fine particle content; it demonstrates a convex relationship with grouting pressure, initially decreasing before reaching a minimum value and subsequently increasing; and it follows a threshold-dependent behavior with respect to water-cement ratio, showing an increasing trend below a critical ratio but decreasing progressively when this threshold is exceeded.
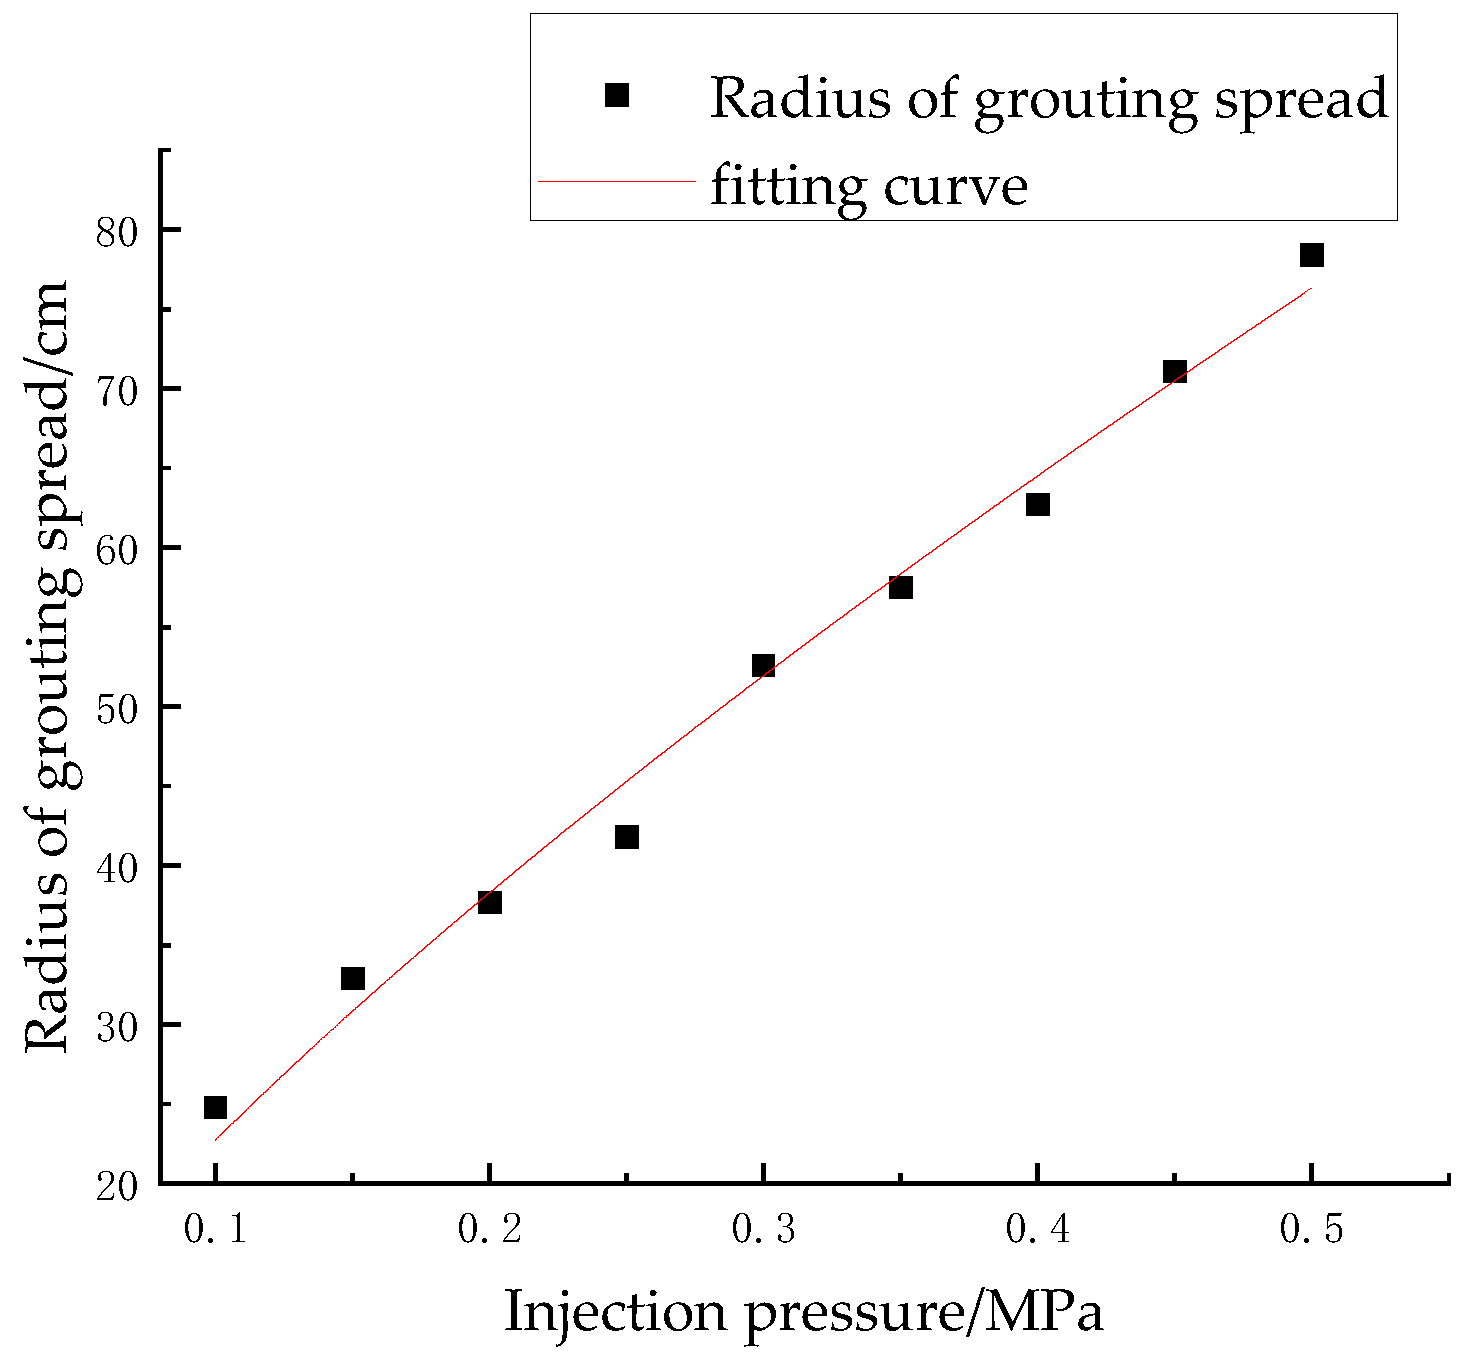
- The slurry diffusion radius of self-drilling bolts exhibits distinct relationships with three key parameters: it increases proportionally with grouting pressure while decreasing with both drilling speed and slurry viscosity. Among these factors, sensitivity analysis reveals slurry viscosity as the most influential parameter, followed by grouting pressure, with drilling speed demonstrating the least impact. Based on these observed relationships, we establish that the diffusion radius follows a power-law function of grouting pressure, drilling speed, and slurry viscosity, from which we derive the following empirical formula.
- The overall diffusion form of the slurry is large in the upper part and gradually decreases along the drilling direction, but the slurry is mainly concentrated in the outlet area. The slurry diffusion radius will increase with the increase of grouting pressure, but the rate of increase will gradually decrease. When the drilling speed is 0.5 m/min, the slurry diffusion radius is the smallest, which is 32.7 cm. When the drilling speed decreases to 0.3 m/min, the slurry diffusion radius increases to 52.6 cm, an increase of 60.9%. When the drilling speed decreases from 0.3 m/min to 0.1 m/min, the slurry diffusion radius increases to 95.9 cm, an increase of 82.3%. When the slurry viscosity increases from 83.3 mPa·s to 833.3 mPa·s, the slurry diffusion radius decreases by 72%.
Author Contributions
Funding
Institutional Review Board Statement
Informed Consent Statement
Data Availability Statement
Conflicts of Interest
References
- Sun, Y. Surface subsidence of pit-in-pit foundation in sand–cobble stratum in Beijing area. Proc. Inst. Civ. Eng.-Ground Improv. 2018, 172, 96–107. [Google Scholar] [CrossRef]
- Huang, J.; Xu, P.; Huang, Z. Settlement Analysis of Mud-Water Shield Passing Full-Face Water-Rich Sand and Cobble Stratum Under Luo River. Geotech. Geol. Eng. 2023, 42, 535–542. [Google Scholar] [CrossRef]
- Jin, Z.; Sun, F.; Zhu, Y.; Yang, L.; Yu, B.; Yan, Y.; Du, Y.; Ge, G. An Experimental Study on the Shear Characteristics of Typical Colluvial Soil with Gravel and the Stability of Slopes in Wenzhou, China. Indian Geotech. J. 2020, 51, 627–646. [Google Scholar] [CrossRef]
- Zhao, P.; Ma, W. Study on the correlation of macro-fine parameters of surrounding rock in sand and cobble tunnel based on discrete element. Mater. Res. Express 2022, 9, 095502. [Google Scholar] [CrossRef]
- Ubaid, H.; Amanpreet, T. Pullout behavior of helical soil nails in cohesionless soil: A laboratory investigation. IOP Conf. Ser. Earth Environ. Sci. 2023, 1110, 012006. [Google Scholar] [CrossRef]
- Jiang, X.; Qin, Y.; Li, W.-T.; Xiang, P.-F.; Zhang, S.-S.; Chen, C. Experimental study on grouting mortar GFRP anchor rod pulling test. J. Phys. Conf. Ser. 2021, 2044, 012161. [Google Scholar] [CrossRef]
- Małkowski, P.; Feng, X.; Niedbalski, Z.; Żelichowski, M. Laboratorial Tests and Numerical Modeling of Rock Bolts Bonded by Different Materials. Rock Mech. Rock Eng. 2022, 56, 2589–2606. [Google Scholar] [CrossRef]
- Buragadda, V.; Orekanti, R.E.; Kompala, P.M. Influence of type of geosynthetic material interaction on shallow anchor pullout capacity. Mater. Today Proc. 2024, 103, 277–281. [Google Scholar] [CrossRef]
- Chen, J.; Ma, S.; Guo, Z.; Liu, H.; Liu, A.; Lan, J. Mechanical Behavior and Parameter Effects of a Novel Cross-Sectional Self-Drilling Bolt Under Tension. Geotech. Geol. Eng. 2025, 43, 95. [Google Scholar] [CrossRef]
- Zhong, Z.; Li, J.; Bie, C. Theoretical Approach to Predicting the Diffusion Radius of Fracture Grouting in Soil–Rock Mixtures. Appl. Sci. 2023, 13, 4730. [Google Scholar] [CrossRef]
- Zhuo, Z.; Rentai, L. Theoretical and experimental study on one dimensional fracture grouting in soil medium. Sādhanā 2020, 45, 232–242. [Google Scholar] [CrossRef]
- Kim, D.; Park, K. Evaluation of the grouting in the sandy ground using bio injection material. Geomech. Eng. 2017, 12, 739–752. [Google Scholar] [CrossRef]
- Liu, S.; Xie, Z.; Zhang, J.; Sun, J.; Tian, Q.; Yu, Z.; An, X.; Wu, W. Experimental Study on the Diffusion Law of Horizontal Grouting in Shallow Sand Gravel Layer. KSCE J. Civ. Eng. 2024, 28, 3192–3207. [Google Scholar] [CrossRef]
- Hua, S.Y.; Zhang, M.D.; Huang, W.H. Model test study of soil grouting effect on shield tunnel longitudinal structural behavior. Eng. Geol. 2025, 347, 107912. [Google Scholar] [CrossRef]
- Cheng, S.; Yang, F.; Dai, Y.; Yang, Z.; Shi, Y. An Experimental Research on Crack Propagation Regularity During Fracture Grouting. IOP Conf. Ser. Earth Environ. Sci. 2021, 651, 032047. [Google Scholar] [CrossRef]
- Fu, J.; Haeri, H.; Sarfarazi, V.; Zadeh, R.K.; Amini, E.; Amini, M.S.; Karimi, L. Computational and experimental analysis of failure characteristics in geogrid-reinforced pre-holed subsurface materials. Eng. Fract. Mech. 2025, 315, 110857. [Google Scholar] [CrossRef]
- Li, J.; Hu, J.; Zhao, Y.; Zhao, Z.; Chen, Y.; Li, B. Failure characteristics of tunnel under the true triaxial condition: Role of a prefabricated flaw. Theor. Appl. Fract. Mech. 2024, 130, 104327. [Google Scholar] [CrossRef]
- Xiao, Q.; Gao, B.; Deng, H.; Zhao, J. Study on the performance of pervious concrete under freeze–thaw cycle based on PFC3D. Front. Phys. 2025, 12, 1466191. [Google Scholar] [CrossRef]
- Wang, T.; Zhang, F.; Furtney, J.; Damjanac, B. A review of methods, applications and limitations for incorporating fluid flow in the discrete element method. J. Rock Mech. Geotech. Eng. 2022, 14, 1005–1024. [Google Scholar] [CrossRef]
- Wang, T.; Zhou, W.; Chen, J.; Xiao, X.; Li, Y.; Zhao, X. Simulation of hydraulic fracturing using particle flow method and application in a coal mine. Int. J. Coal Geol. 2014, 121, 1–13. [Google Scholar] [CrossRef]
- Zhang, Z.; Shao, Z.; Fang, X.; Liang, X. Research on the Fracture Grouting Mechanism and PFC Numerical Simulation in Loess. Adv. Mater. Sci. Eng. 2018, 2018, 4784762. [Google Scholar] [CrossRef]
- Zhou, J.; Fang, K.; Zhao, T. Reinforcement effect of cement grout on soil based on granular flow theory. In Proceedings of the 2016 4th International Conference on Advanced Materials and Information Technology Processing (AMITP 2016), Guilin, China, 24–25 September 2016. [Google Scholar] [CrossRef]
- Wang, J.; Zhang, J.; Li, M.; Sartaj, M.; Wang, Y. A Numerical Simulation of the Interaction of Aggregate and Rockfill in a Gangue Fluidized Filling Method. Sustainability 2022, 14, 12838. [Google Scholar] [CrossRef]
- Sun, F.; Pan, R.; Zhu, X.Y.; Chen, T.L. Meso-Mechanical Simulation of Fracture Grouting under Fluid-Solid Coupling Environment and Engineering Applications. Appl. Mech. Mater. 2013, 477–478, 485–491. [Google Scholar] [CrossRef]
- JGJ120-2012; Technical Specification for Building Foundation Pit Support. China Standards Press: Beijing, China, 2012.


| Sample Number | Percentage of Particle Mass Less Than a Certain Particle Size/% | Cu | Cc | ||||||||||
|---|---|---|---|---|---|---|---|---|---|---|---|---|---|
| 100 mm | 60 mm | 40 mm | 20 mm | 10 mm | 5 mm | 2 mm | 1 mm | 0.5 mm | 0.25 mm | 0.075 mm | |||
| 1 | 100 | 100 | 80.2 | 58 | 42.3 | 36.6 | 31.2 | 29.1 | 22.7 | 5.4 | 3 | 68.9 | 0.3 |
| 2 | 100 | 90.75 | 76.25 | 53.67 | 40.32 | 34.64 | 30.07 | 29.56 | 25.87 | 3.6 | 3.2 | 79.6 | 0.4 |
| 3 | 100 | 100 | 84.19 | 55 | 38.38 | 34.12 | 27.64 | 27.32 | 24.17 | 6.07 | 3.37 | 77.0 | 1.3 |
| 4 | 100 | 86.75 | 77.13 | 52.94 | 43.31 | 36.41 | 32.24 | 29.8 | 24.57 | 4.78 | 2.88 | 81.8 | 0.1 |
| 5 | 100 | 85.75 | 81.93 | 55.62 | 39.63 | 33.84 | 28.79 | 27.75 | 23.65 | 5.37 | 2.02 | 74.5 | 1.0 |
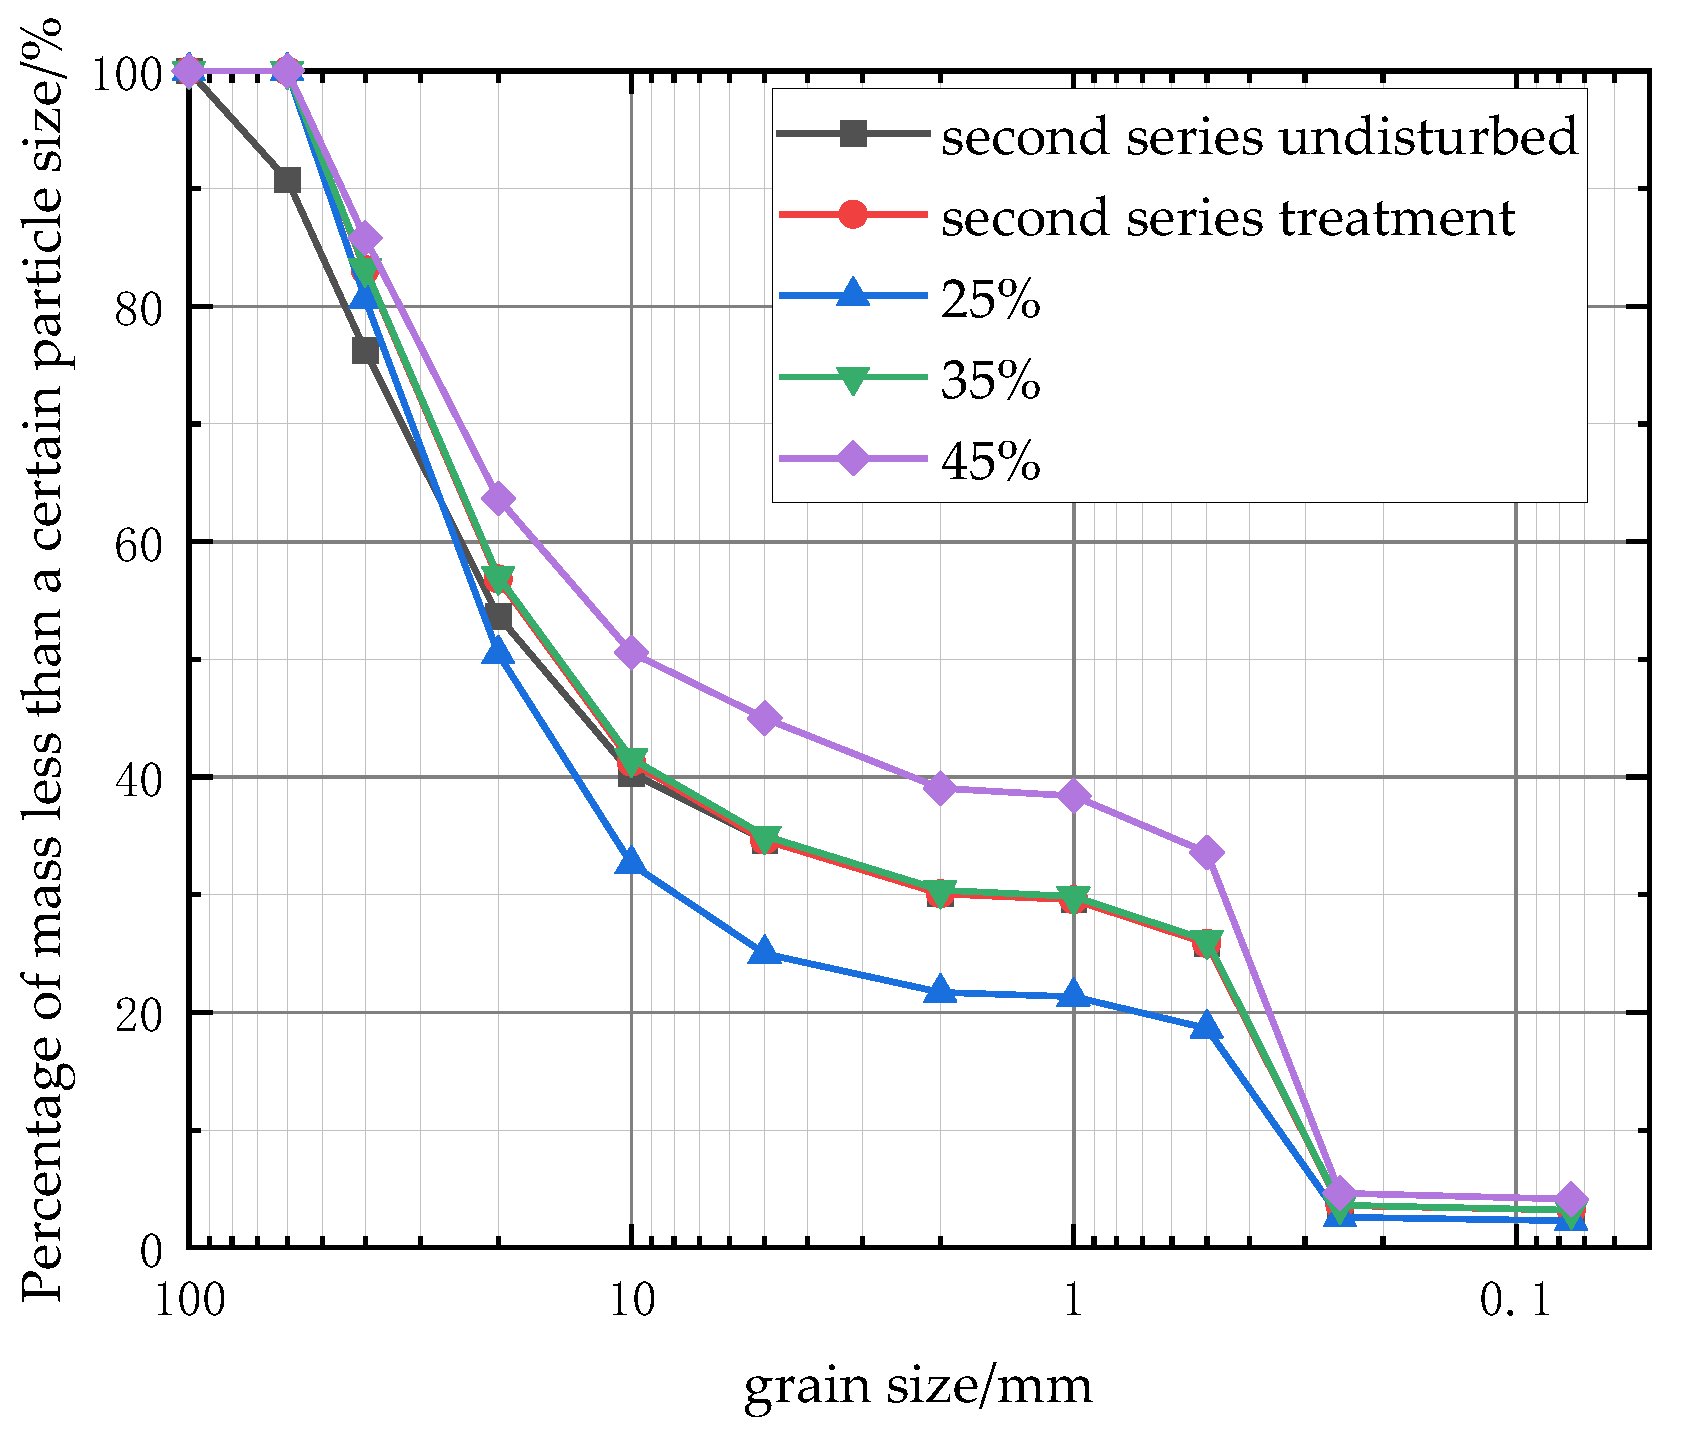
| Sample Number | Percentage of Particle Mass Less Than a Certain Particle Size/% | ||||||||||
|---|---|---|---|---|---|---|---|---|---|---|---|
| 100 mm | 60 mm | 40 mm | 20 mm | 10 mm | 5 mm | 2 mm | 1 mm | 0.5 mm | 0.25 mm | 0.075 mm | |
| undisturbed | 100 | 90.75 | 76.25 | 53.67 | 40.32 | 34.64 | 30.07 | 29.56 | 25.87 | 3.6 | 3.2 |
| treatment | 100 | 100 | 83.11 | 56.81 | 41.26 | 34.64 | 30.07 | 29.56 | 25.87 | 3.6 | 3.2 |
| 25% | 100 | 100 | 80.63 | 50.44 | 32.59 | 25 | 21.7 | 21.33 | 18.66 | 2.59 | 2.29 |
| 35% | 100 | 100 | 83.21 | 57.05 | 41.58 | 35 | 30.38 | 29.86 | 26.13 | 3.62 | 3.21 |
| 45% | 100 | 100 | 85.79 | 63.66 | 50.57 | 45 | 39.06 | 38.39 | 33.6 | 4.65 | 4.13 |
| Specimen Name | Proportion of Fine Particles/% | Injection Pressure/MPa | Water Cment Ratio | Peak Pull Force/kN | Ultimate Displacement/mm | Anchorage Body Diameter/cm |
|---|---|---|---|---|---|---|
| 25-02-11 | 25 | 0.2 | 1.1 | 105 | 7.80 | 21.5 |
| 25-03-07 | 25 | 0.3 | 0.7 | 84 | 5.38 | 27.5 |
| 25-04-09 | 25 | 0.4 | 0.9 | 130 | 5.60 | 29.3 |
| 35-02-09 | 35 | 0.2 | 0.9 | 52 | 3.67 | 13.6 |
| 35-03-11 | 35 | 0.3 | 0.7 | 38 | 4.65 | 14.7 |
| 35-04-07 | 35 | 0.4 | 1.1 | 34 | 3.96 | 14.3 |
| 45-02-07 | 45 | 0.2 | 0.7 | 18 | 5.27 | 9.6 |
| 45-03-09 | 45 | 0.3 | 0.9 | 24 | 3.68 | 8.6 |
| 45-04-11 | 45 | 0.4 | 1.1 | 20 | 3.54 | 10.3 |
| Parameter | Proportion of Fine Particles | Injection Pressure | Water Cement Ratio | Error |
|---|---|---|---|---|
| 319.00 | 175.00 | 136.00 | 186.00 | |
| 124.00 | 146.00 | 206.00 | 163.00 | |
| 62.00 | 184.00 | 163.00 | 156.00 | |
| 106.33 | 58.33 | 45.33 | 62.00 | |
| 41.33 | 48.67 | 68.67 | 54.33 | |
| 20.67 | 61.33 | 54.33 | 52.00 | |
| 85.67 | 12.67 | 23.33 | 10.00 |
| Parameter | Proportion of Fine Particles | Injection Pressure | Water Cement Ratio | Error |
|---|---|---|---|---|
| 18.78 | 16.74 | 14.61 | 15.52 | |
| 12.28 | 13.71 | 12.95 | 15.44 | |
| 12.49 | 13.10 | 15.99 | 12.59 | |
| 6.26 | 5.58 | 4.87 | 5.17 | |
| 4.09 | 4.57 | 4.32 | 5.15 | |
| 4.16 | 4.37 | 5.33 | 4.20 | |
| 2.17 | 1.21 | 1.01 | 0.98 |
| Parameter | Proportion of Fine Particles | Injection Pressure | Water Cement Ratio | Error |
|---|---|---|---|---|
| 78.30 | 51.80 | 45.40 | 52.50 | |
| 42.60 | 43.70 | 52.60 | 50.40 | |
| 28.50 | 53.90 | 51.40 | 46.50 | |
| 26.10 | 17.27 | 15.13 | 17.50 | |
| 14.20 | 14.57 | 17.53 | 16.80 | |
| 9.50 | 17.97 | 17.13 | 15.50 | |
| 16.60 | 3.40 | 2.40 | 2.00 |
| Factor | Sum of Squares of Deviations | Degree of Freedom | Mean Square | F | Significance Level |
|---|---|---|---|---|---|
| Proportion of fine particles | 11,990.89 | 2 | 5995.44 | 73.02 | ** |
| Injection pressure | 262.89 | 2 | 131.44 | 1.60 | — |
| Water cement ratio | 830.89 | 2 | 415.44 | 5.06 | * |
| Error | 164.22 | 2 | 82.11 |
| Factor | Sum of Squares of Deviations | Degree of Freedom | Mean Square | F | Significance Level |
|---|---|---|---|---|---|
| Proportion of fine particles | 9.10 | 2 | 4.55 | 4.90 | * |
| Injection pressure | 2.53 | 2 | 1.27 | 1.36 | — |
| Water cement ratio | 1.54 | 2 | 0.77 | 0.83 | — |
| Error | 1.86 | 2 | 0.93 |
| Factor | Sum of Squares of Deviations | Degree of Freedom | Mean Square | F | Significance Level |
|---|---|---|---|---|---|
| Proportion of fine particles | 439.26 | 2 | 219.63 | 71.08 | ** |
| Injection pressure | 19.34 | 2 | 9.67 | 3.1 | * |
| Water cement ratio | 9.92 | 2 | 4.96 | 1.61 | * |
| Error | 6.18 | 2 | 3.09 |
| Maximum Radius (Rmax)/cm | Maximum and Minimum Radius Ratio (Rmax/Rmin) | Stiffness Ratio (k) | Friction Factor (f) | Porosity (n) | Normal Bonding Strength/N | Tangential Bond Strength/N |
|---|---|---|---|---|---|---|
| 4 | 2 | 4 | 0.25 | 0.2 | 3 × 10⁴ | 3 × 10⁴ |
| Specimen Name | Injection Pressure/MPa | Drilling Rate/mmin−1 | Slurry Viscosity/mPas | Radius of Grouting Spread/cm |
|---|---|---|---|---|
| 2-2-83.3 | 0.2 | 0.2 | 83.3 | 65.6 |
| 2-3-416.6 | 0.2 | 0.3 | 416.6 | 16.3 |
| 2-4-138.9 | 0.2 | 0.4 | 138.9 | 33.7 |
| 3-2-138.9 | 0.3 | 0.2 | 138.9 | 58.3 |
| 3-3-83.3 | 0.3 | 0.3 | 83.3 | 77.3 |
| 3-4-416.6 | 0.3 | 0.4 | 416.6 | 19.2 |
| 4-2-416.6 | 0.4 | 0.2 | 416.6 | 39.5 |
| 4-3-138.9 | 0.4 | 0.3 | 138.9 | 67.6 |
| 4-4-83.3 | 0.4 | 0.4 | 83.3 | 84.7 |
Disclaimer/Publisher’s Note: The statements, opinions and data contained in all publications are solely those of the individual author(s) and contributor(s) and not of MDPI and/or the editor(s). MDPI and/or the editor(s) disclaim responsibility for any injury to people or property resulting from any ideas, methods, instructions or products referred to in the content. |
© 2025 by the authors. Licensee MDPI, Basel, Switzerland. This article is an open access article distributed under the terms and conditions of the Creative Commons Attribution (CC BY) license (https://creativecommons.org/licenses/by/4.0/).
Share and Cite
Gao, X.; Zhao, M.; Wang, C.; Chen, X.; Zhang, Y. Study on the Influencing Factors of Grouting Anchorage for Self-Drilling Bolts in Sandy Pebble Strata. Appl. Sci. 2025, 15, 5888. https://doi.org/10.3390/app15115888
Gao X, Zhao M, Wang C, Chen X, Zhang Y. Study on the Influencing Factors of Grouting Anchorage for Self-Drilling Bolts in Sandy Pebble Strata. Applied Sciences. 2025; 15(11):5888. https://doi.org/10.3390/app15115888
Chicago/Turabian StyleGao, Xiaojuan, Mingchong Zhao, Chaosheng Wang, Xianglin Chen, and Yugang Zhang. 2025. "Study on the Influencing Factors of Grouting Anchorage for Self-Drilling Bolts in Sandy Pebble Strata" Applied Sciences 15, no. 11: 5888. https://doi.org/10.3390/app15115888
APA StyleGao, X., Zhao, M., Wang, C., Chen, X., & Zhang, Y. (2025). Study on the Influencing Factors of Grouting Anchorage for Self-Drilling Bolts in Sandy Pebble Strata. Applied Sciences, 15(11), 5888. https://doi.org/10.3390/app15115888