Article

Advanced AI-Driven Thermographic Analysis for Diagnosing Diabetic Peripheral Neuropathy and Peripheral Arterial Disease

by
Albert Siré Langa
1,
Jose Luis Lázaro-Martínez
2,*,
Aroa Tardáguila-García
2,
Irene Sanz-Corbalán
2,
Sergi Grau-Carrión
1,
Ibon Uribe-Elorrieta
2,
Arià Jaimejuan-Comes
2 and
Ramon Reig-Bolaño
1
1
Faculty of Science Technology and Engineering (FCTE), Universitat de Vic–Universitat Central de Catalunya, 08500 Vic, Spain
2
Diabetic Foot Unit, Facultad de Medicina, Universidad Complutense de Madrid, Instituto de Investigacion Sanitaria del Hospital Clínico San Carlos, 28040 Madrid, Spain
*
Author to whom correspondence should be addressed.
Appl. Sci. 2025, 15(11), 5886; https://doi.org/10.3390/app15115886
Submission received: 28 April 2025 / Revised: 19 May 2025 / Accepted: 22 May 2025 / Published: 23 May 2025
(This article belongs to the Special Issue Applications of Sensors in Biomechanics and Biomedicine)

Abstract

:
This study explores the integration of advanced artificial intelligence (AI) techniques with infrared thermography for diagnosing diabetic peripheral neuropathy (DPN) and peripheral arterial disease (PAD). Diabetes-related foot complications, including DPN and PAD, are leading causes of morbidity and disability worldwide. Traditional diagnostic methods, such as the monofilament test for DPN and ankle–brachial pressure index for PAD, have limitations in sensitivity, highlighting the need for improved solutions. Thermographic imaging, a non-invasive, cost-effective, and reliable tool, captures temperature distributions of the patient plantar surface, enabling the detection of physiological changes linked to these conditions. This study collected thermographic data from diabetic patients and employed convolutional neural networks (CNNs) and vision transformers (ViTs) to classify individuals as healthy or affected by DPN or PAD (not healthy). These neural networks demonstrated superior diagnostic performance, compared to traditional methods (an accuracy of 95.00%, a sensitivity of 100.00%, and a specificity of 90% in the case of the ResNet-50 network). The results underscored the potential of combining thermography with AI to provide scalable, accurate, and patient-friendly diagnostics for diabetic foot care. Future work should focus on expanding datasets and integrating explainability techniques to enhance clinical trust and adoption.

1. Introduction

Diabetes mellitus (DM) is a condition affecting millions of individuals worldwide, with its global prevalence having increased rapidly over the past three decades. Diabetic foot is a common complication of DM, characterized by ulceration, infection, and/or destruction of deep tissues of the foot. This condition results from the interaction of multiple factors, primarily diabetic peripheral neuropathy and peripheral arterial disease, which impact the lower extremities of diabetic patients [1].
Diabetic peripheral neuropathy is a loss of sensory function that begins in the lower extremities. It is also characterized by pain and significant morbidity. Over time, at least 50% of individuals with diabetes develop diabetic neuropathy [2].
There are various methods to assess diabetic peripheral neuropathy. In a busy clinical environment, it is often sufficient to determine whether a patient has symptoms, particularly painful DPN, and to assess their risk of foot ulceration using a monofilament examination. However, for evaluating early nerve damage and providing a more precise phenotyping of somatic and autonomic neuropathy, specialized screening and diagnostic tests are available, such as quantitative sensory testing, sudomotor function tests, neurophysiology, and skin punch biopsy. Current neuropathy endpoints lack sensitivity to detect early abnormalities before overt neuropathy develops, are invasive, or have repeatedly failed as surrogate endpoints of therapeutic efficacy in clinical trials for DPN [3].
Peripheral arterial disease is the lower-limb manifestation of systemic atherosclerotic disease. PAD may initially present symptoms of intermittent claudication, while chronic limb-threatening ischemia, the end stage of PAD, is characterized by rest pain and/or tissue loss. PAD is an age-related condition, present in over 10% of individuals aged ≥ 65 in high-income countries [4].
Diagnosis of PAD relies on clinical assessment and diagnostic tests. The most commonly used diagnostic test is the ankle–brachial pressure index (ABPI) test, which evaluates blood flow to the limbs. However, using ABPI to assess PAD in diabetic individuals can be challenging due to medial sclerosis, the hardening of arteries. This condition can render the arteries incompressible, resulting in falsely elevated ABPI values [5].
In both cases, DPN and PAD, the diagnostic accuracy is not particularly high. Specifically, the sensitivity of the monofilament test for diagnosing DPN is 53%, with a specificity of 88% [6]. For PAD, the sensitivity of the ankle–brachial index is 35.48%, with a specificity of 97.55% [7].
Within this context, infrared thermography (IR) is currently emerging as a promising method for supporting diagnostic processes by detecting and visualizing temperature changes emitted by the body.
Hardy [8] proposed that physiological processes and the thermal properties of the skin are influenced by various factors because the skin plays a role in regulating core body temperature. These factors change in the presence of disease, making infrared measurements useful for diagnostic purposes.
Since then, numerous studies have investigated the use of thermographic imaging in diagnosing diabetes-related complications. Zhou et al. [9] explored the application of infrared thermal imaging technology for the early diagnosis of diabetic peripheral neuropathy. Their study identified temperature changes in plantar blood vessels associated with mild DPN, proposing a non-invasive, reliable, and early diagnostic method. They concluded that infrared thermal imaging is a dependable tool for detecting early microvascular abnormalities linked to DPN.
Padierna et al. [10] developed a non-invasive methodology using infrared thermography and machine learning models to characterize peripheral arterial disease in patients with type 2 diabetes mellitus. Their findings indicated that infrared thermography, combined with machine learning, is a reliable tool for PAD detection in diabetic patients.
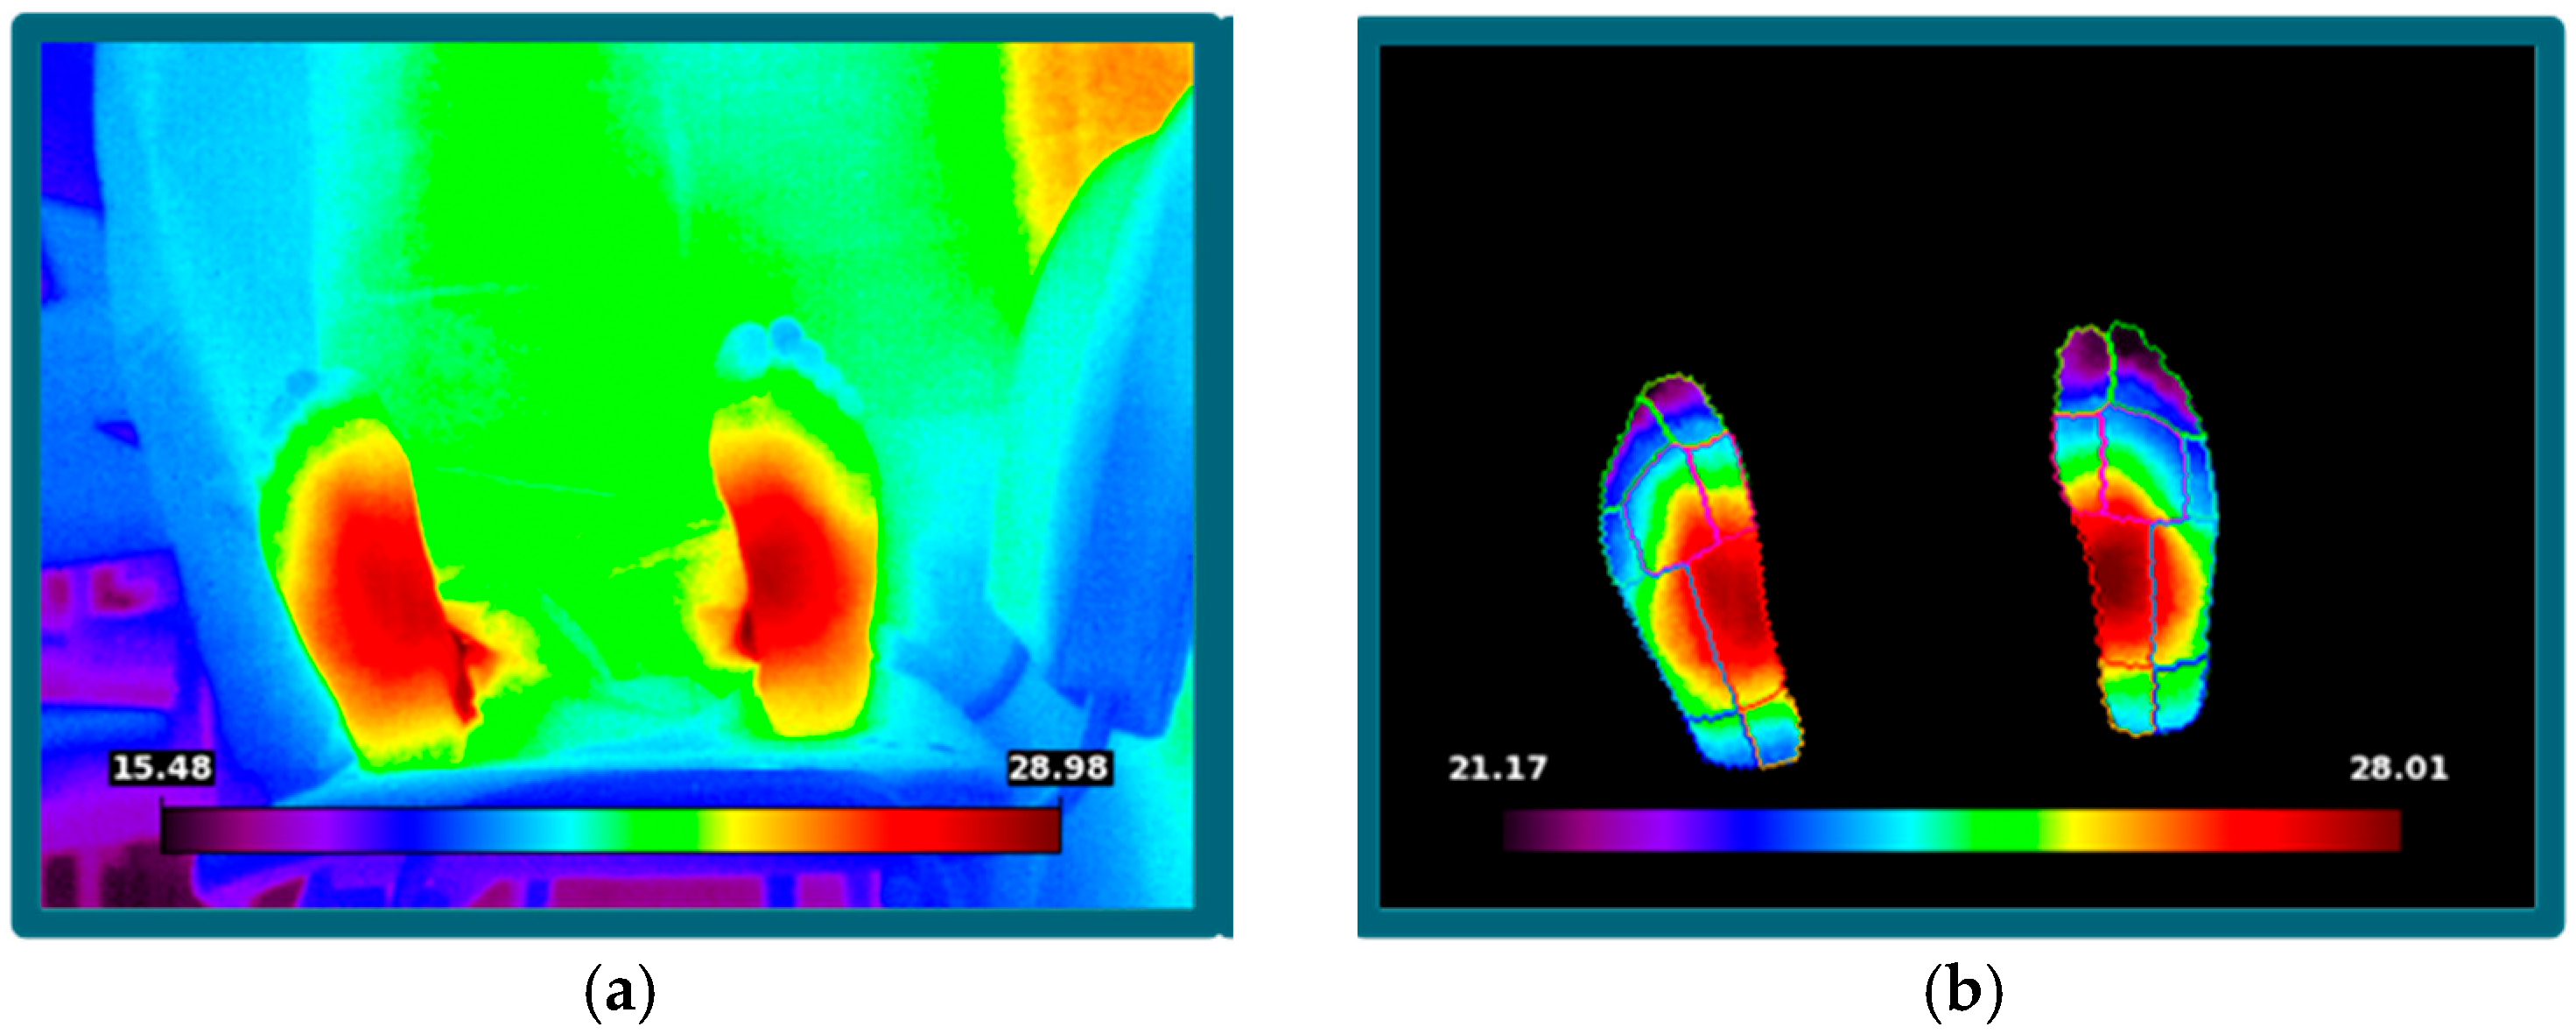
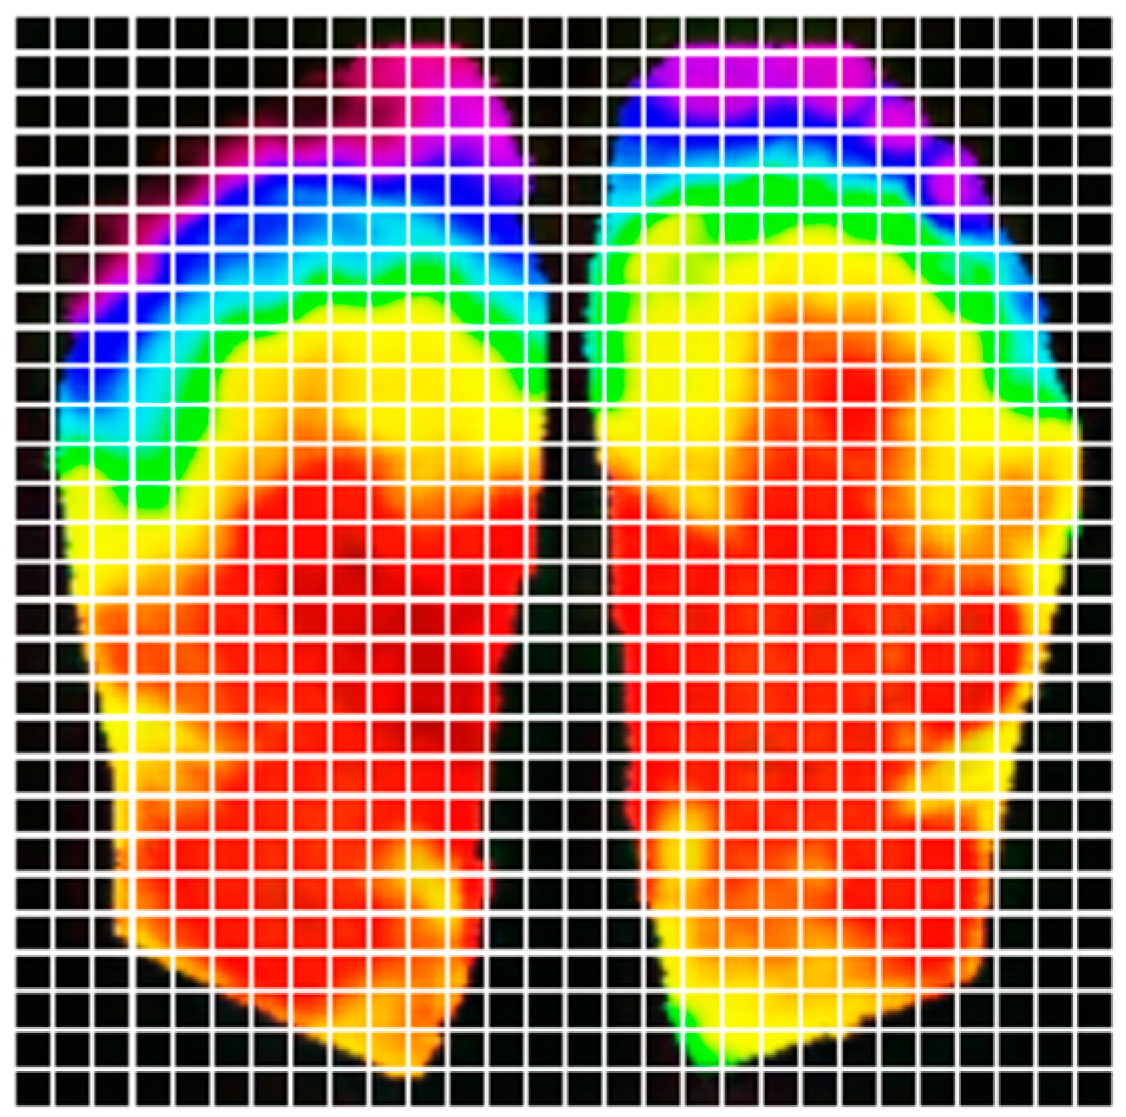
In this scenario, infrared thermography could provide a solution to enhance diagnostic performance. IR is a tool that captures the infrared radiation emitted by the human body through the lens of an infrared camera and converts it into temperature data via photoelectric conversion. This technique is non-invasive, contact-free, cost-effective, reliable, and allows for rapid examination. It is safe for both patients and healthcare professionals.
Artificial intelligence (AI), particularly deep learning, offers significant advantages over traditional statistical analysis in thermographic image interpretation for diagnosing DPN and PAD. While statistical methods rely on predefined features and thresholds, AI models learn complex, non-linear patterns directly from data. This enables higher sensitivity and specificity, especially in early-stage or subclinical cases. Furthermore, AI can integrate spatial and temporal information across images, enhancing diagnostic accuracy.
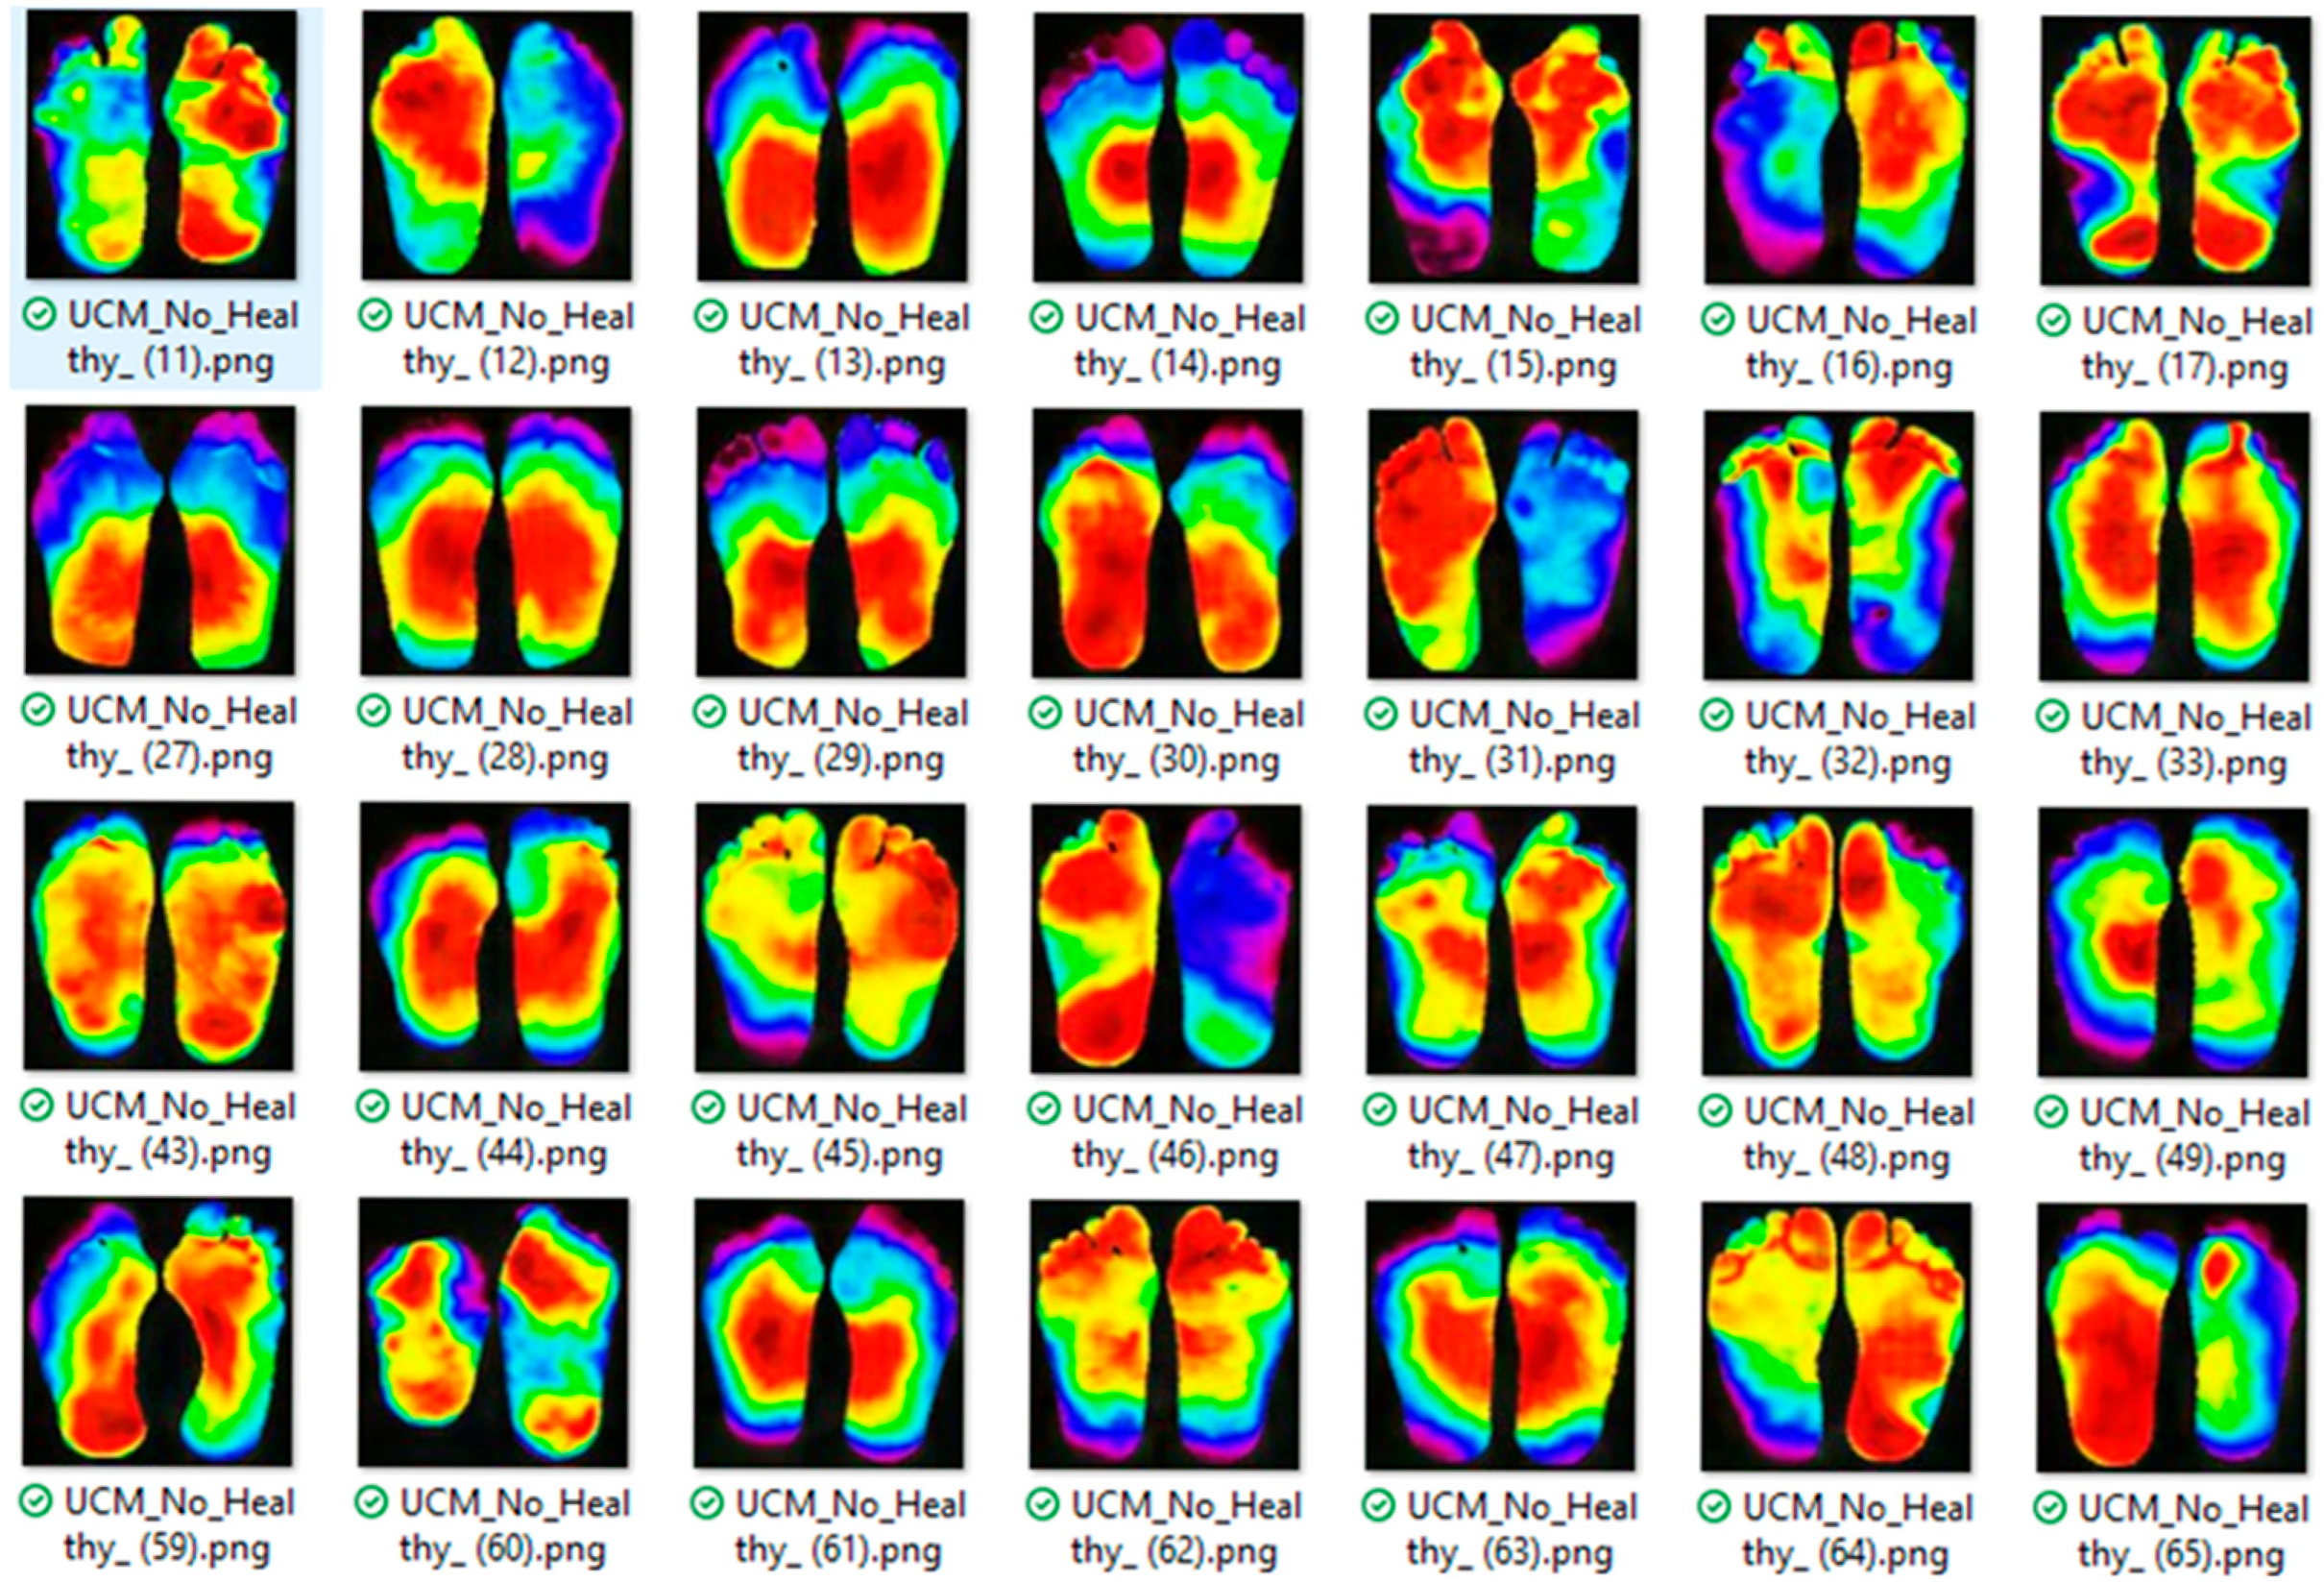
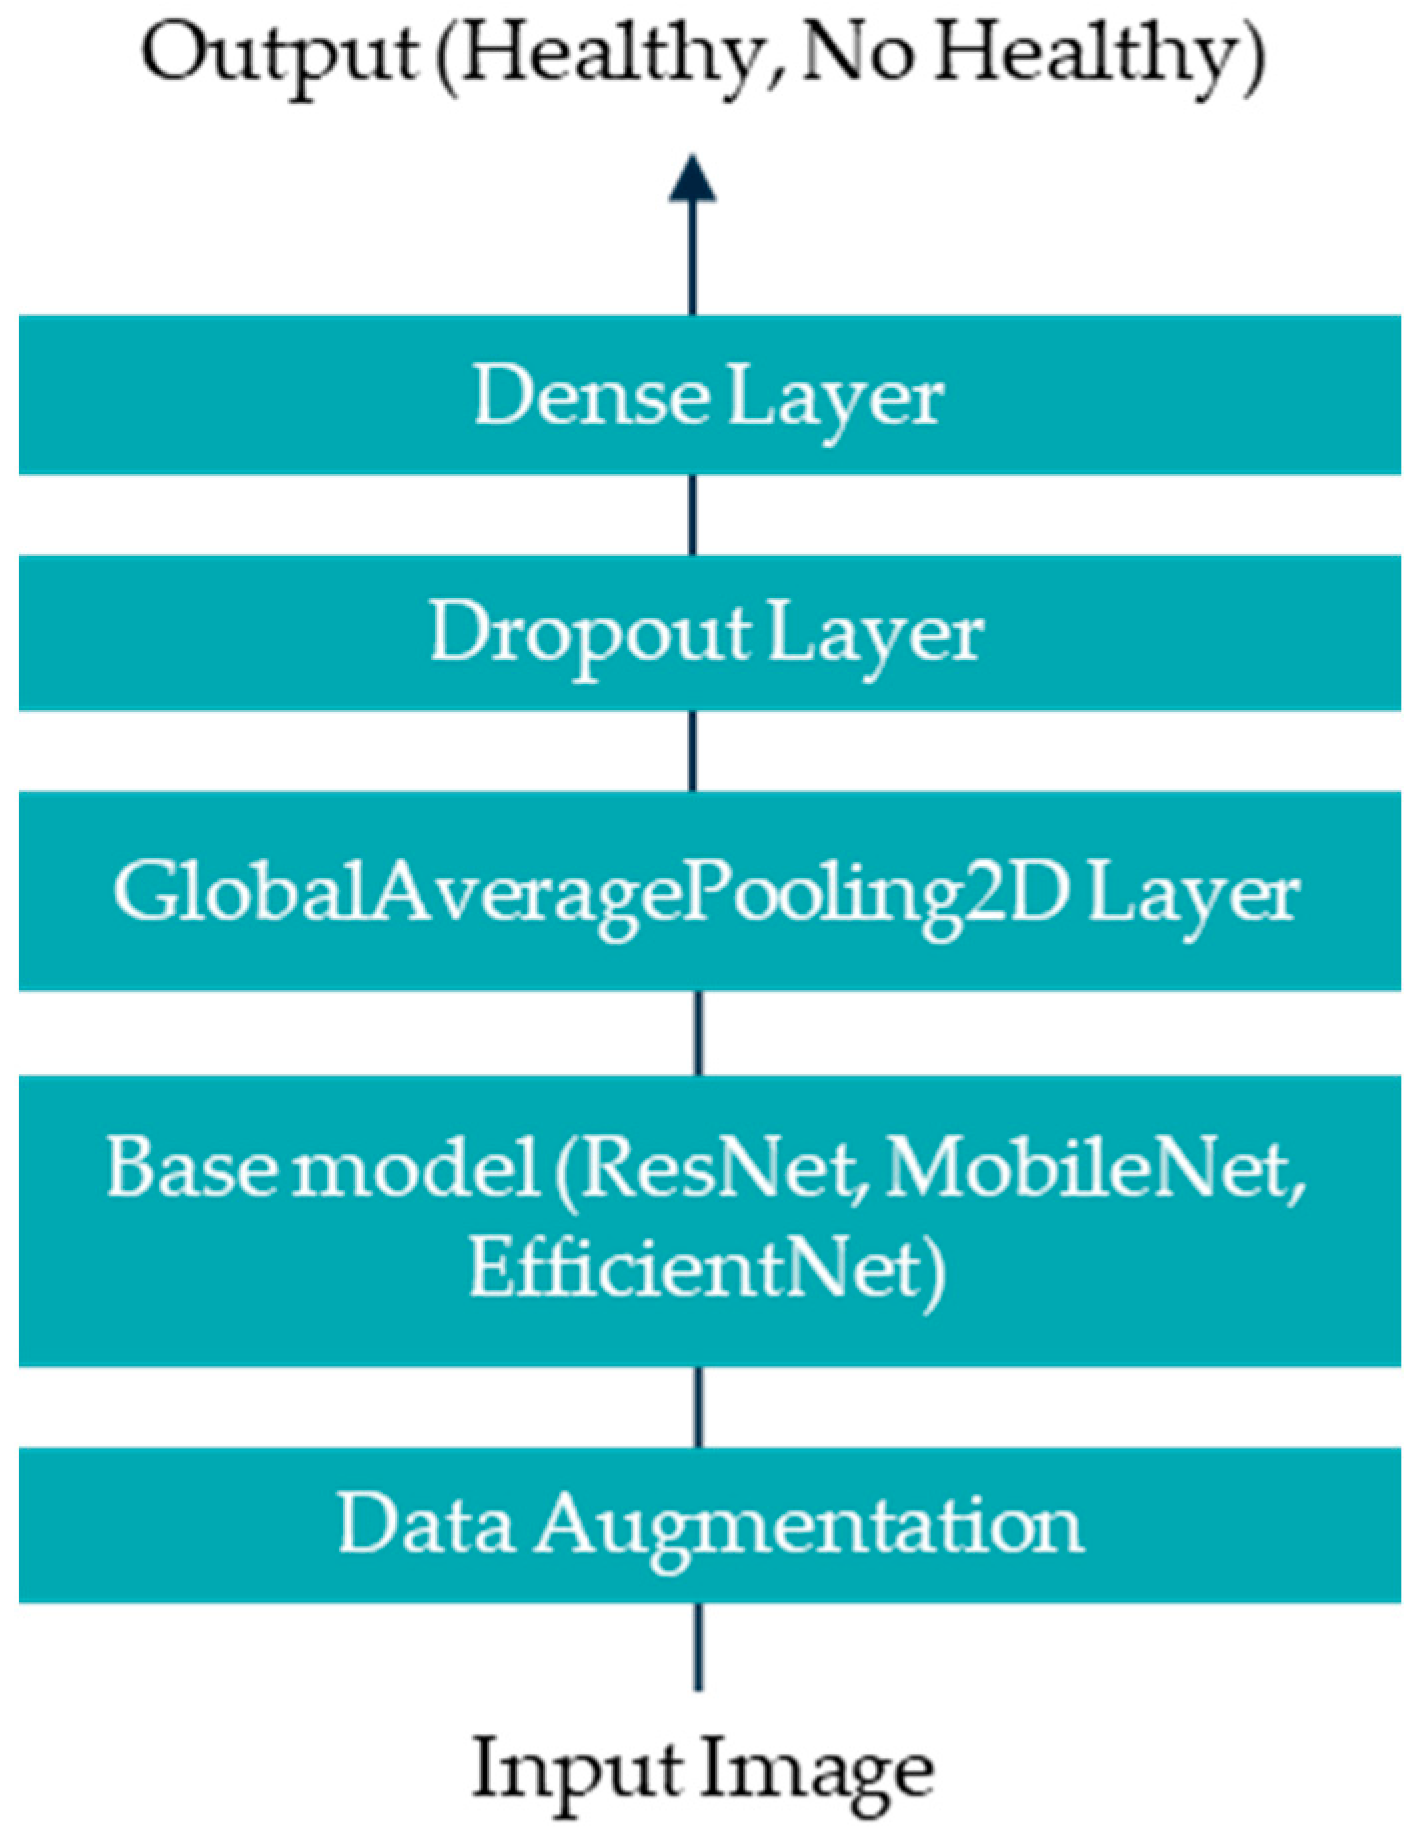
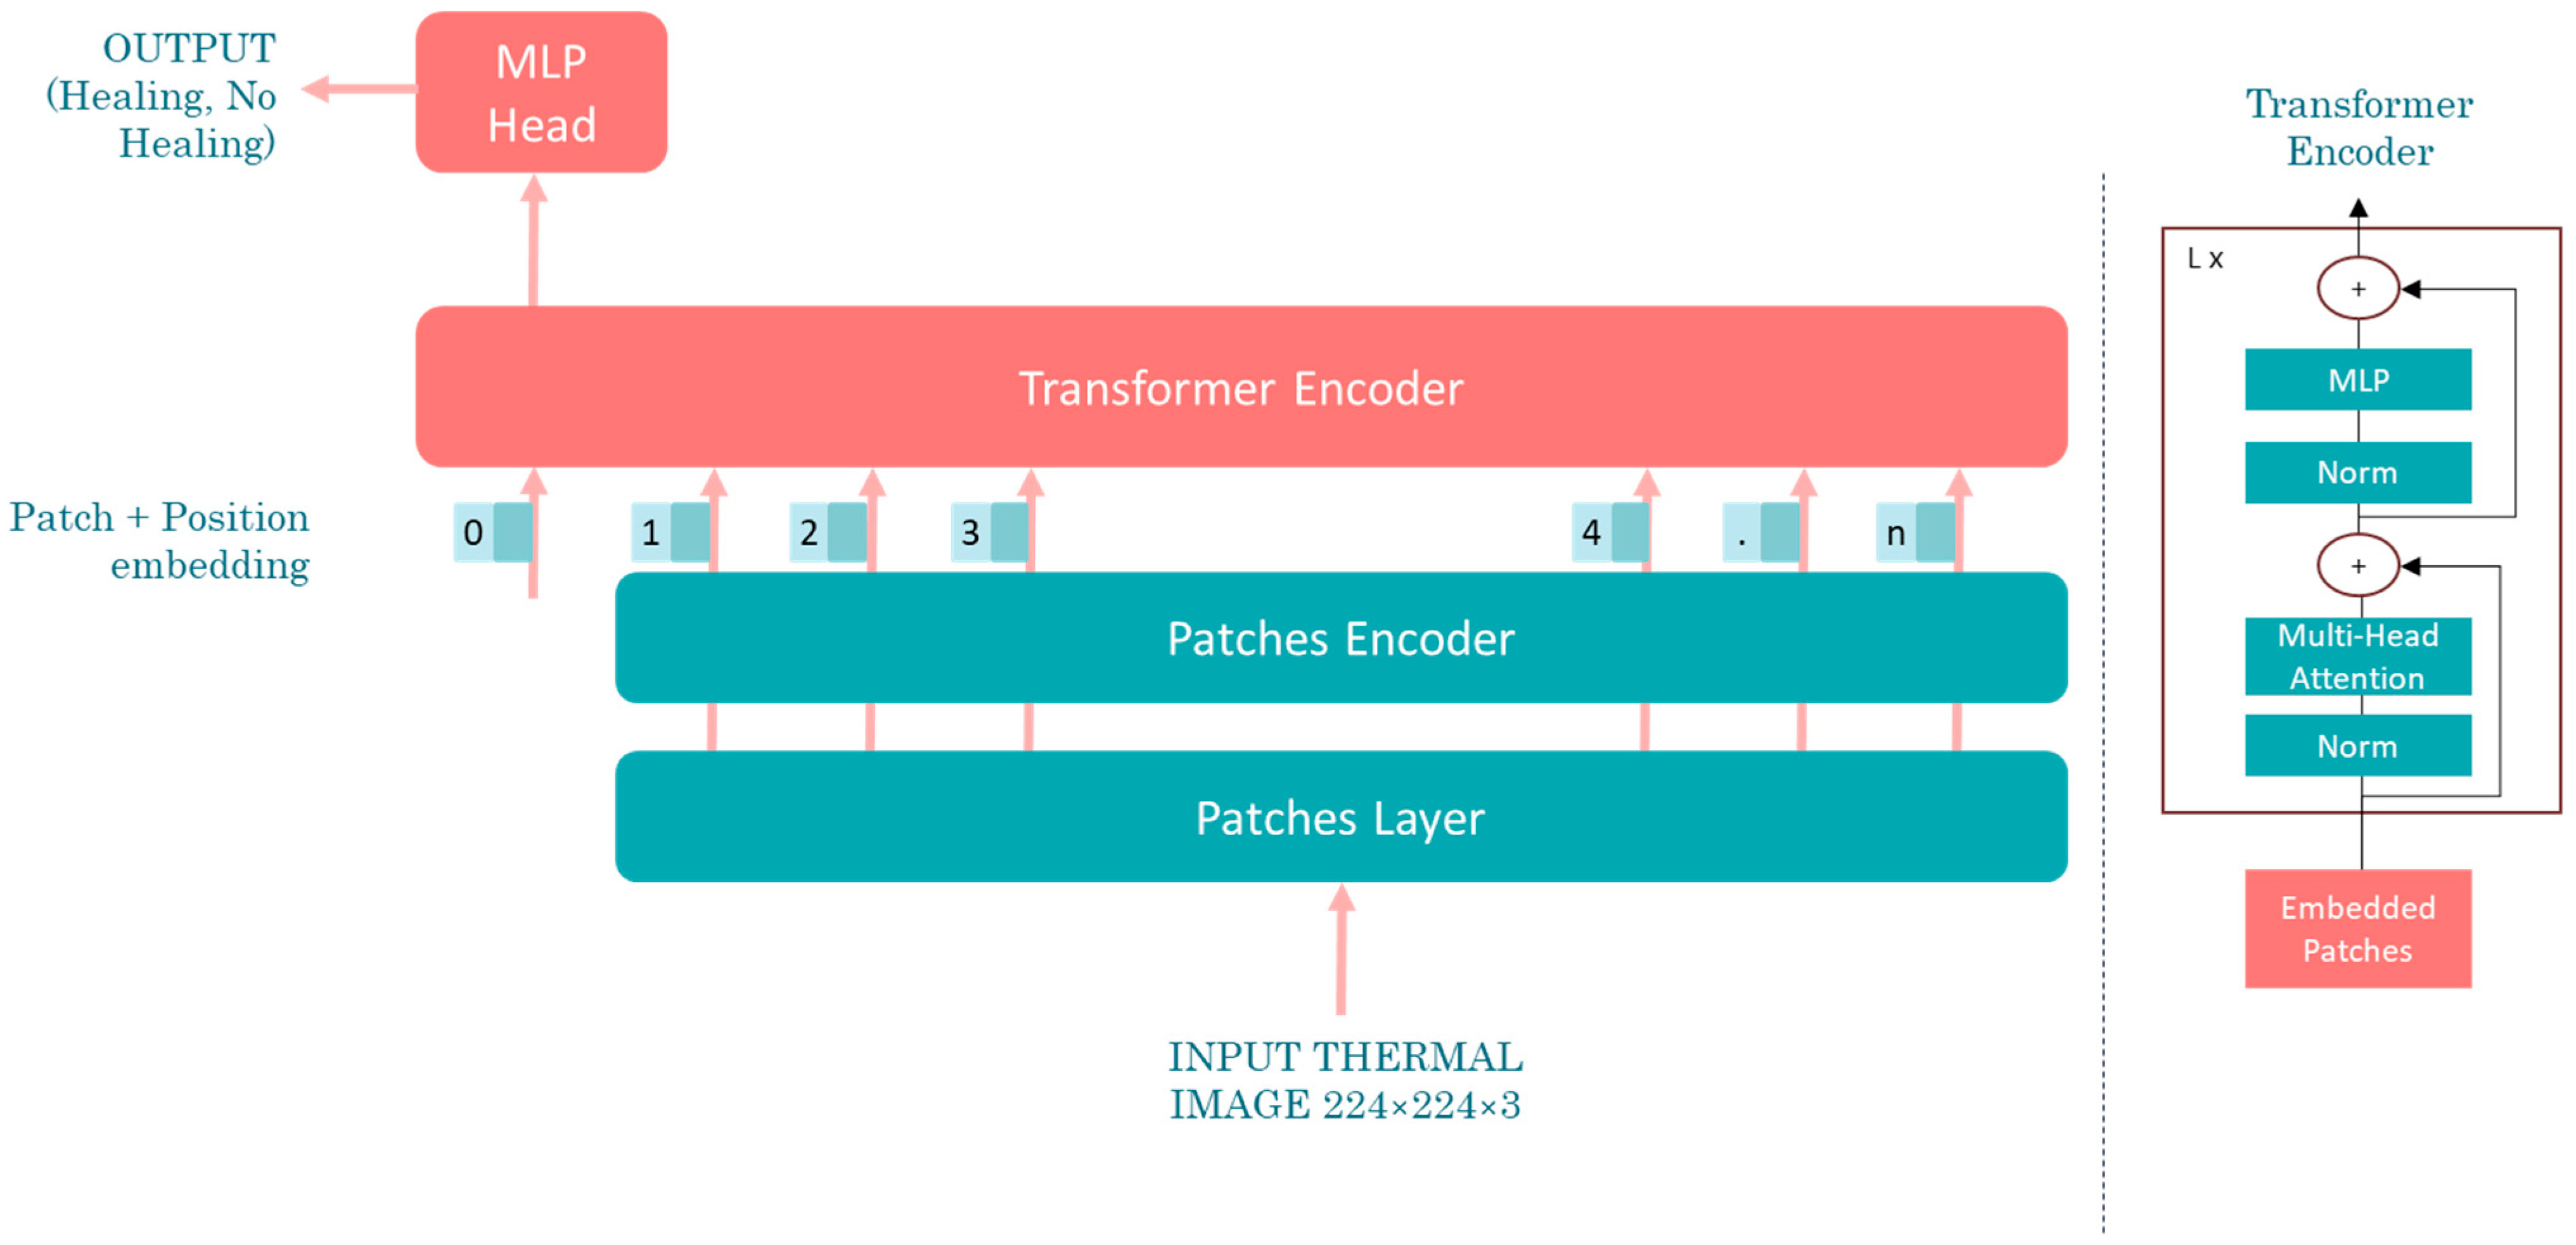
This study aims to develop a deep learning-based methodology for the identification of diabetic peripheral neuropathy (DPN) and peripheral arterial disease (PAD) using infrared thermographic features extracted from the plantar surface of the feet. To achieve this, we trained and evaluated multiple convolutional neural network (CNN) architectures and a vision transformer (ViT) model, specifically adapted to small datasets. The models were designed to automatically classify patients as either healthy or affected by DPN and/or PAD based on subtle temperature distribution patterns. Ultimately, this approach seeks to support the development of non-invasive, accessible, and objective diagnostic tools that can enhance early detection and the personalized management of diabetes-related foot complications such as DPN and PAD.

2. Materials and Methods

2.1. Objectives

This study aimed to train and evaluate various artificial intelligence algorithms for the classification of healthy and non-healthy patients through the processing of thermographic images. It is worth noting that raw temperature data will not be used; instead, thermal images will be utilized.

2.2. Methodological Framework

2.2.1. Capture of the Clinical Dataset

The study was conducted at the Diabetic Foot Unit from Universidad Complutense de Madrid, in Spain, following the approved study protocol. This protocol was approved by a local institutional review board (Clinical Research Ethics Committee—CEIM Clinic Hospital Clinico of San Carlos, Ref No: 24/007-E). The Diabetic Foot Unit from Universidad Complutense de Madrid took on the process of collecting written consent for all patients included in this study.
Thermographic images were first captured from the patients participating in the study. The sample consisted of a total of 147 patients, generating 147 images in total, corresponding to one image per feet for each participant (see Figure 1).
The patients selected for the study met the following criteria:
  • Adults, without distinction of sex.
  • Diagnosed with type 1 or type 2 diabetes mellitus, regardless of pharmacological treatment received.
  • No exposure to extreme temperatures for at least three days prior to the consultation.
  • No intense physical activity was performed in the 24 h period before image acquisition.
Patients were excluded from the study if they presented any of the following conditions:
  • Active foot ulcers.
  • Neuropathy of non-diabetic origin.
  • Lower limb revascularization performed within the past four weeks.
  • Inability to capture thermographic images due to anatomical characteristics.
  • Cognitive impairments that hindered participation in the study.
  • Explicit refusal to participate in the study.
  • Major amputations of either foot.
The patients included in the study were previously diagnosed by clinical specialists. To this end, these patients underwent a standardized neurological screening (including Semmes–Weinstein monofilament testing, tuning fork examination, and NerveCheck Master®®; Phi Med Europe SL, Barcelona, España) and a vascular assessment (palpation of distal foot pulses, ankle–brachial index [ABI], toe–brachial index [TBI], and transcutaneous oxygen pressure [TcPO2]). This allowed for the determination of whether the study participants were specifically affected by diabetic neuropathy and/or peripheral arterial disease. Based on these evaluations, they were categorized into two groups: patients with DPN and/or PAD (non-healthy patients) and patients without these conditions (healthy patients). Based on that, a detailed distribution of participants is presented in Table 1.
Prior to the acquisition of thermographic images of both feet, the environmental conditions of the room were verified. The temperature was maintained at 25 °C (±1 °C), with a relative humidity of 55% [11]. These conditions were controlled to ensure the reproducibility of the thermographic measurements. Participants were instructed to remove their shoes and socks and to cleanse their feet using a damp towel. After that, to take the picture, each patient was positioned supine on an examination table for a minimum of 15 min. Based on our experience and prior experimental evidence [11], this period allowed for thermal equilibrium in the plantar region, minimizing variability and ensuring reliable temperature acquisition. To ensure thermal isolation and preserve patient privacy, a blue cloth with specific openings was used to expose only the soles of the feet. This method minimized thermal interference from the rest of the body and maintained subject confidentiality.
Thermographic images were captured using a Thermal Expert TE-Q1 camera (i3System Inc., Daejeon, Republic of Korea), which has a good performance for e-health applications [12]. This device was chosen for its high thermal sensitivity and precision, essential features for clinical evaluation.
The acquired images were processed to automatically segment the soles of the feet and to dynamically adjust the thermal scale according to the maximum and minimum temperature values detected in both extremities. An example of the resulting output from this process is shown in Figure 2.

2.2.2. Dataset Balancing

The dataset obtained from the clinical study exhibited an imbalance in the number of thermographic images of healthy patients, compared to those with pathological conditions (DPN and PAD).
To address this issue and to ensure a balanced distribution, additional thermographic images of healthy patients were incorporated from the publicly available INAOE dataset [13]. This integration enhanced the representativeness of the healthy patient class in the analysis.
It is important to highlight that the thermographic images of healthy subjects obtained from the INAOE public dataset were selected specifically because their acquisition protocol closely aligned with the protocol used in our clinical trial. Both datasets followed standardized practices described in prior literature, including:
  • A supine rest period for thermal acclimatization.
  • Acquisition of plantar images with the patient at rest, in a thermally controlled environment.
  • Application of infrared shielding methods to isolate plantar temperature from background radiation.
  • Use of infrared cameras with similar technical specifications.
Additionally, we implemented a strict preprocessing pipeline—including image merging and thermal scale alignment—in order to harmonize them with the clinical images captured in the study and to minimize potential acquisition-related biases.
We also initiated the collection of additional thermographic images from healthy individuals under the same clinical conditions, which will be incorporated into future works to further strengthen the model and reduce domain shift risks.
After completing the balancing process, the final dataset was obtained, consisting of a total of 192 thermal images. The additional 45 participants included from the INAOE dataset were completely healthy individuals without diabetes. While these participants did not undergo the same full clinical screening protocol described in the study, the dataset was originally collected under controlled conditions and included only subjects who were medically evaluated as free of any metabolic, vascular, or neurological disorders at the time of acquisition. Therefore, although the exact same diagnostic tests were not applied, the inclusion criteria were functionally equivalent in ensuring that the individuals included from the INAOE dataset represented a healthy, non-diabetic population without signs of diabetic peripheral neuropathy (DPN) or peripheral arterial disease (PAD).
In addition, the dataset contained 11 diabetic patients who did not present clinical signs of either PAD or DPN, serving as a secondary control subgroup. The remaining patients in the dataset were clinically diagnosed with diabetic peripheral neuropathy (DPN), peripheral arterial disease (PAD), or both, based on neurological and vascular assessments. A summary of the distribution of patients in the final dataset is presented in Table 2.

2.2.3. Convolutional Neural Network Training

Using the preprocessed foot images, a convolutional neural network (CNN) was trained to classify the images into two main categories: non-healthy patients (those diagnosed with diabetic neuropathy, peripheral arterial disease, or both conditions) and healthy patients (those without these conditions).
Convolutional neural networks are widely used in classification tasks, such as the one proposed in this study, due to their ability to extract and process high-level features from input images [14]. Additionally, CNNs can leverage transfer learning mechanisms, enabling the development of high-performance models by utilizing data from different domains [15]. This approach is particularly useful in scenarios where the dataset size is limited, as it reduces training time and enhances the model’s generalization capability.
Our convolutional neural network (CNN) utilized transfer learning by leveraging several base models, including ResNet-50 [16], MobileNet V1 [17], and EfficientNet V2 B0 [18].
The convolutional neural network (CNN) model was developed to process input images with the dimensions 224 × 224 × 3, corresponding to standard RGB images with three color channels. This dimensionality was chosen to align with the input requirements of the selected base architectures. To enhance the generalization capability of the model and to mitigate potential overfitting—particularly in the presence of class imbalance—data augmentation techniques were selectively applied. Specifically, random rotations and horizontal/vertical flips were introduced exclusively to samples of the underrepresented class (i.e., healthy cases) within the training dataset, ensuring that augmentation would not bias the already dominant class and would improve model robustness to spatial variability. Table 3 summarizes the structure of the dataset, showing how it was divided into training, validation, and test sets before and after data augmentation, providing the number of images per class in each subset:
The architecture employed transfer learning by utilizing one of three state-of-the-art convolutional backbones: ResNet-50, MobileNet V1, or EfficientNetV2-B0. These models were initialized with pretrained weights from the ImageNet dataset, enabling the network to benefit from a rich hierarchy of visual features learned on a large and diverse corpus of natural images. The top classification layers of the pretrained models were removed, and a custom classification head was appended. This included a global average pooling layer to condense the spatial dimensions of the feature maps into a compact vector representation, effectively summarizing global contextual information. This was followed by a dropout layer (with a dropout rate of 0.3) to introduce regularization and reduce the risk of overfitting during training. Finally, a single dense layer with sigmoid activation was added to perform binary classification between the target classes (see Figure 3).
The training process was carried out in two main phases. During the initial training phase, a partial fine-tuning strategy was adopted: approximately 75% of the base model layers were frozen, particularly those associated with low-level feature extraction. This allowed the model to preserve valuable generic representations while updating only the upper 25% of the layers to adapt to the domain-specific dataset. Empirically, this configuration outperformed other layer-freezing strategies tested in our experiments. After convergence in the initial phase, the model proceeded to a full fine-tuning stage, wherein the base model was completely unfrozen except for the first 50 layers, which remained non-trainable to further retain foundational features. During this second phase, the model was recompiled with a reduced learning rate of 1 × 10⁻⁴ to prevent large parameter updates and ensure stable adaptation. An additional set of training epochs was conducted, which significantly improved the model’s performance on domain-specific features by refining high-level representations.
Binary cross-entropy was used as the loss function to enhance classification accuracy. The Adam optimizer, with an initial learning rate of 0.001, was employed to adjust model weights during training. A learning rate scheduler was implemented to reduce the learning rate whenever validation accuracy plateaued, ensuring efficient convergence. Furthermore, early stopping was applied to terminate training after 8 epochs with no improvement in validation accuracy, preventing overfitting and unnecessary computation.

2.2.4. Visual Transformer Network Training

Visual transformers (ViT) [19] are showing promising results in the medical imaging domain [20]. They introduce a transformative approach to image recognition by applying a transformer architecture directly to images without relying on convolutional networks. The vision transformer processes images by splitting them into smaller fixed-size patches, treating these patches as individual tokens (similar to words in natural language processing models). The model embeds these patches into a 1D sequence and passes them through a standard transformer encoder for image classification tasks. This approach eliminates the need for convolutional layers, relying instead on self-attention mechanisms to learn image features.
Our proposed vision transformer (ViT) model was designed to classify input images into binary categories (healthy or not healthy), leveraging a transformer-based architecture tailored for image analysis tasks. This model used the standard transformer-based approach for image classification. However, it employed a reduced number of layers, which allowed it to be trained on a small dataset (essentially a “small ViT” model with around 26 million parameters). Figure 4 shows a concise breakdown of its structure.
The model received fixed-size RGB input images, which were optionally augmented using a sequence of standard transformations, including random rotations and horizontal/vertical flips. As with the CNN models, data augmentation was applied exclusively to the underrepresented class (healthy) within the training dataset, since the same augmentation strategy was consistently used for both the CNN and ViT models.
After being processed, each image was divided into non-overlapping patches of equal size for further processing (Figure 5).
These patches were vectorized and passed through a dense layer to project them into a lower-dimensional embedding space. To preserve spatial information, a trainable positional embedding was added to the patch representations.
The encoded patches were then processed through a series of transformer blocks. Each block started with layer normalization, followed by a multi-head self-attention mechanism with four attention heads. A residual connection was applied after the attention output. Another layer normalization was performed, and the result was passed through a multilayer perceptron (MLP) block composed of two dense layers with GELU activations and dropout regularization. A second residual connection integrated the MLP output back into the original path.
After the transformer layers, the output patch sequence underwent layer normalization and was flattened into a single feature vector. A dropout layer was applied to this flattened representation to mitigate overfitting. This feature vector was then passed through a classification head implemented as an MLP composed of two dense layers (with 512 and 256 units, respectively), again using GELU activations and dropout. Finally, the network outputted logits through a dense layer, with the number of units corresponding to the number of target classes (healthy or not healthy).
The model was trained using the Adam optimizer with a learning rate of 0.0003 and a weight decay of 0.0001. Sparse categorical cross-entropy loss was employed as the loss function. Finally, early stopping was implemented to halt training after 10 consecutive epochs without improvement in validation accuracy, effectively reducing overfitting and saving computational resources.

3. Results

3.1. Convolutional Neural Network Results

Traditionally, the performance of AI-based classification models in clinical settings is evaluated using statistical metrics, including accuracy, sensitivity, specificity, and other related indicators, as summarized in Table 4 [21].
Based on the definitions above, the list of performance metrics on the validation dataset are shown in Table 5. (The validation dataset is a portion of the training dataset—in this case, 20%—that is not used for training but instead is used to evaluate the model during training, after each epoch).
The list of performance metrics on the test dataset are shown in Table 6. The test dataset consisted of 40 images, 20 images of healthy patients and 20 images of non-healthy patients. Those images have never been “seen” by the model.
As indicated in the table, the ResNet-50 network outperformed the other two CNNs in terms of results for the test dataset.

3.2. Visual Transformer Network Results

The dataset structure for training, validation, and testing used in the ViT model was the same as that used for the CNN models. In this sense, the list of ViT performance metrics on the validation dataset (20% of the training dataset) is shown in Table 7.
The list of ViT performance metrics on the test dataset is shown in Table 8. The test dataset consisted of 40 images, 20 images of healthy patients and 20 images of non-healthy patients. Those images have never been “seen” by the model.
As shown in Table 8, the visual transformer network yielded worse results on the test set compared to all the CNN models.

4. Discussion

This study demonstrated the integration of advanced artificial intelligence models, including convolutional neural networks (CNNs) and vision transformers (ViTs), with thermographic imaging for the diagnosis of diabetic peripheral neuropathy and peripheral arterial disease.
The comparative analysis revealed that ResNet-50 outperformed the other CNN architectures (MobileNet V1 and EfficientNetV2 B0) and the visual transformer network, achieving an accuracy of 95.00%, a sensitivity of 100.00%, and a specificity of 90%. These results are also superior to those of existing diagnostic methods, which report a sensitivity of 53% and specificity of 88% for DPN (monofilament test) and a sensitivity of 35.48% and specificity of 97.55% for PAD (ankle–brachial index).
Despite the promising results, the study is constrained by certain limitations. First, the relatively small size of the dataset—despite the inclusion of healthy cases from the INAOE public database—may limit the generalizability of the results. Although acquisition protocols between datasets were harmonized, subtle domain shifts cannot be entirely ruled out. Second, the lack of explainability in the AI predictions may hinder clinical adoption. Employing explainability techniques could address this issue by providing clinicians with insights into the decision-making process of the models.

5. Conclusions

The findings of this research underscore the efficacy of integrating infrared thermography with advanced artificial intelligence models—specifically convolutional neural networks (CNNs) and vision transformers (ViTs)—for the diagnosis of DPN and PAD. This approach offers a non-invasive, cost-effective, and scalable alternative to traditional diagnostic methods, facilitating timely interventions and reducing the risk of severe complications, such as ulcers and amputations. Furthermore, the use of transfer learning and public datasets demonstrates the potential of leveraging existing resources to overcome challenges related to data scarcity.
Future work should focus on exploring more sophisticated AI architectures, such as vision transformers with enhanced transfer learning capabilities, to improve diagnostic accuracy. Additionally, incorporating explainability techniques into these models will be essential for building trust and adoption among clinicians. Finally, future research should also prioritize the expansion of the clinical dataset to improve model generalizability and reduce the risk of overfitting, especially in real-world scenarios with diverse patient populations.
In conclusion, the combination of infrared thermography and AI represents a transformative step toward modernizing diabetic foot care, offering efficient, patient-friendly diagnostic solutions with the potential to significantly improve global health outcomes for individuals with diabetes.

Author Contributions

Conceptualization, A.S.L. and I.U.-E.; methodology, A.S.L.; software, A.S.L.; validation, A.S.L. and A.J.-C.; investigation, A.S.L.; clinical study, J.L.L.-M., A.T.-G. and I.S.-C.; writing—original draft, A.S.L.; writing—review and editing, A.S.L., R.R.-B. and S.G.-C.; supervision, R.R.-B. and S.G.-C. All authors have read and agreed to the published version of the manuscript.

Funding

This research received no external funding.

Institutional Review Board Statement

The study was conducted in accordance with the Declaration of Helsinki, and approved by the Institutional Review Board CEIM HOSPITAL CLÍNICO SAN CARLOS (protocol code C.I. 23/060-E and date of approval 25 January 2023).

Informed Consent Statement

Informed consent was obtained from all subjects involved in the study.

Data Availability Statement

The raw data supporting the conclusions of this article will be made available by the authors upon request.

Conflicts of Interest

The authors declare no conflicts of interest.

References

  1. Arias-Rodríguez, F.D.; Jiménez-Valdiviezo, M.A.; del Cisne-Ríos-Criollo, K.; Murillo-Araujo, G.P.; Toapanta-Allauca, D.S.; Rubio-Laverde, K.A.; Barreno-Yandún, Y.P.; Moposita-Alvarado, M.M.; Trejo-Pincay, M.B. Pie diabético. Actualización en diagnóstico y tratamiento. Rev. Bibliográfica Angiol. 2023, 75, 242–258. [Google Scholar]
  2. Feldman, E.L.; Callaghan, B.C.; Pop-Busui, R.; Zochodne, D.W.; Wright, D.E.; Bennett, D.L.; Bril, V.; Russell, J.W.; Viswanathan, V. Diabetic neuropathy. Nat. Rev. Dis. Prim. 2019, 5, 41. [Google Scholar] [CrossRef] [PubMed]
  3. Petropoulos, I.N.; Ponirakis, G.; Khan, A.; Almuhannadi, H.; Gad, H.; Malik, R.A. Diagnosing diabetic neuropathy: Something old, something new. Diabetes Metab. J. 2018, 42, 255. [Google Scholar] [CrossRef] [PubMed]
  4. Houghton, J.S.; Saratzis, A.N.; Sayers, R.D.; Haunton, V.J. New Horizons in Peripheral Artery Disease. Age Ageing 2024, 53, afae114. [Google Scholar] [CrossRef] [PubMed]
  5. Peripheral Arterial Disease: Diagnosis and Management: [A] Evidence Review for Determining Diagnosis and Severity of PAD in People with Diabetes; National Institute for Health and Care Excellence (NICE): London, UK, 2018. [PubMed]
  6. Wang, F.; Zhang, J.; Yu, J.; Liu, S.; Zhang, R.; Ma, X.; Yang, Y.; Wang, P. Diagnostic accuracy of monofilament tests for detecting diabetic peripheral neuropathy: A systematic review and meta-analysis. J. Diabetes Res. 2017, 2017, 8787261. [Google Scholar] [CrossRef] [PubMed]
  7. Cerqueira, M.M.B.D.F.; Bastos, N.S.S.G.; Silva, D.A.R.D.; Gregori, D.; Magalhães, L.B.N.C.; Pimentel, M.M.W. Accuracy of ankle-brachial index in screening for peripheral arterial disease in people with diabetes. PLoS ONE 2024, 19, e0309083. [Google Scholar] [CrossRef] [PubMed]
  8. Hardy, J.D. The radiation of heat from the human body: I. J. Clin. Investig. 1934, 13, 593–604. [Google Scholar] [CrossRef] [PubMed]
  9. Zhou, Q.; Qian, Z.; Wu, J.; Liu, J.; Ren, L.; Ren, L. Early diagnosis of diabetic peripheral neuropathy based on infrared thermal imaging technology. Diabetes/Metab. Res. Rev. 2021, 37, e3429. [Google Scholar] [CrossRef] [PubMed]
  10. Padierna, L.C.; Amador-Medina, L.F.; Murillo-Ortiz, B.O.; Villaseñor-Mora, C. Classification method of peripheral arterial disease in patients with type 2 diabetes mellitus by infrared thermography and machine learning. Infrared Phys. Technol. 2020, 111, 103531. [Google Scholar] [CrossRef]
  11. Viegas, F.; Mello, M.T.D.; Rodrigues, S.A.; Costa, C.M.A.; Freitas, L.D.S.N.; Rodrigues, E.L.; Silva, A. The use of thermography and its control variables: A systematic review. Rev. Bras. Med. Esporte 2020, 26, 82–86. [Google Scholar] [CrossRef]
  12. Villa, E.; Arteaga-Marrero, N.; Ruiz-Alzola, J. Performance assessment of low-cost thermal cameras for medical applications. Sensors 2020, 20, 1321. [Google Scholar] [CrossRef] [PubMed]
  13. Hernandez-Contreras, D.A.; Peregrina-Barreto, H.; de Jesus Rangel-Magdaleno, J.; Renero-Carrillo, F.J. Plantar thermogram database for the study of diabetic foot complications. IEEE Access 2019, 7, 161296–161307. [Google Scholar] [CrossRef]
  14. O’Shea, K.; Nash, R. An Introduction to Convolutional Neural Networks. arXiv 2015, arXiv:1511.08458v2. [Google Scholar]
  15. Weiss, K.; Khoshgoftaar, T.M.; Wang, D. A survey of transfer learning. J. Big Data 2016, 3, 9. [Google Scholar] [CrossRef]
  16. He, K.; Zhang, X.; Ren, S.; Sun, J. Deep residual learning for image recognition. In Proceedings of the IEEE Conference on Computer Vision and Pattern Recognition, Las Vegas, NV, USA, 27–30 June 2016; pp. 770–778. [Google Scholar]
  17. Howard, A.G. Mobilenets: Efficient convolutional neural networks for mobile vision applications. arXiv 2017, arXiv:1704.04861. [Google Scholar]
  18. Tan, M.; Le, Q. Efficientnet: Rethinking model scaling for convolutional neural networks. In Proceedings of the International Conference on Machine Learning, PMLR, Long Beach, CA, USA, 9–15 June 2019; pp. 6105–6114. [Google Scholar]
  19. Dosovitskiy, A. An image is worth 16x16 words: Transformers for image recognition at scale. arXiv 2020, arXiv:2010.11929. [Google Scholar]
  20. Aburass, S.; Dorgham, O.; Al Shaqsi, J.; Abu Rumman, M.; Al-Kadi, O. Vision Transformers in Medical Imaging: A Comprehensive Review of Advancements and Applications Across Multiple Diseases. J. Imaging Inform. Med. 2025. [Google Scholar] [CrossRef]
  21. Dhamnetiya, D.; Jha, R.P.; Shalini, S.; Bhattacharyya, K. How to Analyze the Diagnostic Performance of a New Test? Explained with Illustrations. J. Lab. Physicians 2022, 14, 90–98. [Google Scholar] [CrossRef] [PubMed]
Figure 1. Examples of captured thermographic images.
Applsci 15 05886 g001
Figure 2. Examples of thermographic images processed: (a) original image; (b) processed image. The acquired images were processed to automatically segment the soles of the feet and to dynamically adjust the thermal scale based on the maximum and minimum temperature values detected in both limbs. The numbers indicate the temperature ranges and associated colors in the original image and in the processed image.
Applsci 15 05886 g002
Figure 3. CNN network architecture. After data augmentation, the input images were entered in the base model (which can be ResNet-50, MobileNet V1 or EfficientNetV2 B0); then, a 2D global average pooling and a dropout layer were added, followed by a dense layer for classification.
Applsci 15 05886 g003
Figure 4. Visual transformer conceptual model. We divided an image into fixed-size patches, applied a linear embedding to each patch, incorporated position embeddings, and inputted the resulting sequence of vectors into a standard transformer encoder. For classification, we followed the conventional method of appending an additional learnable “classification token” to the sequence.
Applsci 15 05886 g004
Figure 5. Color image processed by the patcher layer. The image was divided into fixed-size patches.
Applsci 15 05886 g005
Table 1. Patient distribution by pathology.
PathologyNumber of Patients%
Healthy117.49
Not Healthy13692.51
Total147100
Table 2. Patient distribution in the final balanced dataset.
PathologyNumber of Patients%
Healthy5629.17
Not Healthy13670.83
Total192100
Table 3. Training, validation, and test sets division (before and after data augmentation).
Before Data Augmentation
DatasetNumber of Images
Training Healthy16
Training Not Healthy92
Validation Healthy20
Validation Not Healthy24
Test Not healthy20
Test healthy20
Total192
After Data Augmentation
DatasetNumber of Images
Training Healthy88
Training Not Healthy92
Validation Healthy20
Validation Not Healthy24
Test Healthy20
Test Not Healthy20
Total264
Table 4. List of metrics for measuring diagnostic accuracy.
Performance MetricsDescription
AccuracyIt is the proportion of correctly classified cases relative to all evaluated cases. This serves as a general measure of the diagnostic accuracy of the model.
SensitivityIt is the proportion of true positives (TP, patients with the disease correctly classified as positive by the AI) relative to all positive cases (TP + false negatives FN). In other words, it is calculated as (TP/TP + FN) and measures the model’s ability to correctly detect the disease in patients who have it.
SpecificityIt is the proportion of true negatives (TN, patients without the disease correctly classified as negative by the AI) relative to all negative cases (TN + false positives FP). In other words, it is calculated as (TN/TN + FP) and measures the model’s ability to correctly exclude the disease in patients who do not have it.
Precision or True Positive Rate (TPR)It is the proportion of true positives relative to all positive test results (TP/TP + FP). In other words, it measures the probability that a patient who is evaluated positive actually has the disease.
True Negative Rate (TNR)It is the proportion of true negatives relative to all negative test results (TN/TN + FN). In other words, it measures the probability that a patient who is evaluated negative truly does not have the disease.
Table 5. List of CNN metrics for the validation dataset.
Performance MetricResNet-50MobileNet V1EfficientNetV2 B0
Accuracy0.97730.95450.9545
Sensitivity1.00000.95830.9583
Specificity0.95000.95000.9500
Precision or True Positive Rate (TPR)0.96000.95830.9583
True Negative Rate (TNR)1.00000.95000.9500
True Positives242323
True Negatives191919
False Positives111
False Negatives011
Table 6. List of CNN metrics for the test dataset.
Performance MetricResNet-50MobileNet V1EfficientNetV2 B0
Accuracy0.95000.90000.9250
Sensitivity1.00001.00001.0000
Specificity0.90000.80000.8500
Precision or True Positive Rate (TPR)0.90910.83330.8696
True Negative Rate (TNR)1.00001.00001.0000
True Positives202020
True Negatives181617
False Positives243
False Negatives000
Table 7. List of ViT metrics for the validation dataset.
Performance MetricViT
Accuracy0.9545
Sensitivity1.0000
Specificity0.9000
Precision or True Positive Rate (TPR)0.9231
True Negative Rate (TNR)1.0000
True Positives24
True Negatives18
False Positives2
False Negatives0
Table 8. List of ViT metrics for the test dataset.
Performance MetricViT
Accuracy0.8000
Sensitivity1.0000
Specificity0.6000
Precision or True Positive Rate (TPR)0.7143
True Negative Rate (TNR)1.0000
True Positives20
True Negatives12
False Positives8
False Negatives0
Disclaimer/Publisher’s Note: The statements, opinions and data contained in all publications are solely those of the individual author(s) and contributor(s) and not of MDPI and/or the editor(s). MDPI and/or the editor(s) disclaim responsibility for any injury to people or property resulting from any ideas, methods, instructions or products referred to in the content.

