
Reliability of the Fluorescence-Sensitive Optical Sensor Measurement of TcPO2 and Susceptibility to Pressure Injury Around the Foot


Abstract
1. Introduction
2. Materials and Methods
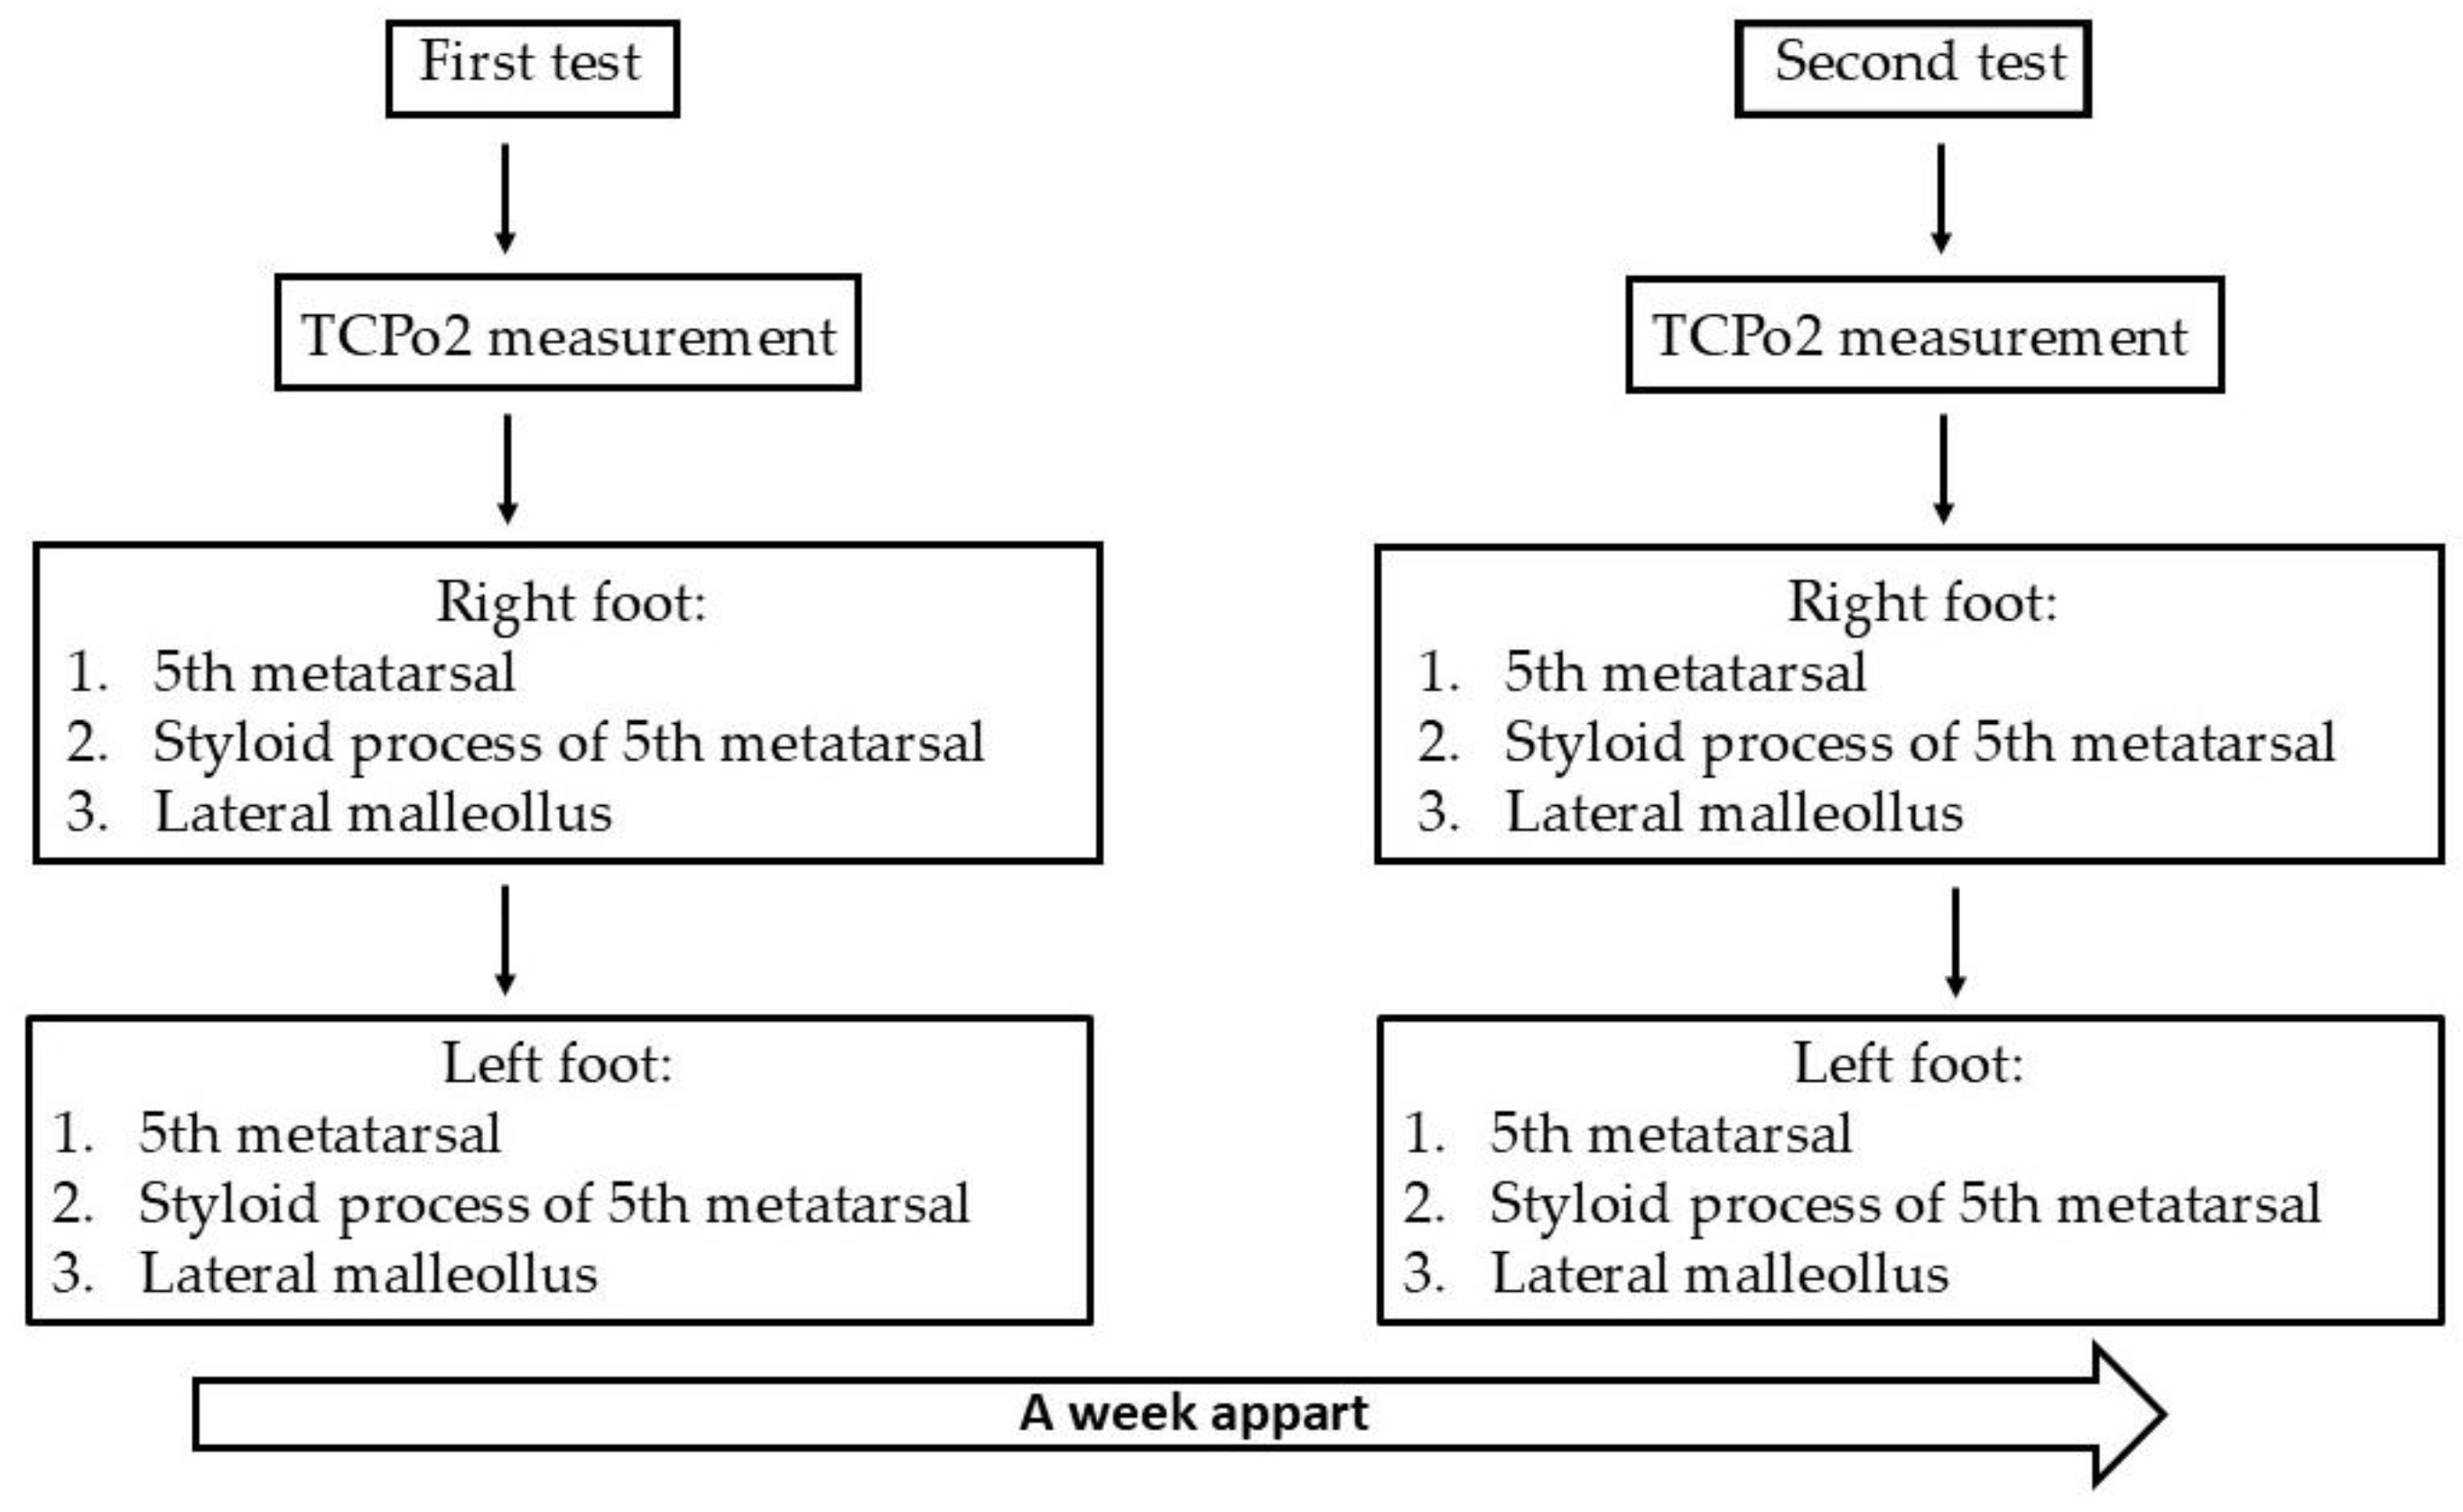
2.1. Study Design
2.2. Participants
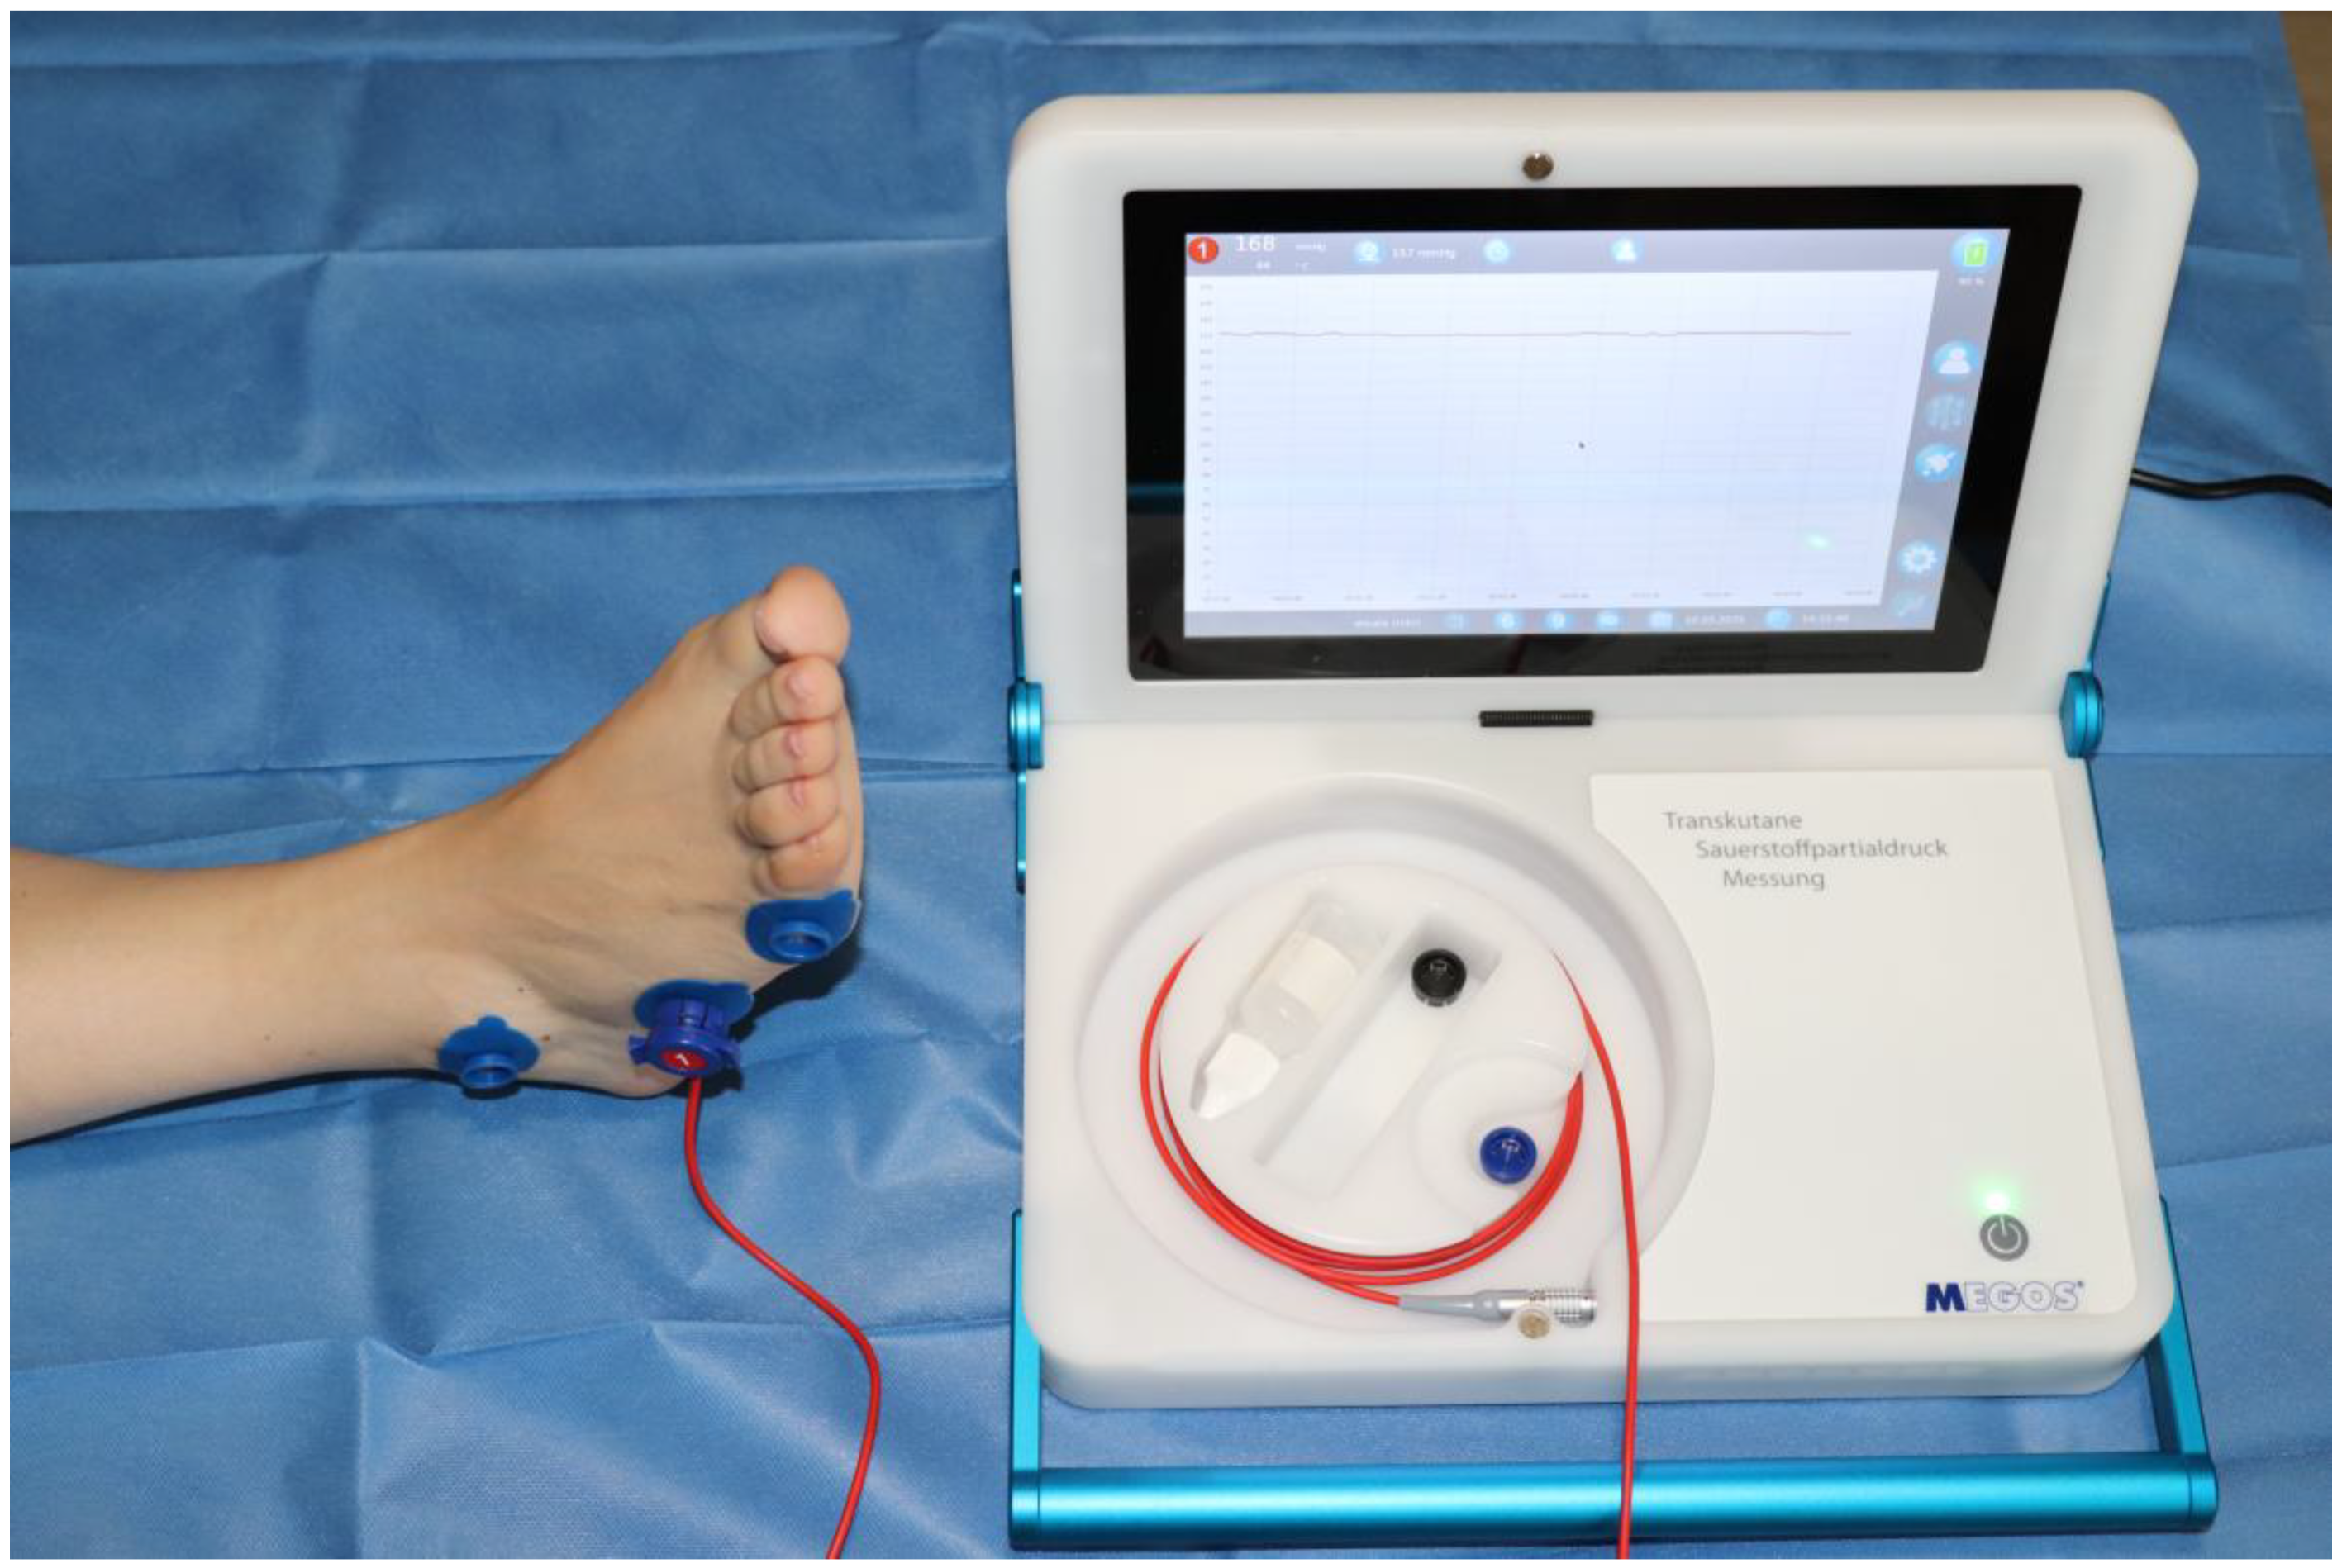
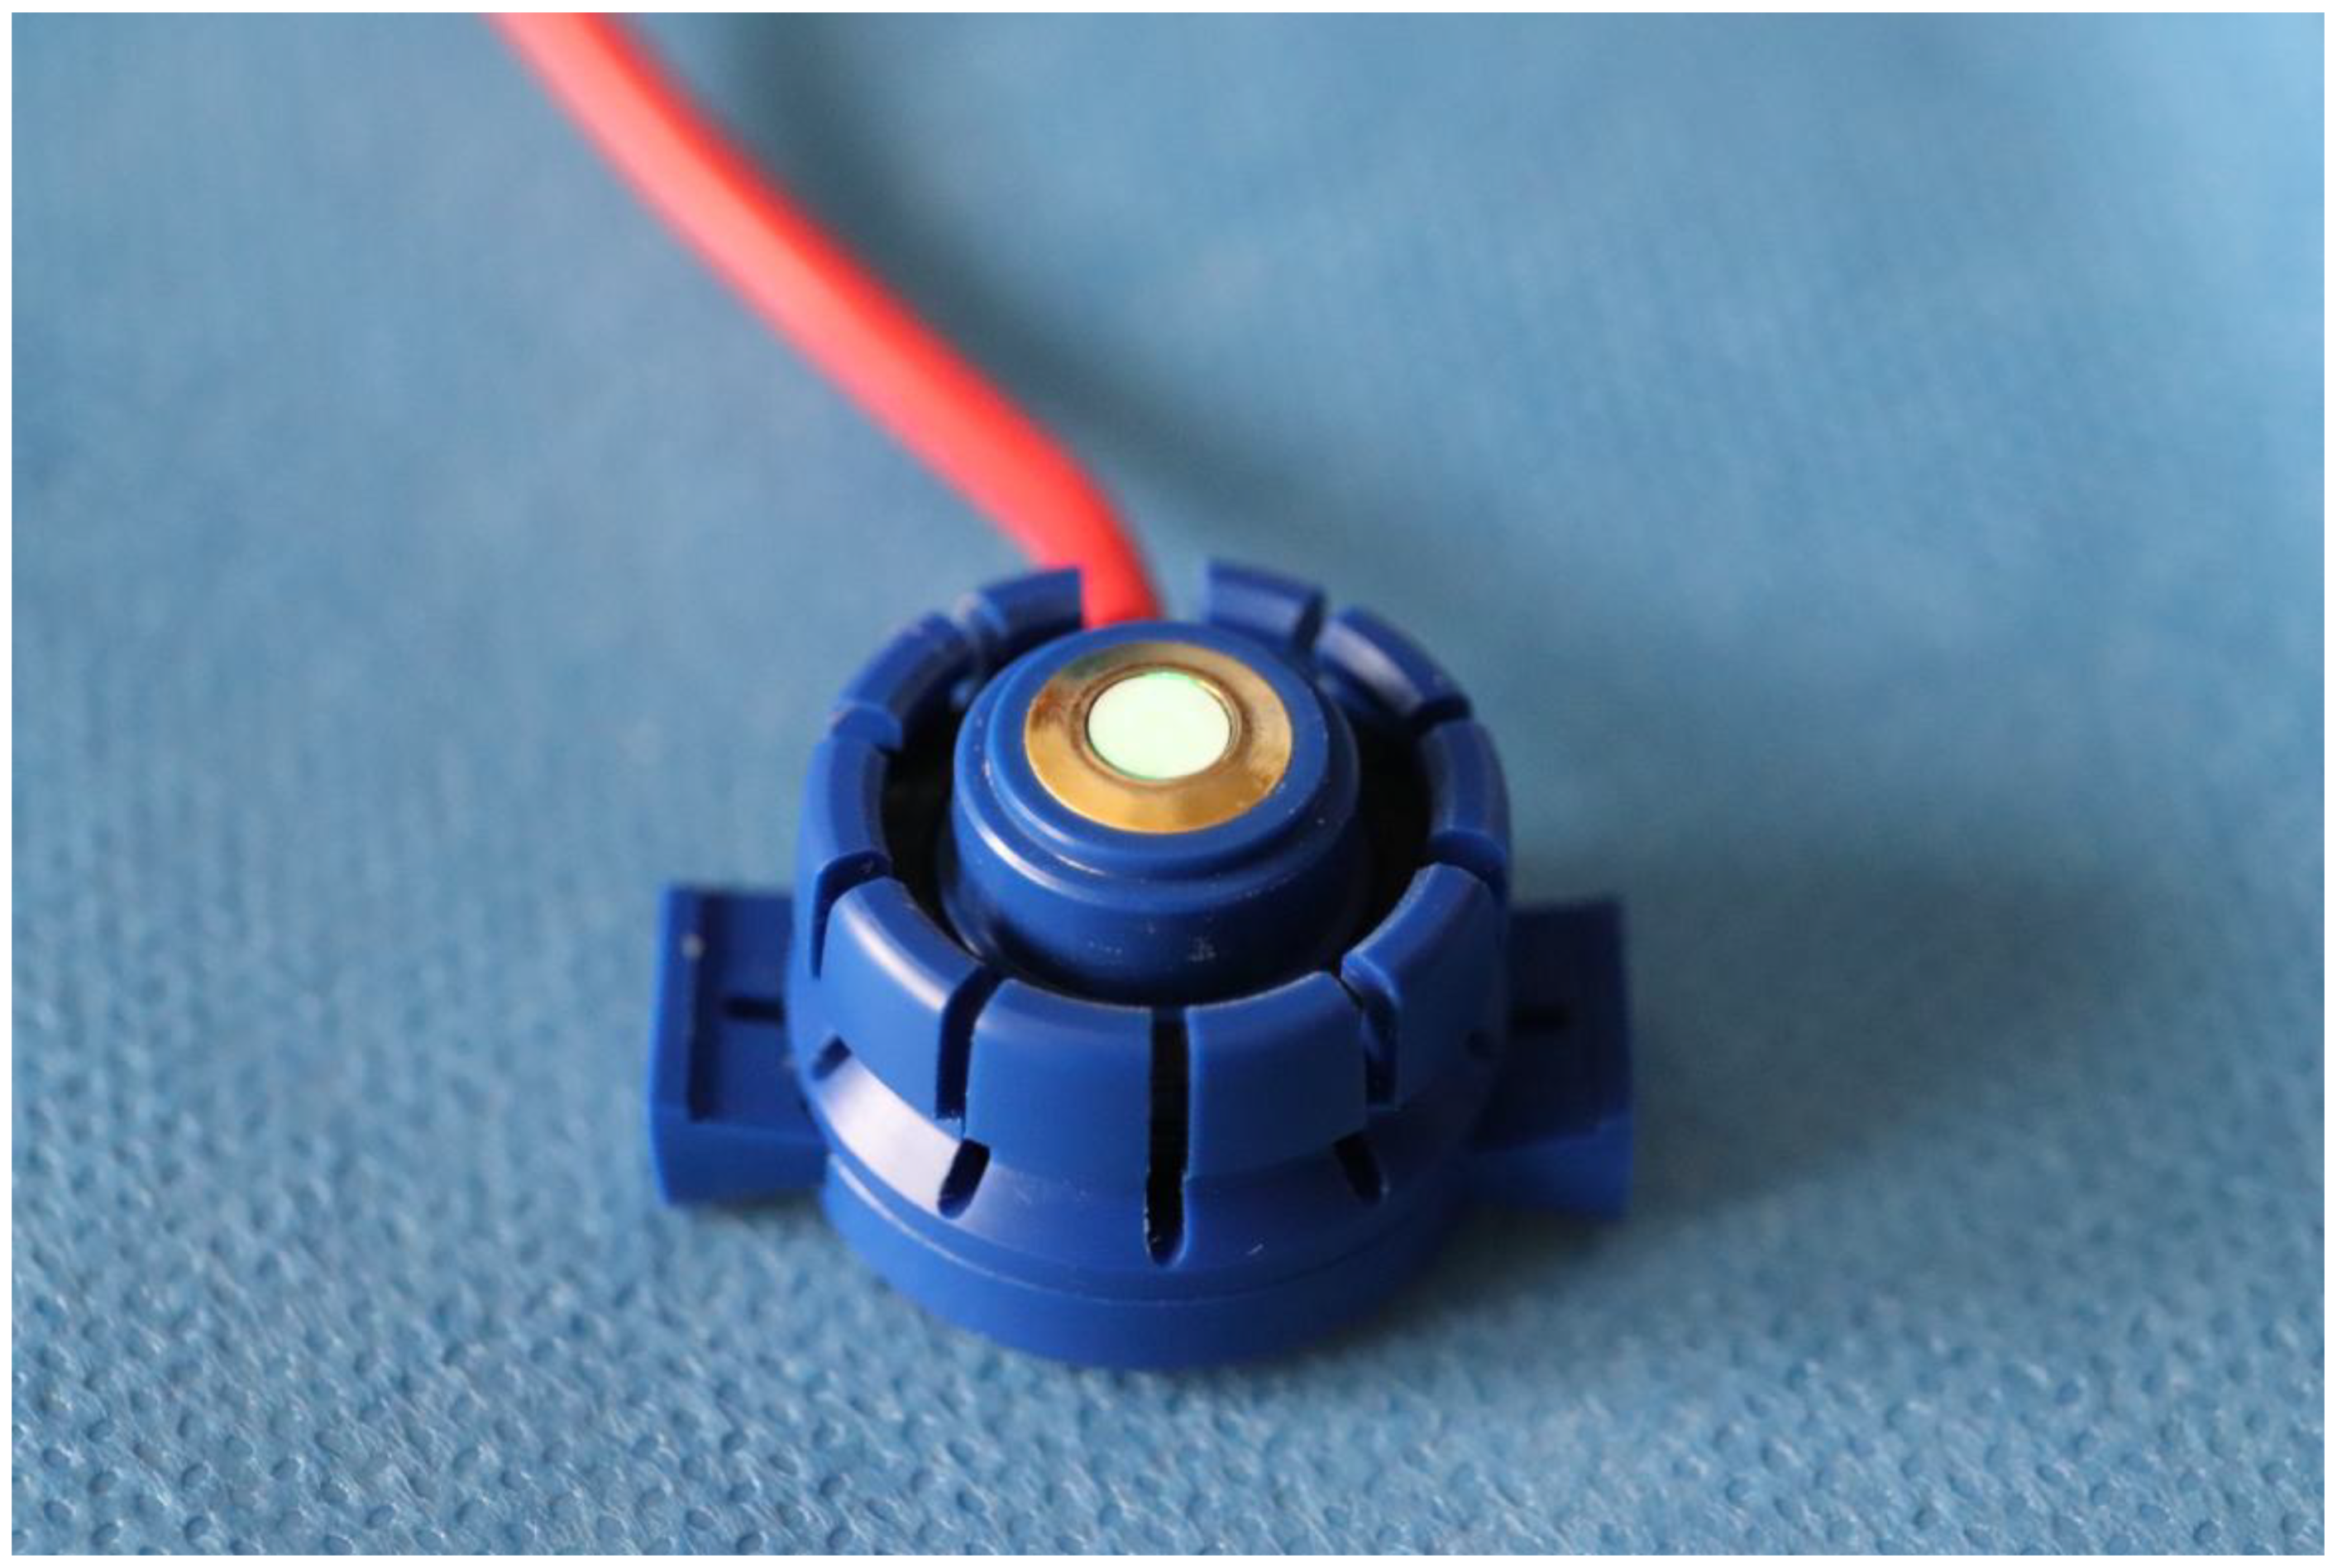
2.3. Materials
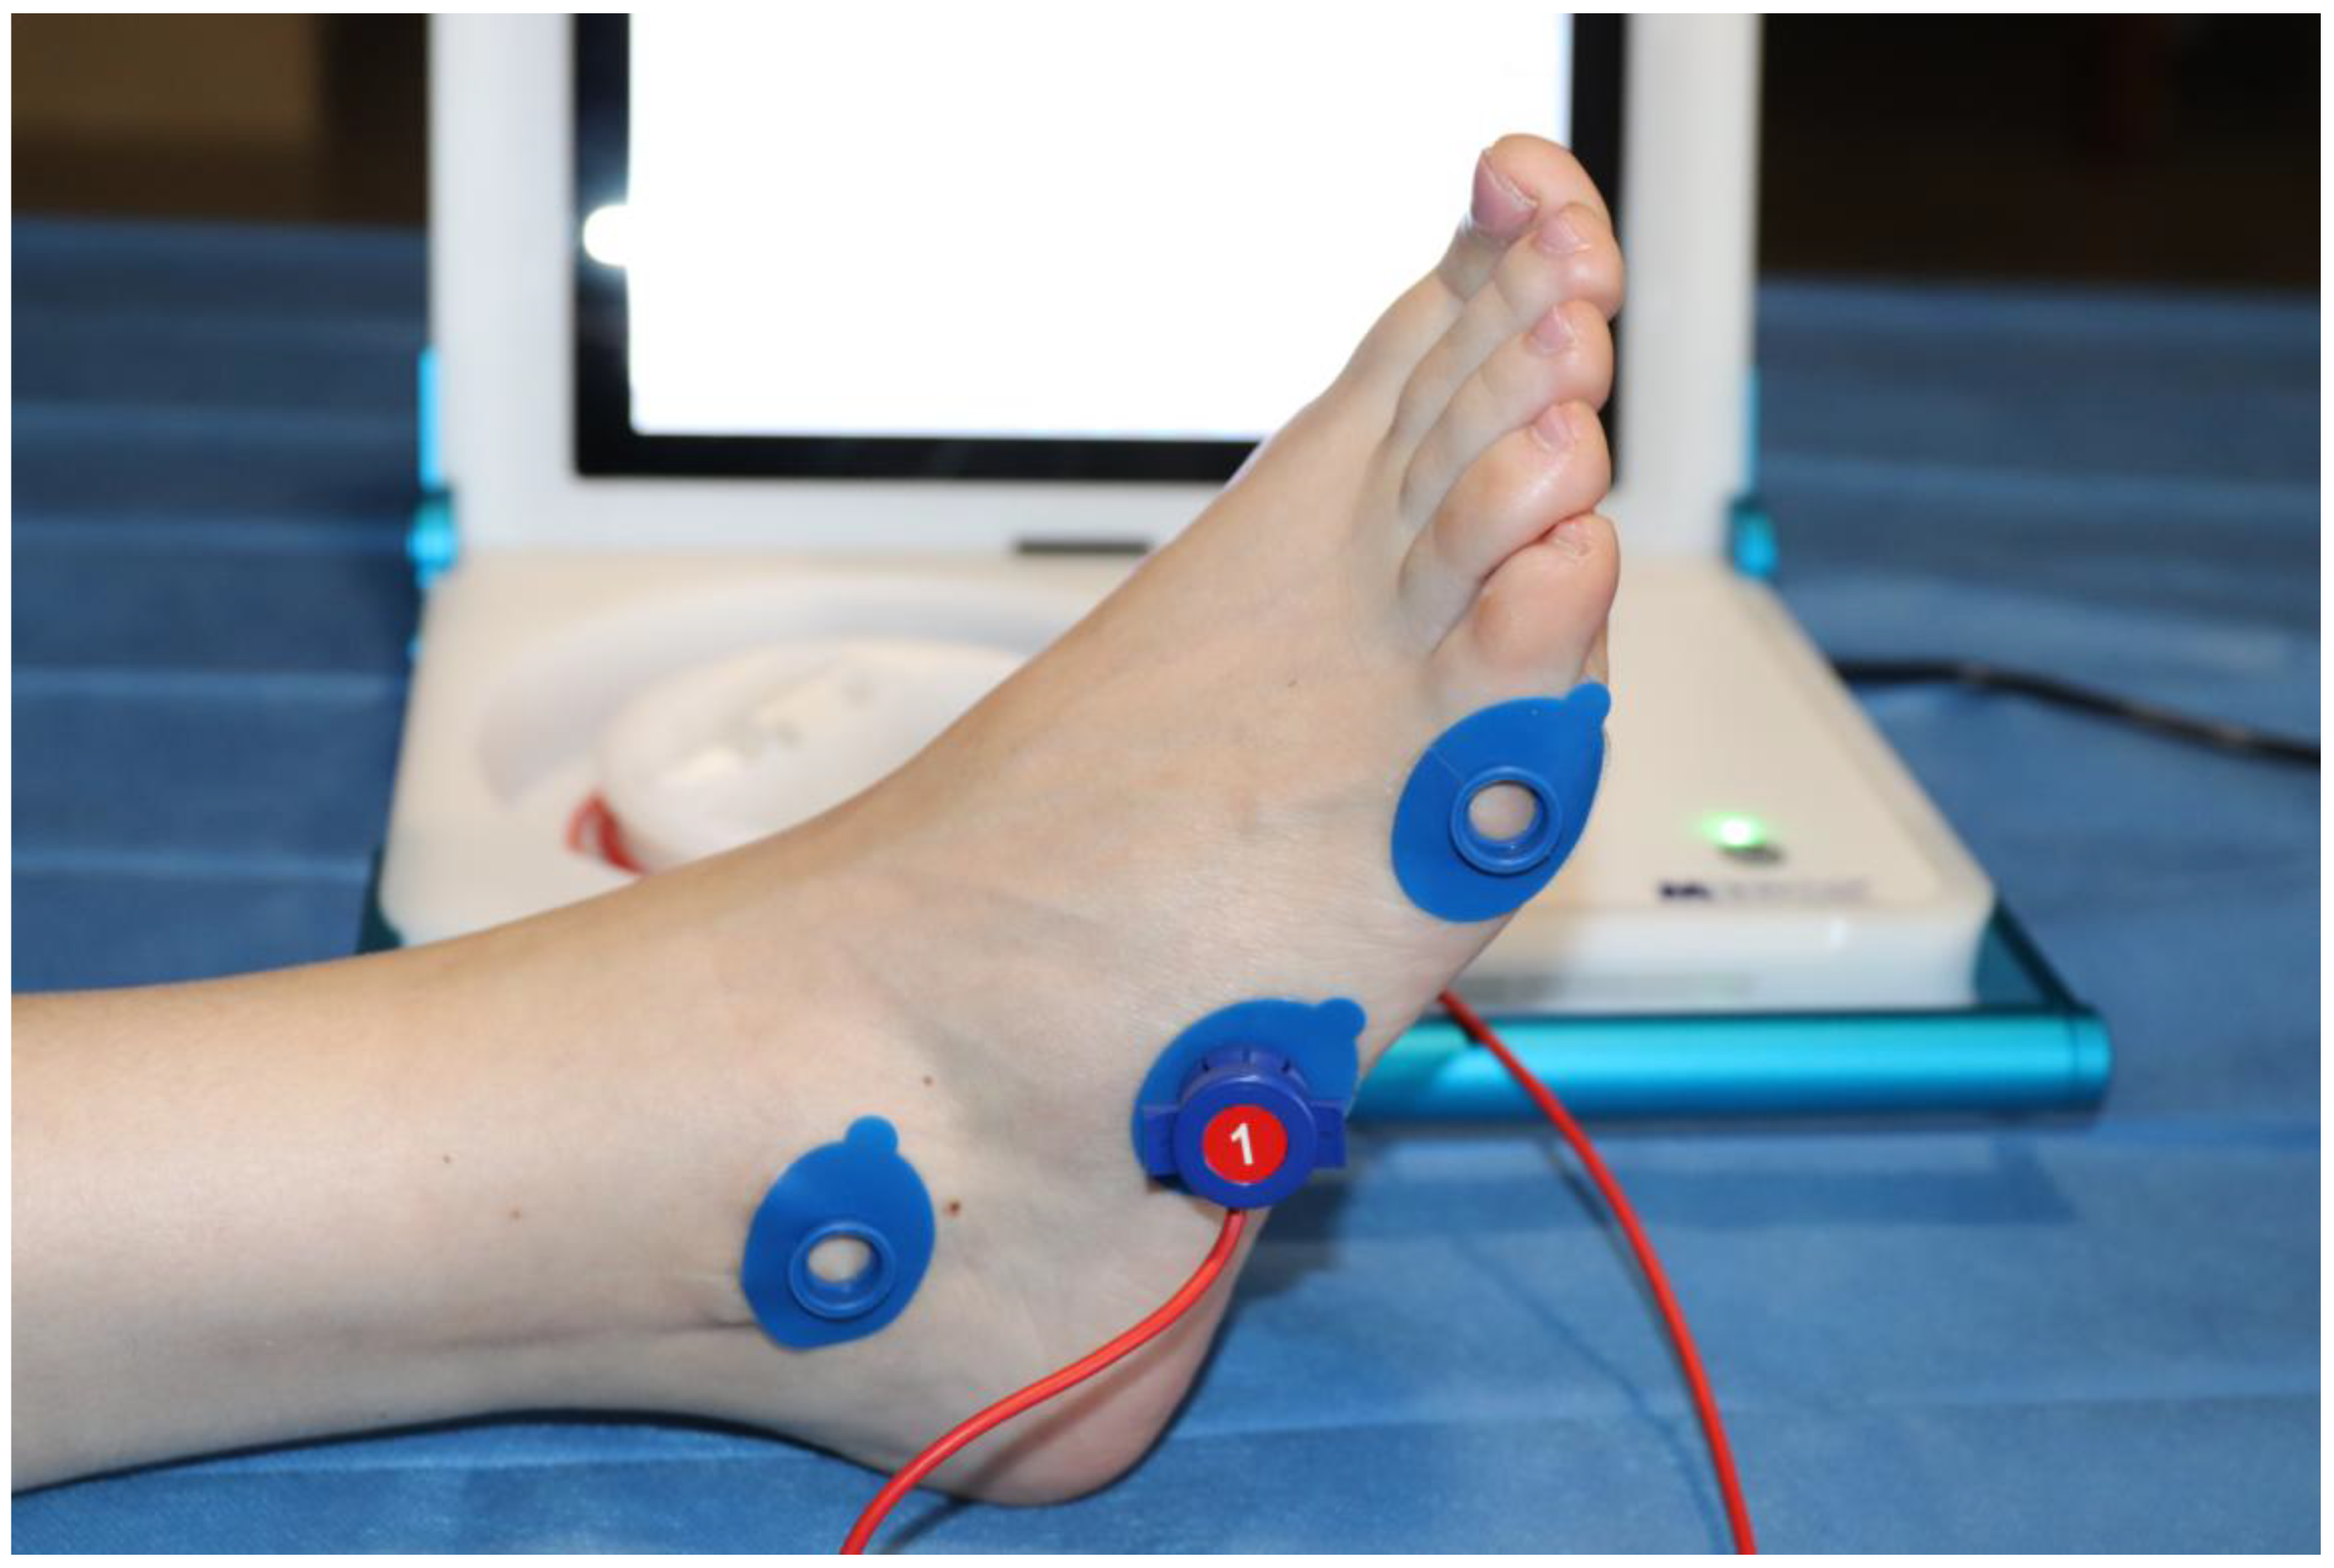
2.4. Procedure
2.5. Statistical Analysis
3. Results
4. Discussion
5. Conclusions
Author Contributions
Funding
Institutional Review Board Statement
Informed Consent Statement
Data Availability Statement
Conflicts of Interest
References
- Edsberg, L.E.; Black, J.M.; Goldberg, M.; McNichol, L.; Moore, L.; Sieggreen, M. Revised National Pressure Ulcer Advisory Panel Pressure Injury Staging System: Revised Pressure Injury Staging System. J. Wound Ostomy Cont. Nurs. 2016, 43, 585–597. [Google Scholar] [CrossRef] [PubMed]
- Mervis, J.S.; Phillips, T.J. Pressure ulcers: Pathophysiology, epidemiology, risk factors, and presentation. J. Am. Acad. Dermatol. 2019, 81, 881–890. [Google Scholar] [CrossRef]
- Khor, H.M.; Tan, J.; Saedon, N.I.; Kamaruzzaman, S.B.; Chin, A.V.; Poi, P.J.; Tan, M.P. Determinants of mortality among older adults with pressure ulcers. Arch. Gerontol. Geriatr. 2014, 59, 536–541. [Google Scholar] [CrossRef]
- Noie, A.; Jackson, A.C.; Taheri, M.; Sayadi, L.; Bahramnezhad, F. Determining the frequency of pressure ulcers incidence and associated risk factors in critical care patients: A 3-year retrospective study. Int. Wound J. 2024, 21, e70120. [Google Scholar] [CrossRef]
- Xiao, F.; Peng, H.; Li, Y. The preventive effect of seamless nursing care on pressure ulcer and related complications in elderly inpatients. Am. J. Transl. Res. 2021, 13, 3515–3521. [Google Scholar]
- Moore, Z.; Avsar, P.; Conaty, L.; Moore, D.H.; Patton, D.; O’Connor, T. The prevalence of pressure ulcers in Europe, what does the European data tell us: A systematic review. J. Wound Care 2019, 28, 710–719. [Google Scholar] [CrossRef]
- García-Fernández, F.P.; Soldevilla-Agreda, J.J.; Pancorbo-Hidalgo, P.L.; Torra-Bou, J.E.; López-Franco, M.D. Prevalencia de las lesiones cutáneas relacionadas con la dependencia en adultos hospitalizados en España: Resultados del 6.o Estudio Nacional del GNEAUPP 2022. Gerokomos 2023, 34, 250–259. [Google Scholar]
- Torra-Bou, J.E.; Soldevilla-Agreda, J.J.; Pancorbo-Hidalgo, P.L.; López-Franco, M.D.; García-Fernández, F.P. Prevalencia de las lesiones cutáneas relacionadas con la dependencia en residencias de mayores y centros sociosanitarios de España: Resultados del 6.o Estudio Nacional del GNEAUPP 2022. Gerokomos 2023, 34, 269–276. [Google Scholar]
- Dehghani, M.; Pourmontaseri, H. Aetiology, risk factors and treatment of typical and atypical pressure ulcers in patients with traumatic brain injury: A narrative review. Int. Wound J. 2024, 21, e14788. [Google Scholar] [CrossRef]
- Hoogendoorn, I.; Reenalda, J.; Koopman, B.F.J.M.; Rietman, J.S. The effect of pressure and shear on tissue viability of human skin in relation to the development of pressure ulcers: A systematic review. J. Tissue Viability 2017, 26, 157–171. [Google Scholar] [CrossRef]
- Catella, J.; Mahé, G.; Leftheriotis, G.; Long, A. Reference Probe for TcpO2 at Rest: A Systematic Review. Diagnostics 2022, 13, 77. [Google Scholar] [CrossRef] [PubMed]
- Willems, S.A.; Nieuwstraten, J.A.; Schepers, A.; van Schaik, J.; van den Hoven, P.; van der Vorst, J.R.; Hamming, J.F.; Brouwers, J.J.W. Prognostic performance of bedside tests for predicting ulcer healing and wound healing after minor amputation in patients prone to medial arterial calcification: A systematic review. Vasc. Med. 2025, 30, 250–260. [Google Scholar] [CrossRef] [PubMed]
- Yip, W.L. Evaluation of the clinimetrics of transcutaneous oxygen measurement and its application in wound care. Int. Wound J. 2015, 12, 625–629. [Google Scholar] [CrossRef]
- Catella, J.; Long, A.; Mazzolai, L. What Is Currently the Role of TcPO2 in the Choice of the Amputation Level of Lower Limbs? A Comprehensive Review. J. Clin. Med. 2021, 10, 1413. [Google Scholar] [CrossRef] [PubMed]
- Leenstra, B.; de Kleijn, R.; Kuppens, G.; Verhoeven, B.A.N.; Hinnen, J.W.; de Borst, G.J. Photo-Optical Transcutaneous Oxygen Tension Measurement Is of Added Value to Predict Diabetic Foot Ulcer Healing: An Observational Study. J. Clin. Med. 2020, 9, 3291. [Google Scholar] [CrossRef]
- Leenstra, B.S.; Kuppens, G.Z.L.; van Bergen, A.; de Kleijn, R.; de Borst, G.J.; Verhoeven, B. Comparison of Photo-optical Transcutaneous Oxygen Tension Measurement with Electro-Chemical Transcutaneous Oxygen Tension Measurement in Patients with Arterial Claudication. Ann. Vasc. Surg. 2021, 77, 274–279. [Google Scholar] [CrossRef]
- López-Moral, M.; García-Madrid, M.; Molines-Barroso, R.J.; García-Álvarez, Y.; Tardáguila-García, A.; Lázaro-Martínez, J.L. Analyses of transcutaneous oxygen pressure values stratified for foot angiosomes to predict diabetic foot ulcer healing. J. Tissue Viability 2023, 32, 480–486. [Google Scholar] [CrossRef]
- Bucki, M.; Luboz, V.; Perrier, A.; Champion, E.; Diot, B.; Vuillerme, N.; Payan, Y. Clinical workflow for personalized foot pressure ulcer prevention. Med. Eng. Phys. 2016, 38, 845–853. [Google Scholar] [CrossRef]
- Sugathapala, R.D.U.P.; Latimer, S.; Balasuriya, A.; Chaboyer, W.; Thalib, L.; Gillespie, B.M. Prevalence and incidence of pressure injuries among older people living in nursing homes: A systematic review and meta-analysis. Int. J. Nurs. Stud. 2023, 148, 104605. [Google Scholar] [CrossRef]
- Daviet, J.-C.; Dudognon, P.; Preux, P.-M.; Rebeyrotte, I.; Lacroix, P.; Munoz, M.; Salle, J.-Y. Reliability of transcutaneous oxygen tension measurement on the back of the hand and complex regional pain syndrome after stroke1. Arch. Phys. Med. Rehabil. 2004, 85, 1102–1105. [Google Scholar] [CrossRef]
- Gélis, A.; Fattal, C.; Dupeyron, A.; Pérez-Martin, A.; Colin, D.; Pelissier, J. Reproducibility of Transcutaneous Oxygen Pressure Measurements in Persons with Spinal Cord Injury. Arch. Phys. Med. Rehabil. 2009, 90, 507–511. [Google Scholar] [CrossRef] [PubMed]
- Henni, S.; Semporé, Y.W.; Le Meliner, T.; Ouedraogo, N.; Hamel, J.F.; Abraham, P. Intra-test and test-retest reliability of exercise oximetry in arterial claudication. Microvasc. Res. 2018, 117, 44–49. [Google Scholar] [CrossRef]
- Henni, S.; Hersant, J.; Ammi, M.; Mortaki, F.-E.; Picquet, J.; Feuilloy, M.; Abraham, P. Microvascular Response to the Roos Test Has Excellent Feasibility and Good Reliability in Patients with Suspected Thoracic Outlet Syndrome. Front. Physiol. 2019, 10, 136. [Google Scholar] [CrossRef] [PubMed]
- Laroche, D.; Barnay, J.L.; Tourlonias, B.; Orta, C.; Obert, C.; Casillas, J.M. Microcirculatory Assessment of Arterial Below-Knee Stumps: Near-Infrared Spectroscopy Versus Transcutaneous Oxygen Tension-A Preliminary Study in Prosthesis Users. Arch. Phys. Med. Rehabil. 2017, 98, 1187–1194. [Google Scholar] [CrossRef]
- Bouyé, P.; Picquet, J.; Jaquinandi, V.; Enon, B.; Leftheriotis, G.; Saumet, J.-L.; Abraham, P. Reproducibility of proximal and distal transcutaneous oxygen pressure measurements during exercise in stage 2 arterial claudication. Int. Angiol. 2004, 23, 114–121. [Google Scholar]
- Tueguem Moyo, T.; Jéhannin, P.; Le Pabic, E.; Le Faucheur, A.; Omarjee, L.; Mahe, G. Test-retest Reliability and Minimal Detectable Change in Exercise Oximetry in Claudicants. Ann. Vasc. Surg. 2024, 99, 19–25. [Google Scholar] [CrossRef]
- Munro, B.H. Statistical Methods for Health Care Research; Lippincott Williams & Wilkins: Philadelphia, PA, USA, 2005; 518p. [Google Scholar]
- Walter, S.D.; Eliasziw, M.; Donner, A. Sample size and optimal designs for reliability studies. Stat. Med. 1998, 17, 101–110. [Google Scholar] [CrossRef]
- Pavlů, D.; Pánek, D.; Kuncová, E.; Thung, J.S. Effect of Blood Circulation in the Upper Limb after Flossing Strategy. Appl. Sci. 2021, 11, 1634. [Google Scholar] [CrossRef]
- Serdar, C.C.; Cihan, M.; Yücel, D.; Serdar, M.A. Sample size, power and effect size revisited: Simplified and practical approaches in pre-clinical, clinical and laboratory studies. Biochem. Medica 2021, 31, 010502. [Google Scholar] [CrossRef]
- Atkinson, G.; Nevill, A.M. Statistical Methods for Assessing Measurement Error (Reliability) in Variables Relevant to Sports Medicine. Sports Med. 1998, 26, 217–238. [Google Scholar] [CrossRef]
- Koo, T.K.; Li, M.Y. A Guideline of Selecting and Reporting Intraclass Correlation Coefficients for Reliability Research. J. Chiropr. Med. 2016, 15, 155–163. [Google Scholar] [CrossRef] [PubMed]
- Gerke, O. Reporting Standards for a Bland-Altman Agreement Analysis: A Review of Methodological Reviews. Diagnostics 2020, 10, 334. [Google Scholar] [CrossRef]
- Andrades-Ramírez, O.; Ulloa-Díaz, D.; Rodríguez-Perea, A.; Araya-Sierralta, S.; Guede-Rojas, F.; Muñoz-Bustos, G.; CHIROSA RÍOS, L.J. Test–Retest Reliability of Concentric and Eccentric Muscle Strength in Knee Flexion–Extension Controlled by Functional Electromechanical Dynamometry in Female Soccer. Appl. Sci. 2024, 14, 8744. [Google Scholar] [CrossRef]
- Shonat, R.D.; Johnson, P.C. Oxygen tension gradients and heterogeneity in venous microcirculation: A phosphorescence quenching study. Am. J. Physiol.-Heart Circ. Physiol. 1997, 272, H2233–H2240. [Google Scholar] [CrossRef]
- Torres Filho, I.P.; Intaglietta, M. Microvessel PO2 measurements by phosphorescence decay method. Am. J. Physiol-Heart Circ. Physiol. 1993, 265, H1434–H1438. [Google Scholar] [CrossRef]
- Urban, M.; Fouasson-Chailloux, A.; Signolet, I.; Colas Ribas, C.; Feuilloy, M.; Abraham, P. Comparison of two devices for measuring exercise transcutaneous oxygen pressures in patients with claudication. VASA 2015, 44, 355–362. [Google Scholar] [CrossRef]
- Leenstra, B.S.; Meerkerk, C.; Conte, M.; Hinnen, J.W.; de Borst, G.J.; Verhoeven, B. Feasibility of Photo-Optical Transcutaneous Oxygen Tension Measurement During Revascularization of the Lower Extremity. Ann. Vasc. Surg. 2021, 77, 127–131. [Google Scholar] [CrossRef]
- Chai, C.Y.; Sadou, O.; Worsley, P.R.; Bader, D.L. Pressure signatures can influence tissue response for individuals supported on an alternating pressure mattress. J. Tissue Viability 2017, 26, 180–188. [Google Scholar] [CrossRef]
- Gómez-González, A.J.; Morilla-Herrera, J.C.; Lupiáñez-Pérez, I.; Morales-Asencio, J.M.; García-Mayor, S.; León-Campos, Á.; Marfil-Gómez, R.; Aranda-Gallardo, M.; Moya-Suárez, A.B.; Kaknani-Uttumchandani, S. Perfusion, tissue oxygenation and peripheral temperature in the skin of heels of healthy participants exposed to pressure: A quasi-experimental study. J. Adv. Nurs. 2020, 76, 654–663. [Google Scholar] [CrossRef]
- Knight, S.L.; Taylor, R.P.; Polliack, A.A.; Bader, D.L. Establishing predictive indicators for the status of loaded soft tissues. J. Appl. Physiol. 2001, 90, 2231–2237. [Google Scholar] [CrossRef]
- Lupiáñez-Pérez, I.; Gómez-González, A.J.; Marfil-Gómez, R.M.; Morales-Asencio, J.M.; García-Mayor, S.; León-Campos, Á.; Kaknani-Uttumchandani, S.; Moya-Suárez, A.B.; Aranda-Gallardo, M.; Morilla-Herrera, J.C. Tissue temperature, flux and oxygen of sacral and trochanteric area under pressure of healthy subjects: A quasi-experimental study. J. Tissue Viability 2021, 30, 207–215. [Google Scholar] [CrossRef] [PubMed]
- Schubert, V. The influence of local heating on skin microcirculation in pressure ulcers, monitored by a combined laser Doppler and transcutaneous oxygen tension probe. Clin. Physiol. 2000, 20, 413–421. [Google Scholar] [CrossRef]
- Alvaro-Afonso, F.J.; Garcia-Alvarez, Y.; Garcia-Morales, E.A.; Flores-Escobar, S.; De Benito-Fernandez, L.; Alfayate-Garcia, J.; Sánchez-Ríos, J.P.; Puras-Mallagray, E.; Malo-Benages, E.J.; Ramírez-Ortega, M.; et al. Determining the Best Noninvasive Test for Peripheral Arterial Disease Diagnosis to Predict Diabetic Foot Ulcer Healing in Patients Following Endovascular Revascularization. Healthcare 2024, 12, 1664. [Google Scholar] [CrossRef]
- Chen, P.; Vilorio, N.C.; Dhatariya, K.; Jeffcoate, W.; Lobmann, R.; McIntosh, C.; Piaggesi, A.; Steinberg, J.; Vas, P.; Viswanathan, V.; et al. Guidelines on interventions to enhance healing of foot ulcers in people with diabetes (IWGDF 2023 update). Diabetes Metab. Res. Rev. 2024, 40, e3644. [Google Scholar] [CrossRef]
- Henshaw, F.R.; Bostan, L.E.; Worsley, P.R.; Bader, D.L. Evaluating the effects of sedentary behaviour on plantar skin health in people with diabetes. J. Tissue Viability 2020, 29, 277–283. [Google Scholar] [CrossRef]
- Nam, H.J.; Wee, S.Y.; Kim, S.Y.; Jeong, H.G.; Lee, D.W.; Byeon, J.; Park, S.; Choi, H.J. The correlation between transcutaneous oxygen pressure (TcPO2) and forward-looking infrared (FLIR) thermography in the evaluation of lower extremity perfusion according to angiosome. Int. Wound J. 2023, 21, e14431. [Google Scholar] [CrossRef]
- Yang, C.; Weng, H.; Chen, L.; Yang, H.; Luo, G.; Mai, L.; Jin, G.; Yan, L. Transcutaneous Oxygen Pressure Measurement in Diabetic Foot Ulcers: Mean Values and Cut-Point for Wound Healing. J. Wound Ostomy Cont. Nurs. 2013, 40, 585–589. [Google Scholar] [CrossRef]
- Falstie-Jensen, N.; Brøchner-Mortensen, J.; Spaun, E.; Falstie-jensen, S. The influence of epidermal thickness on transcutaneous oxygen pressure measurements in normal persons. Scand. J. Clin. Lab. Investig. 1988, 48, 519–523. [Google Scholar] [CrossRef]
- Lübbers, D.W. Theoretical basis of the transcutaneous blood gas measurements. Crit. Care Med. 1981, 9, 721–733. [Google Scholar] [CrossRef]


| Males (n = 13) | Females (n = 17) | |
|---|---|---|
| Age (years) | 58.33 ± 15.36 | 57.53 ± 14.86 |
| Weight (kg) | 79.83 ± 8.89 | 69.65 ± 11.34 |
| Height (cm) | 173.75 ± 5.26 | 160.76 ± 6.30 |
| BMI | 26.51 ± 3.37 | 26.90 ± 3.83 |
| Test | Right Fifth Metatarsal Head | Right Styloid Process of the Fifth Metatarsal | Right Lateral Malleolus | Left Fifth Metatarsal Head | Left Styloid Process of Fifth Metatarsal | Left Lateral Malleolus |
|---|---|---|---|---|---|---|
| First day | 100.62 ± 49.80 | 96.24 ± 38.14 | 82.07 ± 36.43 | 96.52 ± 51.19 | 96.38 ± 41.39 | 82.69 ± 37.70 |
| Second day | 93.38 ± 44.23 | 96.93 ± 43.94 | 74.10 ± 32.72 | 106.14 ± 52.60 | 91.41 ± 37.32 | 81.69 ± 39.59 |
| Anatomical Area | Mean ± SD |
|---|---|
| Right fifth metatarsal head | 21.40 ± 7.79 |
| Right styloid process of the fifth metatarsal | 17.91 ± 7.44 |
| Right lateral malleolus | 15.16 ± 4.05 |
| Left fifth metatarsal head | 20.76 ± 8.26 |
| Left styloid process of the fifth metatarsal | 17.29 ± 7.46 |
| Left lateral malleolus | 15.45 ± 4.62 |
| Mean ± SD (mmHg) | p-Value | ES | SEM | CV% | ICC | ||
|---|---|---|---|---|---|---|---|
| Prueba | Retest | (IC 95%) | (IC 95%) | (IC 95%) | |||
| Fifth metatarsal | |||||||
| Right | 100.62 ± 49.806 | 93.38 ± 44.232 | 0.310 | 7.241 | 20.412 | 48.277 | 0.810 |
| (6.999–33.825) | (47.290–49.265) | (0.594–0.911) | |||||
| Left | 96.52 ± 51.194 | 106.14 ± 52.605 | 0.320 | 9.621 | 33.688 | 50.997 | 0.575 |
| (19.598–47.777) | (49.934–52.059) | (0.094–0.800) | |||||
| Styloid process | |||||||
| Right | 96.24 ± 38.143 | 96.93 ± 43.946 | 0.277 | 0.690 | 24.948 | 42.122 | 0.624 |
| (12.446–37.450) | (41.294–42.951) | (0.199–0.823) | |||||
| Left | 96.38 ± 41.393 | 91.41 ± 37.323 | 0.369 | 4.966 | 12.378 | 41.687 | 0.900 |
| (1.156–24.641) | (40.869–42.505) | (0.787–0.953) | |||||
| Malleolus | |||||||
| Right | 82.07 ± 36.437 | 74.1 ± 32.725 | 0.270 | 7.966 | 14.825 | 44.257 | 0,816 |
| (3.302–26.346) | (43.374–45.139) | (0.608–0.914) | |||||
| Left | 82.69 ± 37.700 | 81.69 ± 39.599 | 0.275 | 1.000 | 18.657 | 46.629 | 0.763 |
| (6.523–30.790) | (45.685–47.572) | (0.496–0.889) | |||||
Disclaimer/Publisher’s Note: The statements, opinions and data contained in all publications are solely those of the individual author(s) and contributor(s) and not of MDPI and/or the editor(s). MDPI and/or the editor(s) disclaim responsibility for any injury to people or property resulting from any ideas, methods, instructions or products referred to in the content. |
© 2025 by the authors. Licensee MDPI, Basel, Switzerland. This article is an open access article distributed under the terms and conditions of the Creative Commons Attribution (CC BY) license (https://creativecommons.org/licenses/by/4.0/).
Share and Cite
Mir-Jiménez, M.; Izquierdo-Renau, M.; Julian-Rochina, I. Reliability of the Fluorescence-Sensitive Optical Sensor Measurement of TcPO2 and Susceptibility to Pressure Injury Around the Foot. Appl. Sci. 2025, 15, 5710. https://doi.org/10.3390/app15105710
Mir-Jiménez M, Izquierdo-Renau M, Julian-Rochina I. Reliability of the Fluorescence-Sensitive Optical Sensor Measurement of TcPO2 and Susceptibility to Pressure Injury Around the Foot. Applied Sciences. 2025; 15(10):5710. https://doi.org/10.3390/app15105710
Chicago/Turabian StyleMir-Jiménez, Melanie, Marta Izquierdo-Renau, and Iván Julian-Rochina. 2025. "Reliability of the Fluorescence-Sensitive Optical Sensor Measurement of TcPO2 and Susceptibility to Pressure Injury Around the Foot" Applied Sciences 15, no. 10: 5710. https://doi.org/10.3390/app15105710
APA StyleMir-Jiménez, M., Izquierdo-Renau, M., & Julian-Rochina, I. (2025). Reliability of the Fluorescence-Sensitive Optical Sensor Measurement of TcPO2 and Susceptibility to Pressure Injury Around the Foot. Applied Sciences, 15(10), 5710. https://doi.org/10.3390/app15105710