Abstract
Pseudotachylytes and cataclasites record transient seismic slips within the brittle–ductile transition zone and ductile flow layers. Investigating the mechanisms of pseudotachylytes can provide the most direct geological evidence for revealing seismic fault slip and coseismic processes. We investigate the deformation and chemical composition of pseudotachylytes, cataclasites, and mylonites collected from the Anning River fault zone in this study. Three kinds of pseudotachylyte veins were found in granite gneiss and cataclasite. Microstructural analyses show that pseudotachylytes and cataclasites developed within granitic gneiss and mylonites, and EBSD analysis indicates granitic gneiss deformed at temperatures of 250–350 °C. All of the pseudotachylytes are enriched in Fe and Ca, with SiO2 content closely resembling that of the wall rock of granitic gneiss. The geochemical results indicate that pseudotachylytes originated from the in situ melting of granitic gneiss, which was produced during coseismic frictional heating. Based on the deformation and geochemical data of mylonites, cataclasites, and pseudotachylytes, a simple model of the seismogenic layer is established for rock deformation during coseismic, post-seismic relaxation, and interseismic periods. Mylonite represents the rheological flow of the brittle–ductile transition zone during interseismic periods, cataclasites display brittle fracturing during coseismic rupture, and pseudotachylytes stand for localized melting induced by coseismic frictional heating. During the post-seismic relaxation, crack healing and static recrystallization of quartz occur.
1. Introduction
Seismic fault mechanics have traditionally focused on the brittle upper crust of tectonically active regions. In classical models, deformation below the brittle–ductile transition (BDT) is thought to be governed by crystal plasticity, while earthquakes are attributed to rapid brittle failure. Consequently, seismic activity was not expected to occur in the deeper, ductile portions of the crust. However, recent observations challenge this assumption. Seismic nucleation has been documented in strong lower crustal rocks within the continental lithosphere, particularly beneath the BDT [1]. In the upper crust, deformation primarily occurs via brittle processes such as frictional sliding and faulting, whereas dislocation creep dominates in the middle and lower crust under thermally activated conditions [2].
During the seismic cycle, the deformation mechanisms of fault rocks are significantly influenced by temperature, strain rate, and pore fluid pressure [3,4,5,6,7,8,9,10,11,12,13,14]. The BDT is thus recognized as a critical zone for controlling the depth extent of seismicity in the continental crust [15,16], with its behavior highly sensitive to temperature, strain rate, and pore fluid pressure [11,12,13,14,17]. Importantly, deformation mechanisms within this transition zone vary across different seismic phases—including coseismic loading, post-seismic relaxation, and interseismic creep—due to variations in strain rate and fluid conditions [11,12,13,14,18]. During interseismic periods, low strain rates promote ductile flow, while higher strain rates during coseismic and post-seismic phases favor brittle failure.
To fully understand the transient creep behavior and strain rate sensitivity of rocks in the BDT during the seismic cycle, it is essential to investigate the microstructures and deformation mechanisms preserved in deep fault rocks [19]. Key evidence for such processes comes from pseudotachylyte and mylonite, which together record the complex interplay of brittle and ductile deformation in the lower crust [20]. Mylonites form under ductile conditions in shear zones, while pseudotachylytes typically originate from high-speed coseismic slip, producing solidified frictional melt along fault surfaces [21,22,23,24,25].
Traditionally, pseudotachylyte has been considered a product of dry, high-velocity frictional melting [23,26]. However, new studies suggest that pseudotachylyte may also form during slower processes such as ductile creep, microseismic rupture, and slow slip events [1,19,27,28]. Furthermore, pseudotachylyte formation has been observed in fluid-rich fault zones [29] and may be preceded by intense fragmentation and grain size reduction [30]. The preservation of pseudotachylyte is also problematic due to its susceptibility to post-seismic alteration and weathering during exhumation [26,31,32]. Nevertheless, pseudotachylyte has now been documented at depths of 22–50 km [33,34,35], indicating that earthquake processes can extend well below the traditionally defined BDT. Microscale amorphization structures observed in both natural fault gouges and experimental granite deformation further suggest that intense shear, rather than melting alone, can produce pseudotachylyte-like textures [36,37,38,39].
The Anning River fault zone provides an ideal natural laboratory for such research. We aim to investigate the chemical composition, microstructures, and deformation mechanisms of pseudotachylytes, cataclasites, and mylonites from the brittle–ductile transition zone in this study. Based on the deformation and petrogenetic origin of pseudotachylyte, a deformation model was established that captures the behavior of fault rocks during coseismic, post-seismic, and interseismic periods in the brittle ductile transition zone, thereby contributing to a more comprehensive understanding of seismic fault dynamics.
2. Materials and Methods
2.1. Samples
In the Xichang segment of the Anning River fault zone, pseudotachylyte has been found in the pre-Avalonian granite gneiss, representing coseismic deformation at the fault source depth during a geological historical period. This study collected a large number of pseudotachylyte and related tectonic rock samples, which are the main research objects of this study (Figure 1).
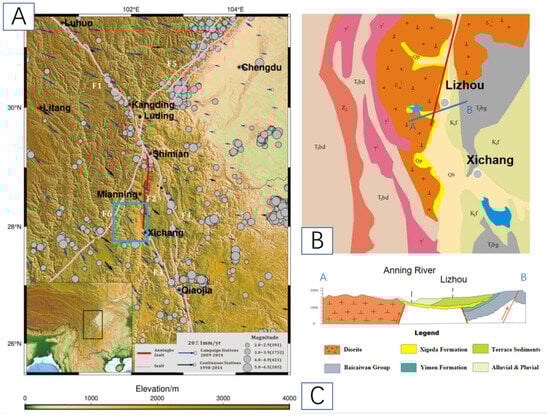
Figure 1.
Simplified geological map of the sample collection area along the Anning River fault zone. (A) Schematic diagram of the Anning River fault zone [40]; (B) simplified geological map near Lizhou, where the red line represents the location of the Anning River fault zone and the blue line indicates the position of geological cross-section AB; and (C) geological cross-section AB.
Samples AF19-43A, AF19-43D, AF19-43G, AF19-44A, AF19-44C, and AF21-4 (of which 43D, 43G, and 44C are rolled stone samples, and the rest are in situ samples, as shown in Figure 2 and Figure 3) are mylonite and shattered rock containing pseudotachylyte. These were all collected from the west side of Lizhoushan, Minsheng Township, Changshitou Village, Xichang City, Sichuan Province, with the coordinates N28°05’27.94″ E102°02′55.71″ (Figure 2 and Figure 3). The elevation is 1725 m.
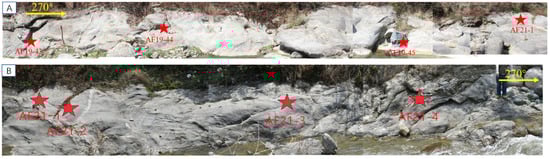
Figure 2.
Sections of samples from the sample collection area. (A) Schematic diagram of the sampling profile on the south bank of the river at Changshitou Village (AF19-43A to AF21-1); (B) schematic diagram of the sampling profile on the south bank of the river at Changshitou Village (AF21-1 to AF21-4).
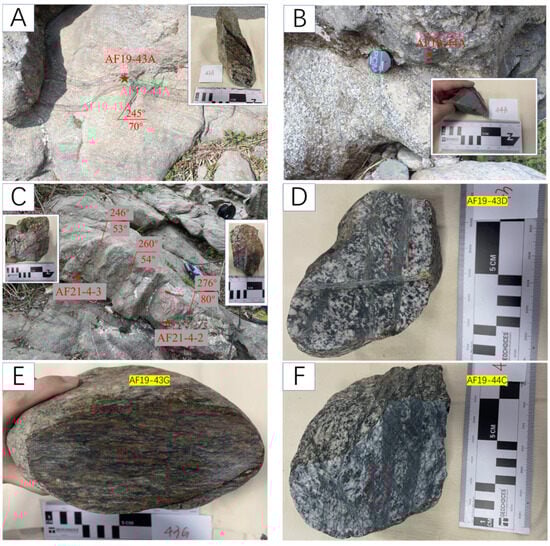
Figure 3.
Images of specimens. (A) AF19-43A granitic gneiss containing pseudotachylyte; (B) AF19-44A gneiss containing pseudotachylyte; (C) AF21-4-2 and AF21-4-3 breccia containing pseudotachylyte; (D) AF19-43D breccia containing pseudotachylyte; (E) AF19-43G mylonite containing pseudotachylyte; and (F) AF19-44C breccia containing pseudotachylyte.
The sampling site is located on the southern riverbed of a river channel trending nearly east–west, where the bedrock is composed of early Proterozoic granite gneiss. Locally, mylonite or shattered rocks develop, with several branching pseudotachylyte veins along the mylonitic foliation (Figure 3). The vein widths are approximately 1–2 cm, and they extend in east–west and southwest directions, with traceable widths of about 20–30 m. These veins cut each other, showing features of synchronous activity. The attitudes of the pseudotachylyte veins are 246° < 53°, 260° < 54°, and 276° < 80°. The surrounding mylonitic foliation in the host rock has an attitude of 72° < 80°. A 20 cm wide pegmatite vein is also developed in the host rock (Figure 3), with an attitude of 310° < 54°, and pseudotachylyte is observed along the vein, with an attitude of 302° < 47°.
In the riverbed, mylonite cobbles containing pseudotachylyte veins can be seen. These cobbles provide the three-dimensional spatial distribution characteristics of the pseudotachylyte veins. Some veins are filled in clear, straight fractures (Figure 3), while others are injected along the fractured network formed by the shattered rocks (Figure 3).
2.2. Methods
This study used a variety of analytical techniques to examine the microstructure and chemical composition of the samples, including Optical Microscopy, scanning electron microscopy (SEM)–Energy Dispersive Spectroscopy (EDS), Electron Backscatter Diffraction (EBSD), X-ray Diffraction (XRD), X-ray Fluorescence Spectroscopy (XRF), and Electron Probe Micro-analysis (EPMA).
Polarizing Microscope & SEM-EDS: Microstructures of the samples were observed using a polarizing optical microscope (LEICA) and a scanning electron microscope (Zeiss SIGMA) (SEM) at the State Key Laboratory of Earthquake Dynamics, Institute of Geology, China Earthquake Administration, Beijing, China. The SEM equipped with an Oxford X-Max 50N energy-dispersive X-ray spectroscopy (EDS) were used for measuring element composition, respectively.
EBSD: The quartz fabrics were measured by SEM-EBSD analysis using a scanning electron microscope (SEM) coupled with an Oxford Nordlys nano electron backscattered diffraction (EBSD) detector at the State Key Laboratory of Earthquake Dynamics, Institute of Geology, China Earthquake Administration, Beijing, China. Polished thin sections were carbon-coated prior to EBSD analysis. EBSD allows for the determination of the full crystallographic orientation of crystals in a thin section using a backscattered electron (BSE) signal. Automatic EBSD measurements were used to obtain orientation maps and crystallographic preferred orientation (CPO) patterns. Working conditions during acquisition of the EBSD patterns were 20 kV accelerating voltage, 12 nA probe current, 70° sample tilt, ~20 mm working distance, and high vacuum. EBSD patterns of quartz were acquired and indexed with HKL AZtec software (Oxford Instruments), which selected the direction of the stretching lineation as the X-axis direction; that is, the quartz–mica strip direction is the X-axis direction, and the plane-oriented direction is the XY-plane direction. CHANNEL 5 software (Oxford Instruments) was used for noise reduction and for filling the missing data with at least eight identical neighbors with similar orientation. All stereographic diagrams of EBSD are lower hemisphere projections.
XRD: XRD analysis was performed to qualitatively identify mineral compositions in pseudotachylyte samples and host rocks, XRD data were collected using Bruker D8 ADVANCE X-ray diffractometers with Cu Kα radiation over the 2θ range of 3°–70°, with a step size of 0.02° at the Beida Zhihui Microstructure Analytical Center in Beijing.
XRF: Whole-rock chemical analysis of major elements in pseudotachylyte and host rocks using a Magix-pro2440 XRF machine at theInstitute of Geology, Chinese Academy of Geological Sciences.
EPMA: Major element compositions of mineral grains were determined using a JEOL JXA-8230 electron probe micro-analyzer (EPMA) at the Institute of Tibetan Plateau Research, Chinese Academy of Sciences. The analytical conditions were 15-kV accelerating voltage, 20-nA beam current, 5-μm probe diameter, and 5- to 10-s counting time (background and peak) per element. EPMA analyses were performed on 10 grains for each mineral.
The above methods are described in detail in the following Table 1.

Table 1.
Analytical methods and co-application necessity.
3. Results
This study focuses on the pseudotachylyte found in the granite gneiss within the Anning River fault zone. Based on the contact relationship between the pseudotachylyte and the host rock, three kinds of pseudotachylyte veins were identified: (A) veins with a bifurcated pattern, splitting from the main vein and gradually tapering as it fills the fractures in the host rock (AF19-43A, AF19-43D, and AF19-44C); (B) some veins have undergone later alteration, exhibiting significant plastic deformation features (AF19-43G); and (C) multi-stage veins with a combination of various characteristics (AF21-4-2).
3.1. Microstructures of Pseudotachylyte
3.1.1. Straight Vein-Type Pseudotachylyte in Granite Gneiss and Cataclasite
The straight vein-type pseudotachylyte appears in the cataclasite, with a straight, black pseudotachylyte vein clearly delineated from the host rock.
(1) Sample AF19-44A is a pseudotachylyte vein developed in granite gneiss, with a distinct boundary between the vein and the host rock. The vein has a banded appearance, with a width of approximately 0.5 cm (Figure 4A). This is the dominant type of pseudotachylyte distribution in the study area. The pseudotachylyte vein is dark to black with a clastic texture both in field samples and under Optical Microscopy and SEM. The angular clasts consist of plagioclase and quartz. The plagioclase clasts in the host rock are angular or sub-angular, while the quartz clasts are sub-angular or sub-rounded (Figure 4B–D). In the host rock, brittle fracturing to form cataclasite (Figure 4A, red) and localized S-C structures from initial mylonitization (Figure 4A, yellow) are observed. Under scanning electron microscopy, plagioclase, quartz, and dark minerals are seen to be flattened and elongated in a directional manner, with folding (Figure 4E–G).
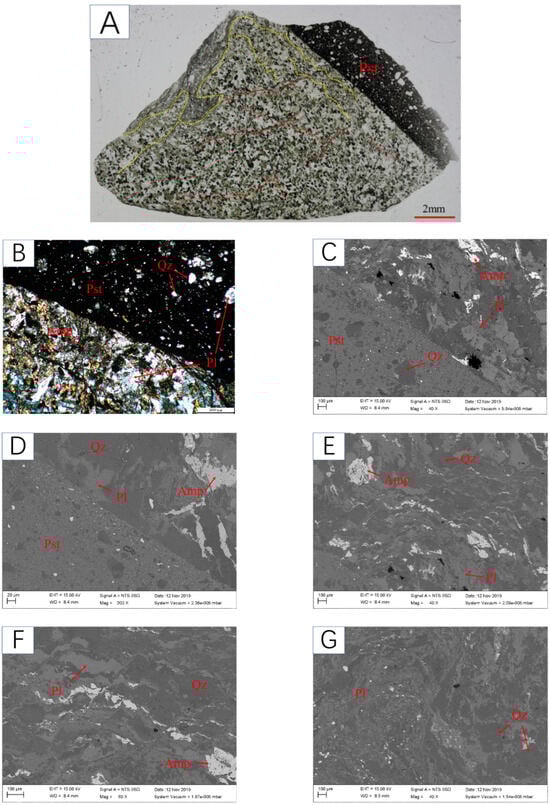
Figure 4.
Microstructures of a straight vein of pseudotachylyte in AF19-44A. (A) AF19-44A under plane-polarized light (PPL). Red solid lines demarcate brittle fractures; yellow dashed lines indicate domains of plastic deformation. (B) AF19-44A under cross-polarized light (XPL). (C–G) Scanning electron micrographs (SEM) of AF19-44A.
The microstructure of this sample suggests that the granite gneiss, with fractured rocks forming cataclasite, produced the pseudotachylyte vein during the coseismic rupture process. It is hypothesized that the mylonitized and cataclasitic granite gneiss surrounding the pseudotachylyte vein serves as its protolith. Due to the high-temperature melting and coseismic deformation, the contact area between the pseudotachylyte and the host rock underwent plastic deformation.
(2) In sample AF21-4-3, the boundary of the black pseudotachylyte vein is straight and distinct (Figure 5A–C), representing the deformation of the coseismic rupture stage. The host rock is an equigranular granite gneiss, where numerous brittle fractures are observed (Figure 5A, red) and localized plastic deformation is present around the vein (Figure 5A, yellow). The host rock exhibits localized fracturing to form cataclasite, with the fractured clastic angular clasts being angular or sub-angular plagioclase and sub-angular or sub-rounded quartz grains (Figure 5D,E). This indicates that the host rock of the pseudotachylyte is cataclasite fractured from granite gneiss.
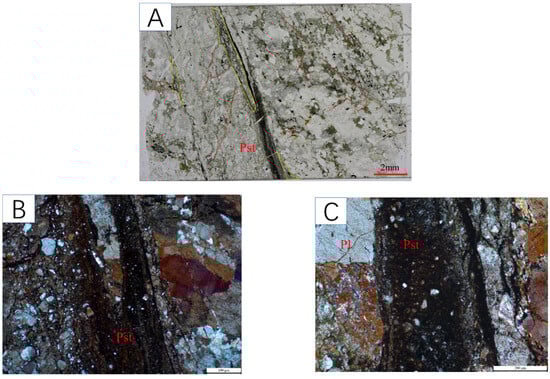
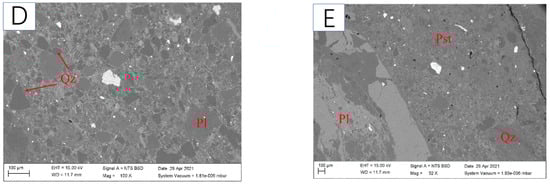
Figure 5.
Microstructures of pseudotachylyte with secondary veins in AF21-4-3. (A) AF21-4-3 under PPL. (B,C) AF21-4-3 under XPL. (D,E) SEM of AF21-4-3.
(3) In sample AF19-43A, the boundary between the pseudotachylyte vein and the surrounding fractured granite gneiss is clear. The glass exhibits a dendritic shape, where two narrow veins converge into a main vein, with a width of approximately 0.3–1 cm (Figure 6A, black). The plagioclase clasts in the host rock are angular or sub-angular, and some clasts show internal fractures. The quartz clasts are sub-angular or sub-rounded, with a grain size slightly smaller than that of the plagioclase clasts (Figure 6B,C). Under scanning electron microscopy, the de-glassified mineral aggregates with cryptocrystalline growth can be observed (Figure 6D,E).
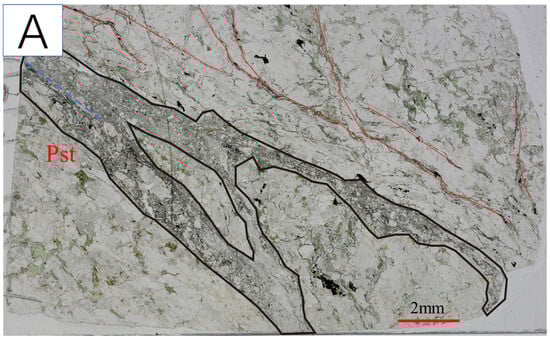
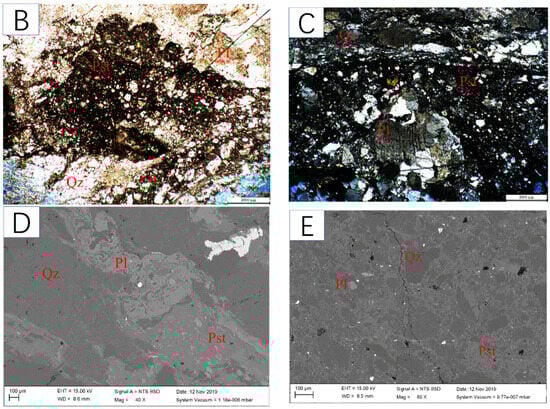
Figure 6.
Microstructures of multi-branching veins of pseudotachylyte in AF19-43A. (A,B) AF19-43A under PPL. (C) AF19-43A under XPL. (D,E) SEM of AF19-43A.
In the host rock, multiple sets of secondary brittle fractures are observed at high angles to the main fracture surface (Figure 6A, red). These secondary fractures are mostly filled with fragmented clasts, with a small amount of melt glass. The intersection of the secondary fractures forms a clear and straight boundary (Figure 6A, blue), which is presumed to be a rupture surface containing melt glass, formed by simultaneous sliding along two intersecting slip surfaces. This is likely the product of the initial sliding stage during coseismic motion.
(4) In sample AF19-43D, the pseudotachylyte primarily exhibits a straight vein morphology, with localized injection into fractured fissures. The boundary between the main pseudotachylyte vein and the surrounding fractured granite gneiss is distinct, and the secondary veins are irregularly distributed in a net-like pattern (Figure 7A), gradually tapering off. The clasts in the host rock are euhedral or subhedral plagioclase and quartz (Figure 7A,B). The plagioclase clasts are angular, with visible internal fractures (Figure 7C,D). Quartz grains exhibit undulatory extinction (Figure 7C,D). Under scanning electron microscopy, mineral aggregates with de-glassified growth can be observed within the pseudotachylyte vein (Figure 7E–G).
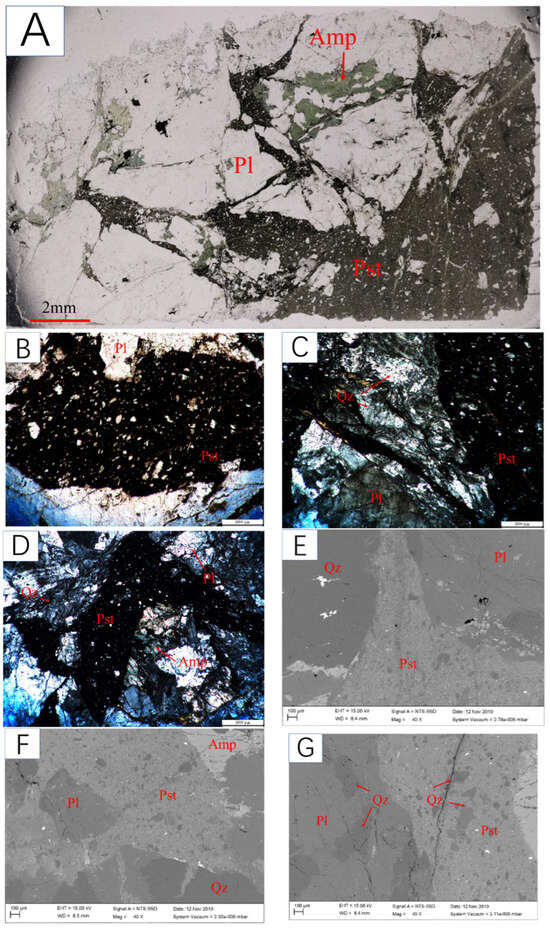
Figure 7.
Microstructures of pseudotachylyte with secondary injected veins in AF19-43D. (A,B) AF19-43D under PPL. (C,D) AF19-43D under XPL. (E–G) SEM of AF19-43D.
This sample represents the main developmental stage of coseismic rupture, where sliding friction along the fault surface reached its peak, and the frictional temperature reached its maximum. The melt produced along the fault surface increased, forming the main body of the pseudotachylyte vein, which also injected into secondary fissures near the main fault. The cryptocrystalline or vitreous mineral aggregates within the vein underwent de-glassification and growth during later deformation, indicating a process of stress unloading.
3.1.2. Distributed Fine Vein-Type Pseudotachylyte Along the Foliation of Mylonite
This type of pseudotachylyte appears in mylonite, with discontinuous fine veins of pseudotachylyte distributed along the foliation.
(1) In sample AF19-44C, the banded pseudotachylyte fine veins are distributed along the foliation of the granite mylonite, with clear but discontinuous boundaries. The veins are intermittent or taper off, and their shape is not straight but rather curved (Figure 8A). Two types of quartz grains are observed in the surrounding mylonite: one type is larger, with deformed edges bending to form bulging structures, and under crossed polarized light, sheared deformation bands are visible (Figure 8B); the other type consists of quartz aggregates with smaller grain size, showing allotriomorphic or subhedral shapes, and are arranged in bands between larger mineral grains. These quartz grains exhibit undulatory extinction (Figure 8B–D). The fine-grained quartz aggregates form banded structures along the foliation, exhibiting distinct plastic flow features (Figure 8D–G). The pseudotachylyte veins and the quartz bands alternate in a directional arrangement and exhibit plastic deformation characteristics (Figure 8A,E–G), indicating that the pseudotachylyte and fine quartz aggregates underwent plastic deformation together.
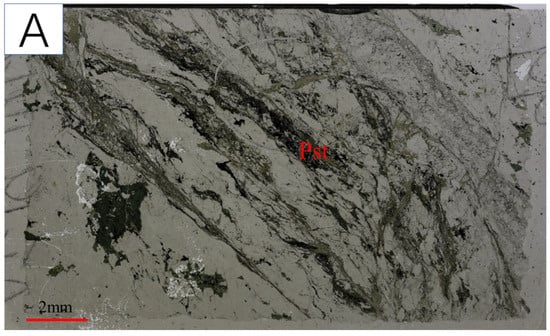
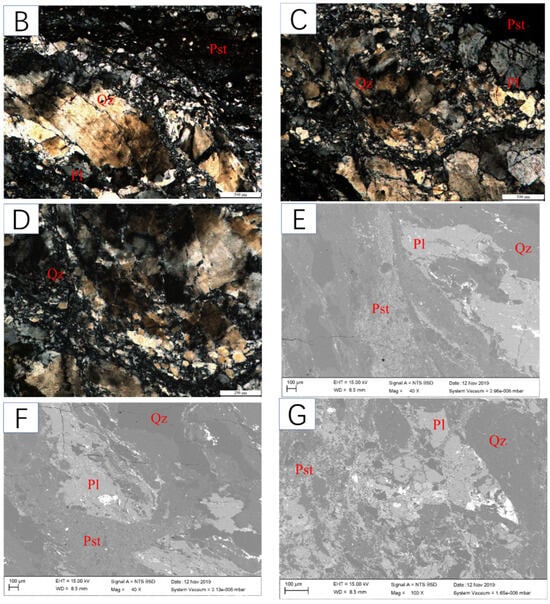
Figure 8.
Microstructures of pseudotachylyte distributed along the foliation in AF19-44C. (A) AF19-44C under PPL. (B–D) AF19-44C under XPL. (E–G) SEM of AF19-44C.
(2) Sample AF19-43G also contains fine veins of pseudotachylyte with plastic deformation. The host rock in this sample shows a porphyritic structure under polarized light, with plagioclase phenocrysts exhibiting σ-shaped or eye-shaped textures (Figure 9A–C). Under scanning electron microscopy, crushed structures are visible inside the phenocrysts, with fractures filled by quartz veins. The tailing ends of the phenocrysts show elongated fine-grained quartz and biotite aggregates, which surround the plagioclase grains (Figure 9D,E), indicating that the plagioclase has undergone hydrolysis to form quartz. The fine-grained aggregates of plagioclase, quartz, and biotite form a banded structure, with quartz subgrains developing, and the edges of the grains show bulging and subgrain rotation recrystallization (Figure 9B,C), indicating medium-temperature dislocation creep in quartz.
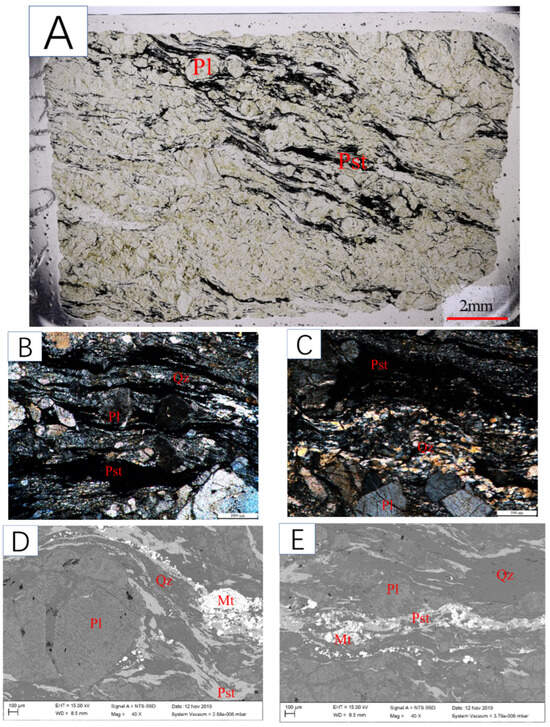
Figure 9.
Microstructures of pseudotachylyte that underwent plastic deformation in AF19-43G. (A) AF19-43G under PPL. (B,C) AF19-43G under XPL. (D,E) SEM of AF19-43G.
Along the foliation, fine pseudotachylyte veins exhibit a directional distribution, with discontinuous boundaries, interruptions, or tapering. The deformation features of the pseudotachylyte veins are consistent with those of the quartz bands, and the veins deform plastically around the eye-shaped plagioclase phenocrysts (Figure 9A–C). These features suggest that after the formation of pseudotachylyte, it and the fine quartz aggregates underwent plastic deformation together. Under scanning electron microscopy, granular magnetite inclusions were observed within the pseudotachylyte (Figure 9D,E).
3.1.3. Multi-Stage Pseudotachylyte Veins in Granite Gneiss
The host rock of this type of pseudotachylyte is fractured granite gneiss, which is similar to the host rock of the straight vein-type pseudotachylyte.
(1) In sample AF21-4-2, three stages of pseudotachylyte veins can be observed (Figure 10A). The boundary between each vein and the host rock is clearly visible, and the veins have a banded morphology, with distinct cutting relationships between them. The first-stage pseudotachylyte vein is about 0.2 cm wide, developed within a shear zone, with an irregular shape and injection characteristics. The vein is black, with a high matrix content and fewer clastic clasts, and it is cut by a wider fracture zone greater than 1 cm. The second-stage pseudotachylyte vein is lighter in color, black–gray, and clearly cuts through the first-stage vein at a large angle. This vein contains a higher proportion of clastic clasts, with the clasts being plagioclase and quartz. The plagioclase clasts are angular or sub-angular, while the quartz clasts are sub-angular or sub-rounded (Figure 10C). The matrix shows de-glassified growth of cryptocrystalline mineral aggregates under scanning electron microscopy (Figure 10D,E), parallel to the fracture zone.
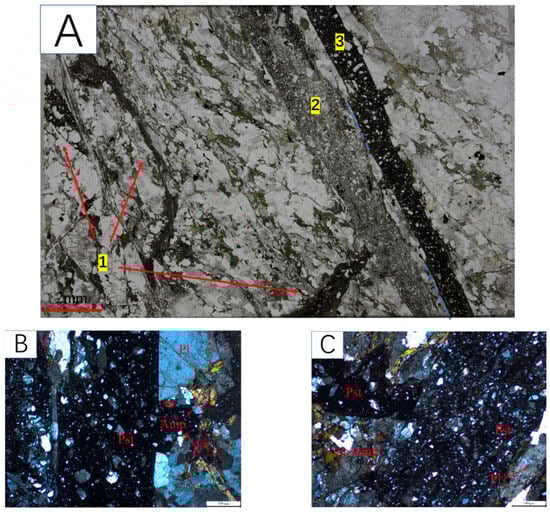
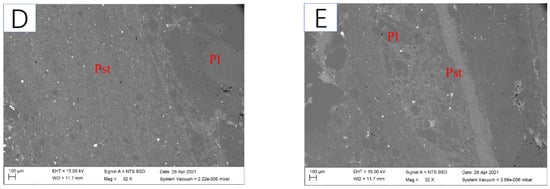
Figure 10.
Microstructures of multi-period pseudotachylytes in AF21-4-2. (A) AF21-4-2 under PPL, (1)–(3) are three stages of pseudotachylyte veins. (B,C) AF21-4-2 under XPL. (D,E) SEM of AF21-4-2.
The third-stage pseudotachylyte vein is nearly parallel to the second-stage vein but locally cuts through it (Figure 10A, blue). The boundary between the two stages is straight and clear. The third-stage vein has a higher matrix content (Figure 10B), is black in color macroscopically, and contains clastic clasts of plagioclase and quartz. However, no de-glassified growth of cryptocrystalline minerals is observed in the matrix. The microstructure and composition of the third-stage vein are similar to those of the straight vein-type pseudotachylyte.
It is evident that the exposed fault rocks have undergone multiple coseismic slip events throughout geological history. Due to the limited distribution and retention of information in the first two stages of pseudotachylyte veins, this study focuses on the last stage of fresh pseudotachylyte, which is more widely exposed in outcrops.
Table 2 summarizes the key characteristics of the various types of pseudotachylyte discussed above.
Table 2.
Summary of pseudotachylyte vein types.
3.2. Fabric of Quartz in Granite Gneiss and Mylonite Around Pseudotachylyte Under Electron Backscatter Diffraction (EBSD)
Under different temperature conditions, the intracrystalline slip system of quartz varies, leading to different crystal preferred orientations (CPOs) [41,42,43]. When the temperature increases or the strain rate decreases, the main slip systems of quartz are basal slip, rhombic slip, and prismatic slip [44,45]. Previous studies have shown that during the plastic deformation of quartz under non-coaxial shear strain, at low temperatures (250–350 °C), deformation primarily occurs through basal <a> dislocation slip creep; at medium–low temperatures (350–450 °C), it primarily occurs through rhombic <a> dislocation slip creep; at medium temperatures (450–600 °C), it mainly occurs through prismatic <a> dislocation slip creep; and at high temperatures (600–700 °C), it mainly occurs through prismatic <c> dislocation slip creep [44,45,46,47,48]. Among these, low-temperature fabrics can overlap with early high-temperature fabrics, and the evolution from high to low temperature in ductile shear zones can form composite fabric models [49]. Due to the limited number of slip systems in quartz, the slip systems can be analyzed simply from the c-axis pole figure. By examining the distribution of the extreme densities in the pole figure, the slip system of quartz deformation can be identified, thus allowing for the determination of the deformation temperature.
In this study, the host rock of pseudotachylyte consists of granite gneiss and granitic mylonite. To determine the depth (temperature) conditions of pseudotachylyte formation, the most typical straight vein-type pseudotachylyte samples, AF21-4-2 and AF21-4-3, were selected for EBSD analysis of quartz in the host rock (parent rock of the melt), fractured granite gneiss (Figure 11).
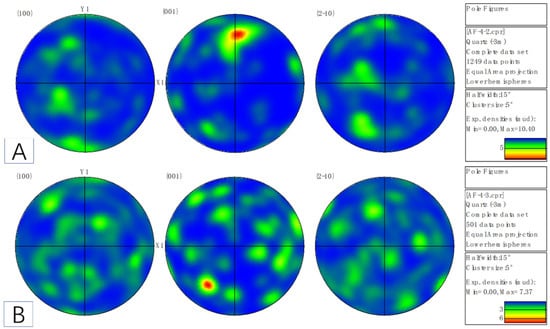
Figure 11.
EBSD for quartz in the host rock of pseudotachylyte. (A) AF21-4-2; (B) AF21-4-3.
For sample AF21-4-2, EBSD analysis of fine-grained quartz in the host rock identified 1249 distinct grains. The pole figure of the c-axis {001} shows a clear orientation, consistent with low-temperature basal dislocation slip creep.
For sample AF21-4-3, a surface scan was performed on quartz in the host rock, and noise reduction was carried out using Channel 5 software. A total of 501 distinct quartz grains were identified, and a pole figure was generated (Figure 11B). Similarly, the pole figure of the c-axis {001} of quartz in this sample shows clear orientation, and the extreme density pattern indicates low-temperature basal <a> dislocation slip creep characteristics.
EBSD analyses of quartz in the granitic host rock reveal a pronounced c-axis alignment characteristic of low-temperature basal <a> dislocation creep, indicating deformation temperatures of roughly 250–350 °C in the fractured granite gneiss surrounding straight vein-type pseudotachylyte. By correlating these temperatures with typical geothermal gradients, the host-rock deformation—and hence melt injection—depth is constrained to the brittle–ductile transition zone at approximately 15–20 km. Importantly, this melt is not derived from high-temperature magmatic intrusion but is instead generated in situ by coseismic, high-velocity frictional heating along fault planes. Thus, EBSD-derived quartz slip system characterization provides a robust thermobarometric framework for estimating both host rock deformation conditions and the depth of pseudotachylyte formation.
3.3. Chemical Composition
To analyze the genesis of pseudotachylyte and its relationship with the host rock, typical pseudotachylyte and host rock samples were selected for electron probe composition analysis. To obtain pure chemical data of pseudotachylyte, this study focuses on the straight vein-type pseudotachylyte samples, which are widely distributed at outcrops, for analysis.
In samples AF19-43D and AF19-44A, an SEM-EDS surface scan and electron probe major element analysis were conducted on the pseudotachylyte vein. A cross-sectional measurement was performed on AF19-43D (Figure 7), with approximately 20 measurement points for each profile, and two cross-section profiles on AF19-44A, with approximately 20 measurement points per profile (Figure 4). Based on the spatial distribution of pseudotachylyte and its relationship with the surrounding fractured granite, it is preliminarily concluded that the host rock on both sides of the pseudotachylyte vein is the parent rock of the melt.
Major minerals, such as plagioclase and a small amount of amphibole in the parent rock, as well as plagioclase clasts in the pseudotachylyte, were analyzed using electron probe major element analysis (Figure 12 and Figure 13).
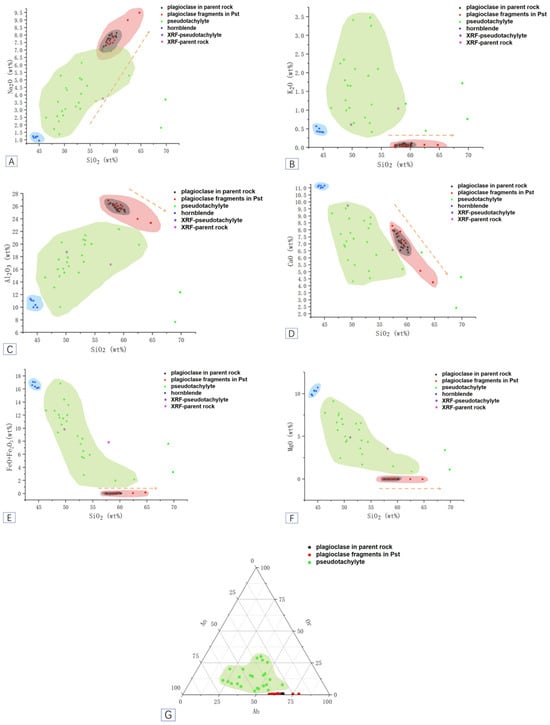
Figure 12.
The results of electron microprobe and XRF for pseudotachylyte in AF19-43D. (A–F) Harker diagrams correlating Na2O, K2O, Al2O3, CaO, FeO, and MgO versus SiO2 content, respectively. The red fields designate plagioclase fragment compositions within pseudotachylyte, black fields delineate parent rock plagioclase compositions, green fields represent pseudotachylyte compositions, and blue fields correspond to hornblende phase chemistries. (G) Ternary phase diagram of the feldspar system (Ab-An-Or).
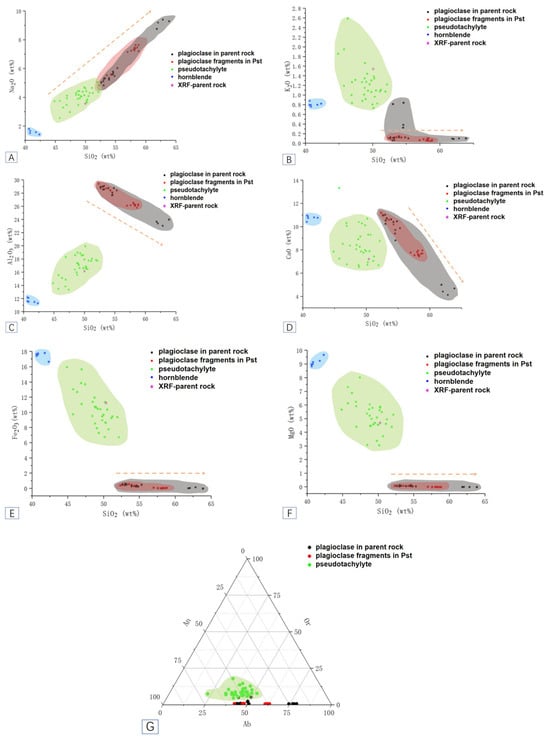
Figure 13.
The results of electron microprobe and XRF for pseudotachylyte in AF19-44A. (A–F) Harker diagrams correlating Na2O, K2O, Al2O3, CaO, FeO, and MgO versus SiO2 content, respectively. The red fields designate plagioclase fragment compositions within pseudotachylyte, black fields delineate parent rock plagioclase compositions, green fields represent pseudotachylyte compositions, and blue fields correspond to hornblende phase chemistries. (G) Ternary phase diagram of the feldspar system (Ab-An-Or).
Evidence from petrochemical analysis, combined with XRF results (Table 3), indicates the genetic relationship between pseudotachylyte and host rocks.
Table 3.
The results of XRF analysis (wB%).
Plagioclase fragments within pseudotachylyte exhibit highly consistent evolutionary trends in major elements (Na2O, CaO, and Al2O3) with wall rock plagioclase. For instance, a positive correlation was observed between Na2O and SiO2 (Figure 12A and Figure 13A). Negative correlations were observed between CaO and Al2O3 and SiO2 (Figure 12C,D and Figure 13C,D). Overlapping An values (An33–41 for pseudotachylyte versus An20–54 for wall rocks) indicate direct inheritance from wall rock minerals.
The matrix of pseudotachylyte shows significantly higher K2O content than the parent rocks, plagioclase and hornblende (Figure 12D and Figure 13B), which is attributed to potassium feldspar decomposition in the parent rocks. FeO and MgO concentrations in the matrix exceed those in parent rock plagioclase but remain lower than in hornblende (Figure 12 and Figure 13), indicating preferential incorporation of Fe-Mg components from mafic minerals (e.g., hornblende, biotite) during melting.
Intermediate Na2O and Al2O3 levels (between parent rock plagioclase and hornblende) and CaO consistency with plagioclase suggest multi-mineral phase mixing during melting.
Pseudotachylyte whole-rock SiO2 content aligns with intermediate rocks (e.g., AF19-43D), while melt residues exhibit Si depletion and Na-Al-Ca enrichment. This reflects selective element migration during partial melting.
Fe-Mg enrichment and Na-Al-Ca depletion: Pseudotachylyte matrix is enriched in Fe-Mg, whereas residual components show elevated Na, Al, and Ca (Figure 12 and Figure 13), consistent with melt-residue compositional complementarity.
Matrix mineral assemblages display diffusion toward central An values (e.g., An12–47 in AF19-43D; An33–66 in AF19-44A), indicating homogenization and re-equilibration of plagioclase during melting (Figure 12G and Figure 13G).
Whole-rock compositional consistency and Fe-Mg-SiO2 complementary trends indicate pseudotachylyte as an autochthonous product of host rock (granitic cataclasite) melting.
The pseudotachylyte’s chemical inheritance from host rocks, matrix element partitioning, and whole-rock complementary evolution collectively demonstrate its formation via in situ partial melting of granitic cataclasite under transient high-temperature/pressure conditions in seismogenic fault zones. This process involves selective melting of parent rock minerals (e.g., K-feldspar, hornblende) and rapid quenching, preserving critical records of seismic slip dynamics.
4. Discussion
The depth distribution of shallow-source earthquakes in the crust is controlled by the strength of fault zones and the stability of sliding friction [18]. Destructive earthquakes generally occur in the regions where the lithospheric strength of the crust is the highest, i.e., the brittle–ductile transition zone [15,16,50,51]. The brittle–ductile transition zone typically lies between depths of 10 and 15 km in the crust, where the temperature ranges from approximately 250 °C to 450 °C. This zone is a semi-brittle deformation domain, where quartz can undergo plastic deformation, while feldspar primarily deforms through brittle fracture. The granite in the brittle–ductile transition zone exhibits unstable sliding [52], and its strength is controlled by temperature, pressure, fluids, and other conditions [11,12,13,14].
The coseismic processes triggered by unstable sliding and high-speed frictional heat generation may be the main mechanisms for the formation of pseudotachylyte. During the coseismic rupture phase, due to the sharp increase in strain rate, the depth of the brittle–ductile transition zone in the fault zone will extend deeper [1]. In the interseismic period, the ductile shear zone, which is in a plastic deformation state, can undergo brittle failure during the coseismic process, forming cataclasites and pseudotachylytes. During the post-seismic relaxation phase, the strain rate gradually decreases, returning to the background values of the normal region. The depth of the brittle–ductile transition zone will gradually become shallower, and at this time, semi-brittle non-steady-state flow becomes the main deformation feature of the fault. This is accompanied by hydrolysis of feldspar and static recrystallization, dynamic recrystallization, and other plastic deformation processes of quartz and other minerals, while the fractures generated by the earthquake begin to heal [17,18,53].
This paper analyzes the microstructures of granite gneiss, mylonite, fractured rock, and pseudotachylyte, providing geological evidence for the deformation processes during each stage of the earthquake cycle.
4.1. Constraints of Microstructure and Rock Chemical Composition on the Genesis of Pseudotachylyte
The microstructures indicate that the rocks collected from the Anning River fault zone underwent deformation during different stages, including interseismic plastic flow, coseismic brittle fracturing, pseudotachylyte formation, and even post-seismic relaxation and fracture healing.
The deformation of mylonite represents interseismic plastic deformation. Mylonite develops an S-C fabric, with feldspar showing a porphyroclastic texture, while quartz and mica are significantly flattened, elongated, and oriented, forming foliations. The pervasive occurrence of feldspar twins and the undulose extinction of quartz indicate that the rock started to be stress-controlled, and high dislocation densities began to develop within the quartz grains. The fractured structures in feldspar grains, as well as the fine-grained quartz particles developing subgrains, grain rotation, and grain boundary migration, suggest that while quartz started to undergo dislocation creep and other plastic deformations, feldspar deformed mainly by brittle fracturing.
The deformation of fractured rocks and pseudotachylytes represents coseismic rupture. The primary deformation characteristic is the presence of fractured feldspar and other minerals, with angular or sub-angular clasts, and fractures filled by fine-grained quartz aggregates. Based on the EBSD analysis, the deformation temperature of the fractured rocks is about 250–350 °C, which corresponds to the brittle–ductile transition temperature (depth) range of the Anning River fault zone.
In sample AF21-4-2, multiple generations of pseudotachylytes are visible. The first generation of veins, formed earlier, is not related to the current coseismic rupture. The second and third generations of veins were both formed during the coseismic rupture phase. After the second-generation vein formation, the viscosity of the melt temporarily restored the fault strength (which may explain why the clasts in the second-generation vein are larger than those in other generations). After the fault was cemented, sliding friction did not stop but continued along the adjacent pre-existing fault surface, forming the third-generation veins.
Samples AF19-43G and AF19-44C all show fine-veined pseudotachylytes along foliations. The localization of plastic strain leads to crystal growth, recrystallization, and crystal preferred orientation in the pseudotachylyte matrix. The clasts remaining in the pseudotachylyte may also undergo plastic deformation. These features correspond to the first-generation vein in AF21-4-2, indicating that multiple seismic events occurred in the Anning River fault zone, and each coseismic pseudotachylyte formation underwent later geological deformation and transformation, eventually becoming the “mother rock” in the next earthquake event.
In samples AF19-43A and AF19-43D, localized devitrification of the pseudotachylyte is evident. Due to the glassy or cryptocrystalline matrix in the pseudotachylyte, the pseudotachylyte is especially prone to recrystallization under fluid (water) influence. Newly formed minerals may partially or completely cover the original microstructure. These observations suggest that pseudotachylytes are difficult to preserve after formation and can be easily modified in later geological processes, which may be one of the reasons why pseudotachylytes are rarely found or reported.
In the fractured rock, the feldspar phenocrysts’ fractures are healed by quartz veins, indicating post-seismic relaxation. Fine-grained quartz particles exhibit elongation and orientation, showing plastic flow deformation, subgrain development, grain boundary migration, and recrystallization.
The chemical composition analysis of pseudotachylyte and its host rocks reveals critical insights into the melting behavior of minerals during coseismic frictional processes. The comparative study of major elements (e.g., Na2O2, K2O, Al2O3, CaO, FeO, and MgO) and SiO2 content demonstrates that amphibole, biotite, and feldspar were preferentially melted under transient high-temperature/pressure conditions, while quartz remained largely unmelted and was preserved as clasts within the pseudotachylyte matrix. This selective melting pattern indicates non-equilibrium melting, where thermodynamically unstable phases (e.g., hydrous minerals like hornblende and biotite) and alkali feldspars decomposed rapidly, whereas quartz resisted melting.
The low SiO2 content in the pseudotachylyte melt (e.g., 49.92–57.63 wt.% in AF19-43D samples) further supports limited quartz participation in melting. Instead, quartz fragments were mechanically incorporated into the melt as relics, consistent with the observed clast-rich microstructure. Notably, the pseudotachylyte matrix exhibits chemical complementarity with the host rock residues: elevated FeO and MgO (derived from mafic minerals like hornblende) and enriched K2O (from K-feldspar breakdown) in the melt contrast with residual Na-Al-Ca enrichment in the restite (e.g., AF19-43D2: CaO = 9.17 wt.%, Na2O = 4.70 wt.%). This dichotomy aligns with partial melting processes, where melt and residue compositions diverge but retain genetic links to the parent rock.
The inheritance of plagioclase chemistry (An33–41 in pseudotachylyte vs. An20–54 in host rocks) and the overlapping trends in Harker diagrams (e.g., Na2O-SiO2: positive correlation; CaO-SiO2: negative correlation) underscore a local origin for the melt. Moreover, the spatial distribution of pseudotachylyte veins—intimately associated with fractured granite and showing sharp, non-reacted contacts—rules out an external injection mechanism. The homogenization of plagioclase compositions (e.g., An12–47 in AF19-43D) and the ternary feldspar system (Ab-An-Or) equilibration further attest to rapid melting–quenching cycles, preserving disequilibrium signatures.
In summary, the geochemical coherence between pseudotachylyte and host rocks, coupled with microstructural evidence (e.g., clast–melt relationships), conclusively supports an in situ melting genesis within seismogenic faults. The pseudotachylyte formed via frictional heating-induced selective melting of hydrous and alkali-rich phases, while refractory minerals (e.g., quartz) survived as clasts, leaving a distinct chemical imprint of coseismic slip dynamics.
4.2. Model of Genesis Pseudotachylyte and Deformation During Seismic Period Cycle in the Anning River Fault Zone
Through the study of the microstructures, deformation fabrics, and chemical compositions of pseudotachylyte and its associated fractured rocks and mylonites in the Anning River fault zone, the process of pseudotachylyte formation can be summarized in the following stages (Figure 14):
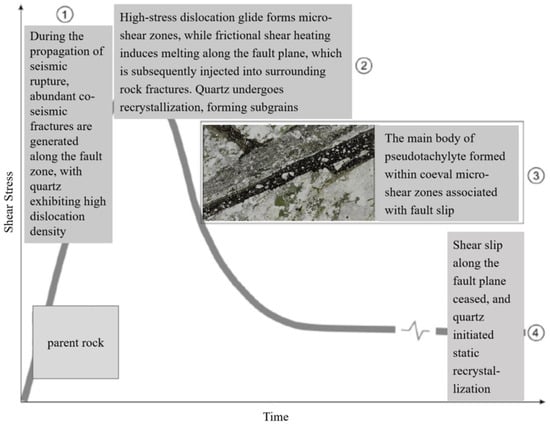
Figure 14.
A model of the pseudotachylyte and quartz microstructure during the seismic fault sliding process (modified from [25]).
- Pre-peak Friction Strength of the Fault: Before the fault reaches its peak friction strength, the friction within the fault zone is relatively high, resulting in the occurrence of numerous coseismic micro-fractures. Multiple sets of high-angle brittle fractures extend along the fault plane, forming fractured rocks associated with coseismic rupture. During this phase, quartz in the parent rock begins to fragment. The temperature rise induced by coseismic sliding causes the quartz particles in the parent rock to develop high dislocation densities, which leads to dislocation creep in the quartz (manifested by undulose extinction in quartz grains).
- Fault Reaching Peak Friction Strength: After the fault reaches its peak friction strength, rapid sliding along the fault plane occurs. Due to the frictional shear heating during coseismic movement, the temperature continuously increases, causing the rock to melt. The molten material is distributed along the fault plane and injected into the fractures of the host rocks (e.g., sample AF19-43D). During this phase, the sustained increase in temperature promotes the development of dislocations and the reorganization of crystal lattices in the quartz particles in the parent rock. This leads to dynamic recrystallization of quartz, forming subgrains and new crystal grains, with grain size controlled by both high stress and high strain rates.
- Fault Sliding Weakening Phase: In the weakening phase of fault sliding, coseismic shear continues for several tens of seconds, and the molten material keeps forming, leading to the main body of the pseudotachylyte (e.g., sample AF19-44A, AF21-4-3). At this stage, in the microshear zone formed concurrently with the unstable fault sliding, quartz particles and subgrain aggregates that have already undergone recrystallization continue to undergo dynamic recrystallization through grain boundary sliding mechanisms.
- Cessation of Coseismic Shear Sliding: After the cessation of coseismic shear sliding, the molten material begins to cool. However, the high temperatures generated by the molten material continue to heat the host rock, causing quartz in the host rock to continue undergoing plastic deformation. As stress and strain rates begin to decrease, quartz begins to undergo static recrystallization, forming a bubble-like structure and creating triple junctions (where the boundary angles between quartz grains are 120°), which restricts grain growth. Most of the fractures in the host rock are healed during this process.
From this model, it can be seen that pseudotachylyte formed in the brittle–ductile transition zone of the fault is the result of a non-steady-state rheological process. During this process, the ability of quartz to capture the transient non-steady-state rheology records a series of events: fracturing, dynamic recrystallization, and static recrystallization. This also explains why most pseudotachylytes exhibit the systematic feature of containing both quenched melt phases and recrystallized fine-grained aggregates simultaneously.
This model is cyclical and repetitive. For each seismic cycle, the pseudotachylyte generated during coseismic rupture undergoes metamorphic and deformational alteration during the post-seismic relaxation phase and interseismic phase. This results in the formation of fine vein pseudotachylyte with plastic deformation overprinted along the foliation, as mentioned earlier. In the next seismic cycle, these deformed products serve as the parent rock, undergoing further seismic modification. The multiple generations of pseudotachylyte veins present in sample AF21-4-2 provide a good correspondence to this model.
4.3. Limitations and Future Directions
While this study acknowledges the alteration of pseudotachylytes post-formation, additional limitations—such as sampling constraints and uncertainties in temperature estimation—warrant explicit discussion. Sampling is restricted to specific fault zones (e.g., Anning River fault zone), potentially limiting the generalizability of microstructural and geochemical conclusions to other tectonic settings with varying lithologies or stress regimes. Temperature estimates, primarily derived from quartz EBSD slip systems (250–350 °C for fractured rocks), rely on empirical relationships between crystallographic preferred orientations and thermobarometric frameworks. However, these correlations may not fully account for strain rate effects or fluid-induced recrystallization, which could obscure original deformation temperatures.
Future research could mitigate these gaps through in situ thermometry techniques (e.g., Raman spectroscopy of carbonaceous phases or laser microprobe analysis of fluid inclusions), which provide direct constraints on peak temperatures during pseudotachylyte formation. Additionally, integrating multi-scale structural transects across diverse fault segments (e.g., from shallow brittle to deeper ductile domains) would clarify how temperature–depth relationships vary spatially and temporally within seismogenic zones. Such approaches would enhance the robustness of thermomechanical models linking microstructural observations to macroscale seismic processes, ensuring more reliable interpretations of fault zone evolution and earthquake dynamics.
5. Conclusions
This paper focuses on pseudotachylytes, cataclasites, and mylonites exposed in the brittle–ductile transition zone along the Anning River fault zone, conducting microstructural analysis, rock chemical composition measurements, mineral deformation, and fabric orientation analysis. The main results are as follows:
The mylonites exposed along the Anning River fault zone represent deformation in the brittle–ductile transition zone during the interseismic period. Cataclasites represent coseismic fractures in the brittle–ductile transition zone. The quartz fabric from EBSD showed deformation temperature in the cataclasites is between 250 and 350 °C, corresponding to a depth range of 15–20 km. Three kinds of black pseudotachylyte veins presented in the cataclasites and mylonites represent frictional melting at coseismic slip.
Rock chemical analysis was performed on typical straight vein-type pseudotachylytes and their host rocks, showing that pseudotachylytes were produced directly from the frictional heating process of granitic host rocks during coseismic slip.
A simple model was proposed for the deformation characteristics and mechanisms of fault zone rocks during the coseismic, post-seismic relaxation, and interseismic periods. This model provides a reference for understanding the deformation processes of rocks at the depth of the seismic source in earthquake fault zones.
Supplementary Materials
The following supporting information can be downloaded at https://www.mdpi.com/article/10.3390/app15115870/s1. Section S1: Geological Setting.
Author Contributions
Y.Z. contributed to the conception and design of this study. W.D. conducted the experiments. W.D. and Y.Z. wrote the manuscript. H.L. and X.M. guided the use of instruments and discussed the results of SEM and EBSD. S.L. participated in sample preparations and illustration. All authors contributed to the field work, collection of samples, manuscript revision, read and approved the submitted version. All authors have read and agreed to the published version of the manuscript.
Funding
This research is supported by the National Natural Science Foundation of China (Grant No. U2139202) and the National Key Research and Development Program of China (Grant No. 2023YFC3012001).
Institutional Review Board Statement
Not applicable.
Informed Consent Statement
Not applicable.
Data Availability Statement
The original contributions presented in the study are included in the article/Supplementary Materials, further inquiries can be directed to the corresponding authors.
Acknowledgments
We would like to express our sincere gratitude to the editors of this journal for their kind assistance and professional support throughout the review process. We also deeply appreciate the constructive and insightful comments provided by the two anonymous reviewers, which greatly improved the quality of this manuscript.
Conflicts of Interest
The authors declare no conflict of interest.
References
- Campbell, L.R.; Menegon, L.; Fagereng, A.; Pennacchioni, G. Earthquake nucleation in the lower crust by local stress amplification. Nat. Commun. 2020, 11, 1322. [Google Scholar] [CrossRef] [PubMed]
- Brace, W.F.; Kohlstedt, D.L. Limits on lithospheric stress imposed by laboratory experiments. J. Geophys. Res. 1980, 85, 6248–6252. [Google Scholar] [CrossRef]
- Chernak, L.J.; Hirth, G.; Selverstone, J.; Tullis, J. Effect of aqueous and carbonic fluids on the dislocation creep strength of quartz. J. Geophys. Res. 2009, 114, B04201. [Google Scholar] [CrossRef]
- Gueydan, F.; Leroy, Y.M.; Jolivet, L. Mechanics of low-angle extensional shear zones at the brittle-ductile transition. J. Geophys. Res. 2004, 109, B12407. [Google Scholar] [CrossRef]
- Holyoke, C.W.; Tullis, J. The interaction between reaction and deformation: An experimental study using a biotite+plagioclase+quartz gneiss. J. Metamorph. Geol. 2006, 24, 743–762. [Google Scholar] [CrossRef]
- Ikari, M.J.; Niemeijer, A.R.; Marone, C. The role of fault zone fabric and lithification state on frictional strength, constitutive behavior, and deformation microstructure. J. Geophys. Res. 2011, 116, B08404. [Google Scholar] [CrossRef]
- Kohlstedt, D.L.; Evans, B.; Mackwell, S.J. Strength of the lithosphere: Constraints imposed by laboratory experiments. J. Geophys. Res. 1995, 100, 17587–17602. [Google Scholar] [CrossRef]
- Montési, L.G.J.; Zuber, M.T. A unified description of localization for application to large-scale tectonics. J. Geophys. Res. 2002, 107, 1–21. [Google Scholar] [CrossRef]
- Sibson, R.H. Continental fault structure and the shallow earthquake source. J. Geol. Soc. 1983, 140, 741–767. [Google Scholar] [CrossRef]
- Tullis, J.; Yund, R.A. Chapter 4 The Brittle-Ductile Transition in Feldspar Aggregates: An Experimental Study. Int. Geophys. 1992, 51, 89–117. [Google Scholar] [CrossRef]
- Trepmann, C.A.; Stockhert, B. Quartz microstructures developed during non-steady state plastic flow at rapidly decaying stress and strain rate. J. Struct. Geol. 2003, 25, 2035–2051. [Google Scholar] [CrossRef]
- Trepmann, C.A.; Stockhert, B.; Dorner, D.; Moghadam, R.H.; Küster, M.; Roller, K. Simulating coseismic deformation of quartz in the middle crust and fabric postseismic stress relaxation: An experimental study. Tectonophysics 2007, 442, 83–104. [Google Scholar] [CrossRef]
- Trepmann, C.A.; Stockhert, B. Short-wavelength undulatory extinction in quartz recording coseismic deformation in the middle crust: An experimental study. Solid Earth 2013, 4, 263–276. [Google Scholar] [CrossRef]
- Trepmann, C.A.; Chen, H.; Felix, H.; Katharina, D.; Christian, S. Recrystallization of quartz after low-temperature plasticity: The record of stress relaxation below the seismogenic zone. J. Struct. Geol. 2017, 95, 77–92. [Google Scholar] [CrossRef]
- Tse, S.T.; Rice, J.R. Crustal earthquake instability in relation to the depth variation of frictional slip properties. J. Geophys. Res. 1986, 91, 9452–9472. [Google Scholar] [CrossRef]
- Scholz, C.H. The brittle-pl and depth of seismic faulting. Geol. Rundsch. 1988, 77, 319–328. [Google Scholar] [CrossRef]
- Dai, W.H.; Zhou, Y.S. Deformation of the Brittle-Plastic Transition Zone at the Post-Seismic Relaxation Period: A Case Study of the Red River Fault. Seismol. Geol. 2019, 41, 996–1011, (In Chinese with English Abstract). [Google Scholar] [CrossRef]
- Zhou, Y.S.; Han, L.; Jing, C.; He, C.-R.; Dang, J. The Rheological Structures of Brittle-Plastic Transition in Longmenshan Fault Zone and Seismogenic Mechanism of Wenchuan Earthquake. Seismol. Geol. 2014, 36, 882–895, (In Chinese with English Abstract). [Google Scholar] [CrossRef]
- Campbell, L.R.; Menegon, L. Transient high strain rate during localized viscous creep in the dry lower continental crust(Lofoten, Norway). J. Geophys. Res. Solid Earth 2019, 124, 10240–10260. [Google Scholar] [CrossRef]
- Sibson, R.H. Transient discontinuities in ductile shear zones. J. Struct. Geol. 1980, 2, 165–174. [Google Scholar] [CrossRef]
- McKenzie, D.; Brune, J.N. Melting on fault planes during large earthquakes. Geophys. J. Int. 1972, 29, 65–78. [Google Scholar] [CrossRef]
- Sibson, R.H. Generation of Pseudotachylyte by Ancient Seismic Faulting. Geophys. J. Int. 1975, 43, 775–794. [Google Scholar] [CrossRef]
- Cowan, D.S. Do faults preserve a record of seismic slip? A field geologist’s opinion. J. Struct. Geol. 1999, 21, 995–1001. [Google Scholar] [CrossRef]
- Bestmann, M.; Pennacchioni, G.; Frank, G.; Goken, M.; de Wall, H. Pseudotachy in muscovite-bearing quartzite: Coseismic friction-induced melting and plastic deformation of quartz. J. Struct. Geol. 2011, 33, 169–186. [Google Scholar] [CrossRef]
- Bestmann, M.; Pennacchioni, G.; Nielsen, S.; Goken, M.; de Wall, H. Deformation and ultrafine dynamic recrystallization of quartz in pseudotachylyte-bearing brittle faults: A matter of a few seconds. J. Struct. Geol. 2012, 38, 21–38. [Google Scholar] [CrossRef]
- Sibson, R.H.; Toy, V.G. The Habitat of Fault-Generated Pseudotachylyte: Presence vs. Absence of Friction-Melt. In Radiated Energy and the Physics of Faulting; Abercrombie, R., McGarr, A., Di Toro, G., Kanamori, H., Eds.; American Geophysical Union: Washington, DC, USA, 2006; pp. 153–166. [Google Scholar] [CrossRef]
- Wang, L.; Barbot, S. Excitation of San Andreas tremors by thermal instabilities below the seismogenic zone. Sci. Adv. 2020, 6, eabb2059. [Google Scholar] [CrossRef]
- Papa, S.; Pennacchioni, G.; Menegon, L.; Thielmann, M. High-stress creep preceding coseismic rupturing in amphibolite-facies ultramylonites. Earth Planet. Sci. Lett. 2020, 541, 116271. [Google Scholar] [CrossRef]
- Song, B.R.; Johnson, S.E.; Song, W.J.; Gerbi, C.C.; Yates, M.G. Coseismic damage runs deep in continental strike-slip faults. Earth Planet. Sci. Lett. 2020, 539, 116241. [Google Scholar] [CrossRef]
- Magloughlin, J.F. Microstructural and chemical changes associated with cataclasis and frictional melting at shallow crustal levels: The cataclasite-pseudotachylyte connection. Tectonophysics 1992, 204, 243–260. [Google Scholar] [CrossRef]
- Kirkpatrick, J.D.; Shipton, Z.K.; Persano, C. Pseudotachylvtes: Rarely generated, rarely preserved, or rarely reported? Bull. Seismol. Soc. Am. 2009, 99, 382–388. [Google Scholar] [CrossRef]
- Kirkpatrick, J.D.; Rowe, C.D. Disappearing ink: How pseudotachylytes are lost from the rock record. J. Struct. Geol. 2013, 52, 183–198. [Google Scholar] [CrossRef]
- Moecher, D.P.; Steltenpohl, M.G. Petrological evidence for co-seismic slip in extending middle-lower continental crust: Heier’s zone of pseudotachylyte, north Norway. Geol. Soc. Lond. Spec. Publ. 2011, 359, 169–186. [Google Scholar] [CrossRef]
- Clerc, A.; Renard, F.; Austrheim, H.; Jamtveit, B. Spatial and size distributions of gamets grown in a pseudotachylyte generated during a lower crust earthquake. Tectonophysics 2018, 733, 159–170. [Google Scholar] [CrossRef]
- Orlandini, O.F.; Mahan, K.H.; Williams, M.J.; Regan, S.P.; Mueller, K.J. Evidence for deep crustal seismic rupture in a granulite-facies, intraplate, strike-slip shear zone, northern Saskatchewan, Canada. Geol. Soc. Am. Bull. 2019, 131, 403–425. [Google Scholar] [CrossRef]
- Janssen, C.; Wirth, R.; Rybacki, E.; Naumann, R.; Kemnitz, H.; Wenk, H.R.; Dresen, G. Amorphous material in SAFOD core samples (San Andreas Fault): Evidence for crush-origin pseudotachylytes? Geophys. Res. Lett. 2010, 37, L01302. [Google Scholar] [CrossRef]
- Pec, M.; Stünitz, H.; Heilbronner, R. Semi-brittle deformation of granitoid gouges in shear experiments at elevated pressures and temperatures. J. Struct. Geol. 2012, 38, 200–221. [Google Scholar] [CrossRef]
- Pec, M.; Stünitz, H.; Heilbronner, R.; Drury, M.; de Capitani, C. Origin of pseudotachylites in slow creep experiments. Earth Planet. Sci. Lett. 2012, 355–356, 299–310. [Google Scholar] [CrossRef]
- Marti, S.; Stinitz, H.; Heilbronner, R.; Plümper, O. Amorphous material in experimentally deformed mafic rock and its temperature dependence: Implications for fault rheology during aseismic creep and seismic rupture. J. Struct. Geol. 2020, 138, 104129. [Google Scholar] [CrossRef]
- Miao, S.Q.; Zhou, Y.S.; Ma, X.; Dang, J.X. Lithologic Structure of the Anninghe Fault Zone: Constraints From High-Pressure Wave Velocity Experiments. Front. Earth Sci. 2022, 10, 853474. [Google Scholar] [CrossRef]
- Brunel, M.; Maliakov, Y.K. Crystal slip systems in quartz under varying temperature conditions. J. Struct. Geol. 1972, 5, 123–135. [Google Scholar]
- Hara, I.; Takeda, K.; Kimura, T. Quartz fabric transitions in shear zones. Tectonophysics 1973, 18, 287–301. [Google Scholar]
- Mainprice, D.; Bouchez, J.L.; Casey, M. Crystallographic preferred orientations of quartz in mylonites. J. Geophys. Res. 1986, 91, 3857–3869. [Google Scholar]
- Schmid, S.M.; Paterson, M.S.; Boland, J.N. High temperature flow and dynamic recrystallization in Carrara Marble. Tectonophysics 1980, 65, 245–280. [Google Scholar] [CrossRef]
- Toy, V.G.; Prior, D.J.; Norris, R.J. Quartz fabrics in the Alpine Fault mylonites: Influence of strain rate and temperature. J. Struct. Geol. 2008, 30, 1172–1187. [Google Scholar] [CrossRef]
- Ji, S.C. Experimental studies on quartz plasticity under non-coaxial deformation. Acta Geophys. Sin. 1988, 31, 213–225, (In Chinese with English Abstract). [Google Scholar]
- Heidelbach, F.; Stretton, I.; Langenhorst, F. Slip system activity in quartz during plastic deformation. J. Geophys. Res. 2000, 105, 13345–13356. [Google Scholar] [CrossRef]
- Ábalos, B.; Puelles, P.; Fernández-Armas, S.; Sarrionandia, F. EBSD microfabric study of pre-Cambrian deformations recorded in quartz pebbles from the Sierra de la Demanda (N Spain). J. Struct. Geol. 2011, 33, 500–518. [Google Scholar] [CrossRef]
- Ni, J.L.; Liu, J.L. Composite fabric models in ductile shear zones: Insights from quartz CPO evolution. Chin. J. Geol. 2014, 49, 756–769, (In Chinese with English Abstract). [Google Scholar]
- Zhou, Y.S.; He, C.R. The rheological structures of crust and mechanics of high-angle reverse fault slip for Wenchuan Ms8.0 earthquake. Chin. J. Geophys. 2009, 52, 474–484, (In Chinese with English Abstract). [Google Scholar]
- Zhang, Y.Y.; Zhou, Y.S. Strength and deformation mechanisms of fault brittle-plastic transition zones with the influence of fluids and strain rates. Seismol. Geol. 2012, 34, 172–194, (In Chinese with English Abstract). [Google Scholar] [CrossRef]
- Zhang, L.; He, C.R. Frictional properties of phyllosilicate-rich mylonite and conditions for the brittle-ductile transition. J. Geophys. Res. Solid Earth 2016, 121, 3017–3047. [Google Scholar] [CrossRef]
- Niu, L.; Zhou, Y.S.; Yao, W.M.; Ma, X.; He, C.R. An experimental study on the transient creep of granite. Seismol. Geol. 2021, 43, 20–35, (In Chinese with English Abstract). [Google Scholar] [CrossRef]
Disclaimer/Publisher’s Note: The statements, opinions and data contained in all publications are solely those of the individual author(s) and contributor(s) and not of MDPI and/or the editor(s). MDPI and/or the editor(s) disclaim responsibility for any injury to people or property resulting from any ideas, methods, instructions or products referred to in the content. |
© 2025 by the authors. Licensee MDPI, Basel, Switzerland. This article is an open access article distributed under the terms and conditions of the Creative Commons Attribution (CC BY) license (https://creativecommons.org/licenses/by/4.0/).