
Research on Flame Temperature Measurement Technique Combining Spectral Analysis and Two-Color Pyrometry

Abstract

1. Introduction
2. Materials and Methods
2.1. Principle of Two-Color Pyrometry
2.2. Spectral Analysis of Energy-Containing Materials
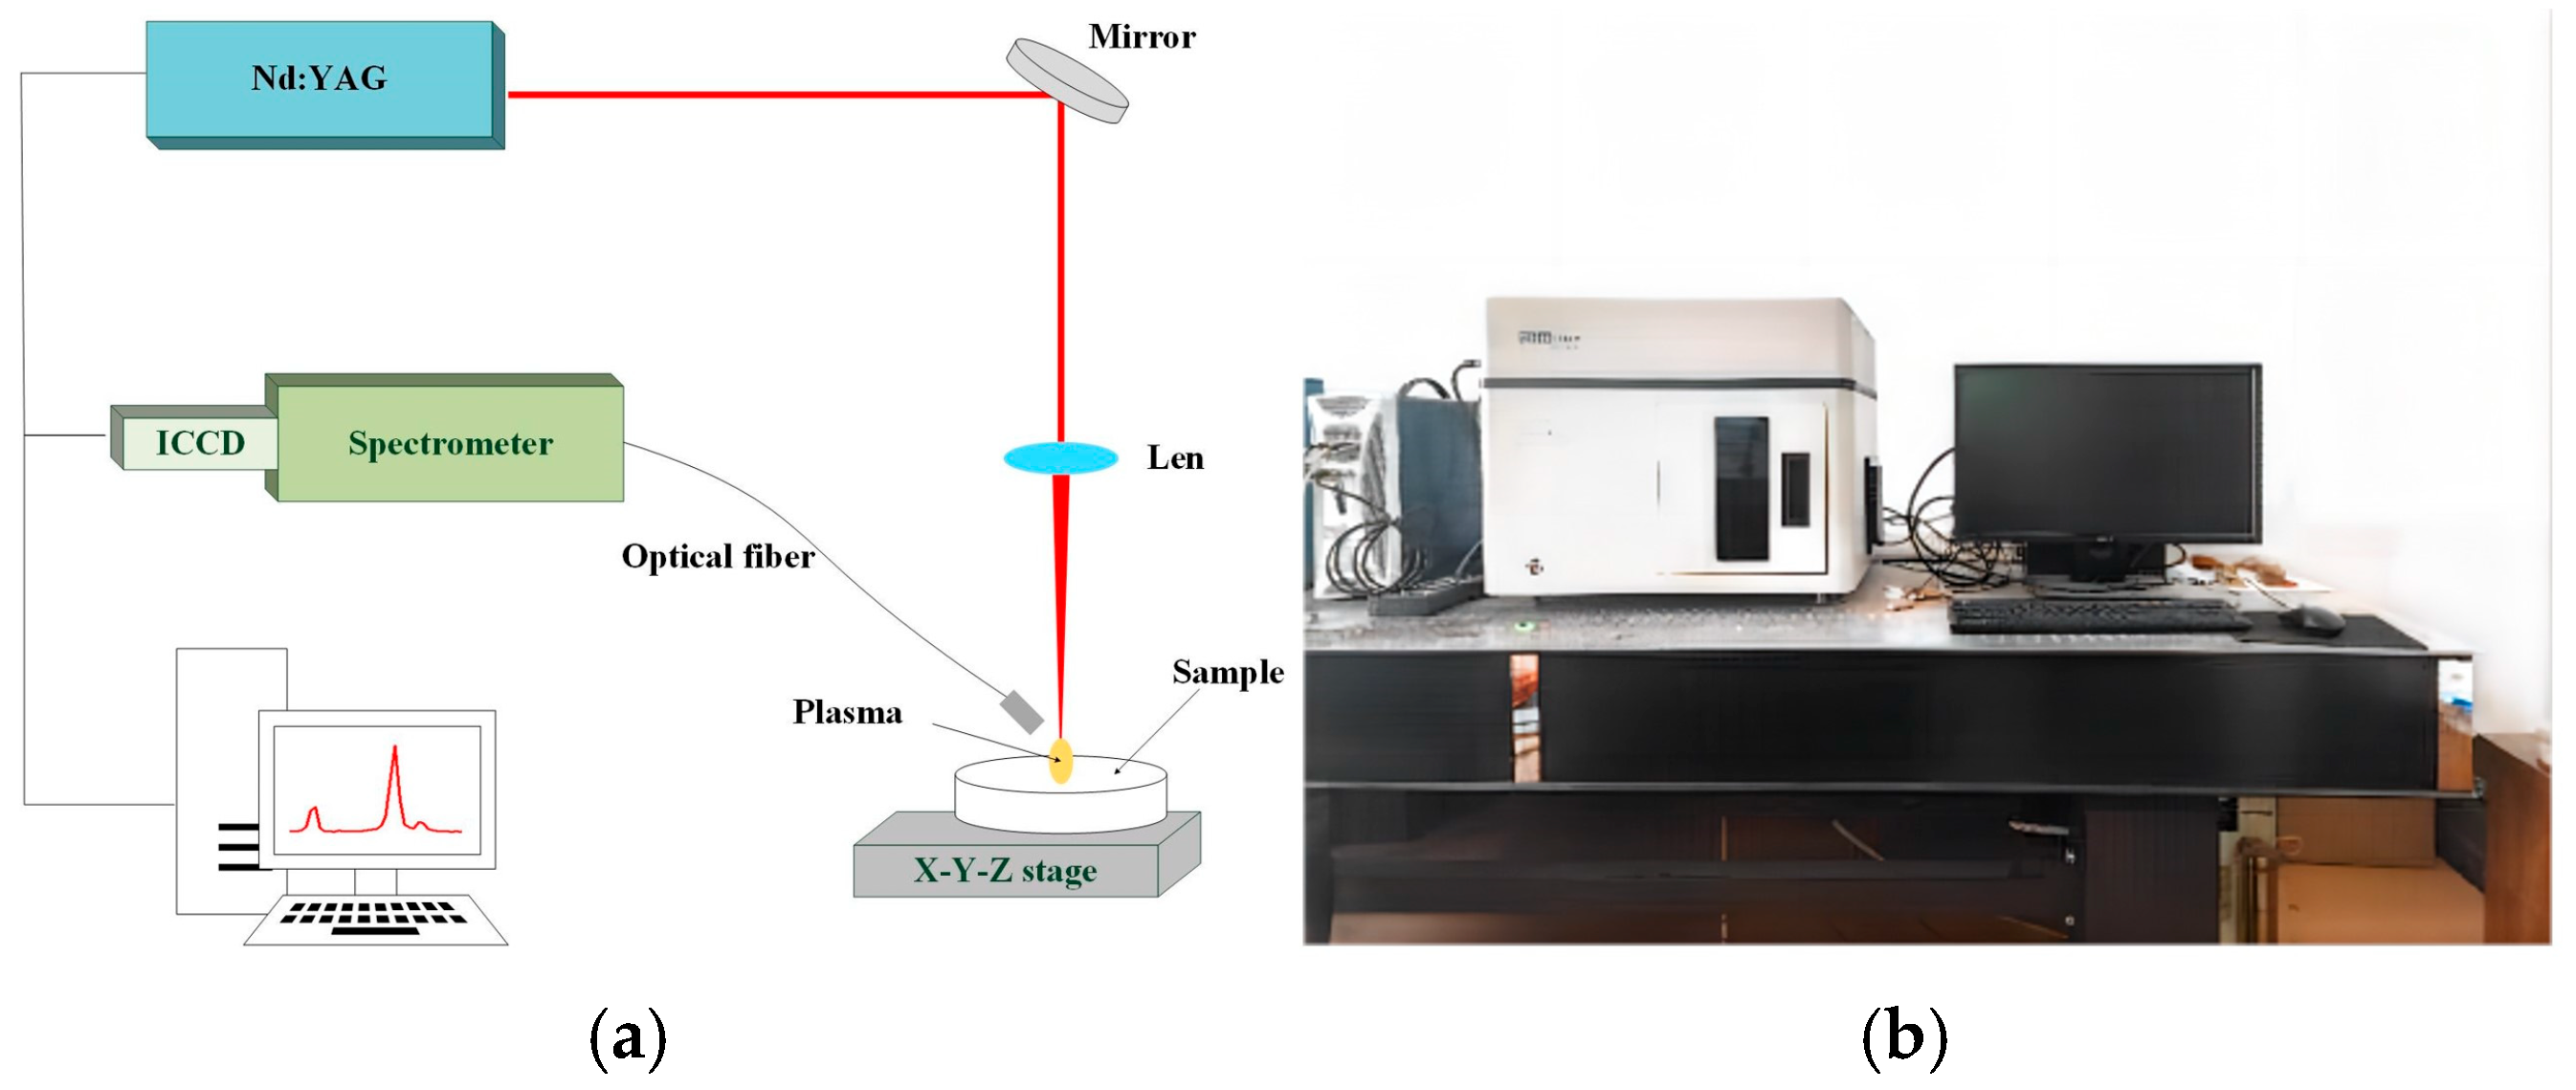
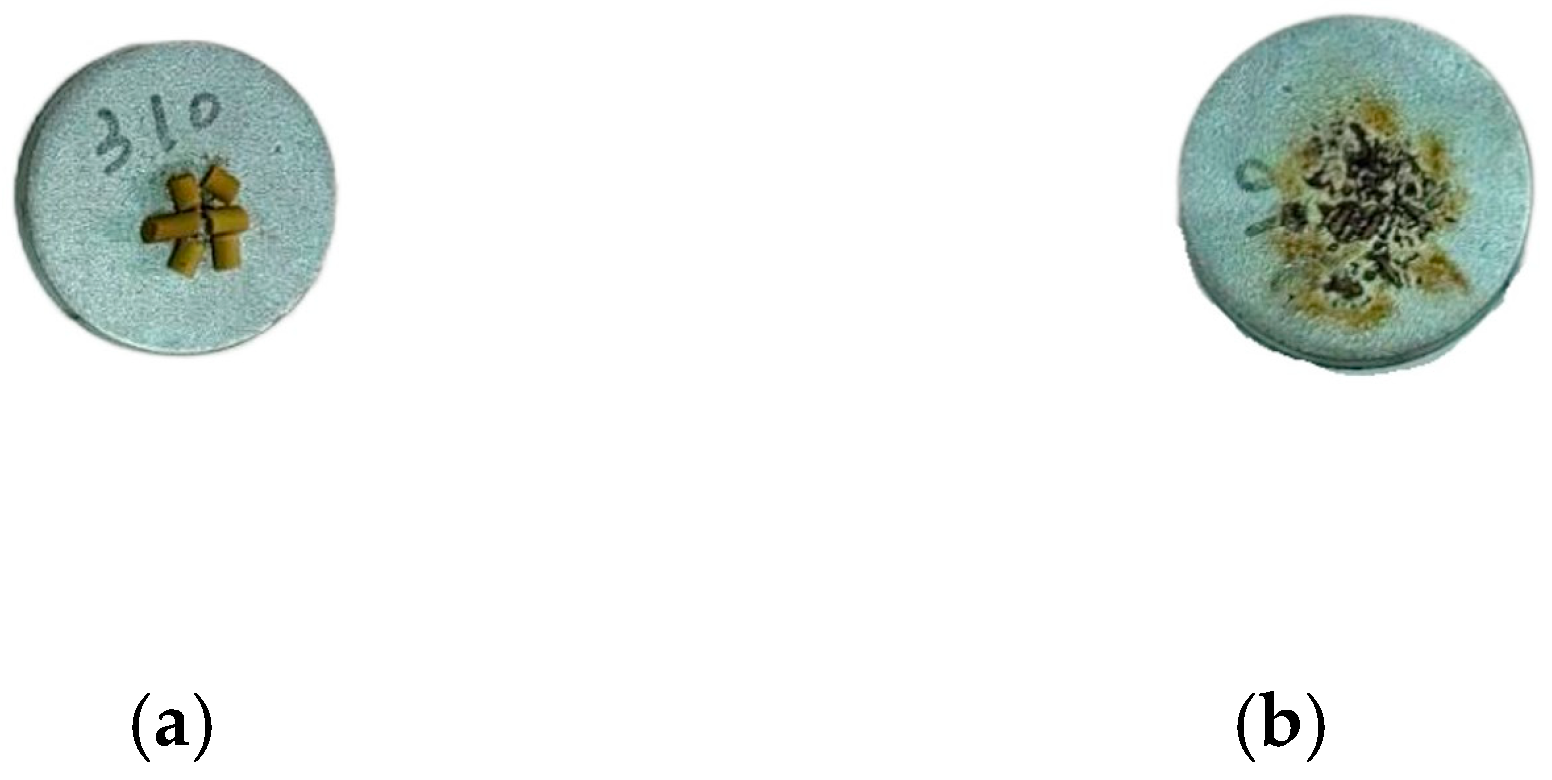
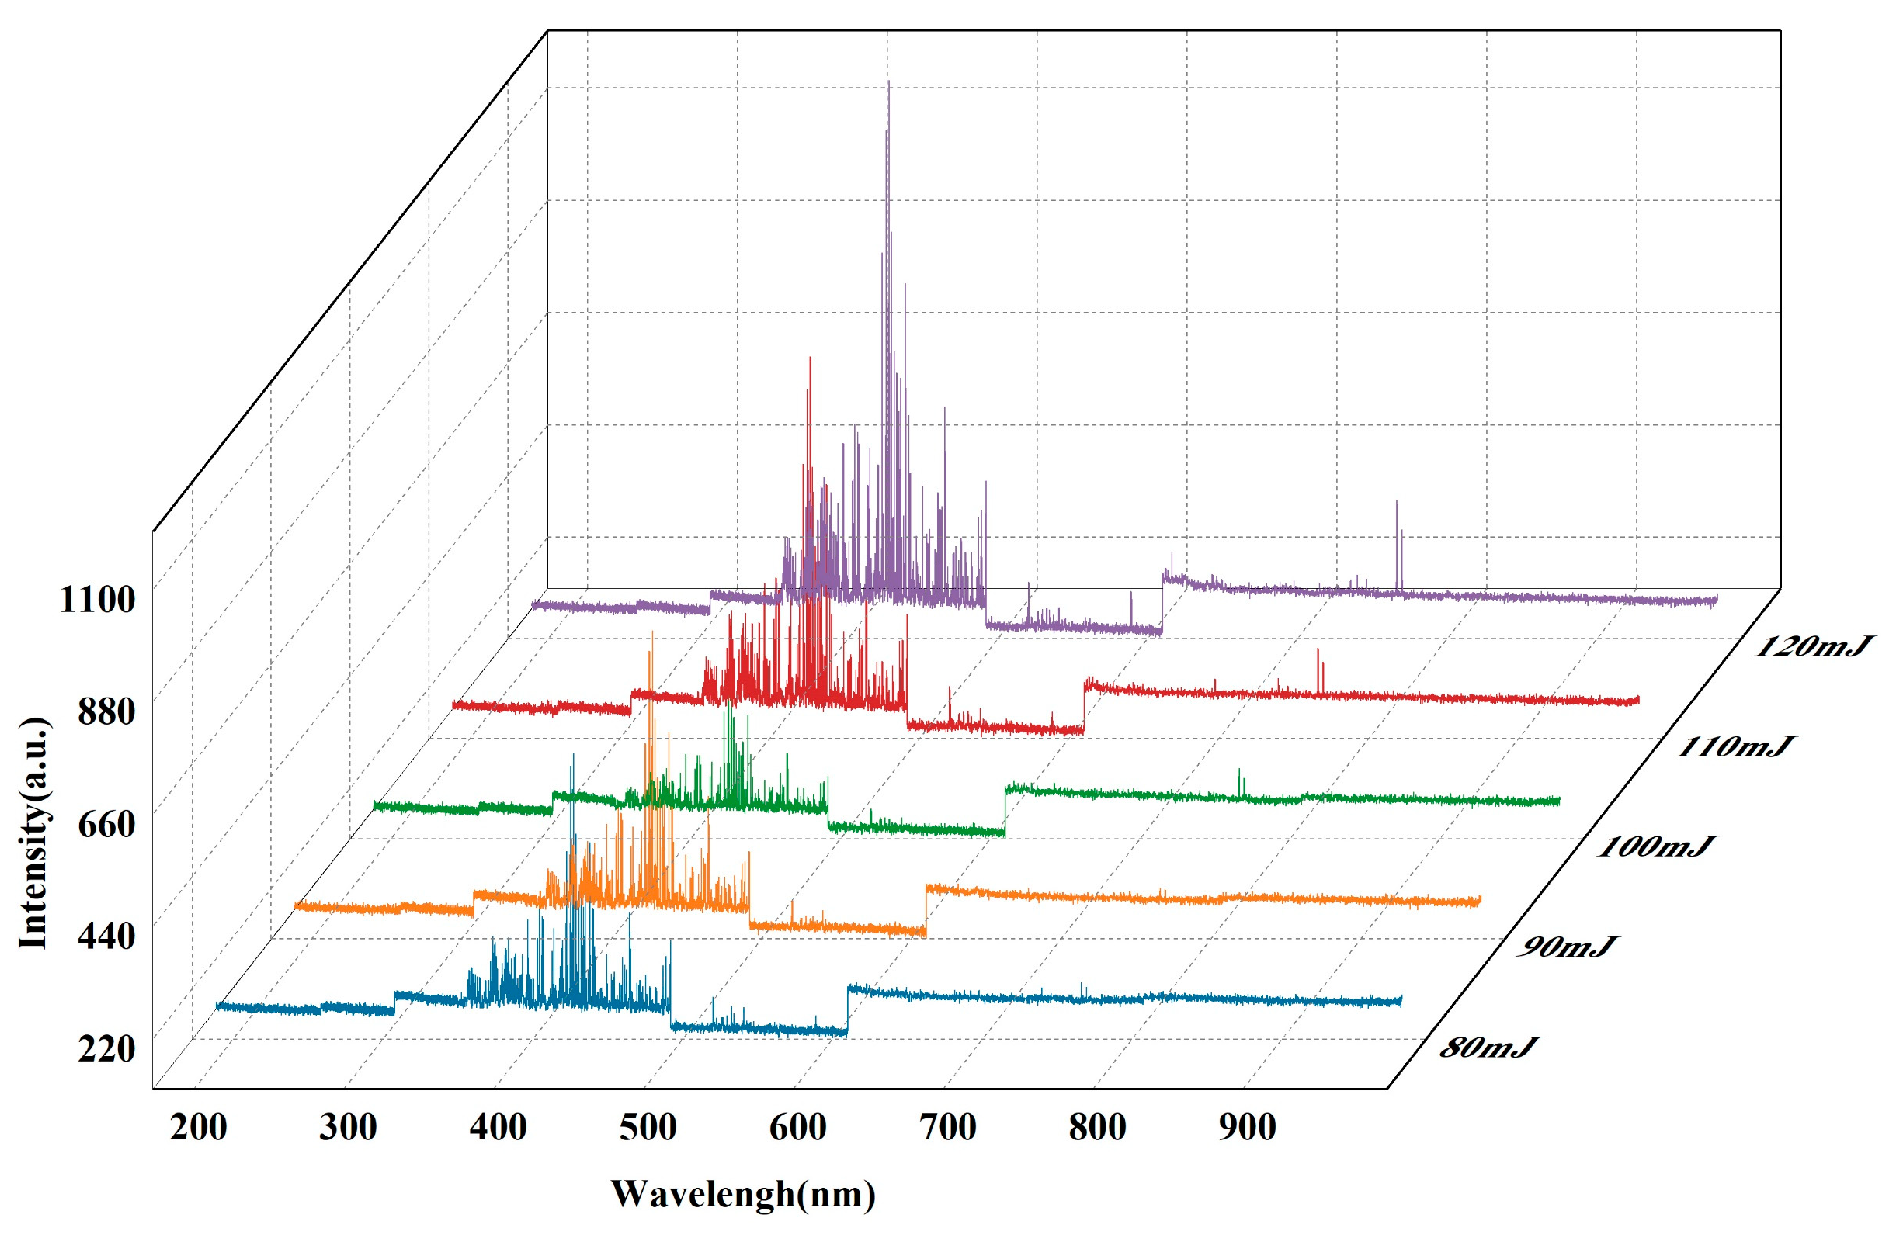
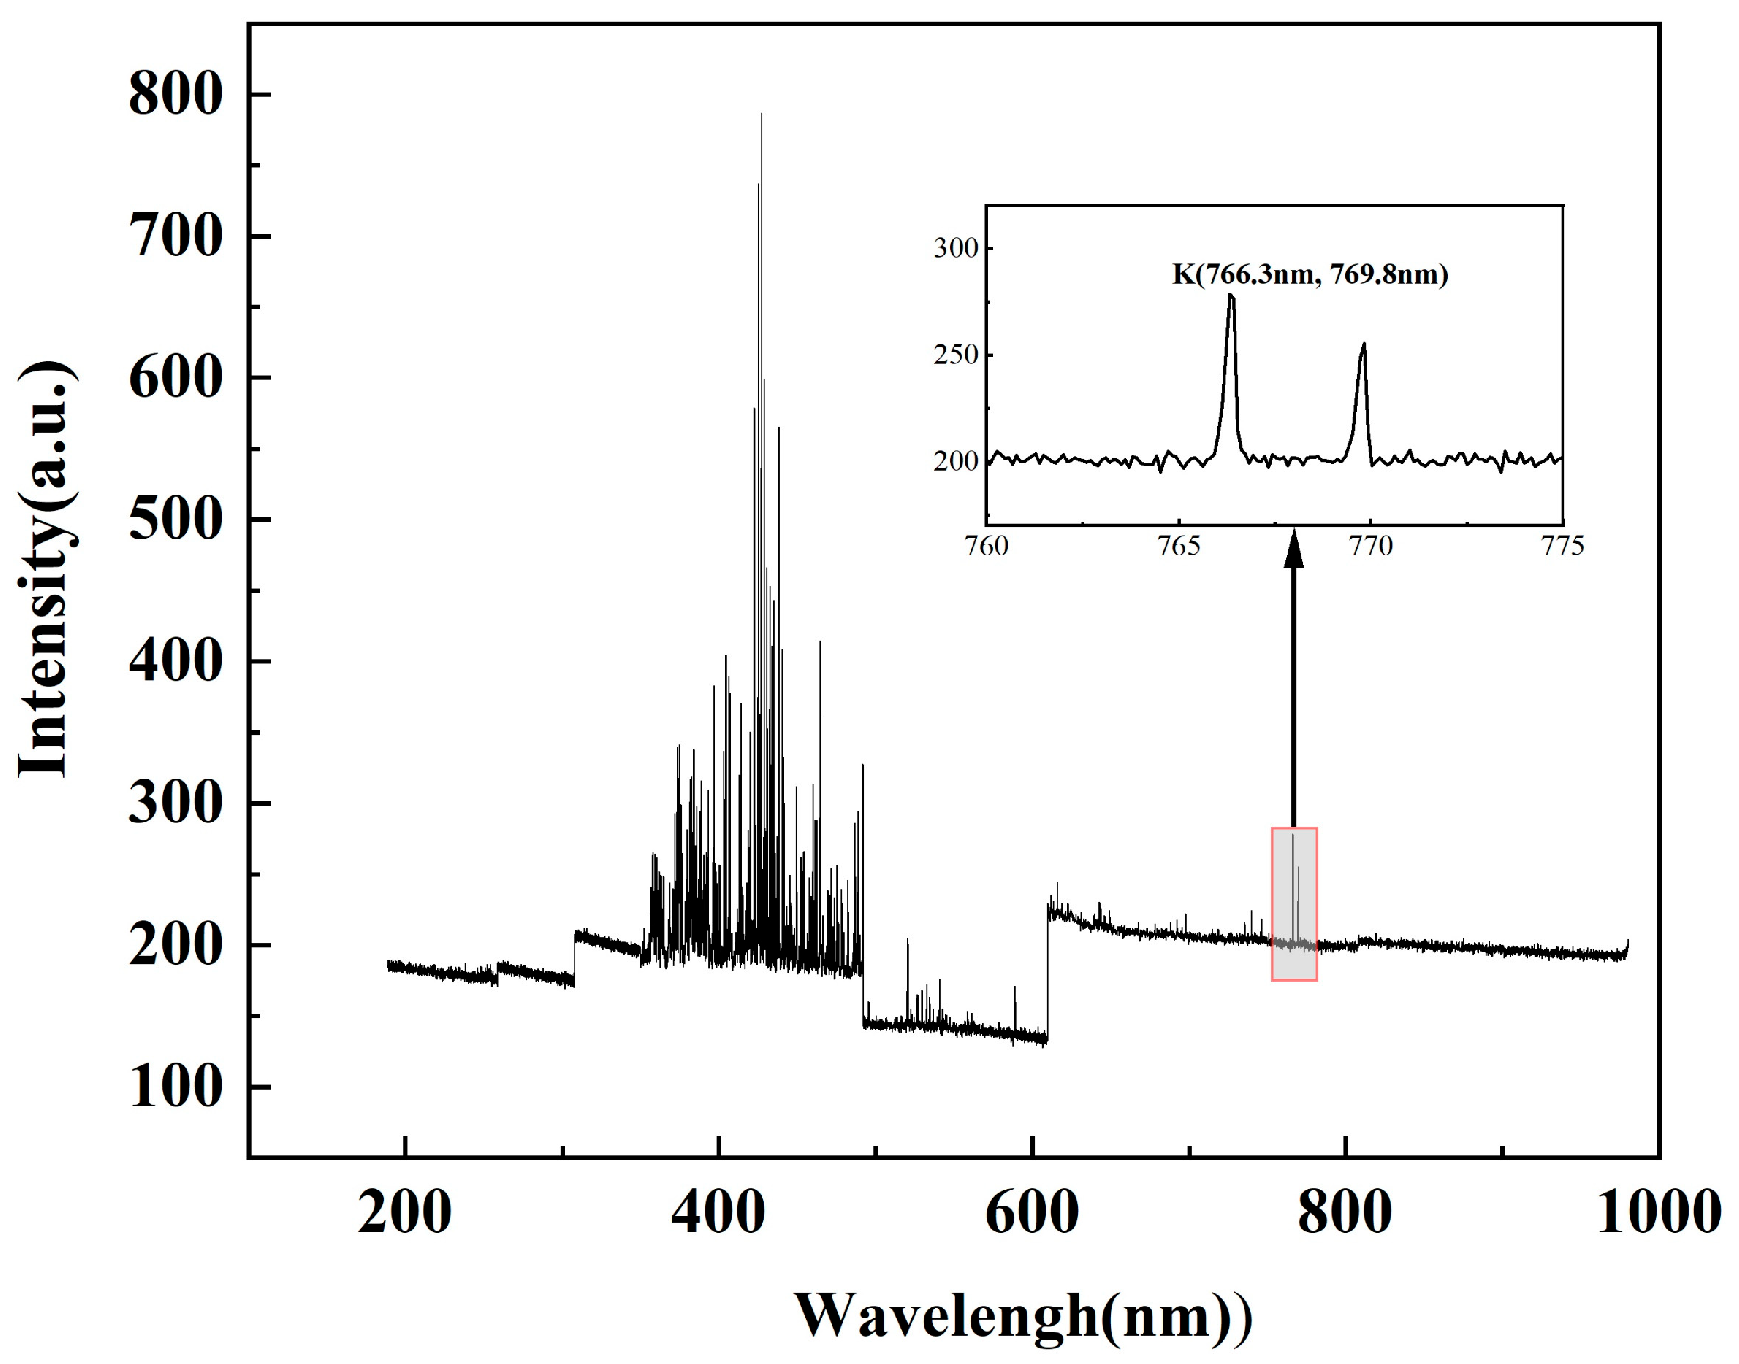
2.2.1. Spectral Analysis Using Laser-Induced Breakdown Spectroscopy
2.2.2. Band Selection for Two-Color Temperature Measurements
2.3. Temperature Calibration Experiment
3. Results
3.1. Accuracy and Uncertainty Analysis
3.1.1. Uncertainty of Gray Body Assumption
3.1.2. Uncertainty of Interference Filters
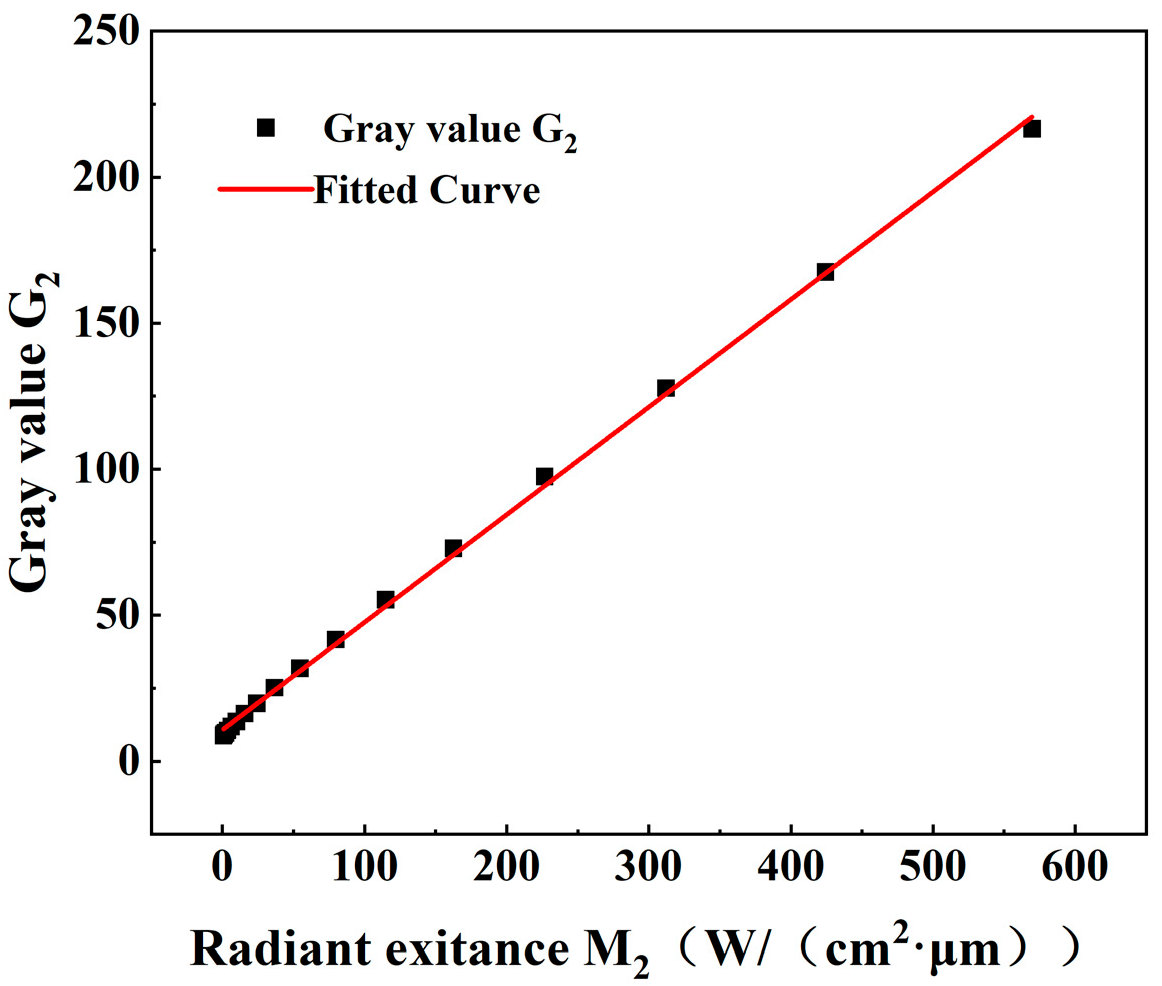
3.1.3. Uncertainty of Conversion from Radiance to Gray Scale Level
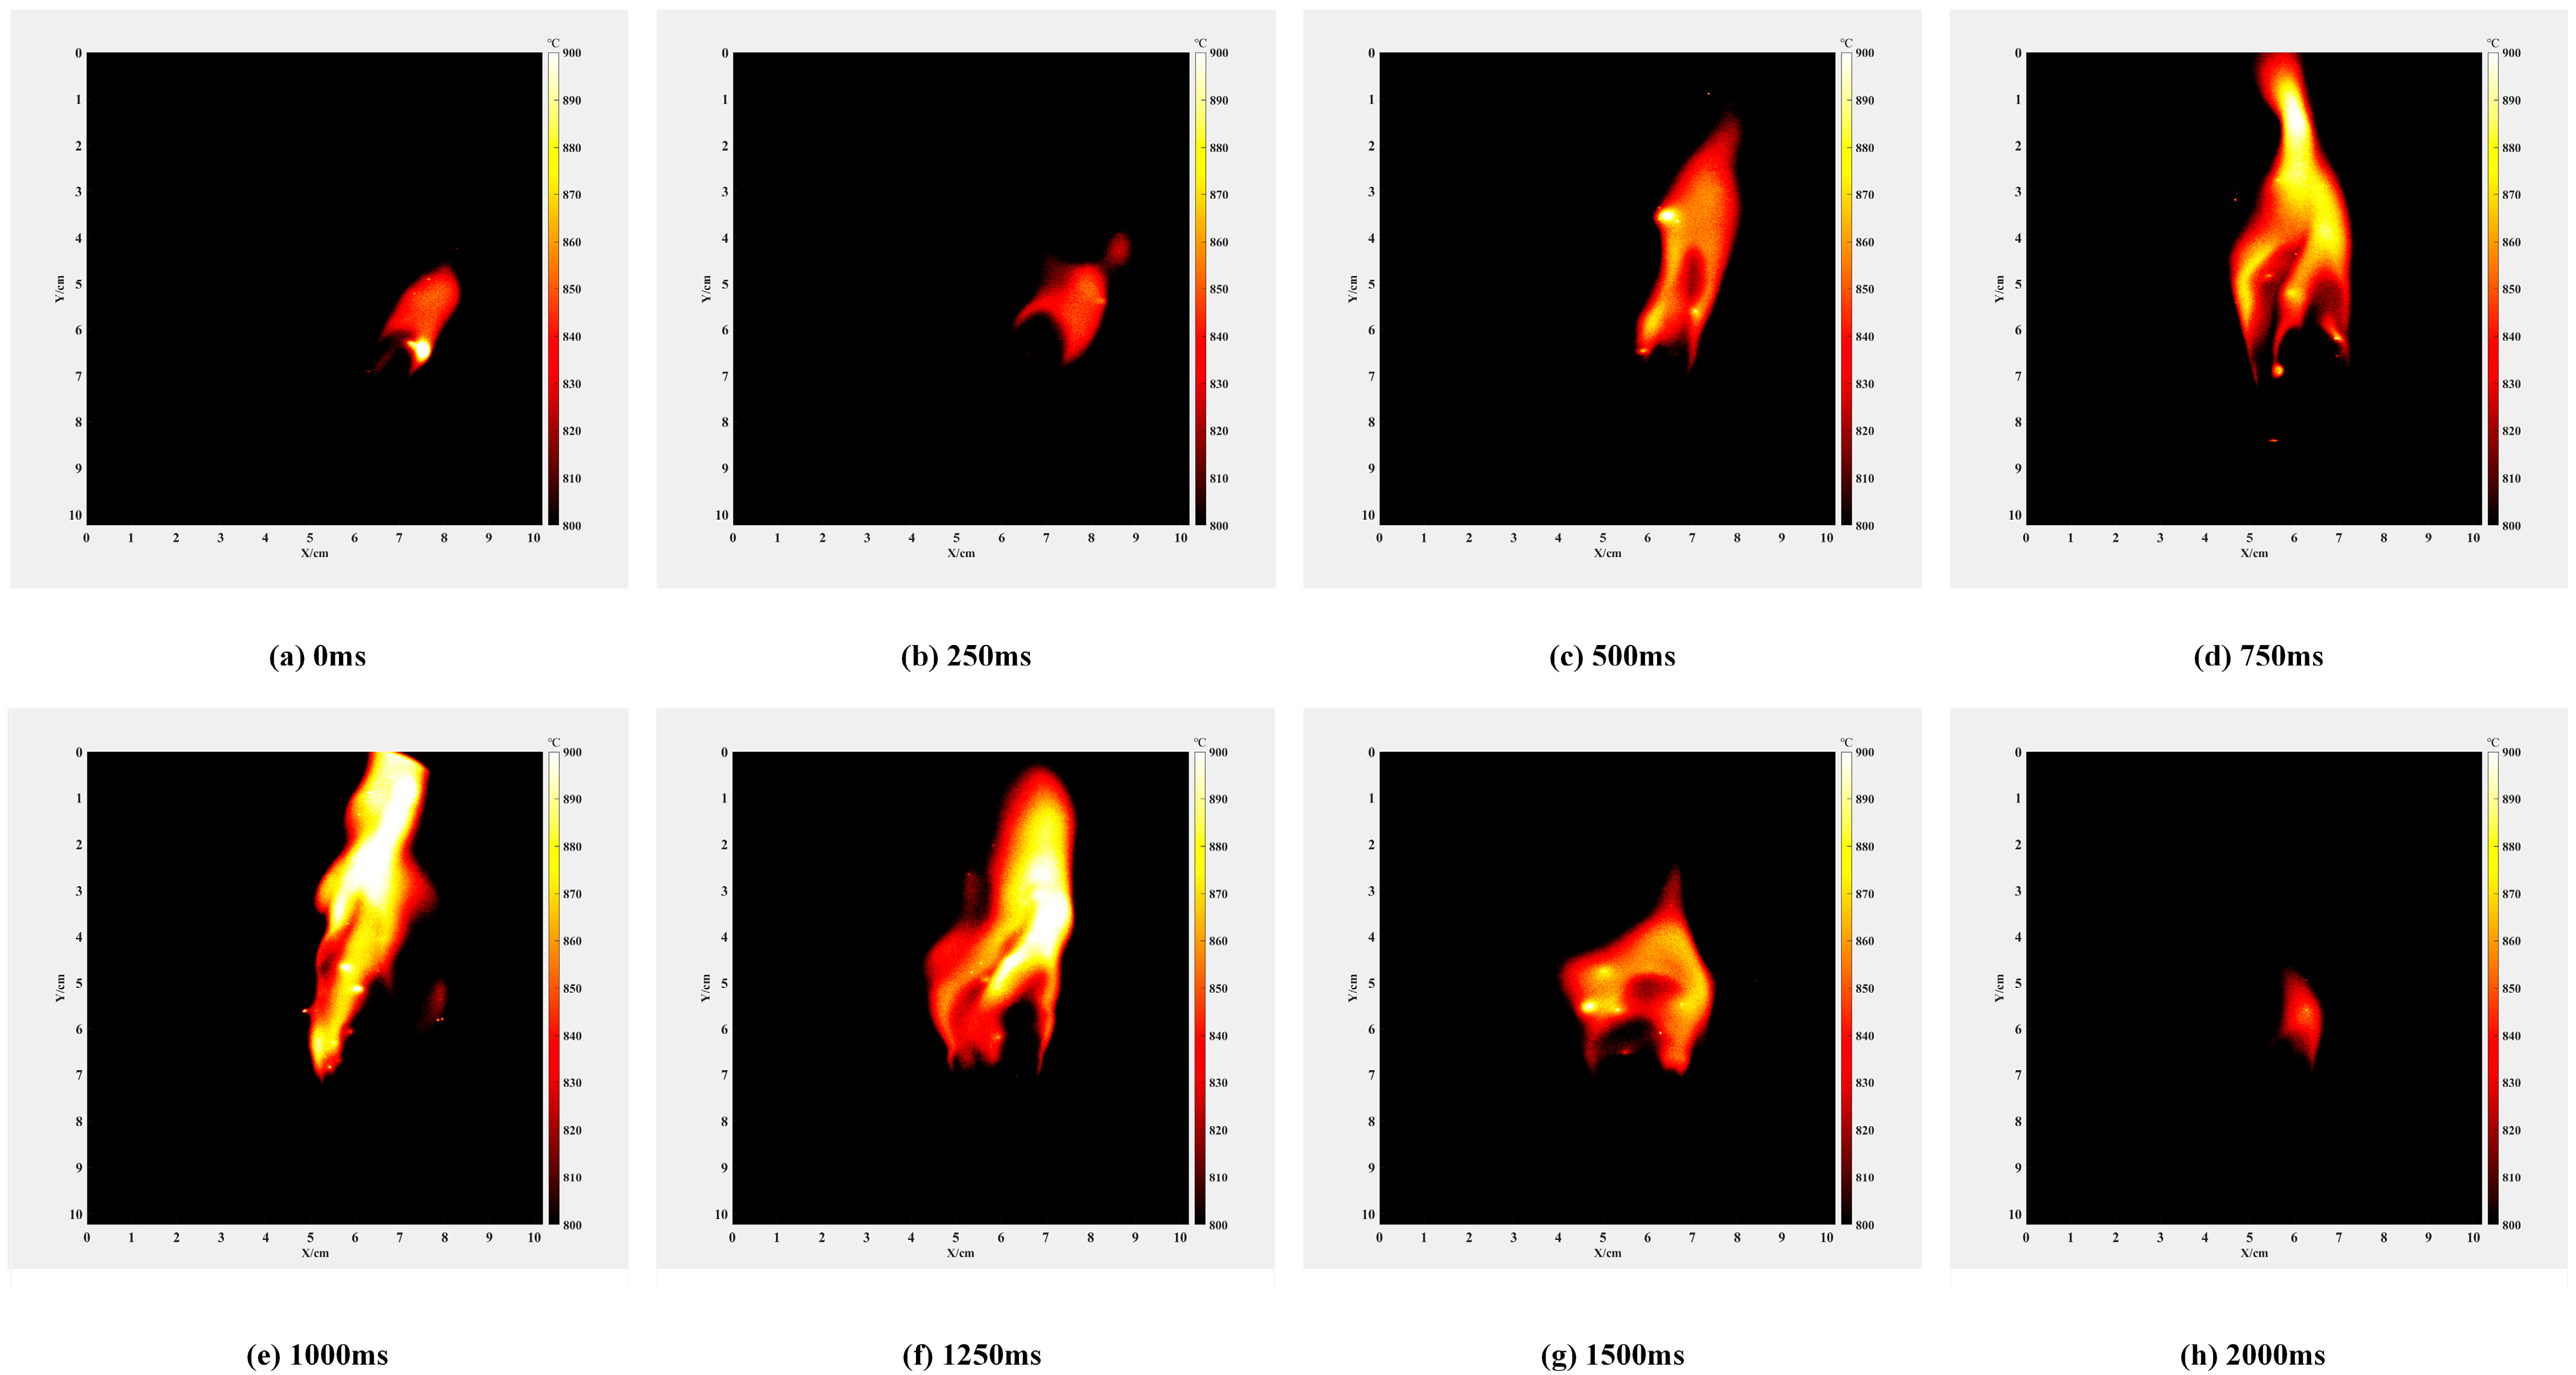
3.2. Nitrocellulose Experiments and Results
- (1)
- (2)
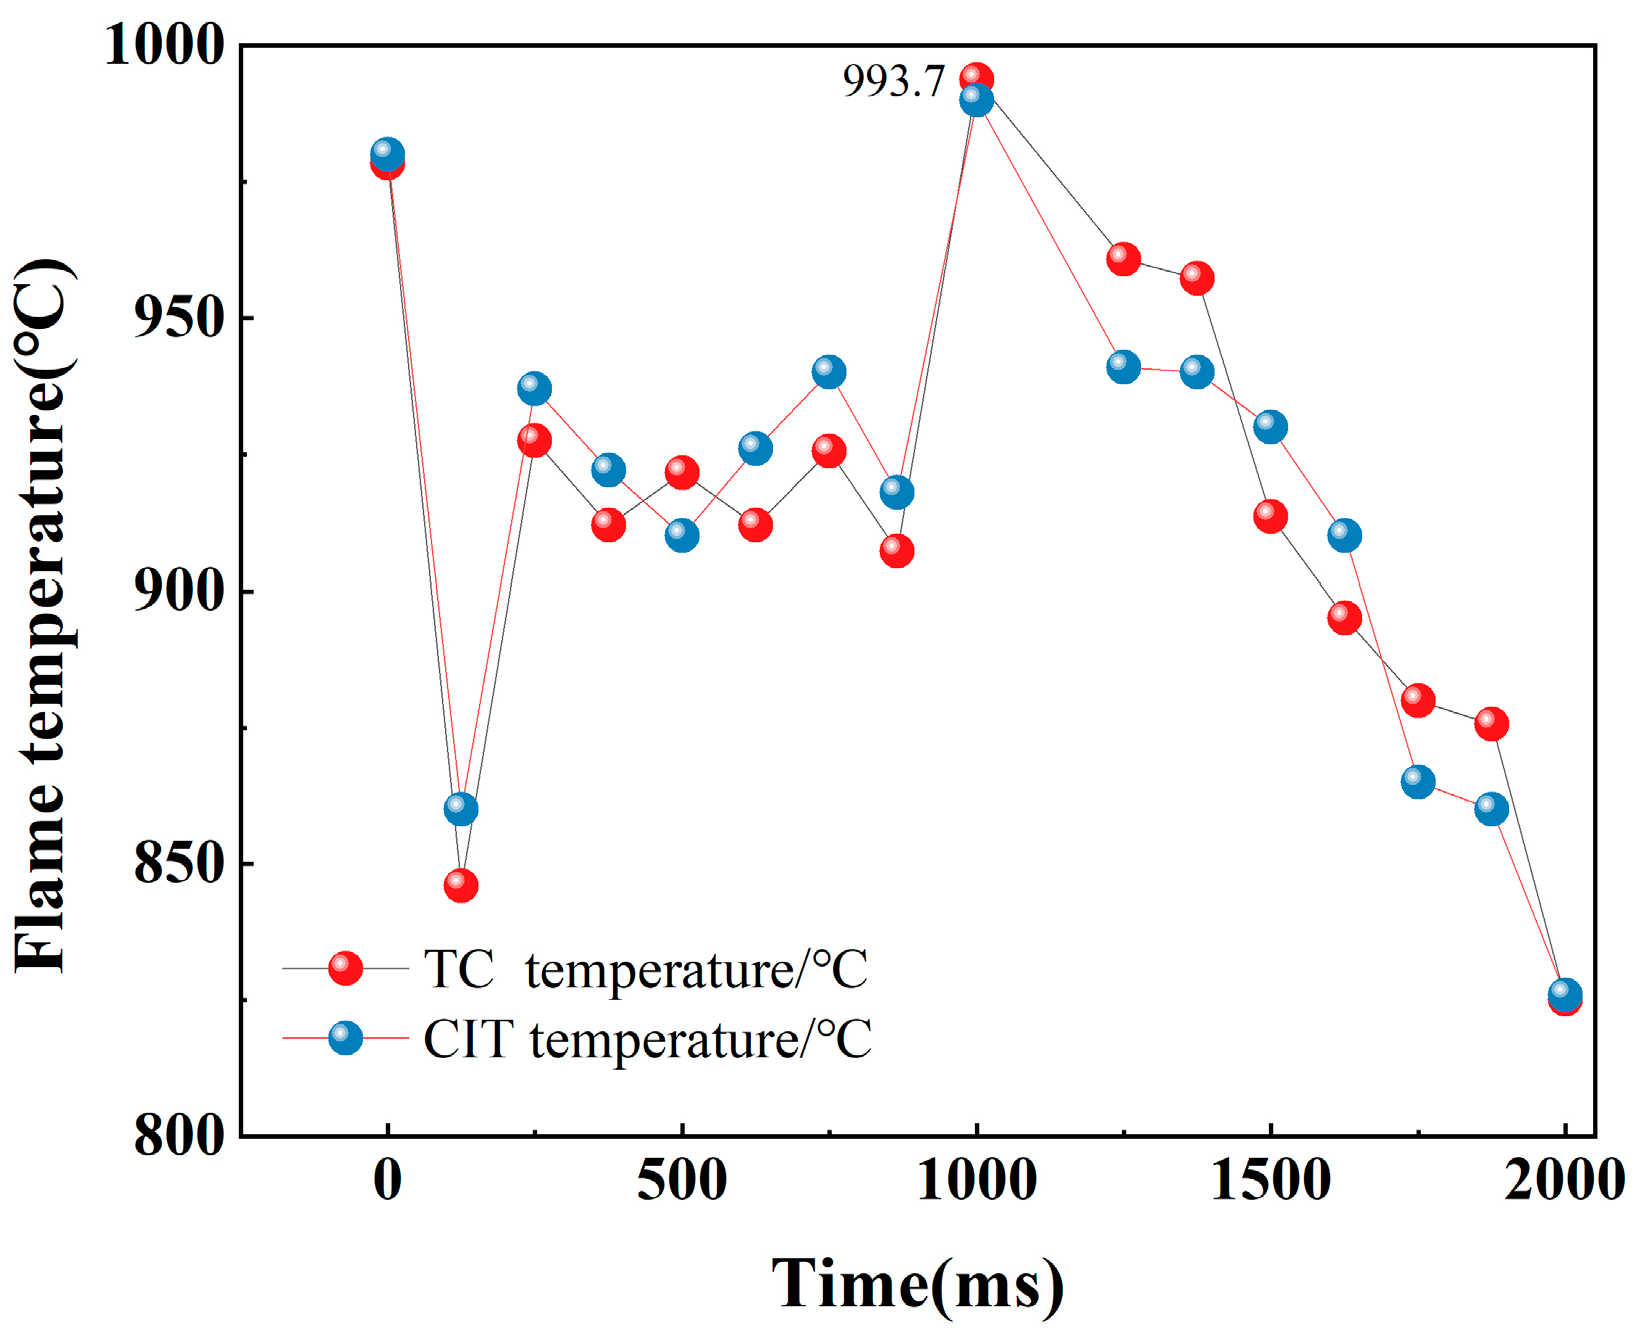
- Figure 12e,f in the full combustion stage: with the expansion of the contact area between the nitrocellulose flame and oxygen, some alkali metals inside the nitrocellulose are violently burned, the flame has some obvious bright spots, and the temperature is also significantly increased, the width of the flame is more than 3.6 cm, the height is more than 7.7 cm, and the maximum temperature of the flame reaches 993.7 °C at the time of 1000 ms in Figure 12e;
- (3)
- Figure 12g,h of the combustion dissipation stage: with the passage of time, the composition of the energetic material gradually decreases, the temperature of the flame also decreases gradually, and the flame becomes smaller and smaller until it is extinguished. The size of the flame is 1.91 cm wide and 4.9 cm high at 2000 ms.
4. Discussion
5. Conclusions
Author Contributions
Funding
Institutional Review Board Statement
Informed Consent Statement
Data Availability Statement
Acknowledgments
Conflicts of Interest
References
- Wang, Y.Q.; Chen, Y.R.; Zhao, Q.; Zhou, M.; Shao, Y. On-Line Measurement of Converter Combustion Flame with Radiation Thermometry and AES. Spectrosc. Spect. Anal. 2017, 37, 1243–1247. [Google Scholar] [CrossRef]
- Li, S.Y.; Zhang, D.Y.; Gao, Q.; Li, B.; He, Y.; Wang, Z. Temperature measurement in a combustion flow field with femtosecond laser-induced filament. Acta Phys. Sin. 2020, 69, 234207. [Google Scholar] [CrossRef]
- Olabode, O.F.; Fletcher, S.; Longstaff, A.P.; Bell, A. Core temperature measurement using ultrasound for high-precision manufacturing processes. Proc. Inst. Mech. Eng. B J. Eng. Manuf. 2023, 237, 09544054221150662. [Google Scholar] [CrossRef]
- Zhang, B.Q.; Xu, Z.Y.; Liu, J.G.; Yao, L.; Ruan, J.; Hu, J.; Xia, H.; Nie, W.; Yuan, F.; Kan, R. Temperature measurement method of high temperature and high-pressure flow field based on wavelength modulation spectroscopy technology. Acta Phys. Sin. 2019, 68, 233301. [Google Scholar] [CrossRef]
- Wang, Z.H.; Fu, P.F.; Hou, L.Y.; Chao, X. Diffuse-reflection-based single-ended laser absorption sensor for H2O temperature and concentration in kerosene-fuelled combustor. Meas. Sci. Technol. 2020, 31, 105202. [Google Scholar] [CrossRef]
- Lee, D.N.; Cho, J.Y. Simplified stochastic temperature model for storage reliability estimation of solid rocket propellants. J. Mech. Sci. Technol. 2023, 37, 411–425. [Google Scholar] [CrossRef]
- Kim, D.; Kubota, Y.; Izato, Y.; Miyake, A. Temperature variation measurements of an ignited energetic ionic liquid. Sci. Technol. Energetic Mater. 2023, 84, 14–16. [Google Scholar]
- Tang, C.; Wang, Y.; Li, Y.; Zeng, S.; Kong, L.; Li, L.; Sun, J.; Zhu, M.; Deng, T. A review of graphene-based temperature sensors. Microelectron. Eng. 2023, 275, 112015. [Google Scholar] [CrossRef]
- Hulewicz, A.; Dziarski, K.; Krawiecki, Z. The Estimated Temperature of the Semiconductor Diode Junction on the Basis of the Remote Thermographic Measurement. Sensors 2023, 23, 1944. [Google Scholar] [CrossRef]
- Yu, Q.; Sun, X.; Gu, S.; Dong, Y. Study on CCD temperature measurement method without channel proportional coefficient calibration. Opt. Laser Technol. 2023, 165, 109625. [Google Scholar] [CrossRef]
- Huang, J.; Li, S.; Sanned, D.; Xu, L.; Xu, S.; Wang, Q.; Stiti, M.; Qian, Y.; Cai, W.; Berrocal, E.; et al. A detailed study on the micro-explosion of burning iron particles in hot oxidizing environments. Combust. Flame 2022, 238, 111755. [Google Scholar] [CrossRef]
- Hsu, P.S.; Jiang, N.; Felver, J.J.; Lauriola, D.K.; Danehy, P.M.; Roy, S. 10 kHz two-color OH PLIF thermometry using a single burst-mode OPO. Opt. Lett. 2021, 46, 2308–2311. [Google Scholar] [CrossRef]
- Satija, A.; Lucht, R.P. Simultaneous Temperature and Pressure Measurements in Compressible Flow Using Nanosecond O2 Coherent Anti-Stokes Raman Spectroscopy. Appl. Spectrosc. 2022, 76, 541–547. [Google Scholar] [CrossRef] [PubMed]
- Moller, S.; Käufer, T.; Pandey, A.; Schumacher, J.; Cierpka, C. Combined particle image velocimetry and thermometry of turbulent superstructures in thermal convection. J. Fluid Mech. 2022, 945, A22. [Google Scholar] [CrossRef]
- Wang, L.Y.; Du, H.M.; Xu, H. Compensation method for infrared temperature measurement of explosive fireball. Thermochim. Acta 2019, 680, 178342. [Google Scholar] [CrossRef]
- Li, Y.; Pan, D.; Jiang, Z.; Yu, H.; Gui, W. Adaptive Compensation Method for the Infrared Temperature Measurement Error Based on 3D Thermal Imaging. IEEE Sens. J. 2023, 23, 13200–13208. [Google Scholar]
- Lin, J.; Zhang, X.; Liu, K.; Zhang, W. Emissivity characteristics of hydrocarbon flame and temperature measurement by color image Processing. Energies 2019, 12, 2185. [Google Scholar] [CrossRef]
- Li, C.; Kong, D.; Wang, Y.; Gao, L.; Zhang, X.; Zhang, Q. Color CCD High-Temperature Measurement Method Based on Matrix Searching. Appl. Sci. 2023, 13, 5334. [Google Scholar] [CrossRef]
- Zhang, X.; Zeng, C.B.; Liu, X.Y.; Chen, P.; Han, Y. Multispectral Temperature Measurement Method Based on Multivariate Extreme Value Optimization. Spectrosc. Spect. Anal. 2023, 43, 705–709. [Google Scholar]
- Wang, Z.; Dai, J.; Yang, S. The development of a multispectral pyrometer for achievable proper temperature field measurements of the explosion flame. Meas. Sci. Technol. 2023, 34, 065501. [Google Scholar] [CrossRef]
- Campbell, N.R.; Gardiner, H.W.B. Photo-electric colour-matching. J. Sci. Instrum. 1925, 2, 177–187. [Google Scholar]
- Zhou, H.C.; Lou, C.; Cheng, Q. Experimental investigations on visualization of three-dimensional temperature distributions in a large-scale pulverized-coal-fired boiler furnace. Proc. Combust. Inst. 2005, 30, 1699–1706. [Google Scholar] [CrossRef]
- Luo, Z.; Zhou, H.C. A combustion-monitoring system with 3-D temperature reconstruction based on flame-image processing technique. IEEE Trans. Instrum. Meas. 2007, 56, 1877–1882. [Google Scholar] [CrossRef]
- Yan, W.; Zhou, H.; Jiang, Z.; Lou, C.; Zhang, X.; Chen, D. Experiments on measurement of temperature and emissivity of municipal solid waste (MSW) combustion by spectral analysis and image processing in visible spectrum. Energy Fuels 2013, 27, 6754–6762. [Google Scholar] [CrossRef]
- Huang, Y.; Long, M.; Fan, H.; Gui, L.; Chen, D.; Duan, H. Quantifying the Effects of Combustion Gases’ Radiation on Surface Temperature Measurements Using Two-Color Pyrometry. Energy Fuels 2019, 33, 3610–3619. [Google Scholar] [CrossRef]
- Huang, Y.; Long, J.; Chen, D.; Long, M.; Yang, Z.; Li, C. Temperature errors in two-color pyrometry simultaneously considering reflection and combustion gas radiation. Opt. Express 2021, 29, 25084–25099. [Google Scholar] [CrossRef]
- Zhang, Q.W.; Cheng, Y.F.; Xia, Y.; Wang, Z.; Wang, Q.; Shen, Z. Application of two-color thermometry pyrometer in the measurement of transient explosion temperature. Explos. Shock Waves 2022, 42, 114101. [Google Scholar]
- Li, C.; Xu, C.; Wang, Y.; Gao, L.; Zhang, X.; Zhang, Q.; Kong, D. Study on the Influence of Internal Modulation Parameters on the Temperature Calculation Performance of Matrix-Searching CCD Pyrometer. Meas. Sci. Technol. 2024, 35, 36002. [Google Scholar] [CrossRef]
- Cheng, Y.F.; Yao, Y.L.; Wang, Z.H.; Zhang, B.B.; Xia, Y.; Liu, R.; Shu, C.M. An improved two-colour pyrometer based method for measuring dynamic temperature mapping of hydrogen-air combustion. Int. J. Hydrogen Energy 2021, 46, 34463–34468. [Google Scholar] [CrossRef]
- Corral-Gómez, L.; Armas, O.; Soriano, J.A.; Pastor, J.; Garcia-Oliver, J.M.; Mico, C. An Optical Engine Used as a Physical Model for Studies of the Combustion Process Applying a Two-Color Pyrometry Technique. Energies 2022, 15, 4717. [Google Scholar] [CrossRef]
- Sawada, S.; Okada, D.; Nakatsuka, N.; Tainaka, K.; Hori, T.; Hayashi, J.; Akamatsu, F. Effects of ambient temperature on the combustion processes of single pulverized coal particle. J. Therm. Sci. Technol. 2021, 16, JTST0011. [Google Scholar] [CrossRef]
- Hu, K.; Xu, Y.; Li, M.; Gu, X. Research on 2D Temperature Field Measurement Method of Mg/CO2 Combustion Flame Based on Color CCD. IOP Conf. Ser. Earth Environ. Sci. 2021, 631, 012116. [Google Scholar] [CrossRef]
- Yu, T.; Bauer, F.J.; Huber, F.J.; Will, S.; Cai, W. 4D temperature measurements using tomographic two-color pyrometry. Opt. Express 2021, 29, 5304–5315. [Google Scholar] [CrossRef] [PubMed]
- Xu, X.G.; Wei, K.P.; Feng, L.H.; Yang, B.; Ping, L.; Xu, Q.; Liu, J.; Wang, Y. Research on Radiation Spectroscopy Thermometry of Plume of Solid Rocket Motor. Spectrosc. Spect. Anal. 2021, 41, 305–311. [Google Scholar]
- Hao, W.Y.; Hao, X.J.; Yang, Y.W.; Liu, X.; Liu, Y.; Sun, P.; Sun, R. Rapid classification of soils from different mining areas by laser-induced breakdown spectroscopy (LIBS) coupled with a PCA-based convolutional neural network. J. Anal. At. Spectrom. 2021, 36, 2509–2518. [Google Scholar] [CrossRef]
- Jin, H.Y.; Hao, X.J.; Mo, B.M. Rapid classification of heavy metal soils from different mining areas by using a GSCV quadratic merit seeking network combined with MF-LIBS. J. Anal. At. Spectrom. 2023, 38, 2280–2290. [Google Scholar] [CrossRef]
- Mason, P.E.; Darvell, L.I.; Jones, J.M.; Williams, A. Observations on releasing gas-phase potassium during the combustion of single biomass particles. Fuel 2016, 182, 110–117. [Google Scholar] [CrossRef]
- De Lucia, F.C.; Harmon, R.S.; McNesby, K.L.; Winkel, R.J.J.; Miziolek, A.W. Laser-induced breakdown spectroscopy analysis of energetic materials. Appl. Opt. 2003, 42, 6148–6152. [Google Scholar] [CrossRef]
- Kramida, A.; Ralchenko, Y.; Reader, J.; NIST ASD Team. NIST Atomic Spectra Database (Version 5.10). Available online: https://physics.nist.gov/asd (accessed on 24 September 2024).
- Liu, X.D.; Hao, X.J.; Xue, B.; Tai, B.; Zhou, H. Two-dimensional flame temperature and emissivity distribution measurement based on element doping and energy spectrum analysis. IEEE Access 2020, 8, 200863–200874. [Google Scholar] [CrossRef]
- Sun, Y.; Lou, C.; Zhou, H. A simple judgment method of gray property of flames based on spectral analysis and the two-color method for measurements of temperatures and emissivity. Proc. Combust. Inst. 2011, 33, 735–741. [Google Scholar] [CrossRef]
- Xue, B.; Hao, X.J.; Liu, X.D.; Tai, B.; Zhou, H. Simulation of an NSGA-III based fireball inner-temperature-field reconstructive method. IEEE Access 2020, 8, 43908–43919. [Google Scholar]
- Wang, J.; Hao, X.J.; Pan, B.W.; Huang, X.; Sun, H.; Pei, P. Spectroscopic measurement of the two-dimensional flame temperature based on a perovskite single photodetector. Opt. Express 2023, 31, 8098–8109. [Google Scholar] [CrossRef] [PubMed]
- Wang, J.; Hao, X.J.; Pan, B.W.; Huang, X.; Sun, H.; Pei, P. Perovskite single-detector visible-light spectrometer. Opt. Lett. 2023, 48, 399–402. [Google Scholar] [CrossRef] [PubMed]
- Tucsen Photonics Co., Ltd. Dhyana 400BSI V2. Available online: https://www.tucsen.com/Home/Product/info/dataid/27.html (accessed on 2 September 2024).
- Monier, R.; Thumerel, F.; Chapuis, J.; Soulie, F.; Bordreuil, C. Liquid metals surface temperature fields measurements with a two-colour pyrometer. Measurement 2017, 101, 72–80. [Google Scholar] [CrossRef]
- Huang, X.; Hao, X.; Pan, B.; Liang, X.; Wang, Z.; Feng, S.; Pei, P.; Zhang, H. Flame Imaging Technology Based on 64-Pixel Area Array Sensor. Micromachines 2024, 15, 44. [Google Scholar] [CrossRef]


| Wavelength Interval (nm) | 10 | 20 | 30 | 40 | 50 | 60 |
|---|---|---|---|---|---|---|
| Error (%) | 3.80 | 2.41 | 1.52 | 0.79 | 0.80 | 0.80 |
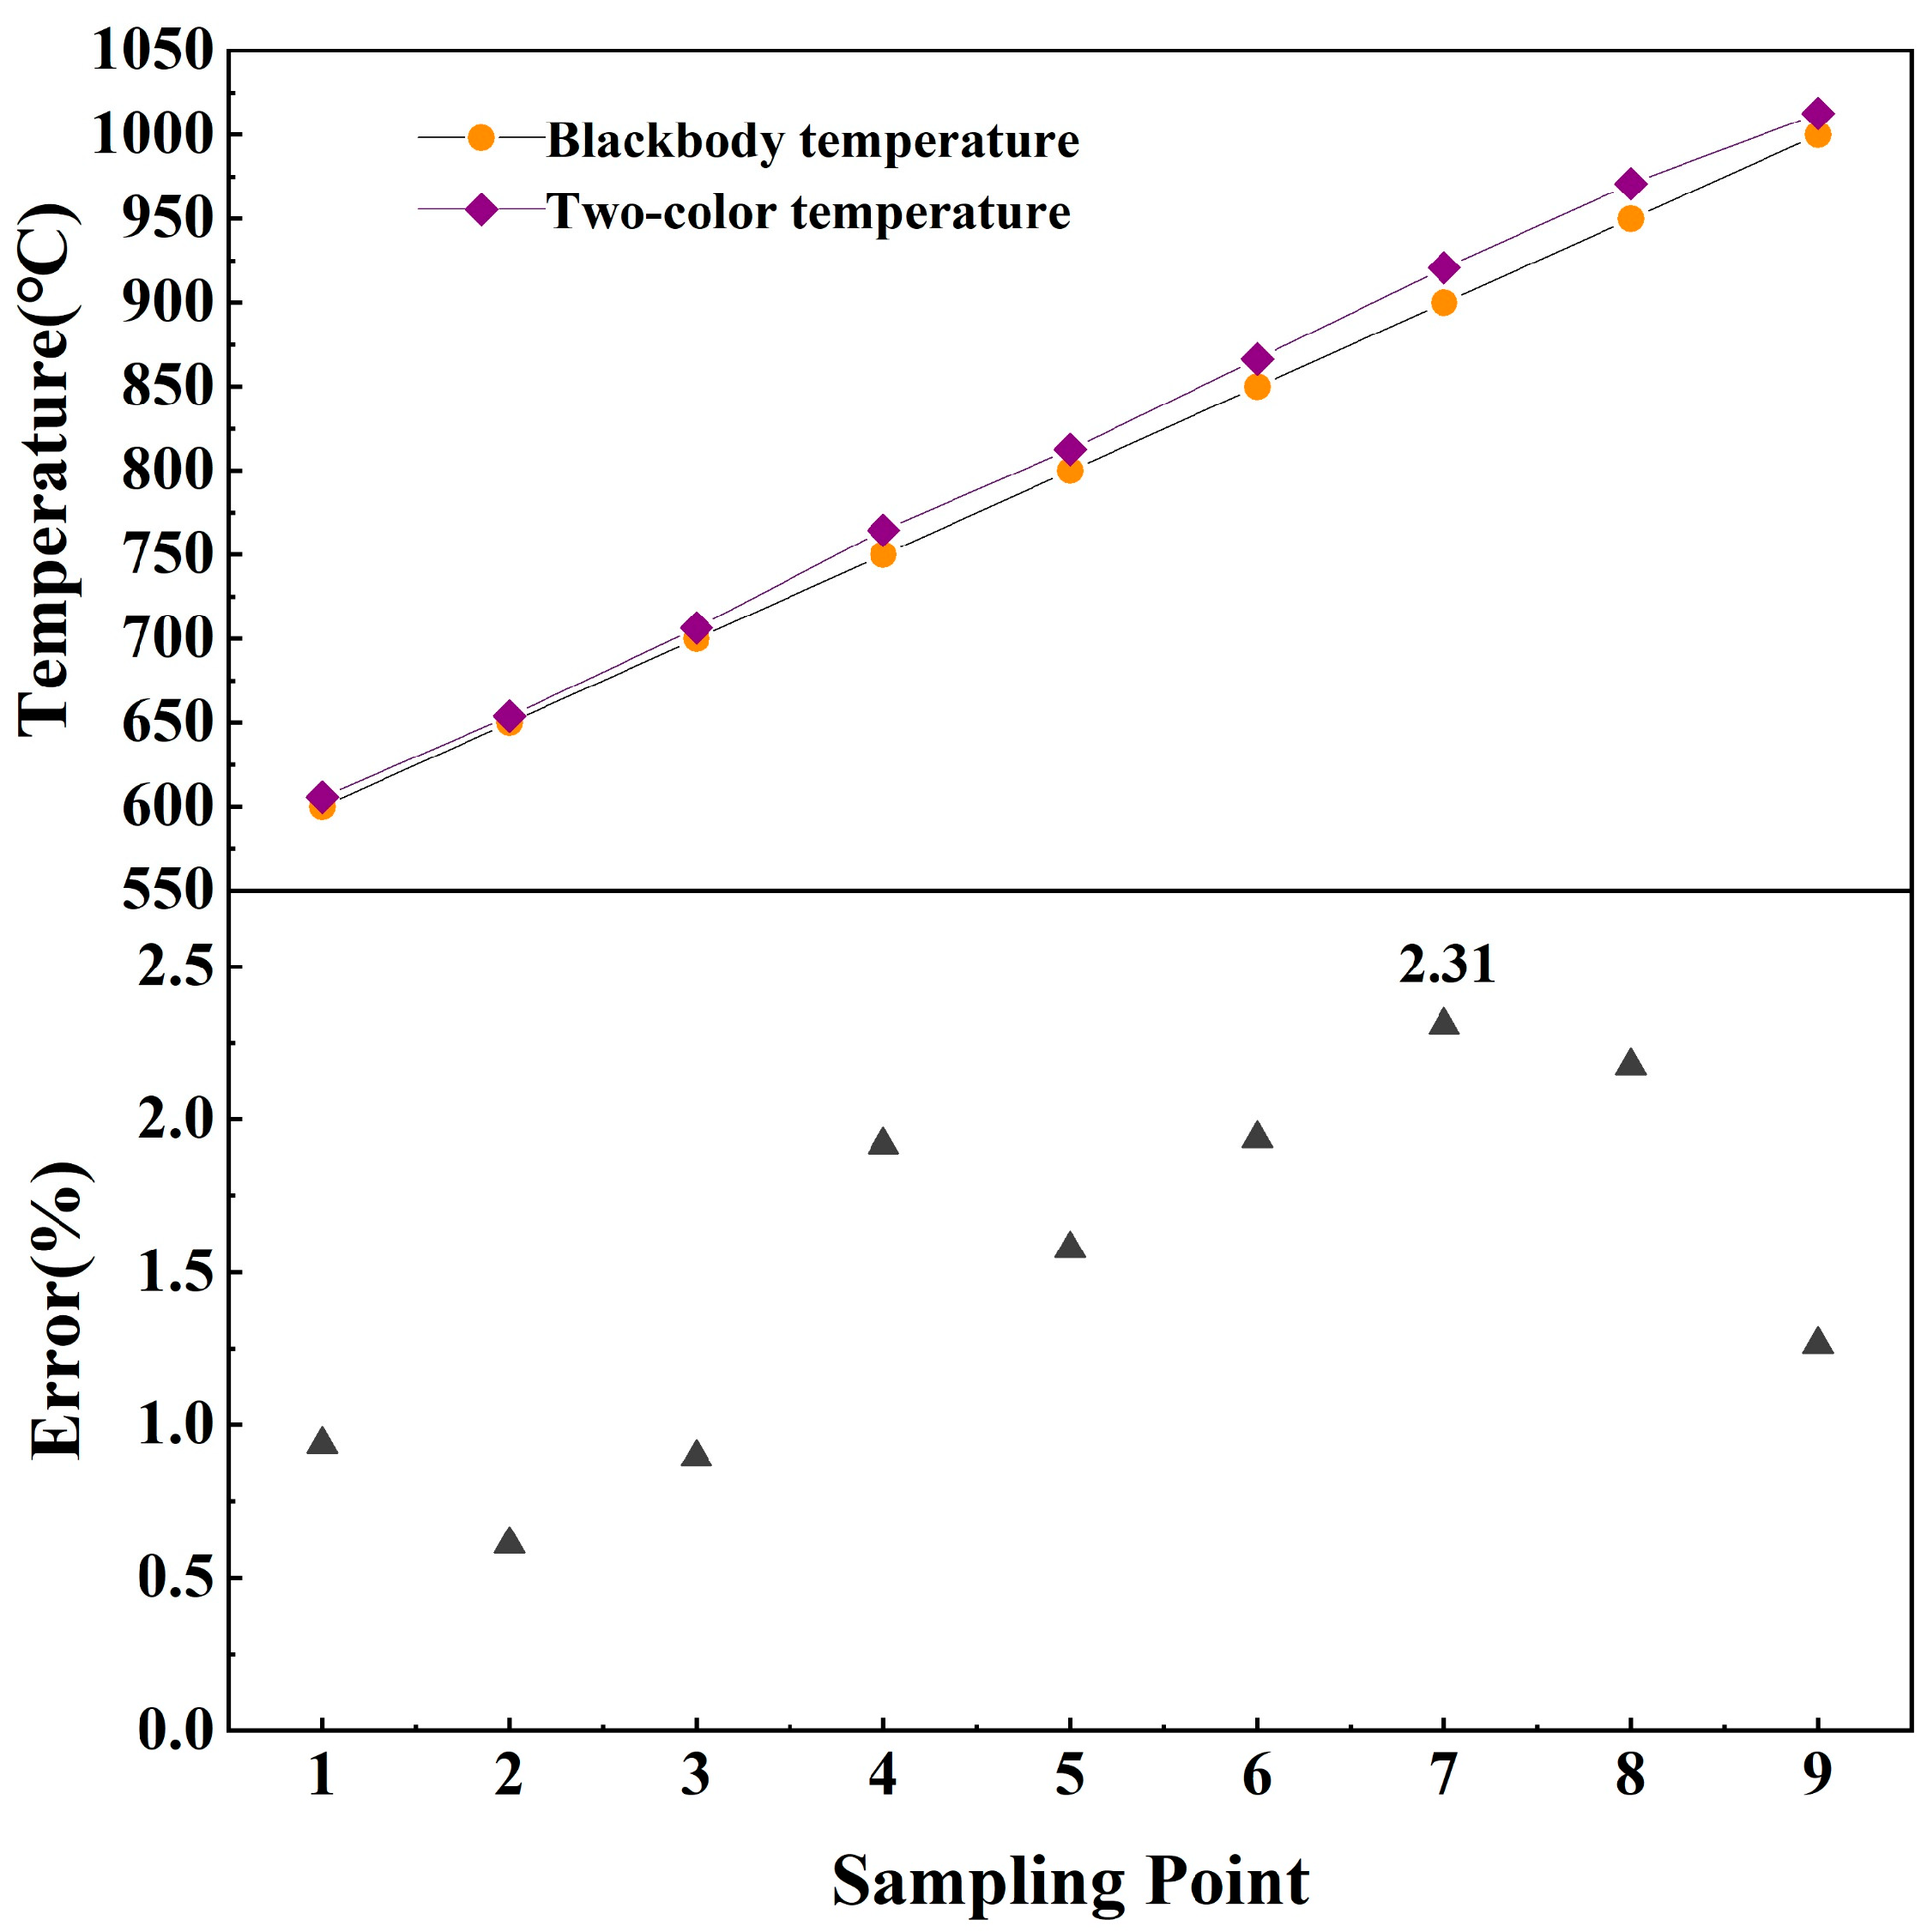
| Sampling Point | G1 | G2 | Blackbody Temperature/°C | Two-Color Pyrometry Temperature/°C | Temperature Measurement Error/% |
|---|---|---|---|---|---|
| 1 | 6 | 9.1 | 600 | 605.63 | 0.94 |
| 2 | 6.29 | 10.5 | 650 | 653.96 | 0.61 |
| 3 | 6.7 | 11.89 | 700 | 706.26 | 0.89 |
| 4 | 8.26 | 16.68 | 750 | 764.38 | 1.92 |
| 5 | 11 | 24 | 800 | 812.61 | 1.58 |
| 6 | 17.37 | 39.6 | 850 | 866.47 | 1.94 |
| 7 | 32 | 72.89 | 900 | 920.76 | 2.31 |
| 8 | 55.77 | 122.5 | 950 | 970.68 | 2.18 |
| 9 | 102 | 216.51 | 1000 | 1012.63 | 1.26 |
| 600 °C | 650 °C | 700 °C | 750 °C | 800 °C | 850 °C | 900 °C | 950 °C | 1000 °C | |
|---|---|---|---|---|---|---|---|---|---|
| 0.177 | 0.058 | 0.130 | 0.351 | 0.322 | 0.357 | 0.413 | 0.422 | 0.465 | |
| 0.75 | 0.75 | 0.75 | 0.75 | 0.75 | 0.75 | 0.75 | 0.75 | 0.75 | |
| 1.083 | 1.026 | 1.060 | 1.172 | 1.157 | 1.175 | 1.205 | 1.210 | 1.234 | |
| 0.00247 | 0.00125 | 0.00133 | 0.00164 | 0.00060 | 0.00201 | 0.01128 | 0.00216 | 0.00478 |
| 600 °C | 650 °C | 700 °C | 750 °C | 800 °C | 850 °C | 900 °C | 950 °C | 1000 °C | |
|---|---|---|---|---|---|---|---|---|---|
| 0.92% | 0.97% | 0.94% | 0.85% | 0.86% | 0.85% | 0.83% | 0.83% | 0.81% | |
| 2.13% | 2.17% | 2.15% | 2.09% | 2.09% | 2.08% | 2.07% | 2.07% | 2.06% | |
| 1.23% | 1.30% | 1.26% | 1.14% | 1.15% | 1.13% | 1.11% | 1.10% | 1.08% | |
| 1.29% | 2.11% | 0.97% | 0.40% | 0.16% | 0.48% | 2.27% | 0.42% | 0.83% | |
| 2.93% | 3.43% | 2.83% | 2.56% | 2.55% | 2.57% | 3.37% | 2.52% | 2.60% |
| 0.3 g | 0.2 g | 0.1 g | ||||
|---|---|---|---|---|---|---|
| 0% | 5% | 0% | 5% | 0% | 5% | |
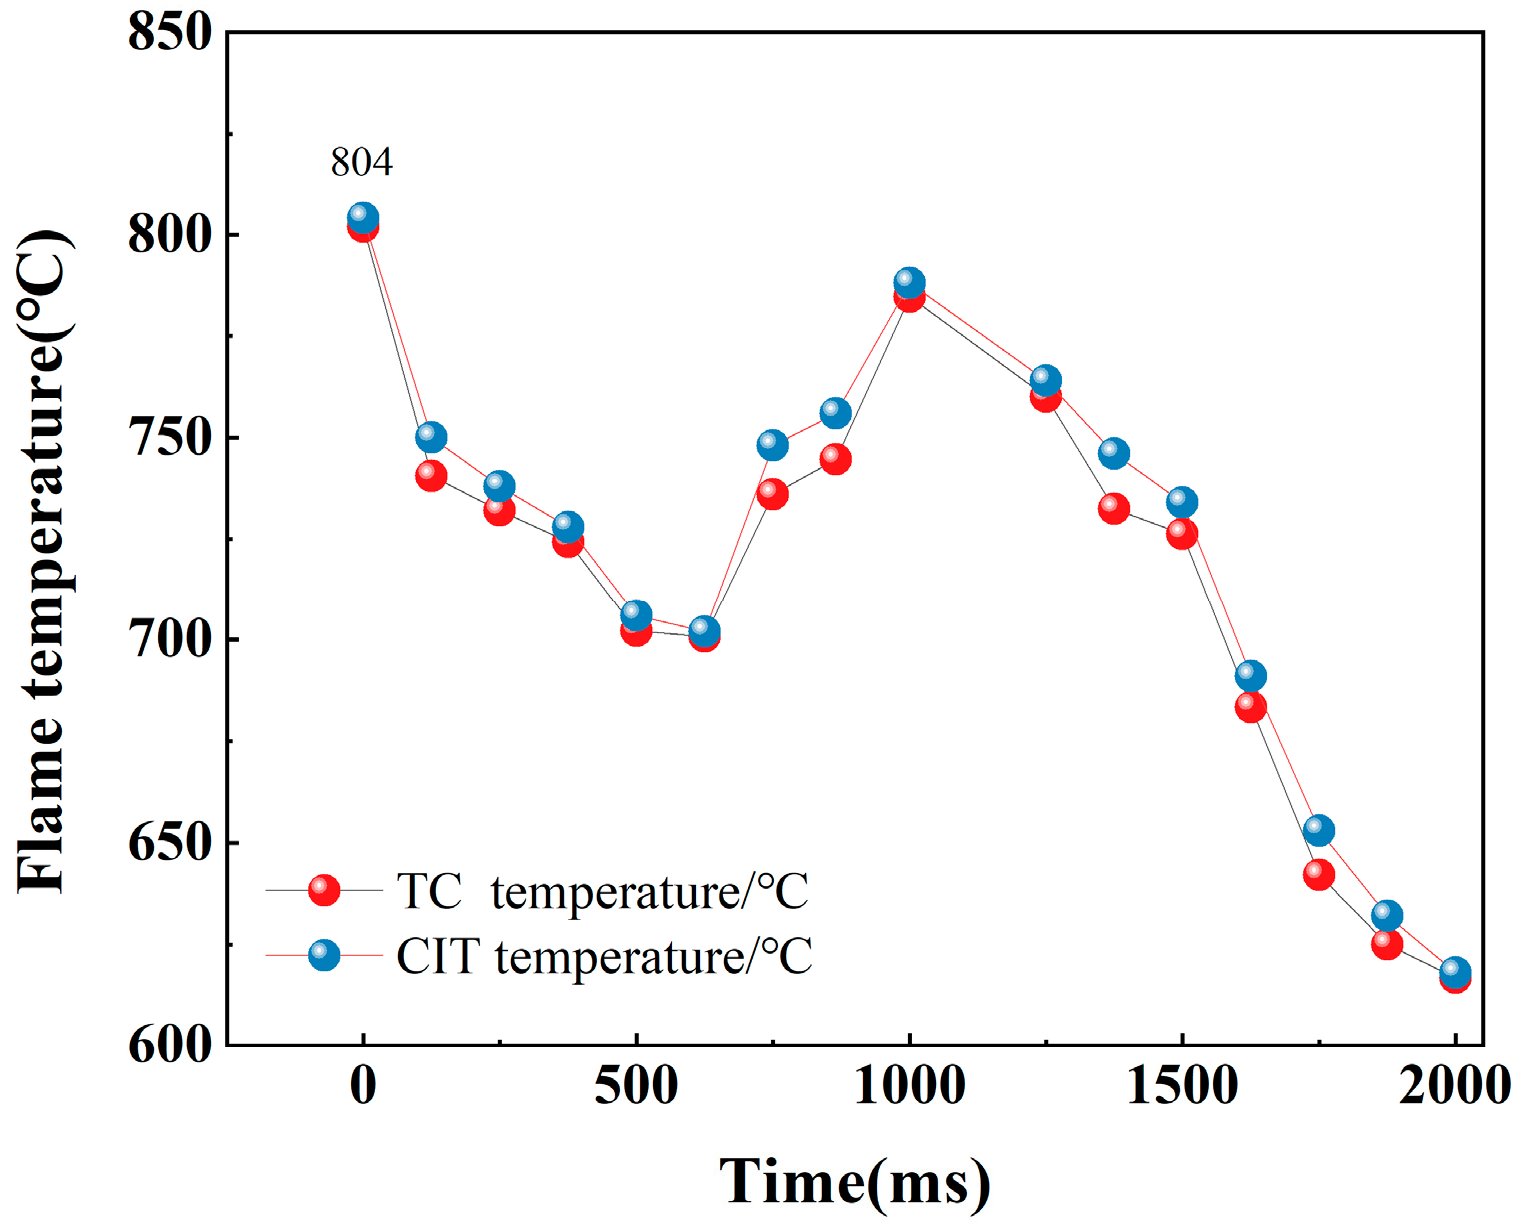
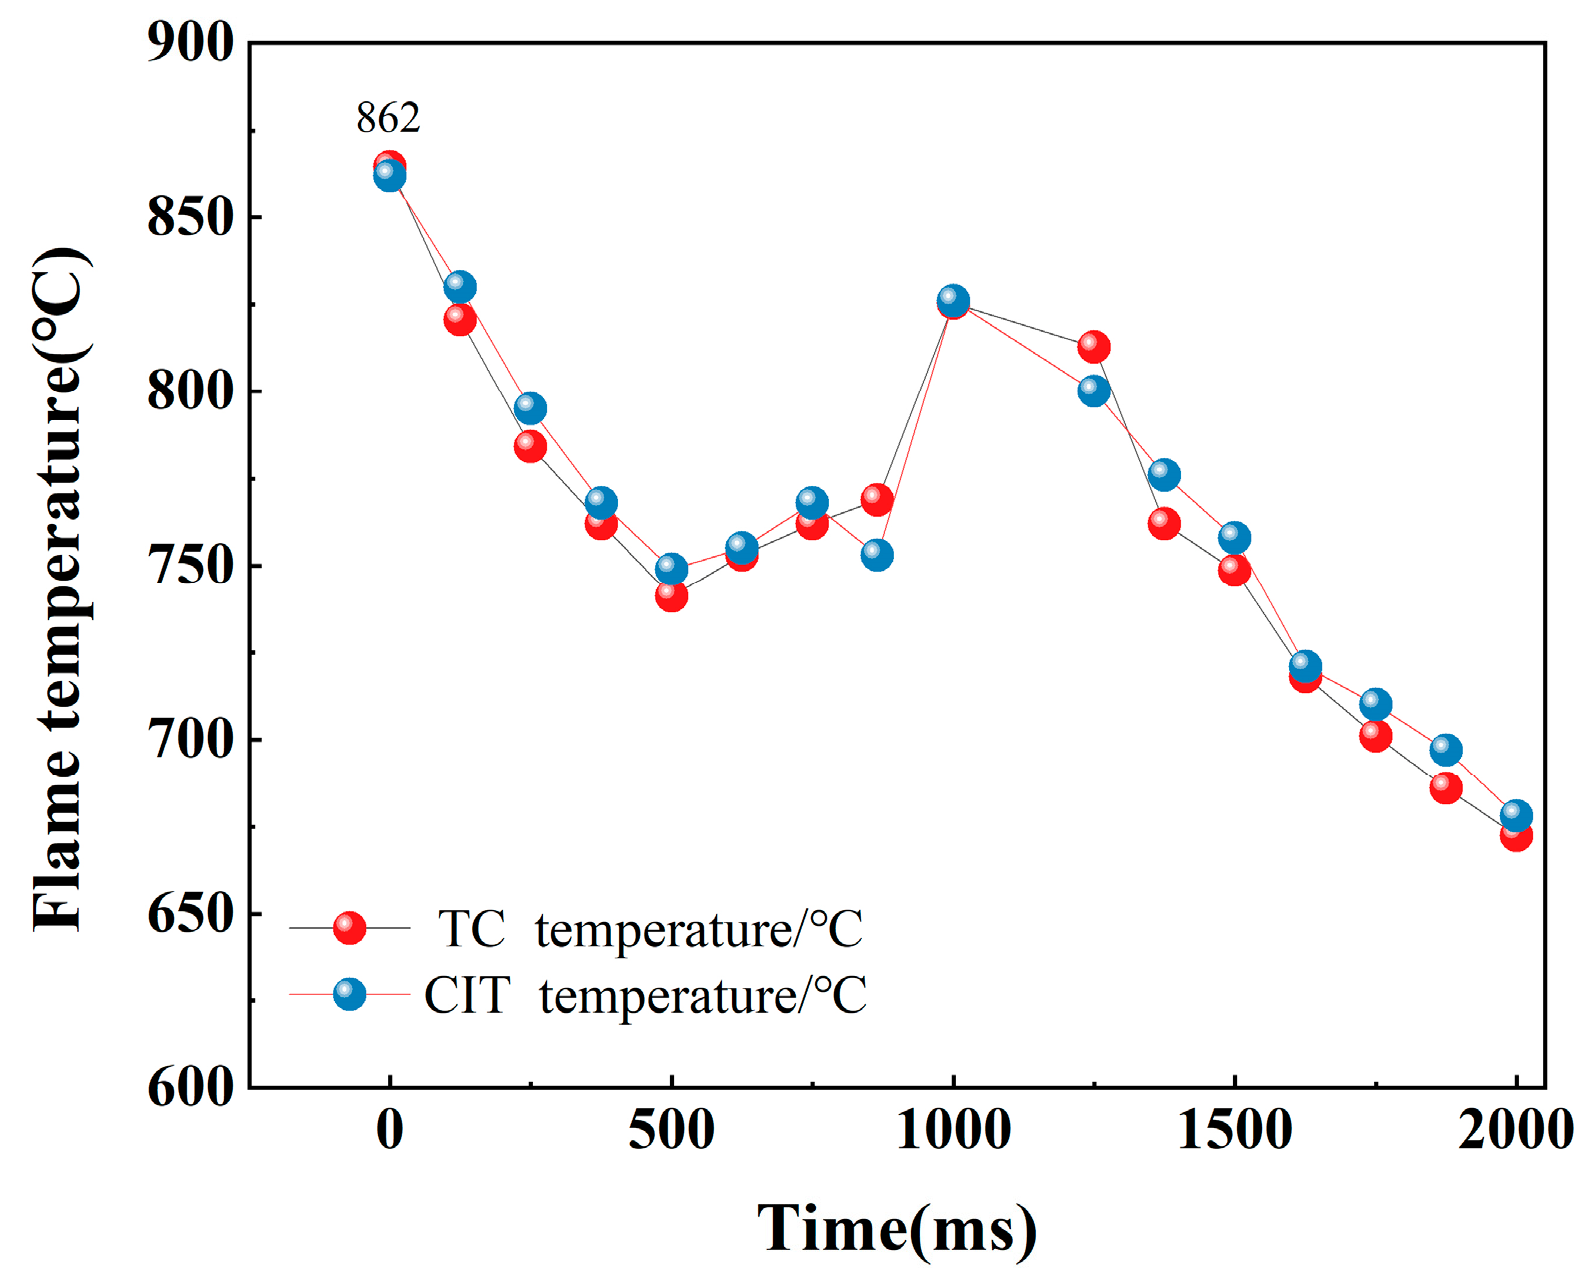
| TC temperature (°C) | 993.7 | 991.2 | 862 | 859.4 | 804 | 800.6 |
| TDLAS temperature (°C) | 1012.6 | 1012.6 | 878.2 | 878.2 | 818 | 818 |
| Error (%) | 1.87% | 2.11% | 1.84% | 2.14% | 1.71% | 2.13% |
Disclaimer/Publisher’s Note: The statements, opinions and data contained in all publications are solely those of the individual author(s) and contributor(s) and not of MDPI and/or the editor(s). MDPI and/or the editor(s) disclaim responsibility for any injury to people or property resulting from any ideas, methods, instructions or products referred to in the content. |
© 2025 by the authors. Licensee MDPI, Basel, Switzerland. This article is an open access article distributed under the terms and conditions of the Creative Commons Attribution (CC BY) license (https://creativecommons.org/licenses/by/4.0/).
Share and Cite
Pei, P.; Hao, X.; Feng, S.; Wei, T.; Xu, C. Research on Flame Temperature Measurement Technique Combining Spectral Analysis and Two-Color Pyrometry. Appl. Sci. 2025, 15, 5864. https://doi.org/10.3390/app15115864
Pei P, Hao X, Feng S, Wei T, Xu C. Research on Flame Temperature Measurement Technique Combining Spectral Analysis and Two-Color Pyrometry. Applied Sciences. 2025; 15(11):5864. https://doi.org/10.3390/app15115864
Chicago/Turabian StylePei, Pan, Xiaojian Hao, Shenxiang Feng, Tong Wei, and Chenyang Xu. 2025. "Research on Flame Temperature Measurement Technique Combining Spectral Analysis and Two-Color Pyrometry" Applied Sciences 15, no. 11: 5864. https://doi.org/10.3390/app15115864
APA StylePei, P., Hao, X., Feng, S., Wei, T., & Xu, C. (2025). Research on Flame Temperature Measurement Technique Combining Spectral Analysis and Two-Color Pyrometry. Applied Sciences, 15(11), 5864. https://doi.org/10.3390/app15115864