Article

Pore Structure Differences and Influencing Factors of Tight Reservoirs Under Gravity Flow–Delta Sedimentary System in Linnan Subsag, Bohai Bay Basin

1
State Key Laboratory of Petroleum Resources and Engineering, China University of Petroleum (Beijing), Beijing 102249, China
2
College of Geosciences, China University of Petroleum (Beijing), Beijing 102249, China
3
Hainan Research Institute, China University of Petroleum (Beijing), Sanya 572024, China
*
Author to whom correspondence should be addressed.
Appl. Sci. 2025, 15(11), 5800; https://doi.org/10.3390/app15115800
Submission received: 17 April 2025 / Revised: 19 May 2025 / Accepted: 20 May 2025 / Published: 22 May 2025

Abstract

:
In tight reservoirs deposited in diverse sedimentary settings, the pore structure governs tight oil enrichment features and sweet-spot distribution. Taking the tight sandstone reservoirs of the lower third member of the Shahejie Formation in the Linnan Subsag of Bohai Bay Basin in China as an example, this study employs XRD to delineate petrological characteristics, while porosity and permeability measurements are used to quantify physical properties. In addition, thin section, SEM, HPMI, NMR, fractal theory, and cathodoluminescence experiments are applied to investigate pore structure characteristics and influencing factors. The results reveal two sedimentary systems: turbidity current and delta front deposits. Turbidite reservoirs exhibit the coarse pore-coarse throats (Type A), medium pore-medium throats (Type B), and fine pore-medium throats (Type C) pore structures. Delta front reservoirs are characterized by medium-pore-coarse-throat (Type D), medium-pore-fine-throat (Type E), and fine-pore-fine-throat (Type F) pore structures. Turbidite reservoirs show more favorable pore structures for oil exploration compared to delta fronts, in which lithofacies and diagenetic facies are the key influences. A genetic model identifies the highest-quality Type A forms in fine sandstone lithofacies under medium compaction–medium cementation–strong dissolution, with pore diameters averaging 10.84 μm in turbidite reservoirs. Conversely, the poorest Type F forms in argillaceous layered siltstone lithofacies under strong compaction, cementation, and weak dissolution diagenetic facies in delta fronts, with pore diameters averaging 0.88 μm. Consequently, the control effect of the pore quality means that Type A has the highest and Type F has the lowest oil-bearing capacity. These findings provide valuable guidance for the classification, evaluation, and exploration of tight oil sweet spots.

1. Introduction

The United States, Canada, and other countries have made important achievements in the exploration and development of tight oil and gas resources, which have significantly changed the current world energy pattern [1,2]. Currently, tight oil exploration and development in China have progressed substantially [3,4,5,6], with total geological resources in the Bohai Bay, Ordos, Junggar, and other basins estimated at 178.2 × 10⁸ t and proven geological reserves of 3.77 × 10⁸ t [7].
As the main oil-producing subsag in the Huimin Sag in the Jiyang Depression of the Bohai Bay Basin in China, the Linnan Subsag has great potential for tight oil resources, which are mainly distributed in the middle and lower parts of the third member and the upper part of the fourth member of the Paleogene Shahejie Formation [8,9]. According to field exploration data from the Sinopec Shengli Oilfield, the tertiary reserves of Linnan Subsag are 1.4984 × 10⁸ t, the predicted reserves are 1.10 × 10⁸ t, and the unproduced proven reserves are 2766.23 × 104 t. The data indicate a favorable potential for unconventional tight oil and gas resources. Among them, the predicted reserves of the lower third member of the Shahejie Formation (Es33) are 8465.2 × 104 t, accounting for 64% of the overall predicted reserves in the Linnan Subsag. During the sedimentary period of Es33, which was influenced by the uplift of the Linshang fault, two different sedimentary systems developed in the Linnan Subsag, namely, the turbidity current and delta front deposits. Although the reservoir position, depth, and physical properties of these two different sedimentary systems are similar, their oily properties are obviously different. Scholars have reported that the difference between the charging strength and the oil abundance of tight oil reservoirs is mainly controlled by the reservoir quality [10,11,12]. Past studies have shown that many geological factors affect the quality of tight sandstone reservoirs, including the sedimentary system, reservoir physical properties, and reservoir microscopic pore structure. The distribution and accumulation of tight oil and gas are closely related to the characteristics of the microscopic pore structure [13,14,15,16]. The microscopic pore structure of a reservoir controls the oil and gas flow capacity and rate, which is the most critical factor affecting the oil-bearing and reservoir physical properties and accumulation of tight reservoirs [17,18,19,20,21,22,23]. Many scholars have confirmed the importance of micro/nanopore structures for the evaluation of unconventional reservoirs and the analysis of the oil-bearing properties of tight reservoirs [14,24,25,26,27]. Oiliness in tight reservoirs is a major and intuitive indicator of the reservoir quality and its corresponding heterogeneity. The heterogeneity and complexity of reservoirs, especially the micro/nanopore structure, affect the charging, migration, and accumulation of petroleum and ultimately manifests as differences in oil-bearing properties [27,28,29,30,31]. According to previous research results, the microscopic pore structure of a reservoir is clearly the core and key to the oil-bearing properties of tight reservoirs. At present, reservoir pore structure characterization can be carried out via nuclear magnetic resonance (NMR), high-pressure mercury injection (HPMI), low-temperature nitrogen adsorption, and other methods to study reservoir quality parameters such as the pore type, geometry, size distribution, and pore–throat connectivity, but the factors influencing the microscopic pore structure in tight reservoirs are not clear. Clarifying the characteristics of the microscopic pore structure of reservoirs and analyzing the influencing factors has an obvious guiding role in geological exploration and oil well development.
The scale of the turbidite reservoirs is significantly smaller than that of the delta front reservoirs, but the difference between oil well production and core oil-bearing reservoirs is large, which is reflected in the net gross ratio (total oil layer thickness/sand body thickness) of the sand body, oil abundance, and oil well productivity. The statistical results show that the net gross ratio of turbidite sand reservoirs in 66.7% of the same oil wells is markedly better than that of delta sedimentary reservoirs, while the influencing factors of reservoir oil-bearing differences are still unclear.
Previous studies have investigated the heterogeneity of reservoirs in the delta sedimentary system of Es33 on the southern slope of Linnan Subsag [32], but the differences in the microscopic pore structure characteristics of reservoirs under the control of different sedimentary systems in the area have not been compared. In addition, in-depth studies have been carried out only on the sedimentation, diagenesis, and fluid evolution of reservoirs in the Jiangjiadian area of the Shahejie Formation in Linnan Subsag. However, few studies have investigated the sedimentary factors, diagenesis, and formation mechanism of effective reservoirs in Es33 of the tight sandstones in the study area. In addition, the influence of sedimentation and diagenesis on the microscopic heterogeneity of reservoirs is not clear [33,34,35,36,37,38].
Therefore, we explored whether there are differences in the microscopic pore structure characteristics of turbidite reservoirs and delta front reservoirs in Es33 in the Linnan Subsag, which affects the oil-bearing properties of tight reservoirs. In this study, HPMI, NMR, cast thin sections, scanning electron microscopy (SEM), and other methods are used to identify the pore type, geometry, and size distribution, fractal theory is used to characterize the pore–throat connectivity, and the cathode luminescence method is used to determine the type and stage of reservoir cementation. To clarify the differences in the microscopic pore structure of the two sets of sedimentary reservoirs, the sedimentary factors and diagenesis of the different sedimentary systems are discussed in detail, and their influences on the microporous pore structure are compared and summarized, providing an in-depth understanding of the heterogeneous formation process of the two types of sedimentary reservoirs. Finally, a sedimentary–diagenetic model suitable for the microscopic heterogeneity of reservoirs in the study area is established. This study deepens the theoretical research on the microscopic pore structure characteristics and influencing factors of tight sandstone reservoirs and can provide guidance for the evaluation, exploration, and development of tight oil sweet spots.

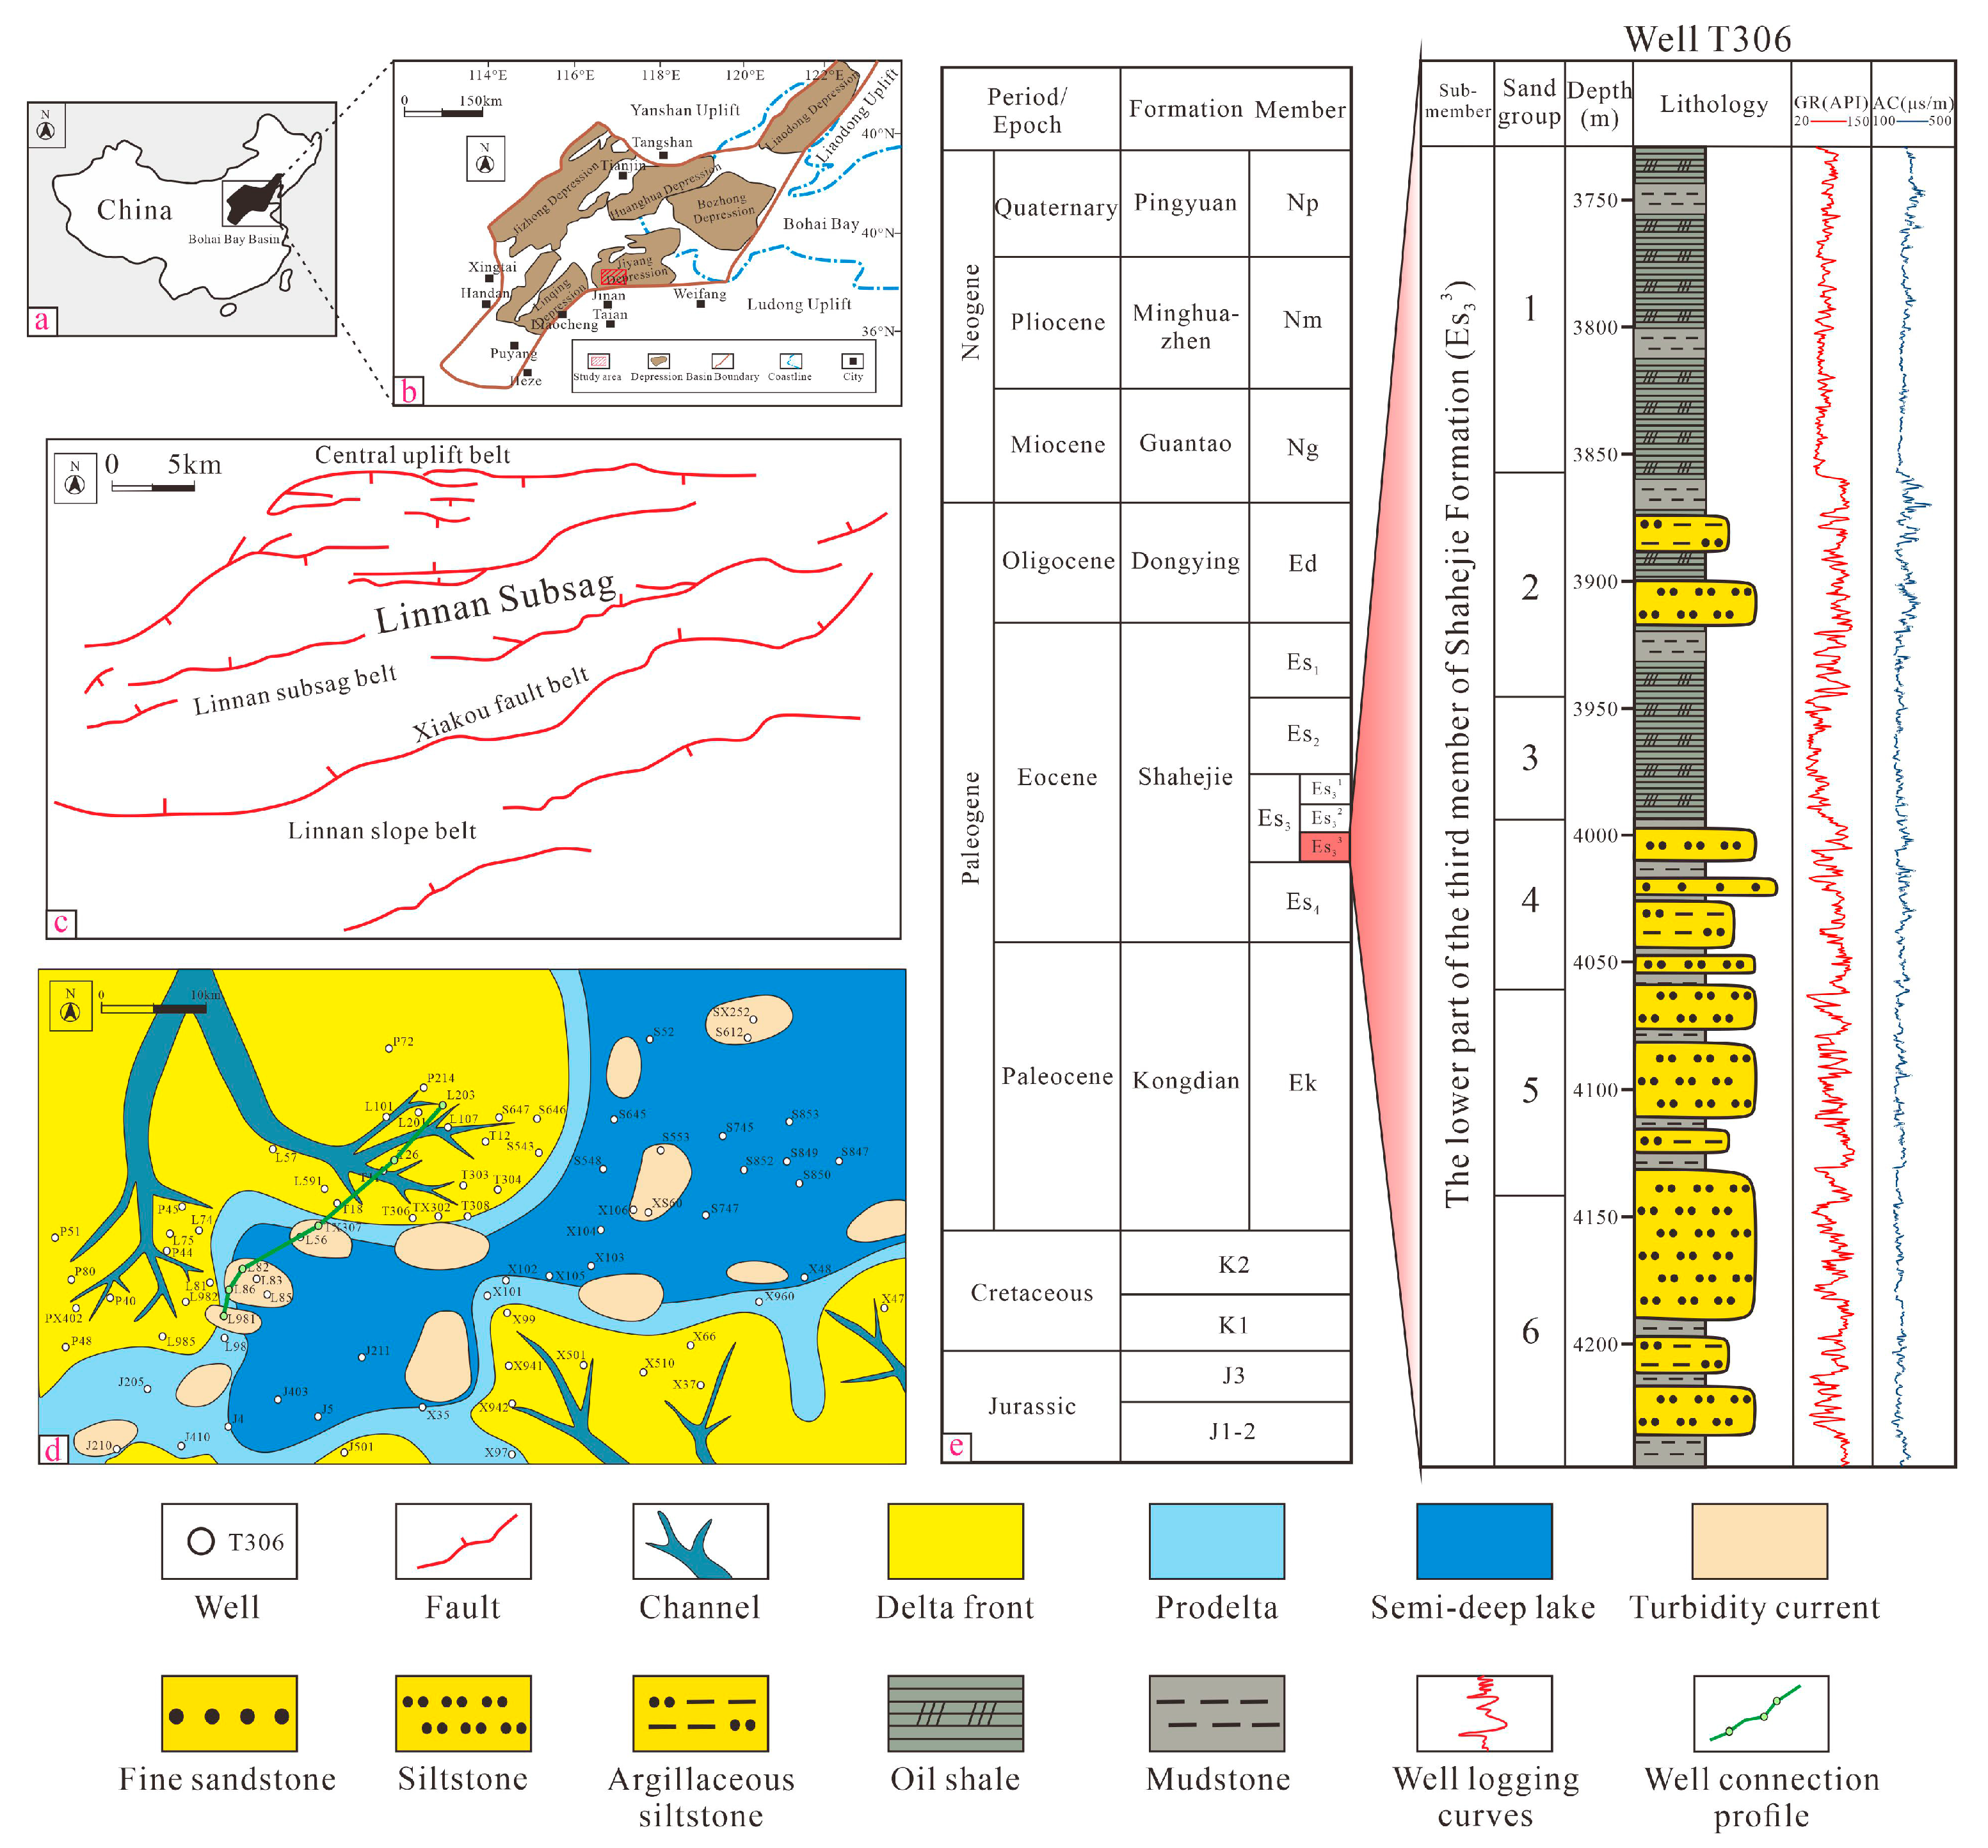
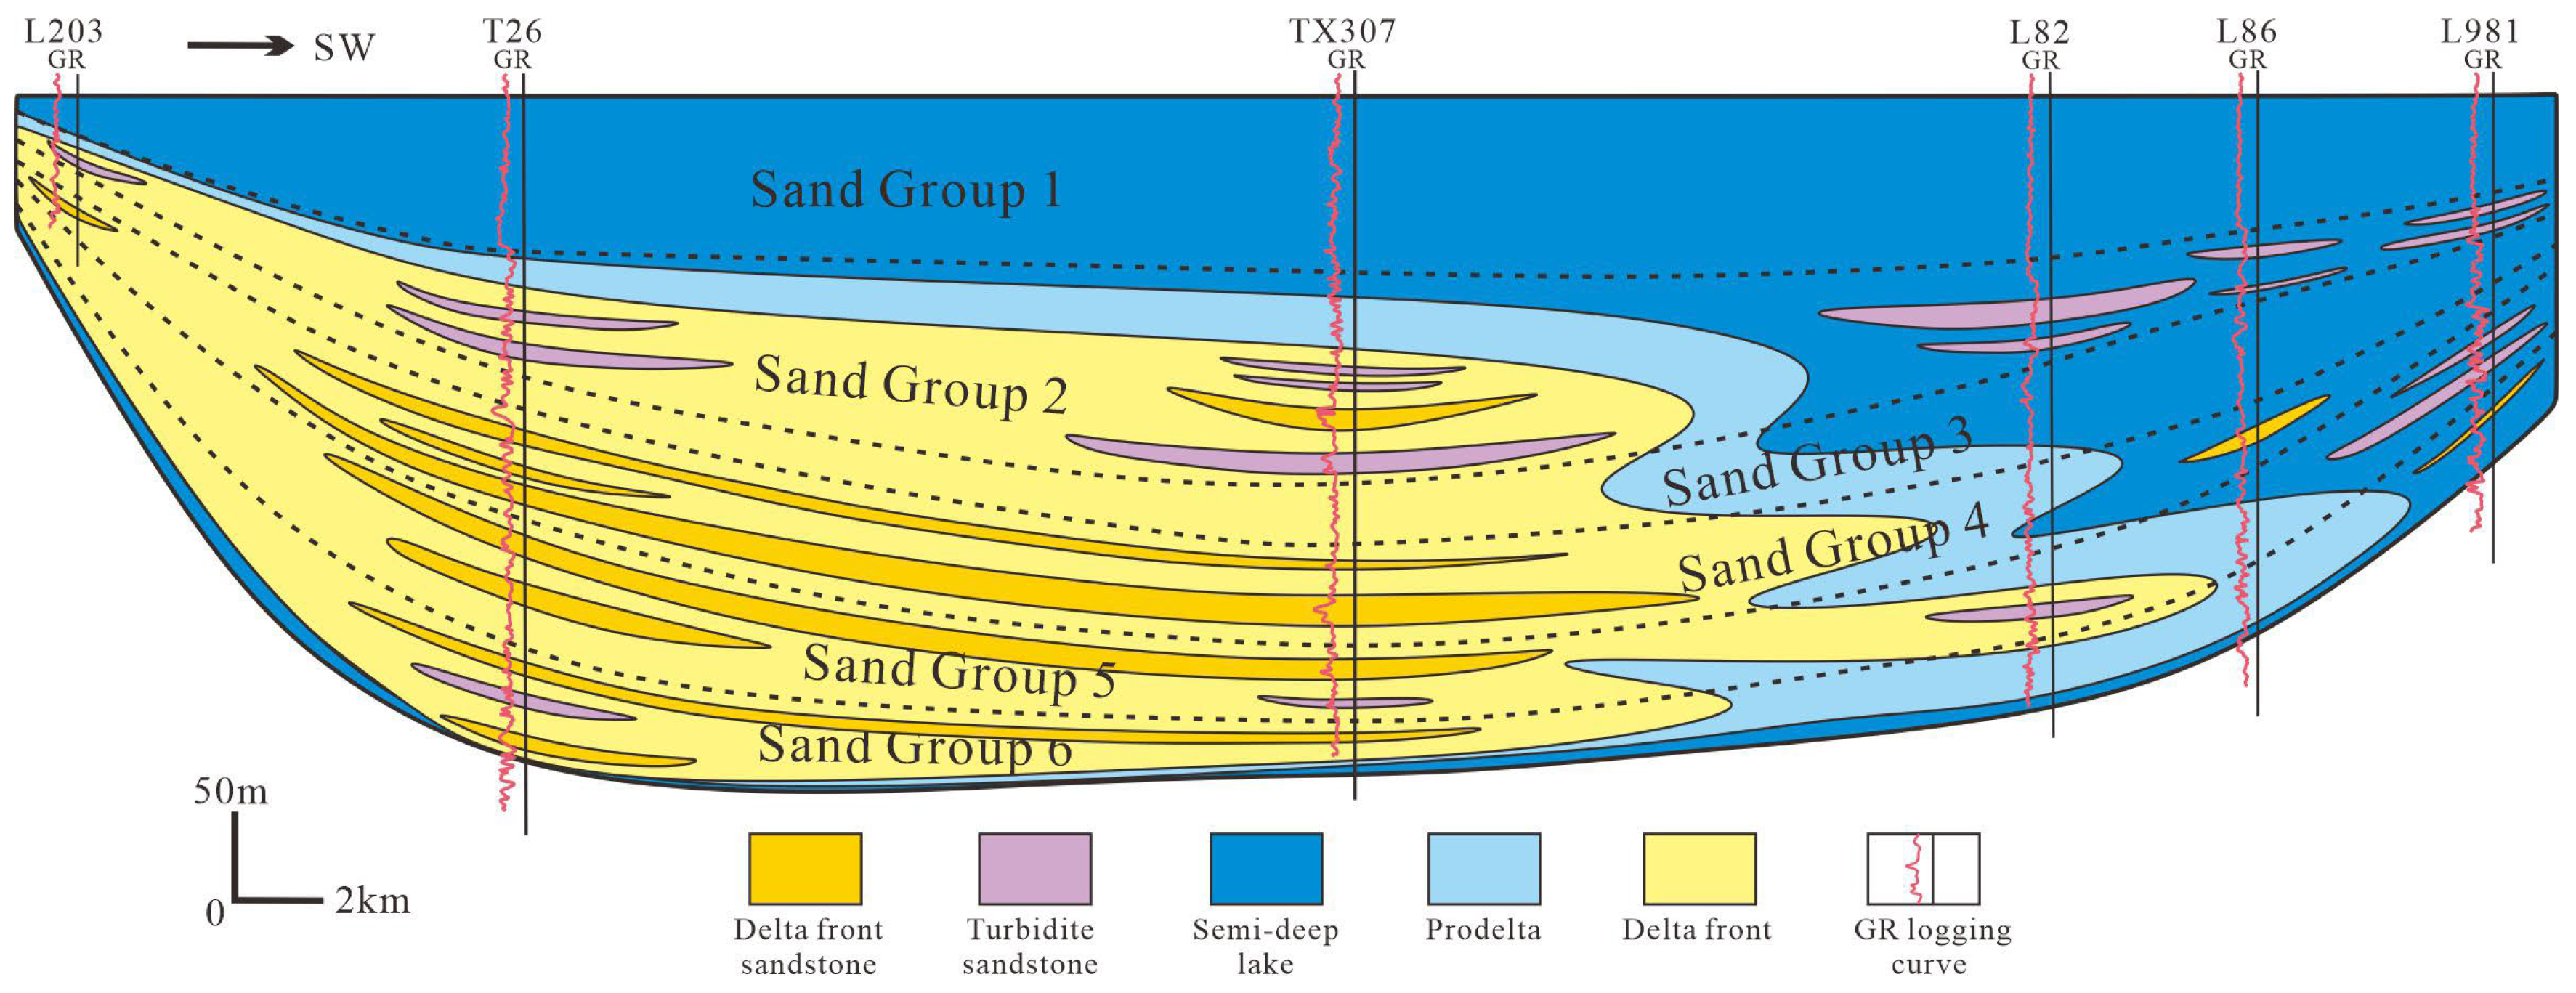
2. Geological Settings

The Linnan Subsag is located between the Linshang Fault and the Xiakou Fault in the southwest of the Huimin Sag, a secondary tectonic unit of the Jiyang Depression in the Bohai Bay Basin of China [39], which is a semigraben subsag with an axial northeast–east direction, north fault, and south overlap with an area of 3000 km2 [40] (Figure 1a,b). The Linnan Subsag includes four structural units, which are the central uplift belt, Linnan Subsag belt, Xiakou fault belt, and Linnan slope belt, from north to south (Figure 1c). The main study area of this paper is the northern source region of the Linnan Subsag, which is located mainly between the central uplift belt and the Linnan Subsag belt. The sedimentary facies of the study area include the delta front, prodelta, semideep lake, and turbidity current subfacies (Figure 1d). Historically, the Linnan Subsag experienced two sedimentary stages, the Paleogene fault sag period and the Neogene fault-depression period, and the Paleogene strata of the Shahejie Formation (Es) and Dongying Formation (Ed), Neogene strata of the Guantao Formation (Ng) and Minghuazhen Formation (Nm), and Quaternary (Q) strata were deposited (Figure 1e). The third member of the Shahejie Formation is the most important exploration horizon at present, and Es33 is the main oil-bearing layer of tight oil in the Linnan Subsag. Under the influence of the Linshang fault activity, the Linnan Subsag produced a steep slope in the late sedimentary stage of Es33, which provided sufficient conditions for the collapse of the delta front and finally led to the development of many deep-water turbidity fan deposits [41]. There are 1–6 sets of sand groups from top to bottom, of which the 1st and 3rd sand groups are source rocks with organic-rich mudstone, whereas the 2nd and 4–6th sand groups are tight sandstone reservoir groups.
There are two sets of sedimentary systems in Es33 in Linnan Subsag, which are the gravity flow sedimentary system corresponding to sand Group 2 of the deep-water slip turbidity sand body and the delta sedimentary system corresponding to sand Groups 4–6 of the delta front subfacies (Figure 2). Among them, the gravity flow sedimentary system developed turbidity current sedimentation, which has typical identification markers with normal bedding, bottom scouring surfaces, groove forms, thin interbedded sand-mud layers, and incomplete Bauma sequences. The delta sedimentary system in the study area has developed delta front subfacies sedimentation, and the lithology is mainly sandstone, siltstone, and claystone. In addition, the corresponding identification signs are sedimentary structures such as wavy bedding and cross-bedding. Moreover, the logging curve presents a funnel-bell composite shape [42,43].

3. Samples and Experimental Methods

3.1. Sample and Data

The geophysical logging curves of 43 exploratory wells in the study area were collected, and a total of 6 sand groups, including source rocks (shale/mudstone) and tight sandstone reservoirs, were interpreted. To complete the corresponding supporting experiments, a total of 62 tight sandstone samples were collected from the cores of 17 key exploration wells. There were 24 samples from turbidite reservoirs and 38 samples from delta front reservoirs, all of which were conventional core plunger samples with a length of 6 cm and a diameter of 2.5 cm cut parallel to the bedding plane. To ensure the scientific and rigorous selection of samples, all the key well cores related to this study were carefully observed and described. Therefore, the samples were selected according to their color, structure, granularity, and oil-bearing characteristics. Moreover, all the samples were tested and analyzed with fresh cut surfaces to improve the accuracy of the results without the influence of weathering. The 6 cm long core plunger sample was cut into 3 sections and the 4 cm core in the middle section was used for physical property determination, HPMI, and NMR analysis. The remaining 2 cm at the upper and lower ends were subsequently used for X-ray diffraction (XRD), casting thin sections, cathode luminescence experiments, and SEM analysis. Before the experimental measurements, rock samples were washed with a dichloromethane–methanol (93:7, v/v) solvent at 90 °C and 0.5 MPa for seven days to remove any residual oil [44]. The cleaned samples were then dried in a constant-temperature chamber (60 °C/48 h) before proceeding with the experiments. XRD, porosity, permeability, and SEM were performed for all the samples and 13 representative key samples were selected for cathodoluminescence (CL), HPMI, and NMR analyses according to the experimental analysis results. In addition, more than 150 lithologic composition, XRD, porosity, and permeability data points were collected from the Sinopec Shengli Oilfield Branch.

3.2. Pore Structure Characterization Experiments

XRD analysis can determine the relative abundance of different minerals in tight sandstone, especially clay minerals. In this study, a D8AA25 X-ray diffractometer with Cu-Kα radiation was employed for detection. Samples were oven-dried at 60 °C for 48 h, ground to a particle size less than 40 μm, and pressed into pellets using a back-pressure method. The computer-acquired diffraction spectra ranged from 3° to 45°.
The porosities and permeabilities of 62 tight sandstone reservoir samples in Es33 from drilling wells were systematically measured and collected. The porosities of the thoroughly dried samples were measured using a JS 100007 helium porosity measurement instrument, with high-purity helium (99.99%) chosen as the working medium for porosity measurements. The measurement principle is based on Boyle’s gas expansion law. The helium method reveals only connected porosity rather than total porosity. In this study, the JS 100007 helium porosimeter exhibited an RSD of 0.73%, a triplicate-measurement RSDtriplicate of 0.717%, a porosity measurement accuracy of ±0.02% (of true value), and a pressure sensor accuracy of ±0.1%. The permeability parameters were obtained using an A10133 gas permeameter by standard industry methods with a confining pressure of 5 MPa. The measurement principle is based on Darcy’s law. The A10133 gas permeameter demonstrated an RSD of 1.21%, a triplicate-measurement RSDtriplicate of 1.15%, a flow meter and differential pressure sensor accuracy of ±1–2%, and an additional calibration error of 1–2%.
Casting thin sections were created by injecting evacuated pore spaces with blue resin of rock samples to visualize pore types and sizes. Carbonate minerals were differentiated via Alizarin Red staining. After the resin solidified, the samples were cut and polished using the French Brot CTS sample preparation system (Zhehong Robot Automation Company, Shanghai, China). A total of 62 casting thin sections covering different sedimentary facies in the study area were prepared and observed via LinKam-350 polarizing microscope (Linkam Scientific Instruments, Redhill, UK) to distinguish minerals, cement types, and pore genesis and types. Rock types were determined according to core and casting thin section observations, XRD identifications, and rock mineral compositions. Based on the identification from casting thin sections, we analyzed the sandstone samples using a CL8200MK5-2 cathodoluminescence instrument (Cambridge Image Technology Ltd, Hatfield, UK) to determine the types and extent of diagenesis, such as feldspar dissolution and calcite cementation. The experimental conditions were a temperature of 25 °C, humidity of 45%, vacuum of 0.3 Pa, beam voltage of 13.5 kV, and beam current of 250 mA.
ZEISS SIGMA500 field emission SEM (Carl Zeiss Microscopy GmbH, Oberkochen, Germany) with a maximum resolution of 1 nm was used to observe selected tight sandstone reservoir samples under the control of different sedimentary systems and to determine the pore type, morphology, mineral type, size, and occurrence of the pores to study the pore structure [45]. Prior to observation, samples were sliced into thin sections, with observation surfaces of argon-ion polished and gold-coated to enhance sample conductivity. The pore morphology and mineral elemental composition were observed using secondary electron detectors and EDS. Additionally, different types and forms of pores significantly differ from mineral particles after argon-ion polishing, allowing pores to be directly acquired via ImageJ software (Basic Class). The application of this software for quantifying pore structures involves obtaining binary images of pores, as well as the pore diameter, pore area, and porosity parameters.
HPMI experiment applies external pressure to a core plug to make mercury overcome the non-wetting interfacial tension and enter the pores, thereby quantitatively acquiring key parameters such as pore size distribution, pore volume, and capillary pressure curves, providing a direct basis for the quantitative characterization of the reservoir pore structures [46]. Analysis of mercury withdrawal efficiency and the plateau morphology of the capillary pressure curve further allows qualitative assessment of pore–throat network connectivity, providing a basis for evaluating reservoir flow continuity. The injection pressure and pore radius in the mercury intrusion experiment satisfied the Washburn equation [47]. In this study, HPMI was conducted on 13 core plugs with various reservoirs (5 core plugs with turbidite sandstone and 8 core plugs with delta front sandstone) via an AutoPore IV9500 mercury intrusion porosimeter (Micromeritics Instrument Corporation, Norcross, GA, USA). The mercury intrusion tests included both pressurized intrusion and pressurized withdrawal tests, with a maximum experimental pressure of 200 MPa. In all cases, the experimental data were collected using a reference intrusion equilibration rate of at least 0.001 μL/g/s.
NMR is a physical process in which atomic nuclei with non-zero magnetic moments split their spin energy levels under the influence of an external magnetic field and absorb radiofrequency radiation of a certain frequency to enter a higher energy state [48]. After the radiofrequency pulse ceases, under the influence of the main magnetic field, the transverse macroscopic magnetization vector gradually decreases to zero, corresponding to the transverse relaxation time. For the same fluid properties and rock sample, the relaxation time is determined by the pore size. Tight sandstone exhibits three relaxation mechanisms: particle surface, bulk fluid, and molecular diffusion relaxation. The relaxation time of bulk fluid and molecular diffusion becomes negligible when the samples are saturated with water, allowing the relaxation time T2 to be simplified to Equation (1) [49,50,51].
1 T 2 = ρ 2 S V
In Equation (1), T2 (ms) represents the surface relaxation time, S/V (μm−1) denotes the specific surface area, and ρ2 (μm/ms) represents the surface relaxation rate.
From Equation (1), it can be seen that T2 is related to the specific surface area S/V of a single pore. Let the value of S/V be equal to the value of FS/r, then we have
T 2 = r ρ 2 F s
In Equation (2), T2 (ms) represents the surface relaxation time, ρ2 (μm/ms) represents the surface relaxation rate, r (μm) denotes the pore radius in micrometers, and FS denotes the shape factor of a pore, which is related to the geometric shape of the pore.
From Equation (2), it can be seen that the transverse relaxation time T2 is theoretically linearly proportional to the pore radius. Therefore, the NMR T2 spectra can be converted into the pore–throat radius distribution curve [46,52,53,54].
In this study, the MicroMR12-040 V equipment of Jiangsu Newman Company was used for NMR, the coil diameter of the instrument probe was 10 mm, and the average working environment was controlled at 22 °C–28 °C. The following parameters are set for the device: the sampling frequency is 200 kHz, the number of echoes is 6000, the number of scans is 16, the waiting time is 1000 ms, and the echo interval is 0.1 ms.

3.3. Fractal Dimension Feature Analysis

The French mathematician Mandelbrot first introduced fractal theory in the 1970s. By analyzing the fractal dimensions of reservoirs, this theory enables the characterization of the structural features of various complex objects in nature. The pore structures within reservoirs exhibit specific fractal characteristics. By calculating the fractal dimensions from the basic parameters obtained through HPMI experiments, a quantitative description of the heterogeneity and complexity of the pore structures can be obtained. Typically, the internal pore structures of porous rocks have noninteger fractal dimensions, with idealized fractal dimensions generally ranging from 2 to 3 [55]. A smaller fractal dimension indicates a more uniform pore–throat distribution and greater homogeneity of the reservoir. Conversely, a larger fractal dimension corresponds to a more complex pore–throat distribution and a greater degree of heterogeneity.
The relevant data are obtained from HPMI experiments and the fractal dimension is calculated via the following Equation (3) [56]:
LgSw = (D − 3)lgPc + (3 − D)lgPmin
In Equation (3), Sw (%) is the wetting phase saturation, with Sw = 1 − SHg (SHg is the mercury saturation in the HPMI experiment); D is the fractal dimension; Pc (Mpa) is the capillary pressure; and Pmin (MPa) is the capillary pressure when mercury first enters the pores during the HPMI experiment, corresponding to the maximum pore–throat radius.
Equation (3) shows that in double logarithmic coordinates, the wetting phase saturation Sw is linearly related to the capillary pressure (Pc). The slope of this line is (D − 3), which allows for the determination of the corresponding fractal dimension. Given that the pore structure of tight sandstone reservoirs exhibits multifractal characteristics [57], first delineating the fractal intervals on the intersection plot is necessary. Within each fractal interval, segmental linear regression can be performed to determine the slope K for each interval. The fractal dimension D can then be calculated based on the slopes obtained from different fractal intervals as follows in Equation (4):
D = K + 3
In Equation (4), D represents the fractal dimension and K represents the slope for each interval.

4. Results

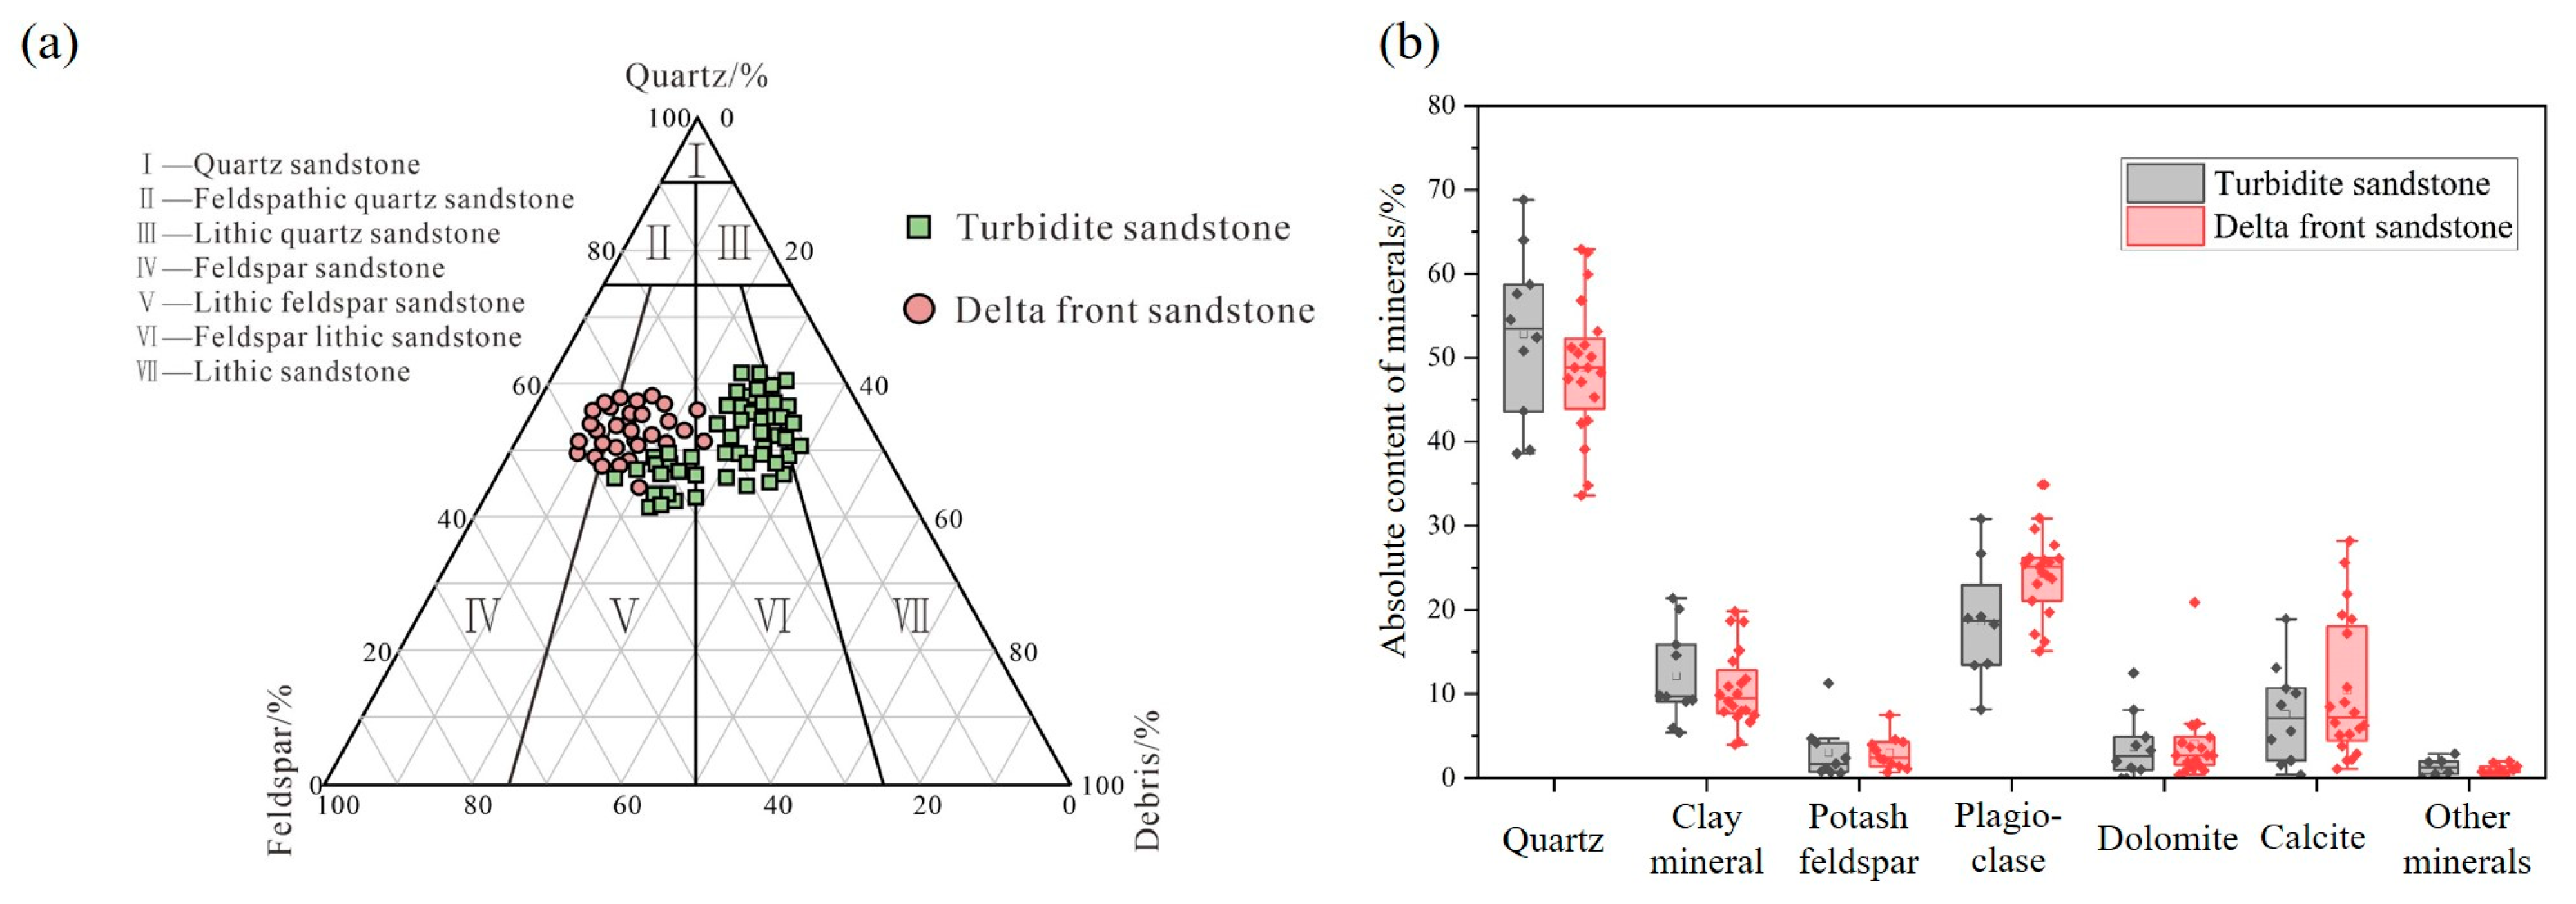
4.1. Petrological Characteristics

The turbidite reservoirs of Es33 have developed feldspar lithic sandstone and lithic feldspar sandstone, and a small amount of lithic sandstone has also been discovered. However, the delta front reservoirs have developed mainly lithic feldspar sandstone and feldspar sandstone (Figure 3a). The lithic compositions of these two different sets of sedimentary reservoirs are dominated by metamorphic rock cuttings. In addition, in terms of the feldspar content, plagioclase accounts for a significantly greater proportion than potassium feldspar. According to the XRD rock mineral diffraction results, the quartz content is the highest (68.8% in turbidite sandstones, with 62.9% in delta front sandstones), followed by plagioclase and clay minerals (mostly higher than 10%). In delta front sandstones, the quartz and clay mineral contents are slightly lower than that in turbidites, whereas calcite is anomalously enriched, constituting up to 28.2% of the rock (Figure 3b).

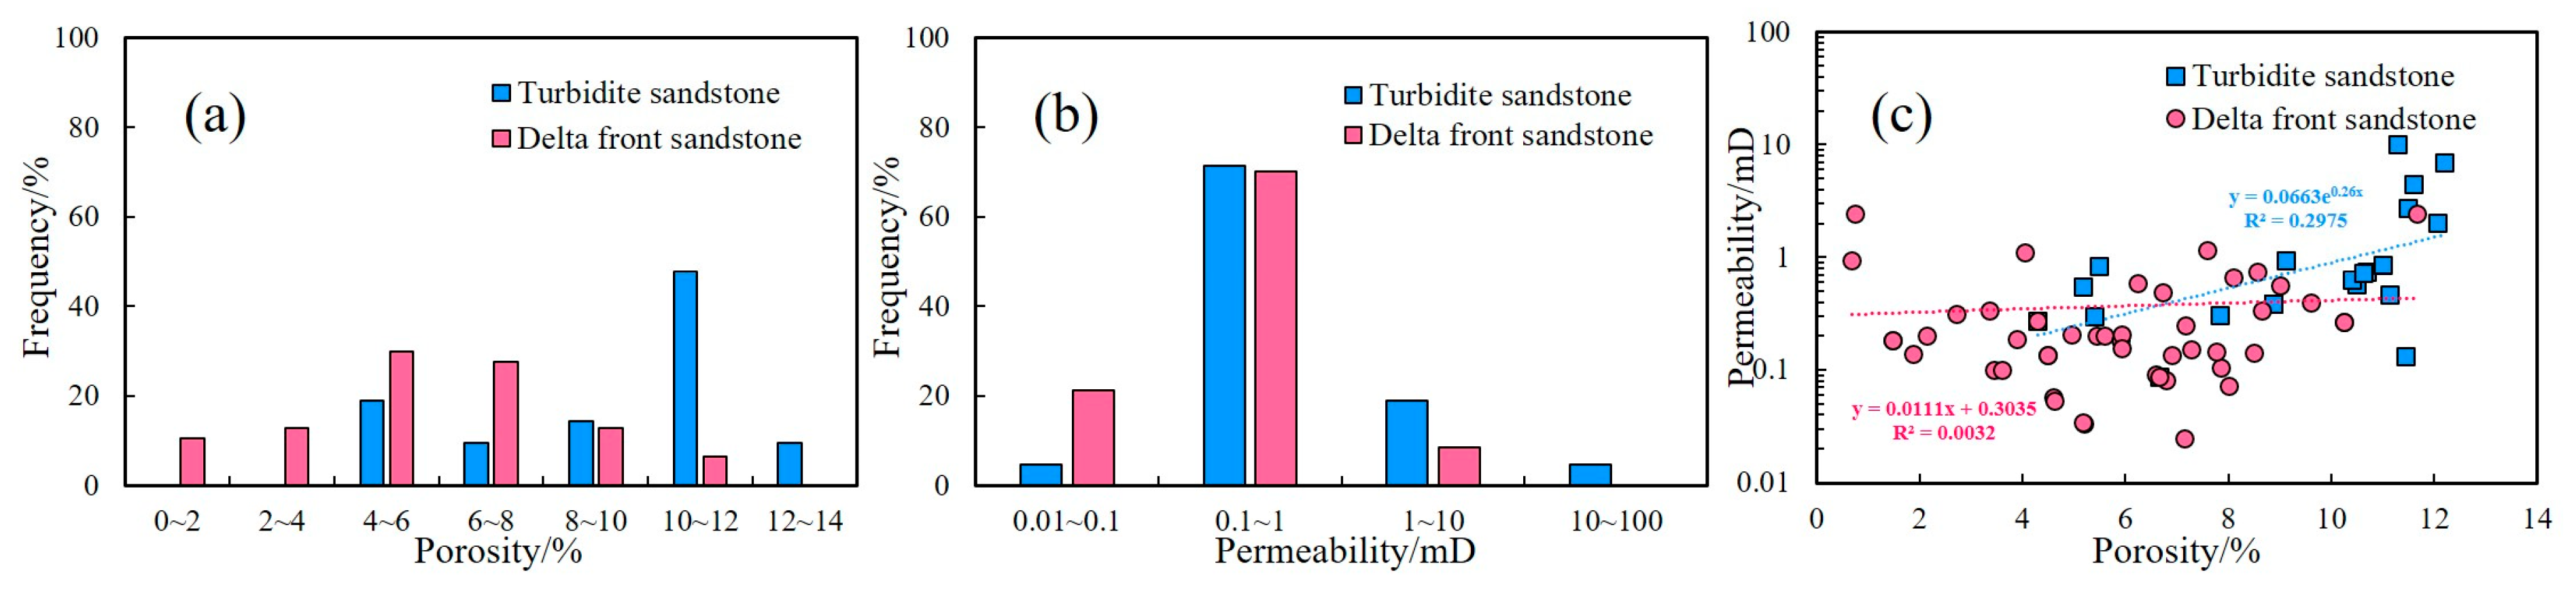
4.2. Physical Property Characteristics

The maximum porosity of turbidite tight reservoirs is 12.2% and the minimum value is 4.29%, with an average value of 9.34%, which is mainly distributed in the range of 4–12.2%, and the porosity of 47.6% of the samples is 10–12%. In addition, the permeability is distributed in the range of 0.01–100 mD, with a maximum value of 10.09 mD, a minimum value of 0.09 mD, and an average value of 1.64 mD. The 0.1–1 mD and 1–10 mD samples accounted for 71.4% and 19.0% of the total samples, respectively, but the permeability of 4.8% of the samples was greater than 10 mD (Figure 4a,b). For the tight reservoirs of the delta front subfacies, the porosity is distributed in all intervals within the range of 12%, with a maximum value of 11.67%, a minimum value of 0.68%, and an average value of 5.82%, but the main distribution range of porosity is 4–8%. The permeability range is 0.01–10 mD, the maximum value is 2.46 mD, and the minimum value is 0.03 mD, with an average of 0.37 mD. Among them, 70.2% of the samples have permeabilities of 0.1–1 mD, with 21.3% of the samples having permeabilities of only 0.01–0.1 mD (Figure 4a,b). The physical properties of turbidite tight reservoirs are significantly better than those of delta front tight reservoirs.
According to the porosity and permeability intersection diagram, the turbidite sandstones clearly have a relatively strong positive correlation between porosity and permeability. However, there is no significant correlation between the porosity and permeability of delta front sandstone reservoirs (Figure 4c). Moreover, some sandstones from different sedimentary reservoirs have similar porosities, but obvious differences in permeability. Therefore, the pore structure of reservoirs under the control of different sedimentary systems in the study area needs to be studied, and the corresponding differences in the pore structure should be clarified. This study elucidates the effects of pore structure differences on permeability, and the influence of the pore structure on oil-bearing properties is discussed.

4.3. Pore Systems

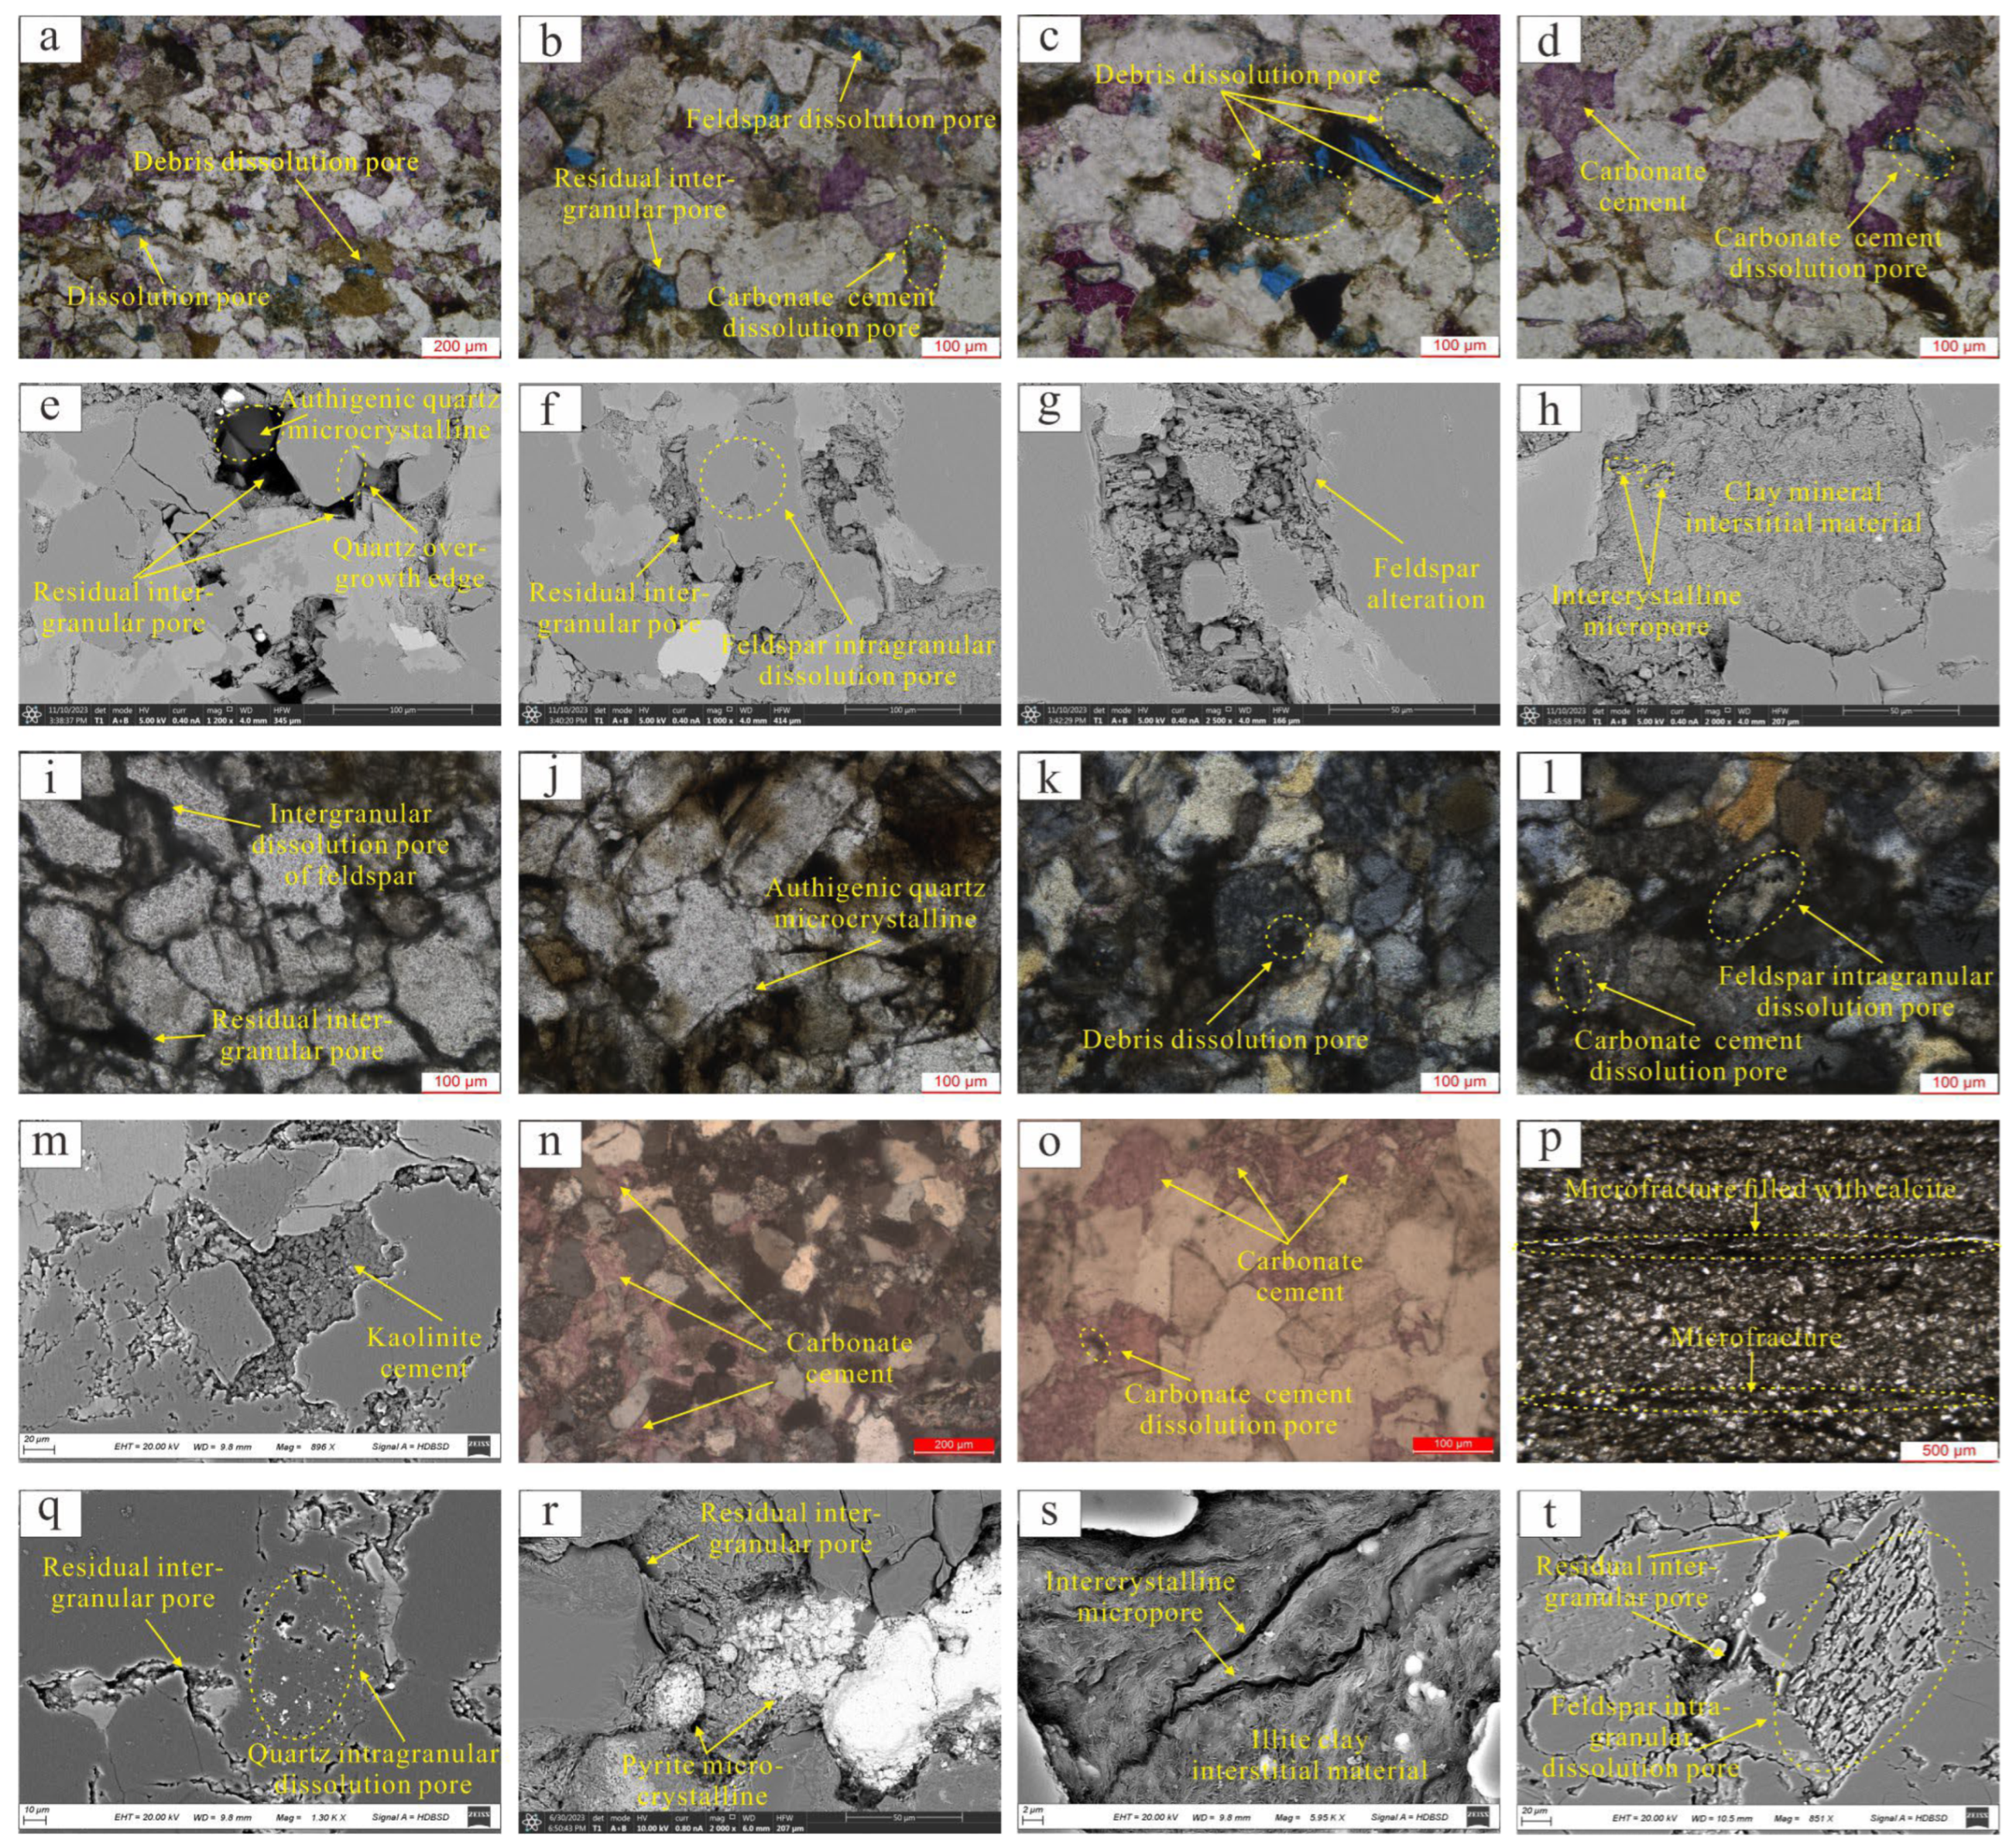
4.3.1. Qualitative Analysis

Based on the comprehensive observations and analysis of thin section and SEM images of 17 tight sandstone cores from the different sedimentary facies of the turbidity current and delta front in the Linnan Subsag, there are five main pore types in the study area: intergranular residual pores, intergranular dissolution pores, intragranular dissolution pores, intergranular micropores, and microfractures (Figure 5a–t). Among them, the intergranular pores are composed of residual intergranular pores and intergranular dissolution pores, with the largest proportion of pores. There are few primary residual intergranular pores (Figure 5b), which are mainly intergranular dissolution pores. They are specifically manifested as feldspar particles, quartz particles, debris, and carbonate cementation dissolution pores (Figure 5a,b,d). The second largest proportion of pores are intragranular dissolution pores, which are composed mainly of feldspar and debris dissolution pores in the study area (Figure 5c,f). However, quartz intragranular dissolution pores are occasionally found in the tight reservoirs of the delta front sedimentary system (Figure 5q). Feldspar particles are the main component of both intergranular and intragranular dissolution. Intergranular micropores are mainly intergranular micropores of clay minerals (Figure 5h,s). In addition, diagenetic shrinkage microfractures have developed in argillaceous layers in tight sandstones (Figure 5p).
The primary intergranular residual pores of the turbidite reservoirs of sand Group 2 in Es33 are clearly developed, and there are also many intragranular and granular margin dissolution pores. Overall, the intergranular zone is partially filled with carbonate cementation and clay gap filler (Figure 5a–h). Under the microscope, quartz secondary enlargement is observed (Figure 5e). The degree of pore development is moderate. The intragranular dissolution pores are mainly debris and feldspar dissolution pores (Figure 5a,b,f), whereas the intergranular dissolution pores are mainly felsic particle margin dissolution and carbonate cementation dissolution (Figure 5b,d). In addition, obvious feldspar alteration can be observed (Figure 5g). The main pore spaces are the primary residual intergranular pores, debris dissolution pores, feldspar dissolution pores, mineral particle intergranular dissolution pores, and carbonate cement intergranular dissolution pores. In addition, the secondary pore spaces are clay mineral intergranular micropores (Figure 5h). The overall surface pore rate is between 2.12% and 6.68%, and the average surface pore rate is 4.12%.
The tight reservoirs of the delta front of sand Groups 4–6 in Es33 in the Linnan Subsag are generally filled with carbonate (calcite and dolomite) cementations and clay gap fillers (Figure 5i–t). Kaolinite clay cementation can be observed incidentally (Figure 5m), and secondary enlargement of quartz (Figure 5j) and pyrite (Figure 5r) can be observed under the microscope. The degree of pore development is generally low. The main pore spaces are mineral particle intergranular dissolution pores, residual intergranular pores, feldspar intragranular dissolution pores, and debris dissolution pores (Figure 5i,k,l,t). The secondary pore spaces include the intergranular micropores of clay minerals, microcracks (Figure 5p,s), and a small number of carbonate cementation intergranular dissolution pores (Figure 5l,o). Occasionally, intragranular dissolution pores of quartz particles can be observed (Figure 5q). The overall surface pore rate is between 0.86% and 2.17%, and the average rate is 1.63%.
The overall surface pore rate of the turbidite reservoirs is relatively high. The primary intergranular pores, intergranular dissolution pores, and intragranular dissolution pores are relatively developed, whereas the carbonate cementation is relatively weak. Therefore, the degree of pore development in turbidite reservoirs is greater than that in reservoirs at the delta front.

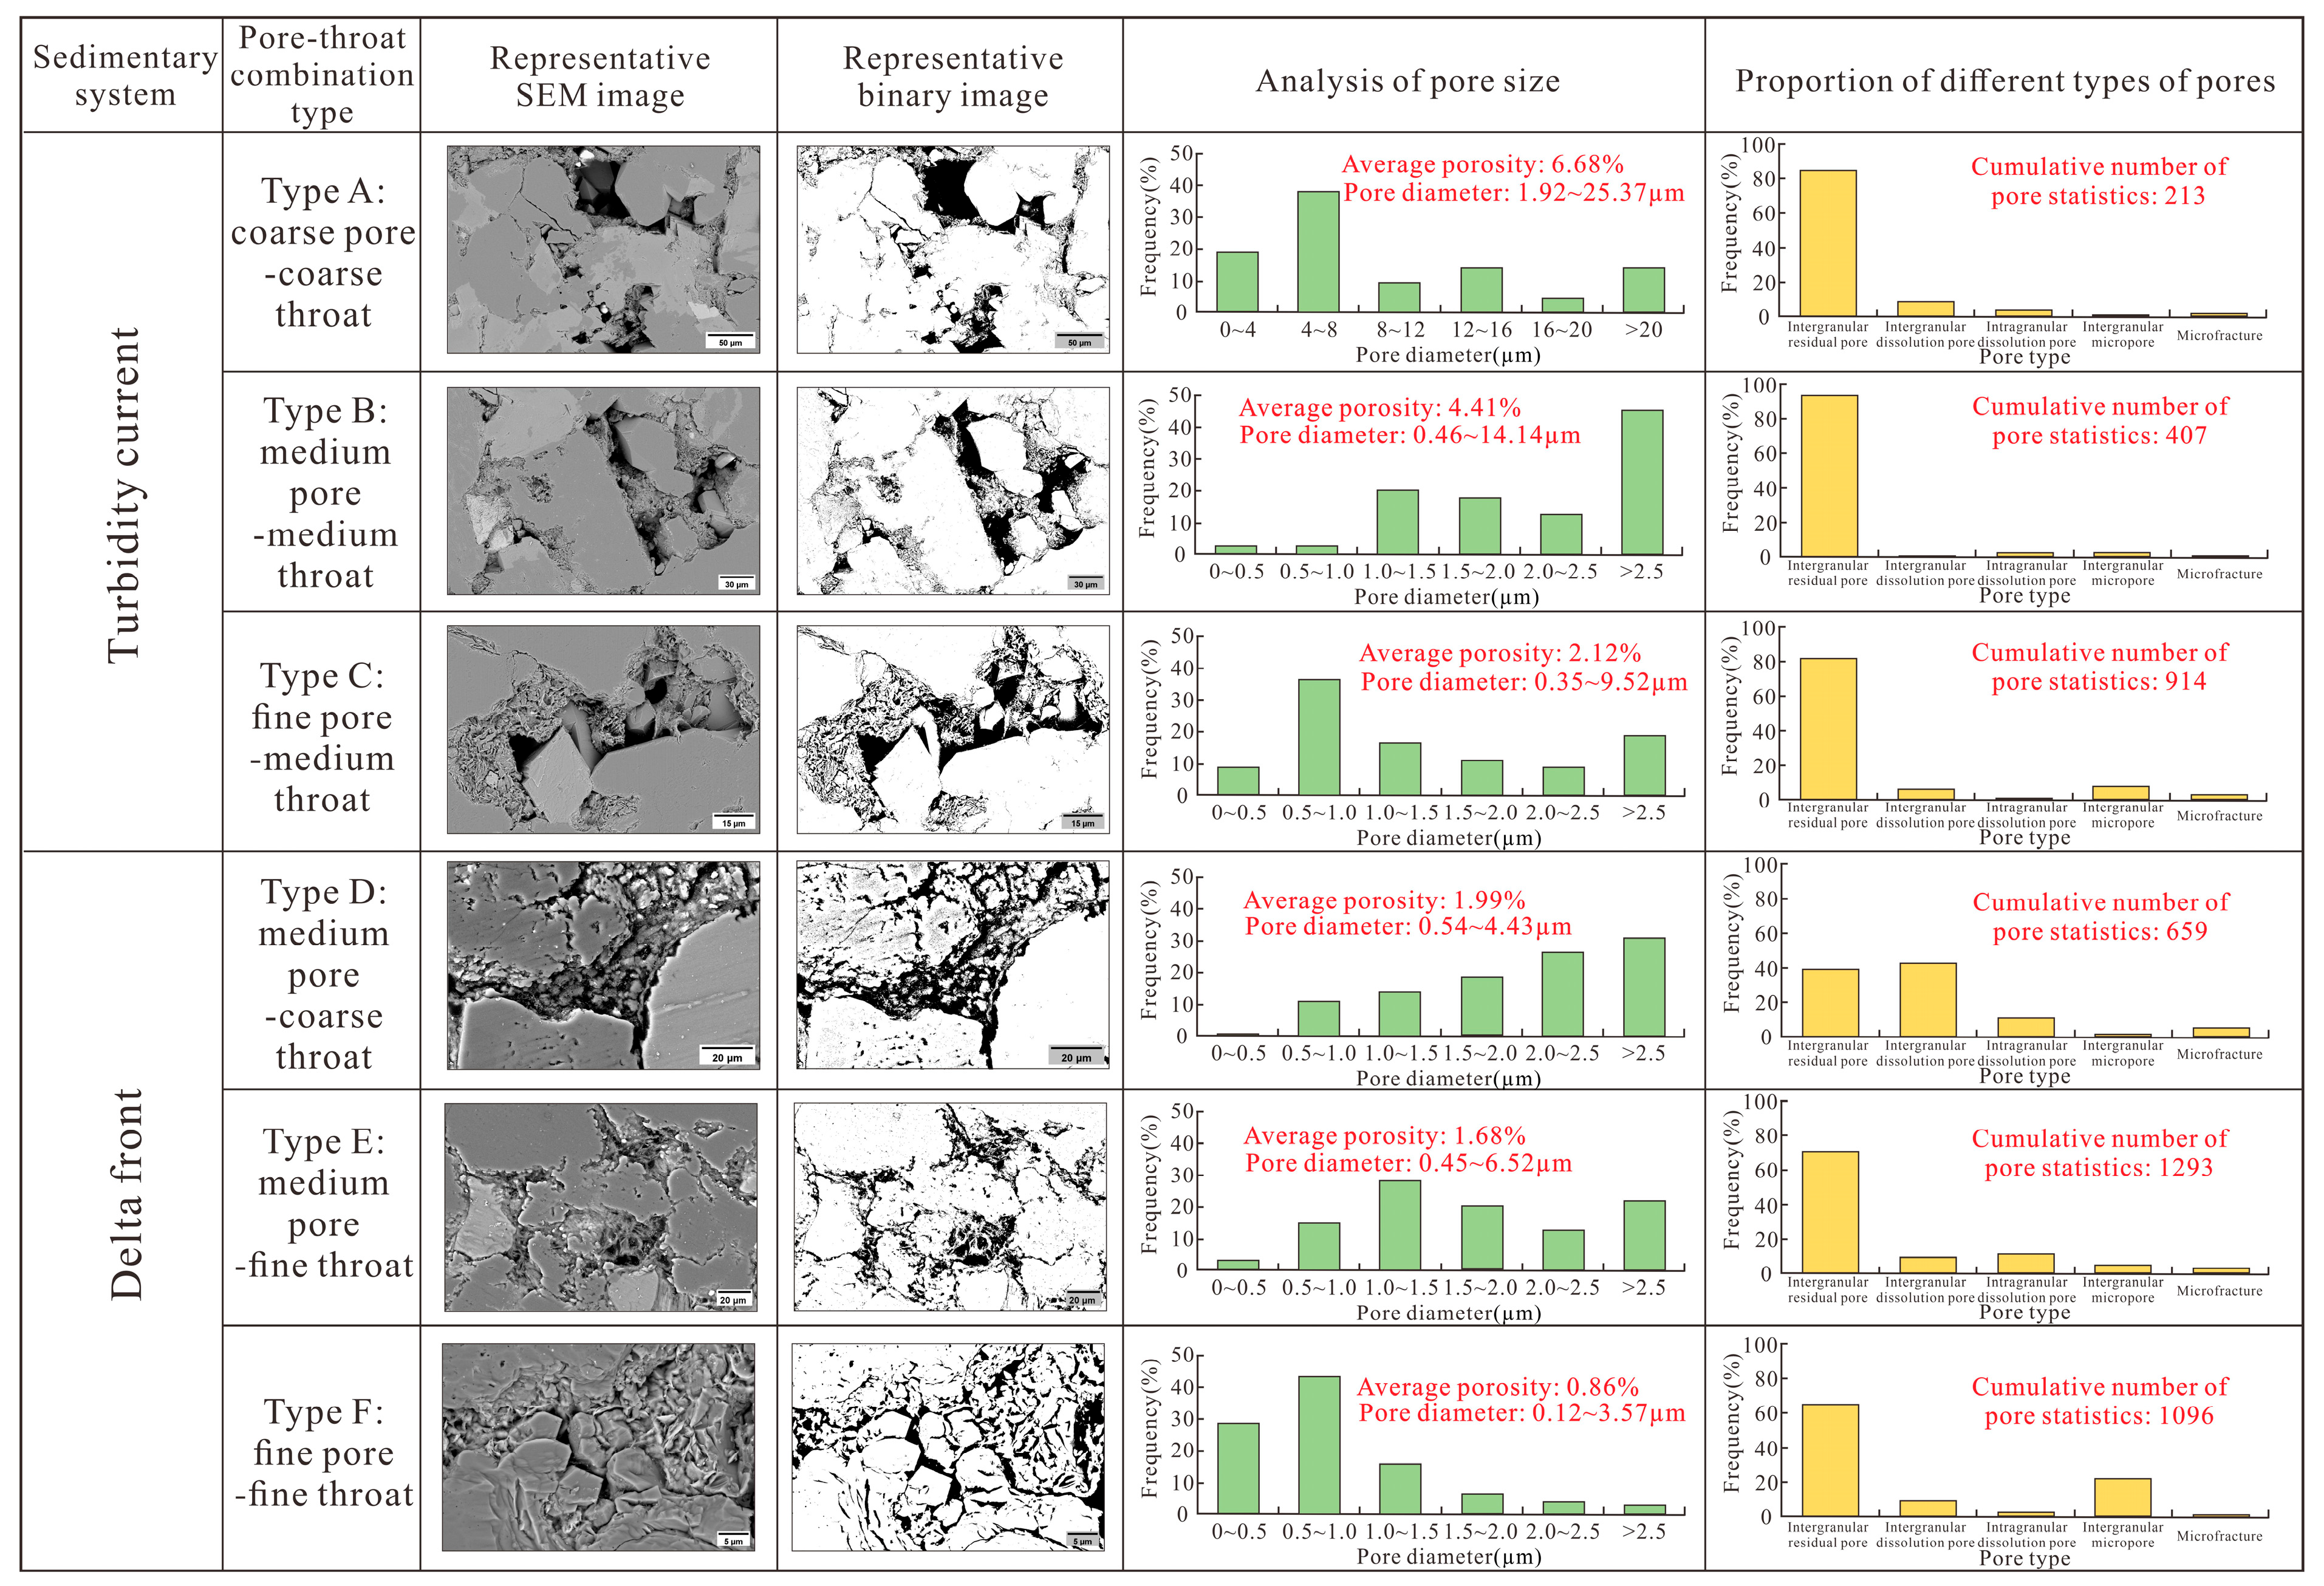
4.3.2. Quantitative Analysis

By processing and analyzing SEM images of 62 samples via ImageJ, the pore structure types were categorized into six classes. The specific statistical results of the pore structure parameters for individual samples are shown in Figure 6.
The turbidite reservoirs exhibit three types of pore–throat combinations: coarse pore–coarse throat (Type A), medium pore–medium throat (Type B), and fine pore–medium throat (Type C). These types show significant differences in their average porosity, range of pore diameter variations, and proportion of pore area for different types. The Type A pore structure has a high average porosity of 6.68%. The range of pore diameters varies greatly, with a minimum of 1.92 μm and a maximum of 25.37 μm. For Type B and Type C pore structures, the average porosity and pore diameter decrease sequentially, and the range of pore diameters is smaller than that of Type A. Type B reservoirs have an average porosity of 4.41% and pore diameters ranging from 0.46 μm to 14.14 μm. The Type C reservoirs present an average porosity of 2.12% and pore diameters ranging from 0.35 μm to 9.52 μm. All three types of turbidite sediment pore–throat combinations predominantly feature intergranular residual pore areas (exceeding 80%), with Type A accounting for nearly 10% of the dissolution pore area. The Type B pore areas are predominantly intergranular residual pores, whereas Type C pores represent relatively larger proportions of intergranular micropores and microcrack areas.
In delta front sediment deposits, three types of pore-throat combinations have also been developed: medium pore-coarse throats (Type D), medium pore-fine throats (Type E), and fine pore-fine throats (Type F). The average porosity and range of pore diameter variations for Types D, E, and F are significantly smaller than those for Types A, B, and C in turbidite reservoirs. The average porosities of Types D, E, and F decrease, with values of 1.99%, 1.68%, and 0.86%, respectively. However, Type E, the medium pore–fine throat type, has the largest range of pore diameters from 0.45 μm to 6.52 μm, whereas Type F has the smallest minimum diameter at only 0.12 μm. The proportion of the pore area varies greatly among different pore–throat combinations in delta front sedimentary reservoirs. Type D is primarily composed of intergranular dissolution pores and residual intergranular pores, accounting for approximately 80%, with slightly more intergranular dissolution pores. Type E predominantly consists of residual intergranular pores (70.60%), followed by intragranular dissolution pores (11.63%). Type F has the highest proportion of residual intergranular pores, accounting for 64.88% of the pore area. The second highest proportion is intergranular micropores at 22.18%, which is significantly greater than that of the other pore-throat combination types.
The sizes of the pores in tight sandstone reservoirs with different pore–throat structures vary significantly. Type A primarily consists of pores with diameters ranging from 4 μm to 8 μm, with more than 10% of the pores having diameters exceeding 20 μm. The Type B and D reservoirs predominantly have pores with diameters larger than 2.5 μm. In Type B, the proportion of pores with diameters between 1.0 μm and 2.5 μm decreases as the diameter increases. Conversely, in Type D, the proportion of pores across all size ranges increases with the increasing diameter. The Type C and F reservoirs feature pores with diameters ranging from 0.5 μm to 1.0 μm, accounting for more than 35% of the total. However, nearly 15% of the Type C pores have diameters slightly larger than 2.5 μm, whereas more than 25% of the Type F pores and throats have diameters between 0 and 0.5 μm. Type E reservoirs exhibit relatively even distributions of pore development across different diameter ranges. Pores with diameters between 1.0 μm and 1.5 μm are the most prevalent, accounting for nearly 27% of the total. In contrast, pores and throats with diameters between 0 and 0.5 μm are the least prevalent, accounting for approximately 3%.
A comparison of the pore–throat combinations and corresponding pore structure parameters of the tight sandstone reservoirs under the control of the two sedimentary systems clearly reveals that the pore structure of the turbidity current deposits significantly outperforms that of the tight sandstone reservoirs in the delta front subfacies.

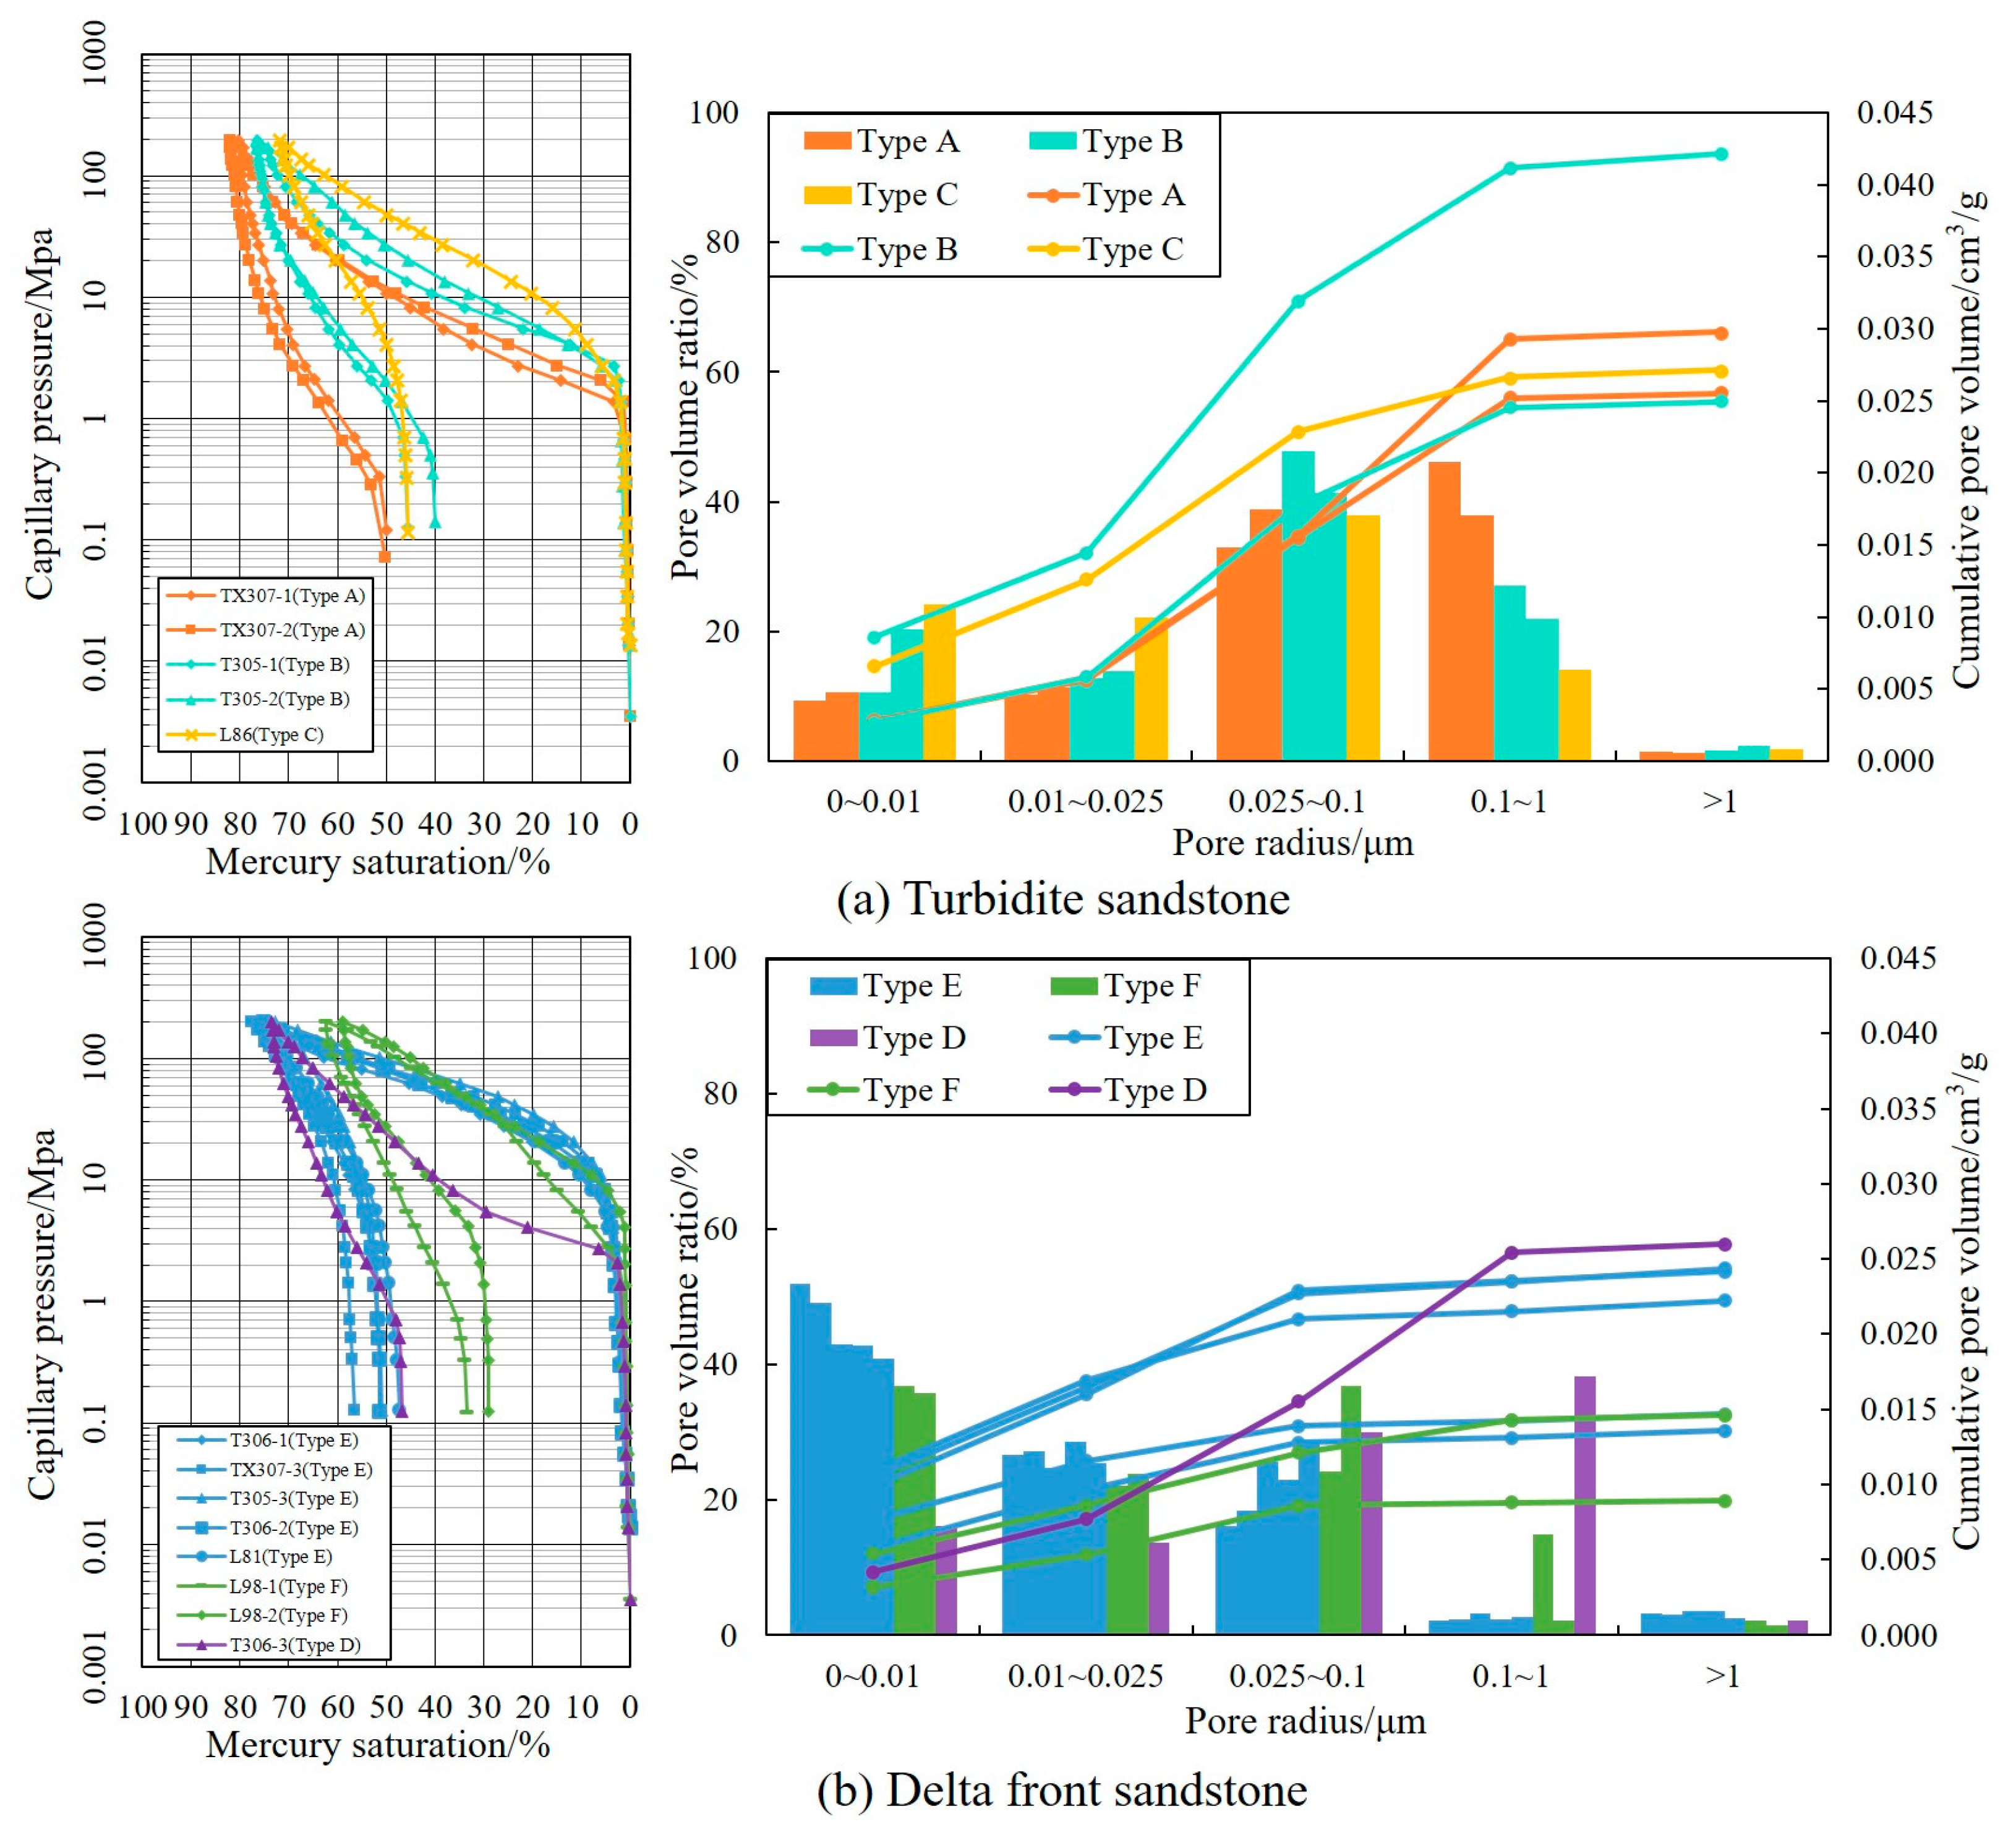
4.4. Pore Size Distribution

The mercury injection curve from the HPMI experiments reflects the connectivity of pores and throats as well as their distribution characteristics.
Owing to the selective distribution and skewness control of the reservoir pore–throat characteristics, the HPMI curves of turbidite and delta front tight reservoirs are classified into three types each. They correspond sequentially to six pore-throat combination types (Types A–F), with each curve shape representing distinct pore structure features (Figure 7). The displacement pressure distribution of turbidite reservoirs ranges from 0.676 MPa to 2.750 MPa. The maximum mercury injection saturation ranged from 71.790% to 81.980%. The distribution of the maximum pore–throat radius ranged from 0.267 to 1.087 μm, with a mercury extraction efficiency ranging from 36.491–48.043%. Curve Types A and B represent slightly sorted coarse-skewed distributions, with a more pronounced platform period for turbidite reservoirs. Additionally, Type A exhibits coarser skewness than Type B does. However, Type C curves exhibit poor sorting and fine skewness, lacking a platform period, indicating a relatively poorer reservoir performance. The displacement pressure distribution of the sandstone in the delta front ranges from 2.045–8.260 MPa, with the maximum mercury saturation predominantly between 58.793% and 77.542%. The maximum pore–throat radius ranges from 0.089 to 0.359 μm, with significant variations in each curve parameter and a mercury withdrawal efficiency of 27.168% to 50.725%. The Type D curve morphology represents poorly sorted and coarse-skewed pore structures, whereas the Type E curve signifies moderately sorted to moderately skewed structures. The Type F curve indicates poorly sorted and fine-skewed structures, with all three types lacking distinct plateau phases. Among these mercury injection capillary pressure curves, Type F has the highest minimum wet phase saturation value and a large volume of reservoir micropores but few macropores, indicating a relatively poor reservoir rock storage performance.
Turbidite sandstone reservoirs mainly feature fine–medium pores (0.025–1 μm), with a pore size distribution that is unimodal. The main peak almost exclusively corresponds to fine pores 0.025–0.1 μm in size, with a main peak occurring in the 0.1–1 μm medium pores. The cumulative pore volume of the turbidite sandstone samples ranged from 0.025 to 0.042 cm3/g, indicating significant changes in the cumulative pore volume in the Type B mercury injection curves. The delta front sandstone reservoirs have developed mainly micropores–fine pores (0–0.1 μm). The pore size distribution exhibits both unimodal and bimodal characteristics, with significant variations in the main peak pore sizes. Micropores (0–0.025 μm), fine pores (0.025–0.1 μm), and medium pores (0.1–1 μm) are present. The cumulative pore volume of the delta front reservoirs ranges from 0.009 to 0.026 cm3/g. Among them, the Type F mercury injection curves have the smallest cumulative pore volume, whereas the Type D curves have the largest cumulative pore volume. The Type E curves show significant variations in the cumulative pore volume, which are primarily distributed within the ranges of 0.010–0.015 cm3/g and 0.020–0.025 cm3/g. Additionally, both the Type D and F curves feature relatively developed medium pores.
According to the analysis of the HPMI results, within the overall study area, turbidite sandstones exhibit smaller variations in curve parameters than delta front sandstones. Turbidite sandstone reservoirs demonstrate relatively better sorting, coarser skewness, lower minimum wet phase saturation values, smaller pore–throat volumes, lower displacement pressures, larger maximum pore–throat radii, and greater mercury withdrawal efficiencies. Therefore, rock reservoir properties are relatively superior to those of delta front sandstone reservoirs. Moreover, the cumulative pore volume and pore size distribution range of the turbidite sandstones in the study area are both greater than those of the delta front reservoirs. In addition, the delta sedimentary tight reservoirs have micropores with 0–0.025 μm pore radii, which are difficult to observe with the naked eye, resulting in the surface pore rate of the delta front sandstones being significantly lower than that of the turbidite sandstones.
NMR signals can capture information about the pore structure. The figure shows the typical incremental and cumulative distributions of the pore–throat radius in the core plug samples of tight sandstones after saturation with water, corresponding to six types of pore structures (Figure 8). In the NMR pore diameter spectrum in the figure, in addition to the combination of Type D delta front sandstones, which have a distinct bimodal distribution with a main peak at 0.007 μm and a secondary peak at 0.15 μm, the other types exhibit a predominantly unimodal distribution. The pore–throat radii for Type D are distributed between 0.0007 μm and 1 μm. Among the turbidite sandstone samples, Types A, B, and C tend to have decreasing main peak positions in their pore size distributions, ranging from a maximum of 0.04 μm to a minimum of 0.01 μm. For the delta front sandstone samples, Type E has a broader range of main peak variations (0.003–0.015 μm), whereas Type F has significantly smaller peaks, primarily at approximately 0.003 μm. Through spectral comparison and analysis, it is evident that the main peaks of the pore–throat radius in the turbidite sandstone samples are generally larger than those in the delta front samples.

4.5. Fractal Dimension Features
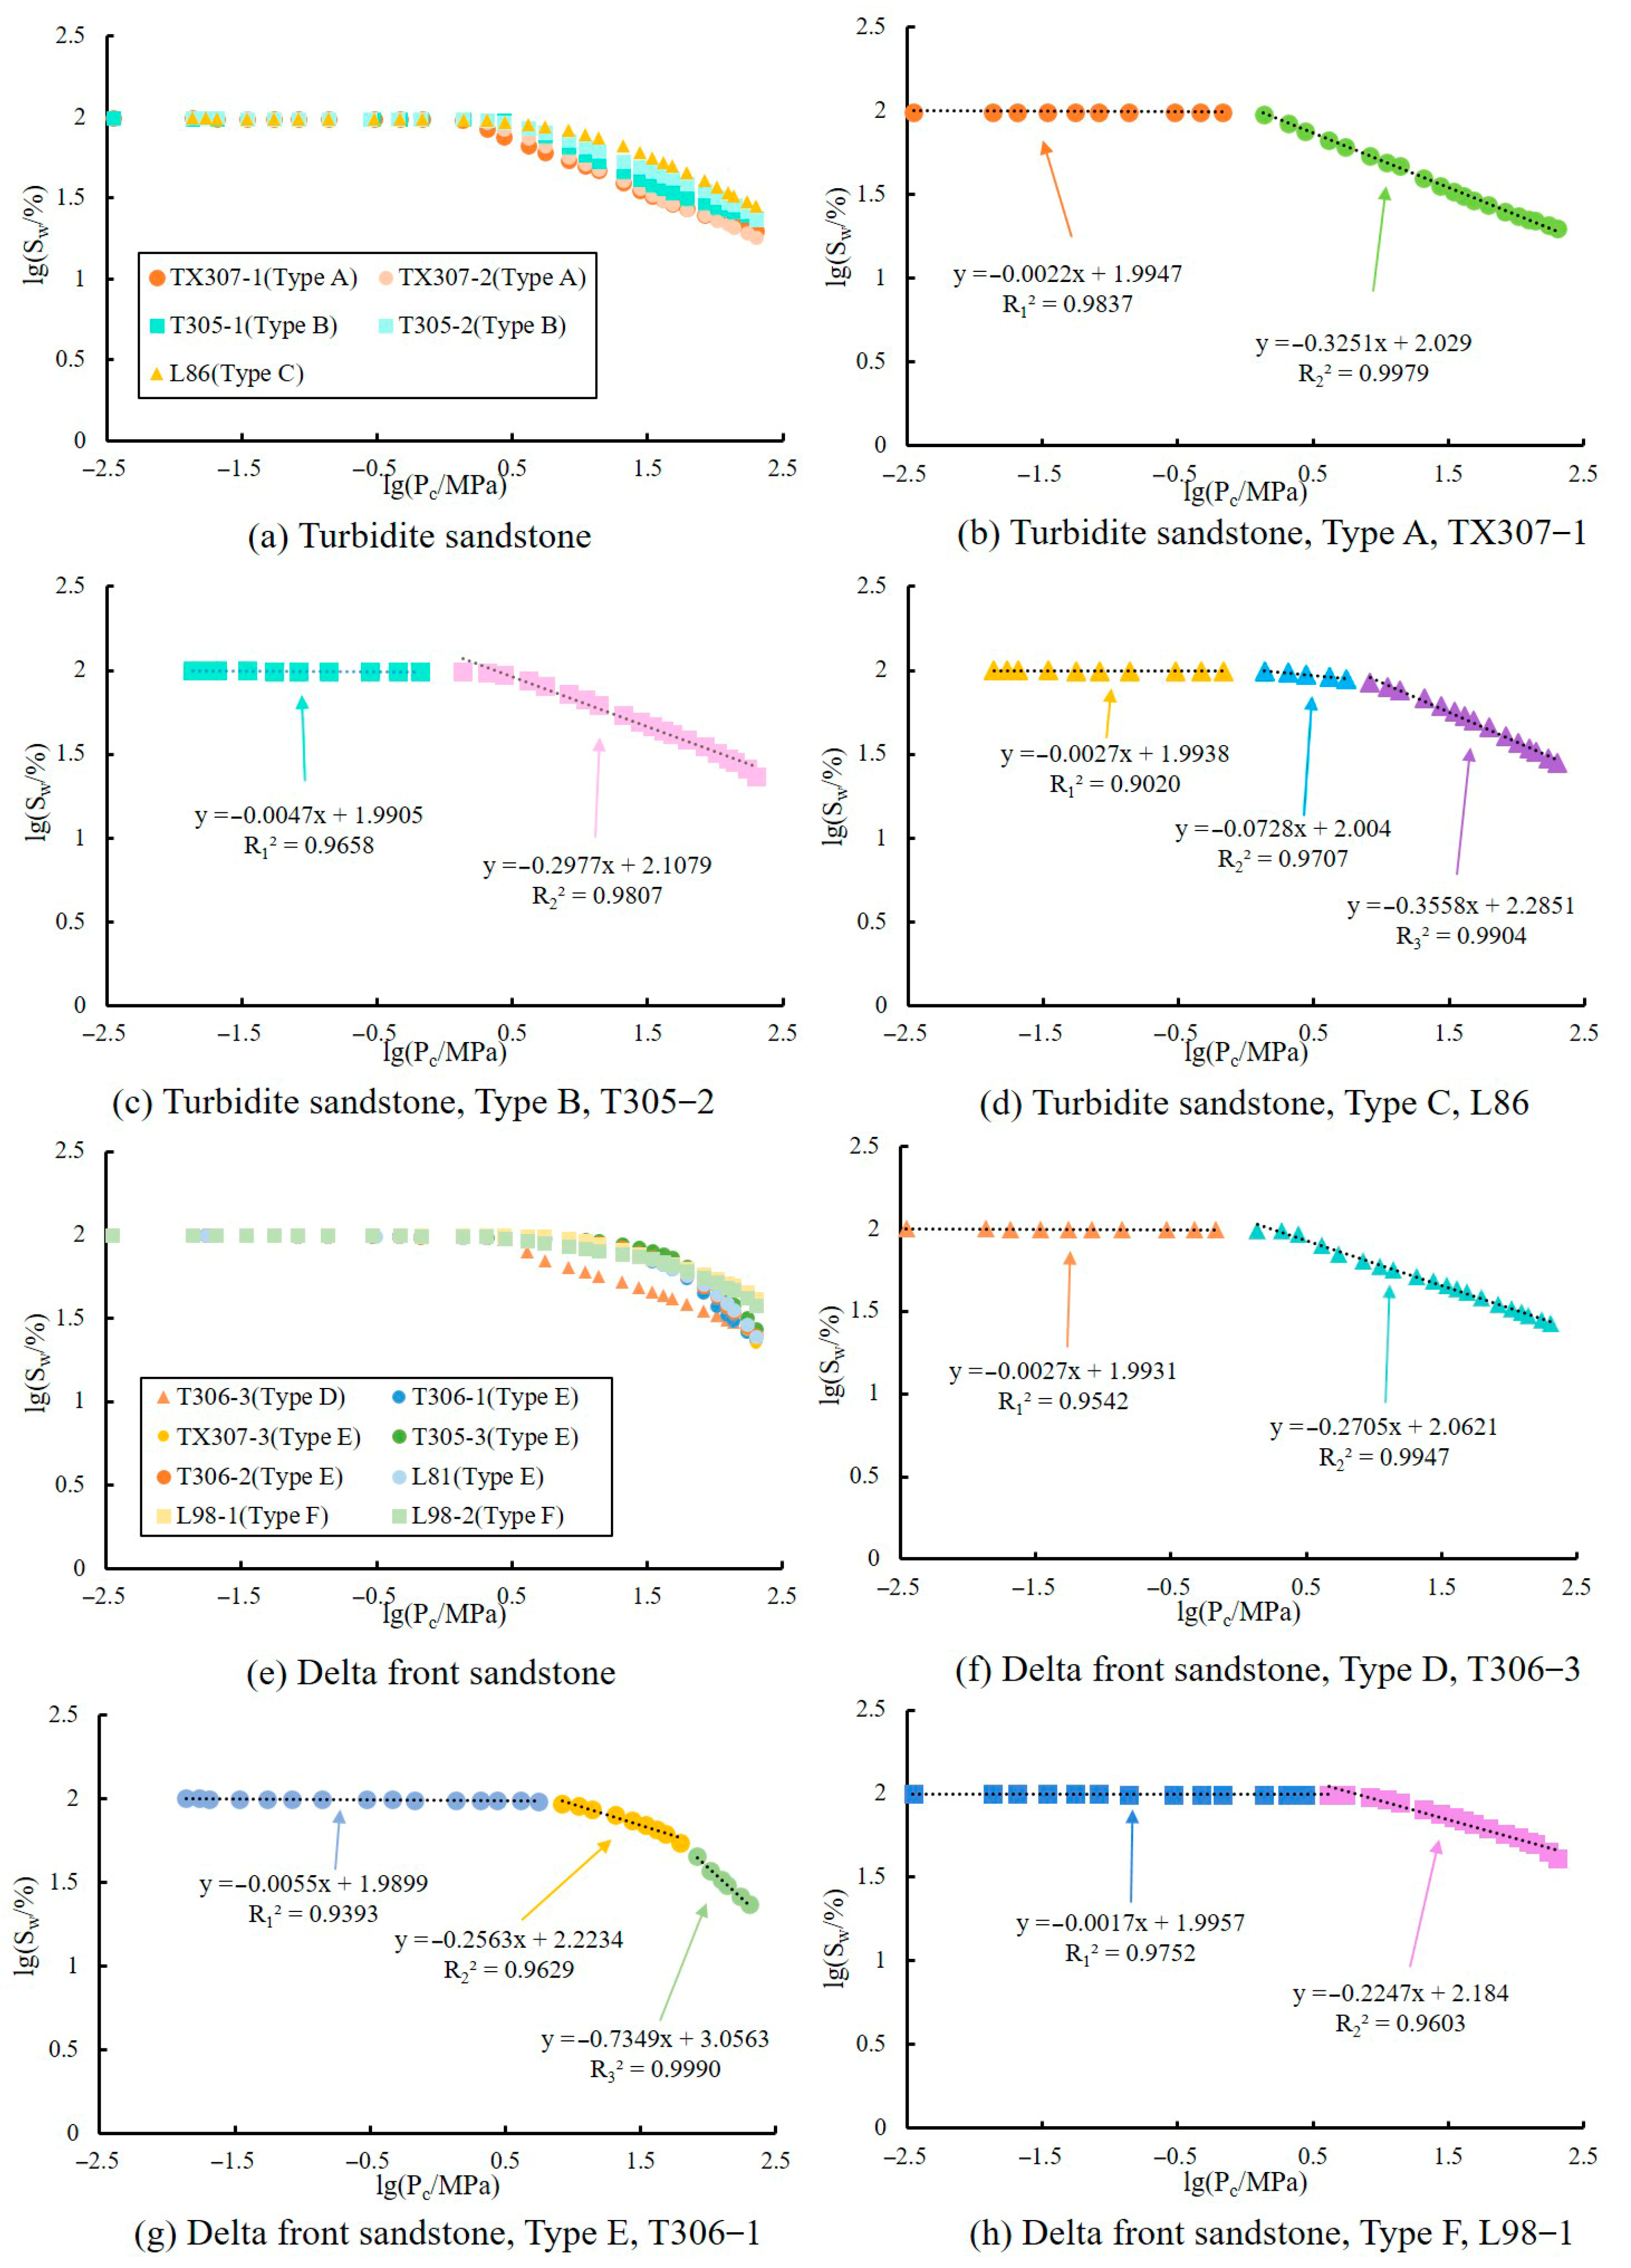
Fractal dimension is calculated from the capillary pressure and mercury saturation data obtained via HPMI experiments, employing Equations (3) and (4). Typical fractal characteristics are shown in Figure 9, where there is a significant linear correlation between the wetting phase saturation and the capillary pressure on a double logarithmic coordinate, with the fractal dimension correlation R2 for each segment exceeding 0.9.
The pore characteristics of the two sets of sedimentary reservoirs exhibit different fractal features, but overall, they present a multisegment fractal pattern (Table 1 for specific data). The numerical values and differences of multi-segment fractal dimensions can quantitatively characterize pore structure heterogeneity across different pore size scales, with each fractal segment corresponding to a specific pore size range and geological genesis. The macropore segment (D1) corresponds to primary macropores and macroscopic fractures with pore diameters greater than 100 nm, which can reflect the complexity of the fracture network and flow connectivity. These features principally arise from coarse-grained intergranular pores formed during depositional grain packing and the fracture networks generated by subsequent tectonic stress. In the mesopore segment (D2), the physical pore scale is 10–100 nm, mainly revealing the modification of the pore network by compaction, cementation, and dissolution during the diagenetic processes. The microporous segments (D3) focus on the intercrystalline pores and microscopic secondary dissolution pores, which are physical pore scales less than approximately 10 nm, affecting the adsorption characteristics and specific surface area of the reservoirs [58,59,60].
Among the turbidite sandstone samples, Type A and B pore–throat combinations, including sample TX307-1, present two-segment fractal features (D1 and D2), whereas Type C displays three-segment fractal features (D1, D2, and D3). Moreover, Type D, represented by sample T306-3, and Type F, represented by sample L98-1, both exhibit a two-segment fractal feature (D1, D2). In contrast, Type E pore–throat combinations, exemplified by sample T306-1, correspond to a three-segment fractal feature (D1, D2, D3) (Figure 9).
(1)
Two-segment fractal characteristics: These characteristics correspond to the Type A and B pore–throat combinations in turbidite sandstones (Figure 9b,c) and the Type D and F types in delta front sandstones (Figure 9f,h). As shown in Table 1, in turbidite reservoirs, the fractal dimension D1 for relatively coarse pores ranges from 2.995 to 2.998, with an average value of 2.997. The fractal dimension D2 for relatively fine pores ranges from 2.643 to 2.702, with an average value of 2.674. In the delta front sandstone reservoirs, the fractal dimension D1 for relatively coarse pores ranges from 2.997 to 2.998, with an average value of 2.998. The fractal dimension D2 for relatively fine pores ranges from 2.730 to 2.808, with an average value of 2.771. In delta front sandstone reservoirs, the average values of fractal dimensions D1 and D2 of the Type D and Type F pore–throat combinations are both higher than those of Type A and B in turbidite sandstones, indicating a more complex pore size distribution and pronounced heterogeneity in delta front sandstones. The delta front reservoirs exhibit the highest D1 value, reflecting as markedly heterogeneous for the macroscopic pore–fracture network. The average value of D2 of turbidite sandstones is low. Under the combined influence of compaction, cementation, and dissolution during the diagenesis processes, the pore–throat distribution of the reservoirs is uniform and the homogeneity is pronounced.
(2)
Three-segment fractal characteristics: These correspond to the Type C pore–throat combination in turbidite sandstones (Figure 9d) and Type E in delta front sandstone reservoirs (Figure 9g). As shown in Table 1, in turbidite reservoirs, the fractal dimension D1 for relatively coarse pores is 2.997, D2 is 2.927, and D3 for relatively fine pores is 2.644. In delta front reservoirs, the fractal dimension D1 for relatively coarse pores ranges from 2.992 to 2.995, with an average of 2.993. D2 ranges from 2.726 to 2.810, with an average of 2.762. D3 ranges from 2.078 to 2.283, with an average of 2.206. The average values of the fractal dimensions D1 and D2 segments of the Type C pore–throat combination in turbidite sandstones are both higher than those of Type E in delta fronts. The D1 segment implies that the pore size distribution within the turbidite reservoirs is more complex and heterogeneous. Moreover, complex and multi-branched flow channels have been formed under the influence of sedimentation. The D2 segment is predominantly controlled by diagenesis. Under the combined modification of compaction, cementation, and dissolution, the turbidite reservoirs exhibit enhanced heterogeneity and an increased complexity of fluid-flow pathways. The D3 segment fractal dimension characterizing micropores in the turbidite sandstones is significantly larger than that of the delta front reservoirs, indicating that the micropore diameters in turbidite sandstones exceed those in delta fronts. The Type E pore–throat combination developed in delta front facies exhibits a relatively uniform micropore distribution and pronounced homogeneity, while the small micropore diameters limit the fluid-flow capacity.

5. Discussion

5.1. The Impact of Sedimentation on Reservoir Pore Structure in Two Sedimentary Systems

The ultimate manifestation of pore structures in tight sandstone reservoirs is determined by the combined effects of sedimentation and diagenesis. The composition, grain size, and depositional environment of sediments lay the material foundation for the formation of reservoir space, whereas diagenesis is the key factor in the formation and evolution of pore structures. Overall, in the study area of the Linnan Subsag, the differences in the sedimentary and diagenetic processes under two different sedimentary systems in Es33 determine the distribution characteristics of pore structure variations.

5.1.1. The Impact of Sedimentary Facies on Pore Structure

Sedimentary facies have a significant effect on the formation of pore structures. Variations in the sediment composition, grain size, and sorting within different sedimentary facies lead to substantial differences in the pore structure. Even within the same sedimentary facies, variations in the grain size and clay content at different locations can cause noticeable differences in the reservoir pore structure (Figure 3 and Figure 6).
Turbidity currents are gravity-driven sediment flows with Newtonian rheological properties and turbulent conditions, where sediments are transported in suspension and supported by turbulence. The overall process of turbidity current deposition is characterized by a continuous decrease in energy and the flow velocity, resulting from the gradual settling of suspended sediments. During turbidity current sedimentation, coarse and fine particles settle at different rates, leading to a normally graded sequence with a gradational upper contact [61,62]. Thin sections of sandstones show that turbidite reservoirs in the area have moderate–poor sorting, with subangular grains predominating. The amount of the matrix is slightly greater, mostly consisting of matrix-supported and pore-filling cementation. The maturity of turbidity current sediments and structures is relatively low, with varying clast sizes. The grain size probability curves typically exhibit a low-slope single-segment feature with a wide range of grain sizes (Figure 5a–h).
In the delta front subfacies, the sedimentary microfacies primarily include distributary channels, delta front sandbars, distal sandbars, sheet sands, and interdistributary bays. The overall sorting of the reservoirs is moderate and the roundness is mainly subangular. Owing to significant sedimentary facies control, the compositional and structural maturities of the delta front subfacies reservoirs are intermediate to low (Figure 5i–t). Among the different types of sand bodies within the delta front sedimentary system, distributary channel sands have the best physical properties, whereas delta front sandbars and distal sandbars have intermediate properties. However, sheet sands and interdistributary bay sands have the worst physical properties. The reservoir lithofacies in different sedimentary microfacies of the delta front subfacies are complex, with varying degrees of heterogeneity and relatively noticeable differences in physical properties [63,64,65].
Overall, turbidite reservoirs have good physical properties, with lower complexity in terms of their pore structure and weaker heterogeneity, making them favorable reservoirs. In contrast, delta front reservoirs have poorer properties, with relatively complex pore structures and greater heterogeneity (Figure 4 and Figure 6). The composition and structure of tight sandstones affect the reservoir physics and pore structure [66,67,68,69]. The reason lies in the fact that although the matrix content in turbidite reservoirs is slightly higher and sorting is moderately deviated, the rocks have coarser grains, higher quartz and debris contents, and greater sandbody thicknesses, resulting in good reservoir quality. On the other hand, while delta front reservoirs have relatively lower matrix contents, their carbonate cement contents are significantly higher, and both their compositional and structural maturities are intermediate to low. Moreover, delta front reservoirs have thinner single-sand bodies, finer sandstone grain sizes, and better sorting and rounding, but an increased mud content in facies such as sheet sands degrades their physical properties, leading to poorer pore structures and greater heterogeneity, which further deteriorates their physical quality [70]. As the pore structure improves, the proportion of movable fluids in tight reservoirs increases accordingly. Therefore, the proportion of movable fluids and the oil content in gravity flow sedimentary reservoirs are greater than those in delta front reservoirs. The microscopic pore structure characteristics and fluid mobility are significantly influenced by the lithology and lithofacies of tight sandstones [71].

5.1.2. Impact of Lithofacies on Pore Structure

The tight sandstone reservoirs controlled by two different sedimentary systems exhibit diverse lithofacies types, but the impact and control of these lithofacies on the microscopic pore structure of the reservoirs remain unclear. Therefore, it is necessary to discuss the sedimentary processes under the control of the gravity flow and delta front subfacies at both macro- and microscales to clarify the relationships between different lithofacies and the microscopic pore structures of reservoirs.
The turbidite sandstones are generally coarse, are predominantly composed of fine sandstone and siltstone, and exhibit distinctive gravity flow sedimentary structures. The delta front reservoirs are primarily composed of fine siltstone and calcareous siltstone. The sedimentary structures are relatively sparse, with some mudstone bands developed. Summarizing the lithofacies classification results, different pore structure types correspond to the following lithofacies, as shown in Figure 10. In turbidite sandstone reservoirs, the Type A pore structure is associated with fine sandstone lithofacies, which predominantly consists of massive fine sandstone, with some cores displaying disturbed structures and minor mudstone bands. The type B pore structure corresponds to siltstone lithofacies, which consists mainly of massive siltstone, but also features cross-bedding and convolute bedding. The type C pore structure is linked to argillaceous siltstone lithofacies, which are characterized by variable sedimentary structures and bedding, with load structures and flame structures developed, and occasional wavy migrating microcross-bedding. Under the influence of the delta front subfacies, the Type D pore structure corresponds to the fine siltstone lithofacies, which predominantly consists of massive structures with minor mudstone bands. The type E pore structure includes a variety of lithofacies, such as calcareous siltstone lithofacies and argillaceous layered siltstone lithofacies. The former is mainly massive, whereas the latter features feathery sedimentary structures. The Type F pore structure is associated with silty mudstone lithofacies and is characterized mainly by massive structures, although some cores contain debris or sandy masses.
The lithofacies description and spatial distribution characteristics are illustrated in Figure 10. In turbidite sandstone reservoirs, the first type of lithofacies is fine sandstone, which predominantly consists of massive fine sandstone, with some core samples displaying disturbed structures and a small number of mudstone bands. These lithofacies are present mainly at the bottom of the turbidite sandstone reservoirs (sand Group 2), which are in the relatively low-lying area at the center of the subsidence zone within the study area. The second type are siltstone lithofacies, which primarily consist of massive siltstone, but have a visible development of cross-bedding and encapsulated bedding. These lithofacies are present mainly at the top of the gravity flow sedimentary reservoirs in the eastern part of the study area. The final type of lithofacies in the turbidite sandstones is argillaceous siltstone. It is characterized by variable sedimentary structures and bedding, specifically showing the development of load structures and flame structures, while occasional wavy migration microcrossbedding can also be observed. These lithofacies are distributed primarily in the western area of Linnan Subsag and is located mainly at the bottom of turbidite sedimentary reservoirs. With respect to the three types of lithofacies in the gravity flow reservoirs, the fine sandstone and argillaceous siltstone lithofacies both develop at the bottom of sand Group 2, which is in the central and western areas of the study area. In contrast, the siltstone lithofacies are present at the top of sand Group 2, which is primarily situated in the eastern part of the study area. However, the sedimentary reservoirs of sand Groups 4–6 also developed three types of lithofacies under the control of delta front facies. The coarsest lithology is in the fine-siltstone lithofacies, which are characterized primarily by massive structures with a small number of mudstone bands. The lithofacies are predominantly developed in the eastern part of the study area, which has a high structural position and is located at the top of the delta front sedimentary reservoirs. The calcareous siltstone is the second type of lithofacies within the delta front sedimentary facies; it is also characterized by massive structures and is the only one of calcareous sandstone lithofacies among all types. It has developed at the top of the delta front sandstones in the easternmost part of the study area, with a structural position lower than that of the fine-siltstone lithofacies. The final type is the argillaceous layered siltstone lithofacies, which feature a large number of argillaceous layered bands with occasional feathery sedimentary structures. These lithofacies developed in the western and central areas of the study region, occurring at both the top and middle sections of the delta front sedimentary reservoirs. The three types of lithofacies developed under the control of delta front facies exhibit distinct spatial distribution characteristics. The fine siltstone and calcareous siltstone lithofacies have developed mainly at the top of the sedimentary reservoirs in the eastern part of the study area, whereas the argillaceous layered siltstone lithofacies are in the upper–middle section of the reservoirs in the western part.
Based on the study of the two sets of sedimentary reservoirs, the tight sandstone lithofacies in the study area can be finely classified. The results indicate that six types of lithofacies correspond to six types of pore structures, clarifying the relationship between sedimentation and the genesis of pore structures. Specifically, the fine sandstone lithofacies, siltstone lithofacies, and argillaceous siltstone lithofacies developed in the gravity flow reservoirs correspond to the coarse pore–coarse throat (Type A), medium pore–medium throat (Type B), and fine pore–medium throat (Type C) pore structures, respectively. In contrast, the fine-siltstone lithofacies in the delta front reservoirs correspond to the medium pore-coarse throat (Type D) pore structure, whereas the calcareous siltstone lithofacies control the medium pore-fine throat (Type E) structure. The pore structure influenced by the argillaceous layered siltstone lithofacies is classified as fine pore–fine throat (Type F).

5.2. The Impact of Diagenesis and Diagenetic Facies on Reservoir Pore Structure in Two Sedimentary Systems

5.2.1. Impact of Diagenesis on Pore Structure

The examination of core-cost thin sections, ordinary thin sections, and SEM data determined that the diagenetic processes significantly affecting the tight sandstone reservoirs in Es33 in the Linnan Subsag include compaction, cementation, and dissolution. Among these, compaction and cementation reduce porosity, whereas dissolution increases porosity.
(1)
Compaction
In the study area, the compaction in Es33 is primarily mechanical, with chemical compaction (pressure solution) being less common. According to the rock component statistics from core-cost thin sections, the overall clastic components in the area have a relatively high proportion of rigid components (quartz, feldspar, and metamorphic rock debris). However, the tight sandstone particles are generally relatively fine, with moderate sorting and a relatively high content of the clay matrix. As a result, mechanical compaction significantly reduces the original intergranular pores. The compaction phenomena observed under the microscope include the fracturing of rigid particles and deformation and compaction of plastic particles. In addition, the contact relationships of clastic particles are mainly line contacts and point-line contacts, with some particles undergoing compaction (Figure 5i,j).
Compaction is one of the important diagenetic processes responsible for reducing primary porosity in the study area, with the primary influencing factor being the burial depth. As the burial depth increases, the compaction intensity also increases, leading to a significant reduction in the primary porosity. However, tight sandstone reservoirs controlled by two different sedimentary systems exhibit significant differences in the burial depth and corresponding degree of compaction. The reservoirs controlled by the gravity flow sedimentary system correspond to the 2nd sand group, with relatively shallow burial depths ranging from 3200 to 4000 m. The contact types between clastic particles include point–line contacts and line–line contacts, with relatively low degrees of compaction and well-preserved primary intergranular pores (Figure 5b,c). In contrast, the tight reservoirs controlled by the delta front sedimentary system correspond to the 4–6 sand groups in the study area. Owing to a deeper burial (3800–4400 m), the degree of compaction is high, leading to a significant reduction in primary intergranular pores. The particle contacts are predominantly line contacts, with noticeable irregular contacts and the fracturing of rigid particles. These phenomena result in a reduced throat width, with most throat types being sheet-like and sheet-bend-shaped, making the pore structure more complex due to compaction. Mechanical compaction, which significantly reduces the primary porosity, has a weaker effect on turbidites than on delta front sandstone reservoirs.
There is a small amount of pressure dissolution in the area, which primarily involves quartz pressure dissolution. This phenomenon manifests as irregular or sutured contacts between particles, which reduces the porosity (Figure 5i). Quartz pressure dissolution causes throat narrowing and flattening between clastic particles, increasing the complexity and heterogeneity of the pore structure, which ultimately affects reservoir permeability. After quartz pressure dissolution, the dissolved SiO2 becomes saturated in the pore water, leading to the precipitation of quartz secondary enlarged edges, which reduces the porosity and permeability of the reservoir.
Quartz pressure dissolution seams have developed, with some of these seams containing black carbonaceous films. As the burial depth of the reservoir increases and the geothermal gradient increases, the intensity of quartz pressure dissolution gradually increases. Consequently, the effect of quartz pressure dissolution is stronger in delta front facies reservoirs than in turbidite reservoirs, resulting in a more complex pore structure in the former.
(2)
Cementation
As the burial depth increases within reservoirs, the content of cementing materials continuously increases, leading to a gradual deterioration in the physical properties of the rock. Consequently, cementation is the main reason for the decline in reservoir quality. The essence of cementation is the consolidation of authigenic minerals into rock. The main types of cementation in the area include carbonate cementation (such as calcite, dolomite, iron–calcite, and iron–dolomite cements) (Figure 5a–d,n,o), siliceous cementation, and clay mineral cementation (such as kaolinite, illite, and chlorite cements) (Figure 5m). According to extensive thin section data and XRD analysis results, most pore spaces are filled with carbonate cements and authigenic clay minerals, whereas some pore spaces are occupied by secondary enlarged quartz. This leads to the further deterioration and complexity of the pore structure. However, the degree of cementation is quite different between the two sedimentary reservoirs.
(3)
Carbonate cementation
The reservoirs in the area have undergone two phases of carbonate cementation. Early carbonate cementation, which primarily consisted of calcite and dolomite, occurred mainly at shallow depths (generally less than 1700 m). Late carbonate cements include (iron) calcite and (iron) dolomite, and late-stage carbonate precipitation mainly occurred in the deeper parts of the study area (generally greater than 2100 m) under relatively high-temperature, high-pressure, and Fe2+-rich reducing conditions. The cement content significantly increases with the increasing burial depth [72]. Es33 belongs to the middle diagenesis B stage [43,73], where late-stage carbonate cementation mostly occurs after secondary quartz enlargement (Figure 5a–d,n,o).
Cementing materials fill the pores, reducing the storage space and causing the rock pores to shrink and pore–throats to become blocked, which decreases the reservoir storage properties, increases the complexity of the pore structure, and enhances the heterogeneity of the pore structure. Under microscopic observation, the cementation degree of the delta front reservoirs is significantly greater than that of the turbidite sandstone reservoirs. The turbidite reservoirs exhibit pore-filling cementation, with intergranular spaces partially filled with carbonate cement (Figure 5a–d). In contrast, the delta front reservoirs commonly have intergranular spaces filled with carbonate cement, where most of the pore spaces between grains are occupied by carbonate minerals, often as medium-to-fine crystalline granular spaces between clastic grains (Figure 5n,o). The carbonate cementation in the delta front reservoirs is exceptionally strong, leading to pseudobasement-type cementation, severely blocking the original pore spaces, creating variable pore–throat structures, and significantly deteriorating the reservoir properties.
(4)
Clay cementation
The impact of clay mineral types and their relative abundances on the heterogeneity of reservoir pore structures is due primarily to the different crystallization forms of these clay minerals and their occurrence in the reservoirs. In the northern source area of the Linnan Subsag, the tight sandstone reservoirs widely contain illite, kaolinite, chlorite, and illite/smectite mixed layers. Among these, kaolinite primarily forms book-like or worm-like aggregates by sporadically filling the pores (Figure 5m). It can also create some secondary porosity during the alteration of feldspar to kaolinite (Figure 5g). Illite bridges and partitions the intergranular pores in a flaky manner (Figure 5s). Chlorite acts as a pore lining and filling material within the intergranular pores. Moreover, the illite/smectite mixed layers appear in fibrous and flaky forms, often as pore linings and fillings. Clay minerals significantly reduce pore and throat sizes, affect porosity and permeability, and increase the heterogeneity of the reservoir pore structure.
According to the vertical distribution map of clay mineral relative percentages, the kaolinite cementation in the delta front reservoirs is stronger than that in the turbidite sand reservoirs. In delta front reservoirs, the relative content of kaolinite can reach 67% (Figure 11). SEM reveals that kaolinite forms book-like or worm-like aggregates, with kaolinite crystals present to varying degrees in most intergranular pores and some kaolinite filling the throats, reducing their width. Additionally, there are often significant residual pores, dissolution pores, and intercrystalline micropores between kaolinite crystals, which increases the types of pore–throat structures and the heterogeneity of the pore space. However, turbidite sandstone reservoirs are relatively rich in illite and illite/smectite mixed layers. These clay minerals fill the pores in flaky and fibrous forms, with occasional networked and curved flaky oriented illite, reducing the pore and throat sizes. Chlorite is an authigenic mineral in the area and its content is low, ranging from 0.5% to 2.0%. According to X-ray diffraction analysis of clay minerals, the delta front reservoirs are relatively richer in chlorite, accounting for 4% to 23% of the total clay mineral content, with an average of 10.75%, and exhibit chlorite rims. The development of chlorite rims is beneficial for preserving primary intergranular pores. However, in the study area, the chlorite rims in the tight sandstone reservoirs are relatively thin and rarely completely envelop the particles. Therefore, the relatively high content of chlorite cementation does not play a key role in preserving the primary intergranular pores of the delta front reservoirs. In addition, it does not significantly improve the heterogeneity of the reservoir pore structure.
Owing to the rich presence of illite and illite/smectite mixed layers in turbidite reservoirs and the abundant kaolinite cementation in delta front reservoirs, the impact of clay mineral cementation on the pore structure of tight sandstones varies. Additionally, the degree of clay filling in the delta front reservoirs is greater than that in the turbidite reservoirs, resulting in different levels of heterogeneity in the pore structures of the two reservoir types (Figure 12).
(5)
Siliconeous cementation
In the clastic rock tight reservoirs in the Linnan Subsag, siliceous cementation is characterized by the secondary enlargement of clastic quartz and the formation of new intergranular microcrystalline quartz (Figure 12). Microscopic observations reveal that both the turbidite and the delta front sandstone reservoirs exhibit the secondary enlargement of quartz, with similar amounts of new intergranular microcrystalline quartz. Thus, the impact of siliceous cementation on the heterogeneity of pore structures in the two different reservoirs is not significant (Figure 5e,j).
Overall, the impact of cementation on the pore structure of the tight reservoirs in the two sets of sedimentary systems indicates that carbonate cementation is the primary influencing factor, clay cementation is a secondary factor, and siliceous cementation has a minimal effect. The cementation in the delta front reservoirs is generally stronger than that in the turbidite reservoirs, resulting in a greater degree of heterogeneity in the pore structures of the delta front subfacies than in those of the turbidite facies.
(6)
Dissolution
In the study area’s tight sandstone reservoirs, dissolution constitutes the principal mechanism for generating secondary pores. Compared to a primary pore space, these dissolution-induced pores exhibit larger dimensions and greater abundance, which lead to increased pore–throat radii and enhanced connectivity within the pore network. Consequently, the overall pore network becomes more continuous, thereby facilitating fluid flow, and the spatial heterogeneity of pore structures decreases relative to the pre-dissolution condition.
There are three main types of dissolution in Es33. The direct dissolution of rock fragment particles such as feldspar, debris, and quartz to varying extents results in the formation of intergranular and intragranular pores. The dissolution of carbonate cements results in the formation of intergranular solution pores. The initial replacement of clastic particles by carbonate minerals is followed by the dissolution of the replacement minerals, which causes the indirect dissolution of clastic particles, leading to expanded secondary intergranular pores and intragranular solution pores [32]. Additionally, a small amount of clay matrix dissolution occurs in rocks with relatively high matrix contents. However, owing to the complex nature of the matrix, which is primarily composed of clay minerals, while dissolution can occur under certain temperature, pressure, and physicochemical conditions, the nature of the matrix means that dissolution has a minimal impact on porosity and permeability and does not significantly improve the pore structure.
Feldspar dissolution is most common throughout the study area and can occur throughout the burial process, although to varying degrees. Rock fragment particles are affected primarily by the dissolution of plagioclase feldspar. In shallow reservoirs, the intensity is low, whereas in middle-to-deep reservoirs, it is high. Dissolved plagioclase feldspar often has bay-like edges, with some dissolving along cleavage planes to form honeycomb or lattice structures. Strongly dissolved plagioclase feldspars appear as debris or even casts (Figure 5b,f,i,l). Additionally, SEM reveals honeycomb structures formed by feldspar dissolution (Figure 5t). Rock debris dissolution mainly creates intragranular pores (Figure 5a,c,k), whereas quartz particles easily dissolve into bay-like structures, forming secondary intergranular solution pores (Figure 5a,e). Feldspar dissolution is more intense than that of rock debris and quartz particles. The secondary dissolution of intergranular pores is due mainly to the dissolution of carbonate cements in addition to clastic particle dissolution (Figure 5b,d,l,o).
A comparison of numerous thin sections and SEM images reveals that the dissolution of rock debris and secondary dissolution of carbonate cements in turbidite reservoirs are significantly greater than those in delta front reservoirs. However, feldspar dissolution is slightly weaker in turbidite reservoirs than in delta front reservoirs. The dissolution of the quartz particles shows little difference (Figure 12). Overall, the intensity of dissolution in turbidite reservoirs is greater than that in the delta front, leading to a greater improvement in the pore structure and the better homogeneity and connectivity of the pores.
The occurrence of reservoir dissolution is closely related to the activity of formation fluids. Under the microscope, the delta front reservoirs show only a minimal development of quartz intragranular dissolution pores (Figure 5q). In Es33 in the Linnan Subsag, the burial depth is significant and the palaeotemperature is high, causing the organic matter to have entered a high-maturity stage, with a gradual decrease in organic acids in the tight sandstone reservoirs [73]. During the period of 28–38 Ma, the formation temperature reached 80–120 °C. The organic matter in the source rocks produced large amounts of organic acids and CO2 during thermal maturation, making the formation water acidic [34,74]. Since both the sand groups above and below the turbidite reservoirs are source rocks, the turbidite sandstone reservoirs are “source rock interbedded reservoirs”. The formation water within turbidite reservoirs exhibits higher acidity than those in delta front sandstones adjacent to a single source rock [75,76,77]. Consequently, dissolution in turbidite reservoirs is correspondingly more intense. During this period, both sets of tight reservoirs experienced severe feldspar dissolution, resulting in the precipitation of large amounts of SiO2 and kaolinite. SiO2 also provided materials for the secondary enlargement of quartz. Between 19 and 28 Ma, organic acids in Es33 began to undergo thermal decarboxylation, whereas earlier diagenetic dissolution consumed some of the initial organic acids, resulting in a decreased concentration of organic acids and a shift in formation water toward alkalinity. Thus, the delta front reservoirs became more alkaline than the turbidite reservoirs. In an alkaline environment, clay minerals undergo a mutual transformation, accompanied by the formation of late-stage carbonate cements and the dissolution of quartz and secondary enlargement. Eventually, quartz grain dissolution is observed in the delta front reservoirs under the microscope. From 3–19 Ma, a large amount of organic acids were generated due to the evolution of organic matter and the formation water remained acidic. There was a slight dissolution of carbonate cements and late-stage quartz enlargement. Since 3 Ma, Es33 had reached peak hydrocarbon generation, with organic acids undergoing thermal decarboxylation and substantial decomposition, leading to a reduction in the acidity of the formation water. In summary, during the sedimentary period, Es33 experienced the alternating acidity and alkalinity of formation fluids, resulting in alkaline dissolution in the delta front sandstone reservoirs, where both feldspar and quartz grain intragranular dissolution phenomena are visible (Figure 12).
In the context of enhanced oil recovery, mineral dissolution increases the reservoir porosity and enlarges pore–throat diameters, thereby strengthening the pore connectivity and, consequently, reducing the spatial heterogeneity of the pore network. Studies have shown that the dissolution effect in turbidite reservoirs in the study area is stronger than that in delta front sandstone reservoirs. The dissolution effect significantly improved turbidite reservoirs, contributing to increased reservoir homogeneity.
Under the combined influence of compaction and cementation, the primary residual intergranular pores are often triangular, quadrilateral, or irregular polygons, with uneven distributions and poor connectivity. However, dissolution significantly enhances the pore structure and connectivity of tight reservoirs. Based on the above analysis, turbidite sandstone reservoirs, compared with delta front sandstone reservoirs, experience relatively weaker compaction and cementation but stronger dissolution, ultimately resulting in the lower complexity of the pore structure, better connectivity, and greater homogeneity in turbidite reservoirs (Figure 12).

5.2.2. The Impact of Diagenetic Facies on Pore Structure

The diagenesis of the six types of pore structures is summarized via a diagenetic facies classification method, reflecting the impact of multiple factors on pore changes under the control of different sedimentary systems during the processes of sandstone reservoir compaction and porosity enhancement. Additionally, by integrating studies on formation water properties, diagenetic characteristics, and diagenetic evolution sequences and considering the compaction strength characteristics observed between clastic particles, the tight sandstone reservoirs in the study area can ultimately be classified into six diagenetic facies corresponding to lithofacies and pore structure types (Figure 13).
(1)
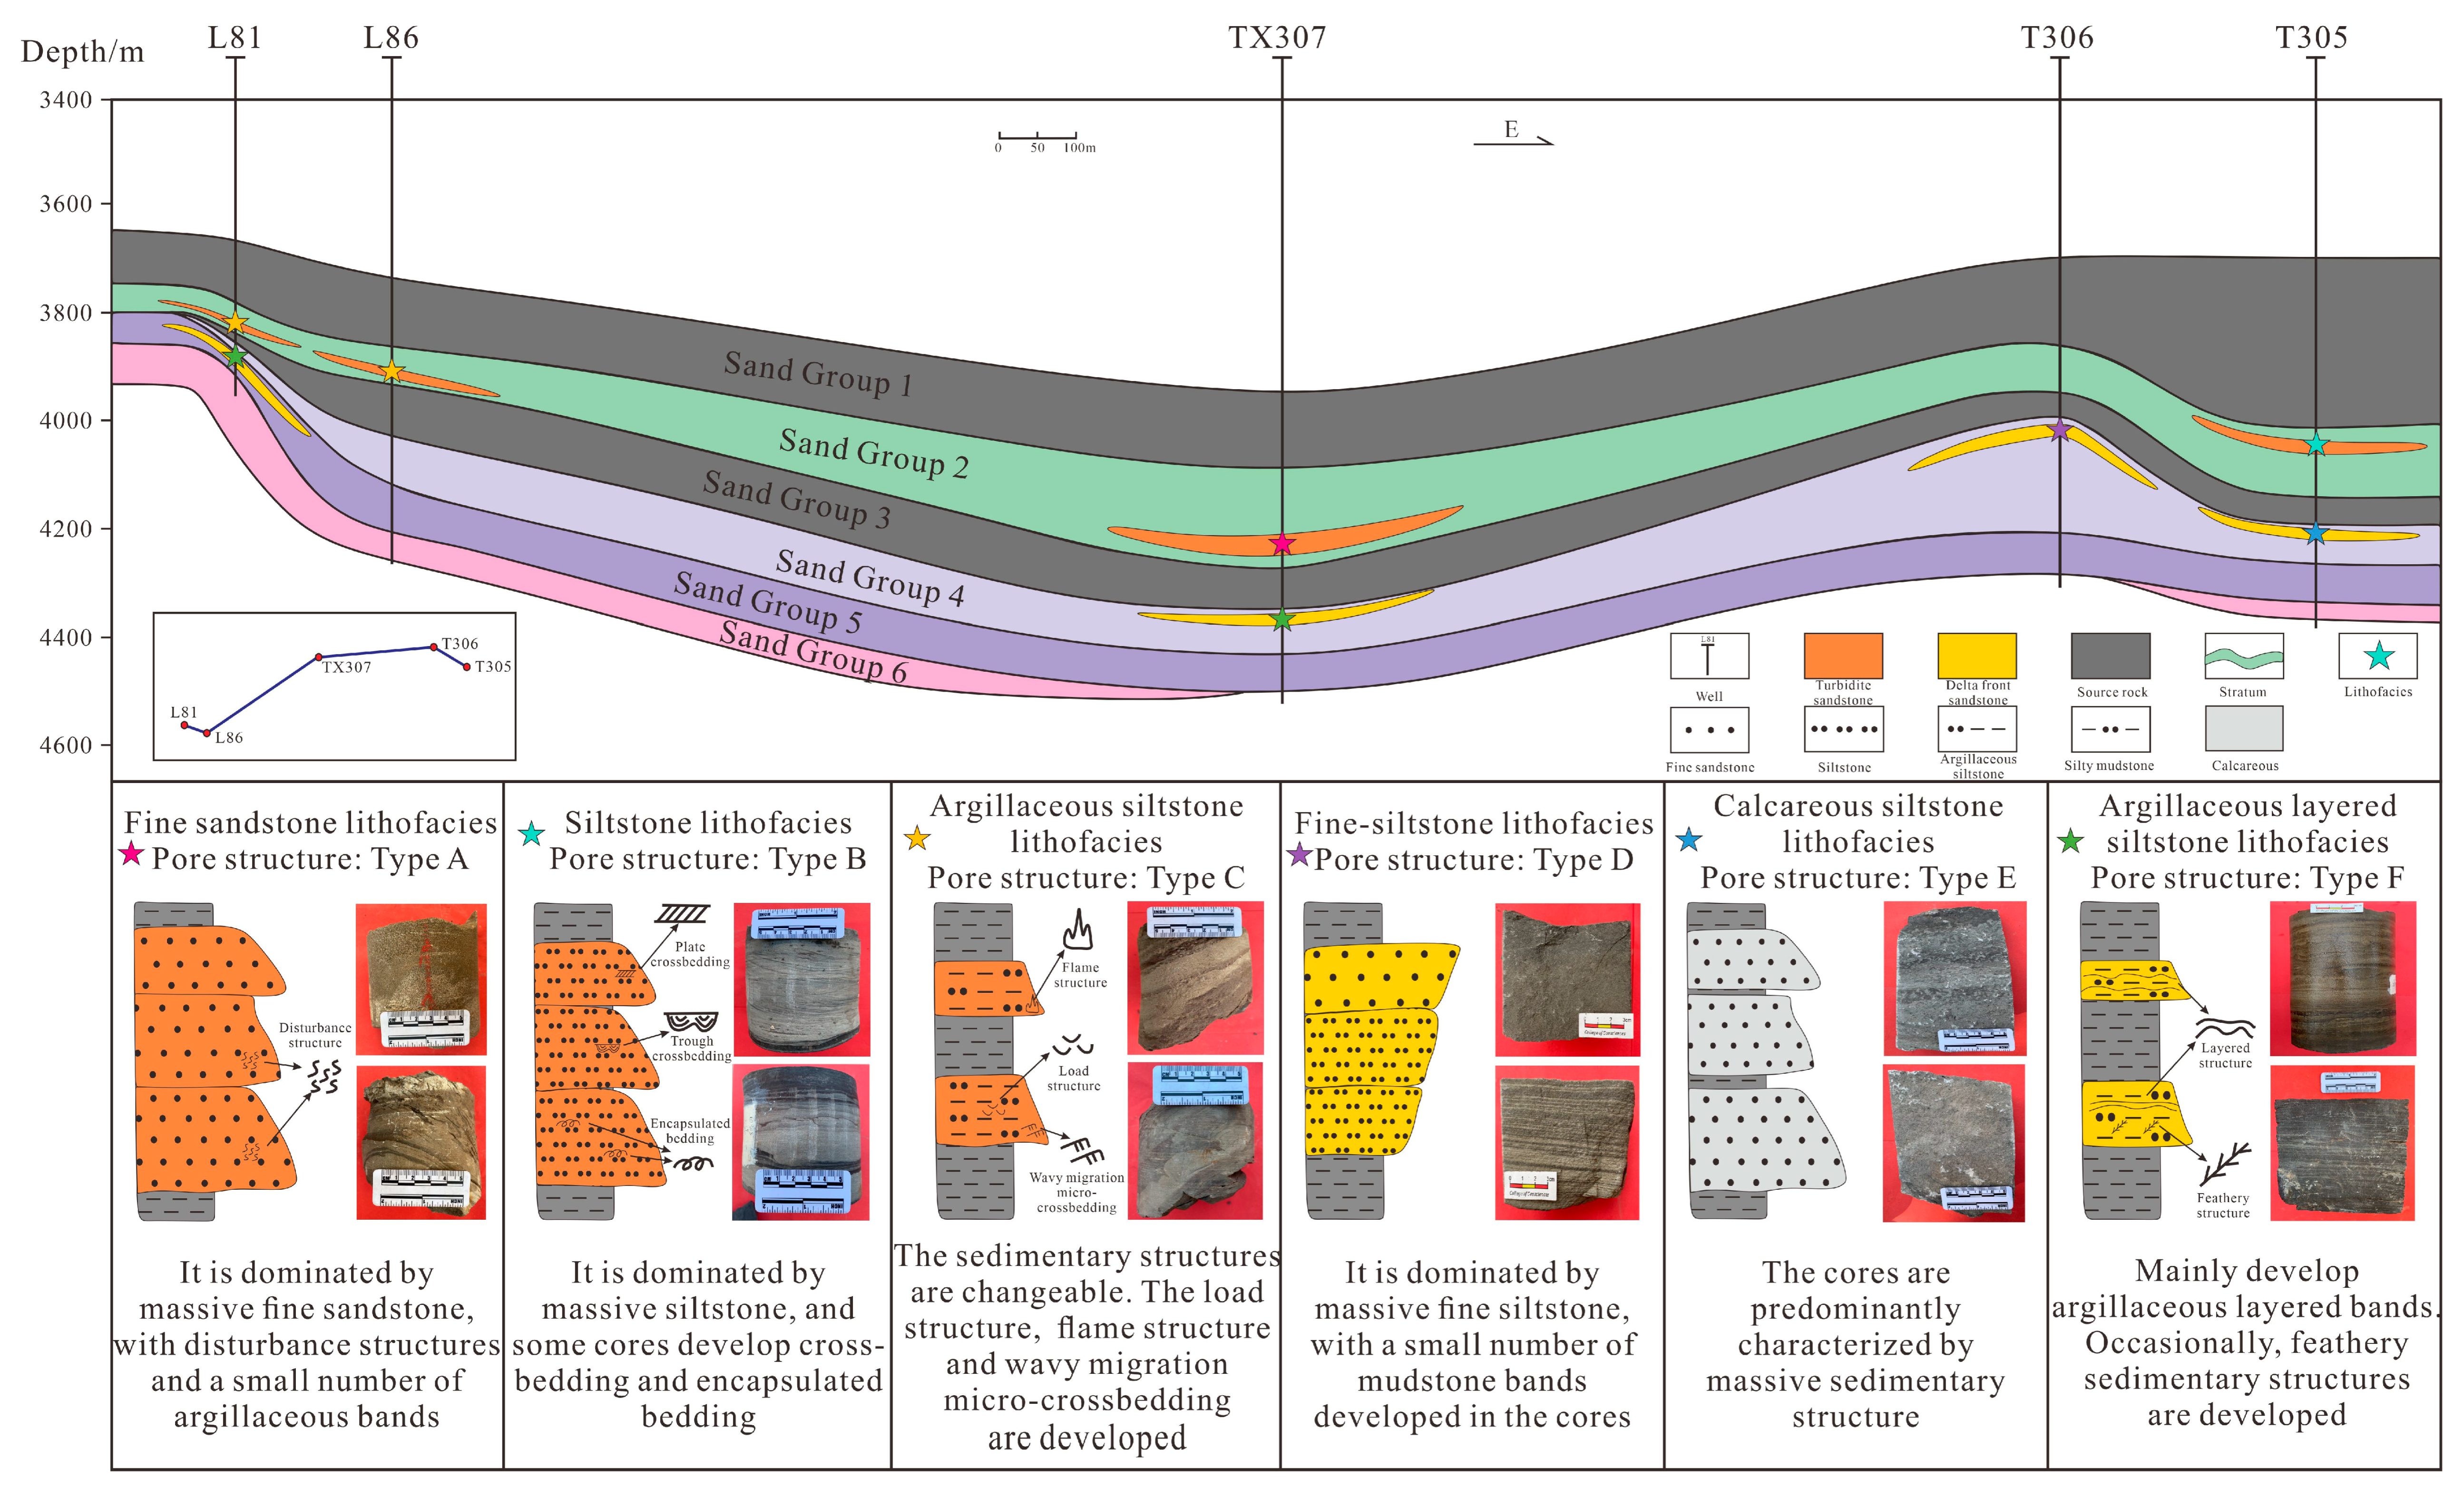
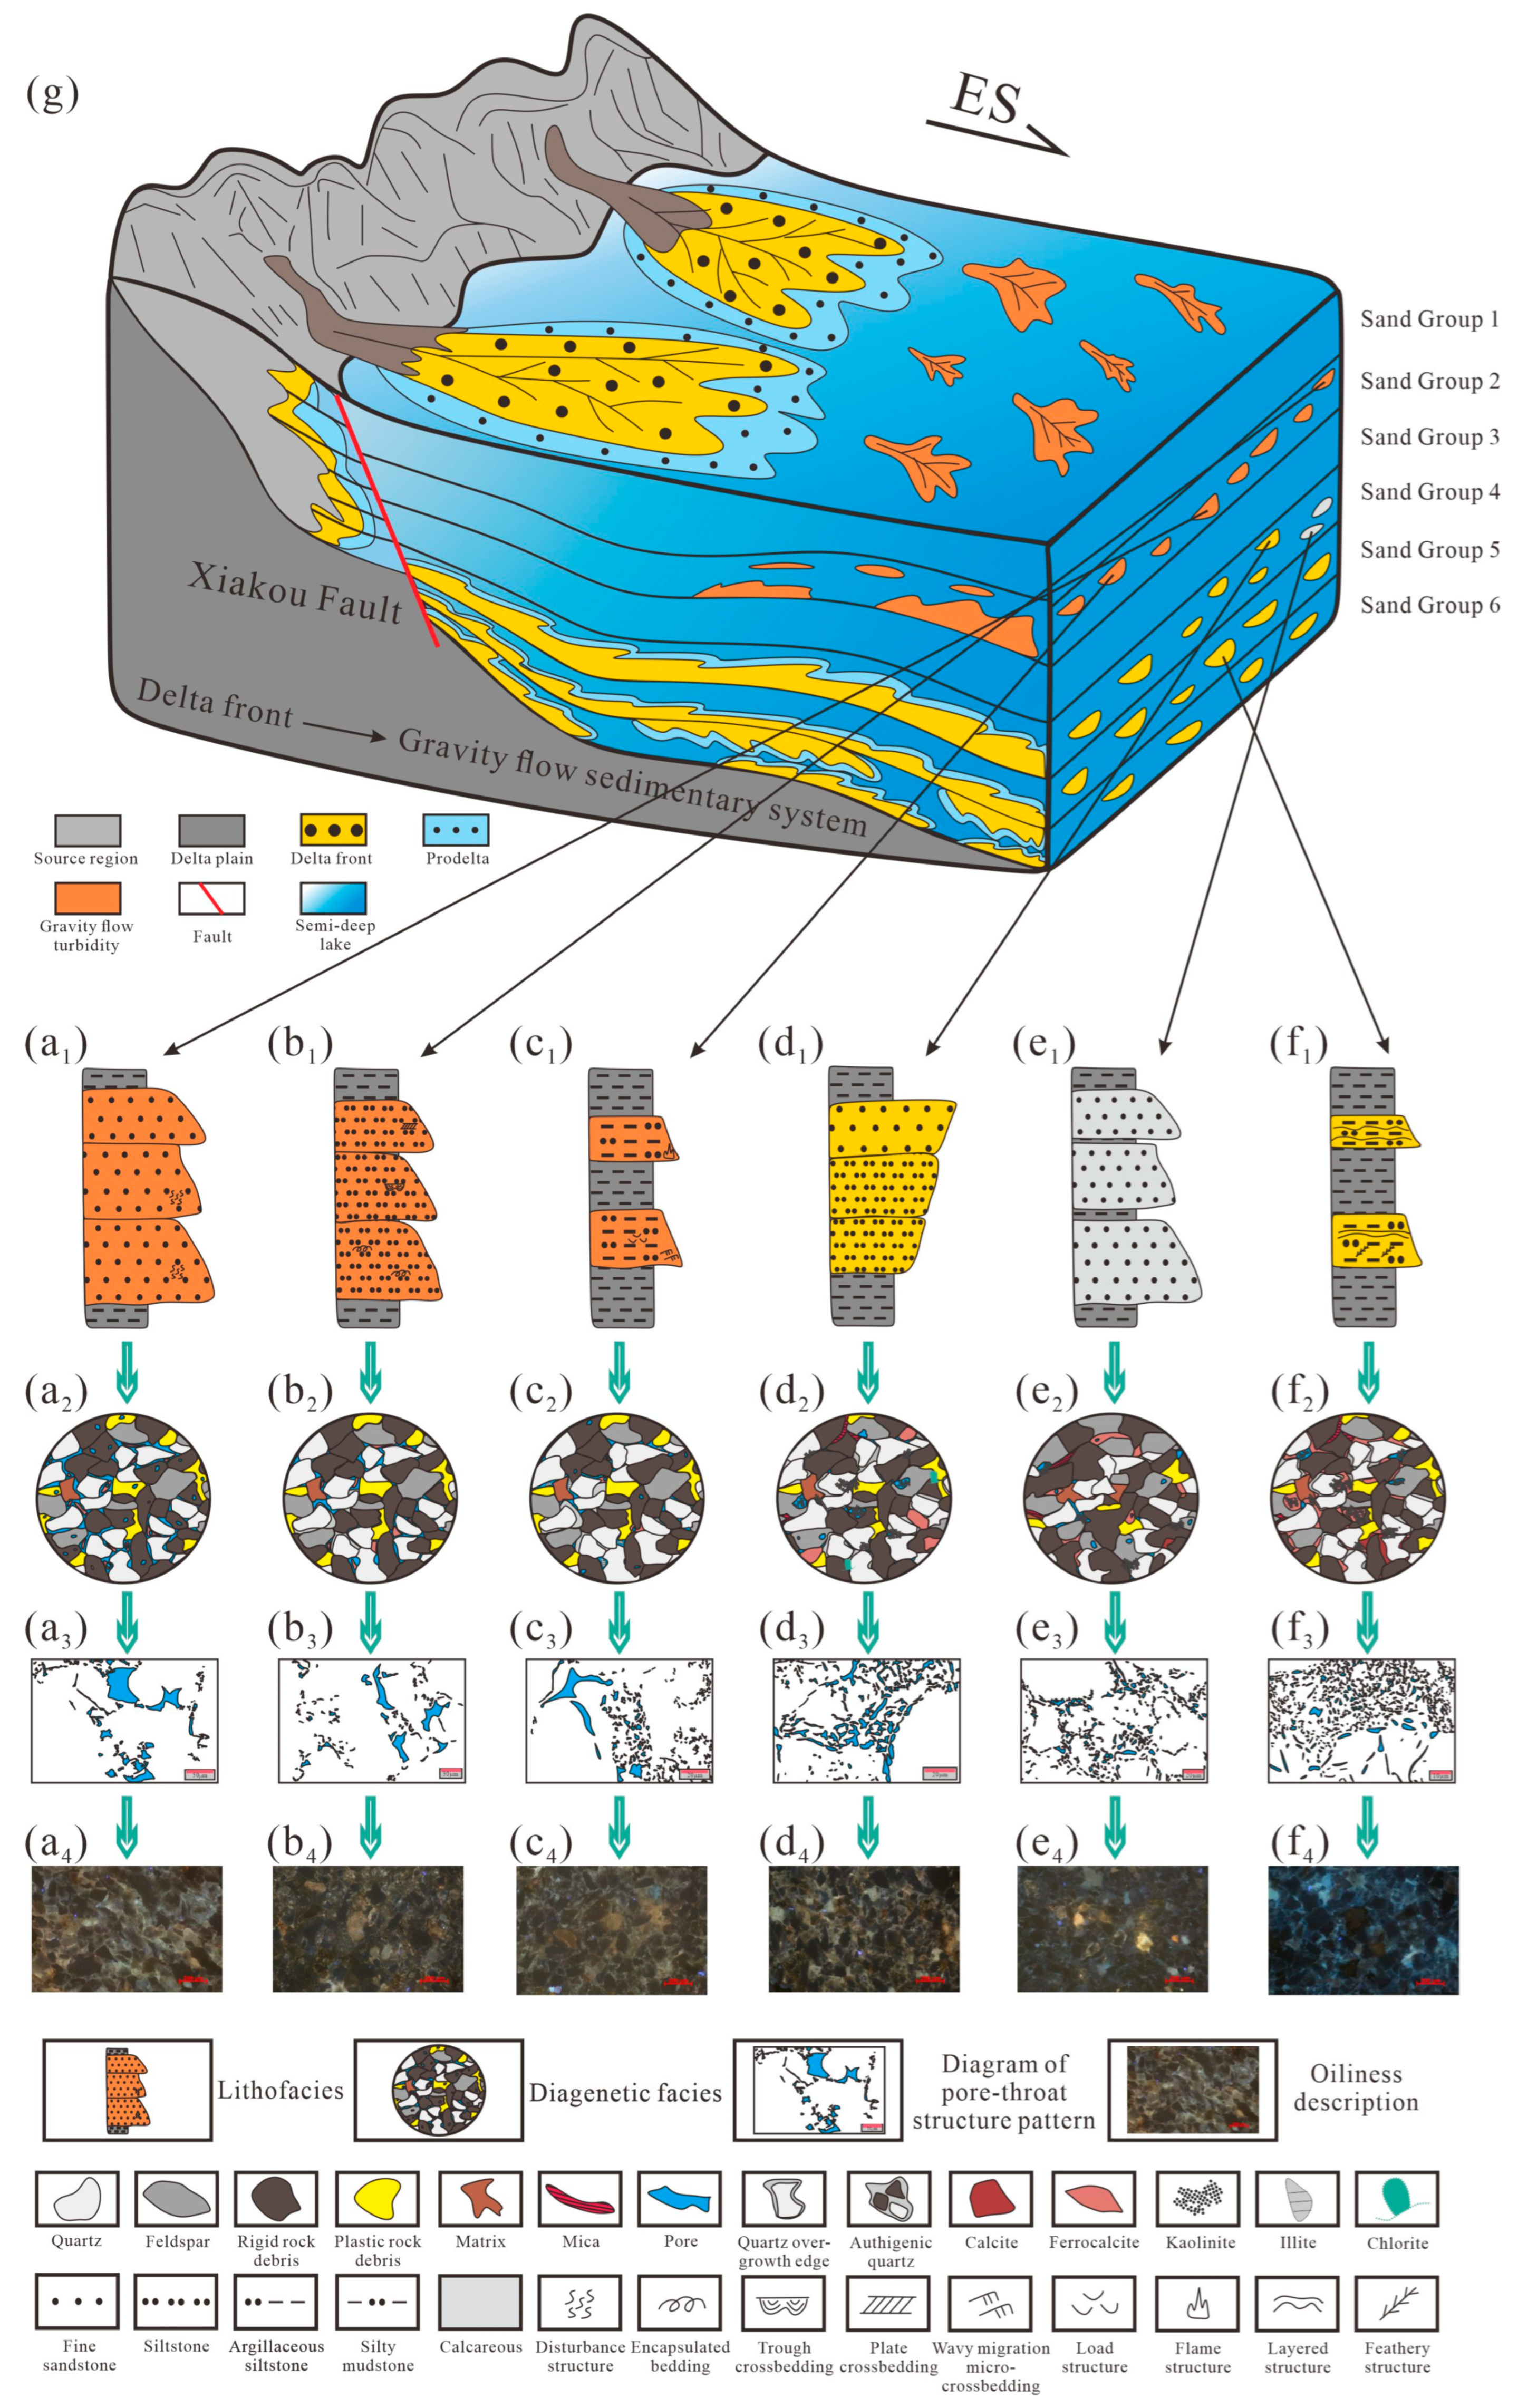
Medium compaction–medium cementation–strong dissolution diagenetic facies (according to the Type A pore structure): The diagenetic facies developed in the fine sandstone lithofacies, with moderate grain compaction primarily characterized by point contacts and residual primary pores were relatively well preserved. In addition, both carbonate and clay cementation are moderate. Influenced by the proximity to source rocks rich in organic acids, the dissolution process is pronounced, resulting in noticeable intergranular carbonate cement dissolution pores and intragranular debris dissolution pores, ultimately forming a coarse pore–coarse throat pore structure with an average surface pore rate of 6.68% (Figure 13a1,a2).
(2)
Medium compaction–medium cementation–weak dissolution diagenetic facies (according to the Type B pore structure): The diagenetic facies as a whole exhibit moderate compaction, predominantly characterized by point and point-line contacts. While some primary pores are well preserved, the cementation is moderate, with a degree of cementation like that of the previous diagenetic facies. These diagenetic facies have developed mainly in the siltstone lithofacies of turbidite reservoirs. Influenced by the mineral composition of the rocks, the debris content is relatively low and the dissolution process is weak, ultimately forming a medium-porosity pore structure with an average surface pore rate of 4.41% (Figure 13b1,b2).
(3)
Medium compaction–strong cementation–weak dissolution diagenetic facies (according to the Type C pore structure): This type of diagenetic facies developed in the reservoirs of argillaceous siltstone lithofacies and exhibited moderate compaction but strong cementation. Compared with that in delta front reservoirs, the overall cementation in turbidite sedimentary reservoirs is relatively weak. However, the high clay content in the argillaceous siltstone lithofacies led to strong clay cementation. Additionally, influenced by the lithofacies, the high clay content and low abundance of easily dissolvable minerals result in weak dissolution. Owing to the comprehensive effects of various diageneses, the reservoirs in these diagenetic facies feature partially filled intergranular carbonate cements and clay-filled materials, with clay minerals primarily consisting of illite and illite/smectite mixed layers. Therefore, the average surface pore rate is 2.12%, with a fine pore–medium throat pore structure (Figure 13c1,c2).
(4)
Medium compaction–strong cementation–strong dissolution diagenetic facies (according to the Type D pore structure): The diagenetic facies developed in the fine-siltstone lithofacies are located at the high structural position of the delta front facies. Although these diagenetic facies experience stronger compaction than the three types in turbidite reservoirs, they remain the least compacted within the delta front facies because of their relatively shallow burial depth, with an overall moderate degree of compaction. Delta front reservoirs generally exhibit high cementation contents and strong cementation characteristics, with fewer residual primary pores. Additionally, the intergranular filling consists of carbonate cements and clay infill. The high feldspar content in the fine-siltstone lithofacies is subject to the stronger dissolution of feldspar than that of debris and carbonate cements. In other words, strong dissolution leads to both well-developed intergranular and intragranular dissolution pores, ultimately resulting in a medium pore–coarse throat pore structure with an average surface pore rate of 1.99% (Figure 13d1,d2).
(5)
Strong compaction–strong cementation–medium dissolution diagenetic facies (according to the Type E pore structure): These facies develop in the calcareous siltstone lithofacies and are controlled by the delta sedimentary system in the study area, corresponding to a medium pore–fine throat pore structure with an average surface pore rate of 1.68%. This diagenetic facies exhibit significant compaction, with quartz grains showing pressure dissolution and sutured contacts. Moreover, the calcareous siltstone lithofacies show strong carbonate cementation. Under the combined effects of strong compaction and cementation, a small number of primary pores are preserved. The degree of dissolution is moderate, with the observable dissolution of feldspar and intergranular carbonate cements, resulting in complex and variable pore–throat types. Occasional occurrences of feldspar transforming into kaolinite are noted, and this kaolinitization process can also generate a small number of secondary pores (Figure 13e1,e2).
(6)
Strong compaction–strong cementation–weak dissolution diagenetic facies (according to the Type F pore structure): The diagenetic facies developed in the argillaceous layered siltstone lithofacies in the central and western parts of the study area are characterized by a relatively low quartz content and weak compaction resistance but a high degree of compaction. The high mud content is accompanied by significant cementation, which preserves only a small number of intergranular residual primary pores. In addition, the intergranular spaces are generally filled with carbonate cements. There are few easily dissolvable minerals, leading to weak dissolution effects. Therefore, fine pore diameters and strong heterogeneity can be found within reservoirs. These diagenetic facies correspond to a fine pore–fine throat pore structure with an average surface pore rate of only 0.86%. However, notably, intercrystalline micropores account for a large proportion of the total pore area, which consists of micropores within kaolinite minerals (Figure 13f1,f2).

5.3. Genetic Mechanisms of Reservoir Pore Structures in Different Sedimentary Systems

The pore structure characteristics of the tight sandstone reservoirs in Es33 in Linnan Subsag are controlled mainly by both sedimentation and diagenetic processes. Based on these findings, a genetic model of the pore structure under the control of lithofacies and diagenetic facies has been established (Figure 14), clarifying the mechanisms of heterogeneity in reservoir pore structures in different sedimentary systems.
Previous studies have demonstrated that marine tight sandstone reservoirs, such as the Norphlet Formation along the northern Gulf of Mexico, exhibit relatively homogeneous pore structures with minor vertical variation in the porosity and permeability. This phenomenon reflects both the development of a consistent grain framework under continuous, stable marine depositional conditions and the subsequent approximately synchronous diagenetic processes (the compaction–cementation–dissolution cycle) throughout the tight sandstones [78,79]. However, the study area of this paper is the lacustrine tight sandstone reservoirs, which are governed by both the gravity flow and delta sedimentary systems, resulting in pronounced heterogeneity. Sedimentation and diagenesis determine the pore evolution of tight reservoirs through dynamic coupling. Sedimentation controls the initial grain packing structure and pore distribution and limits the geometry of the primary pores. Diagenesis, under the conditions of a deepening burial, increasing temperature, and fluid chemical changes, progressively reduces primary pores and generates secondary pores through compaction, cementation, and dissolution, causing the primary pore structures and connectivity to undergo cycles of reduction and reconstruction. Ultimately, the interaction coupling of sedimentary and diagenetic processes governs the development of multi-scale and multi-type pore structures in tight sandstones, directly affecting the fluid flow capacity, reservoir quality, and petroleum occurrence characteristics.
During the shallow burial and weak diagenetic stage, the primary pores are relatively well-preserved compared to the deep layers, with slight clay cementation and initial compaction. Some soluble rock debris dissolves in weakly acidic formation water, generating a small number of secondary dissolution pores. During the stage of intermediate burial with strong compaction and cementation, compaction and carbonate cementation dominate, significantly reducing the primary pores and filling most of the pore spaces with cements, resulting in a decline in pore connectivity. Under the spatiotemporal coupling effect of sedimentary and diagenetic facies, the compaction intensities, cementation type, and degrees in sandstones of different lithologies controlled and developed by the two sets of sedimentary systems exhibit differences. Consequently, multiple pore–throat combinations develop within these sandstones. During the deep-burial, pore-remodeling stage, secondary dissolution predominates: in turbidite sandstones adjacent to two sets of source rock layers, the hydrocarbon-generating organic acids promote the dissolution intensity to be higher than that of the delta fronts. Therefore, turbidite sandstones develop more secondary pores, increasing both the porosity and permeability. Meanwhile, secondary dissolution products can provide the material basis for the subsequent cementation, leading to a new round of the cementation–dissolution cycle and further complicating the pore–throat structures.
For turbidite reservoirs, the highest-quality pore structure type in the study area is the coarse pore-coarse throat (Type A), which results from the combined effects of fine sandstone lithofacies and medium compaction-medium cementation-strong dissolution diagenetic facies. It has developed mainly at the bottom of sand Group 2 in the low-lying areas of the central part of the study area. The pore structure exhibits favorable petrophysical properties, with porosities of up to 12.565% and permeabilities approaching 10 mD. It has the least complex pore structure and minimal heterogeneity, with the predominant pore type being residual intergranular pores (84.65%) and intergranular and intragranular dissolution pores accounting for approximately 11% of the total pores. The pore diameter ranges widely from 1.92 to 25.37 μm, with an average of 10.84 μm. In contrast, based on siltstone lithofacies and influenced by medium compaction–medium cementation–weak dissolution diagenetic facies, the reservoirs developed a medium pore–medium throat pore structure type (Type B), with pore diameters significantly smaller than those of Type A. This type developed at the top of sand Group 2 in the eastern part of the study area. The porosity is mainly between 8% and 11%, whereas the permeability is generally less than 1 mD. The pores are predominantly residual intergranular pores (93.59%), with overall pore diameters ranging from 0.46 to 14.14 μm, with an average of 3.26 μm. In addition to the fine sandstone and siltstone facies, significant amounts of argillaceous siltstone lithofacies are present in the turbidite reservoirs. These lithofacies are characterized by variable sedimentary structures and beddings, including load structures, flame structures, and wavy migration microcrossbedding layers. In these lithofacies, diagenesis primarily involves medium compaction, strong cementation, and weak dissolution, resulting in a fine pore–medium throat pore structure type (Type C) with the smallest average pore diameter in the turbidite sedimentary system. The porosity ranges from 4–8%, and the permeability is between 0.3 and 1 mD. Although the pores are primarily composed of residual intergranular pores (81.91%), the increased clay mineral content has led to a significant increase in the proportion of intercrystalline micropores and microfractures, totaling approximately 11%. The pore diameter distribution ranges from 0.35 to 9.52 μm, with an average of 1.93 μm. Type C pore structures are distributed in the western part of the Linnan Subsag and are located mainly at the bottom of turbidite sedimentary reservoirs.
The formation of the pore structure in delta front sedimentary systems is also controlled by lithofacies and diagenetic facies. Within this sedimentary system, the optimal pore structure is characterized by a medium pore–coarse throat (Type D) developed in the fine-siltstone lithofacies, with a few mudstone bands. This type of reservoir is generally located at the top of delta front sedimentary reservoirs in the structurally high area of the eastern part of the study area. During diagenesis, cementation and dissolution are relatively strong, whereas compaction is of a medium intensity. The type D pore structure is optimal for the delta front facies, with porosities ranging from 8–12% and permeabilities ranging from 0.08 to 3 mD. The pore types are diverse, with dissolution pores being the most prevalent (approximately 44%), followed by residual intergranular pores (39.20%), and intercrystalline micropores being the least common. The range of pore diameters is small, from 0.54 to 4.43 μm, with an average pore diameter of 2.12 μm, which is the largest among the delta front facies. Medium pore–fine throat pore structures (Type E) can occur in calcareous siltstone lithofacies, eventually developing under the combined effects of strong compaction, strong cementation, and medium dissolution. Type E pore structures also develop at the top of delta sedimentary reservoirs in the eastern part, but the structural position is lower than that of Type D pore structures. In terms of physical properties, the porosity distribution ranges from 4–8%, and the permeability ranges from 0.02–1 mD (mainly less than 0.3 mD). The pores are mainly residual intergranular pores (70.60%), followed by dissolution pores (approximately 21%). The pore diameter range is the largest among the delta front reservoirs, from 0.45 to 6.52 μm, with an average pore diameter of 1.89 μm. However, within the relatively impoverished argillaceous layered siltstone lithofacies of the central and western Linnan Subsag, reservoir porosity reduction is most pronounced. Compaction and cementation are intense, whereas dissolution is weak. As a result, the worst pore structure type, fine pore–fine throat (Type F), has developed. This material has the poorest physical properties among all pore structure types, with the greatest complexity and heterogeneity. The porosity varies widely from 0–6%, with a concentration in the range of 0–4%. The permeability is mainly 0.1–0.2 mD. Although Type F pores are still predominantly residual intergranular pores (64.88%), they are characterized by a significant proportion of intercrystalline micropores (22.18%), which mainly consist of kaolinite intercrystalline micropores. The pore diameter distribution ranges from 0.12 to 3.57 μm, with an average of only 0.88 μm, which is the smallest among all pore structure types.
The pore structure of tight sandstone reservoirs significantly affects the oil content. Overall, turbidite reservoirs have notably higher oil contents than delta front reservoirs and the oil content decreases sequentially as the pore structure deteriorates. The fluorescence images reveal that some rock fragments are impregnated with oily bitumen and asphaltene bitumen, resulting in fluorescence (Figure 14a4–f4).
The two sedimentary systems exhibit different oil-bearing characteristics, and the quality of the pore structure has an important effect on the oil content. High-quality reservoir pore structures demonstrate good oil-bearing properties, whereas those with relatively poor pore structures present less noticeable oil-bearing characteristics. Coarse pore-coarse throat pore structures show spotted, patchy pale yellow, and brownish-yellow fluorescence, indicating a high bitumen content. The medium-to-coarse-throat sandstones exhibit diffused or localized patchy bright yellow, yellow, off-white yellow, and slightly brownish-yellow fluorescence, with bitumen contents slightly lower than those of Type A pore structures. The medium-pore–medium-throat sandstones mainly display patchy medium-dark, medium-bright yellow, yellow, and brownish-yellow fluorescence, with bitumen contents ranging from medium to high. In the medium-pore to fine-sized-pore–throat and fine-pore to medium-sized-throat types with a moderate-pore structure quality, patchy dull yellow–white and blue–white fluorescence are present in the intergranular spaces, with the bitumen content ranging from medium to low. In contrast, the poorest-quality fine-pore–fine-throat sandstones have only a small amount of bitumen-impregnated fragments, with the intergranular fluorescence being mostly patchy and spotted medium-dark blue-white and blue-white with a low bitumen content.
Based on this analysis, a summary of the tight sandstone reservoirs controlled by different sedimentary systems in the study area is provided, clarifying the genetic mechanisms behind the differences in the reservoir heterogeneity. The pore structures are classified into six types, which are formed under the combined control of sedimentary lithofacies and diagenetic facies. In gravity flow sedimentary reservoirs, the fine sandstone lithofacies—medium compaction, medium cementation, and strong dissolution diagenetic facies—control the development of coarse pore–coarse throat pore structures. The siltstone lithofacies—medium compaction, medium cementation, and weak dissolution diagenetic facies—form medium-pore–medium-throat structures. The argillaceous siltstone lithofacies—medium compaction, strong cementation, and weak dissolution diagenetic facies—correspond to the development of fine-to-medium-porosity pore types. In the delta sedimentary system, genetic combination patterns have developed with the fine siltstone lithofacies—medium compaction–strong cementation–strong dissolution diagenetic facies—the calcareous siltstone lithofacies—strong compaction–strong cementation–medium dissolution diagenetic facies—and the argillaceous layered siltstone lithofacies—strong compaction–strong cementation–weak dissolution diagenetic facies. These three combinations control the development of three types of pore structures: medium pore–coarse throat, medium pore–fine throat, and fine pore–fine throat. Furthermore, the reservoir oil-bearing capacity is substantially controlled by the pore structure type and diminishes as the pore structure quality declines. Therefore, the coarse pore–coarse throat pore structure has the best oil-bearing capacity, whereas the fine pore–fine throat structure has the worst capacity.

5.4. Implication for Tight Oil Recovery

The pore structures have a crucial influence on the fluid-dynamic behavior of tight sandstone reservoirs by governing their storage space and flow capacity, thereby impacting the reservoir quality (e.g., porosity and permeability) and oil recovery [23]. The flow capacity is enhanced as the pore–throat size increases and pore-size distribution improves. Conversely, the complex micropore–microthroat networks and heterogeneity in tight oil reservoirs severely limit the fluid mobility, hydrocarbon accumulation, and enhancement of oil recovery [80]. In heterogeneous tight sandstones, identifying key fluid flow units through multi-scale and quantitative pore structure parameters can provide a scientific basis for methods such as precision hydraulic fracturing, chemical flooding, and nano-assisted flooding, thereby markedly improving oil recovery.
The Type A pore structure provides low-resistance channels for fluids, significantly enhancing the permeability and oil productivity of the reservoirs. The coarse pores and wide throats create low capillary entry pressures and high absolute permeability, enabling an efficient hydrocarbon flow and typically higher initial production rates. The fluid mobility and oil recovery of the Type B pore structure show a moderate level. A balanced pore–throat geometry delivers moderate capillary pressures alongside reasonable connectivity, supporting both storage and flow properties that favor sustained oil recovery under conventional water flooding or a gas injection. In the Type C pore structure, although medium-sized throats can form flow channels, the reduced pore volumes limit the total storage and raise the heterogeneity, leading to increased residual oil saturation and requiring targeted displacement strategies to improve the tight oil recovery. The fluid-filling capacity is governed by capillary entry pressure: the lower the capillary pressure, the easier for fluid to fill. The coarse throats in the Type D pore structure markedly reduce the entry pressure. Therefore, despite exhibiting only medium pore sizes, the reservoirs display an excellent flow capacity and correspondingly enhanced tight oil production rates. The narrow throats in the Type E pore structure increase the capillary pressures, generating strong Jamin effects, which impedes the spontaneous imbibition [81]. Consequently, both water and oil flooding efficiencies are markedly reduced and oil recovery is correspondingly limited. The Type F pore structures are mainly composed of micro-nano pores, with narrow and dispersed throats, which are unfavorable for the migration and accumulation of oil and gas [82]. The combined fine-pore and fine-throat network almost blocks the conventional displacement flow. It is necessary to rely on high-pressure hydraulic fracturing or nano-modified displacement agents to improve connectivity and enhance oil recovery.

6. Conclusions

(1)
Quantitative pore structure analysis identifies six types: In turbidite sandstones, pores and throats range from coarse-coarse (Type A) through medium-medium (Type B) to fine-medium (Type C). In delta front sandstones, they progress from medium-coarse (Type D) via medium-fine (Type E) to fine-fine (Type F). The integration of HPMI, NMR, and SEM data reveals that turbidite reservoirs exhibit comparatively enhanced pore structure characteristics relative to those of delta front tight sandstones.
(2)
Sedimentation furnishes the material basis for reservoir space development. Two depositional settings are classified into six reservoir lithofacies—three turbidite (Type A: fine sandstone; Type B: siltstone; Type C: argillaceous siltstone) and three delta front (Type D: fine-siltstone; Type E: calcareous siltstone; Type F: argillaceous layered siltstone)—each directly linked to a specific pore structure type. This lithofacies–pore correlation clarifies how contrasting sedimentary processes govern the structure and connectivity of reservoir pore systems.
(3)
Diagenesis governs reservoir pore structures: compaction and cementation diminish the porosity, whereas dissolution augments it. Accordingly, six diagenetic facies—medium compaction–medium cementation–strong dissolution; medium compaction–medium cementation–weak dissolution; medium compaction–strong cementation–weak dissolution; medium compaction–strong cementation–strong dissolution; strong compaction–strong cementation–medium dissolution; and strong compaction–strong cementation–weak dissolution—are defined, each mapping to pore structure Types A–F, respectively.
(4)
The reservoir pore structures in the study area result from the interplay of sedimentary and diagenetic controls, with six combined lithofacies and diagenetic facies defining distinct pore structure types. An optimal coarse pore–coarse throat pore structure (Type A) develops in turbidite fine sandstone lithofacies under medium compaction–medium cementation–strong dissolution diagenetic facies. Conversely, the poorest fine-pore–fine-throat pore structure (Type F) occurs in delta front argillaceous layered siltstone lithofacies subjected to strong compaction, strong cementation, and weak dissolution. Furthermore, turbidite reservoirs generally exhibit higher oil contents than delta front counterparts, and the oil content systematically declines as the pore structures transition from Type A to Type F.

Author Contributions

Conceptualization, L.R. and D.C.; Methodology, L.R.; Software, F.W.; Formal analysis, J.C. and F.W.; Investigation, L.R., Y.W., W.L. and M.J.; Data curation, L.R.; Writing—original draft, L.R. and Y.W.; Writing—review & editing, D.C. and Q.W.; Visualization, L.R. and J.C.; Supervision, D.C. All authors have read and agreed to the published version of the manuscript.

Funding

This research was funded by the National Major Science and Technology Projects of China grant number 2024ZD14001-001. And the APC was funded by 2024 AAPG Foundation Grants-in-Aid Program grant number Fred A. & Jean Dix Named Grant.

Institutional Review Board Statement

Not applicable.

Informed Consent Statement

Not applicable.

Data Availability Statement

The raw data supporting the conclusions of this article will be made available by the authors on request.

Acknowledgments

We appreciate the support from the Sinopec Shengli Oilfield Branch of the China Petroleum and Chemical Corporation for providing the data and tight sandstone samples used in this study and the permission to publish the results.

Conflicts of Interest

The authors declare no conflict of interest.

References

  1. Wang, X.G.; Huan, J.L.; Peng, X.J.; Zhang, C.; Yuan, W. Flow mechanism and pore structures of tight sandstone based on digital core analysis. Pet. Geol. Recovery Effic. 2022, 29, 22–30. [Google Scholar] [CrossRef]
  2. Cheng, J.; Ge, H.; Yang, W.; Zuo, B.; Li, Q.; Liang, X. Development and testing of surfactants for high-temperature and high-salt reservoirs. Unconv. Oil Gas 2023, 10, 57–62. [Google Scholar] [CrossRef]
  3. Zhu, H.J.; Ju, Y.W.; Huang, C. Microcosmic gas adsorption mechanism on clay-organic nanocomposites in a marine shale. Energy 2020, 197, 117256. [Google Scholar] [CrossRef]
  4. Huang, F.F.; Pu, C.S.; Gu, X.Y. Study of a low-damage efficient-imbibition fracturing fluid without flowback used for low-pressure tight reservoirs. Energy 2021, 222, 119941. [Google Scholar] [CrossRef]
  5. Liu, H.M.; Gao, Y.; Qin, F.; Yang, H.Y. New fields, new types and resource potentials of hydrocarbon exploration in Jiyang depression, Bohai Bay Basin. Acta Pet. Sin. 2023, 44, 2141–2159. [Google Scholar] [CrossRef]
  6. Wu, P.; Hu, S.; Shen, Z.; Fu, B.; Liang, X.; Zhang, Y. Study on fine characterization and application of composite sand body in meander zone of Z Oilfield. Unconv. Oil Gas 2023, 10, 18–25. [Google Scholar] [CrossRef]
  7. Zhang, J.Y.; Tao, S.Z.; Wu, S.T.; Liu, G.D.; Zhao, W.Z.; Li, G.H. Controlling effect of pore-throat structures on tight oil accumulation effectiveness in the upper Cretaceous Qingshankou formation, Songliao Basin. Geoenergy Sci. Eng. 2023, 225, 211689. [Google Scholar] [CrossRef]
  8. Wang, Y.S.; Chen, T.; Zhang, P.F.; Zhai, Z. Exploration potential and direction of Palaeogene light crude oil reservoirs in Jiyang depression. Acta Pet. Sin. 2021, 42, 1605–1614. [Google Scholar] [CrossRef]
  9. Liu, B.; Mohammadi, M.; Ma, Z.; Bai, L.; Wang, L.; Xu, Y.; Ostadhassan, M.; Hemmati-Sarapardeh, A. Evolution of porosity in kerogen type I during hydrous and anhydrous pyrolysis: Experimental study, mechanistic understanding, and model development. Fuel 2023, 338, 127–149. [Google Scholar] [CrossRef]
  10. Clarkson, C.R.; Wood, J.M.; Burgis, S.E.; Aquino, S.D.; Freeman, M. Nanopore-structure Analysis and Permeability Predictions for a Tight Gas Siltstone Reservoir by Use of Low-Pressure Adsorption and Mercury-Intrusion Techniques. SPE Res. Eval. Eng. 2012, 15, 648–661. [Google Scholar] [CrossRef]
  11. Zou, C.N.; Yang, Z.; Tao, S.; Yuan, X.J.; Zhu, R.K.; Hou, L.H.; Wu, S.T.; Sun, L.; Zhang, G.S.; Bai, B.; et al. Continuous hydrocarbon accumulation over a large area as a distinguishing characteristic of unconventional petroleum: The Ordos Basin, North-Central China. Earth Sci. Rev. 2013, 126, 358–369. [Google Scholar] [CrossRef]
  12. Loucks, R.G.; Ruppel, S.C.; Wang, X.; Ko, L.; Peng, S.; Zhang, T.; Rowe, H.D.; Smith, P. Pore types, pore-network analysis, and pore quantification of the lacustrine shale-hydrocarbon system in the Late Triassic Yanchang Formation in the southeastern Ordos Basin, China. Interpretation 2017, 5, SF63–SF79. [Google Scholar] [CrossRef]
  13. Soeder, D.J. Reservoir properties and pore structure of tight gas sands. AAPG Bull. 1984, 68, 530–531. [Google Scholar] [CrossRef]
  14. Zeng, J.H.; Yang, Z.F.; Feng, X.; Qiao, J.C.; Zhang, Z.Y. Study status and key scientific issue of tight reservoir oil and gas accumulation mechanism. Adv. Earth Sci. 2014, 29, 651–661. [Google Scholar] [CrossRef]
  15. Lai, J.; Wang, G.W. Fractal analysis of tight gas sandstones using high-pressure mercury intrusion techniques. J. Nat. Gas Sci. Eng. 2015, 24, 185–196. [Google Scholar] [CrossRef]
  16. Schmitt, M.; Fernandes, C.P.; Wolf, F.G.; da Cunha Neto, J.A.B.; Rahner, C.P.; dos Santos, V.S.S. Characterization of Brazilian tight gas sandstones relating permeability and angstrom-to micron-scale pore structures. J. Nat. Gas Sci. Eng. 2015, 27, 785–807. [Google Scholar] [CrossRef]
  17. Clarkson, C.R.; Freeman, M.; He, L.; Agamalian, M.; Melnichenko, Y.B.; Mastalerz, M.; Bustin, R.M.; Radliński, A.P.; Blach, T.P. Characterization of tight gas reservoir pore structure using USANS/SANS and gas adsorption analysis. Fuel 2012, 95, 371–385. [Google Scholar] [CrossRef]
  18. Clarkson, C.R.; Solano, N.; Bustin, R.M.; Bustin, A.M.M.; Chalmers, G.R.L.; He, L.; Melnichenko, Y.B.; Radliński, A.P.; Blach, T.P. Pore structure characterization of North American shale gas reservoirs using USANS/SANS, gas adsorption, and mercury intrusion. Fuel 2013, 103, 606–616. [Google Scholar] [CrossRef]
  19. Wu, S.T.; Zhu, R.K.; Yang, Z.; Mao, Z.G.; Cui, J.W.; Zhang, X.X. Distribution and characteristics of lacustrine tight oil reservoirs in China. J. Asian Earth Sci. 2019, 178, 20–36. [Google Scholar] [CrossRef]
  20. Wu, S.T.; Lin, S.Y.; Chao, D.J.; Zhai, X.F.; Wang, X.R.; Huang, X.; Xu, J.L. Fluid mobility evaluation based on pore structure investigation in tight sandstones: Case study of Upper Triassic Chang 6 tight sandstone in Huaqing area, Ordos Basin. Nat. Gas Geosci. 2019, 30, 1222–1232. [Google Scholar] [CrossRef]
  21. Song, Y.; Luo, Q.; Jiang, Z.X.; Yang, W.; Liu, D.D. The enrichment of tight oil and its controlling factors in central and western China. Petrol. Explor. Dev. 2021, 48, 1–13. [Google Scholar] [CrossRef]
  22. Sun, P.K.; Xu, H.M.; Zhu, H.Q.; Jia, L.B.; Hu, X.N.; Fang, H.J.; Jiang, H.Q.; Xu, Z.H.; Jiang, T.W.; Jiang, X.; et al. Investigation of pore-type heterogeneity and its control on microscopic remaining oil distribution in deeply buried marine clastic reservoirs. Mar. Petrol. Geol. 2021, 123, 104750. [Google Scholar] [CrossRef]
  23. Qin, Y.; Yao, S.P.; Xiao, H.M.; Cao, J.; Hu, W.X.; Sun, L.H.; Tao, K.Y.; Liu, X.W. Pore structure and connectivity of tight sandstone reservoirs in petroleum basins: A review and application of new methodologies to the Late Triassic Ordos Basin, China. Mar. Pet. Geol. 2021, 129, 105084. [Google Scholar] [CrossRef]
  24. Nelson, P.H. Pore-throat sizes in sandstones, tight sandstones, and shales. AAPG Bull. 2009, 93, 329–340. [Google Scholar] [CrossRef]
  25. Loucks, R.G.; Reed, R.M.; Ruppel, S.C.; Hammes, U. Spectrum of pore types and networks in mudrocks and a descriptive classification for matrix-related mudrock pores. AAPG Bull. 2012, 96, 1071–1098. [Google Scholar] [CrossRef]
  26. Shanley, K.W.; Cluff, R.M. The evolution of pore-scale fluid-saturation in low-permeability sandstone reservoirs. AAPG Bull. 2015, 99, 1957–1990. [Google Scholar] [CrossRef]
  27. Xi, K.L.; Cao, Y.C.; Haile, B.G.; Zhu, R.K.; Jahren, J.; Bjørlykke, K.; Zhang, X.X.; Hellevang, H. How does the pore-throat size control the reservoir quality and oiliness of tight sandstones? the case of the Lower Cretaceous Quantou Formation in the southern Songliao Basin, China. Mar. Pet. Geol. 2016, 76, 1–15. [Google Scholar] [CrossRef]
  28. Wimmers, K.; Koehrer, B. Integration of sedimentology, petrophysics and rock typing as key to understanding a tight gas reservoir. Oil Gas Eur. Mag. 2014, 40, 196–200. [Google Scholar]
  29. Zhao, H.W.; Ning, Z.F.; Wang, Q.; Zhang, R.; Zhao, T.Y.; Niu, T.F.; Zeng, Y. Petrophysical characterization of tight oil reservoirs using pressure-controlled porosimetry combined with rate-controlled porosimetry. Fuel 2015, 154, 233–242. [Google Scholar] [CrossRef]
  30. Wang, G.W.; Chang, X.C.; Yin, W.; Li, Y.; Song, T.T. Impact of diagenesis on reservoir quality and heterogeneity of the Upper Triassic Chang 8 tight oil sandstones in the Zhenjing area, Ordos Basin, China. Mar. Pet. Geol. 2017, 83, 84–96. [Google Scholar] [CrossRef]
  31. Qiao, J.C.; Zeng, J.H.; Jiang, S.; Wang, Y.N. Impacts of sedimentology and diagenesis on pore structure and reservoir quality in tight oil sandstone reservoirs: Implications for macroscopic and microscopic heterogeneities. Mar. Pet. Geol. 2020, 111, 279–300. [Google Scholar] [CrossRef]
  32. Du, S.H.; Qiu, L.W.; Nan, J.H. Reservoir features and controlling factors of the 3th members of Shahejie Formation in south slope of Linnan sag. Sci. Technol. Eng. 2018, 18, 68–76. [Google Scholar]
  33. Xu, X.Q. Reservoir Evaluation of Es3, Member in Linxi Area. Huimin Sag. Master’s Thesis, China University of Petroleum, Qingdao, China, 2008. [Google Scholar]
  34. Duan, Y.G. Effects of Hydrocarbon Emplacement to the Evolution of Diagenesis and Secondary Pores of Reservoirs in Linnan Subsag. Master’s Thesis, Shandong University of Science and Technology, Qingdao, China, 2010. [Google Scholar]
  35. Cao, Y.C.; Wang, S.J.; Wang, Y.Z.; Yang, T.; Zhang, S.M.; Zhang, H.N. Sedimentary characteristics and depositional model of slumping deep-water gravity flow deposits: A case study from the middle Member 3 of Paleogene Shahejie Formation in Linnan subsag, Bohai Bay Basin. J. Palaeogeogr. 2017, 19, 419–432. [Google Scholar] [CrossRef]
  36. Teng, J.B. Division and evaluation of diagenetic facies of reservoirs in the control of fluid-rock chemical interaction: A case study of the lower Es3 in Jiangjiadian-wawu area. Pet. Geol. Recovery Effic. 2017, 24, 1–9. [Google Scholar] [CrossRef]
  37. Yang, T. Synergistic Diagenetic Evolution of Deep-Water Gravity Flow Sandstones-Mudstones and Genesis of High Quality Reservoirs in the Third Member of the Shahejie Formation, Dongying Depression. Ph.D. Thesis, China University of Petroleum, Qingdao, China, 2017. [Google Scholar]
  38. Fang, X.X.; Ma, C.F.; Zhao, L.Q.; Lei, L.Q.; Huang, W.J.; Han, C.C.; Qi, M. Diagenetic evolution of tight sandstone and the formation of an effective reservoir in the lower member 3 of the Shahejie Formation, Bohai Bay Basin, East China. Mar. Pet. Geol. 2024, 161, 106658. [Google Scholar] [CrossRef]
  39. Li, J.L.; Wang, X.; Wang, W.Q.; Li, B.; Zeng, J.H.; Jia, K.K.; Qiao, J.C.; Wang, K.T. Influence of sand-mud assemblages in tight sandstones on reservoir storage spaces: A case study of the lower submember of the 3rd member of the Paleogene Shahejie Formation in the Linnan sub-sag, Bohai Bay Basin. Oil Gas Geol. 2023, 44, 1173–1187. [Google Scholar] [CrossRef]
  40. Feng, D.X.; Ye, F. Structure kinematics of a transtensional basin: An example from the Linnan Subsag, Bohai Bay basin, Eastern China. Geosci. Front. 2018, 9, 917–929. [Google Scholar] [CrossRef]
  41. Feng, D.X. Main controlling factors in hydrocarbon accumulation of lower Sha 3 in Yingzijie area of Linnan Sag. Sci. Technol. Rev. 2015, 33, 54–58. [Google Scholar] [CrossRef]
  42. Cao, Y.C.; Wang, X.T.; Wang, Y.Z.; Yang, T.; Cheng, X.; Wang, S.J. Evolution of diagenetic fluids in reservoirs of Es3x in Jiangjiadian area of Linnan sag. Xinjing Pet. Geol. 2017, 38, 127–132. [Google Scholar] [CrossRef]
  43. Zuo, X.C. Study on Sedimentary Facies and Reservoir Characteristics of the Third Member of Shahejie Formation in Linnan Sag. Master’s Thesis, Liaoning Petrochemical University, Fushun, China, 2020. [Google Scholar] [CrossRef]
  44. Keshavarz, V.; Khosravanian, R.; Taheri-Shakib, J.; Salimidelshad, Y.; Hosseini, S.A. Chemical removal of organic precipitates deposition from porous media: Characterizing adsorption and surface properties. J. Pet. Sci. Eng. 2019, 175, 200–214. [Google Scholar] [CrossRef]
  45. Chukwuma, K.; Bordy, E.M.; Coetzer, A. Evolution of porosity and pore geometry in the Permian Whitehill Formation of South Africa-A FE-SEM image analysis study. Mar. Pet. Geol. 2018, 91, 262–278. [Google Scholar] [CrossRef]
  46. Wang, Y.C.; Chen, D.X.; Rong, L.X.; Chen, J.L.; Wang, F.W.; He, S.J.; Wang, Y.Q.; Yang, Z.J.; Lei, W.Z. Evaluation of fluid mobility and factors influencing the deep tight sandstone of the third member of the Shahejie formation in the Jiyang depression, Bohai Bay Basin. Mar. Pet. Geol. 2024, 170, 107090. [Google Scholar] [CrossRef]
  47. Matthews, G.P.; Moss, A.K.; Ridgway, C.J. The effects of correlated networks on mercury intrusion simulations and permeabilities of sandstone and other porous media. Powder Technol. 1995, 83, 61–77. [Google Scholar] [CrossRef]
  48. Griesinger, C.; Bennati, M.; Vieth, H.M.; Luchinat, C.; Parigi, G.; Höfer, P.; Engelke, F.; Glaser, S.J.; Denysenkov, V.; Prisner, T.F. Dynamic nuclear polarization at high magnetic fields in liquids. Prog. Nucl. Magn. Reson. Spectrosc. 2012, 64, 4–28. [Google Scholar] [CrossRef]
  49. Zhang, F.; Jiang, Z.; Sun, W.; Li, Y.; Zhang, X.; Zhu, L.; Wen, M. A multiscale comprehensive study on pore structure of tight sandstone reservoir realized by nuclear magnetic resonance, high pressure mercury injection and constant-ratemercury injection penetration test. Mar. Petrol. Geol. 2019, 109, 208–222. [Google Scholar] [CrossRef]
  50. Wu, Y.P.; Liu, C.L.; Ouyang, S.Q.; Luo, B.; Zhao, D.D.; Sun, W.; Awan, R.S.; Lu, Z.D.; Li, G.X.; Zang, Q.B. Investigation of pore-throat structure and fractal characteristics of tight sandstones using HPMI, CRMI, and NMR methods: A case study of the lower Shihezi Formation in the Sulige area, Ordos Basin. J. Pet. Sci. Eng. 2022, 210, 110053. [Google Scholar] [CrossRef]
  51. Kleinberg, R.L.; Horsfield, M.A. Transverse relaxation processes in porous sedimentary rock. J. Magn. Reson. (1969) 1990, 88, 9–19. [Google Scholar] [CrossRef]
  52. Zheng, S.J.; Yao, Y.B.; Liu, D.M.; Cai, Y.D.; Liu, Y. Characterizations of full-scale pore size distribution, porosity and permeability of coals: A novel methodology by nuclear magnetic resonance and fractal analysis theory. Int. J. Coal Geol. 2018, 196, 148–158. [Google Scholar] [CrossRef]
  53. Slijkerman, W.F.J.; Hofman, J.P.; Looyestijn, W.J.; Volokitin, Y. A practical approach to obtain primary drainage capillary pressure curves from NMR core and log data. Petrophysics-SPWLA J. Form. Eval. Reserv. Descr. 2001, 42, SPWLA-2001-v42n4a3. [Google Scholar]
  54. Liu, H.M.; Zhang, S.; Song, G.Q.; Wang, X.J.; Teng, J.B.; Wang, M.; Bao, Y.S.; Yao, S.P.; Wang, W.Q.; Zhang, S.P.; et al. Effect of shale diagenesis on pores and storage capacity in the Paleogene Shahejie Formation, Dongying Depression, Bohai Bay Basin, east China. Mar. Pet. Geol. 2019, 103, 738–752. [Google Scholar] [CrossRef]
  55. Barral, J.; Coppens, M.O.; Mandelbrot, B.B. Multiperiodic multifractal martingale measures. J. Mathématiques Pures Appliquées 2003, 82, 1555–1589. [Google Scholar] [CrossRef]
  56. Wang, C.; Zhang, H.; Yao, Z.G.; Huo, J.H. Study on Fractal Characteristics of Tight Sandstone Reservoir Based on Mercury Intrusion Experiment. J. Chongqing Univ. Sci. Technol. 2023, 25, 7–12. [Google Scholar] [CrossRef]
  57. Song, Z.Z.; Liu, G.D.; Yang, W.W.; Zou, H.Y.; Sun, M.L.; Wang, X.L. Multi-fractal distribution analysis for pore structure characterization of tight sandstone—A case study of the Upper Paleozoic tight formations in the Longdong District, Ordos Basin. Mar. Pet. Geol. 2018, 92, 842–854. [Google Scholar] [CrossRef]
  58. Zhang, H.M.; Guo, L.; Wu, Z.Y.; Ma, J.B. Pore-throat structure, fractal characteristics and permeability prediction of tight sandstone: The Yanchang Formation, Southeast Ordos Basin. Sci. Rep. 2024, 14, 27913. [Google Scholar] [CrossRef] [PubMed]
  59. Li, Z.; Ren, Y.L.; Chang, R.; Zhang, Y.L.; Zhang, X.Z.; Tian, W.C. Clarifying the contribution of multiscale pores to physical properties of Chang 7 tight sandstones: Insight from full-scale pore structure and fractal characteristics. Front. Earth Sci. 2024, 12, 1361052. [Google Scholar] [CrossRef]
  60. Wang, W.; Li, W.Z.; Xu, S. Classifications of the Reservoir Space of Tight Sandstone Based on Pore Structure, Connectivity, and Fractal Character: A Case Study from the Chang 7 Member of the Triassic Yanchang Formation in the Ordos Basin, China. ACS Omega 2022, 7, 10627–10637. [Google Scholar] [CrossRef]
  61. Lowe, D.R. Comparative sedimentology of the principal volcanic sequences of Archean greenstone belts in South Africa, Western Australia and Canada. Implications for crustal evolution. Precambrian Res. 1982, 17, 1–29. [Google Scholar] [CrossRef]
  62. Liu, F.; Zhu, X.M.; Li, Y.; Xu, L.M.; Niu, X.B.; Zhu, S.F.; Liang, X.W.; Xue, M.G.; He, J.C. Sedimentary characteristics and facies model of gravity flow deposits of Late Triassic Yanchang Formation in southwestern Ordos Basin, NW China. Pet. Explor. Dev. 2015, 42, 633–645. [Google Scholar] [CrossRef]
  63. Wiseman, A.C.; Krause, F.F. Comparing geology and well completions to production in the unconventional region of the Cardium Formation (Upper Cretaceous), northwest Pembina field, Alberta, Canada. AAPG Bull. 2014, 98, 881–892. [Google Scholar] [CrossRef]
  64. Mahmic, O.; Dypvik, H.; Hammer, E. Diagenetic influence on reservoir quality evolution, examples from Triassic conglomerates/arenites in the Edvard Grieg field, Norwegian North Sea. Mar. Pet. Geol. 2018, 93, 247–271. [Google Scholar] [CrossRef]
  65. Yuan, X.G.; Chang, T.Q.; Li, S.; Gao, Y.; Tao, H.F.; Li, W.F.; Wang, C.S. Sedimentary texture differences between lithofacies types and their control on the physical property in fan-delta conglomerate reservoirs: A case study from the Triassic Baikouquan Formation in Mahu Sag, Junggar Basin, Northwestern China. Geoenergy Sci. Eng. 2024, 233, 212455. [Google Scholar] [CrossRef]
  66. Morad, S.; Al-Ramadan, K.; Ketzer, J.M.; De Ros, L.F. The impact of diagenesis onthe heterogeneity of sandstone reservoirs: A review of the role of depositional faciesand sequence stratigraphy. AAPG Bull. 2010, 94, 1267–1309. [Google Scholar] [CrossRef]
  67. Bjørlykke, K. Relationships between depositional environments, burial history and rock properties. Some principal aspects of diagenetic process in sedimentary basins. Sediment. Geol. 2014, 301, 1–14. [Google Scholar] [CrossRef]
  68. Xi, K.L.; Cao, Y.C.; Liu, K.Y.; Jahren, J.; Zhu, R.K.; Yuan, G.H.; Hellevang, H. Authigenic minerals related to wettability and their impacts on oil accumulation in tight sandstone reservoirs: An example from the Lower Cretaceous Quantou Formation in the southern Songliao Basin, China. J. Asian Earth Sci. 2019, 178, 173–192. [Google Scholar] [CrossRef]
  69. Wang, W.R.; Yue, D.L.; Eriksson, K.A.; Liu, X.Y.; Liang, X.W.; Qu, X.F.; Xie, Q.C. Qualitative and quantitative characterization of multiple factors that influence movable fluid saturation in lacustrine deep-water gravity-flow tight sandstones from the Yanchang Formation, southern Ordos Basin, China. Mar. Pet. Geol. 2020, 121, 104625. [Google Scholar] [CrossRef]
  70. Feng, D.H.; Liu, C.L.; Feng, X.L.; Wang, X.P.; Awan, R.S.; Yang, X.Y.; Xu, N.; Wu, Y.F.; Wu, Y.P.; Zang, Q.B. Movable fluid evaluation of tight sandstone reservoirs in lacustrine delta front setting: Occurrence characteristics, multiple control factors, and prediction model. Mar. Pet. Geol. 2023, 155, 106393. [Google Scholar] [CrossRef]
  71. Zang, Q.; Liu, C.; Awan, R.S.; Yang, X.; Lu, Z.; Li, G.; Wu, Y.; Feng, D.; Ran, Y. Comparison of pore size distribution, heterogeneity and occurrence characteristics ofmovable fluids of tight oil reservoirs formed in different sedimentary environments:a case study of the chang 7 member of Ordos Basin, China. Nat. Resour. Res. 2022, 31, 415–442. [Google Scholar] [CrossRef]
  72. Zeng, J.H. Effect of fluid-rock interaction on porosity of reservoir rocks in tertiary system, Dongying Sag. Acta Pet. Sin. 2001, 22, 39. [Google Scholar] [CrossRef]
  73. Xia, Y. Diagenetic evolution of deep sandstone and formation mechanism of quality reservoirs in Shengli Petroliferous province. Petrochem. Ind. Technol. 2017, 24, 142–144. [Google Scholar]
  74. Shi, S.G.; Yang, T.; Cao, Y.C.; Zhang, H.N.; Yuan, G.H. Diagenesis and pore evolution of turbidite reservoir in the Linnan Depression. Spec. Oil Gas Reserv. 2017, 24, 57–62. [Google Scholar] [CrossRef]
  75. Wang, T.; Wang, X.F.; Zhang, D.D.; Wang, Q.T.; Luo, H.Y.; Wang, J.; Ma, Z.L.; Chen, Z.X.; Liu, W.H. Pore formation and evolution mechanisms during hydrocarbon generation in organic-rich marl. Pet. Sci. 2025, 22, 557–573. [Google Scholar] [CrossRef]
  76. Cao, T.T.; Deng, M.; Cao, Q.G.; Huang, Y.R.; Yu, Y.; Cao, X.X. Pore formation and evolution of organic-rich shale during the entire hydrocarbon generation process: Examination of artificially and naturally matured samples. J. Nat. Gas Sci. Eng. 2021, 93, 104020. [Google Scholar] [CrossRef]
  77. Xu, L.W.; Yang, K.J.; Wei, H.; Liu, L.F.; Li, X.; Chen, L.; Xu, T.; Wang, X.M. Diagenetic evolution sequence and pore evolution model of Mesoproterozoic Xiamaling organic-rich shale in Zhangjiakou, Hebei, based on pyrolysis simulation experiments. Mar. Pet. Geol. 2021, 132, 105233. [Google Scholar] [CrossRef]
  78. Smith, J.T. Petrographic and Core Analysis of the Jurassic Norphlet Formation: A Case Study in the Lithofacies Control of Diagenesis and Porosity in the Flomaton Field, AL; West Virginia University: Morgantown, WV, USA, 2021. [Google Scholar] [CrossRef]
  79. Paredes, H.C.G.; Catuneanu, O.; Romano, U.H. Controls on the quality of Miocene reservoirs, southern Gulf of Mexico. J. S. Am. Earth Sci. 2018, 81, 45–65. [Google Scholar] [CrossRef]
  80. Yang, C.; Yang, E. Mineral composition and pore structure on spontaneous imbibition in tight sandstone reservoirs. Sci. Rep. 2025, 15, 7504. [Google Scholar] [CrossRef]
  81. Wang, F.; Zhang, Y.; Yu, Z.H.; Chen, J. Simulation research on Jamin effect and oil displacement mechanism of CO2 foam under microscale. Arab. J. Chem. 2023, 16, 105123. [Google Scholar] [CrossRef]
  82. Song, X.L.; Feng, C.J.; Li, T.; Zhang, Q.; Pan, X.H.; Sun, M.S.; Ge, Y.L. Quantitative classification evaluation model for tight sandstone reservoirs based on machine learning. Sci. Rep. 2024, 14, 20712. [Google Scholar] [CrossRef]
Figure 1. Geological settings of study area: (a) Simplified location of the Bohai Bay Basin in China; (b) Simplified structural units of the Bohai Bay Basin and location of Linnan Subsag; (c) Simplified structural units and distribution of faults in the Linnan Subsag; (d) Sedimentary facies map of Es33 in the study area; (e) Stratigraphic columns of Es33 in the study area, Bohai Bay Basin. Es31, Es32, and Es33 are the lower, middle, and upper parts of the Third Member, respectively.
Applsci 15 05800 g001
Figure 2. Simplified sedimentary cross-section in Es33, Linnan Subsag (the cross-section location is shown in Figure 1c).
Applsci 15 05800 g002
Figure 3. Petrological characteristic of reservoirs: (a) Triangular plot of sandstone classification; (b) Box plot of diffraction analysis results of whole rock minerals.
Applsci 15 05800 g003
Figure 4. Physical properties of different sedimentary reservoirs for 68 samples: (a) Porosity distribution; (b) Permeability distribution; (c) Correlation between porosity and permeability.
Applsci 15 05800 g004
Figure 5. Microscopic characteristics of tight sandstone reservoirs in Es33 in Linnan Subsag. Notes: (a) Dissolution pores, well TX307, turbidite sandstone, 4231.8 m (CTS, −). (b) Feldspar dissolution pores, residual intergranular pores and carbonate cement dissolution pores, well TX307, turbidite sandstone, 4230.6 m (CTS, −). (c) Debris dissolution pores, well T305, turbidite sandstone, 4032.07 m (CTS, −). (d) Carbonate cement, carbonate cement dissolution pores, well T305, turbidite sandstone, 4057.02 m (CTS, −). (e) Quartz overgrowth edge, authigenic quartz microcrystalline and residual intergranular pores, well L86, turbidite sandstone, 3935.58 m (SEM). (f) Feldspar intragranular dissolution pores, residual intergranular pores, well TX307, turbidite sandstone, 4227.1 m (SEM). (g) Feldspar alteration, well T305, turbidite sandstone, 4057.02 m (SEM). (h) Clay mineral interstitial material and intercrystalline micropores, well T305, turbidite sandstone, 4032.07 m (SEM). (i) Intergranular dissolution pores of feldspar, residual intergranular pores, well L86, delta front sandstone, 4096.6 m (CTS, −). (j) Authigenic quartz microcrystalline, well L81, delta front sandstone, 3899.4 m (CTS, −). (k) Debris dissolution pores, well L81, delta front sandstone, 3899.41 m (CTS, +). (l) Carbonate cement dissolution pores, feldspar intragranular dissolution pores, well T305, delta front sandstone, 4204.7 m (CTS, +). (m) Kaolinite cement, well L81, delta front sandstone, 3851.7 m (SEM). (n) Carbonate cement, well T306, delta front sandstone, 4017.2 m (CTS, +). (o) Carbonate cement and carbonate cement dissolution pores, well T306, delta front sandstone, 4006.47 m (CTS, −). (p) Microfractures and some microfractures are filled with calcite, well T306, delta front sandstone, 4015.8 m (CTS, +). (q) Quartz intragranular dissolution pores, residual intergranular pores, well T305, delta front sandstone, 4204.7 m (SEM). (r) Pyrite microcrystalline, residual intergranular pores, well T305, delta front sandstone, 4208.5 m (SEM). (s) Illite clay interstitial material and intercrystalline microcopes, well L81, delta front sandstone, 3851.7 m (SEM). (t) Feldspar intragranular dissolution pores, residual intergranular pores, well L86, delta front sandstone, 4096.6 m (SEM).
Applsci 15 05800 g005
Figure 6. Pore–throat combination types, pore size analysis, and pore type proportion in different sedimentary systems in Es33 in Linnan Subsag.
Applsci 15 05800 g006
Figure 7. HPMI-derived mercury injection and extrusion curves, and full aperture distribution of representative sandstone samples from different sedimentary reservoirs.
Applsci 15 05800 g007
Figure 8. Typical NMR pore diameter incremental and cumulative curves for tight sandstones. (A) Turbidite sandstone. Figures (ac) correspond to the three types of pore structure A, B, and C, respectively. (B) Delta front sandstone. Figures (df) correspond to the three types of pore structure D, E, and F respectively. Notes: (a) Sample TX307-1, 4230.6 m. Sample TX307-2, 4227.1 m. (b) Sample T305-1, 4032.07 m. Sample T305-2, 4057.02 m. (c) Sample L86, 3935.58 m. (d) Sample T306-3, 4005.04 m. (e) Sample T305-3, 4215.8 m. Sample T306-1, 4017.33 m. Sample T306-2, 4004.3 m. Sample TX307-3, 4364.7 m. Sample L81, 3899.41 m. (f) Sample L98-1, 4294.58 m. Sample L98-2, 4297.21 m.
Applsci 15 05800 g008
Figure 9. Fractal dimension features of pore structure for tight sandstone samples of different sedimentary systems. Notes: (a) Turbidite sandstone. (b) Turbidite sandstone, Type A, Sample TX307-1. (c) Turbidite sandstone, Type B, Sample T305-2. (d) Turbidite sandstone, Type C, Sample L86. (e) Delta front sandstone. (f) Delta front sandstone, Type D, Sample T306-3. (g) Delta front sandstone, Type E, Sample T306-1. (h) Delta front sandstone, Type F, Sample L98-1.
Applsci 15 05800 g009
Figure 10. Patterns of different lithofacies’ characteristics and spatial distribution.
Applsci 15 05800 g010
Figure 11. Vertical distribution of relative clay mineral content in Es33 tight sandstone reservoirs.
Applsci 15 05800 g011
Figure 12. Conceptual pattern of differential diagenetic processes in turbidite and delta front sandstone reservoirs.
Applsci 15 05800 g012
Figure 13. Diagenetic intensity and diagenetic facies classification of tight sandstone reservoirs under different sedimentary systems. Notes: (a1) Well TX307, turbidite sandstone, 4227.10 m (cl). (a2) Well TX307, turbidite sandstone, 4229.35 m (-). (b1) Well T305, turbidite sandstone, 4060.55 m (cl). (b2) Well T305, turbidite sandstone, 4032.8 m (-). (c1) Well L86, turbidite sandstone, 3937.18 m (cl). (c2) Well L81, turbidite sandstone, 3852.76 m (SEM). (d1) Well T306, delta front sandstone, 4017.76 m (cl). (d2) Well T306, delta front sandstone, 4015.59 m (SEM). (e1) Well T305, delta front sandstone, 4205 m (cl). (e2) Well T305, delta front sandstone, 4205 m (SEM). (f1) Well L98, delta front sandstone, 4294.58 m (cl). (f2) Well TX307, delta front sandstone, 4364.7 m (SEM).
Applsci 15 05800 g013
Figure 14. Genetic model of microscopic pore structure and oil-bearing characteristics of tight sandstone reservoirs under different sedimentary systems. Notes: (a1f1) Sequentially display the corresponding lithofacies for pore structure Type A–F. (a2f2) Sequentially display the corresponding diagenetic facies for pore structure Type A–F. (a3f3) Sequentially display the pore structure Type A–F. (a4f4) Sequentially display the corresponding oil content for pore structure Type A–F through fluorescence sections. (g) Sedimentary model in Es33, Linnan Subsag.
Applsci 15 05800 g014
Table 1. The basic physical parameters and fractal dimension features of pore structure for experimental samples.
Sedimentary SystemPore–Throat Combination TypeSample NumberPorosity/%Permeability/mDD1D2D3
D1R12D2R22D3R32
Turbidity currentType ATX307-112.5650.8372.9980.98372.6750.9979//
Type ATX307-27.5801.1692.9980.97492.6430.9972//
Type BT305-18.8700.3912.9980.95272.6780.9879//
Type BT305-29.1120.9322.9950.96582.7020.9807//
Type CL867.8410.3062.9970.90202.9270.97072.6440.9904
Delta frontType DT306-38.6450.3352.9970.95422.7300.9947//
Type ET306-17.7650.1442.9950.93932.7440.96292.2650.9990
Type ETX307-37.1530.0252.9920.92022.7300.94822.0780.9943
Type ET305-35.1750.0342.9940.97142.8000.92282.1830.9943
Type ET306-24.6200.0542.9930.96872.7260.95472.2210.9959
Type EL817.8650.1062.9930.96612.8100.94592.2830.9734
Type FL98-13.8890.1882.9980.97522.7750.9603//
Type FL98-25.9000.1862.9980.96532.8080.9112//
Disclaimer/Publisher’s Note: The statements, opinions and data contained in all publications are solely those of the individual author(s) and contributor(s) and not of MDPI and/or the editor(s). MDPI and/or the editor(s) disclaim responsibility for any injury to people or property resulting from any ideas, methods, instructions or products referred to in the content.

