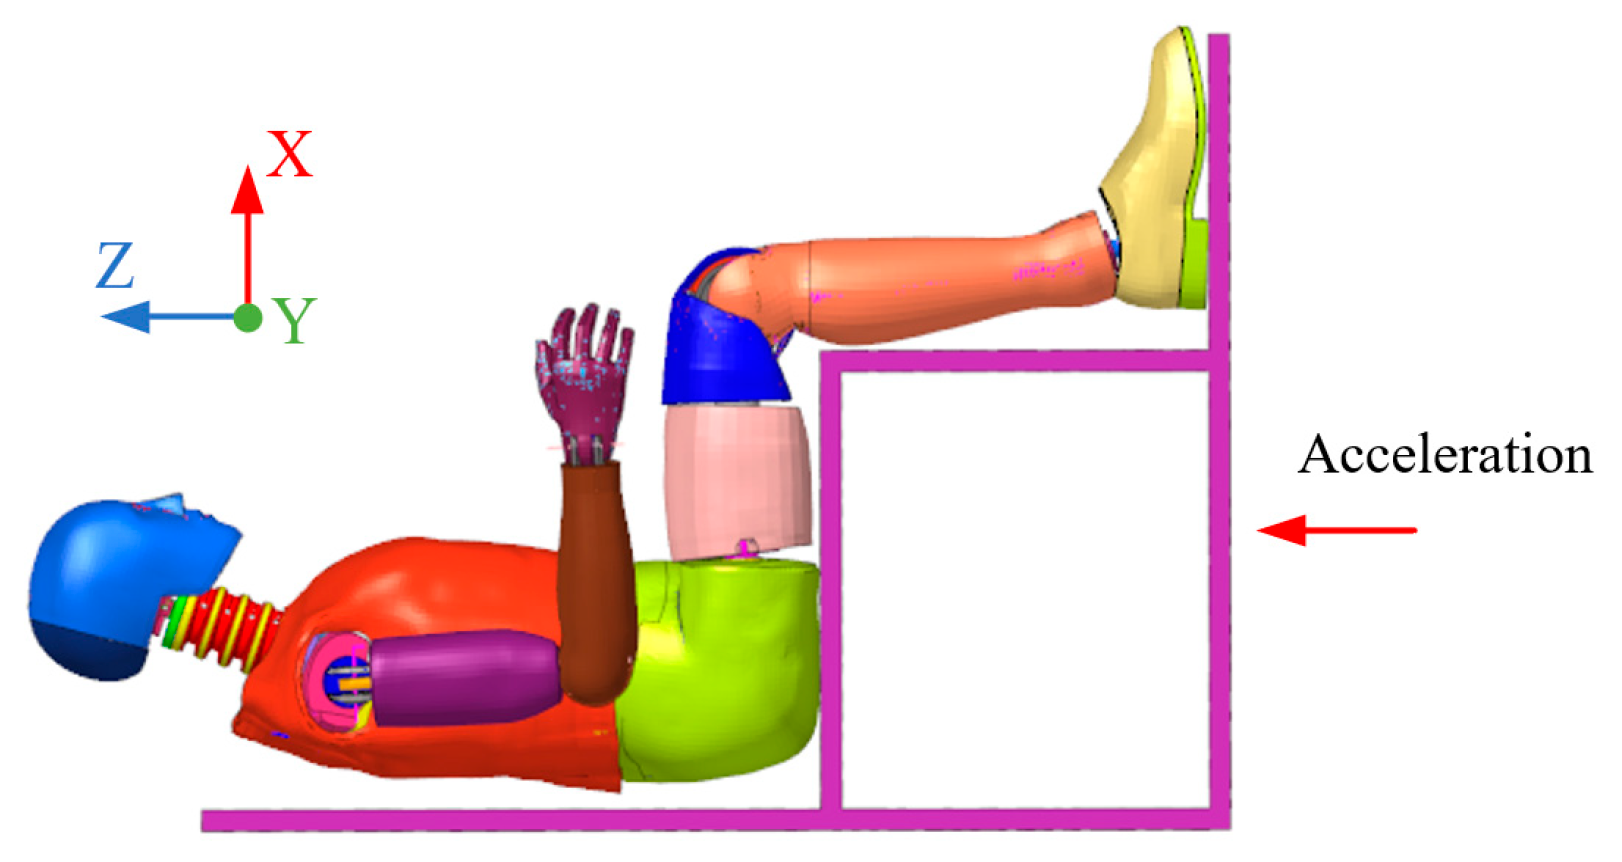
Article

Methodology for Occupant Head-Neck Injury Testing in Under-Body Blast Impact Based on Virtual-Real Fusion

School of Mechanical Engineering, Nanjing University of Science and Technology, Nanjing 210094, China
*
Author to whom correspondence should be addressed.
Appl. Sci. 2025, 15(11), 5796; https://doi.org/10.3390/app15115796
Submission received: 21 April 2025 / Revised: 14 May 2025 / Accepted: 19 May 2025 / Published: 22 May 2025

Abstract

:
The high-biofidelity dummy used to evaluate occupant protection under blast conditions is often costly and vulnerable. To address the limitations of low-cost, simplified dummy head–neck structures, which exhibit significant differences in mechanical properties compared to high-biofidelity dummies, a virtual–real fusion-based test method for assessing occupant head–neck injury in under-body blast impacts is proposed. A simplified dummy head–neck physical model, designed based on human biomechanical characteristics, is constructed for physical testing. A mapping test model based on 1D convolutional neural network (1D-CNN) is developed as the virtual counterpart to process physical model test data, specifically head and chest centroid accelerations, into head centroid acceleration and upper neck axial compression force matching the Hybrid III 50th numerical model. Pendulum collision tests are conducted to simulate under-body blast impacts, generating multiple sets of head and chest acceleration data. Under identical loading conditions, the head centroid acceleration and upper neck axial compression force of the Hybrid III 50th numerical model are computed. The parameters of the mapping test model are then optimized using these simulated experimental datasets based on non-dominated sorting genetic algorithm II (NSGA-II). Validation through blast experiments demonstrates that the proposed method achieves high accuracy, with errors of 10.9% for the Head Injury Criterion (HIC15) and 2.4% for upper neck maximum axial compression force compared to the Hybrid III 50th numerical model calculations. This approach effectively bridges the gap between biofidelity and cost-efficiency in dummy testing for blast impact scenarios.

1. Introduction

Under-body blast (UBB) events caused by buried landmines or improvised explosive devices (IEDs) can produce rapid vertical accelerations transmitted through the vehicle floor into the occupant’s lower limbs, pelvis, and ultimately the spine, resulting in complex and severe loading of the head–neck system. The vertical accelerations can result in compressive axial loads and inertial bending moments in the cervical spine, increasing the risk of skull base fractures, cervical vertebral damage, and traumatic brain injury (TBI). Non-penetrative occupant injuries represent the common casualty pattern in armored vehicles surviving mine detonations, where hull integrity remains preserved. In this scenario, the blast wave fails to penetrate the vehicle hull to directly injure occupants. Primary injury mechanisms originate from vehicle transmissibility, generating traumatic impacts through structural vibration. The simulation and analysis of selected blast scenarios have been the focus of several studies. Danelson [1] developed a blast buck (Accelerative Loading Fixture, or ALF) for studying under-body blast events in a laboratory to compare the responses of Hybrid III and PMHS in the explosion. Trajkovski [2] conducted a finite element analysis to investigate the blast response of the V-shaped hull structure in light armored vehicles. Espinoza-Garcés [3] developed a finite element model of the Hybrid III dummy under pipeline explosion environment and established the relationship between head injury and the blast propagation radius.
The use of dummies for testing the non-penetrative occupant injuries of landmine explosions holds significant scientific value and practical importance. A dummy can simulate the biomechanical responses of the human body under blast impacts, thereby providing injury data. Through dummy testing, it is possible to quantify the extent of damage caused to occupants by blast impacts, evaluate the effectiveness of vehicle protection systems, and provide a basis for improving vehicle design and materials.
Due to the high biofidelity of the dummy, it is already widely used in automobile, manned spaceflight, and military protection tests. For example, Hybrid III 50th ATD (Anthropomorphic Test Device) is used by the North Atlantic Treaty Organization (NATO) as a dummy to test explosion damage to occupants, so it is currently a mature means of explosion-damage test [4,5]. Many scholars have studied the response of Hybrid III under impact. Ott [6] and Marie Bailey [7,8] compared the response of the Hybrid III and the PHMS in under-body high-velocity impact. Using the Hybrid III dummy, Horst analyzed occupant safety in blast-mine loading under vehicles [9], and Bass investigated the protective effects of different protective clothing on the head and neck under a C4 explosion [10]. Yin conducted a study on the influence of wearing protective equipment on the injuries sustained by vehicle occupants during vertical under-vehicle blast impacts [11]. Subsequently, the higher biofidelity dummies, Thor and WIAMan, were launched. Compared with Hybrid III, the flexibility of thoracic and vertebral joints and chest and shoulder restraints of THOR were increased. WIAMan is designed to be more suitable for testing under-body explosion damage, as its structure and materials more closely resemble human characteristics [12]. Zeng compared the response of Thor, WIAMan, and Hybrid III in under-body blast impact [13]. These high biofidelity dummies make the structure and size and biomechanical response as similar as possible to the human body, but the manufacturing cost is high. However, high biofidelity dummies are very expensive. For example, a full Hybrid III 50th percentile male ATD generally costs approximately $250,000, depending on configuration and sensor instrumentation. When large-scale use of dummies is required—such as assessing occupant injuries at multiple seating positions within a vehicle—the use of high-fidelity dummies inevitably leads to substantial cost. The aim of this study is to reduce the cost associated with occupant injury testing.
To enhance engineers’ analysis of occupant biological response through force distribution visualization and reduce cost, a finite element model of a dummy has been introduced. LSTC and the University of Washington have jointly developed the Hybrid III finite element model (FEM). Scholars optimized the material properties of the Hybrid III numerical model under high-speed impact conditions by taking into account the strain rate effects. Lou validated the mechanical behavior of the lumbar spine by introducing a stiffer viscoelastic material card [14]. Zhu validated the material properties of the pelvis flesh, lower leg flesh, heel foam, and lower leg skin under the high rate [15]. Then, Suhaimi conducted high-speed impact tests to validate that the computational results of the optimized Hybrid III 50th FEM are in good agreement with the test results of the physical model [16,17] (The correlation and analysis score ranged from 0.653 to 0.901, and the differences in peak response ranged from 1.5% to 12.7%). In terms of applications, Sławiński [18], Suhaimi [19], and Wang [20] used Hybrid III 50th FEM to analyze the human damage under blast. Roberts studied the effect of shock waves on the human head–neck based on Hybrid III 50th FEM [21]. However, the coupling situations between the occupant and the vehicle are complex and varied. Ensuring that the transmission of explosion impacts within vehicles matches actual conditions is extremely difficult in the finite element model. The proposal of the new method can simplify these analyses. In the paper, the finite element model was utilized under simplified conditions to conduct a comparative validation of the new method.
Mapping the test model using one-dimensional convolutional neural networks (1D-CNNs) constitutes a major contribution of this work, and prior studies have explored similar approaches in data calibration and damage assessment. Park explored the feasibility of using 1D-CNN for vibration-based structural damage assessment. By analyzing the vibration signals, the 1D-CNN model can effectively identify structural damage, improving the accuracy and efficiency of the evaluation [22]. Ail calibrated the low-cost carbon monoxide sensor using 1D-CNN. This method improves the accuracy and reliability of the sensor and demonstrates the potential of 1D-CNN in the calibration of sensor data [23]. Lanning proposed a CNN-based framework to calibrate parameters of nonlinear structural models using time-history data of loads and displacements [24].
This paper aims to investigate a unique testing method that is cost-effective, capable of yielding rapid results, and incorporates a simplified physical dummy model installed on-site. The paper established a simplified physical model of the head–neck structure. Then, we built the mapping test model based on 1D-CNN. Through the fusion of virtual and real testing, the damage to occupants caused by explosions is assessed. The method holds certain significance for the cost-effectiveness testing of dummies. The head–neck part of the dummy is the research content of this paper.

1.1. Injury Criterion

In automotive crash safety assessment, injury criteria are quantitative metrics used to evaluate the likelihood of occupant injury under various impact conditions. Commonly used criteria include the Head Injury Criterion (HIC), which evaluates the risk of traumatic brain injury based on head acceleration; the Neck Injury Index (Nij), which combines axial force and bending moment at the neck; the Chest Deflection and Viscous Criterion (VC) for assessing thoracic injury; and femur loads and tibia indices for lower extremity evaluation. These criteria were originally developed for use in automotive crash testing to assess the risk of human injuries under high-acceleration, short-duration impacts. With the growing need to evaluate occupant responses in under-body blast (UBB) scenarios—especially due to landmine and IED threats—these criteria have been widely adopted in blast biomechanics research. HIC and Nij remain commonly used due to their simplicity and extensive validation history. NATO, for example, references HIC in its military vehicle occupant protection guidelines, including the HFM-090 [4] and the AEP-55 [5] for blast testing and evaluation. Moreover, finite element human body models, such as those used in studies funded by the NATO Research Task Groups, commonly utilize HIC and Nij as benchmark outputs to evaluate head and neck loading under under-body blast and overpressure scenarios [25]. While these criteria are not specifically designed for blast loading, their adoption reflects a practical need for standardized, quantitative injury measures in blast biomechanics.
For under-body blast events, vertical acceleration of the head and neck axial compression are considered the principal contributors to injury. In consideration of space limitations, selected aspects of the vertical acceleration of the head and the axial compression force of the upper neck are considered in this work.

1.1.1. Neck Injury

Nij is a biomechanical injury criterion developed to evaluate the risk of cervical spine injury under combined axial loading and bending conditions. It was introduced by the National Highway Traffic Safety Administration (NHTSA) and standardized by the Society of Automotive Engineers (SAE J1727) to assess neck injury potential in frontal vehicle collisions [26]. Nij is calculated as a linear combination of normalized axial force and sagittal plane bending moment measured at the occipital condyle of anthropomorphic test devices (ATDs), such as the Hybrid III dummy:
N i j = F z F int + M y M int
where F z is the axial force, M y is the sagittal plane moment (flexion/extension), F int and M int are injury threshold values. For the 50th percentile male, the critical compressing force is F int = 6160 N , the critical tensile force is F int = 6806 N , the critical flexion moment is M int = 135   N · m , the critical extension moment is M int = 310 N · m .
The Hybrid III ATD measures F z and M y using a six-axis load cell mounted at the upper neck, which are then substituted into the Nij equation to assess injury risk.

1.1.2. Head Injury

The HIC criterion was adopted in 1998 by the NHTSA [27]. The commonly used time window limits for the HIC standard are 15 ms or 36 ms. Explosions generate extremely rapid shock waves, with the primary loading on the human body typically occurring within just a few to several milliseconds. Therefore, using HIC36 may include smaller but longer-duration accelerations, which dilutes the peak impact and underestimates the actual injury risk. HIC15 is more suitable for identifying short-duration, high-acceleration impacts—precisely the type of injury mechanism explosions typically cause to the human body. NATO reports, such as the HFM-090 [4] and the AEP-55 [5], commonly use HIC15 when evaluating explosive or short-duration high-load events such as blasts and falls. The HIC15 value can be obtained by the following formula:
H I C 15 = max t 1 , t 2 { [ 1 t 2 t 1 t 1 t 2 a d t ] 2.5 ( t 2 t 1 ) } t 2 t 1 15 a = a x 2 + a y 2 + a z 2
where a is the resultant acceleration of the center of gravity of the head in g ( = 9.81 m / s 2 ). t 1 and t 2 are the moments in time during the event, where HIC15 is at a maximum. Time shall be specified in seconds [s].
The Hybrid III ATD evaluates head injury risk using HIC, with acceleration signals measured by accelerometers mounted at the center of gravity of the head.

2. Methodology

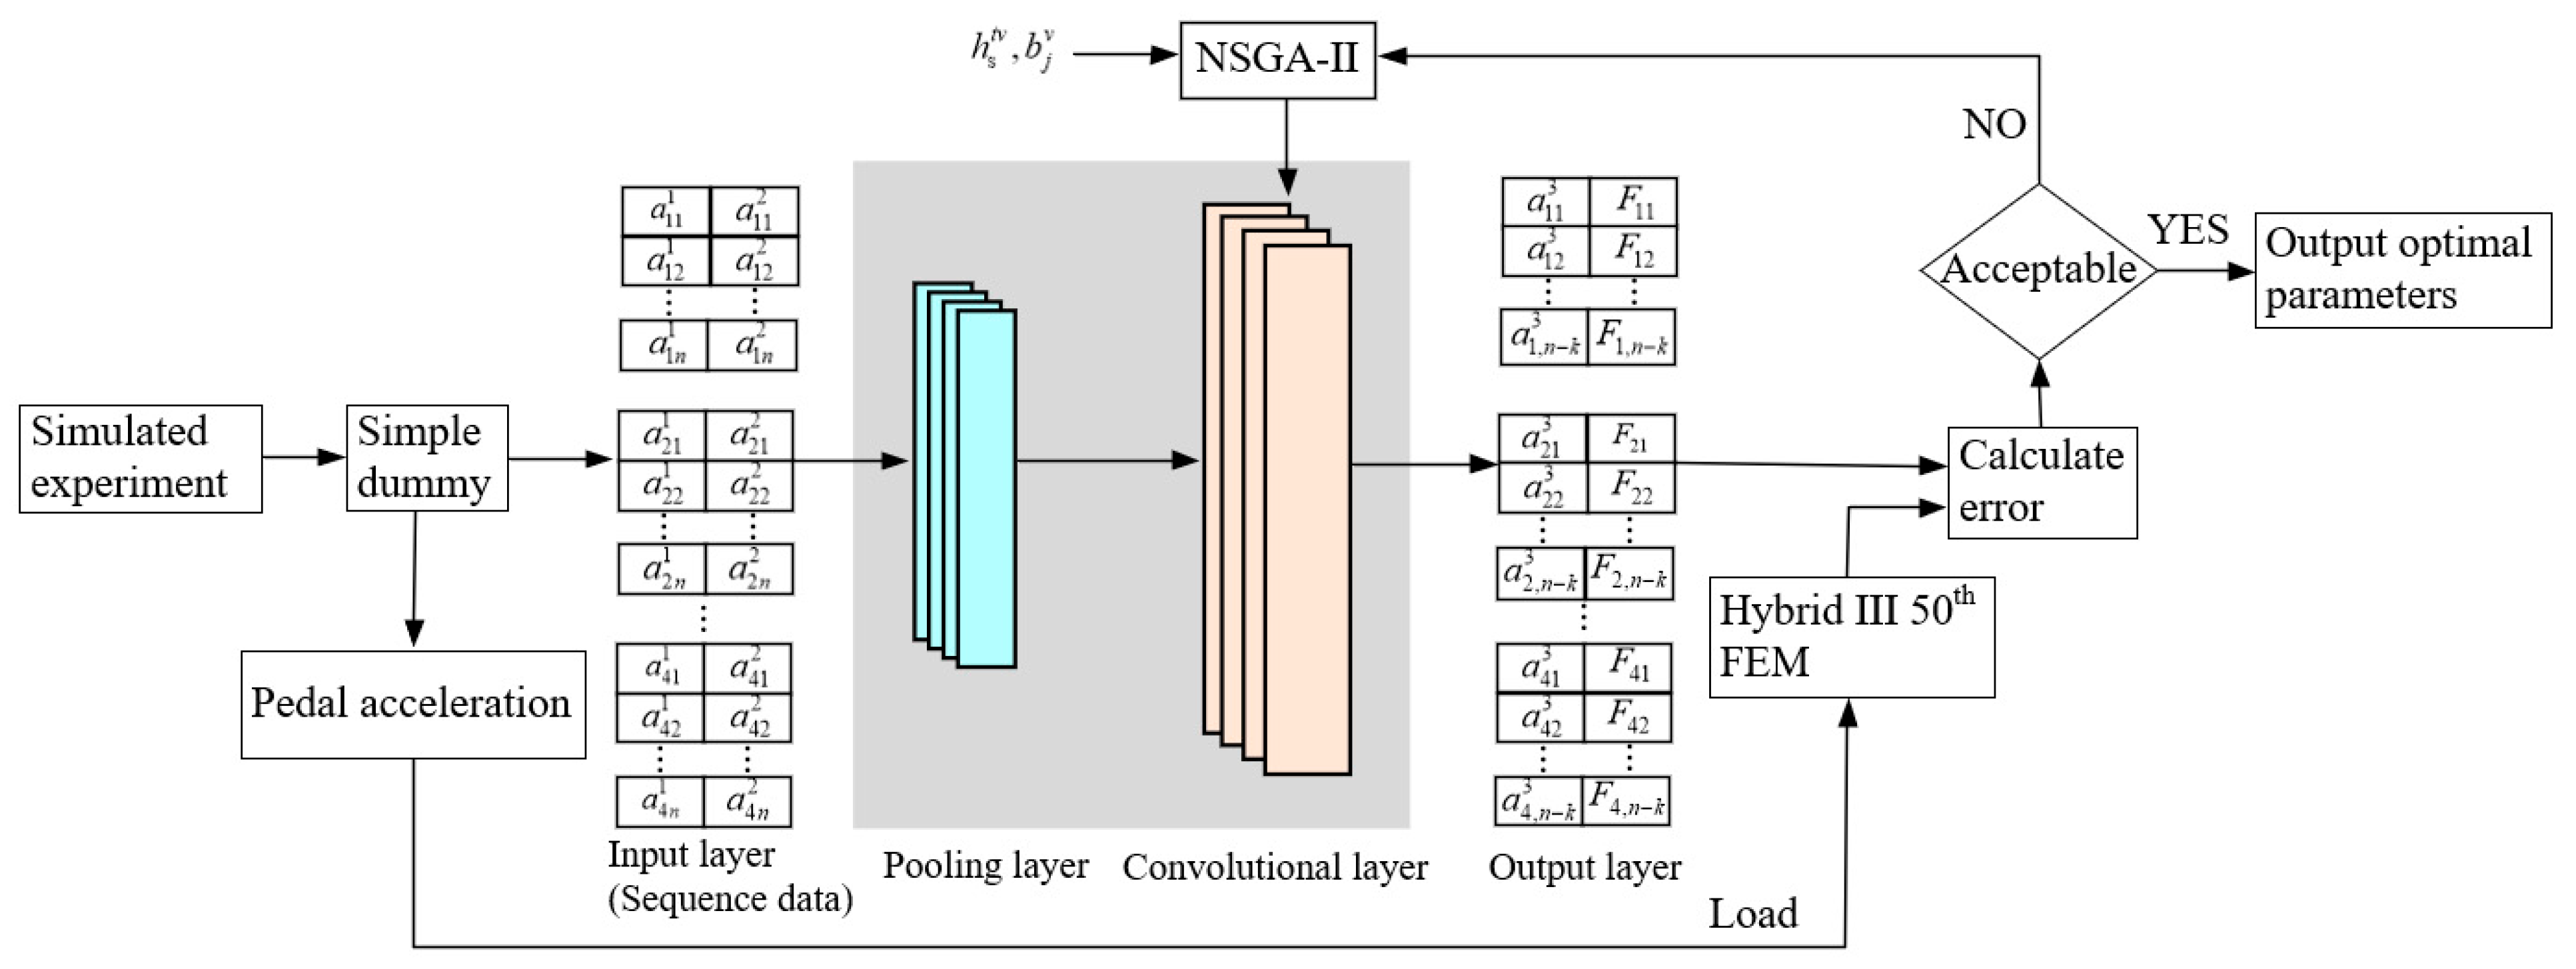
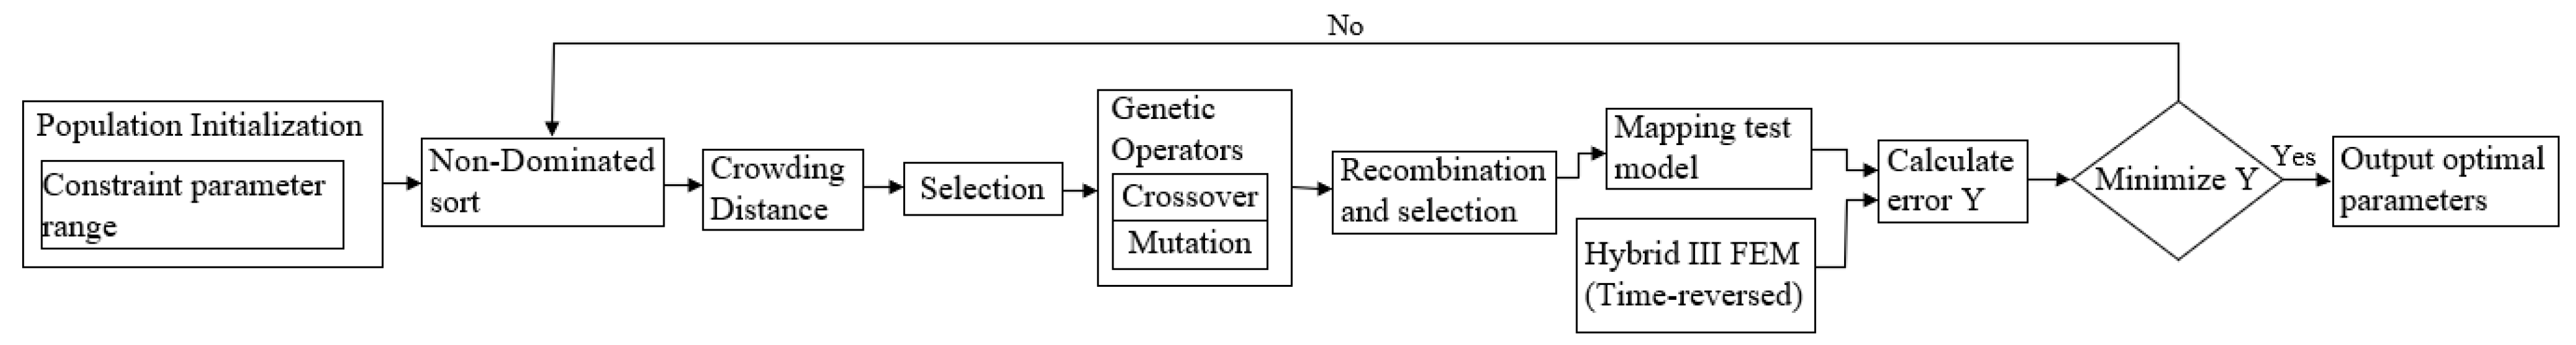
The initial step to build the system involves designing a cost-effective dummy that preserves the segmental mass distribution and center-of-mass locations characteristic of human surrogates. Additionally, the dummy should feature a modular design for ease of assembly and disassembly, while maintaining low manufacturing costs. The primary focus of this study is the head–neck region of the dummy. The head–neck structure consists of alternating aluminum vertebral analogs and silicone intervertebral discs, secured by latex straps simulating ligaments. This design enables basic mobility and injury recognition. Although the segmental mass and center of gravity of the simplified dummy were designed to approximate those of the Hybrid III 50th percentile model, notable differences persist due to the use of cost-effective materials and the omission of moment of inertia considerations. To address these discrepancies, a mapping model based on 1D-CNN is developed.
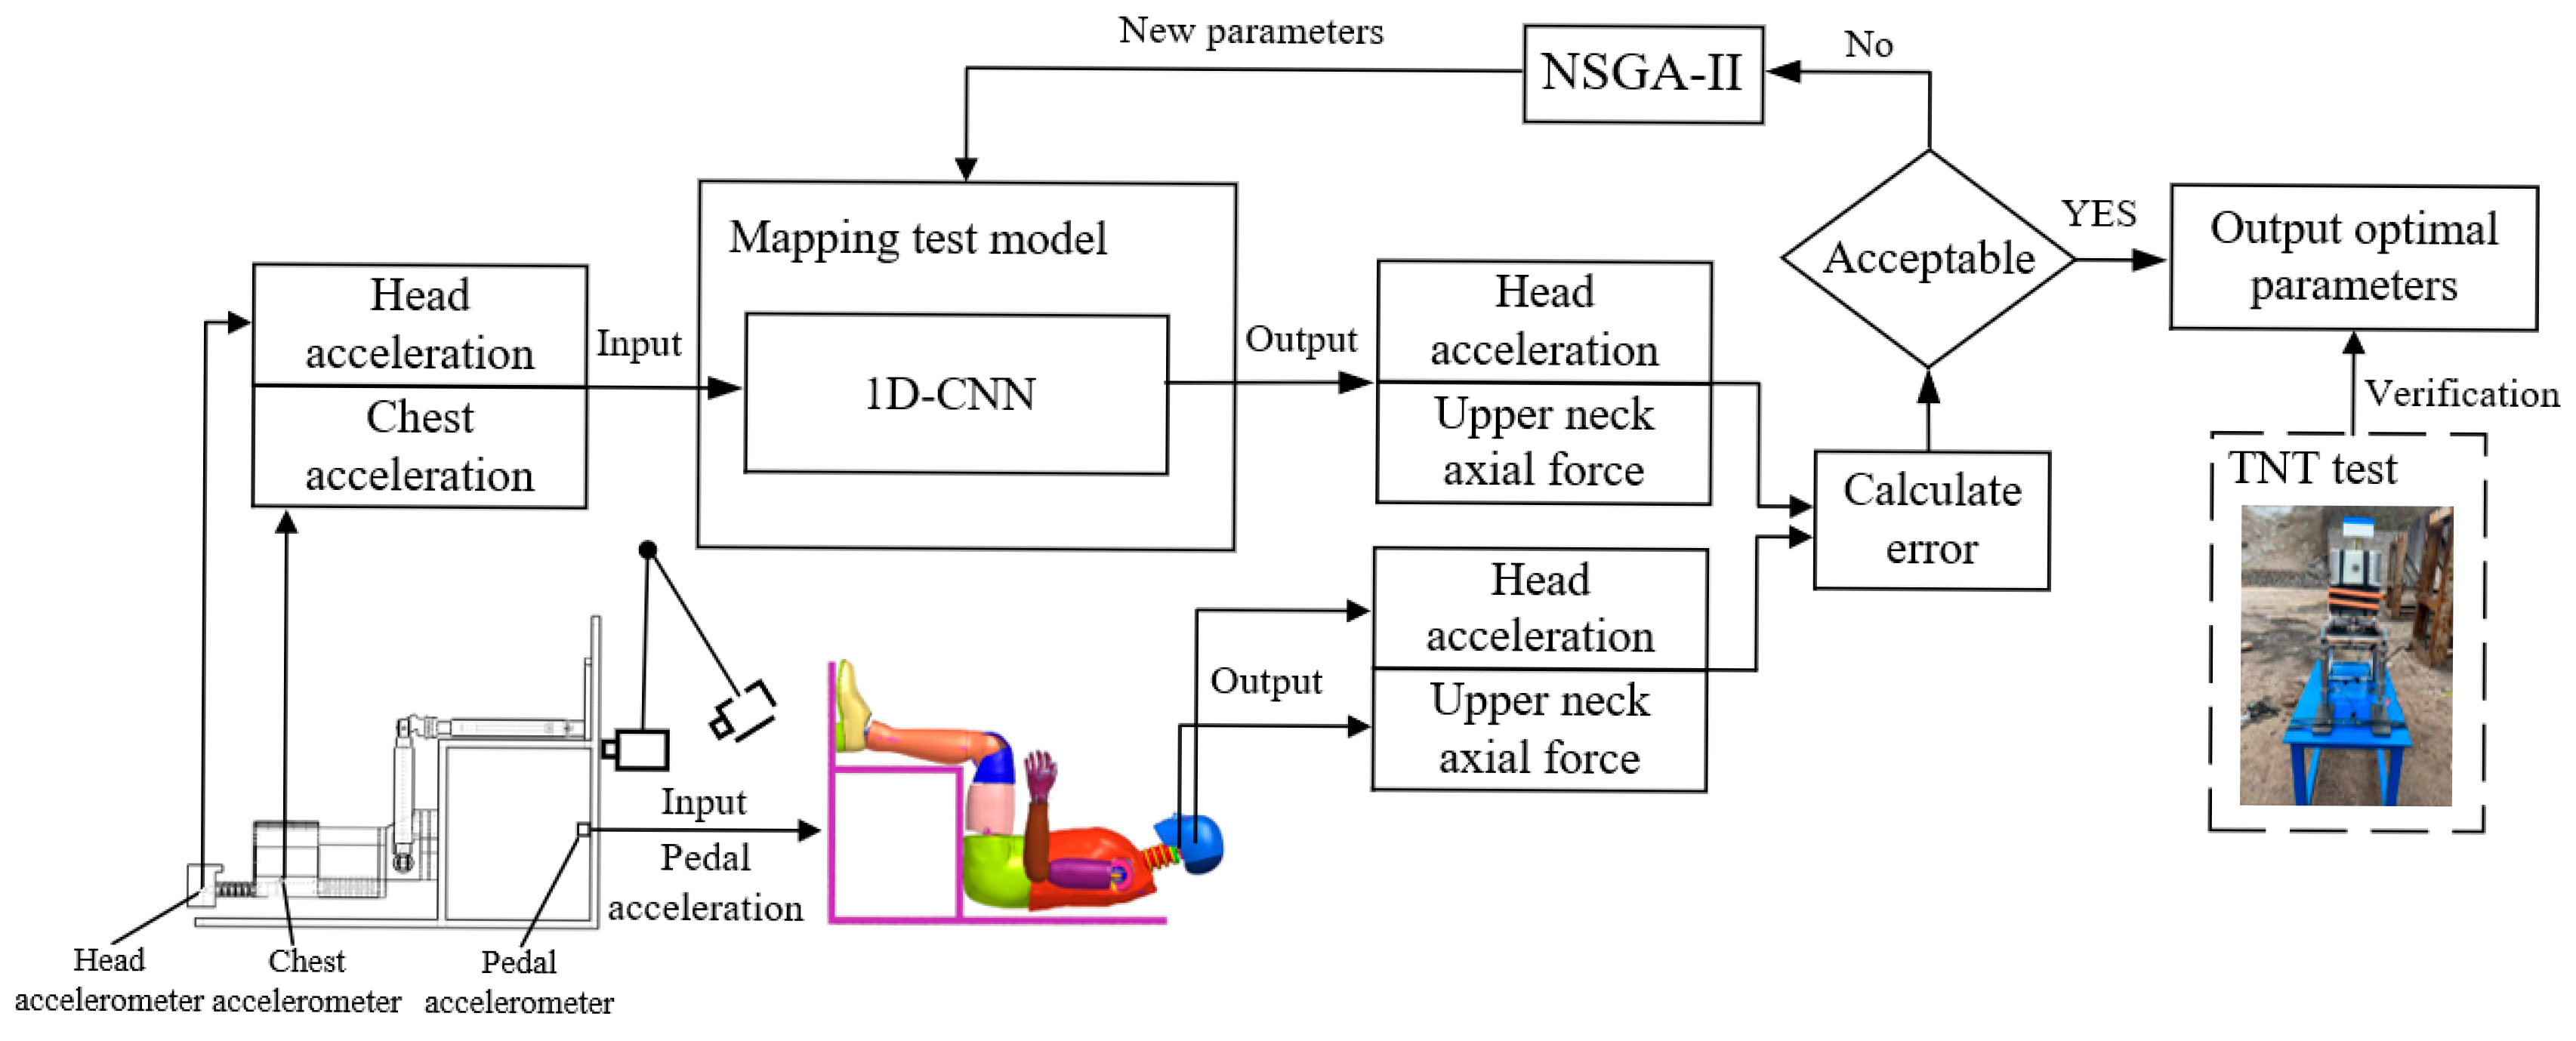
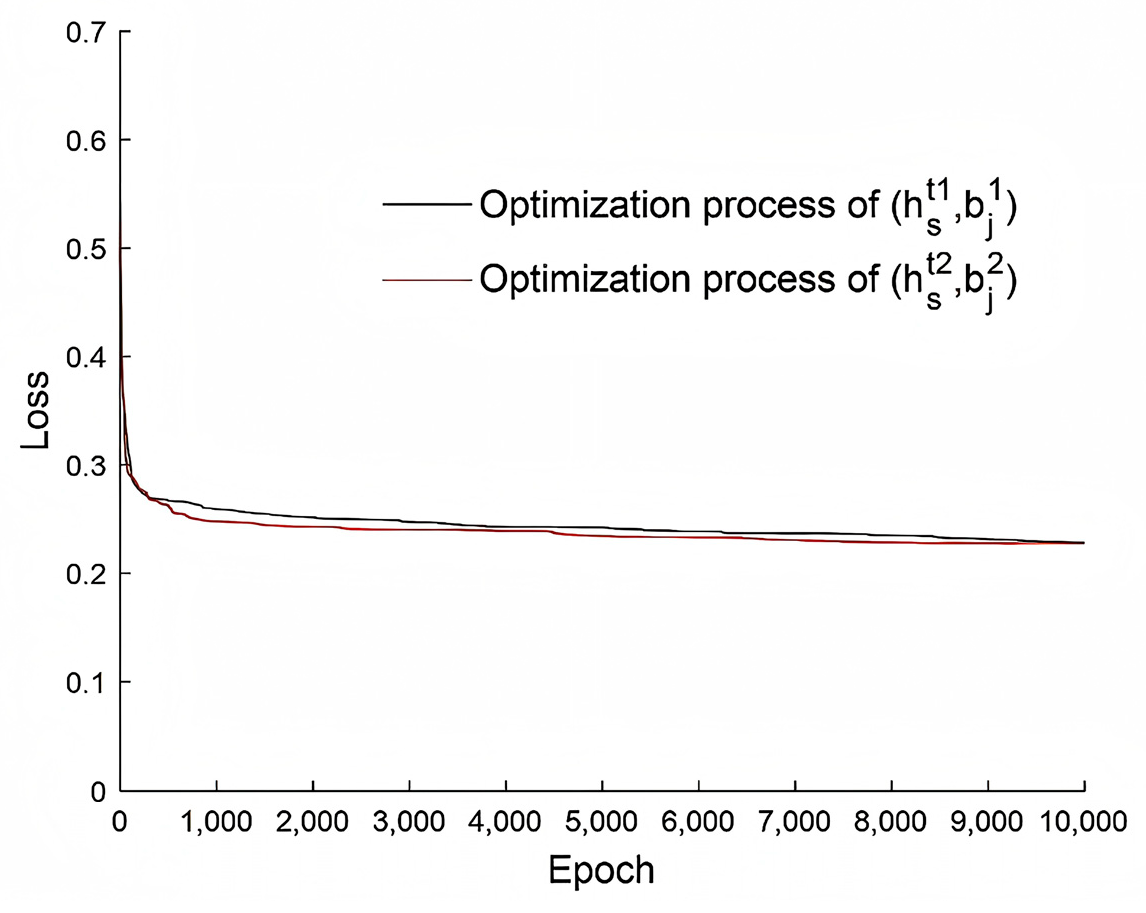
In the second step, the 1D-CNN network is trained to address the discrepancy between the simplified dummy and the high-fidelity dummy. While the simplified dummy replicates segmental mass and center-of-mass distributions, its response still deviates from that of the high-biofidelity dummy due to the use of low-cost materials and simplified joint connections. The mapping model aims to minimize this deviation. The training dataset for the model was obtained through a repeatable and controlled pendulum experiment. Section Relationship Between the Pendulum and Explosive Impact investigates the relationship between pendulum impact and simulated explosions using empirical formulas for blast overpressure. An overview of the model-training procedure is presented as follows: As illustrated in 
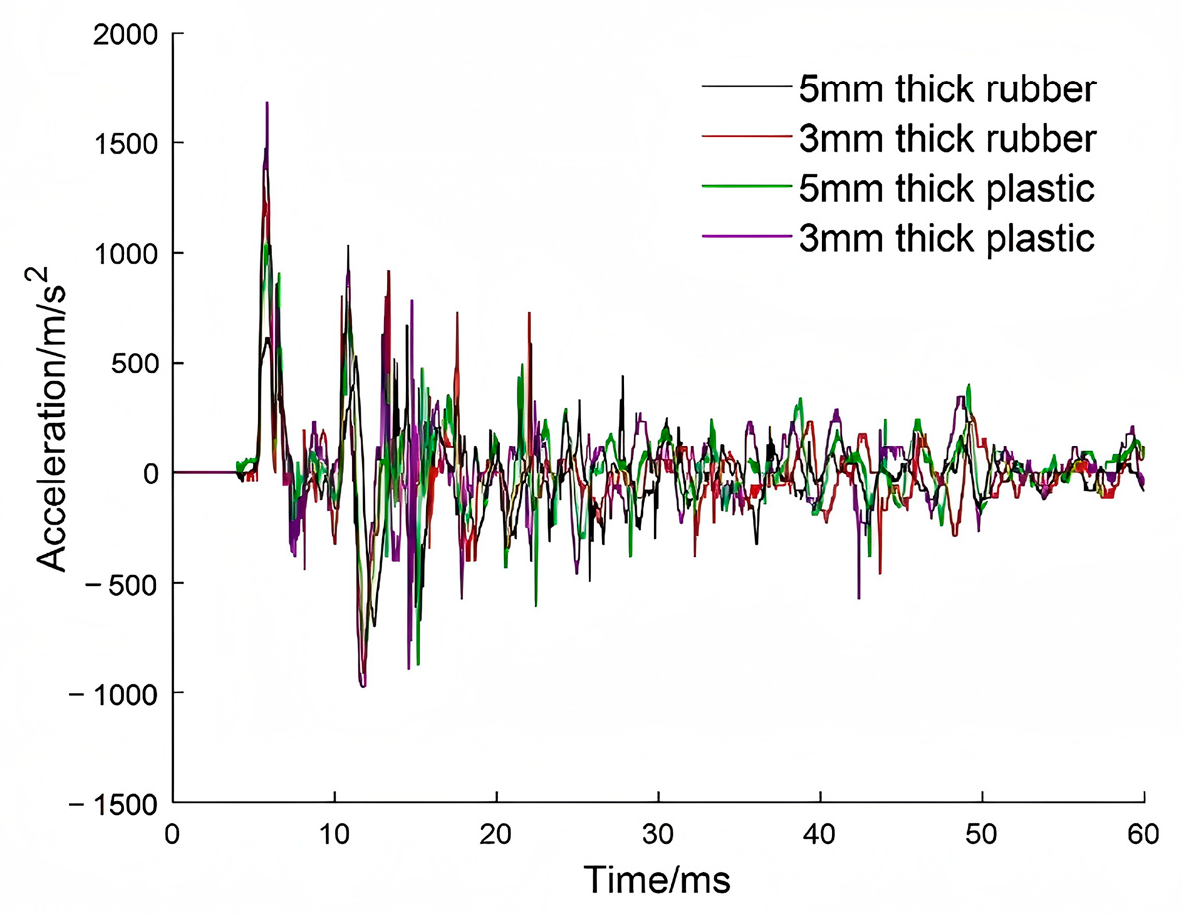
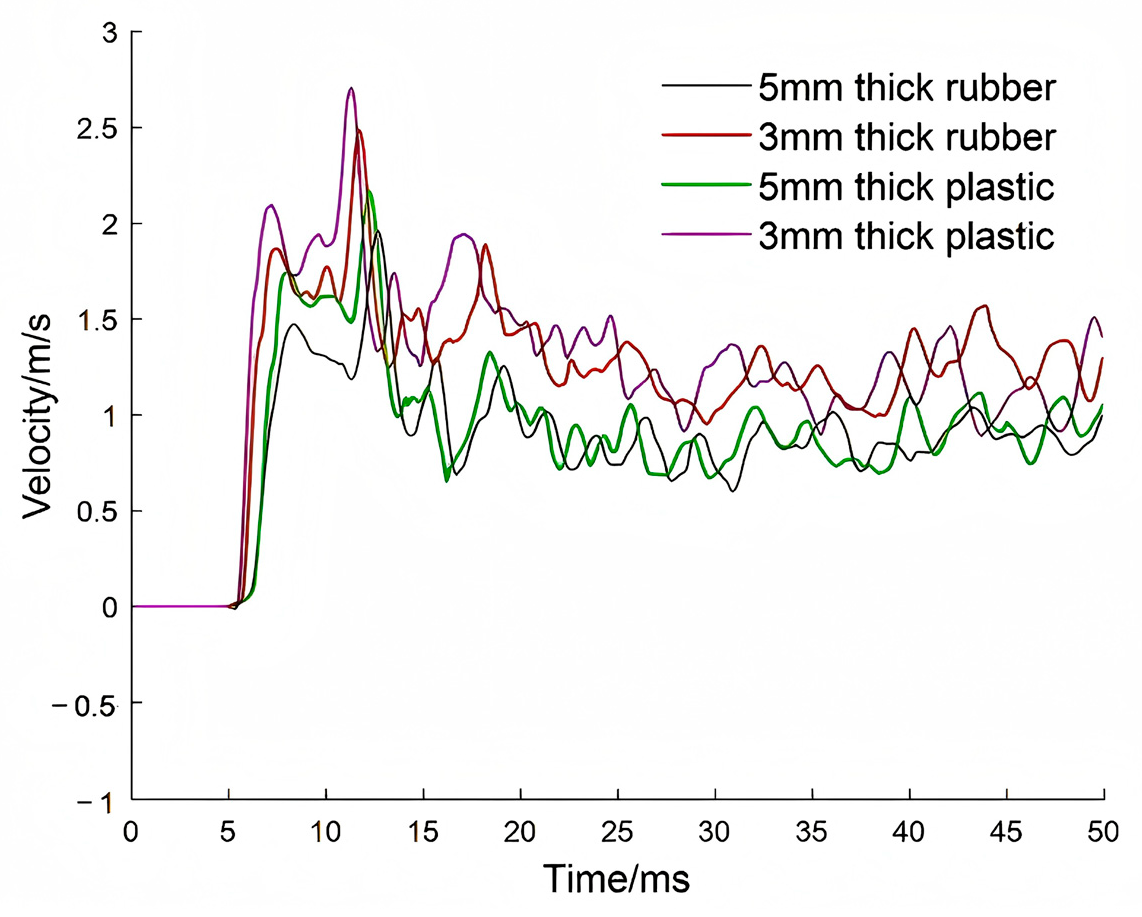
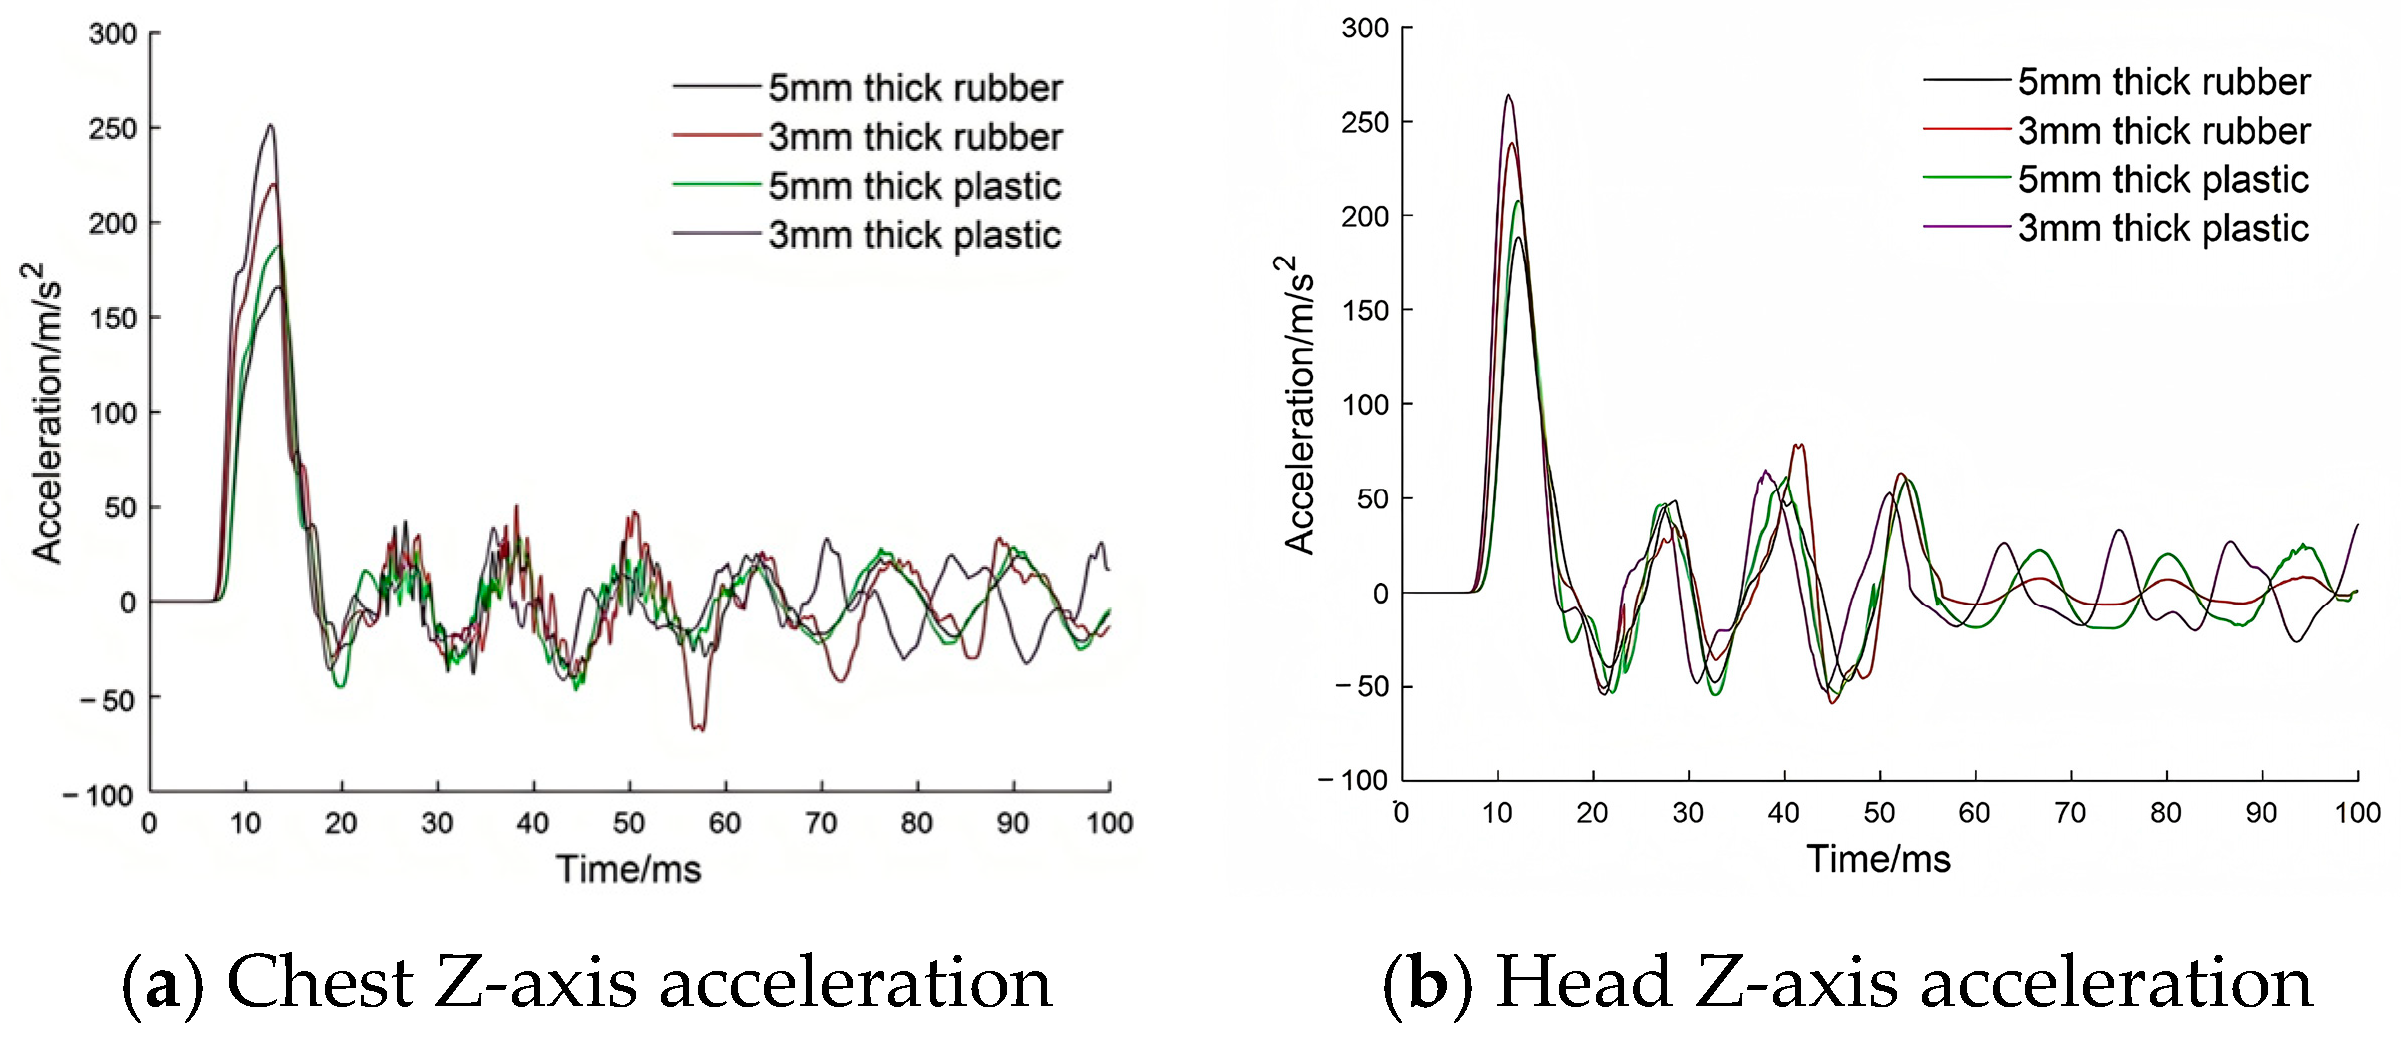
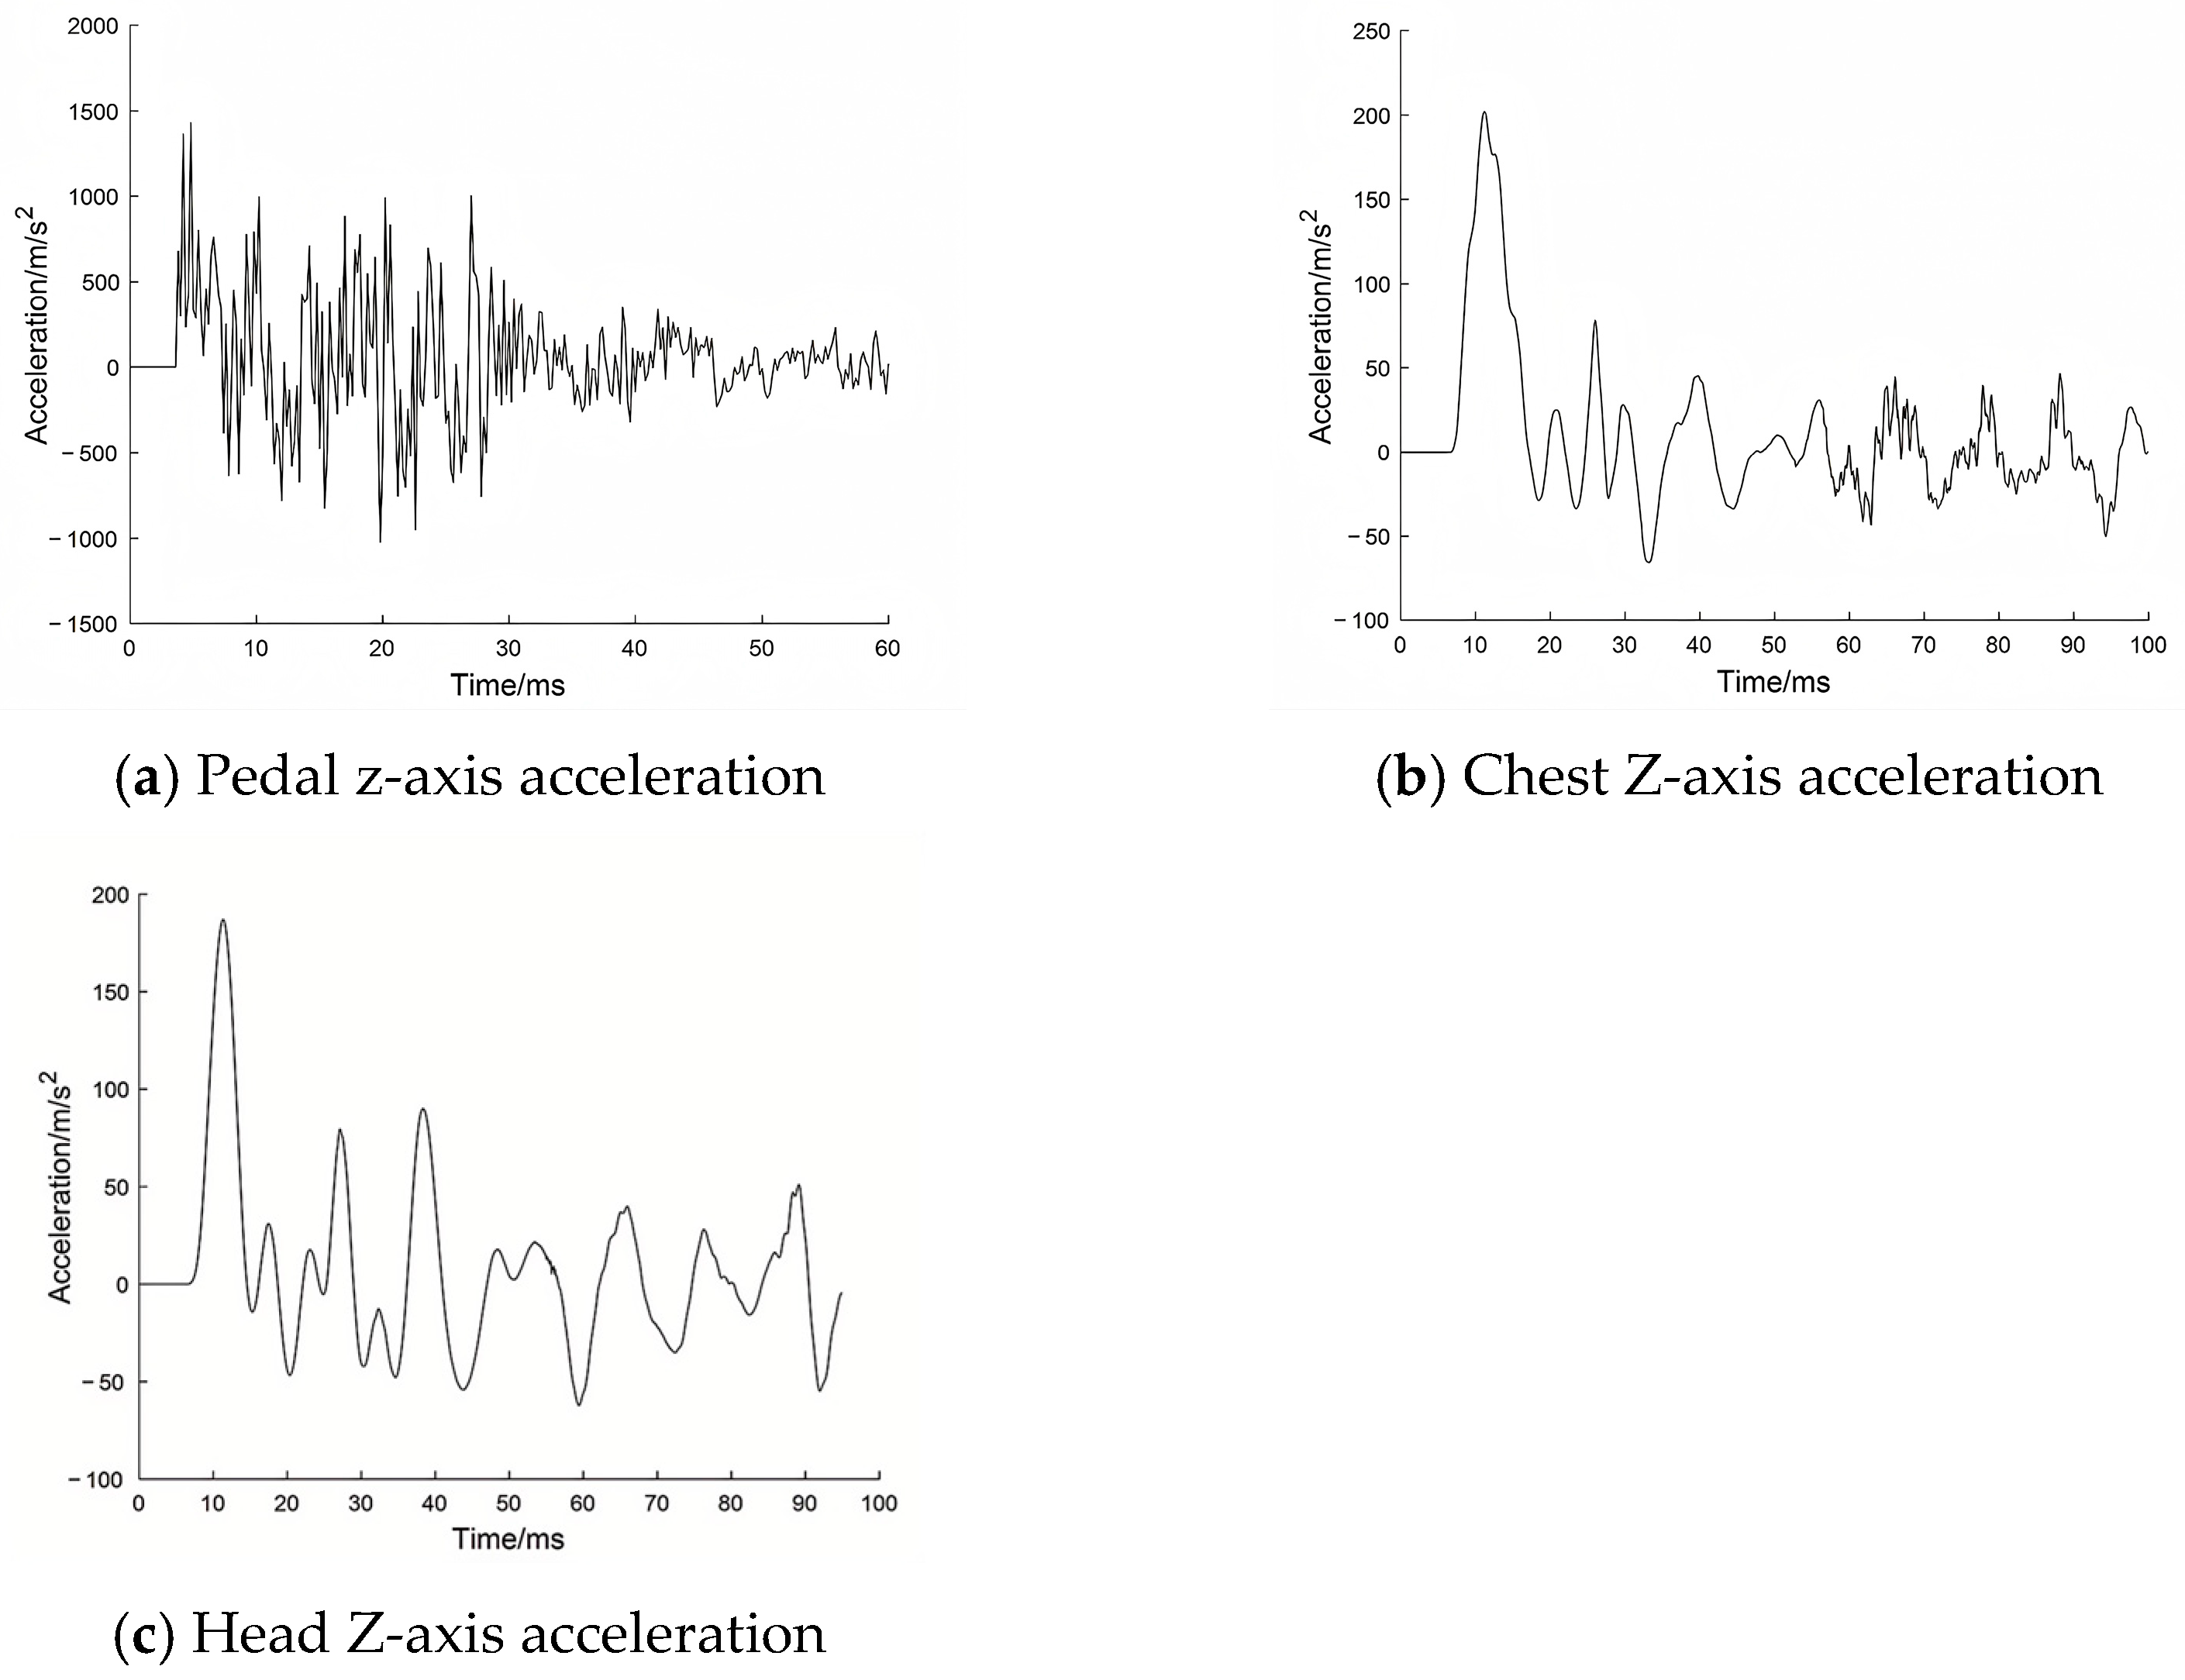
Figure 1, loading is applied to the pedal of the simplified dummy using the pendulum. Acceleration signals from the chest and head of the simplified dummy serve as inputs for the 1D-CNN, while the signals from the accelerometer mounted on the pedal are used as inputs for the Hybrid III FEM. The calibrated head acceleration and upper neck axial force are derived from the computations performed by the 1D-CNN. A comparison is made with the results from the Hybrid III model, and the error is computed. If the error is within acceptable limits, the optimal parameters of the modified model are retained. Otherwise, NSGA-II generates a new set of parameters (CNN’s filters and biases), and the process is repeated. The model is ultimately validated using TNT explosion test. The simple dummy tests the response in an explosive environment, and after the network with training parameters calculates and outputs the calibration value. The accelerometer signals from the test rig are used as inputs for the Hybrid III FEM, with the Hybrid III FEM serving as the reference.
Although the simple dummy is not equipped with a neck force transducer, making it impossible to test neck forces, the relative movement changes of the chest and head can reflect the changes in upper neck force. The mapping test model can map the acceleration of the chest and head to the axial compression force of the upper neck of Hybrid III 50th FEM.
Due to the inherent instability of energy release in explosive detonations, using explosive charge as input for finite element models introduces considerable uncertainty. As a result, this study focuses on the measured pedal acceleration as the key input parameter. Although using the pedal acceleration measured during testing as the input for the finite element model neglects the impact of local pedal deformation, since the head and neck do not directly interact with the pedal, the effect of local pedal deformation on the head–neck response is negligible.
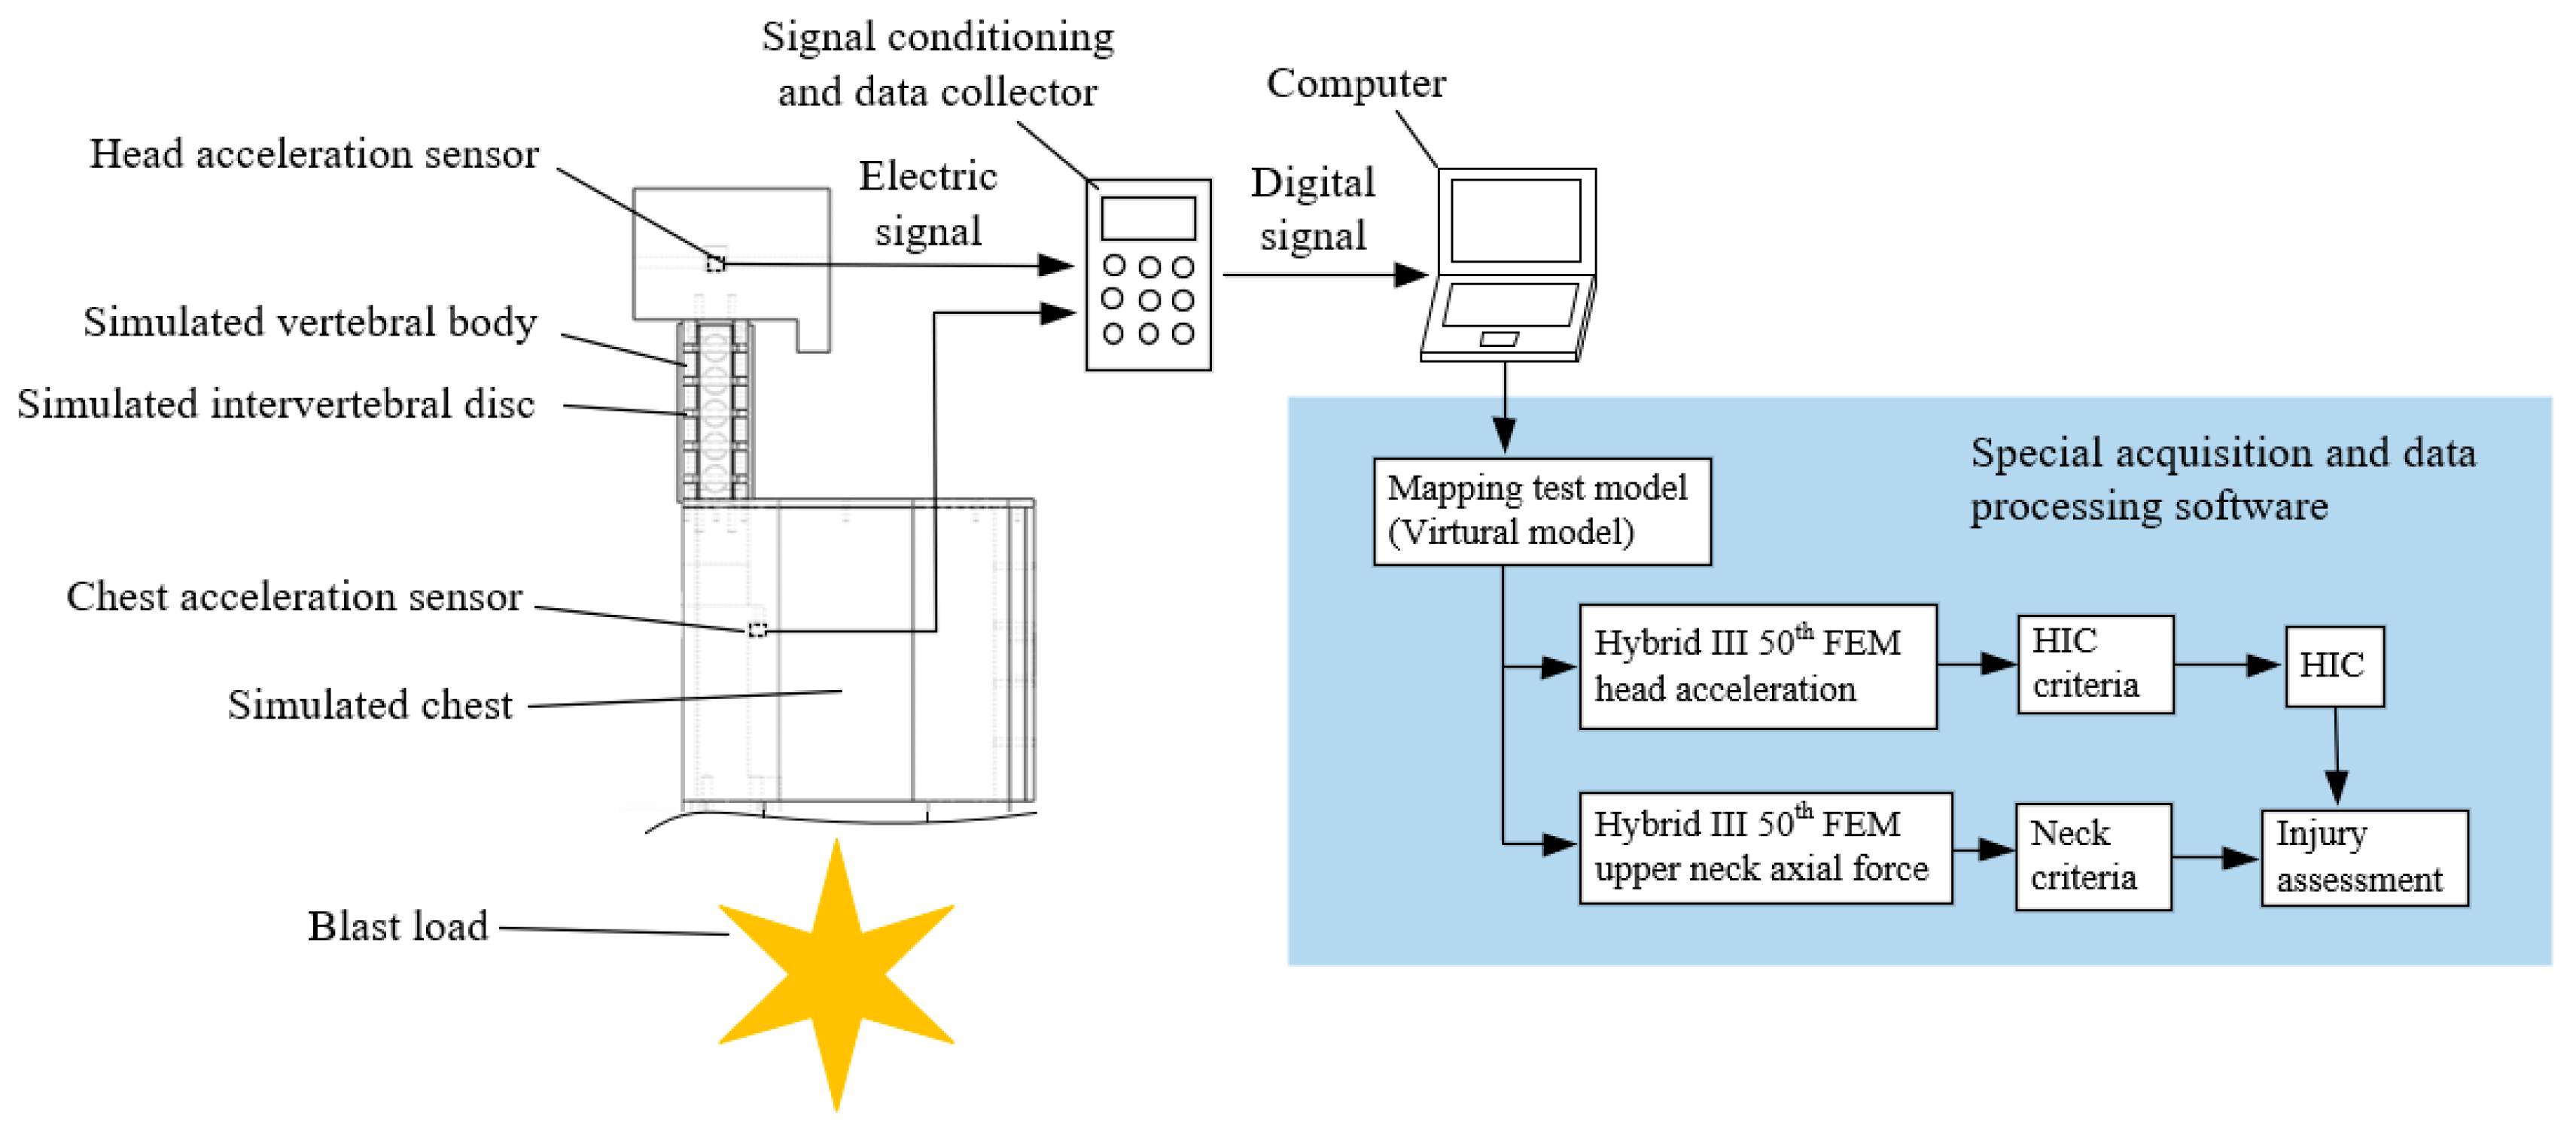
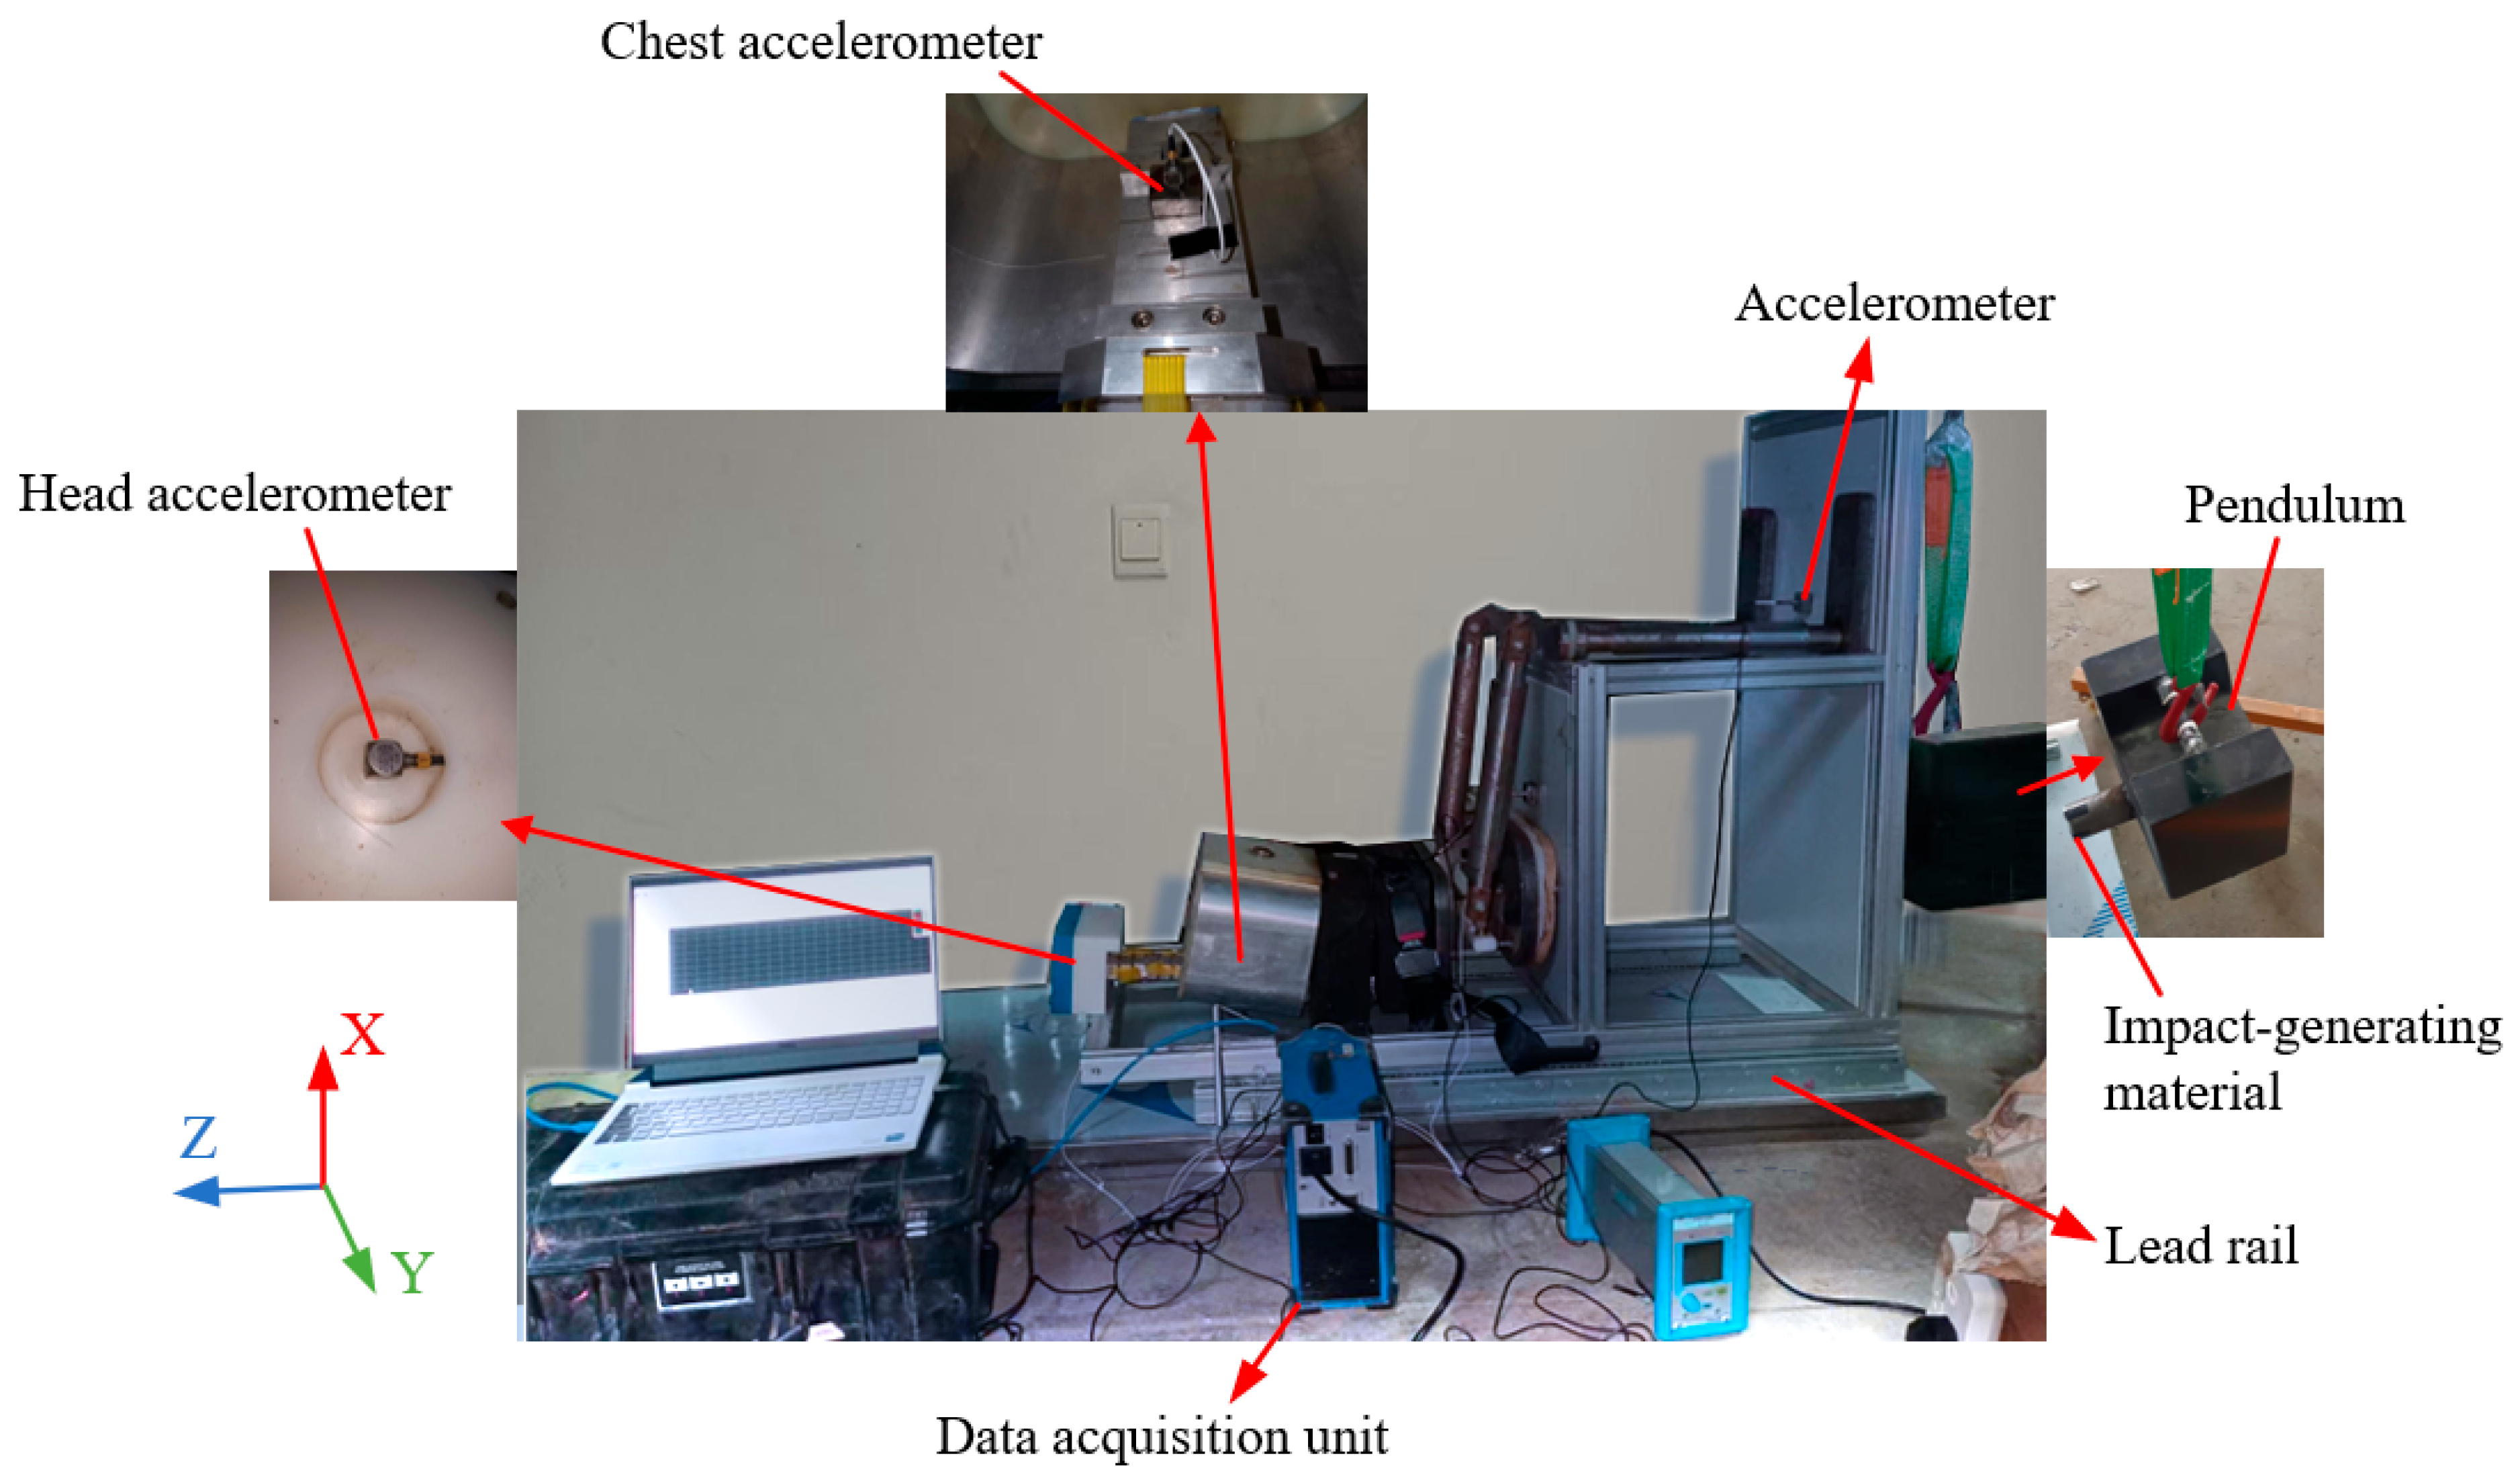
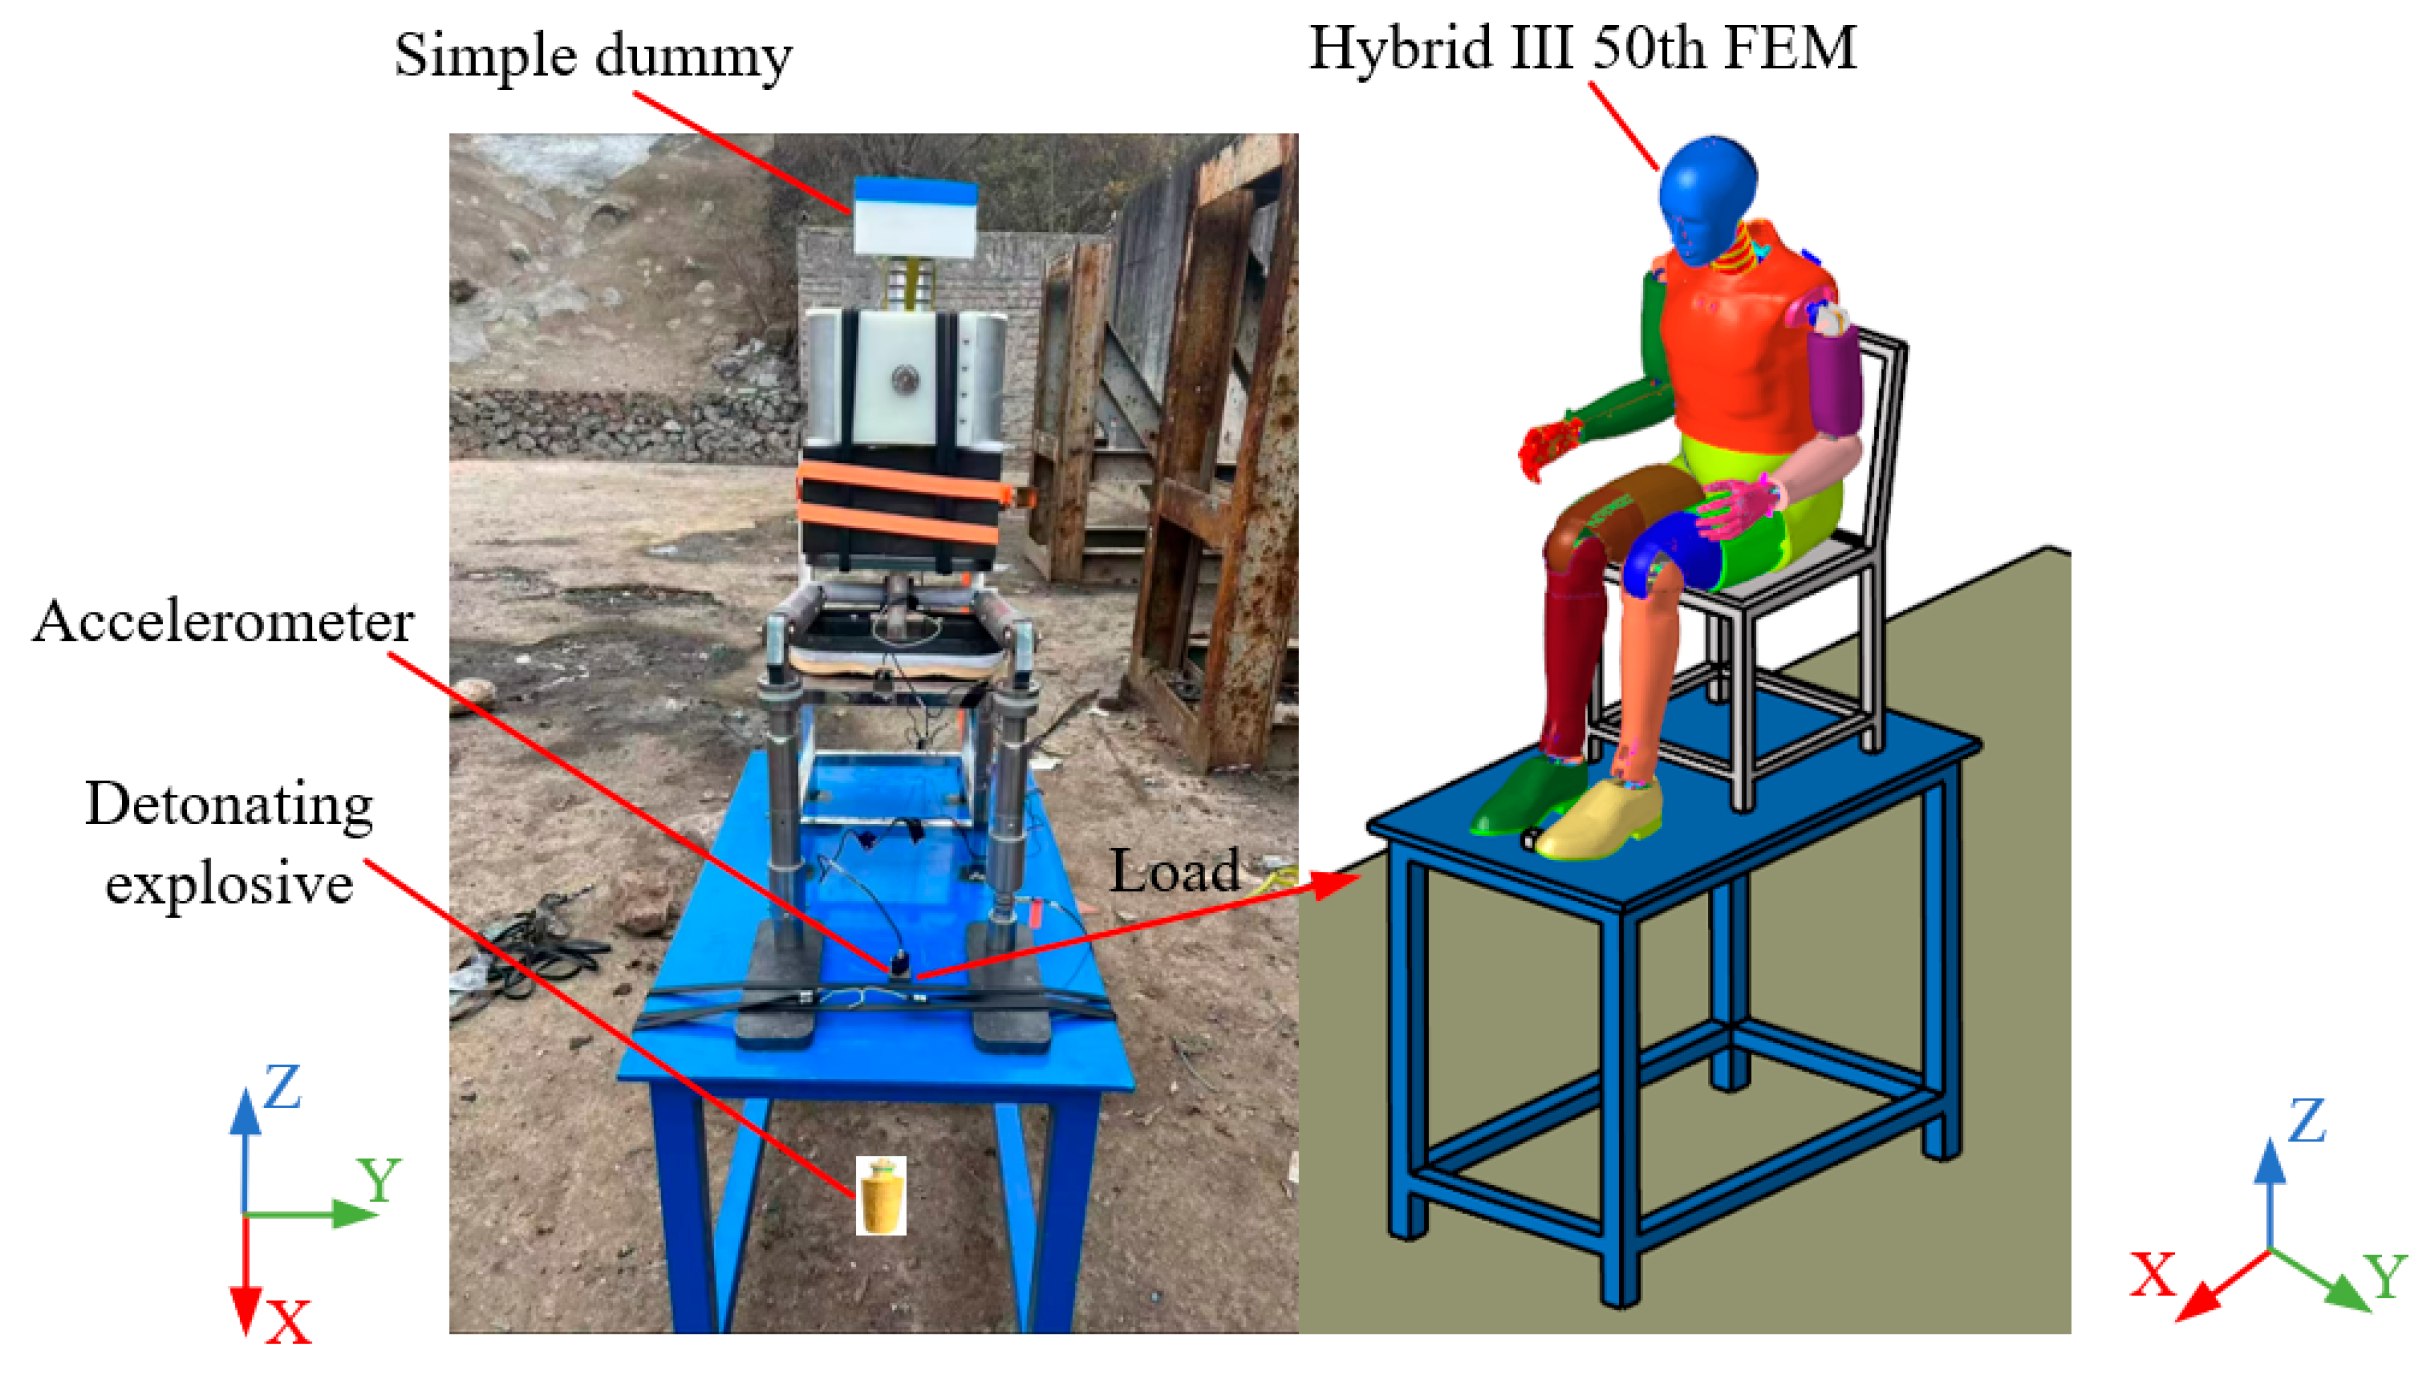
In the practical application of this system. The composition of the test system is shown in Figure 2. The system includes a simple dummy (built-in head–neck physical model), accelerometers, signal conditioning and data collector, and special data acquisition and processing software. The software integrates a virtual model- head–neck injury mapping test model. When the explosion occurs, it will impact the dummy, resulting in a violent movement of the chest and head. The acceleration sensors installed at the centroids of the chest and head record the acceleration signals. These acceleration signals are transmitted through the signal line to the signal conditioning and data collector, and converted into digital signals. Then they are passed to the special data acquisition and processing software. Through the mapping test model in the software, the measured chest and head acceleration signals are mapped to high biofidelity dummy head–neck response, which is the head acceleration and upper neck axial compression force of Hybrid III 50th FEM. Finally, the injury results were evaluated according to the HIC criterion and the neck injury criterion.

Relationship Between the Pendulum and Explosive Impact

Pendulum impact tests can generate short-duration, high-intensity impact forces, making them suitable for studying the response of structures or the human body under instantaneous loading. In certain cases, this loading method can approximately simulate the effects of blast impacts. Draganić [28] introduced various methods and devices for blast load testing and impact simulation, including laboratory techniques such as pendulum impact testing.
Pendulum-based simulation of blast loading relies on the assumption that the force applied by the pendulum to the pedal is equivalent to the force generated by the explosive event. The force exerted by the explosion on the pedal is estimated using the following method.
The following results show the peak impact force exerted on the bottom of the human corresponding to the simulated explosion.
Hopkinson, in his investigation of explosive phenomena, identified that blast effects scale with the cube root of the charge mass, thereby introducing [29]:
Z = R W 1 / 3
Here, W is the TNT equivalent in kg, and R is the distance from the detonation point in m.
For hemispherical surface bursts, the empirical formulae for the peak overpressure (in MPa) was proposed by Newmark and Hansen [30]. This equation applies to surface bursts, where the peak overpressure is typically higher than that of air bursts due to the enhancement caused by reflected waves and ground coupling effects.
P s = 0.6784 Z 3 + 0.294 Z 3 / 2
This study focuses on scenarios with sufficiently large scaled distances, where the shock front may be reasonably approximated as planar. For simplification, the blast load on the vehicle bottom was assumed to be uniformly distributed, the force peak (in N) of blast acting on the pedal is given by
F s = P s · S
S represents the surface area of the bottom of the vehicle that is exposed to the blast in mm2.
The following derivation establishes the relationship between the impact force exerted by the pendulum on the pedal and the pendulum parameters. Applying the law of conservation of energy yields the velocity of the pendulum at its lowest position:
v = 2 g h
The pendulum’s kinetic energy at the lowest point can be calculated as follows:
E k = m 2 g h
According to the impulse–momentum theorem, the average force acting on the pedal can be calculated by dividing the total impulse by the contact time:
F a v g = E k Δ t = m 2 g h Δ t
where m is the mass of the pendulum in kg, h is the drop height of the pendulum in m, Δ t is the force duration (or contact time) in s.
Assume that the maximum force is related to the average force by the following expression:
F max = α · F a v g
The value of α is determined by the material properties and shape of the pendulum head.
By equating the maximum force generated by the explosive impact to the maximum impact force of the pendulum, we obtain
0.6784 Z 3 + 0.294 Z 3 / 2 · S = F max
0.6784 W R 3 + 0.294 W R 3 · S = α m 2 g h Δ t
The Equation (11) indicates that, for a fixed explosion distance, increasing either the pendulum mass or its release height results in a higher equivalent simulated explosive yield.
Given the difficulty in determining the coefficient α , an accelerometer is installed on the pedal to measure the acceleration peak. Subsequently, the peak force can be calculated as induced by the pendulum, and the scaled distance corresponding to the simulated blast is subsequently calculated using the Expression (10). The schematic diagram of the pendulum impact is shown in Figure 3.

3. Head–Neck Physical Model

The structure of the human head–neck is complex, comprising cervical vertebrae, muscle groups, blood vessels, lymphatic tissues, and other anatomical constituents. It is considerably difficult to fully replicate the structure of the head–neck. The head–neck structure of a simple dummy should have the ability to recognize damage while having a relatively simple structure. The component primarily responsible for head–neck movement is taken into consideration. The cervical spine, serving as the principal load-bearing structure of the neck, is composed of seven cervical vertebrae, six intervertebral discs, and ligaments [31]. The intervertebral discs separate the vertebrae and possess a high degree of compressibility, which endows the cervical spine with flexibility. In addition, the intervertebral discs function as a damping mechanism.

3.1. Structure and Material

Mature dummies on the market, such as the Hybrid III and Thor. Necks are constructed from alternating layers of rubber and metal components, which facilitates the neck’s bending and stretching motions, while a steel cable positioned within the central bore of the neck ensures the overall structural integrity. Guided by the characteristics of the human and mature dummy neck, efforts are made to ensure that the simplified dummy’s head–neck structure is capable of recognizing damage while remaining easy to manufacture, assemble, and disassemble.
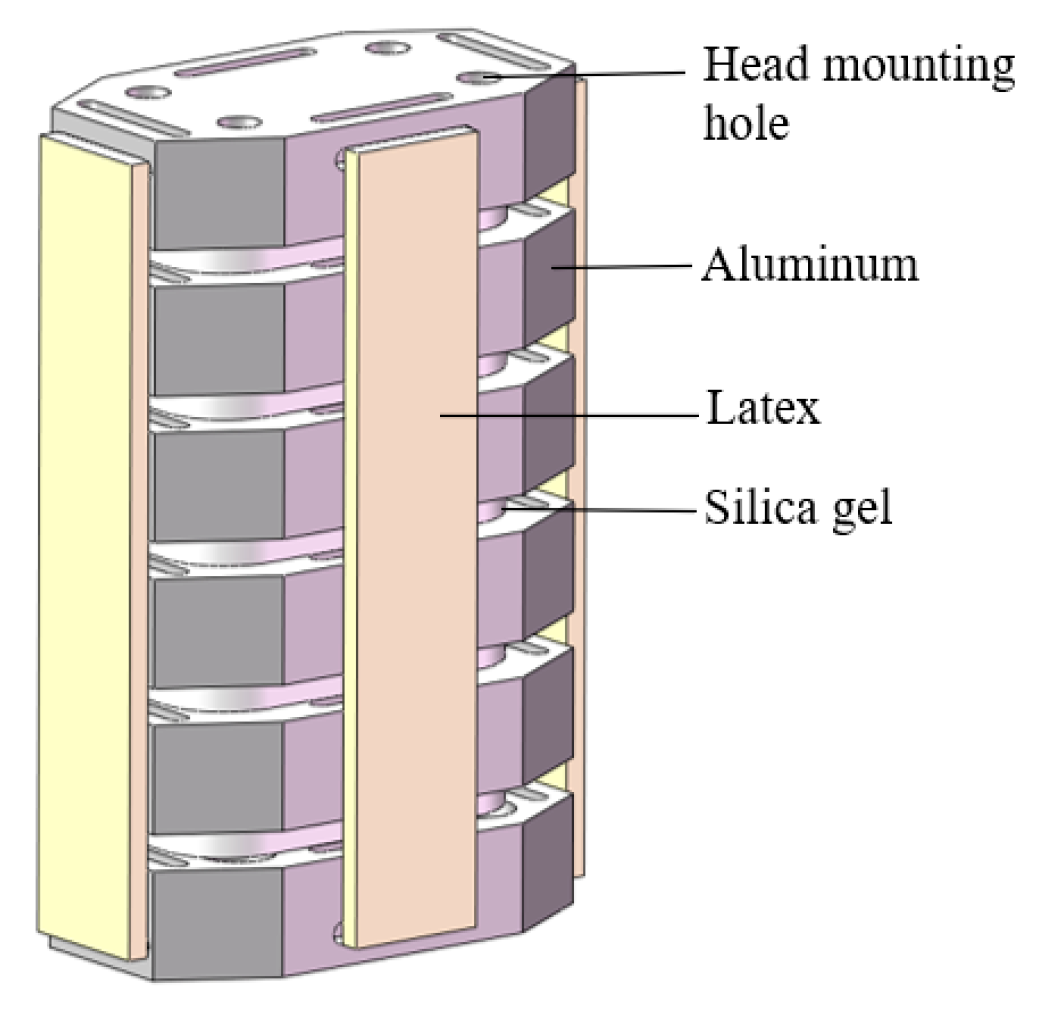
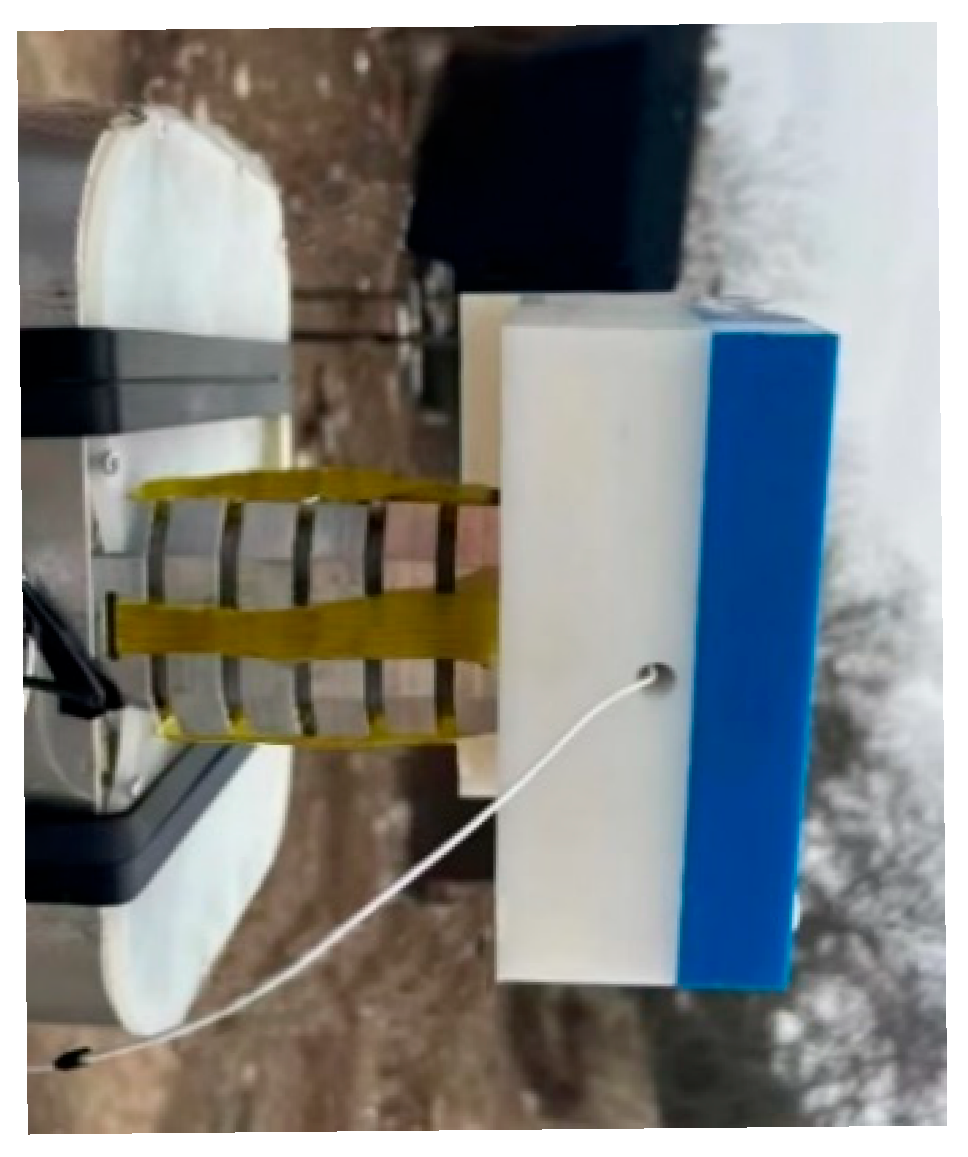
Figure 4 shows the neck structure of the simplified dummy, which is composed of simulated vertebral bodies and intervertebral discs stacked together and surrounded by four symmetrically distributed latex straps with simulated ligaments. The simulated vertebral bodies are made of aluminum with high rigidity. The simulated intervertebral discs are made of silicone, which offers greater elasticity and damping compared to aluminum. These components are tightly fit and secured by latex straps. The latex straps allow for the adjustment of the overall equivalent stiffness and damping of the cervical spine within a small range by varying their tension.
The head of the simplified dummy is primarily designed to simulate the mass of the human head. The head is constructed from PVC with a mass of 4.5 kg. As shown in 
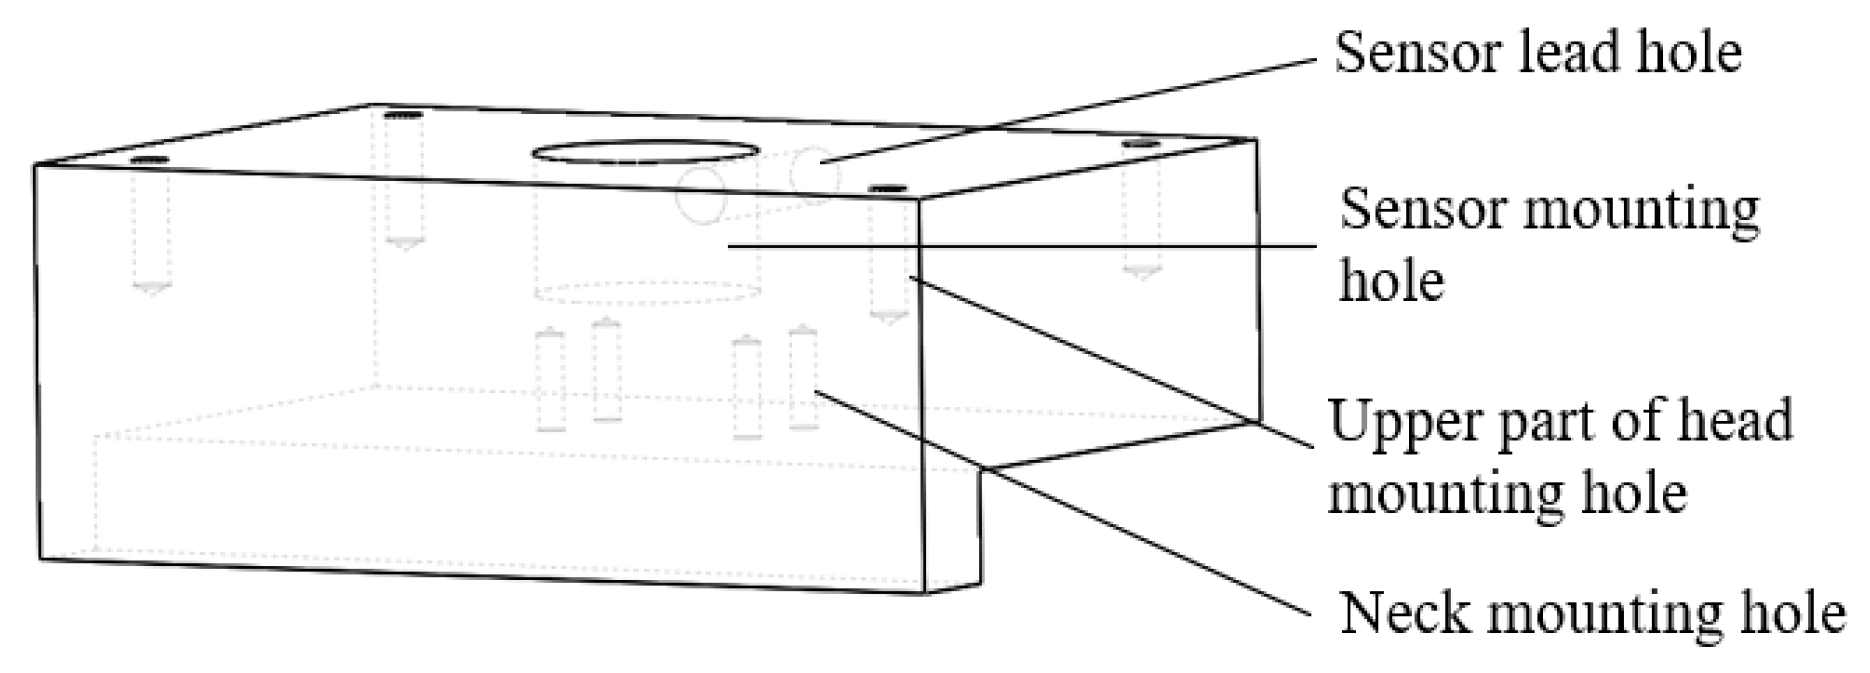
Figure 5, the head consists of upper and lower segments connected by screws, which can be disassembled for sensor installation. A threaded mounting hole is provided at the center of mass to accommodate an accelerometer. This accelerometer is used to measure the head’s acceleration under impact loading. A dedicated hole is included for routing the signal lines from the accelerometer. Figure 6 displays the physical model of the head–neck structure. Four threaded counterbores are machined into the topmost and bottom vertebral bodies, serving as reserved screw holes for threaded connections between the neck and the head and thorax.
Section 5.4 will verify the structure’s ability to identify response variation by calculating the correlation.

3.2. Physical Model Properties

Given that the Hybrid III 50th high-biofidelity dummy serves as the reference in this work, the simplified dummy is designed to replicate its characteristics as closely as possible. In 1988, Kaleps conducted measurements of the mass, moments of inertia, center of gravity, and joint coordinates of various segments of the Hybrid III 50th dummy [32]. The study included the joints’ local coordinates defined relative to the segmental center of gravity and the corresponding transformation matrices from the principal to the local reference coordinate systems. The global coordinate system was defined with its origin at the center of gravity of the thorax, and the global coordinates of all body segments were subsequently calculated. 
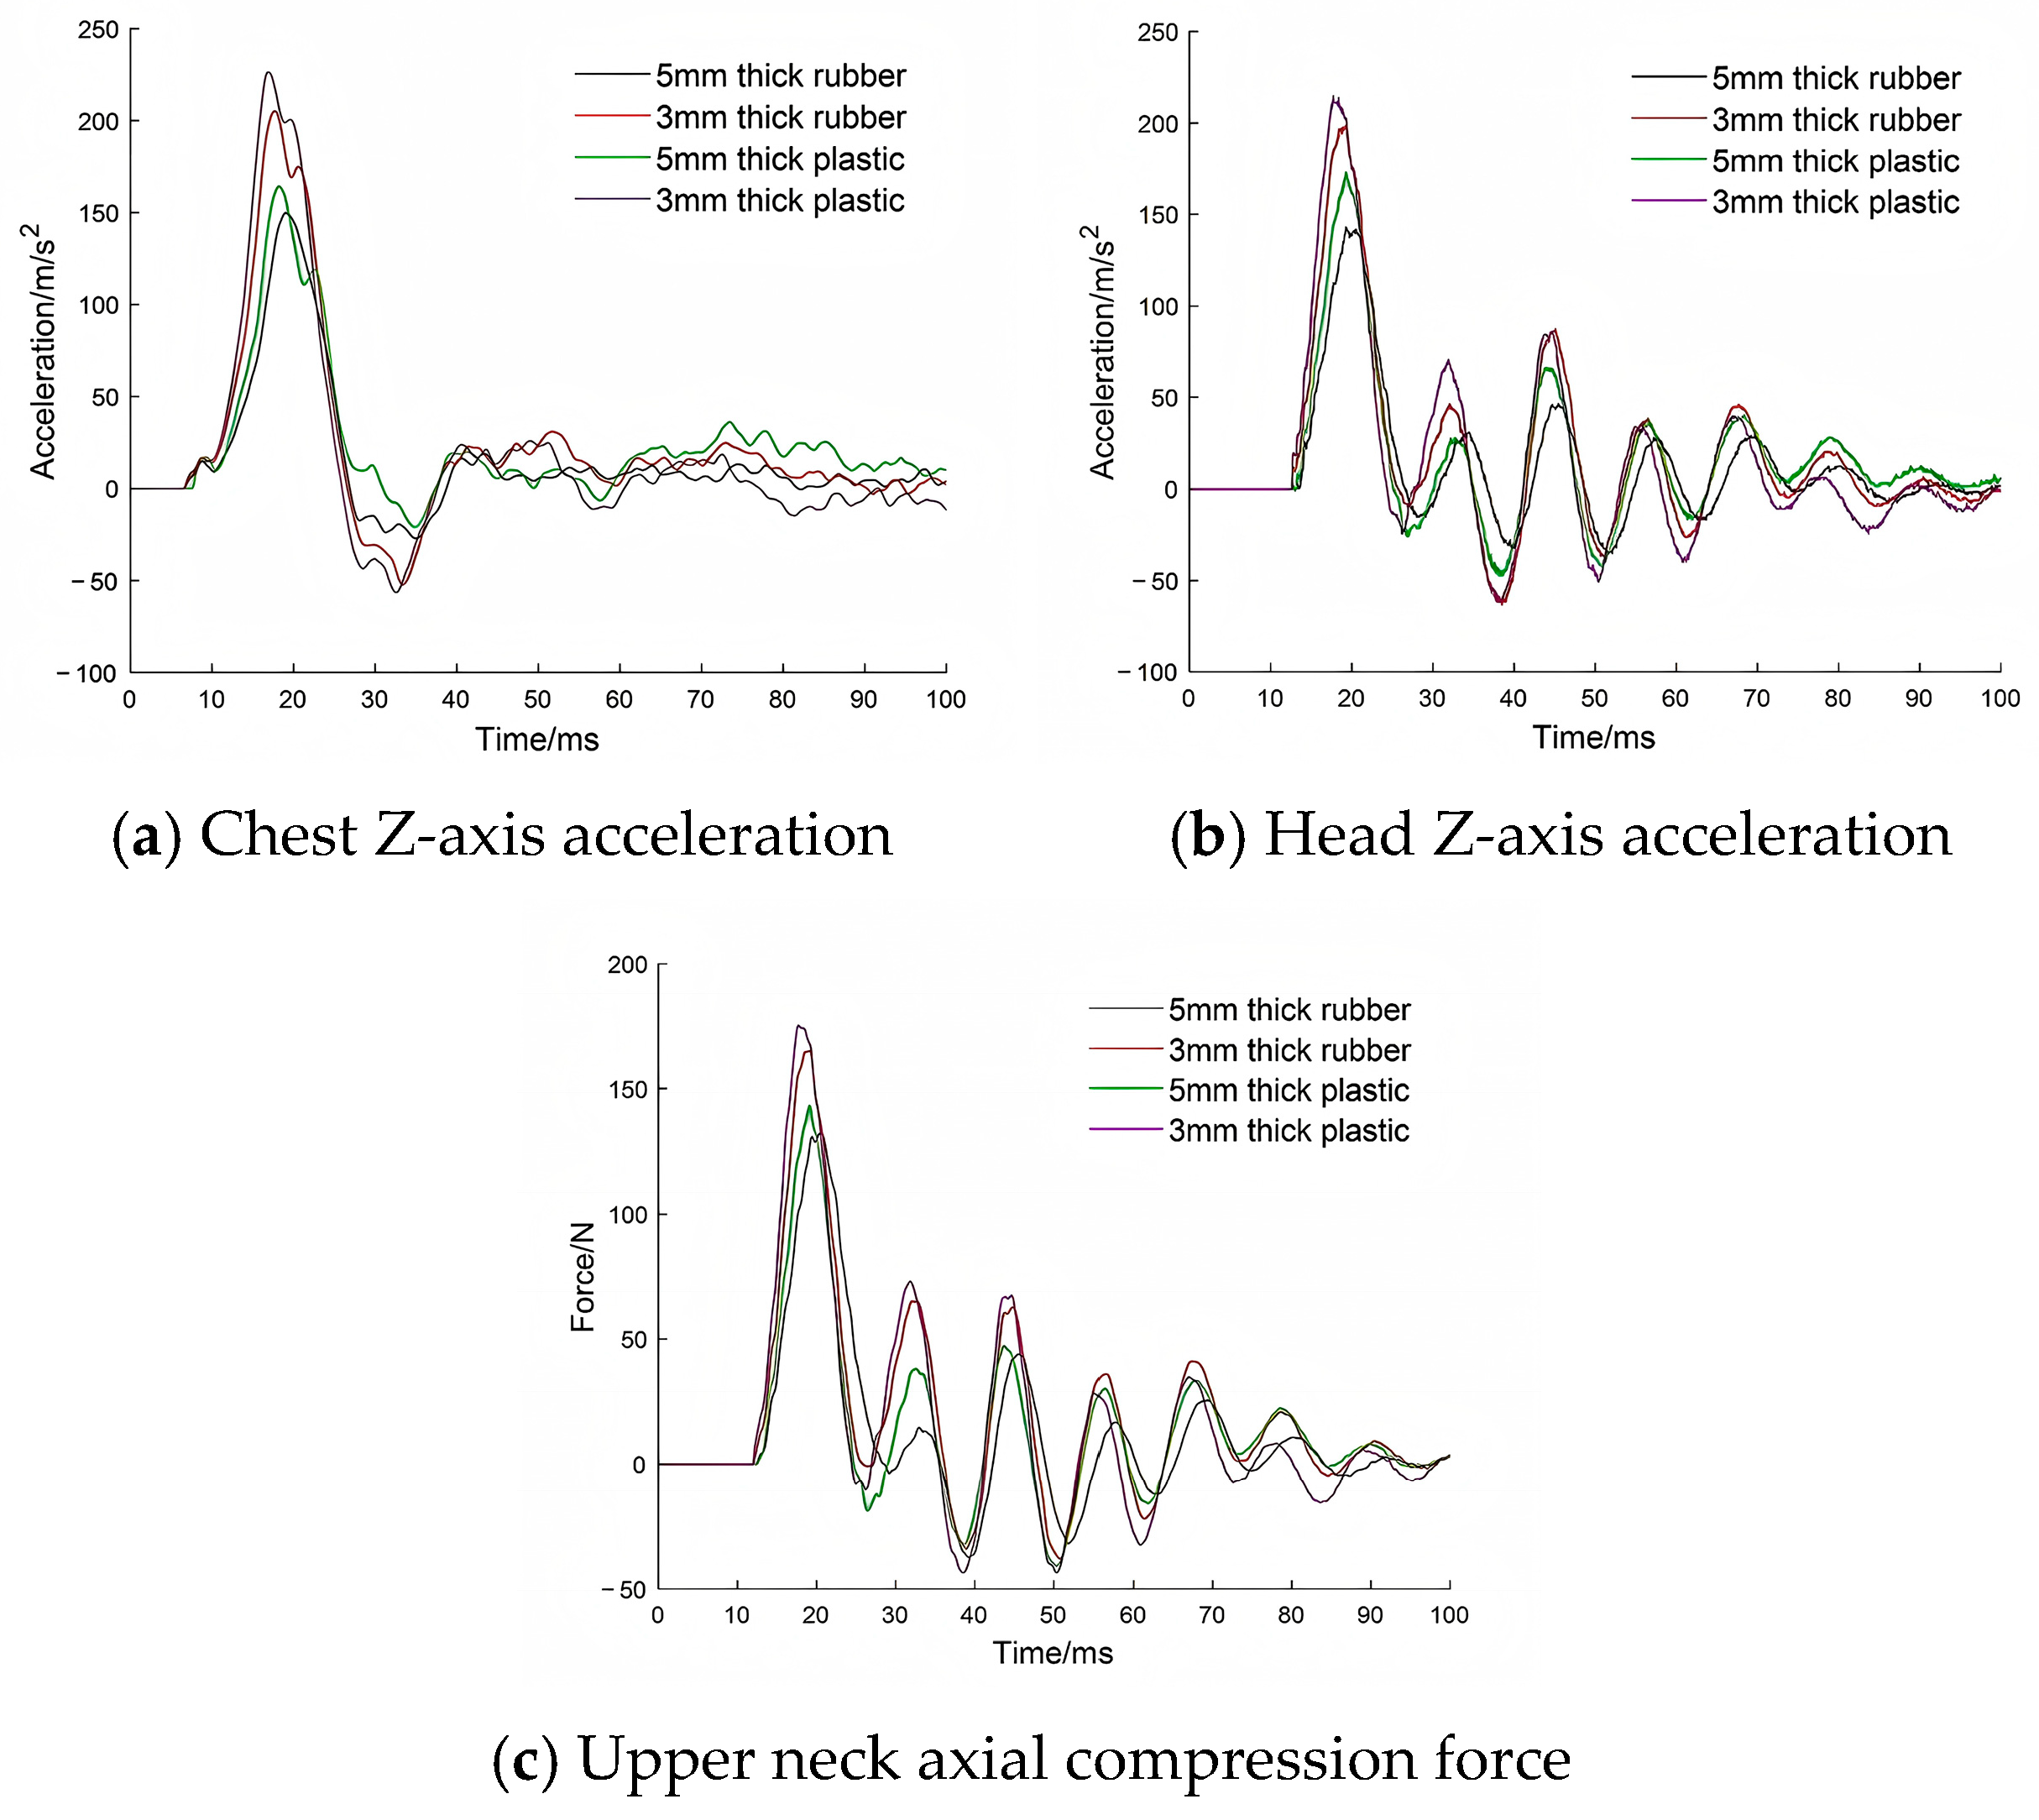
Table 1 compares the mass, center of gravity, and joint coordinates of each segment in the head–neck structure between the simplified dummy and the Hybrid III. The deviation in segmental mass remains below 12.3%, while the discrepancies in center of gravity and joint locations are within 17.1%.
In head–neck biomechanical analysis, the neck is a critical structure for force transmission and kinematic coupling between the head and torso. Its mechanical properties significantly influence the head’s inertial response and injury risk. As a result, accurate representation of neck characteristics is essential for reliable evaluation of head–neck dynamics under impact or blast conditions. Material properties for the vertebral bodies and intervertebral discs were obtained from the LSTC Hybrid III FEM and compared against those of the simplified dummy, whose parameters were supplied by the manufacturer. In the finite element model, the vertebral bodies are made of aluminum and modeled using a linear elastic constitutive equation, while the intervertebral discs are represented by rubber with a viscoelastic constitutive model. In the simplified dummy, the vertebral bodies are also made of aluminum, whereas the intervertebral discs are made of silicone. According to the comparison results in Table 2, the material properties of the vertebral bodies are identical, as both use aluminum. However, significant differences are observed in the intervertebral discs: the simplified discs are softer and exhibit greater damping. To achieve a balance, the thickness of the simplified discs was reduced.
Although the segmental mass and center of gravity of the simplified dummy were designed to closely match those of the Hybrid III 50th, significant differences remain due to the use of low-cost materials, and moments of inertia were not considered. Therefore, a mapping model based on a 1D-CNN was developed to reduce these discrepancies.

4. Mapping Test Model

Consider the contradiction between the degree of simulation, materials, and cost of a simple head–neck structure. To improve the test accuracy, a mapping test model trained by Hybrid III 50th FEM was constructed. The mapping relationship between the responses of two dummies was established based on the multi-channel 1D-CNN model. Employing the NSGA-II algorithm, the model parameters were optimized.

4.1. Multi-Channel 1D-CNN Model

The mapping test model adopts 1D-CNN architecture [33,34]. CNNs perform exceptionally well in processing sequential data due to their ability to capture temporal information and local correlations within the data [35]. The convolutional operation in CNNs involves scanning the entire input with filters, which allows weight parameters to be shared across different positions. The mapping test model consists of three main components: the input, the filter, and the output. The output is generated by convolving the input sequence with the filter.
As shown in Figure 7, multiple sets of simulated impact tests were conducted on the simple dummy to test the acceleration signals of the simple dummy’s chest and head, which were used as inputs of the 1D-CNN model. The measured load signal is taken as the finite element model boundary condition, and the head acceleration and upper neck force of Hybrid III 50th FEM are calculated. Optimize the 1D-CNN model filter and bias until the model output responds to match the Hybrid III 50th FEM. To reduce the number of optimization parameters, a pooling layer is set after the input layer, and the data after maximum pooling participates in the convolution operation. (For pooling formula, see (12), and for convolution formula, see (13).) Then, the error of the output layer with Hybrid III 50th FEM under the same loading is calculated. When the error is within the acceptable range, the optimal parameters are output. Otherwise, the NAGA-II generates a new parameter sample of the convolution layer:
y i j 1 = max u = 1 w ( a i , j + u 1 ) y i j 2 = max u = 1 w ( a i , j + u 2 )
a i j 3 = s = 1 k ( y i , j + s 1 · h s 11 + y i , j + s 2 · h s 21 ) + b j 1 F i j = s = 1 k ( y i , j + s 1 · h s 12 + y i , j + s 2 · h s 22 ) + b j 2 j = 1 , 2 , , n k ;   s = 1 , 2 , , k
a i j 1 represents the j-th data point of the chest acceleration input of the model in the i-th group of experiments, a i j 2 represents the j-th data point of the head acceleration input of the model in the i-th group of experiments, a i j 3 represents the j-th data point of the head acceleration output of the model in the i-th group, F i j represents the j-th data point of the axial upper neck force output of the model in the i-th group of experiments, n is the length of the data, w is the size of the pooled window, k is the length of the filter, h s t v represents the s-th data point of filter in the t input channel and the v output channel, and b j v represents the j-th data point of bias in the v output channel.

4.2. NSGA-II Optimization

To ensure that the model outputs meet expectations across multiple sets of simulation trials, a multi-objective optimization algorithm is employed to optimize the model parameters. By minimizing the error between the output results of multiple data sets and the reference values, the optimal parameters are obtained. As shown in the Figure 8, NSGA-II [36,37] loops through the interval to generate the parameters until the multiple objective function Y is minimized and the sum satisfies the condition as the optimal parameter of the mapping test model. NSGA-II is a multi-objective optimization algorithm, which is used to solve optimization problems with multiple variables and multiple objective functions. The steps include population initialization, non-dominant sorting and crowding allocation, selection operation, crossover and variation, recombination, and selection. Repeat the above steps, iterating over the parameters of the model until convergence reaches a satisfactory solution set. Three types of errors—delay error, amplitude error, and shape error—are considered as the three optimization objectives [38].
The cross-correlation was used to obtain the delay error, which was originally used by Liu to evaluate the error in the output of the MADYMO model [39,40]. Suppose there are two signal sequences, a i , b i   i = 1,2 , 3 , . . .   , n . The cross-correlation r at the delay d can be expressed as
r ( d ) = i [ a i μ a ] [ b i d μ b ] i ( a i μ a ) 2 i ( b i μ b ) 2
where μ a is the average value of a i , μ b is the average value of b i .
When r is the largest, d is the delay of the signal, and the delay error is obtained by Formula (16):
r ( d 0 ) = max ( r ( d ) )
ε p = d 0 · Δ t
Δ t is the signal sampling period.
The amplitude error is defined as the relative error of the norms between the two sets of sequences, expressed by the following equation:
ε m = a i b i b i
The shape of the sequence is represented by the slope of the two sets of sequences, and the shape error is defined as
ε s = | a i · b i · | | b i · |
Before using NSGA-II to optimize the parameters, the search range of the parameters needs to be determined, and the model output range should cover the destination value, so the sum range is set as follows:
min Y = ( ε p ε m ε s ) max ( s = 1 k ( y i , j + s 1 · h s 11 + y i , j + s 2 · h s 21 ) + b j 1 ) max ( a i j F E M ) min ( s = 1 k ( y i , j + s 1 · h s 11 + y i , j + s 2 · h s 21 ) + b j 1 ) min ( a i j F E M ) max ( s = 1 k ( y i , j + s 1 · h s 12 + y i , j + s 2 · h s 22 ) + b j 2 ) max ( F i j F E M ) min ( s = 1 k ( y i , j + s 1 · h s 12 + y i , j + s 2 · h s 22 ) + b j 2 ) min ( F i j F E M ) j = 1 , 2 , , n k ;   s = 1 , 2 , , k
where a i j F E M 3 is the head acceleration calculated by the finite element model, and F i j F E M is the axial compression force of the neck calculated by the finite element model.
Since it was observed that the response of Hybrid III 50th FEM is delayed compared to the simple dummy, reversing the objective data in time can significantly reduce the convergence time.

5. Simulated Experiment and Model Optimization

5.1. Experimental Setup

To obtain more data for model training, a simulated experiment was designed, as shown in Figure 9. Considering that the occupant is damaged by the impact for a short time, the experiment simulates the under-body blast impact on the dummy through the pendulum collision on the pedal. The pendulum was raised to a certain height and released, and it obtained certain kinetic energy during the falling process and then collided with the pedal. The lead rail ensures the holistic motion of the dummy. By adjusting the height of the pendulum, various amplitudes of impact can be obtained. By replacing the waveform-generating material of the pendulum and changing the thickness of the material, the time-to-velocity peak can be regulated. Besides, the measurement range of the sensors is 2000 g. The sampling rate of the data acquisition unit is 100 kHz. Data were processed by CFC1000, SAE J211 [41]. The acceleration of the pedal tested by the sensor was loaded to the pedal of the finite element model, as shown in Figure 10. The responses of the Hybrid III 50th numerical model were calculated as optimization targets.

5.2. Results and Discussions

Figure 11 shows the acceleration signals of the pedal under 4 groups of impact with two kinds of materials and thicknesses. Figure 12 shows the pedal velocity after integrating the acceleration signal. From Figure 12, it is observed that after the pendulum collides with the pedal, the velocity of the pedal increases rapidly. When the pedal touches the dummy, kinetic energy is released, and the velocity is reduced to a certain value and remains unchanged. Moreover, the lower the stiffness and the larger the thickness of the material, the longer the time of velocity to reach the peak. Figure 13a,b shows the z-axis acceleration signal of the simple dummy chest and head after the pendulum collision. The acceleration curves of Hybrid III 50th FEM were obtained after calculation, as shown in Figure 14a–c. To facilitate validation, the simulated bottom area of the vehicle S was set equal to the bottom area of the blast test rig in Section 6.1, with a value of 0.5 m2. The total weight of the dummy and the movable platform is 105 kg. The mass of the pendulum is 70 kg. According to the acceleration profile of the pedal and Equations (3) and (7), Table 3 summarizes the momentum of the pendulum and the scaled distance for explosive equivalence under different test conditions.
Through comparison, it was seen that the head acceleration peak of simple dummies obtained by simulated experiments was consistently higher than those of the Hybrid III 50th numerical model, while the width was smaller before processing by the mapping test model. This indicates that the head–neck physical model of the simple dummy exhibits higher stiffness and lower damping compared to that of the Hybrid III 50th FEM. To enhance the accuracy of the results, the direction for improvement of the simplified dummy is to reduce the stiffness of the neck physical model and increase its damping in the future.

5.3. Training

The data set of the simulation test is used to optimize the model parameters. The Pareto optimal set is derived from the multi-objective optimization problem [42], and the overall error is used to determine the representative solution. The overall error is expressed as ε o v e r a l l = ε p / 3 + ε m / 3 + ε s / 3 . Additionally, this study aims to identify a set of parameters that are adaptable to all operating conditions. If the average error is used as the convergence target, it may result in a situation where one condition is well-adapted while another is poorly adapted. Therefore, the maximum overall error among all operating conditions involved in the optimization is adopted as the loss, expressed as L o s s = max ( ε o v e r a l l ) . When loss no longer decreases, the iterative computation is stopped. Figure 15 illustrates the descent process of loss, where the first loss of the set decreases from 0.54 to 0.23, and the second loss decreases from 0.53 to 0.22.

5.4. Response Correlation

Figure 16 compares the responses of the simplified dummy and the Hybrid III FEM under the condition of 5 mm thick rubber. Although there is a difference in peak values, the waveform profiles are similar in the main peak region upon observation. To verify the ability of the simplified dummy head–neck mock-up to identify response variation, the correlation between the acceleration peak of the simplified dummy chest and head and those of the Hybrid III 50th FEM was calculated.
Spearman’s rank correlation is a statistical method used to measure the correlation between two sets of data [43]. First, the two sets of data are ranked, and then the following formula is applied for calculation:
ρ = ( m m ¯ ) ( n n ¯ ) ( m m ¯ ) 2 · ( n n ¯ ) 2
where m represents the first sequence, n represents the second sequence, m ¯ represents the average of the first sequence, and n ¯ represents the average of the second sequence.
The Spearman rank correlation coefficient ranges between −1 and 1. A value close to 1 indicates a strong positive monotonic relationship, a value close to −1 indicates a strong negative monotonic relationship, and a value close to 0 suggests no monotonic relationship.
The maximum chest and head centroid accelerations obtained from the pendulum impact tests were ranked and compared, as shown in Figure 17a,b. The acceleration peak of the simplified dummy head was higher than that of the Hybrid III 50th FEM under the same conditions; the growth trends were consistent. After calculation, the Spearman rank correlation coefficient between the chest acceleration peak of the simplified dummy and that of the Hybrid III 50th FEM was 0.9887, while the rank correlation coefficient for the head acceleration peak was 0.9853. The peak responses of the simplified dummy’s head–neck showed a strong positive correlation with those of the Hybrid III 50th FEM, indicating that the head–neck physical model possesses the capability to identify response variation.

6. Explosion Experiment Verification

6.1. Experimental Setup

This testing method is primarily applied in under-body blast environments, where its accuracy is verified through under-body blast tests. To facilitate experiment and finite element modeling, the test rig and seat are welded together as a single unit. As shown in Figure 18, the equipment was placed in a static explosion field for the blast test. An explosive was positioned at the base of the rig and detonated. The explosive charge consists of 100 g of TNT powder compacted into a cylindrical shape and wrapped in a plastic casing. Based on the mass–energy equivalence relationship, the total energy released is estimated to be approximately 418.4 kJ, assuming a unit energy density of 4.184 × 10⁶ J/kg for TNT. The bottom of the test rig is elevated 0.6 m above the ground. According to Equation (3), the scaled distance from the closest point on the rig base to the charge is calculated as 1.29 m · k g 1 / 3 . Accelerometers were installed on the chest, head centroids, and pedal positions of the simplified dummy to record the acceleration signals. All dummy acceleration test signals are filtered through CFC1000, SAE J211. Through the optimized mapping test model, the acceleration signals of a simple dummy head and chest were transformed. By aligning the pedal acceleration in the finite element model with the measured data, the response of the Hybrid III 50th FEM is computed and compared with the output results of the mapped test model.

6.2. Results and Discussions

Figure 19 summarize the relationship between the injury metric and the scaled distance in both pendulum and TNT explosion tests. The injury metrics were derived through Hybrid III 50th FEM responses. In particular, the point corresponding to a scaled distance of 1.29 m · k g 1 / 3 represents the TNT explosion test, where the injury metrics are lower than those of the adjacent points. This indicates that the energy released by TNT explosions can be highly unstable, as factors such as explosive casing, density, compaction and incomplete combustion affect the result. Given that the vertical shock wave bypassing the platform and acting directly on the body is expected to be small, using the pedal acceleration as the model input is expected to improve accuracy. Figure 20a shows the pedal acceleration curve of a simple dummy under blast loading. Figure 20b,c shows the chest and head Z-axis acceleration tested by a simple dummy under explosion. Figure 21a,b presents the head Z-axis acceleration and upper neck axial compression force output by the mapping test model and calculated by the finite element model. Table 4 records the relative error of HIC and peak value of the force output of the mapping test model compared with Hybrid III 50th FEM. It is calculated that the relative error of HIC15 is 10.9% and the error of maximum upper neck axial compression force was 2.4%. Since the peak did not attain the injury threshold, the duration of the force levels was not calculated in this experiment. The results above demonstrate that the response error of the head–neck physical model combined with the mapping test model, tested in an explosive environment, remains within a small margin of error.

7. Discussion

The present study proposes a novel method for simulating blast-induced biomechanical responses using a simplified dummy and mapping test model calibration based on 1d-CNN. The primary contribution of this study lies in the proposal and validation of the method; however, certain limitations remain and will be addressed in future research.
First, future investigations should consider scenarios involving greater TNT equivalents or variations in blast angle to fully assess the model’s performance under extreme or oblique loading. In accordance with AEP-55 [5] standards, the reference equivalent for armored vehicle underbelly mine testing is specified as 6, 8, and 10 kg TNT, and the blast tests should incorporate five critical impact orientations: frontal (0°), lateral (90°), rear (180°), anterolateral (45°), and posterolateral (135°) relative to the occupant position. Due to safety constraints at our testing facility and the use of a simplified rig simulating the vehicle’s under-body structure, high-yield explosives were not employed in this phase. The primary objective of this study was to develop and validate the proposed methodology. Future work will incorporate large-yield detonations and multi-directional blast testing to fully evaluate system performance. For the simulated explosion test, Krayterman [44] and Cheng [45] used a vertical shock machine to generate impulses representative of under-body blast loading. Somasundaram employs a hydraulic mechanism to accelerate the dummy-mounted sled, enabling controlled impact with a barrier for dynamic testing [19]. A pressurized cylinder was employed by Marie Bailey to drive a hammer sled into the dummy-mounted floor and seat platen [7,8]. These methods can serve as references for future high-impact loading applications on the simplified dummy. To date, the simulated explosion test of varying impact angles on human body responses remains largely unexplored. Future research could aim to develop experimental blast simulation techniques capable of adjusting the impact trajectory angle.
Second, while the laboratory-based pendulum experiments offer controllable and repeatable conditions, they inherently differ from real explosive environments. Actual blast scenarios may involve multidirectional forces, complex fluid-structure interactions, and secondary effects such as fragment impacts, none of which are replicated in the current setup. These differences should be taken into account when interpreting the validity and generalizability of the results. While the problem of uniaxial loading has been mitigated in recent research, the complex multidirectional characteristics of blast waves and secondary phenomena remain challenging to reproduce. It is necessary to develop an experimental apparatus that can replicate the coupled effects of blast overpressure and fragment impact to better simulate real-world explosive loading conditions.
Third, the validation cases remain relatively limited in number and diversity. The current framework does not account for alternative loading configurations, such as varying occupant postures or different seat structures, which may significantly influence biomechanical outcomes. Expanding the experiment and simulation to encompass a broader range of real-world conditions would enhance the method’s robustness.
Future work will aim to address these limitations by expanding the methodology to other anatomical regions, such as the lumbar spine or lower limbs. A methodology similar to that presented in this study could be adopted for spinal injury assessment. Using the Driz criterion as a basis, the input to the mapping model can be set as the pelvic acceleration of the simplified dummy, while the output corresponds to the pelvic acceleration obtained from a high-biofidelity dummy or finite element model. Moreover, comparing the proposed 1D-CNN architecture with alternative deep learning models will help further validate the rationale behind the chosen calibration approach and potentially improve its accuracy and generalizability. For example, Mirhashemi [46] utilized artificial neural networks (ANNs) to calibrate and simplify the data acquisition process for multi-hole probes. ANNs can establish complex mapping relationships between input data and output results, which meets our requirements. According to Wang’s review, machine learning algorithms—including random forests, support vector regression (SVR), and neural networks—have been shown to significantly enhance the performance and reliability of low-cost gas sensor systems [47]. In future research, efforts will be made to identify and evaluate alternative algorithms that may outperform the current 1D-CNN architecture.

8. Conclusions

To address the trade-off between biofidelity and the cost associated with anthropomorphic test devices, a novel test methodology for evaluating head–neck injuries in blast environments was developed, leveraging a synergy of virtual and physical testing paradigms. A low-cost simplified dummy was designed to test human body responses, and a mapping test model based on 1D-CNN was proposed to calibrate the measured data.
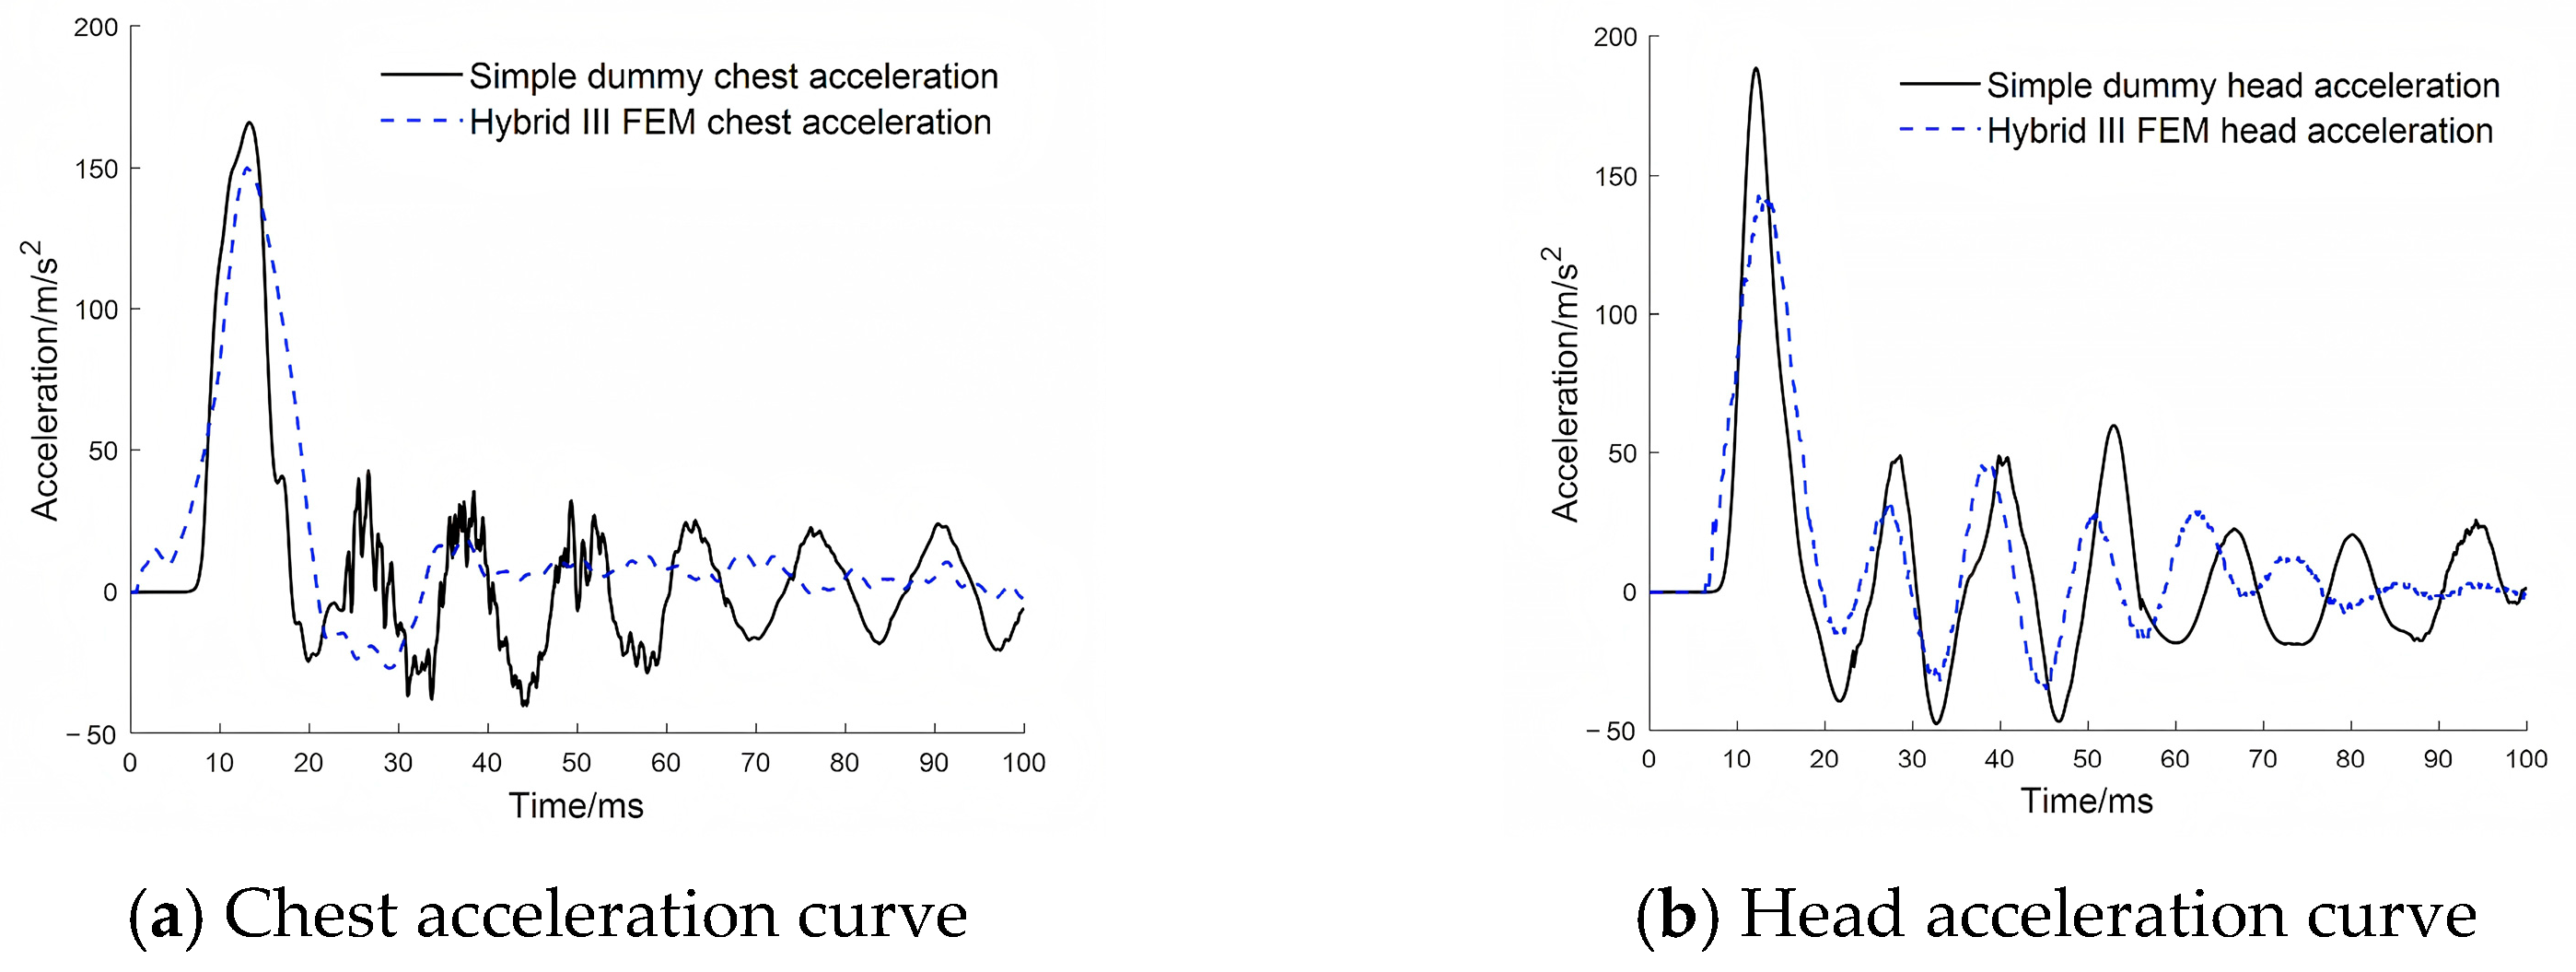
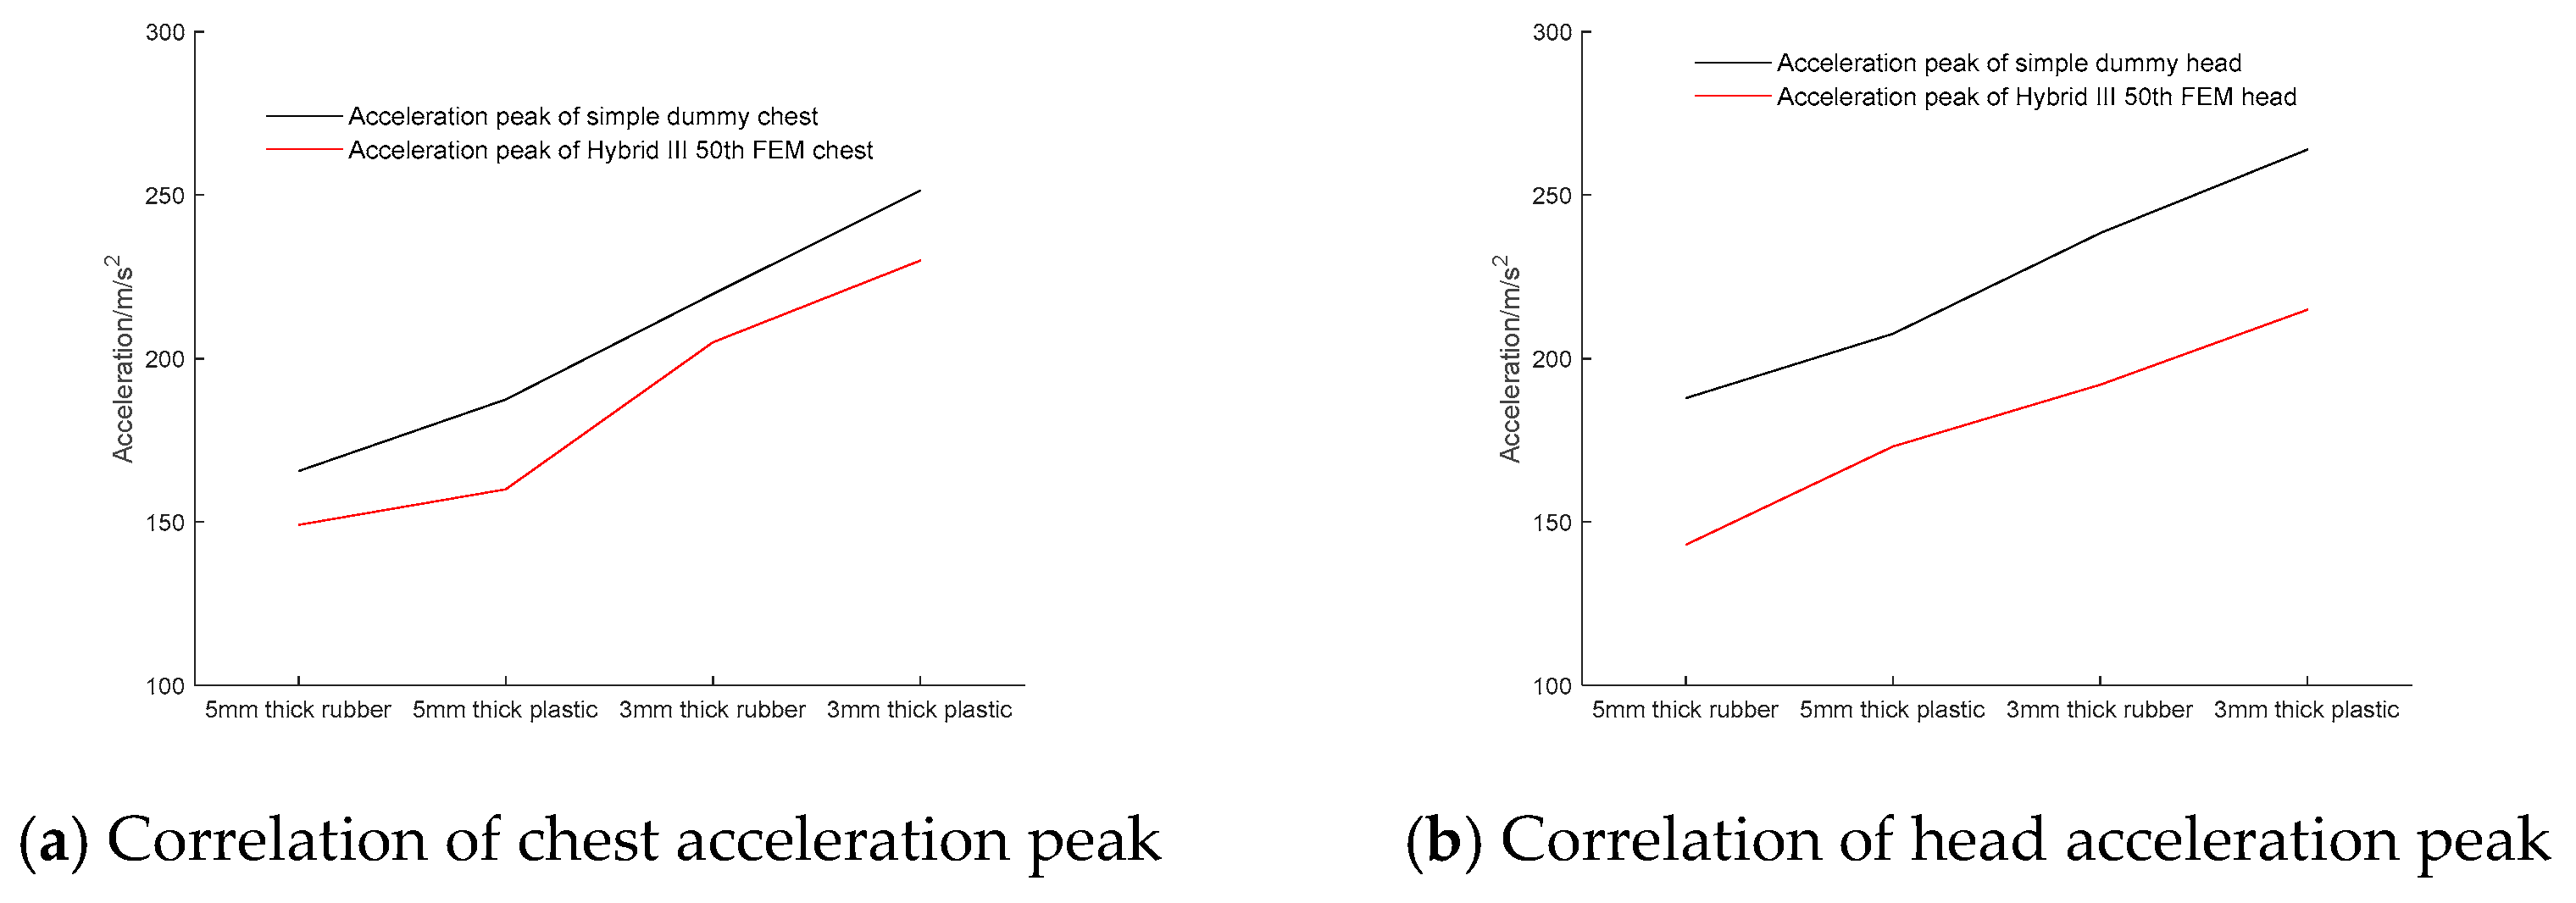
(1) A head–neck physical model is proposed, replicating the segmental mass and center of gravity distribution of the Hybrid III 50th percentile dummy. Its cervical spine is composed of stacked simulated vertebral bodies and intervertebral discs. By calculating the correlation between the chest and head acceleration peak of the simplified dummy and those of the Hybrid III 50th FEM under the same loads, it is demonstrated that the head–neck response of the simplified dummy physical model exhibits a strong positive correlation with the response of the Hybrid III 50th FEM. This indicates that the head–neck physical model of the simplified dummy possesses the capability to identify response variation.
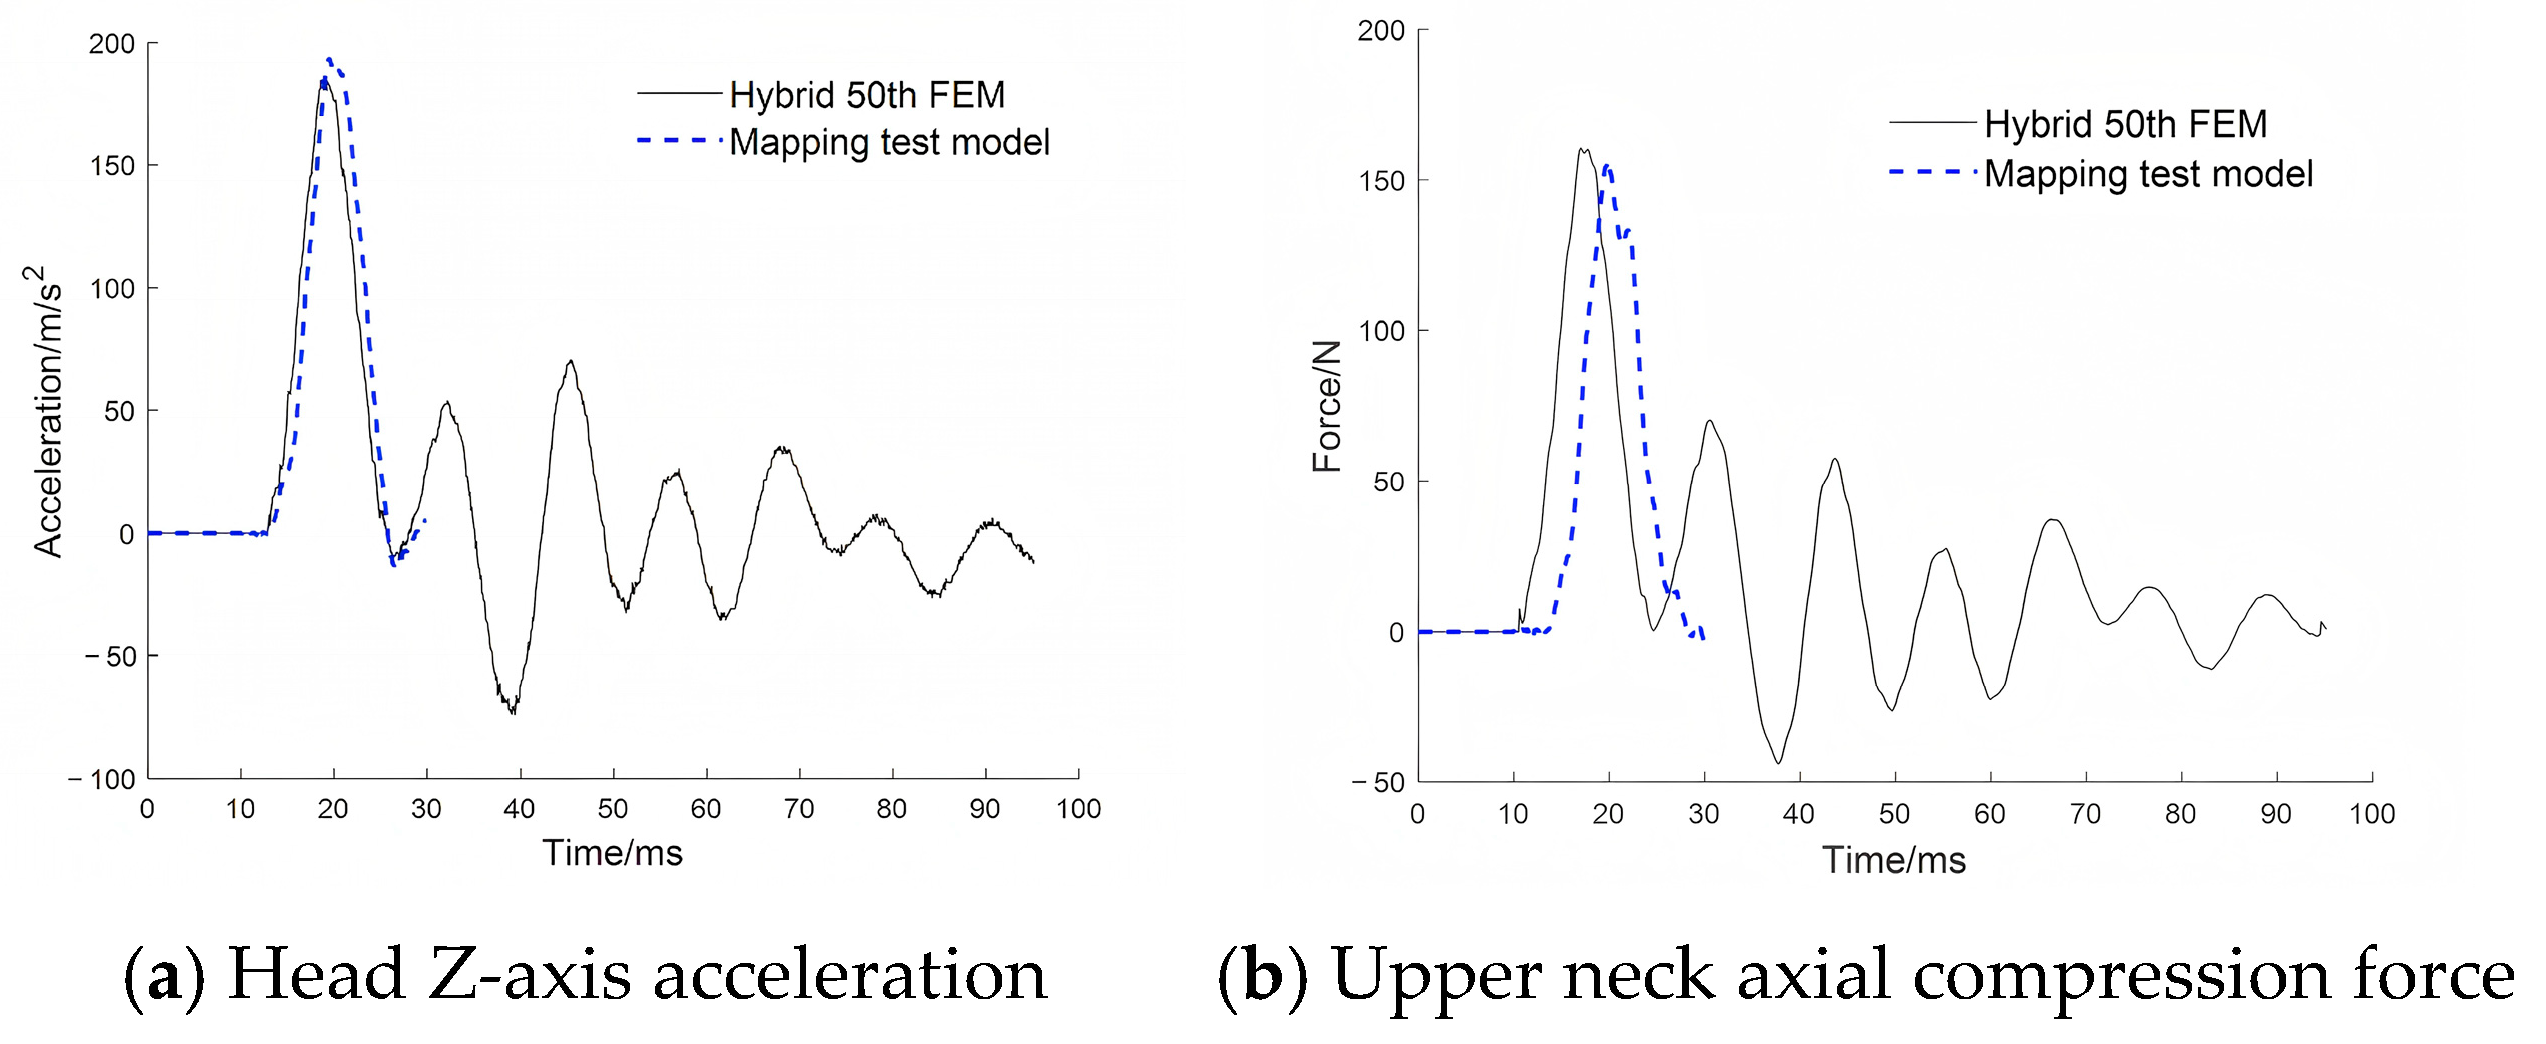
(2) The mapping relationship between the responses of the simplified dummy and the Hybrid III FEM was established through NSGA-II to train the parameters of 1D-CNN. The training data were acquired by employing the pendulum collision to simulate the under-body blast impact on the dummy. The explosion test verification was conducted, and the responses of the Hybrid III 50th numerical model under the same load were taken as a benchmark. The relative error of HIC output by this test method is 10.9%, and the relative error of maximum axial compression force of the upper neck is 2.4%, affirming the efficacy of the combined physical dummy and surrogate model in assessing blast-induced trauma.

Author Contributions

Conceptualization, C.D.; methodology, X.S.; formal analysis, X.S. and C.X.; investigation, X.S.; resources C.D. and P.P.; data curation, X.S.; writing—original draft preparation, X.S.; writing—review and editing, C.D. and P.P.; visualization, X.S.; supervision, C.D. and P.P. All authors have read and agreed to the published version of the manuscript.

Funding

This research received no external funding.

Institutional Review Board Statement

Not applicable for studies not involving humans or animals.

Informed Consent Statement

Not applicable.

Data Availability Statement

The data that support the findings of this study are available from the corresponding author upon reasonable request.

Acknowledgments

We sincerely thank the School of Mechanical Engineering, Nanjing University of Science and Technology, for providing access to their test site.

Conflicts of Interest

The authors declared no potential conflicts of interest with respect to the research, authorship, and publication of this article.

References

  1. Danelson, K.A.; Kemper, A.R.; Mason, M.J.; Tegtmeyer, M.; Hardy, W.N. Comparison of atd to pmhs response in the under-body blast environment. Stapp Car Crash J. 2015, 59, 445–520. [Google Scholar] [CrossRef]
  2. Trajkovski, J.; Perenda, J.; Kunc, R. Blast response of light armoured vehicles (lavs) with flat and v-hull floor. Thin-Walled Struct. 2018, 131, 238–244. [Google Scholar] [CrossRef]
  3. Espinoza-Garcés, C.A.; Aguilar-Pérez, L.A.; Rueda-Arreguin, J.L.; Pérez-Martínez, I.; Torres-Ariza, J.L.; SanMiguel, C.R.T. Head injuries evaluation during a pipeline explosion. Results Eng. 2024, 21, 101655. [Google Scholar] [CrossRef]
  4. North Atlantic Treaty Organization. HFM-090-Test Methodology for Protection of Vehicle Occupants Against Anti-Vehicular Landmine Effects. 2007. Available online: https://www.sto.nato.int/publications/ (accessed on 15 December 2024).
  5. North Atlantic Treaty Organization. Volume 2 (Edition 2)-Procedures for Evaluating the Protection Level of Armoured Vehicles-Mine Threat. 2011. Available online: https://store.accuristech.com/standards/nato-aep-55-vol-2?product_id=2823245 (accessed on 20 December 2024).
  6. Ott, K.; Drewry, D., III; Luongo, M.; Andrist, J.; Armiger, R.; Titus, J.; Demetropoulos, C. Comparison of human surrogate responses in underbody blast loading conditions. J. Biomech. Eng. 2020, 142, 091010. [Google Scholar] [CrossRef]
  7. Bailey, A.; Christopher, J.J.; Salzar, R.S.; Brozoski, F. Comparison of Hybrid-III and postmortem human surrogate response to simulated underbody blast loading. J. Biomech. Eng. 2015, 137, 051009. [Google Scholar] [CrossRef]
  8. Bailey, A.; Christopher, J.; Henderson, K.; Brozoski, F.; Salzar, R.S. Comparison of Hybrid-III and PMHS response to simulated underbody blast loading conditions. In Proceedings of the IRCOBI Conference, Gothenburg, Sweden, 11–13 September 2013; pp. 158–171. Available online: https://api.semanticscholar.org/CorpusID:110543697 (accessed on 1 December 2024).
  9. Horst, M.J.V.D.; Leerdam, P.J.C. Experimental and numerical analysis of occupant safety in blast mine loading under vehicles. In Proceedings of the International Ircobi Conference, Munich, Germany, 18–20 September 2002; Volume 30. [Google Scholar]
  10. “Dale” Bass, C.; Davis, M.; Rafaels, K.; “Steve” Rountree, M.; Harris, R.M.; Sanderson, E.; Andrefsky, W.; DiMarco, G.; Zielinski, M. A methodology f-or assessing blast protection in explosive ordnance disposal bomb suits. Int. J. Occup. Saf. Ergon. 2005, 11, 347–361. [Google Scholar] [CrossRef] [PubMed]
  11. Ning, Y.; Hongliang, W.; Jincheng, Z.; Bing, P.; Longxue, Y. Research on the effect of wearing equipment on occupant injury under vertical impact. Expl. Shock Wave 2021, 41, 085101-1. [Google Scholar] [CrossRef]
  12. Pietsch, H.A.; Bosch, K.E.; Weyland, D.R.; Spratley, E.M.; Henderson, K.A.; Salzar, R.S.; Merkle, A.C. Evaluation of WIA-Man technology demonstrator biofidelity relative to sub-injurious PMHS response in simulated under-body blast events. SAE Technical Paper, 7 November 2016. [Google Scholar] [CrossRef]
  13. Zeng, W.; McMahon, J.; Shedd, D.F.; Carpenter, R.; Salzar, R.S. Biofidelity assessment of the WIAMan thorax by a compar-ative study with Hybrid III, THOR, and PMHS in frontal sled testing. J. Biomech. Eng. 2023, 145, 071008. [Google Scholar] [CrossRef]
  14. Lou, K.; Pe Bosen, D.; Irde, K. Simulation of Various LSTC Dummy Models to Correlate Drop Test Results. In Proceedings of the 13th International LS-DYNA Users Conference Session: Occupant Safety, Manchester, UK, 2–4 June 2013; Livermore Software Technology Corporation Detroit: Manchester, UK, 2013; p. 12. [Google Scholar]
  15. Zhu, F.; Dong, L.; Jin, X.; Jiang, B.; Kalra Shen, M.; King Yang, H. Testing and modeling the responses of hybrid iii crash-dum-my lower extremity under high-speed vertical loading. Stapp Car Crash J. 2015, 59, 521–536. [Google Scholar] [CrossRef]
  16. Somasundaram, K. Methodology for Performing Whole Body PMHS Underbody Blast Impact Testing, and the Corresponding Response of the Hybrid iii Dummy and the Finite Element Dummy Model Under Similar Loading Condition. Master’s Thesis, Wayne State University, Detroit, MI, USA, 2015. [Google Scholar]
  17. Somasundaram, K.; Kalra, A.; Sherman, D.; Begeman, P.; Yang, K.H.; Cavanaugh, J. An experimental and numerical study of Hybrid III dummy response to simulated underbody blast impacts. J. Biomech. Eng. 2017, 139, 121002. [Google Scholar] [CrossRef]
  18. Sławiński, G.; Niezgoda, T.; Barnat, W.; Wojtkowski, M. Numerical analysis of the influence of blast wave on human body. J. Kones 2013, 20, 381–386. [Google Scholar]
  19. Suhaimi, K.; Sohaimi, R.M.; Knight, V.F.; Sheng, T.K.; Syaharani, A. Simulation of hybrid-iii dummy response using three ls-dyna blast methods. Def. S T Tech. Bull. 2017, 10, 111–120. [Google Scholar]
  20. Wang, B.; He, Y.; Nie, B.; Xu, S.; Zhang, J. Numerical investigation of vehicle occupant injury risks in underbody blast events. J. Tsinghua Univ. 2020, 60, 902–909. [Google Scholar] [CrossRef]
  21. Roberts, J.C.; Harrigan, T.P.; Ward, E.E.; Taylor, T.M.; Annett, M.S.; Merkle, A.C. Human head–neck computational model for assessing blast injury. J. Biomech. 2012, 45, 2899–2906. [Google Scholar] [CrossRef]
  22. Park, S.; Kim, S. Enhancing Vibration-based Damage Assessment with 1D-CNN: Parametric Studies and Field Applications. KSCE J. Civ. Eng. 2024, 28, 2934–2951. [Google Scholar] [CrossRef]
  23. Ali, S.; Alam, F.; Arif, K.M.; Potgieter, J. Low-cost CO sensor calibration using one dimensional convolutional neural network. Sensors 2023, 23, 854. [Google Scholar] [CrossRef] [PubMed]
  24. Lanning, A.; EZaghi, A.; Zhang, T. Applicability of convolutional neural networks for calibration of nonlinear dynamic models of structures. Front. Built Environ. 2022, 8, 873546. [Google Scholar] [CrossRef]
  25. North Atlantic Treaty Organization. HFM-270-Framework for Modeling and Simulation of Human Lethality, Injury, and Impairment from Blast-Related Threats. 2023. Available online: https://www.sto.nato.int/publications/ (accessed on 25 December 2024).
  26. Safety Test Instrumentation Standards Committee. SAE J1727-Surface Vehicle Recommended Practice Injury Calculations Guidelines 1996. Available online: https://www.sae.org/standards/content/j1727 (accessed on 20 December 2024).
  27. National Highway Traffic Safety Administration. Development of Improved Injury Criteria for the Assessment of Advanced Automotive Restraint Systems. 1998. Available online: https://www.nhtsa.gov/ (accessed on 26 December 2024).
  28. Draganić, H.; Varevac, D.; Lukić, S. An overview of methods for blast load testing and devices for pressure measurement. Adv. Civ. Eng. 2018, 2018, 3780482. [Google Scholar] [CrossRef]
  29. Clark, C.R.; Benzel, E.C. The Cervical Spine; Lippincott Williams and Wilkins: Philadelphia, PA, USA, 2005; ISBN 0-7817-3576-9. [Google Scholar]
  30. Hopkinson, B. A Method of Measuring the Pressure Produced in the Detonation of High Explosives or by the Impact of Bullets. Philos. Trans. R. Soc. Lond. Ser. A 1914, 213, 437–456. [Google Scholar] [CrossRef]
  31. Newmark, N.; Hansen, R. Design of Blast Resistant Structures. In Shock and Vibration Handbook; McGraw-Hill: New York, NY, USA, 1961; Volume 3. [Google Scholar]
  32. Kaleps, I.; Whitestone, J. Hybrid III Geometrical and Inertial Properties. In Proceedings of the SAE International Congress and Exposition, New York, NY, USA, 1 January 1988; pp. 107–127. [Google Scholar] [CrossRef]
  33. Kiranyaz, S.; Avci, O.; Abdeljaber, O.; Ince, T.; Gabbouj, M.; Inman, D.J. 1-D convolutional neural networks and applications: A survey. Mech. Syst. Signal Process. 2021, 151, 107398. [Google Scholar] [CrossRef]
  34. Junior, R.F.R.; Areias, I.A.D.S.; Campos, M.M.; Teixeira, C.E.; Silv-a, L.E.B.; Gomes, G.F. Fault detection and diagno-sis in electric motors using 1-d convolutional neural networks with multi-channel vibration signals. Measurement 2022, 190, 110759. [Google Scholar] [CrossRef]
  35. Chen, C.; Zhang, J.J.; Zheng, C.H.; Yan, Q.; Xun, L.N. Classification of hyperspectral data using a multi-channel convolutional neural network. In Proceedings of the Intelligent Computing Methodologies: 14th International Conference, Wuhan, China, 15–18 August 2018. [Google Scholar]
  36. Deb, K.; Pratap, A.; Agarwal, S.; Meyarivan, T.A.M.T. A fast and elitist multi-objective genetic algorithm: NSGA-II. IEEE Trans. Evol. Comput. 2002, 6, 182–197. [Google Scholar] [CrossRef]
  37. Yusoff, Y.; Ngadiman, M.S.; Zain, A.M. Overview of NSGA-II for optimizing machining process parameters. Procedia Eng. 2011, 15, 3978–3983. [Google Scholar] [CrossRef]
  38. Tiwari, S.; Kumar, A.; Basetti, V. Multi-objective micro phasor measurement unit placement and performance analysis in di-stribution system using nsga-ii and PROMETHEE-ii. Measurement 2022, 198. [Google Scholar] [CrossRef]
  39. Liu, X.; Chen, W.; Paas, M. Automated occupant model evaluation and correlation. In Proceedings of the ASME International Mechanical Engineering Congress and Exposition, Memphis, TN, USA, 1 January 2005; Volume 42304, pp. 353–358. [Google Scholar] [CrossRef]
  40. Xiao, H.; Wang, K.; Liu, Y.; Guo, Q.; Wen, Y.; Feng, Z. Nonlinear dynamic modeling and body injuries analysis of human/se-at system under vertical impact. Int. J. Ind. Ergon. 2023, 95, 103450. [Google Scholar] [CrossRef]
  41. J211/1-Instrumentation for Impact Test Part 1-Electronic Instrumentation. Safety Test Instrumentation Standards Committee: New York, NY, USA, 19 August 2022. Available online: https://www.sae.org/standards/content/j211/1_202208/ (accessed on 12 December 2024).
  42. Baykasogl, A.; Owen, S.; Gindy, N. A taboo search based approach to find the Pareto optimal set in multiple objective optimization. Eng. Optim. 1999, 31, 731–748. [Google Scholar] [CrossRef]
  43. Hauke, J.; Kossowski, T. Comparison of values of Pearson’s and Spearman’s correlation coefficients on the same sets of data. Quaest. Geogr. 2001, 30, 87–93. [Google Scholar] [CrossRef]
  44. Army Research Laboratory. ARL-TR-6648-Comparative Analysis of THOR-NT ATD vs. Hybrid III ATD in Laboratory Vertical Shock Testing. 2013. Available online: https://apps.dtic.mil/sti/citations/ADA586077 (accessed on 5 January 2025).
  45. Cheng, Z.; Pellenttiere, J.A. Evaluation of the safety performance of ejection seat cushions. In Proceedings of the Forty Second Annual SAFE Association Symposium, Salt Lake City, UT, USA, 27–28 September 2004; pp. 194–201. [Google Scholar]
  46. Mirhashemi, A.; Juangphanich, P.; Miki, K. Application of Machine Learning Techniques in Calibration and Data Reduction of Multihole Probes. J. Turbomach. 2025, 147, 071011. [Google Scholar] [CrossRef]
  47. Wang, A.; Machida, Y.; deSouza, P.; Mora, S.; Duhl, T.; Hudda, N.; Durant, J.L.; Duarte, F.; Ratti, C. Leveraging machine learning algorithms to advance low-cost air sensor calibration in stationary and mobile settings. Atmos. Environ. 2023, 301, 119692. [Google Scholar] [CrossRef]
Figure 1. Workflow of the training process.
Applsci 15 05796 g001
Figure 2. Workflow of the system application.
Applsci 15 05796 g002
Figure 3. Schematic diagram of pendulum impact.
Applsci 15 05796 g003
Figure 4. Simple dummy neck structure.
Applsci 15 05796 g004
Figure 5. Simple dummy head structure.
Applsci 15 05796 g005
Figure 6. Simple dummy head–neck physical model.
Applsci 15 05796 g006
Figure 7. Mapping test model architecture.
Applsci 15 05796 g007
Figure 8. NSGA-II flow.
Applsci 15 05796 g008
Figure 9. Simple dummy simulated experiment.
Applsci 15 05796 g009
Figure 10. Hybrid III 50th FEM simulated experiment.
Applsci 15 05796 g010
Figure 11. Pedal z-axis acceleration.
Applsci 15 05796 g011
Figure 12. Pedal z-axis velocity.
Applsci 15 05796 g012
Figure 13. Simple dummy responses under pendulum impact.
Applsci 15 05796 g013
Figure 14. Hybrid III 50th FEM responses under pendulum impact.
Applsci 15 05796 g014
Figure 15. Loss curves.
Applsci 15 05796 g015
Figure 16. Comparison of head–neck response between simple dummy and Hybrid III 50th FEM under the condition of 5 mm thick rubber.
Applsci 15 05796 g016
Figure 17. Calculation of head–neck response correlation between simple dummy and Hybrid III 50th FEM.
Applsci 15 05796 g017
Figure 18. Verification test.
Applsci 15 05796 g018
Figure 19. Correlation between injury metrics and scaled distances. (a) Correlation between HIC and scaled distance. (b) Correlation between maximum axial compressive force of the upper neck and scaled distance.
Applsci 15 05796 g019
Figure 20. Response of simplified dummy test under blast impact.
Applsci 15 05796 g020
Figure 21. Response derived from Hybrid III 50th FEM and mapping test model.
Applsci 15 05796 g021
Table 1. Segmental mass and center of gravity of the head–neck region simplified dummy and the Hybrid III 50th.
Mass (kg)COG (X,Z) (m)Joint (X,Z) (m)
Simple DummyHybrid III 50th Simple DummyHybrid III 50th Simple DummyHybrid III 50th
Head4.50004.5000(0.0023, 0.3544)(0.0031, 0.3348)Head/neck joint center(0.0110, 0.3140)(0.0132, 0.2840)
Neck1.07001.2200(0.0110, 0.2310)(0.0132, 0.2210)Neck/chest attachment center(0.0110, 0.1251)(0.0132, 0.1509)
Chest14.700016.6200(0, 0)(0, 0)
Table 2. Material properties of the neck components in the simplified dummy and the Hybrid III 50th.
Viscoelastic ElasticityLinear Elasticity
Bulk Modulus (GPa)Decay ConstantYoung Modulus (GPa)
Simple DummyHybrid III 50th (FEM)Simple DummyHybrid III 50th (FEM)Simple DummyHybrid III 50th (FEM)
Intervertebral disc0.06000.11280.35000.1100
Vertebral body 69.800070.0000
Table 3. Momentum and scaled distance for explosive equivalence under different pendulum impact conditions.
5 mm Thick Rubber3 mm Thick Rubber5 mm Thick Plastic3 mm Thick Plastic
Momentum/ k g . m / s 196.00219.13207.89240.05
Scaled distance for explosive equivalence/ m · k g 1 / 3 1.791.351.471.27
Table 4. Relative error compared to Hybrid III 50th FEM.
HIC15Upper Neck Maximum Axial Compression Force (kN)
Hybrid III 50th FEM2.75160.52
The proposed model3.05156.68
Relative error (%)10.92.4
Disclaimer/Publisher’s Note: The statements, opinions and data contained in all publications are solely those of the individual author(s) and contributor(s) and not of MDPI and/or the editor(s). MDPI and/or the editor(s) disclaim responsibility for any injury to people or property resulting from any ideas, methods, instructions or products referred to in the content.

