Article

Estimation of Amino Acid and Tea Polyphenol Content of Tea Fresh Leaves Based on Fractional-Order Differential Spectroscopy

1
State Key Laboratory of Remote Sensing Science, Faculty of Geographical Science, Beijing Normal University, Beijing 100875, China
2
Beijing Engineering Research Center for Global Land Remote Sensing Products, Faculty of Geographical Science, Beijing Normal University, Beijing 100875, China
3
Faculty of Arts and Sciences, Beijing Normal University, Zhuhai 519087, China
4
Key Laboratory of Tea Quality and Safety Control, Ministry of Agriculture and Rural Affairs, Tea Research Institute, Chinese Academy of Agricultural Sciences, Hangzhou 310008, China
*
Authors to whom correspondence should be addressed.
Appl. Sci. 2025, 15(11), 5792; https://doi.org/10.3390/app15115792
Submission received: 6 April 2025 / Revised: 16 May 2025 / Accepted: 20 May 2025 / Published: 22 May 2025

Abstract

:
Amino acids (AAs) and tea polyphenols (TPs) are essential quality indicators in tea, impacting sensory attributes and economic value. Hyperspectral technology enables efficient, real-time detection of these compounds on field-grown tea leaves. “The original spectra were preprocessed using fractional-order derivatives (0.1–1.0 orders) to enhance subtle spectral features. Compared to fixed integer-order derivatives (e.g., first or second order), fractional-order derivatives allow continuous tuning between 0 and 1, thereby amplifying minor absorption peaks while effectively suppressing noise amplification”. The Competitive Adaptive Reweighted Sampling (CARS) method selects optimal spectral bands, and Partial Least Squares Regression (PLSR) models were built with raw spectral reflectance as independent variables and AA and TP content as dependent variables. Results show that FOD had better prediction accuracy compared to classical integer-order derivatives, e.g., the optimal FOD order of 0.7 for AA prediction increased the R2 from 0.73 to 0.80 and reduced the RMSE from 0.30% to 0.25%, while for TP prediction, a FOD order of 0.1 raised the R2 from 0.40 to 0.42 and lowered the RMSE from 4.03% to 3.96%. In addition, CARS shows a better performance over the correlation coefficient (CC) method in model accuracy, contributing to more accurate selection of sensitive bands for the content prediction of tea ingredients. Our FOD–CARS–PLSR models achieved an R2 of 0.80 and RMSE of 0.25% for AAs, and an R2 of 0.42 and RMSE of 3.96% for TPs in fresh tea leaves. Beyond tea quality monitoring, this flexible preprocessing and modeling framework can be readily adapted to estimate biochemical or biophysical properties in other crops, soils, or vegetated ecosystems, offering a generalizable tool for precision agriculture and environmental sensing.

1. Introduction

Tea (Camellia sinensis) is one of the most widely consumed beverages in the world, valued not only for its unique flavor but also for its potential health benefits. Tea contains important compounds such as tea polyphenols (TPs) and amino acids (AAs). These compounds are known for their health benefits, including antioxidant effects, cancer prevention, improved bone strength, and helping to relieve stress or anxiety [1,2]. Furthermore, the content of these components plays a significant role in determining tea quality and market value [3,4].
Measuring TPs and AAs is essential for evaluating tea quality [5]. However, traditional chemical testing methods have several drawbacks. They are often destructive, meaning the sample cannot be reused after testing, which is problematic for high-value teas [6]. In addition, these methods require advanced equipment, special chemicals, and trained personnel, making them expensive and time-consuming. Such limitations hinder the application of these methods for real-time, large-scale quality assessments.
Spectroscopy offers a faster and more sustainable alternative [7,8]. This technique analyzes the interactions between electromagnetic waves and chemical bonds (e.g., C–H, N–H, and O–H), generating unique spectral patterns that allow researchers to correlate specific bands with chemical components. For example, Schulz et al. (1999) demonstrated that near-infrared (NIR) spectroscopy could be used to predict the levels of polyphenols and alkaloids, and Dong et al. (2018) successfully employed an optimized PLSR model to estimate theanine content in oolong tea [9,10].
Most previous studies have focused on processed tea products such as powder or dried leaves, where water content is less problematic. In contrast, fresh tea leaves present additional challenges because water interferes with the spectral signal. Fresh leaves represent a critical stage in tea production, where proper management can significantly influence final quality. Therefore, developing improved methods to assess key quality indicators in fresh tea leaves is of great importance.
Hyperspectral technology, which collects detailed spectral information across many narrow and contiguous bands, has proven useful in studying complex compounds. However, current methods often rely on first- or second-order derivatives to highlight spectral features. While these methods work well for strong signals, they may not capture the subtle variations associated with compounds like TPs and AAs.
Fractional-order differentiation (FOD) provides a more flexible approach by allowing the adjustment of the differentiation order. This flexibility can enhance weak spectral features while suppressing noise, offering potential advantages over traditional integer-order methods [11,12]. Despite its promise, FOD has not been fully explored for its appl-cation in fresh tea leaves.
In this study, mature and fully expanded tea leaves with an inner-circle diameter greater than 3 cm were selected as the research objects. While tender shoots and buds are traditionally considered key indicators of premium tea quality, mature leaves represent a substantial portion of harvestable biomass in many practical scenarios—especially in mechanized harvesting or late-season plucking. Moreover, mature leaves still contain significant levels of quality-related compounds such as amino acids and polyphenols and are widely used in mid- to low-grade tea production, functional tea processing, and quality monitoring at the canopy or field scale. Evaluating the spectral characteristics of such leaves thus has both agronomic relevance and practical implications for scalable, non-destructive quality assessment. We propose a method that combines fractional-order differential spectroscopy with Competitive Adaptive Reweighted Sampling (CARS) and Partial Least Squares Regression (PLSR) to estimate AA and TP content in fresh tea leaves. By shifting the focus from processed tea products to fresh leaves, our approach aims to develop a rapid, non-destructive tool for tea quality monitoring that could support improved agricultural management.

2. Materials and Methods
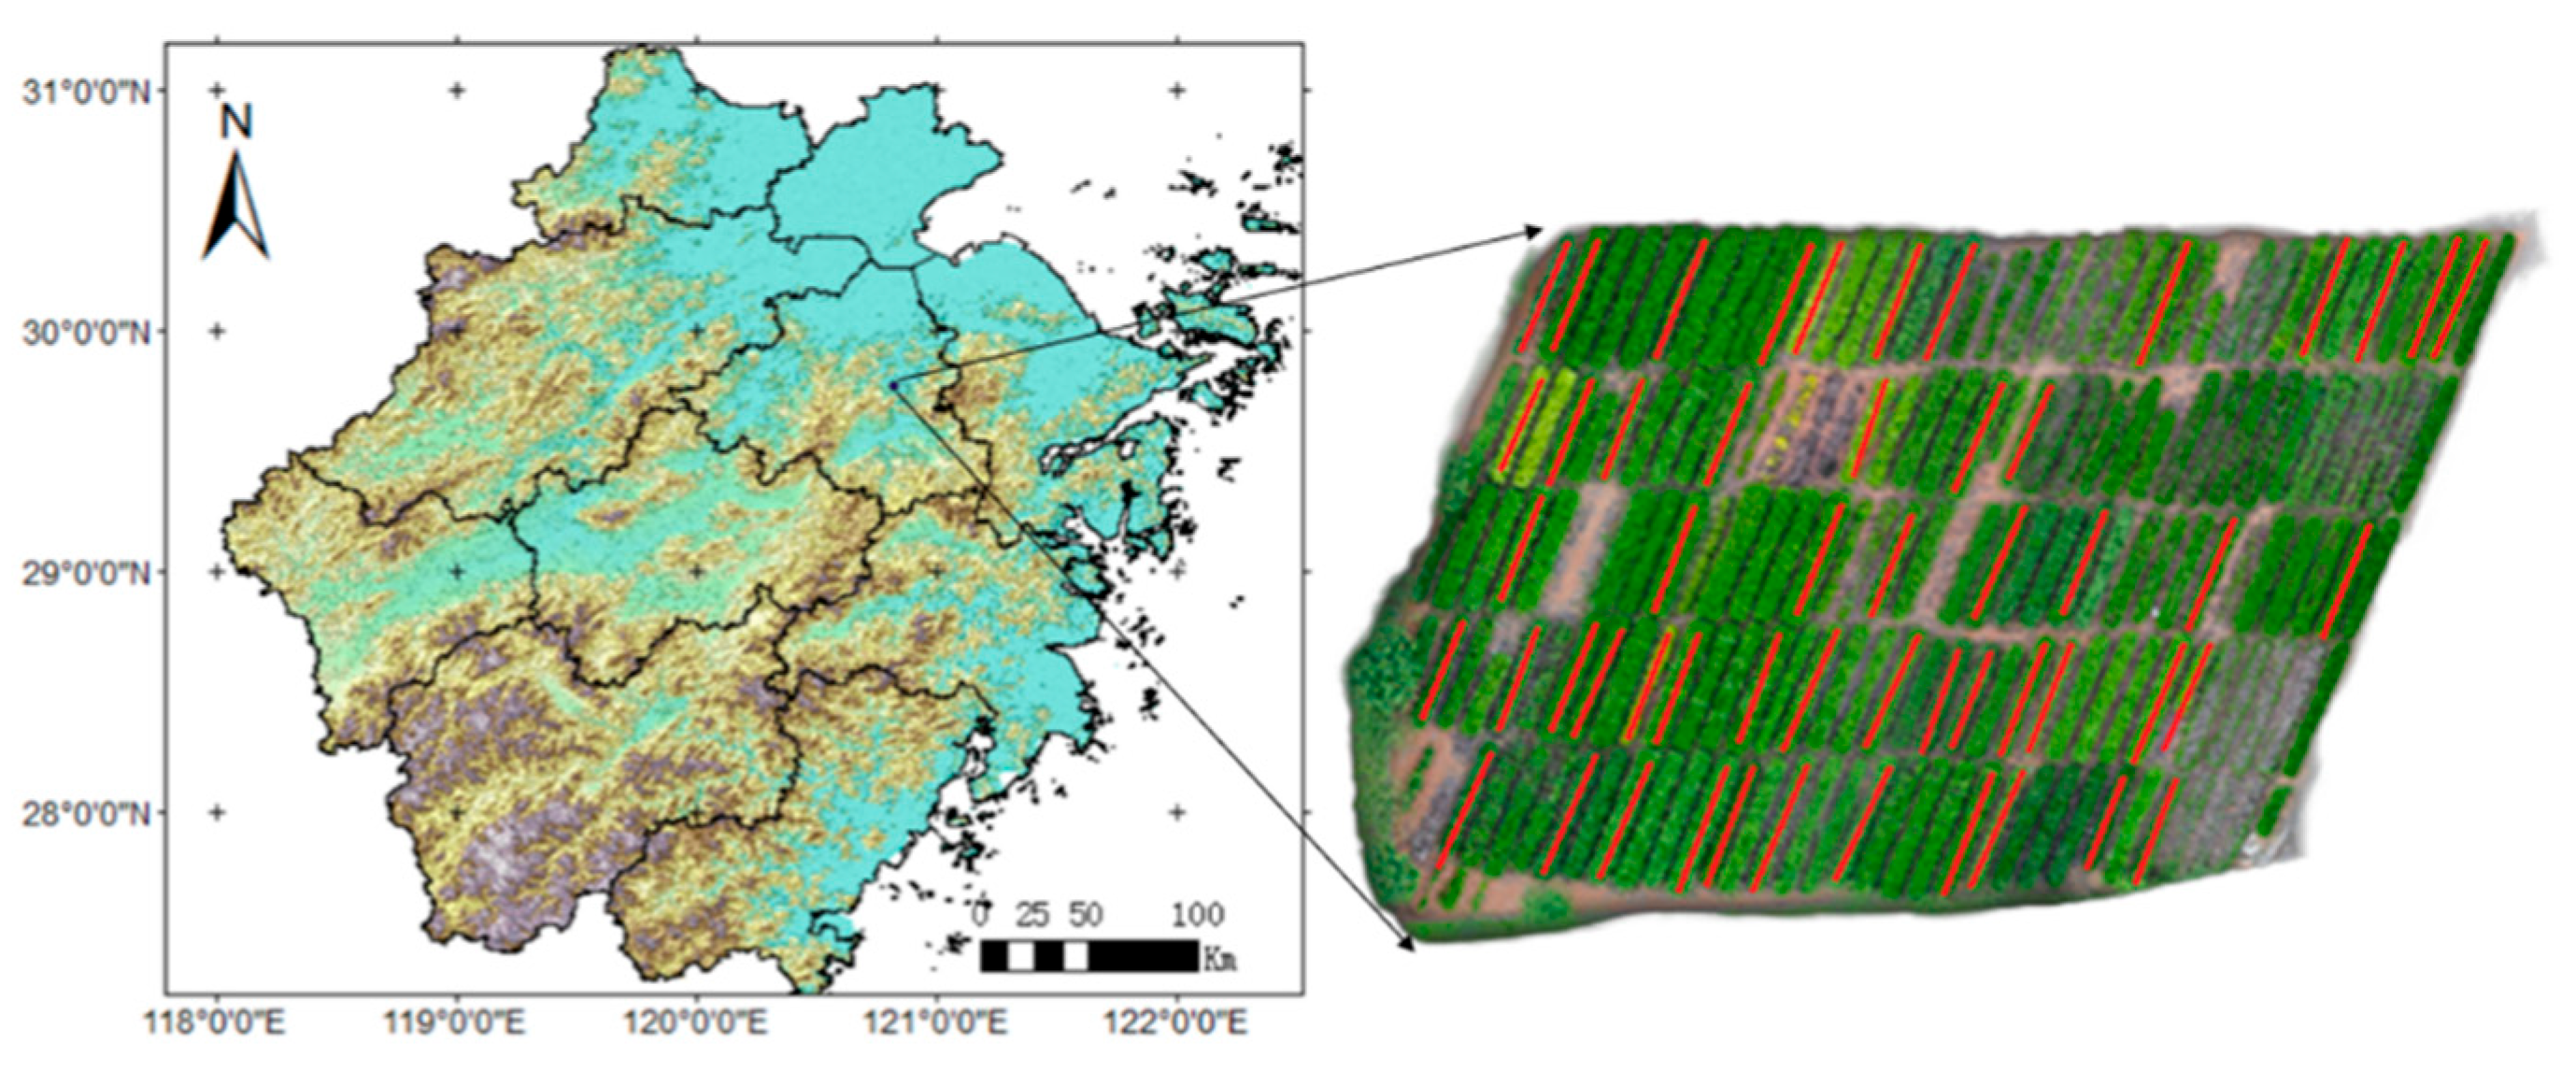
2.1. Research Area

The experiment was carried out at the comprehensive tea experimental site of the Tea Research Institute, Chinese Academy of Agricultural Sciences, located in Shengzhou City (as shown in Figure 1), Zhejiang Province, China. The site is in Chayuantou Village, Sange Street Town, at 119°44′ E and 30°45′ N, with an elevation of 63 m and flat terrain. This region is in the northern subtropical monsoon climate zone with mild weather, distinct seasons, abundant rainfall, and high humidity. The annual average temperature is 17.2 °C, annual precipitation is 1355.1 mm, and the site receives 1696.1 h of sunshine, with a frost-free period of 235 days. The experimental area covers 235 acres and exhibits high tea cultivar diversity. A total of 53 national and provincial-level tea varieties (e.g., Zhenong 139, Xin’an No.4, Zhongcha 108, Zhenong 21, Zhenong 113, Xicha No.8, and Longqu No.1; these cultivars are typically C. sinensis var. sinensis (the Chinese variety), common for green tea) aged 10–15 years were present on acidic soils optimal for tea cultivation.

2.2. Experiment

This experiment was conducted at the Shengzhou experimental site of the Tea Research Institute on 13–14 May 2023. The weather during the experiment was sunny, with a light breeze, an average temperature of 12.2 °C, and a maximum temperature of 27.4 °C. The relative humidity averaged 74%. Leaf samples were collected on 14 May 2023, during the spring tea season, which is widely regarded as the optimal harvest period for high-quality tea leaves in the study region. At this time, tea plants typically exhibit vigorous growth, and the concentrations of key quality-related compounds are close to their seasonal peaks. The selection of this specific date ensures consistency across samples and minimizes the confounding effects of environmental variability. Moreover, the weather conditions on the sampling day were clear and stable, providing suitable lighting for spectral measurements and reducing atmospheric interference, thereby enhancing the reliability of the collected data.

2.2.1. Sample Collection and Spectral Measurements

Fresh tea leaves were collected from various parts of tea trees within the same variety between 10:00 a.m. and 2:00 p.m. Leaves were chosen to ensure they were dry and free of dew. After excluding three abnormal samples, a total of 103 fresh tea leaf samples were retained.
Immediately after collection, samples were taken to the laboratory for spectral measurements using an ASD FieldSpec 4 spectrometer with a leaf clip attachment. The instrument covered the 350–2500 nm wavelength range, with a resolution of 3 nm in the visible–near-infrared region (VNIR: 350–1000 nm) and 10 nm in the shortwave infrared region (SWIR: 1000–2500 nm). Spectral sampling intervals were 1.4 nm for 350–1000 nm and 1.8 nm for 1000–2500 nm. A halogen lamp (color temperature 2900–3100 K) was used as the light source, and both the equipment and lamp were preheated for 1.5 h. For each sample, 10 fresh leaves were selected, and reflectance spectra were measured at five different points on each leaf with three repetitions per point. Outliers were removed, and the average spectrum of each sample was used for analysis. The white reference was recalibrated before each measurement.

2.2.2. Chemical Determination of AA and TP Content

The collected samples were de-enzymed, dried, and returned to the laboratory, where they were ground with a ball mill and extracted with ultrapure water for further analysis.

AA Content Measurement

The AA content in tea leaves was analyzed in accordance with the Chinese National Standard GB/T 8313-2018 [13], which specifies the method for determining the content of TP and catechins. The sample extract was reacted with a designated concentration of ninhydrin solution and phosphate buffer. After the reaction, the absorbance was measured at 570 nm using a spectrophotometer. Each sample was analyzed in triplicate to ensure accuracy.

TP Content Measurement

The determination of TP content followed the guidelines of the Chinese National Standard GB/T 8313-2018. The sample extract was treated with a prescribed concentration of ferric tartrate solution, and absorbance was recorded at 540 nm using a spectrophotometer. As with the AA analysis, each sample was measured in triplicate for reliable results.
The collected leaf samples were subjected to enzyme deactivation and drying processes before being transported to the laboratory for analysis. The samples were ground using a ball mill and extracted with ultrapure water for subsequent analysis. For AA content determination, the sample extracts were reacted with a specified concentration of ninhydrin solution and phosphate buffer. The absorbance at 570 nm was measured using a spectrophotometer for quantitative analysis. Similarly, the TP content was determined by treating the sample extracts with a standardized ferric tartrate solution, followed by spectrophotometric measurement at 540 nm. To ensure data reliability, each sample was analyzed in triplicate for both quality parameters. The quality control measures included the use of standard reference materials and routine calibration of the spectrophotometer.

2.3. Method

The 103 samples were divided into a training set and a test set using a 3:1 ratio, with every 4th sample selected for the test set to maintain a similar distribution of the target variables. The overall methodological workflow is shown in Figure 2.

2.3.1. FOD Spectral Data Processing

FOD is a branch of mathematical analysis introduced in the late 17th century by Leibniz and L’Hôpital [14,15,16]. Unlike classical integer-order calculus (such as first-order or second-order derivatives), FOD extends the operation to any real-number order, offering a more precise description of dynamic characteristics in complex systems, including subtle variations in spectral reflectance signals. After more than three centuries of development, several definitions of FOD have been proposed from different perspectives, such as the Riemann–Liouville, Grunwald–Letnikov, and Caputo definitions [17,18]. Although a unified formula for FOD has not yet been established, the Grunwald–Letnikov definition is widely adopted for its ease of use in numerical calculations and engineering applications [19,20,21].
In this study, the Grunwald–Letnikov definition was used to carry out FOD as follows [22].
For a function f ( x ) , the Grunwald–Letnikov fractional derivative of order α is defined as follows:
D α f x = l i m h 0 1 h α k = 0 ( 1 ) k ( α k ) f ( x k h )
where
  • D α f ( x ) denotes the fractional derivative of order α of f(x);
  • α ∈ R represents the fractional order of differentiation;
  • h represents a positive real number approaching zero;
  • ( α k ) represents the generalized binomial coefficient, defined as follows:
    α k = Γ α + 1 Γ k + 1 Γ α k + 1
Γ ( x ) denotes the Gamma function, which extends the factorial to complex and real number arguments.
The Grunwald–Letnikov formulation conceptualizes fractional differentiation as an infinite series, approximating the true derivative through a limiting process. This approach provides a direct link between integer-order and fractional-order calculus, offering intuitive insights into the nature of fractional derivatives. In practical applications, the infinite series is typically truncated to a finite number of terms for computational feasibility:
D α f x 1 h α k = 0 N ( 1 ) k ( α k ) f ( x k h )
where N is the chosen number of terms for truncation. The selection of N involves a trade-off between computational efficiency and accuracy.
The spectral data of fresh tea leaves were preprocessed using the FOD method to enhance the spectral features. Different orders of derivatives (from 0.1 to 1.0) were applied to determine the optimal order for modeling the quality indices.

2.3.2. CARS-PLSR Feature Band Selection

Spectral data typically contain a large number of highly correlated bands. This increases the complexity of the models [23,24]. To address this issue, the Competitive Adaptive Reweighted Sampling (CARS) algorithm was introduced. The core idea of CARS is to simulate a natural selection process by adaptively adjusting the weights of each band and ultimately selecting the optimal combination of bands that contribute most to the model’s performance. Specifically, the CARS algorithm employs Monte Carlo sampling and an exponentially decaying function to iteratively update the sampling probability of each band. Bands that have a stronger relationship with the target variables are assigned higher probabilities and are more likely to be retained [25].
CARS is essentially a feature selection method based on model performance. By evaluating a large number of randomly generated band combinations, CARS effectively removes redundant and irrelevant bands, improving the model’s interpretability and prediction accuracy. In hyperspectral data analysis, the CARS algorithm typically uses cross-validation to assess the performance of different band combinations and ultimately selects the subset of bands that minimize the cross-validation root mean square error (RMSEcv). The implementation of the CARS method can be described as follows.
Use Monte Carlo sampling to randomly select a fixed proportion of samples from the dataset [26]. Establish a PLSR model using these samples. The PLSR model can be ex-pressed as follows:
y = b X + e
where
  • y is the response variable vector;
  • X is the predictor variable matrix;
  • b = [ b 1 , b 2 , , b n ] T is the regression coefficient vector;
  • e is the error term vector.
Evaluate the importance of each predictor variable (or spectral band) using the absolute values of the regression coefficients | b i | .
Then, define a weight W i for each variable to quantify its relative importance:
W i = b i j = 1 n | b j |
Assign a weight of W i = 0 to variables removed by the CARS algorithm.
Iteratively eliminate variables with low weights using two methods. First, the Exponentially Decreasing Function (EDF) determines the number of variables to retain in each iteration. Then, Adaptive Reweighted Sampling (ARS) further refines the variable selection based on the weight.
Repeat the upper steps for N iterations. Finally, select the subset of variables that yields the lowest Root Mean Square Error of Cross-Validation RMSE as the optimal combination.
Since Monte Carlo sampling randomly selects a fixed proportion of samples in each iteration, rather than using all samples, the selected band combination has better adaptability. The EDF helps to quickly eliminate bands with low importance early in the iteration process, significantly reducing the computational burden. After multiple experiments, we set the number of Monte Carlo sampling iterations to 50, with 90% of samples used in each iteration.

2.3.3. CC-PLSR Method

For comparison, a simpler correlation coefficient (CC) method was also used for band selection. The CC method directly selects bands based on the correlation between spectral data and the target variables. The correlation threshold was set between 0 and 1, in increments of 0.1. The threshold yielding the best prediction accuracy for AAs and TPs was chosen. Both CC+PLSR and CARS+PLSR models were constructed for comparison.

2.3.4. Model Evaluation

Model performance was evaluated using the coefficient of determination (R2) and root mean square error (RMSE). R2, which ranges from 0 to 1, indicates how well the model explains the variance of the target variable. RMSE measures the average prediction error. The final performance metrics were based on the best of five iterations for each model.

2.3.5. Comparative Preprocessing Treatments

To validate the effectiveness of the FOD method, we also applied two commonly used spectral preprocessing techniques for comparison: standard normal variate (SNV) and multiplicative scatter correction (MSC). These methods are widely used to remove baseline shifts and scatter effects in hyperspectral data. The same modeling framework (CARS+PLSR) was applied to SNV- and MSC-preprocessed spectra to ensure a fair comparison with the FOD approach.

3. Results

3.1. AA and TP Content in Fresh Tea Leaves

The analysis of the fresh tea leaves revealed that tea polyphenol (TP) content averaged 20.85%, with values ranging from 11.94% to 30.25%. Amino acid (AA) content averaged 2.64%, with a range from 1.82% to 5.47%. These distributions (as shown in Figure 3) approximate a normal distribution, consistent with typical tea quality observed in May.

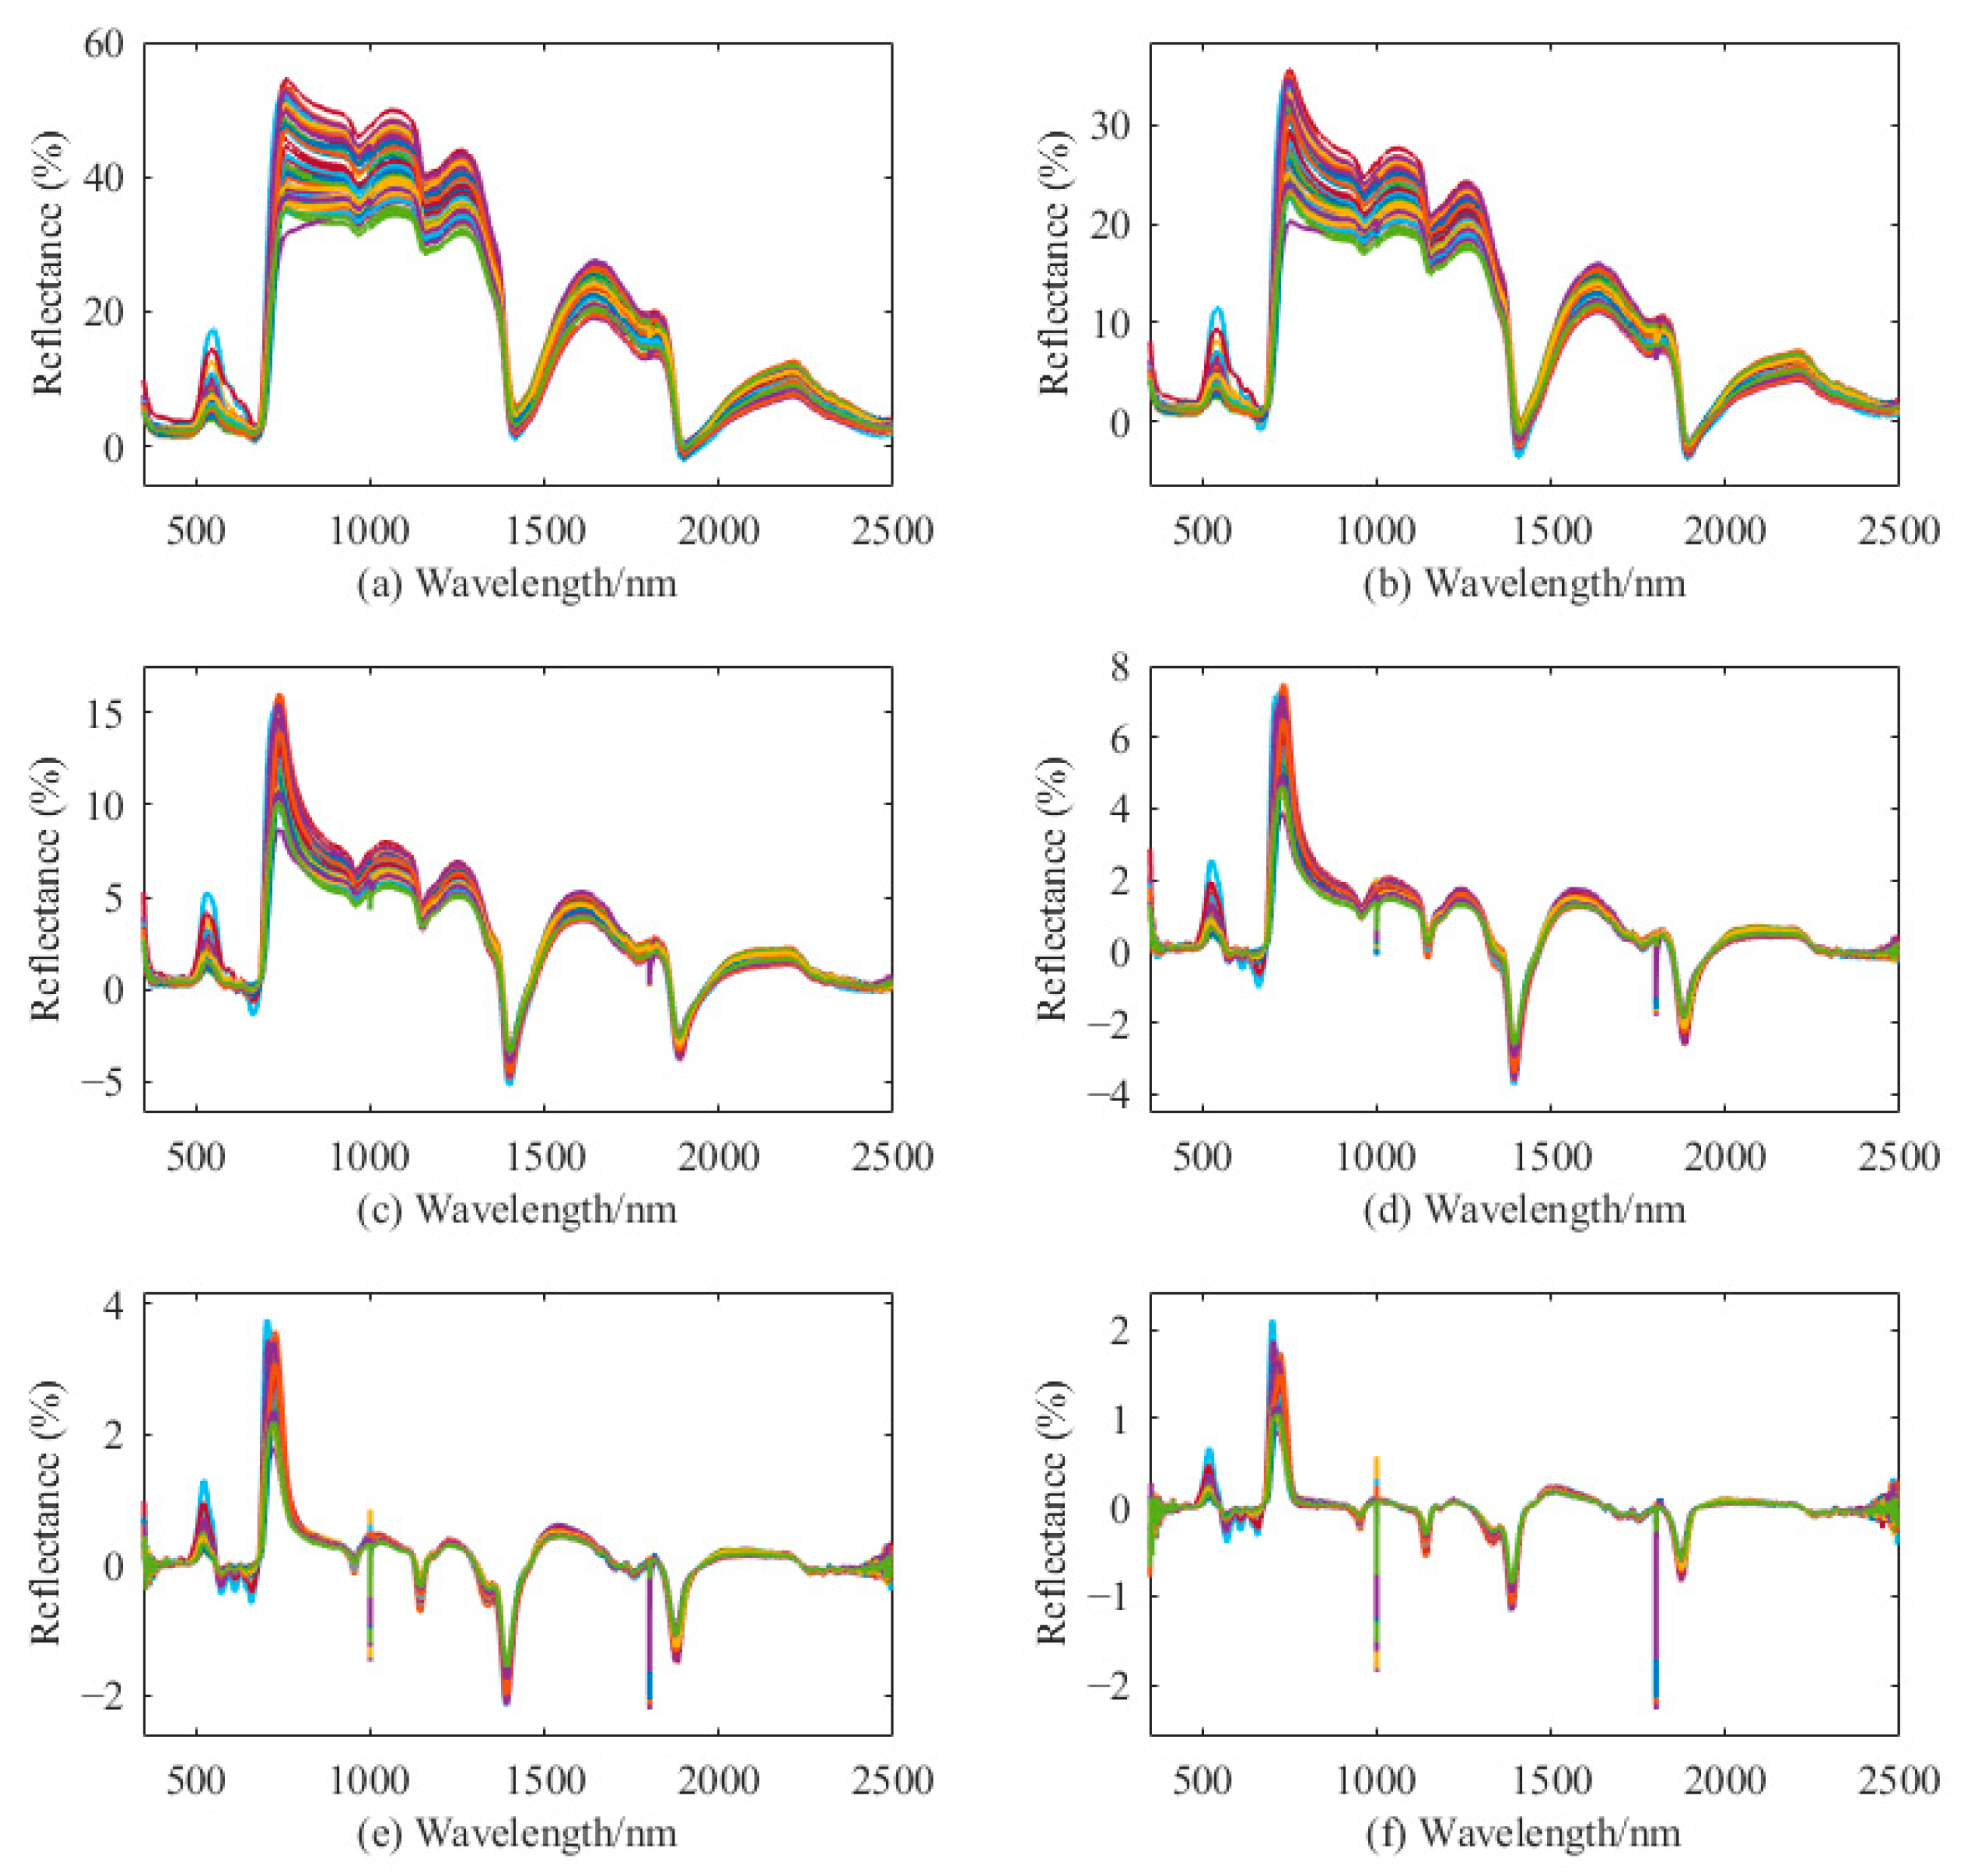
3.2. Hyperspectral Characteristics of AA and TP

Fractional-order differentiation (FOD) was applied to the hyperspectral data with derivative orders from 0.1 to 1.0 to assess its impact on spectral characteristics. As shown in Figure 4, lower FOD orders (0.1–0.2) mainly smoothed the spectra and reduced baseline drift. In contrast, higher orders (e.g., 0.5 and above) amplified local fluctuations, which made the spectral curves sharper but also increased noise—especially in regions with low reflectance.
Figure 5 and Figure 6 illustrate the correlation coefficient curves between AAs, TPs, and different wavelengths at various FOD orders. For AAs, a low-order FOD (0–0.3) produced smoother correlation curves, while middle orders (0.4–0.7) introduced noticeable fluctuations near wavelengths such as 400 nm, 600 nm, 1150 nm, 1700 nm, and around 2250–2400 nm. For TPs, a mid-order FOD (0.4–0.7) enhanced correlations around 400 nm, 620 nm, 1150 nm, 1400 nm, and 2300–2400 nm. At high FOD orders (0.8–1.0), increased volatility was observed across the spectral range for both AA and TP.
The correlation curve of TPs is shown in Figure 6. In the middle order (0.4–0.7), more fluctuations start to appear near 400 nm and 2400 nm, and the bands near 620 nm, 1150 nm, 1400 nm, and 2300 nm start to show higher correlations; in the high order (0.8–1.0), the fluctuations at 350–500 nm, 800–1100 nm, and 2100–2500 nm begin to increase.

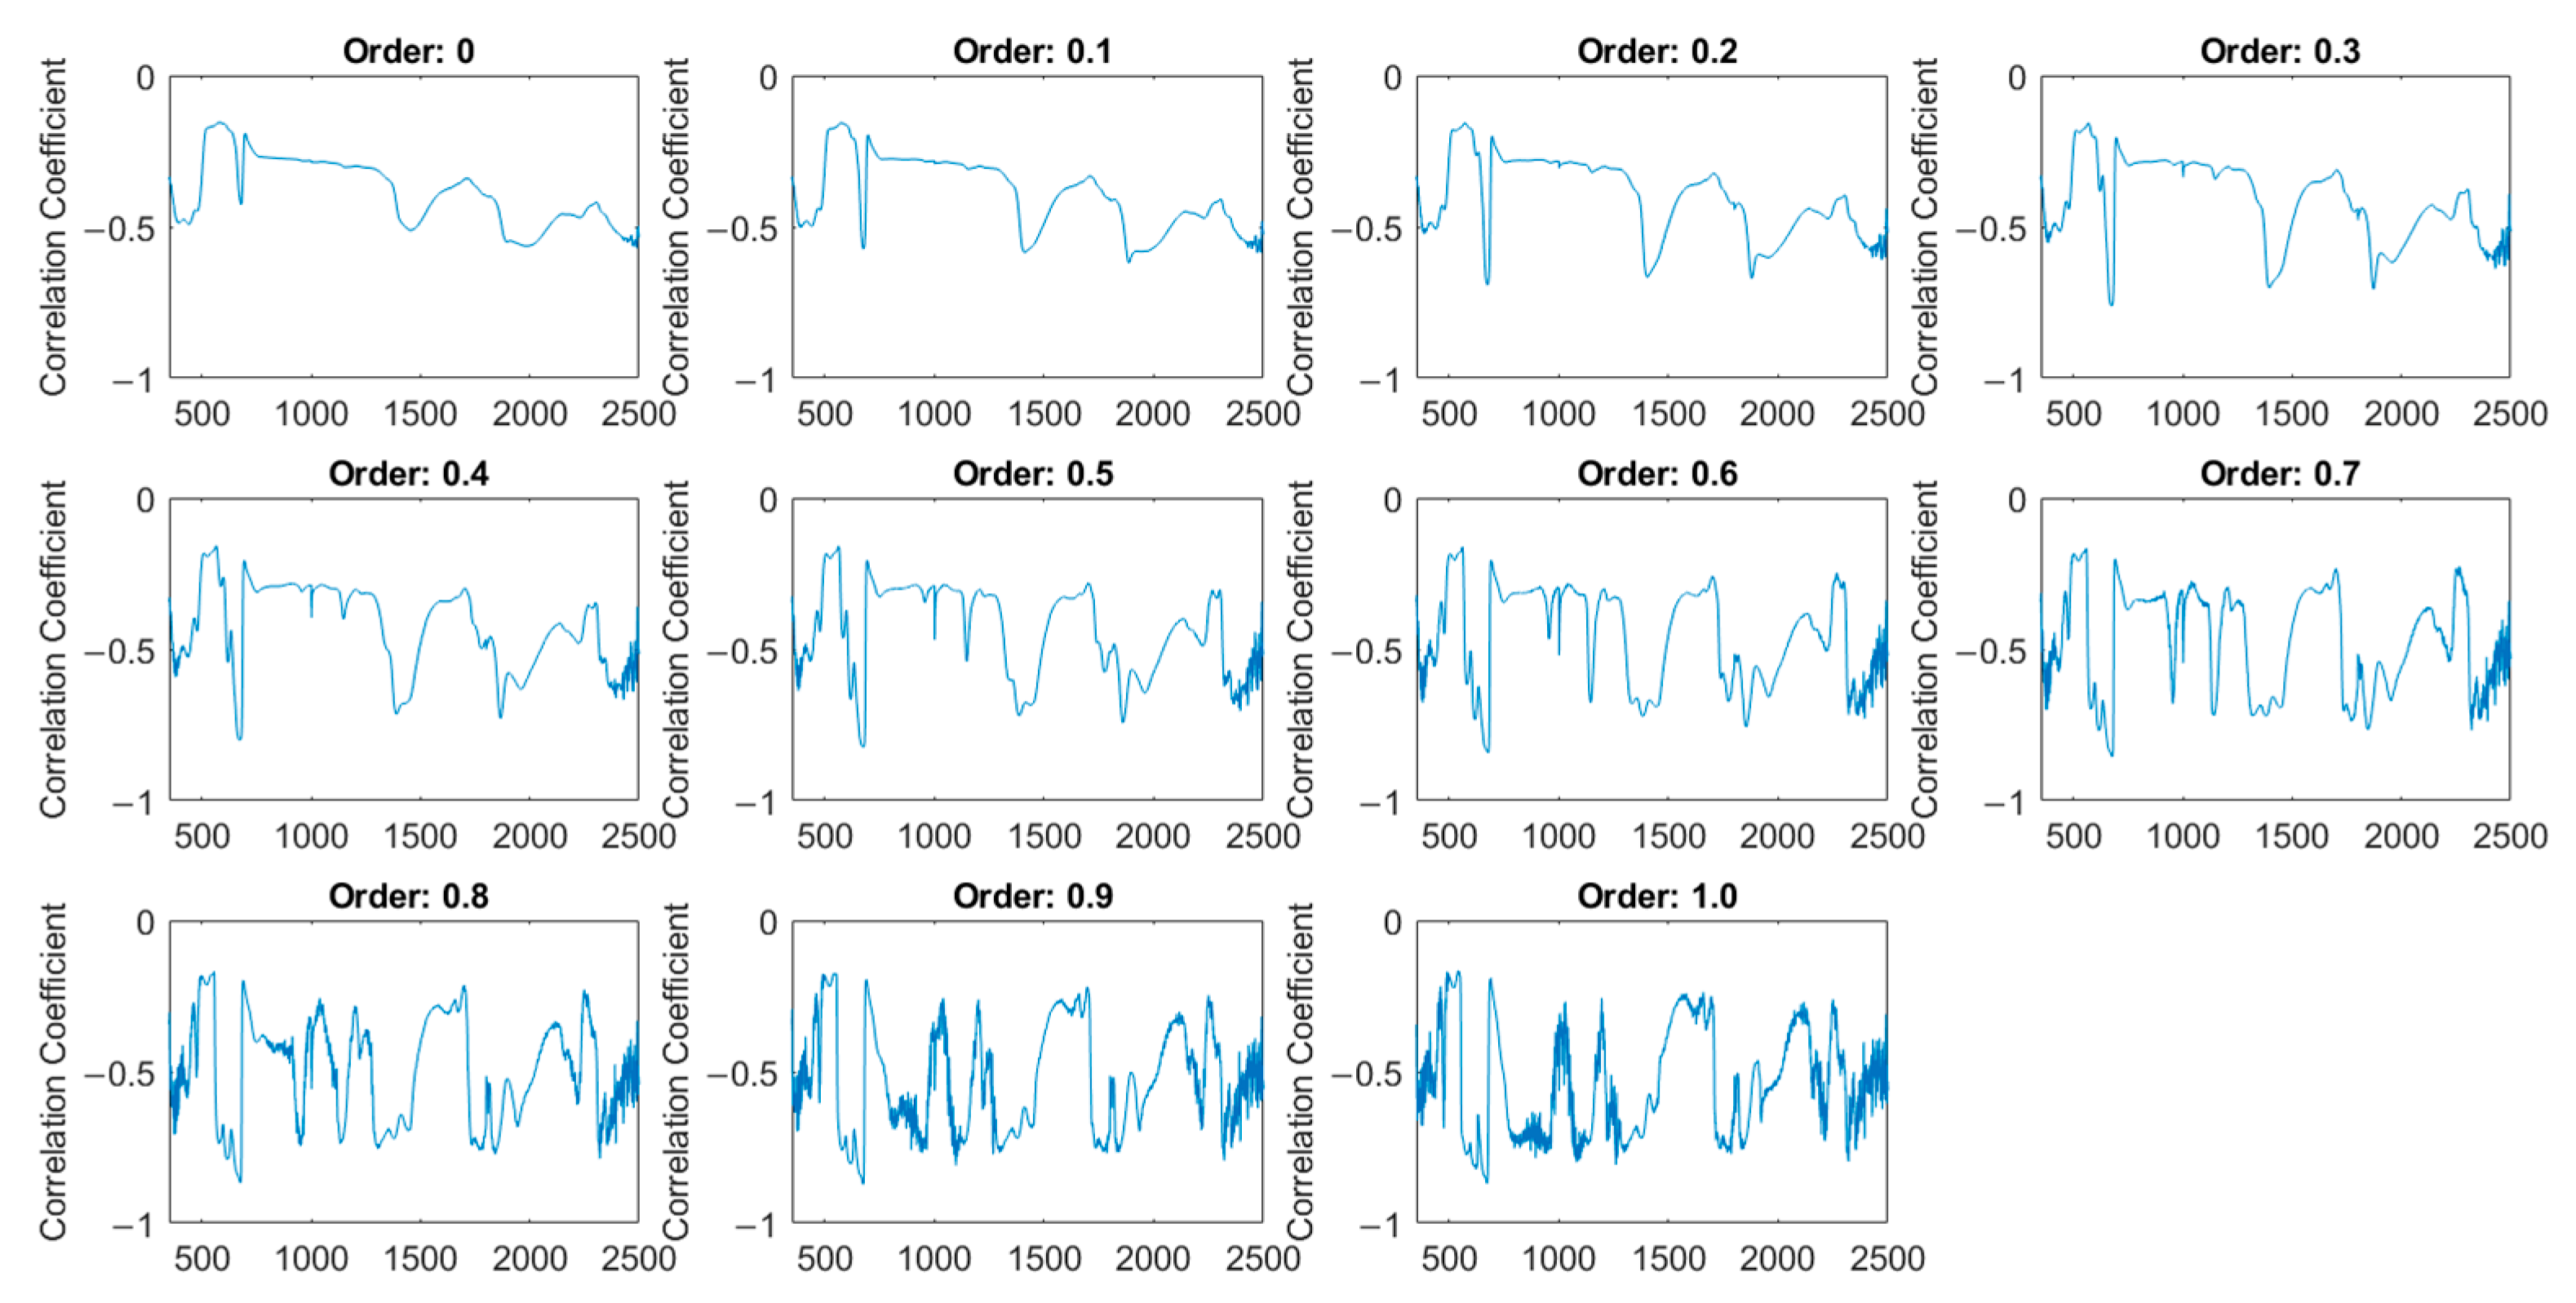
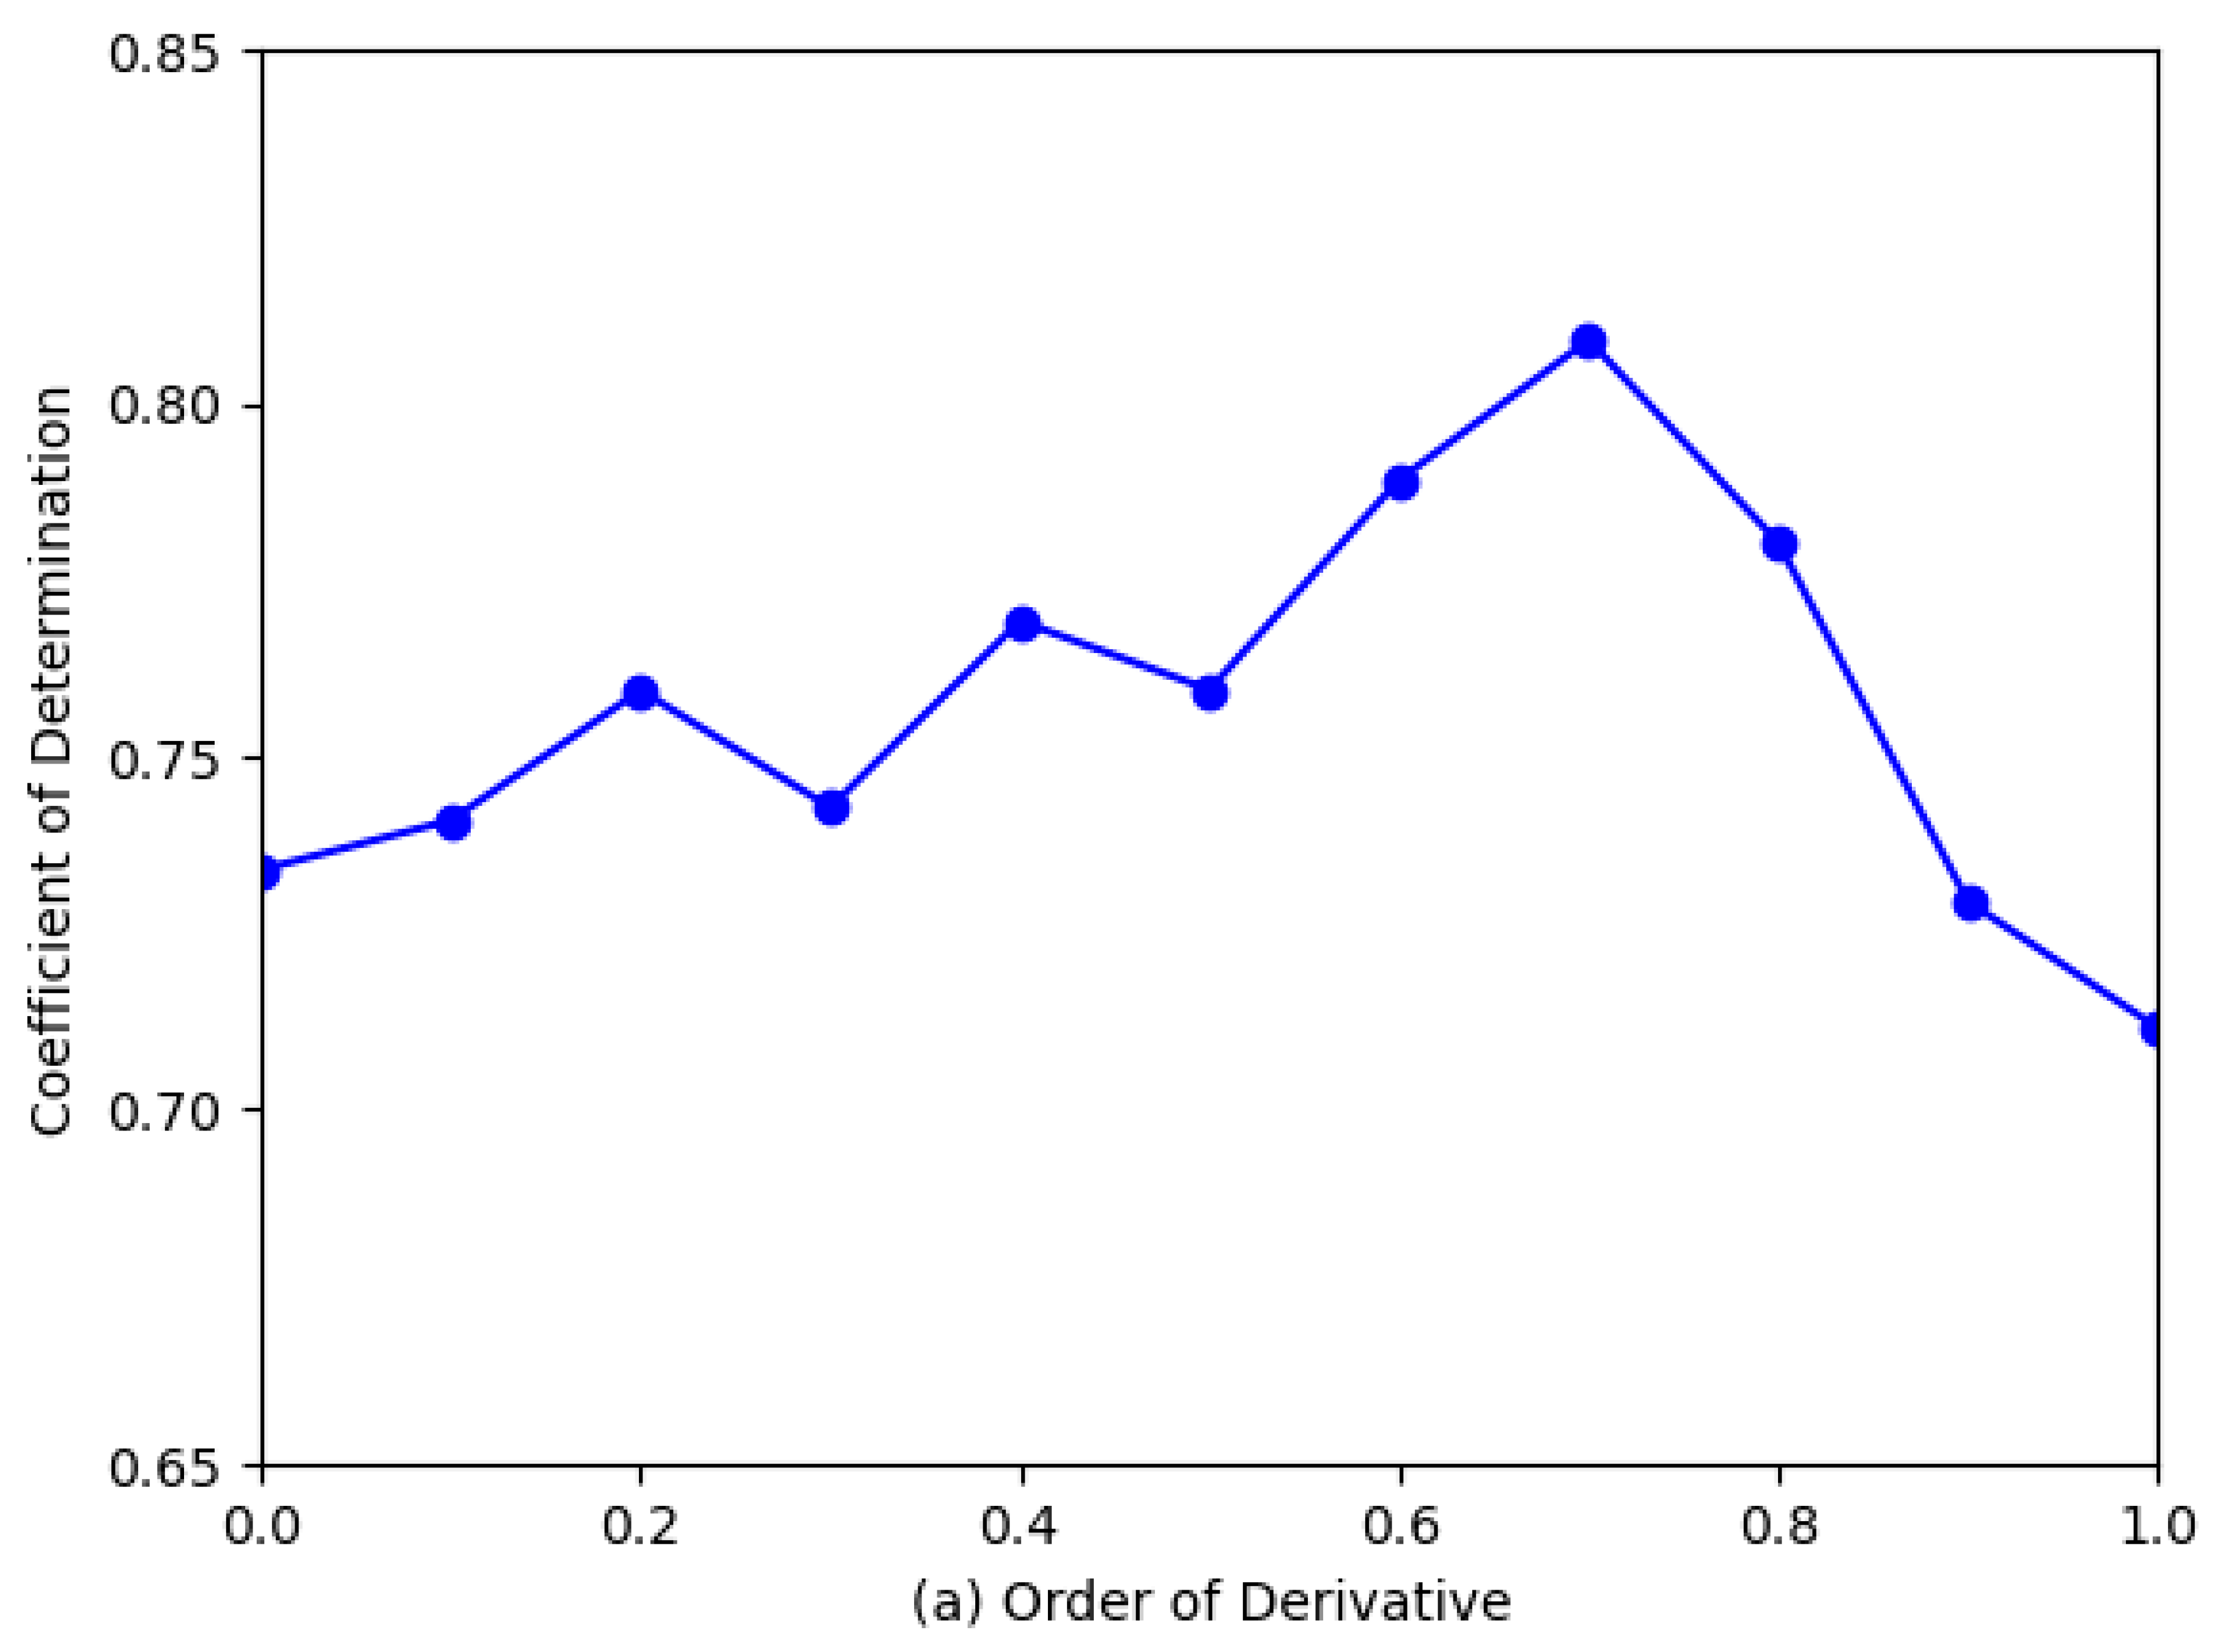
3.3. Determination of Optimal FOD Order

To identify the best FOD order for modeling tea quality indices, the spectral data processed with FOD at different orders were input into CARS+PLSR models. The accuracy of the test set was used as the selection criterion, with each order being evaluated five times to avoid experimental bias. As displayed in Figure 7, for AA, the maximum R2 for the test set was achieved at the FOD order of 0.7 (R2 = 0.80). For TP, the best performance was observed at the FOD order of 0.1 (R2 = 0.42). Different quality indices in fresh tea leaves exhibit varying spectral characteristics, and the FOD order that best highlights these characteristics differs for each compound.
As shown in Figure 8, panels (a) through (f) demonstrate the predictive capabilities of the CARS-PLSR models corresponding to AA’s 0th-, 0.7th-, and 1st-order derivatives, and TP’s 0th-, 0.1st-, and 1st-order reflectance derivatives, respectively. The results demonstrate that the application of FOD improves model accuracy compared to raw spectra and integer-order derivatives. In particular, FOD more effectively captures the spectral features related to the biochemical compounds in tea leaves.
Figure 8 shows the test results for predicting AAs and TPs in fresh tea leaves using CARS-PLSR models under different fractional-order derivative (FOD) preprocessing methods. For AAs, the 0.7th-order derivative gave the best performance, with a relatively high R2 of 0.8089 and the lowest RMSE of 0.2986, whereas the 0th- and 1st-order derivatives had lower R2 values and higher RMSE values. In contrast, the best results for TPs were obtained with the 0.1th-order derivative, which reached an R2 of 0.4247 and an RMSE of 3.9064, although the overall accuracy for TPs was still lower than for AAs. These findings suggest that choosing the right fractional derivative order can help highlight the spectral features most relevant to each compound, but the optimal orders differ.
Table 1 presents the inversion accuracy of two tea quality indicators, AAs and TPs, using different band selection algorithms. In the table, R train 2 and R test 2 represent the coefficient of determination for the training set and test set, respectively.
For the AA model, the CC+PLSR approach yielded an R train 2 of 0.67, with an RMSE of 0.51, in the training set, and an R test 2 of 0.63 with an RMSE of 0.47 in the test set. For the TP model, the R train 2 was 0.48, with an RMSE of 3.21, and the R test 2 was 0.39, with an RMSE of 4.57. The overall accuracy of CC+PLSR was relatively low, particularly for the TP model, where both the training and test R2 values were below 0.5, indicating a weak predictive capability.
In contrast, the CARS+PLSR method achieved higher accuracy for both AAs and TPs. For the AA model, the R train 2 was 0.86, and the R test 2 was 0.80, demonstrating robust model performance. For the TP model, the R train 2 reached 0.70, and the R test 2 was improved to 0.42, with lower RMSE values compared to the CC+PLSR method. Although CARS requires multiple iterations to identify the optimal band combination, the incorporation of EDF and ARS algorithms allows for the elimination of low-importance bands during the early stages of iteration, shortening the modeling time from 13.58 s (CC-PLSR) to 5.27 s (CARS-PLSR).
Compared to the CC+PLSR method, the CARS+PLSR approach proved to be a superior band selection algorithm, capable of identifying the optimal combination of bands more efficiently and enhancing the inversion capability of the model.

3.4. Analysis of CARS-Selected Feature Bands

The CARS-selected feature bands for AAs and TPs are shown in Table 2. For AAs, 19 bands were selected, including wavelengths such as 372 nm, 406 nm, 676 nm, 1415 nm, 1892 nm, and others. These bands are associated with the stretching and bending vibrations of N–H bonds, which are prominent in the molecular structure of AAs. For example, the 1415 nm band is close to the first overtone of the N–H stretching vibration at 1450–1470 nm, and the 1892 nm band is related to the combination of N–H stretching and H–N–H bending vibrations around 1900–1950 nm. However, these bands are also susceptible to interference from other components, such as moisture, proteins, and other organic compounds [27,28].
For TPs, the CARS-selected bands included 22 wavelengths, such as 354 nm, 645 nm, 1021 nm, 1428 nm, 2136 nm, and others. The 1428 nm band is close to the first overtone of O–H and C–H stretching vibrations at 1450–1460 nm, while the 1658 nm band may be attributed to the first overtone of C–H bonds in the aromatic ring and combination frequencies involving hydroxyl groups [29]. The 2136 nm band could be associated with the combination of C–H stretching and C=C stretching vibrations in the aromatic ring [30,31].
Overall, the selected characteristic bands for AAs and TPs are primarily influenced by the molecular structure of their functional groups and optical vibration modes, especially C–H, N–H, and conjugated systems. However, the exact locations of these bands may shift due to interference from other compounds. Assigning the selected bands to specific functional groups proved moderately challenging. While key peaks around 2284 nm (N–H) and 1661 nm (O–H) match known amino acid and polyphenol bonds, nearby C–H overtone features can overlap and cause ambiguity. Thus, some assignments may be confounded by signals from related compounds. These limitations underscore the need for targeted pure-compound spectra in the 350–2500 nm range to confirm and refine our attributions in future work.

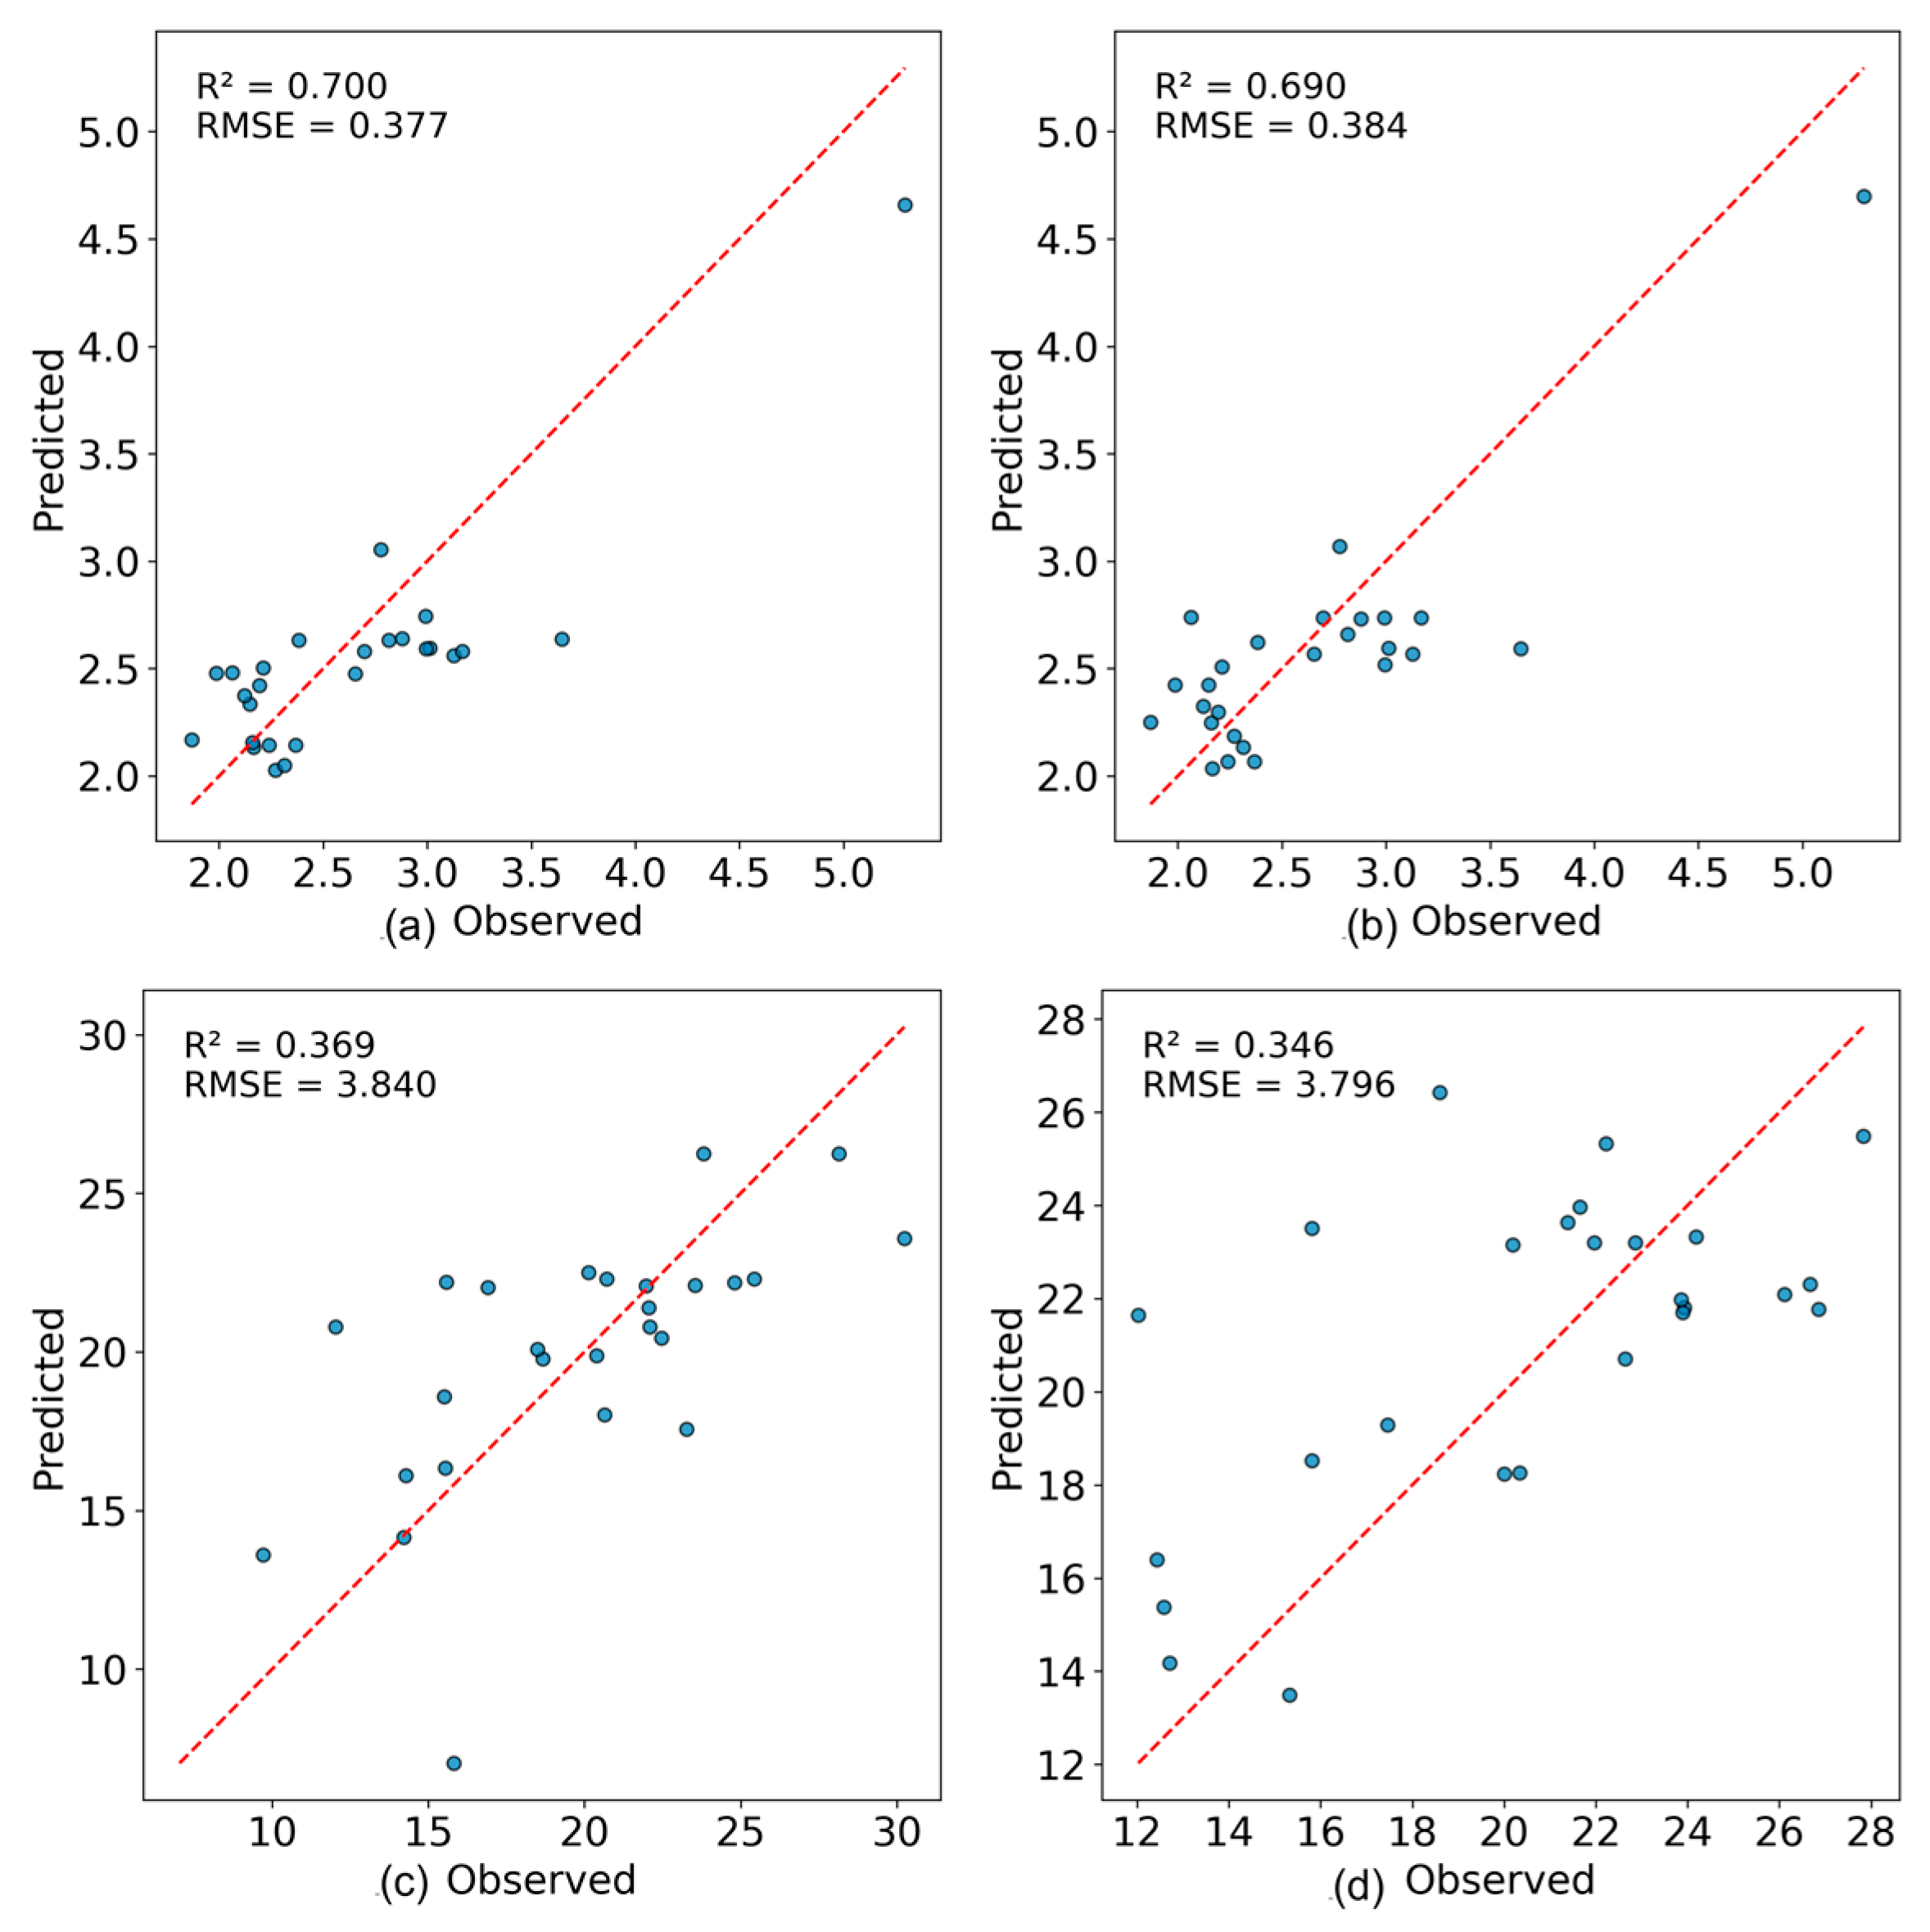
3.5. Analysis of Prediction Based on MSC and SNV Preprocess

The results in Figure 9 show that MSC preprocessing yields slightly tighter clustering around the 1:1 line than SNV for amino acid (AA) prediction, improving the R2 from 0.690 to 0.700 and reducing the RMSE from 0.384 to 0.377. This indicates that MSC’s multiple scatter correction more effectively compensates for particle-size and path-length variations in fresh leaves. For polyphenol (TP) estimation, both corrections produce lower accuracy—R2 = 0.369 with MSC and 0.346 with SNV—reflecting the greater sensitivity of TP signals to residual water and structural heterogeneity. Nevertheless, MSC still offers a modest gain over SNV. Overall, while neither scatter correction matches the performance of fractional-order derivatives in this study, MSC provides the best balance between noise suppression and feature preservation when only linear preprocessing is applied.

4. Discussion

4.1. Comparison of Integer-Order and Fractional-Order Differential Spectra

Traditional integer-order derivatives (e.g., first or second derivatives) apply a fixed transformation that can amplify noise along with the signal. In contrast, fractional-order differentiation (FOD) offers a flexible approach by allowing the derivative order to be adjusted. This flexibility enables FOD to enhance subtle spectral features while suppressing noise, providing a better balance between smoothing and detail extraction [11,12]. Such adaptability is especially important when dealing with fresh tea leaves, where water content and complex biochemical compositions pose additional challenges.

4.2. Optimal Fractional Order for Quality Prediction

Our results indicate that the optimal FOD order varies for different tea quality indices. For amino acids (AAs), the model with an FOD order of 0.7 produced the best model performance, with the test set R2 increasing from 0.73 to about 0.80 and the RMSE decreasing accordingly. In contrast, tea polyphenols (TPs) achieved optimal results at an FOD order of 0.1, which modestly improved the R2 from 0.40 to 0.42. These differences likely arise from the inherent spectral characteristics of AAs and TPs. AAs exhibit more distinct absorption features that benefit from moderate differentiation, while the smoother spectral profile of TPs requires minimal processing to avoid excessive noise amplification. FOD offers clear advantages. Unlike MSC and SNV—which apply linear corrections to remove scatter effects—FOD lets us tune the derivative order continuously between 0 and 1 [32,33]. This flexibility both sharpens subtle absorption peaks and limits noise amplification. As a result, FOD–CARS–PLSR delivers a higher R2 and lower RMSE than MSC–CARS–PLSR or SNV–CARS–PLSR on fresh leaves. By targeting specific orders, FOD adapts to each compound’s spectral signature in a way that simple corrections cannot [34,35].

4.3. Comparison of CARS and CC Feature Band Extraction

Two methods were employed for selecting sensitive spectral bands: the CC method and CARS method. The CC method, while straightforward, selects bands based solely on their individual correlation with the target variable and may miss complex interactions. In contrast, CARS iteratively refines band selection through Monte Carlo sampling and adaptive reweighting [25]. This process effectively eliminates redundant bands and enhances model performance. Our results showed that the CARS+PLSR model outperformed the CC+PLSR model in both prediction accuracy and computational efficiency. For example, the AA model using CARS+PLSR achieved a test R2 of 0.80 compared to 0.63 with the CC method, and the model building time was reduced significantly. PLSR excels at handling highly collinear spectral data by projecting predictors into a small set of orthogonal latent variables. CARS then selects the most informative wavelengths, removing redundant or noisy bands. Together, PLSR and CARS reduce overfitting and improve model stability, which explains their better performance compared to simpler algorithms.

4.4. Evaluation of AA and TP Prediction Models and Future Direction

The combination of FOD preprocessing and CARS-based band selection with PLSR modeling provided promising improvements for predicting AA and TP content in fresh tea leaves. For AAs, the method increased the R2 by approximately 7% compared to raw spectra or first-order derivatives, while for TPs, the improvement was more modest. Although these enhancements indicate the potential of FOD and CARS in capturing key spectral features, the overall prediction accuracy remains preliminary. Limitations include the relatively small sample size and the focus on leaf-level measurements only.
Future work should consider expanding the sample set to include a broader range of tea varieties and growing conditions. Additionally, exploring finer increments in FOD order and extending the analysis to canopy-level measurements could further validate and enhance the robustness and generalizability of the proposed method.

4.5. Comparison with Other Studies

In comparison to our study on fresh tea leaves—where FOD–CARS–PLSR over 350–2500 nm yielded R2 = 0.80 for AA and R2 = 0.42 for polyphenols—other investigations report higher accuracy under different conditions. For example, J. Wang et al. (2023) [36] also measured fresh leaves across the same spectral range but used first-order derivatives, achieving R2 = 0.79 for AA and only 0.28 for polyphenols. In contrast, Bian et al. (2013) [37] applied CARS–PLSR to raw spectra of piled dried leaves and reached R2 = 0.89 for polyphenols and 0.81 for AA, while Schulz et al. (1999) [9] employed NIRS on dried leaf extracts (350–2500 nm) to obtain R2 values above 0.85 for key catechins. Chanda et al. (2017) [38] focused on leaf powder in the 900–1701.5 nm region with SNV preprocessing, reporting an R2 between 0.91 and 0.95 for polyphenols, and Bian et al. (2010) [39] achieved a cross-validation R2 of 0.97 for polyphenols and 0.99 for AA on tea powder over 1000–2500 nm. More recently, Zareef et al. (2023) [40] analyzed black tea extracts by FT-NIR (4000–10,000 cm−1) and obtained R2 = 0.91 for polyphenols using a Si-CARS–PLS model. These higher R2 values from dried leaves and powders likely reflect reduced water interference and structural heterogeneity, while narrower spectral windows can miss important overtone bands. Our fractional-order derivative approach, although more sensitive to surface moisture variation in fresh leaves, offers finer tuning between amplifying subtle absorption features and suppressing noise, highlighting its potential for applications where maintaining sample integrity is critical.
These performance differences between AA and TP prediction models may be attributed to multiple factors. First, the choice of spectral technology and the variety of tea and data processing methods (e.g., PLSR, Support Vector Machines, and deep learning) may all have an influence on model performance. Advanced techniques are capable of capturing more complex spectral–chemical relationships, thereby enhancing prediction accuracy. Second, sample properties and diversity play a critical role. Different varieties of tea and sample forms (e.g., powder, dried leaf, and fresh leaf) may exhibit unique spectral characteristics that affect the generalizability and accuracy of the model. Moreover, variations in sample collection, preparation, and measurement can also introduce biases that contribute to the differences observed across studies.
While our study focuses on tea fresh leaves, the proposed combination of fractional-order derivatives and Competitive Adaptive Reweighted Sampling with PLSR is broadly applicable. By adjusting the fractional order and sampling scheme, researchers can employ this approach to quantify key quality indicators in fruits, vegetables, grains, or even non-plant materials (e.g., soil organic matter and water pollutants). Such adaptability makes the FOD–CARS–PLSR framework a versatile asset for diverse biochemical sensing tasks in precision agriculture, food safety, and environmental monitoring.
This study does have some limitations that could be improved in future studies, including a limited sample size and constrained indicators (AAs and TPs). Importantly, it was also limited to the fresh leaf scale, excluding canopy-level data, which could enhance broader applications in tea production.

5. Conclusions

This study shows that fractional-order differentiation (FOD) combined with CARS improves PLSR predictions of amino acid (AA) and tea polyphenol (TP) content in fresh leaves. Using an optimal FOD of 0.7 raised the AA test R2 from 0.73 to 0.80 and lowered the RMSE from 0.30% to 0.25%. For TPs, an FOD of 0.1 increased the R2 from 0.40 to 0.42 and decreased the RMSE from 4.03% to 3.96%. Achieving these accuracies in fresh leaves is notable, given their high moisture and variable surfaces. CARS also beat simple correlation-based band selection, cutting computation time while boosting accuracy. Future work will validate our models across diverse cultivars to assess genetic and environmental effects and study each compound’s spectral features. The FOD+CARS algorithm also makes this method practical for automated industrial tea grading. We note that key absorption bands for amino acids and polyphenols can be linked to N–H and O–H bond vibrations. However, these bands often overlap with similar vibrations from water, cellulose, lignin, and other phenolic compounds. Such overlap can introduce confounding signals and reduce the specificity of each assignment. As a result, our current band assignments carry only moderate confidence. Further validation—using pure compounds and advanced spectroscopic databases—will be needed to resolve these overlaps and improve model reliability. Although tested on fresh tea leaves, our FOD–CARS–PLSR method can be applied to other crops by tuning the derivative order and sampling scheme. This makes it a versatile tool for biochemical sensing in precision agriculture, food safety, and environmental monitoring.

Author Contributions

S.L.: Writing—original draft preparation, Formal analysis, Methodology, Investigation. R.S.: Methodology, Supervision, Writing—review and editing. X.L.: Methodology, Supervision, Writing—review and editing. Y.L.: Methodology, Supervision, Writing—review and editing. L.Z.: Investigation, Writing—review and editing. X.H.: Investigation, Writing—review and editing. Y.X.: Investigation, Writing—review and editing. All authors have read and agreed to the published version of the manuscript.

Funding

This study was funded by the National Natural Science Foundation of China (U24A20423), the National Key Research and Development Program of China (2023YFD1601700), the National Key Research and Development Program of China (Grant No. 2019YFD1002203), and the Key Research and Development projects of Zhejiang Province (2021C02036).

Data Availability Statement

All data generated or analyzed in this study are available from the author upon reasonable request.

Acknowledgments

For the purpose of refining the language and ensuring clarity in our manuscript, we used ChatGPT (OpenAI) as a language polishing tool. The use of ChatGPT was strictly limited to enhancing the English language presentation.

Conflicts of Interest

The authors declare no conflicts of interest.

References

  1. Raza, A.; Chaoqun, C.; Luo, L.; Asghar, M.A.; Li, L.; Shoaib, N.; Yin, C. Combined application of organic and chemical fertilizers improved the catechins and flavonoids biosynthesis involved in tea quality. Sci. Hortic. 2024, 337, 113518. [Google Scholar] [CrossRef]
  2. Wang, P.; Zhao, B.; Yin, Z.; Gao, X.; Liu, M. Structure elucidation and anticancer activity of a heteropolysaccharide from white tea. Carbohydr. Polym. 2024, 333, 121976. [Google Scholar] [CrossRef] [PubMed]
  3. Ge, S.; Wang, Y.; Shen, K.; Wang, Q.; Ahammed, G.J.; Han, W.; Jin, Z.; Li, X.; Shi, Y. Effects of Differential Shading on Summer Tea Quality and Tea Garden Microenvironment. Plants 2024, 13, 202. [Google Scholar] [CrossRef] [PubMed]
  4. Zhou, P.; Chen, M.; Bao, Q.; Wang, H.; Wang, Y.; Fu, H. The Effect of Intercropping with Different Leguminous Green Manures on the Soil Environment and Tea Quality in Tea Plantations. Microorganisms 2024, 12, 1721. [Google Scholar] [CrossRef]
  5. Ai, S.R.; Wu, R.M.; Yan, L.Y.; Wu, Y.H. Measurement of the Ratio of Tea Polyphenols to Amino Acids in Green Tea Infusion Based on near Infrared Spectroscopy. Adv. Mater. Res. 2011, 301–303, 1093–1097. [Google Scholar] [CrossRef]
  6. Wang, L.; Xu, R.; Hu, B.; Li, W.; Sun, Y.; Tu, Y.; Zeng, X. Analysis of free amino acids in Chinese teas and flower of tea plant by high performance liquid chromatography combined with solid-phase extraction. Food Chem. 2010, 123, 1259–1266. [Google Scholar] [CrossRef]
  7. Li, H.; Wang, Y.; Fan, K.; Mao, Y.; Shen, Y.; Ding, Z. Evaluation of important phenotypic parameters of tea plantations using multi-source remote sensing data. Front. Plant Sci. 2022, 13, 898962. [Google Scholar] [CrossRef]
  8. Moshou, D.; Bravo, C.; Wahlen, S.; West, J.; McCartney, A.; De Baerdemaeker, J.; Ramon, H. Simultaneous identification of plant stresses and diseases in arable crops using proximal optical sensing and self-organising maps. Precis. Agric. 2006, 7, 149–164. [Google Scholar] [CrossRef]
  9. Schulz, H.; Engelhardt, U.H.; Wegent, A.; Drews, H.-H.; Lapczynski, S. Application of Near-Infrared Reflectance Spectroscopy to the Simultaneous Prediction of Alkaloids and Phenolic Substances in Green Tea Leaves. J. Agric. Food Chem. 1999, 47, 5064–5067. [Google Scholar] [CrossRef]
  10. Dong, C.; Li, J.; Wang, J.; Liang, G.; Jiang, Y.; Yuan, H.; Yang, Y.; Meng, H. Rapid determination by near infrared spectroscopy of theaflavins-to-thearubigins ratio during Congou black tea fermentation process. Spectrochim. Acta Part A Mol. Biomol. Spectrosc. 2018, 205, 227–234. [Google Scholar] [CrossRef]
  11. Schmitt, J.M. Fractional Derivative Analysis of Diffuse Reflectance Spectra. Appl. Spectrosc. 1998, 52, 840–846. [Google Scholar] [CrossRef]
  12. Zununjan, Z.; Turghan, M.A.; Sattar, M.; Kasim, N.; Emin, B.; Abliz, A. Combining the fractional order derivative and machine learning for leaf water content estimation of spring wheat using hyper-spectral indices. Plant Methods 2024, 20, 97. [Google Scholar] [CrossRef] [PubMed]
  13. GB/T 8313-2018; Determination of Total Polyphenols and Catechins Content in Tea (TEXT OF DOCUMENT IS IN CHINESE). Available online: https://webstore.ansi.org/standards/spc/gb83132018?srsltid=AfmBOoq3h9dEJLTeNYSe_yZwLh1Mb5yqiMcYz0ewqbOzJsv3Uxijuqp1 (accessed on 19 May 2025).
  14. Chen, Y.Q.; Petras, I.; Xue, D. Fractional order control—A tutorial. In Proceedings of the 2009 American Control Conference, St. Louis, MO, USA, 10–12 July 2009; pp. 1397–1411. [Google Scholar]
  15. Li, Z.; Liu, L.; Dehghan, S.; Chen, Y.; Xue, D. A review and evaluation of numerical tools for fractional calculus and fractional order controls. Int. J. Control. 2017, 90, 1165–1181. [Google Scholar] [CrossRef]
  16. Tolba, M.F.; Said, L.A.; Madian, A.H.; Radwan, A.G. FPGA Implementation of the Fractional Order Integrator/Differentiator: Two Approaches and Applications. IEEE Trans. Circuits Syst. I Regul. Pap. 2019, 66, 1484–1495. [Google Scholar] [CrossRef]
  17. Abbas, S.; Benchohra, M.; Lazreg, J.-E.; Zhou, Y. A survey on Hadamard and Hilfer fractional differential equations: Analysis and stability. Chaos, Solitons Fractals 2017, 102, 47–71. [Google Scholar] [CrossRef]
  18. Obeidat, N.A.; Bentil, D.E. New theories and applications of tempered fractional differential equations. Nonlinear Dyn. 2021, 105, 1689–1702. [Google Scholar] [CrossRef]
  19. Chen, L.; Xu, B.; Zhao, C.; Duan, D.; Cao, Q.; Wang, F. Application of Multispectral Camera in Monitoring the Quality Parameters of Fresh Tea Leaves. Remote. Sens. 2021, 13, 3719. [Google Scholar] [CrossRef]
  20. Koseoglu, M.; Deniz, F.N.; Alagoz, B.B.; Alisoy, H. An effective analog circuit design of approximate fractional-order derivative models of M-SBL fitting method. Eng. Sci. Technol. Int. J. 2022, 33, 101069. [Google Scholar] [CrossRef]
  21. Morais, J.; Zayed, H. Applications of differential subordination and superordination theorems to fluid mechanics involving a fractional higher-order integral operator. Alex. Eng. J. 2021, 60, 3901–3914. [Google Scholar] [CrossRef]
  22. Podlubny, I. Fractional Differential Equations: An Introduction to Fractional Deriva-Tives, Fractional Differential Equations, to Methods of Their Solution and Some of Their Applications; Academic Press: San Diego, CA, USA, 1998; Volume 198. [Google Scholar]
  23. Gao, S.; Xu, J.-H. Hyperspectral image information fusion-based detection of soluble solids content in red globe grapes. Comput. Electron. Agric. 2022, 196, 106822. [Google Scholar] [CrossRef]
  24. Li, S.; Zhang, X.; Shan, Y.; Su, D.; Ma, Q.; Wen, R.; Li, J. Qualitative and quantitative detection of honey adulterated with high-fructose corn syrup and maltose syrup by using near-infrared spectroscopy. Food Chem. 2017, 218, 231–236. [Google Scholar] [CrossRef] [PubMed]
  25. Han, X.; Xie, D.; Song, H.; Ma, J.; Zhou, Y.; Chen, J.; Yang, Y.; Huang, F. Estimation of chemical oxygen demand in different water systems by near-infrared spectroscopy. Ecotoxicol. Environ. Saf. 2022, 243, 113964. [Google Scholar] [CrossRef]
  26. Mosegaard, K.; Tarantola, A. Monte Carlo sampling of solutions to inverse problems. J. Geophys. Res. 1995, 100, 12431–12447. [Google Scholar] [CrossRef]
  27. Li, X.; Sun, C.; Luo, L.; He, Y. Determination of tea polyphenols content by infrared spectroscopy coupled with iPLS and random frog techniques. Comput. Electron. Agric. 2015, 112, 28–35. [Google Scholar] [CrossRef]
  28. Ren, G.; Wang, S.; Ning, J.; Xu, R.; Wang, Y.; Xing, Z.; Wan, X.; Zhang, Z. Quantitative analysis and geographical traceability of black tea using Fourier transform near-infrared spectroscopy (FT-NIRS). Food Res. Int. 2013, 53, 822–826. [Google Scholar] [CrossRef]
  29. Cozzolino, D. The Role of Visible and Infrared Spectroscopy Combined with Chemometrics to Measure Phenolic Compounds in Grape and Wine Samples. Molecules 2015, 20, 726–737. [Google Scholar] [CrossRef]
  30. Nicolaï, B.M.; Beullens, K.; Bobelyn, E.; Peirs, A.; Saeys, W.; Theron, K.I.; Lammertyn, J. Nondestructive measurement of fruit and vegetable quality by means of NIR spectroscopy: A review. Postharvest Biol. Technol. 2007, 46, 99–118. [Google Scholar] [CrossRef]
  31. Saimaiti, A.; Huang, S.-Y.; Xiong, R.-G.; Wu, S.-X.; Zhou, D.-D.; Yang, Z.-J.; Luo, M.; Gan, R.-Y.; Li, H.-B. Antioxidant Capacities and Polyphenol Contents of Kombucha Beverages Based on Vine Tea and Sweet Tea. Antioxidants 2022, 11, 1655. [Google Scholar] [CrossRef]
  32. Guo, P.; Li, T.; Gao, H.; Chen, X.; Cui, Y.; Huang, Y. Evaluating Calibration and Spectral Variable Selection Methods for Predicting Soil Nutrients Using Vis-NIR Spectroscopy. Remote. Sens. 2021, 13, 4000. [Google Scholar] [CrossRef]
  33. Jahani, T.; Kashaninejad, M.; Ziaiifar, A.M. Effect of selected pre-processing methods by PLSR to predict low-fat mozzarella texture measured by hyperspectral imaging. J. Food Meas. Charact. 2024, 18, 5060–5072. [Google Scholar] [CrossRef]
  34. Xiao, Q.; Tang, W.; Zhang, C.; Zhou, L.; Feng, L.; Shen, J. Spectral preprocessing combined with deep transfer learning to evaluate chlorophyll content in cotton leaves. Plant Phenomics 2022, 2022, 9813841. [Google Scholar] [CrossRef] [PubMed]
  35. Li, C.; Zhao, J.; Li, Y.; Meng, Y.; Zhang, Z. Modeling and prediction of soil organic matter content based on visible-near-infrared spectroscopy. Forests 2021, 12, 1809. [Google Scholar] [CrossRef]
  36. Wang, J.; Li, X.; Wang, W.; Wang, F.; Liu, Q.; Yan, L. Research on Rapid and Low-Cost Spectral Device for the Estimation of the Quality Attributes of Tea Tree Leaves. Sensors 2023, 23, 571. [Google Scholar] [CrossRef] [PubMed]
  37. Bian, M.; Skidmore, A.K.; Schlerf, M.; Wang, T.; Liu, Y.; Zeng, R.; Fei, T. Predicting foliar biochemistry of tea (Camellia sinensis) using reflectance spectra measured at powder, leaf and canopy levels. ISPRS J. Photogramm. Remote Sens. 2013, 78, 148–156. [Google Scholar] [CrossRef]
  38. Chanda, S.; Sing, D.; Majumder, S.; Nag, S.; Karmakar, S.; Upadhyay, A.K.; Hazarika, A.K.; Sabhapondit, S.; Tasrin, S. NIR spectroscopy with grey wolf optimization algorithm for prediction of polyphenol content in inward tea leaves. In Proceedings of the 2017 IEEE Calcutta Conference (CALCON), Kolkata, India, 2–3 December 2017; pp. 392–396. [Google Scholar]
  39. Bian, M.; Skidmore, A.K.; Schlerf, M.; Fei, T.; Liu, Y.; Wang, T. Reflectance Spectroscopy of Biochemical Components as Indicators of Tea (Camellia sinensis) Quality. Photogramm. Eng. Remote. Sens. 2010, 76, 1385–1392. [Google Scholar] [CrossRef]
  40. Zareef, M.; Arslan, M.; Hassan, M.; Ahmad, W.; Chen, Q. Comparison of Si-GA-PLS and Si-CARS-PLS build algorithms for quantitation of total polyphenols in black tea using the spectral analytical system. J. Sci. Food Agric. 2023, 103, 7914–7920. [Google Scholar] [CrossRef]
Figure 1. Study area (map of Zhejiang Province and RGB image of the experimental area captured by UAV with red lines marking the sampled tea rows).
Applsci 15 05792 g001
Figure 2. Methodology flowchart.
Applsci 15 05792 g002
Figure 3. Characteristic analysis of AA (a) and TP (b) content in fresh tea leaves.
Applsci 15 05792 g003
Figure 4. Spectral reflectance changes in fresh tea leaves at different orders: (a) 0.1, (b) 0.2, (c) 0.4, (d) 0.6, (e) 0.8, and (f) 1.0. Different colors represent individual samples.
Applsci 15 05792 g004
Figure 5. Correlation coefficient curves between fractional-order derivatives (orders 0.0–1.0) and AA content versus wavelength (nm).
Applsci 15 05792 g005
Figure 6. Correlation coefficient curves between fractional-order derivatives (orders 0.0–1.0) and TPs content versus wavelength (nm).
Applsci 15 05792 g006
Figure 7. Maximum R2 values for AAs (a) and TPs (b) at different FOD orders.
Applsci 15 05792 g007aApplsci 15 05792 g007b
Figure 8. Test results of the prediction model for AAs and TPs at different orders of FOD for tea fresh leaf spectra. (a) AAs with 0th-order derivative, (b) AAs with 0.7th-order derivative, (c) AAs with 1st-order derivative, (d) TPs with 0th-order derivative, (e) TPs with 0.1st-order derivative, and (f) TPs with 1st-order derivative using CARS-PLSR models.
Applsci 15 05792 g008
Figure 9. Test results of the prediction model of predicted vs. observed contents using CARS–PLSR after MSC and SNV preprocessing: (a) AA with MSC (R2 = 0.700, RMSE = 0.377), (b) AA with SNV (R2 = 0.690, RMSE = 0.384), (c) TP with MSC (R2 = 0.369, RMSE = 3.840), (d) TP with SNV (R2 = 0.346, RMSE = 3.796).
Applsci 15 05792 g009
Table 1. Inversion accuracy of AA and TP content in fresh tea leaves.
Quality
Indicator
Modeling MethodFOD-OrderR2 (Train)RMSE (Train)R2 (Test)RMSE (Test)
AACC+PLSR0.70.670.510.630.47
CARS+PLSR0.70.860.30.80.25
TPCC+PLSR0.10.483.210.394.57
CARS+PLSR0.10.72.790.423.96
Table 2. Characteristic bands for AA and TP content in fresh tea leaves.
Quality
Indicator
Modeling MethodNumber of BandsCharacteristic Wavelengths (nm)
AACARS+PLSR19372, 406, 515, 553, 641, 643, 676, 1207, 1415, 1892, 1893, 2103, 2413, 2430, 2443, 2456, 2465, 2470, 2496
TPCARS+PLSR22354, 362, 368, 418, 645, 1021, 1194, 1428, 1541, 1651, 1658, 1678, 1685, 2136, 2273, 2430, 2449, 2458, 2476, 2483, 2488
Disclaimer/Publisher’s Note: The statements, opinions and data contained in all publications are solely those of the individual author(s) and contributor(s) and not of MDPI and/or the editor(s). MDPI and/or the editor(s) disclaim responsibility for any injury to people or property resulting from any ideas, methods, instructions or products referred to in the content.

