Article

Investigation on the Role of Drying Air Humidity and Process Parameters in Shaping the Conditions of Spray Drying Using Model Feed Materials

by
Alicja Barańska-Dołomisiewicz
*,
Aleksandra Jedlińska
and
Katarzyna Samborska
Department of Food Engineering and Process Management, Institute of Food Sciences, Warsaw University of Life Sciences WULS-SGGW, Nowoursynowska 159c, 02-776 Warsaw, Poland
*
Author to whom correspondence should be addressed.
Appl. Sci. 2025, 15(10), 5761; https://doi.org/10.3390/app15105761
Submission received: 20 March 2025 / Revised: 14 May 2025 / Accepted: 20 May 2025 / Published: 21 May 2025

Abstract

:

Featured Application

Dehumidified air-assisted spray drying is increasingly becoming an important factor in producing powders of more desirable properties, particularly sugar-rich powders, as it enables lowering drying air temperature and decreasing carrier content. However, the process of dehumidified air-assisted spray drying, while taking into consideration other drying factors such as inlet air temperature, feed rate, and feed solution concentration, has not been studied thoroughly. This three-stage model study provides comprehensive knowledge on the shaping of the conditions of spray drying that can be further implemented in any food industry or biotechnological sector in order to optimize the spray drying process and produce powders of desirable parameters.

Abstract

A three-stage research using distilled water and maltodextrin as model feed solutions was conducted to study the influence of inlet air humidity on spray drying performance. In the first and second stage, spray drying of distilled water and 30% (solids, w/w) MD solutions were tested at variable feed rate (0.16–0.83 mL/s), inlet air humidity (0.1–0.3, 1.1–1.3, 9–10 g/m3) and inlet air temperature (80–120 °C). In the third stage, the optimization of MD solutions spray drying process variables (80–120 °C inlet air temperature, 0.1–0.3, 1.1–1.3, 9–10 g/m3 inlet air humidity, 10–30% feed solution concentration) were verified for maximum powder recovery and powders of low moisture content and activity. It was noted that inlet air humidity influenced the spray drying performance. Reduced humidity improved the process conditions, but the most satisfying powder properties were noted at 120 °C, thus decreasing inlet air temperature was not necessary to ameliorate the process performance. Optimization in the third stage of the study enabled us to estimate the most satisfying properties of maltodextrin powders. The highest powder recovery and the lowest moisture content and water activity were optimal for spray drying at inlet air temperature of 120 °C, inlet air humidity of 0.1 g/m3, and feed solution concentration of 29.571%.

1. Introduction

Preliminary work on the application of dehumidified air (DA) for the improvement of drying process conditions was carried out in the late 1980s by Hayashi and in the late 1990s by Bhandari et al. [1,2]. Reduced drying air humidity increases the driving force of the process, which lowers the drying temperature [3]. Few researchers have reported DA-assisted drying on a laboratory scale. Moreover, experiments conducted on DA application for drying process were usually performed using one level of air humidity. Babalis and Belessiotis (2004) who dried figs with controlled air humidity with the thin-layer method, applied only one level of humidity and the relative humidity was 10% [4]. In their work on dehumidified air spray drying (DASD) over many years, Goula and Adamopoulos studied tomato pulp and orange juice concentrate spray drying, also using only one level of air humidity [5,6,7]. The authors demonstrated that the residue accumulation in tomato pulp spray drying was reduced in comparison to conventional spray drying (SD) due to the application of DA. The researchers found as well that DA application promoted rapid particulate skin formation, which in consequence decreased the powder moisture content and increased powder bulk density and solubility. As for the orange juice concentrate SD, the authors observed that using maltodextrin (MD) as a carrier in combination with the DASD was also found to be an effective way of reducing residue formation. Therefore, this implies that solely decreasing drying air humidity, while the drying air temperature remains at the standard level for SD, demonstrates effectiveness for process performance and powder properties. However, it should be underlined that this approach fails to take into account other process parameters which can be crucial for potentially improving the course of drying.
In recent years, there has been growing interest in DASD as a result of initial research involving one level of reduced drying air humidity in SD, while other parameters remained typical for SD. The researchers focused on the significant modification of drying parameters in comparison to conventional SD. Jedlińska et al. (2019) described spray drying of honey with the application of DA [8]. The authors significantly modified the process parameters in comparison to conventional SD as the inlet drying temperature was reduced to 75 °C and feed solid concentration was increased up to 60%. Therefore, due to lower stickiness, it was possible to reduce carrier content down to 20% solids, which can be marked as considerable progress in honey SD, because honey powder is usually produced with a minimum of 50% carrier solids. Furthermore, the process can be described as successful in recognizing very high powder recovery (93%), which has not been noted in the literature before for sugar-rich materials. Therefore, dehumidified air spray drying (DASD) has drawn attention not only as a method to increase powder recovery, but also as a method that allows to decrease or avoid stickiness during the production of powders from some sugar-rich materials, which are generally recognized as difficult to dry [9]. The principle of this spray drying approach is based on the significant reduction in air temperature (even down to 75 °C inlet) which helps to avoid stickiness related to low glass transition temperature (Tg) of a raw material. DA provides additional driving force for water evaporation, so it is possible to produce powder at a considerably low temperature for SD [10]. The reduction in stickiness reduces the carrier content, i.e., as was presented for honey down to 20% or to 10% for white mulberry molasses [8,11]. It was also possible to eliminate carriers completely during DASD of materials such as blackcurrant juice concentrate, purple carrot juice concentrate and mango pulp [12]. Thus, DASD enables us to produce powders of a high share of raw material being potent in bioactive compounds, which is important in the formulation of functional food products.
Taken together, these findings imply that because of the reduction in drying air humidity, other drying parameters should be carefully adjusted to achieve the proper drying conditions. It is fundamental to note that the presented literature data do not report on the effect of air humidity tested in a wide range of parameters and on SD process performance. Thus, this paper presents the results with new basic knowledge about the role of drying air humidity in the shaping of SD conditions. This research was conducted based on model feed materials and the knowledge drawn from this study can be further implemented in different food matrixes, as well in different industrial sectors that would benefit from modifying spray drying process parameters in order to enhance process yield or powders stability and their physical properties.
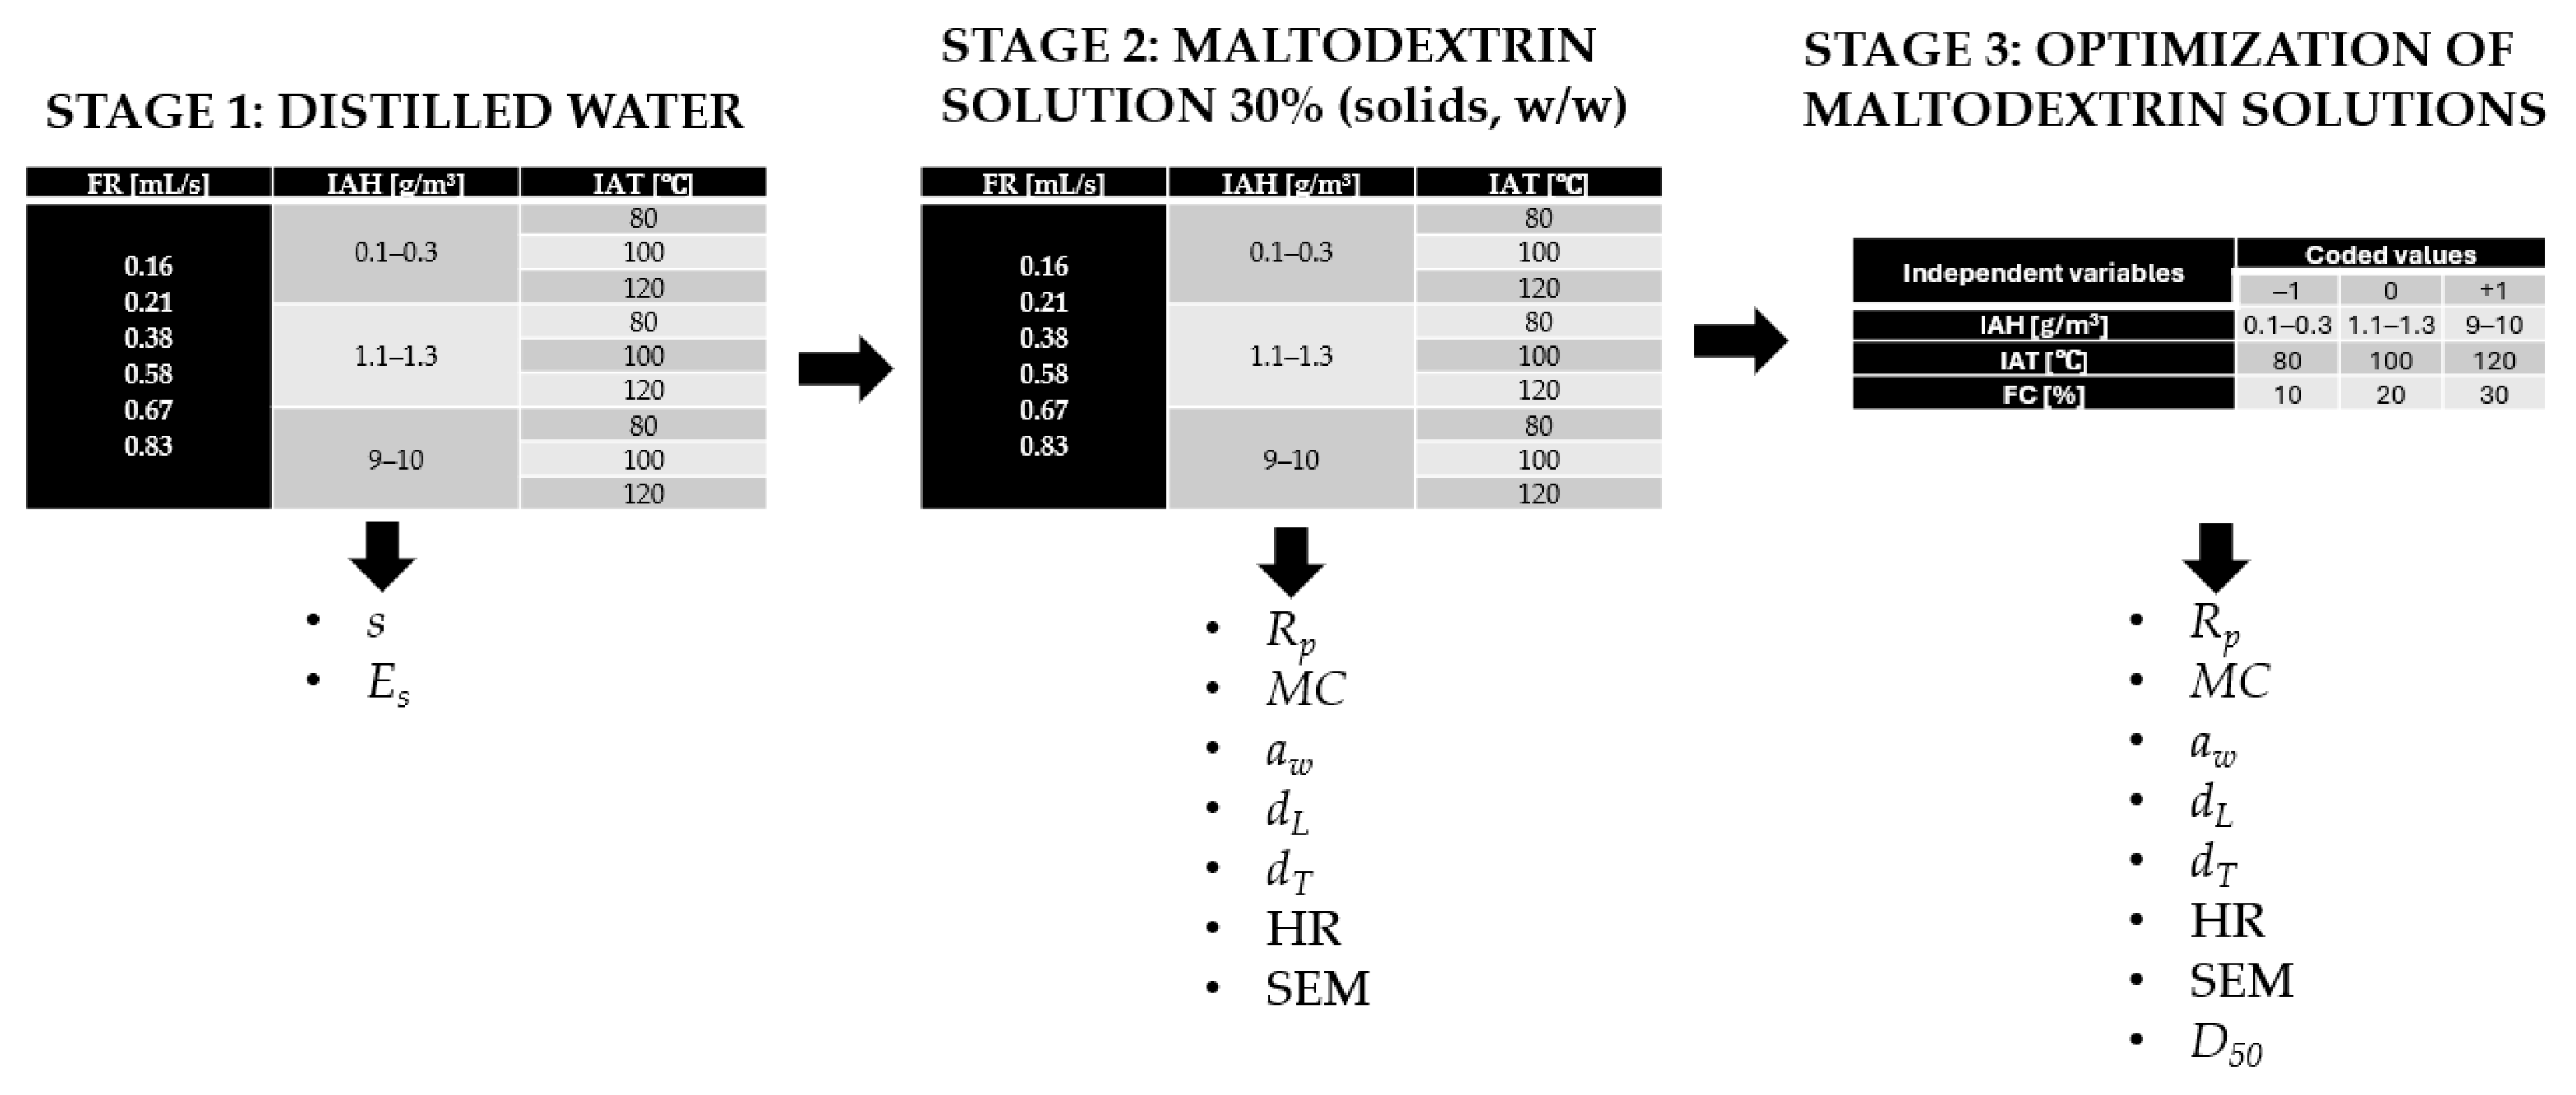
The aim of this research was to study the influence of drying air humidity on the performance of model feed materials (distilled water and MD solutions), spray drying based on the analysis of the inlet and outlet air parameters (temperature, relative and absolute humidity), calculation of specific energy and drying air consumption, powder recovery, and powder properties (moisture content, water activity, particles morphology, loose bulk and tapped densities, flowability, and particles size). The research hypothesis presumed that (1) the drying air humidity influences the spray drying performance, and in consequence its reduced humidity would improve the process conditions, possibly reducing the drying temperature; (2) the reduced drying temperature deteriorates drying conditions. The process performance is strongly dependent on the amount of water to be evaporated, thus the reduction in water content in feed solution (increase in solids content) and reduced feed rate would consequently improve spray drying performance. The research was divided into three stages: Stage I: spray drying/evaporation of distilled water at variable feed rate, drying air humidity and air temperature; Stage II: spray drying of 30% (solids, w/w) MD solutions at the same levels of independent variables as in stage I; Stage III: optimization of MD solutions spray drying process variables (inlet air temperature, drying air humidity, feed solution concentration) for maximum powder recovery and powders of low moisture content and activity.

2. Materials and Methods

2.1. Materials

Feed model materials for spray drying were distilled water and maltodextrin DE15 (OMNIA, Adana, Turkey).

2.2. Spray Drying

Spray drying was performed on a MOBILE MINOR pilot-scale spray dryer (GEA, Mölndal, Denmark) in co-current flow equipped with an air dehumidification system (two stage: condensation by TAEevo TECH020 cooling unit (MTA, Codogno, Italy) + SWEGON condensation unit (Gothenburg, Sweden), adsorption by ML270 unit (Munters, Kista, Sweden)). The disk’s rotational speed was set to 26,000 rpm and the compressed air’s pressure was set to 4.5 bar.

2.3. Experimental Plan

The experimental plan was divided into three stages (Figure A1, Appendix A):
-
Stage I: Spray drying/evaporation of distilled water at variable feed rate (FR), inlet air humidity (IAH) and inlet air temperature (IAT) (54 experiments) (Table 1). During 10 min of the experiment, the outlet air temperature, the relative and absolute humidity of outlet air were measured every 1 min and documented (AZ9871 Data logging/Printing Anemometer, AZ Instrument Corp., Taichung, Taiwan). The process performance was also observed visually, and the time at which water evaporation stopped (the droplets appeared on the internal surface of a spray dryer’s window) was noted. Before running every experiment and during the experiment, the ambient temperature and humidity were monitored using thermo-hygrometer (testo 622 Scientific Ambient Monitor, Testo SE & Co. KGaA, Titisee (Neustadt, Germany)).
-
Stage II: Spray drying of 30% (solids, w/w) MD solutions at the same levels of independent variables and procedure of monitoring drying air parameters and ambient air parameters as in Stage I (54 experiments) (Table 1). Additionally, powder recovery (Rp), its moisture content (MC), water activity (aw), loose bulk and tapped densities (dL and dT), flowability (HR) were determined. The morphology of selected variants was analyzed as well.
-
Stage III: Optimization of MD solutions spray drying process variables (inlet air temperature (IAT), inlet air humidity (IA), feed solution concentration (FC)) for maximum powder recovery and powders of low moisture content and activity using response surface methodology (RSM) with random run order and center points runs added, with three coded levels for each variable: low (−1), standard (0), and high (+1) (Table 2). A total of 19 combinations of variables were considered: 8 factorial points in 2 replications and 3 center points runs placed in the beginning, middle and at the end of the experiment (Table 3). The levels of drying process variables were chosen based on the preliminary research and technical specification of air-dehumidification system. Additionally, particle morphology and particle size (D50), loose bulk and tapped densities (dL and dT), and flowability (HR) of obtained powders were determined. The procedure of monitoring drying air and ambient air parameters was the same as in Stage I and II of the research.

2.4. Analitycal Methods

2.4.1. Moisture Content and Water Activity

The moisture content (MC) in the powders was determined by the oven method. The samples were weighed on an analytical balance of about 0.5 g (with an accuracy of 0.0001 g) and then dried at a temperature of 105 °C during 4 h. The water activity (aw) of the powders was determined using the HygroLab C1 device (Rotronic, Bassersdorf, Switzerland). The measurements were made at a temperature of 25 °C. Moisture content and water activity were analyzed in Stages II and III of the experiment.

2.4.2. Bulk Density and Flowability

A mass of powder occupying a 25 mL cylinder was measured to determine loose bulk density (dL). An automatic volumeter STAV II with a soundproof chamber (Engelsmann AG, Ludwigshafen, Germany) was used to evaluate tapped bulk density (dT) by determining the volume of a sample after 100 taps. The flowability was expressed as Hausner Ratio (HR): HR = dT/dL. Bulk density and flowability were analyzed in Stages II and III of the experiment.

2.4.3. Particle Morphology

The morphology of the powder particles was described based on photos taken with an XL scanning electron microscope (PHENOM, Thermo Fisher Scientific, Waltham, MA, USA) at a magnification of 1000× at an accelerating voltage of 5 kV. Before the photos were taken, the samples were covered with a layer of gold using Sputter Coater 108 Auto (Cressington, EO Elektronen-Optik-Service GmbH, Dortmund, Germany). Particle morphology was analyzed in Stages II and III of the experiment.

2.4.4. Particle Size

Measurements were made based on the laser diffraction method using an 1190 device (CILAS, Orléans, France) in liquid (ethanol) dispersion at maximum obscuration 10%. The median particle diameter was expressed as D50. Particle size was analyzed in Stage III of the experiment.

2.5. Data Collection and Analysis

Data analysis depended on the stage of experiment:
Stage I: The drying process was studied based on a comparison of the inlet and outlet air parameters (temperature, relative and absolute humidity), and then by calculation of specific energy consumption (Es) and drying air consumption (s) accordingly:
E s = i 2 i 0 x 2 x 0
where i2, i0—the enthalpy of the air exiting the spray dryer and the initial air; x2, x0—the absolute humidity after and before the drying process, respectively.
s = 1 ( x 2 x 0 )
where x2, x0—the absolute humidity after and before the drying process, respectively.
Stage II: The procedure for data analysis was similar to Stage I with an additional Rp calculation which was expressed in [%] as the ratio of the solid content in the MD powder to the number of solids in the feed solution prior to spray drying. The following powder properties were analyzed: MC, aw, dL, dT, HR, and morphology of selected variants.
Stage III: The generation of the best-fitting model for the expression of the response variables (descriptors of the drying process performance and powder properties) as a function of the independent variables (drying parameters) and the possible interactions between independent variables by the RSM. The generation of desirability functions to identify the optimized set of drying parameters to maximize powder recovery and minimize moisture content and activity.

2.6. Statistical Methods

2.6.1. Analysis of Variance (ANOVA)

The measurements of powders’ properties were conducted in triplicate, and the results were expressed as mean ± standard deviations. A one-way analysis of variance (ANOVA) and Tukey’s test (p-value <0.05) were used to evaluate the significance of the differences between average values of response variables—descriptors of the drying process performance and powder properties. The data were analyzed using STATISTICA 13.3 software (Statsoft, Tulsa, OK, USA).

2.6.2. Response Surface Methodology (RSM)

Response surface methodology (RSM) was used to determine the relationships between independent variables and response variables, and to optimize the spray drying process in Stage III of the research. For optimization, the desirability function was generated: Rp was maximized, while the MC and aw were minimized. The evaluation was performed using central composition design (face-centered), using Stat-Ease 360 software (Stat-Ease Inc., Minneapolis, MN, USA).

2.6.3. Principal Component Analysis (PCA) and Hierarchical Cluster Analysis (HCA)

PCA and HCA were used to transform the original variables into a smaller set of linear combinations and to visualize the relationships between the response variables. The analysis was performed using STATISTICA 13.3 software (Statsoft, Tulsa, OK, USA).

3. Results and Discussion

3.1. Stage I

Drying Air Consumption and Specific Energy Consumption

Drying air consumption (s) was the highest for the variants at the lowest FR (0.16 mL/s) at 80 °C and 100 °C using the air of ambient humidity (9–10 g/m3) (Figure 1A). Irrespective of IAT and IAH, s decreased with increased FR. However, IAH was crucial to lower the s, as more drying air was needed to evaporate water efficiently due to a lower drying rate at higher IAH. It can be noted that ambient air humidity increased s substantially in comparison to variants processed at lower IAH, underlining the importance of air dehumidification in evaporation efficiency during spray drying and, in consequence, in the optimization of the process. Velić et al. (2003) concluded, based on their simulation, that the air consumption and evaporation efficiency depend on IAT; however, in this study, the effect of IAH and FR were more prominent [13]. As energy conservation is a crucial aspect of any process considerations in the industry, obtained results can be usefully employed in the modification of drying parameters in order to minimize the s or to indicate the importance of the heat recovery in order to reduce the operational cost and the impact on the environment.
The specific energy (Es) consumption during spray drying is crucial to evaluate the economic aspects of the process. Optimization of the Es can be consequently performed by increasing total solids content in the liquid feed, increasing IAT or by decreasing the outlet air temperature [14]. It can be observed that Es was the most influenced by IAH and FR (Figure 1B). Kosasih et al. (2018) noted as well that Es was influenced by IAH while spray drying vitamin C and that lowering IAH enabled to lower Es [15]. In this research the effect of the FR was the most significant at the lowest value (0.16 mL/s), but it should be noted that Es increased substantially at these values with increasing IAH. The effect of increased Es was less prominent at higher FR irrespective of IAT. This phenomenon occurred since the same energy input was required to evaporate the same amount of water, which points to the possible improvement of the drying process that can be introduced in order to optimize the process irrespective of drying temperature and drying air humidity. Jedlińska et al. (2019) and Samborska et al. (2020), who studied the spray drying with the application of dehumidified air of honey and apple juice concentrate, concluded that FR has to be relatively low to evaporate water efficiently at low IAT of 80 °C [8,16]. However, the researchers spray dried materials of high solids content in comparison to distilled water, which require different approaches. Nguyen et al. (2017), who optimized the spray drying conditions for the production of the powder consisting of gum Arabic and MD, noted that increasing FR enabled to increase the mass and heat transfer, thus at the end it improved the energy efficiency of the process, confirming the data obtained in this research [17]. The blue areas presented in Figure 1A,B indicates the experiments where droplets of water were observed inside of the drying chamber. This phenomenon demonstrates that at the highest FR independently of other variables, water was not evaporating, indicating not efficient heat transfer.

3.2. Stage II

3.2.1. Powder Recovery

At the lowest IAH powder could be successfully produced at all levels of IAT and FR. When increasing IAH, it was noted that at low and medium IAT (80 and 100 °C) and with FR at higher levels, it was not possible to obtain any powder in the collector. Thus, the water was not evaporating efficiently, underlining the importance of IAH on the course of drying as it ensured the sufficient drying rate.
Rp in pilot-scale spray drying can be considered as successful when it exceeds 50% [18]. The highest Rp were noted at 120 °C using IAH of medium level regardless of FR (Figure 2). Therefore, IAH of 1.1–1.3 g/m3 can be considered as the most effective in producing MD powders at the highest Rp, while at the same time the course of drying was not disturbed by variable FR at 120 °C. Similarly to Stage I of the research, blue areas in Figure 2 indicate the droplets of water that were observed in the experiments. As aforementioned, higher FR led to the non-effective evaporation of water from the material as it was not removed with the exhausted air from the spray dryer due to too large droplets formation. With increased FR the time of particles presence in the drying chamber contacting drying medium is shorter, thus the evaporation is less efficient leading to lower Rp. The similar relationship was observed by Gavarić et al. (2019) when spray drying Marrubium vulgare extract [19]. At lower IAH, increasing IAT enabled efficient heat and mass transfer, and this phenomenon was not noted at the highest FR. However, at ambient IAH regardless of increased IAT, the heat and mass transfer were not efficient at the highest FR.

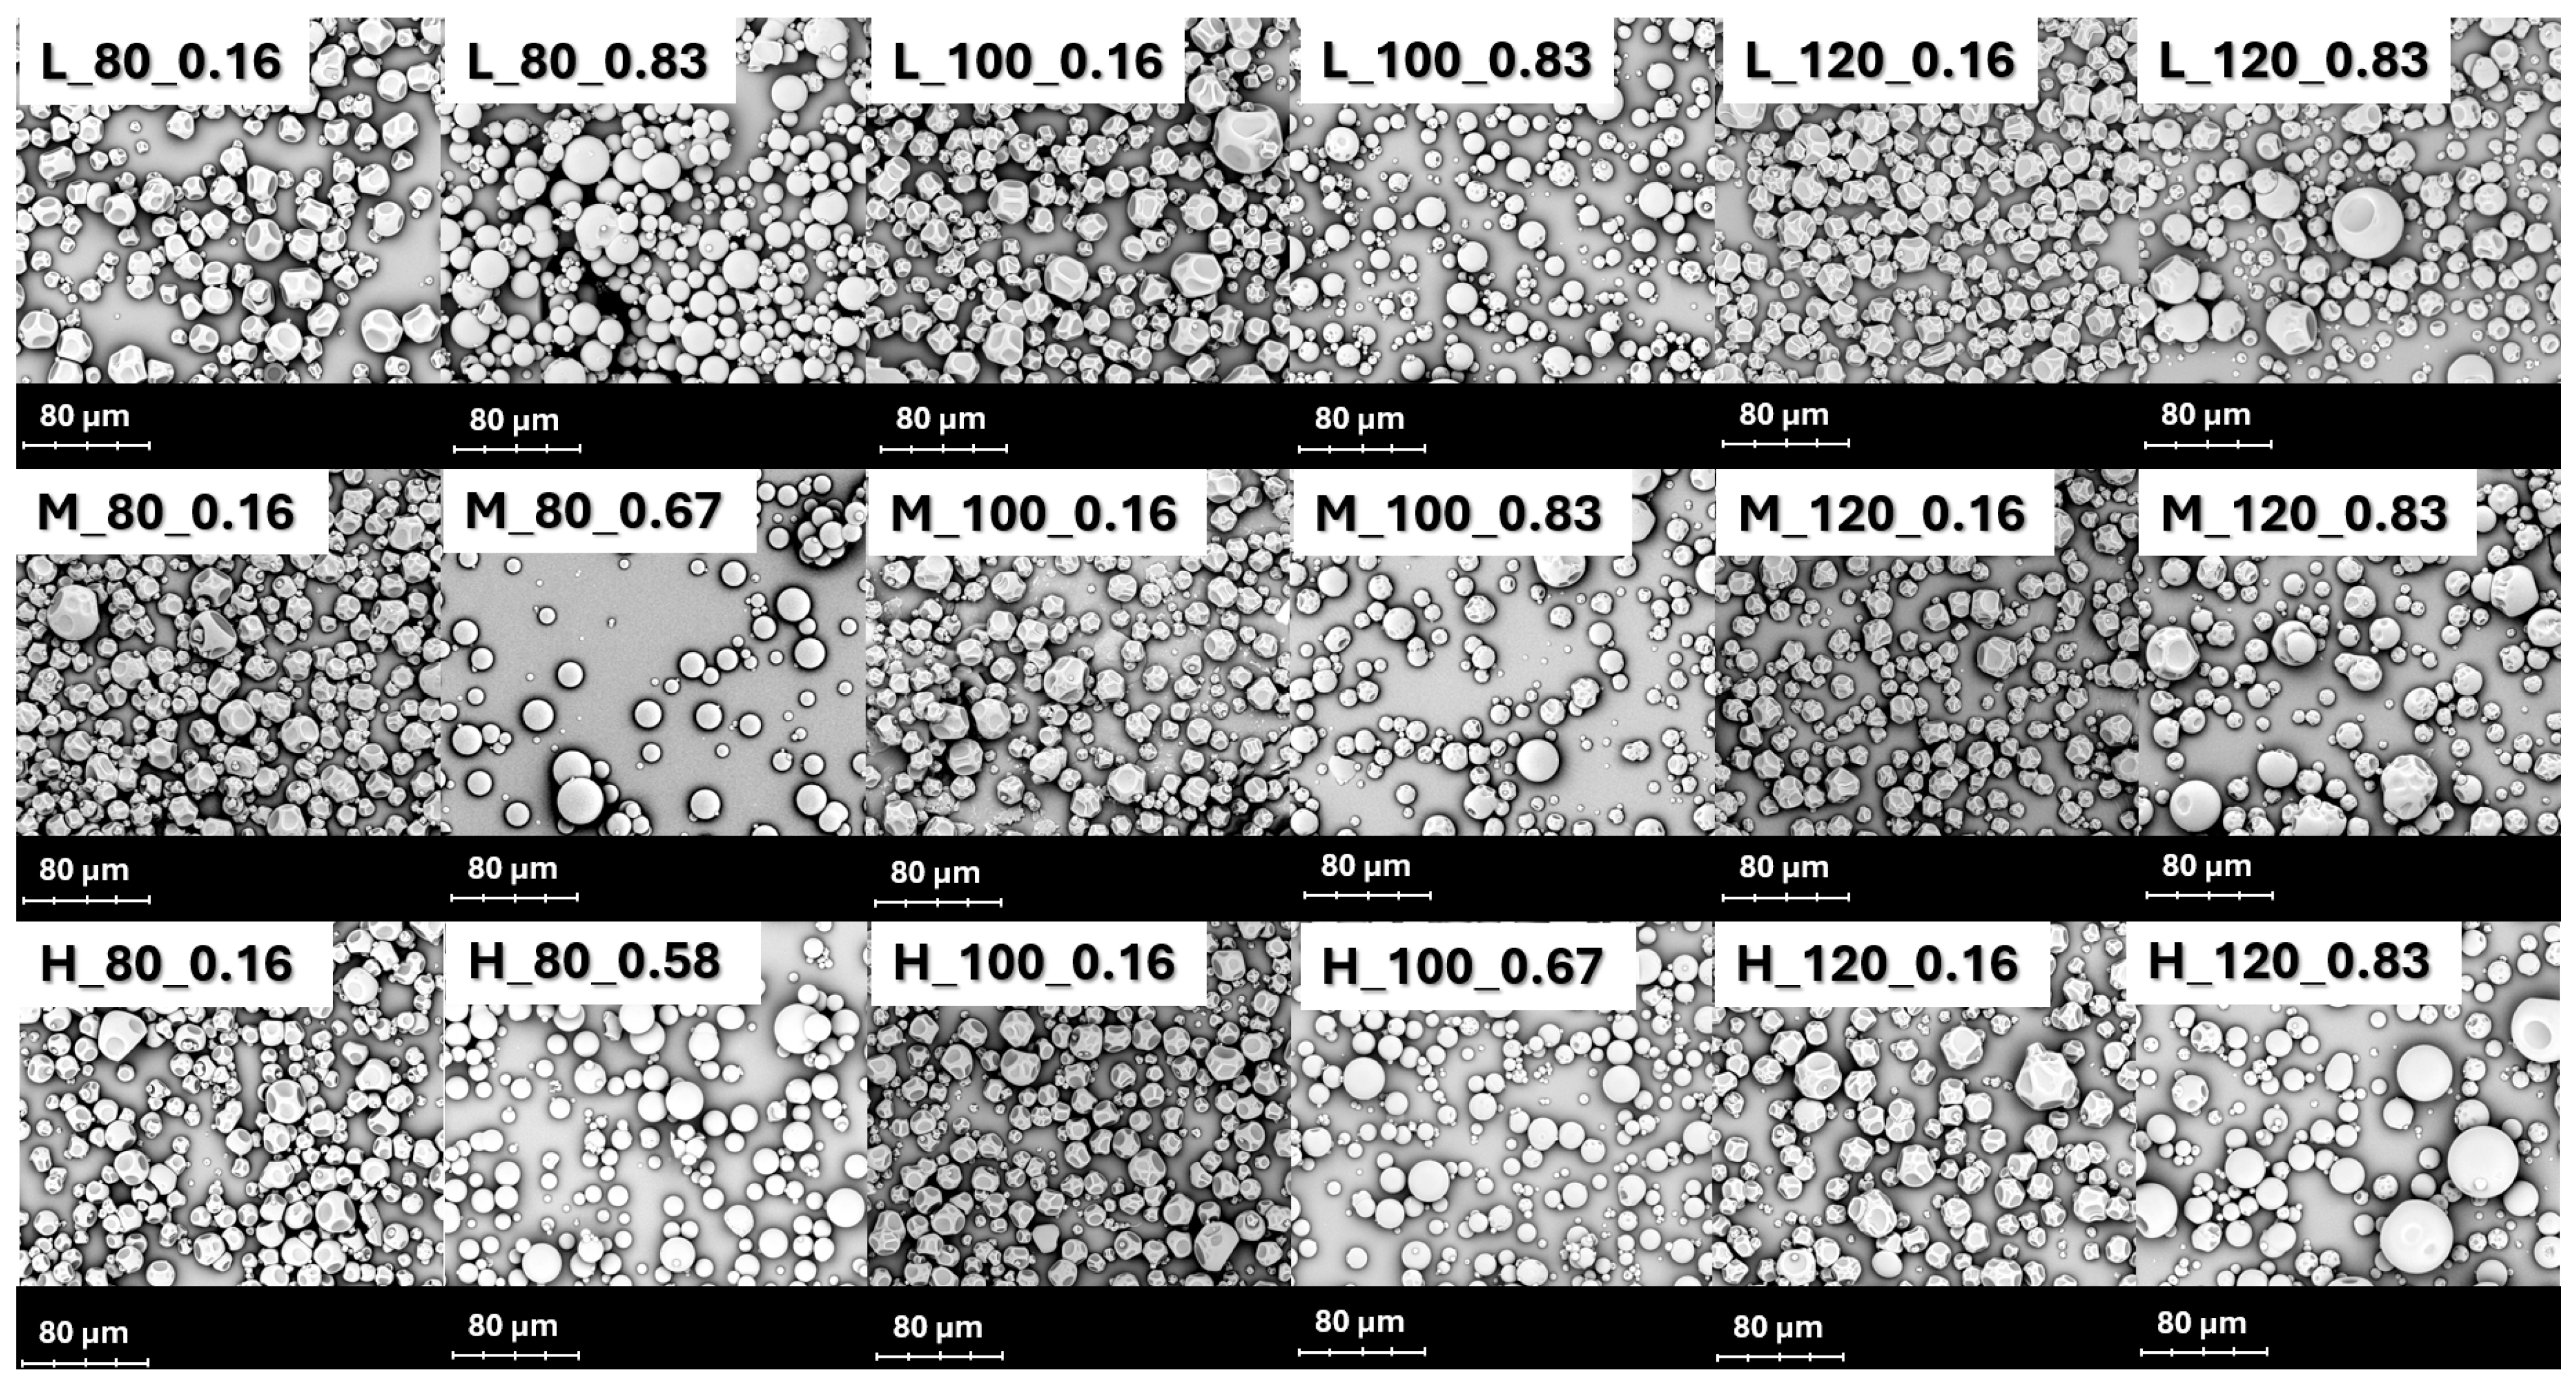
3.2.2. Particles Morphology

Particles morphology was influenced the most by the FR and IAT (Figure 3). Increasing the FR enabled us to obtain more spherical and regular particles with smooth surfaces. Generally, more particles of larger dimensions were observed with increasing the FR, as they were characterized with a diameter exceeding 20 µm, when the FR was the highest for every tested variant. This relationship was noted for all of the tested IAH and IAT, which underlines the importance of the FR in producing powders of desired morphology. Increasing the FR most probably led to a more intense water evaporation, thus it affected lower outlet air temperatures ensuring more significant cooling effect on the particles. In consequence, this phenomenon resulted in more spherical particles with smooth surfaces as there was less stress caused on the particles’ surface. However, despite the significant stress, it should be highlighted that particles can be smooth but at the same time they will become hollow underneath their surface [20,21].
The effect of IAT on the size of particles could be observed—with increased IAT the increase in the particles’ size regardless of IAH was noted (Figure 3). More particles of a larger size (exceeding 40 µm) were present when powders were produced at the highest IAT (120 °C). This phenomenon resulted from rapid water evaporation, which led to formation of the particles’ morphology at the very early stage of drying, resulting in a larger size of the particles. However, the phenomenon of the locking point must be acknowledged, as it determines the moment at which this skin can first be visually recognized. Lower drying temperatures can lead to particles with a more wrinkled morphology, as the locking point happens later compared to more elevated drying temperatures [22]. Nonetheless, this phenomenon was not observed in this study.

3.2.3. Moisture Content and Water Activity

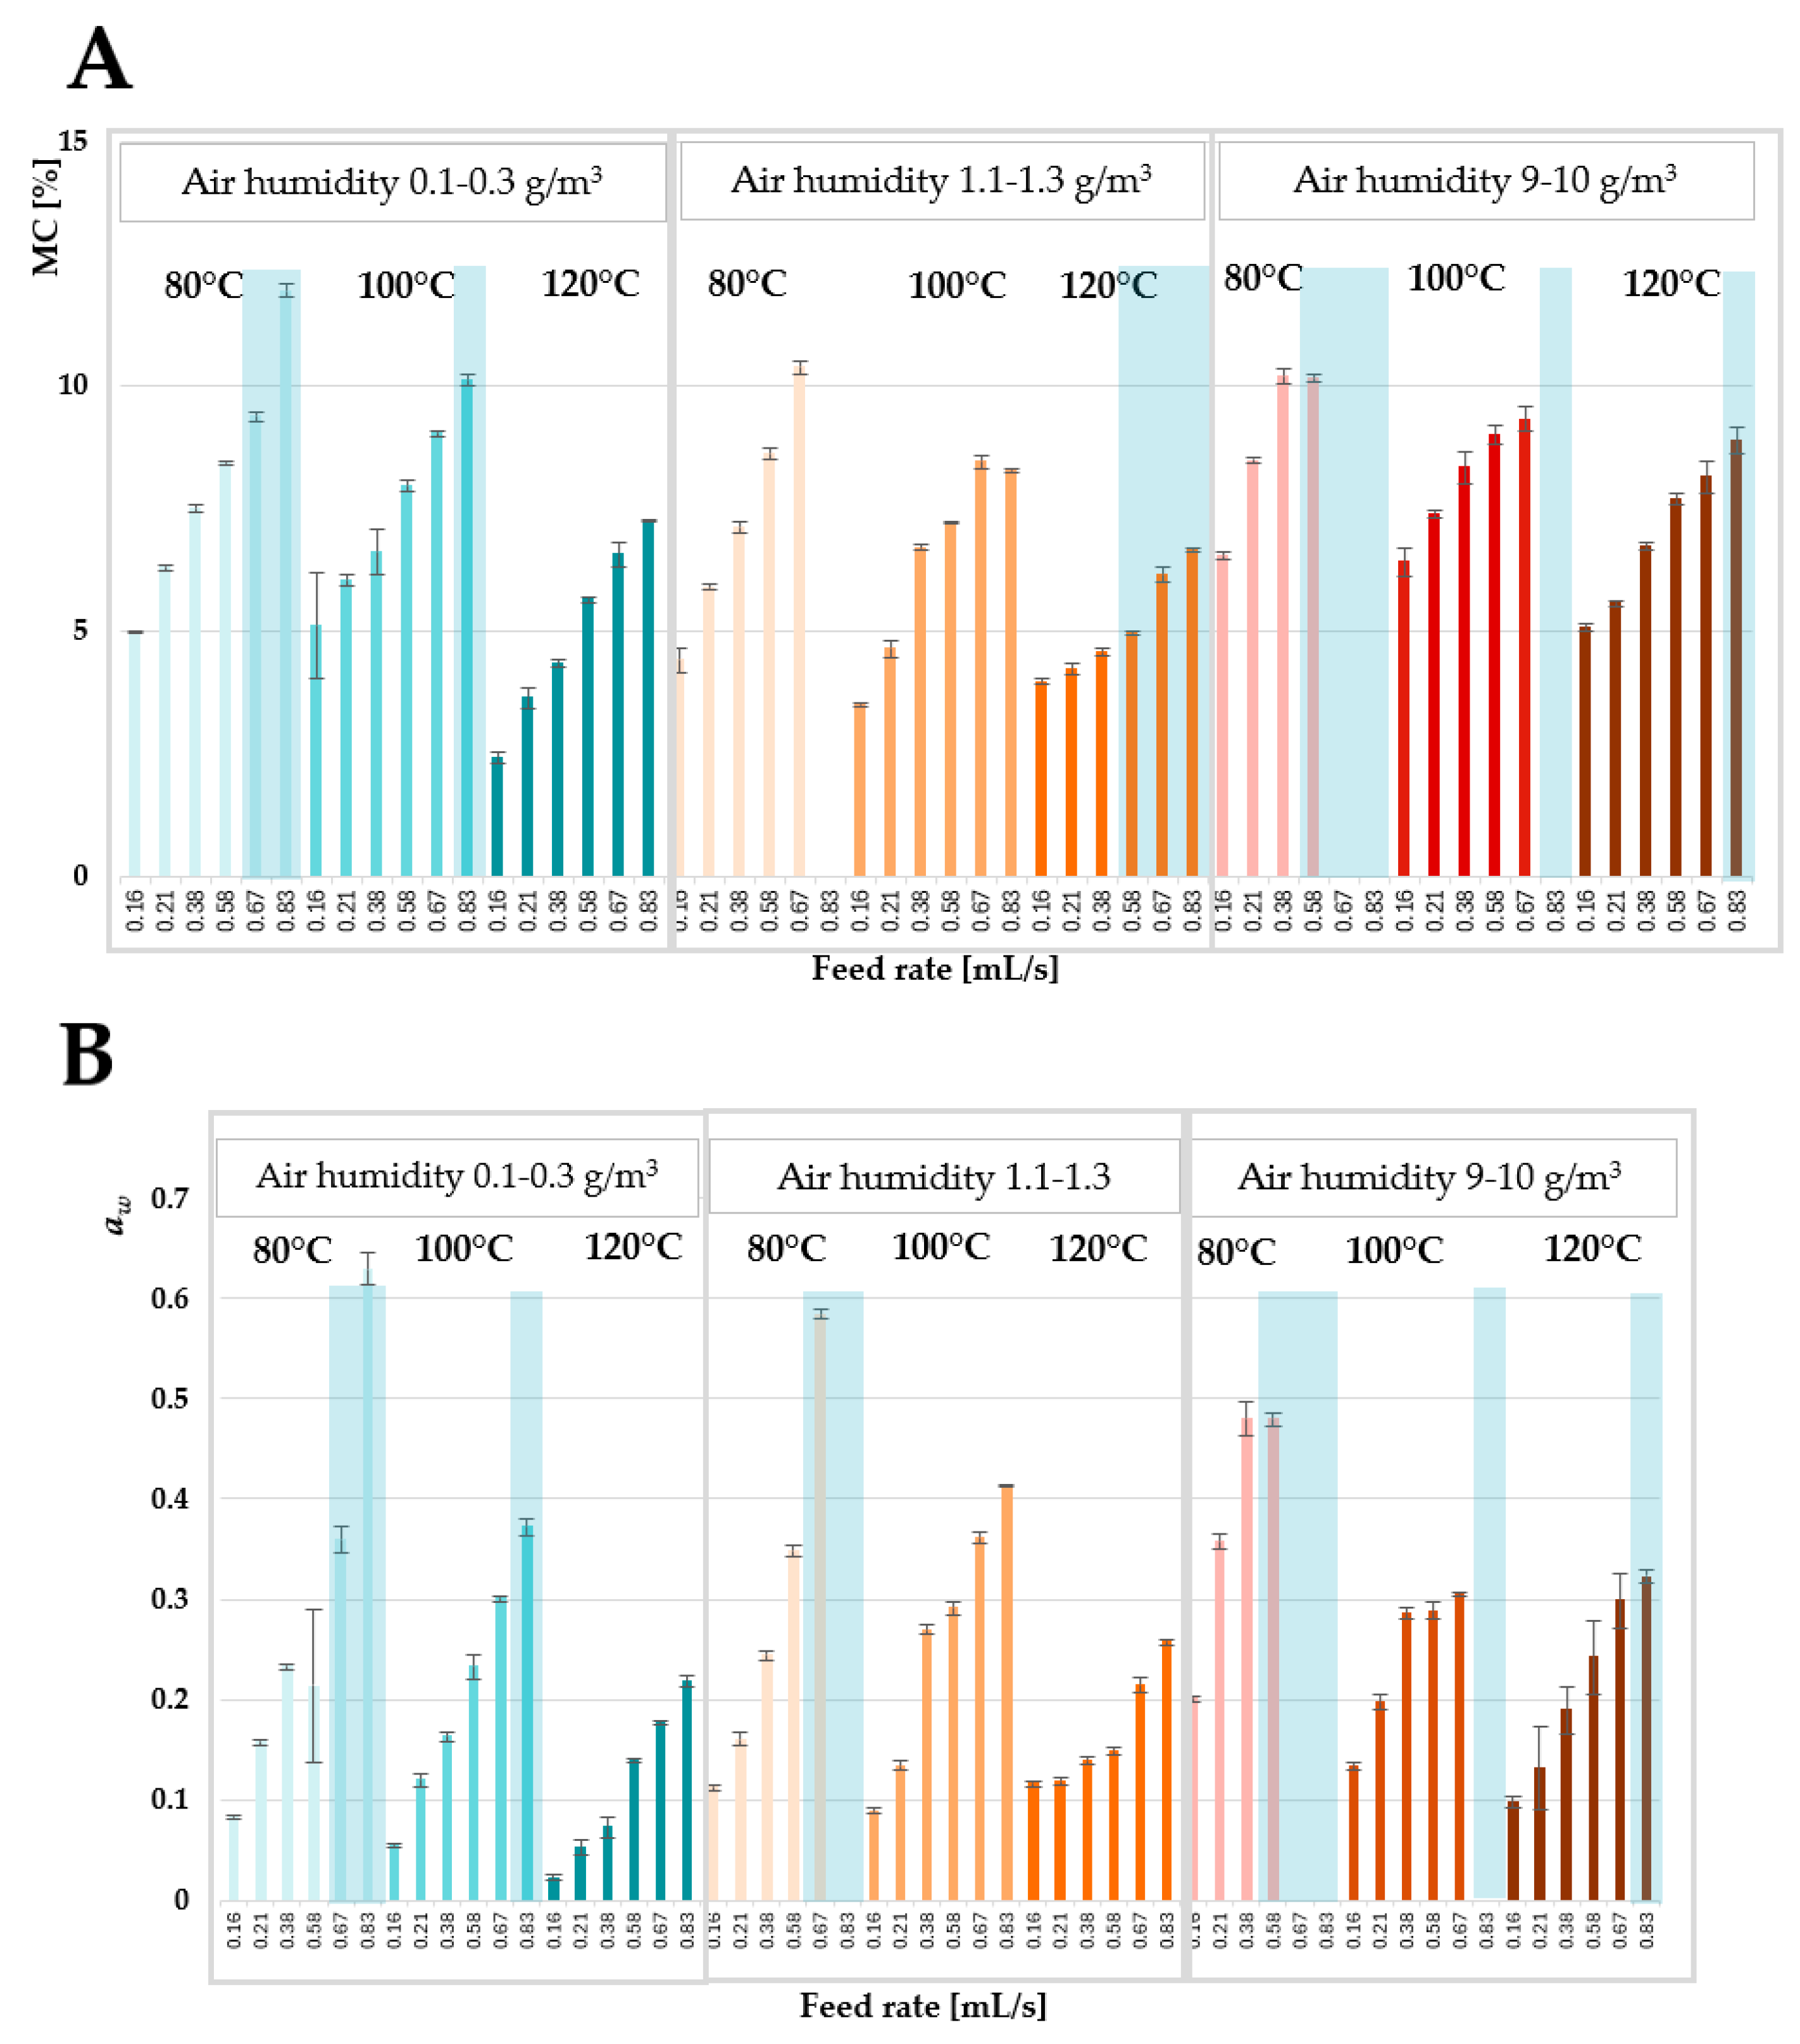
Powders of MC below 5% can be considered as stable, thus MD powders produced at 120 °C, using the lowest or medium IAH (0.1–1.1, 1.1–1.3 g/m3), had the most satisfying results regarding MC (Figure 4A) [23]. Despite increasing FR from 0.16 to 0.58 mL/s, water evaporated effectively leading to the production of powders with MC below 5%. Decreased IAH ensured driving force for water evaporation, despite increased FR. In comparison with the experiments that were conducted using ambient air humidity (9–10 g/m3), it can be noted that it was necessary to increase IAT to 120 °C to produce MD powder of satisfying MC, however at the same time maintaining the lowest FR to ensure enough driving force to evaporate water successfully. According to Schuck et al. (2008), who conducted research on the influence of process parameters on MC and aw of dairy powders, the temperature that the droplet reached during drying was impacted by the temperature of IAT and its absolute humidity, as well as the relative humidity of outlet drying air [24]. Therefore, it directly influences the MC of final product. The results from this study concurs well with the findings of Schuck et al. (2008) [24]. However, the FR should be considered as well, as it influences the mass and heat transfer inside the drying chamber and ensures the satisfying water evaporation. Increasing FR reduces the contact time between the droplet and hot drying air, which decreases the mass and heat transfer and results in powders of higher MC. Nguyen et al. (2017) and Keshani et al. (2012) noted similar a relationship when increasing the FR of the mixture of gum Arabic and MD solutions and lactose-rich products, respectively, increased MC of produced powders [17,25].
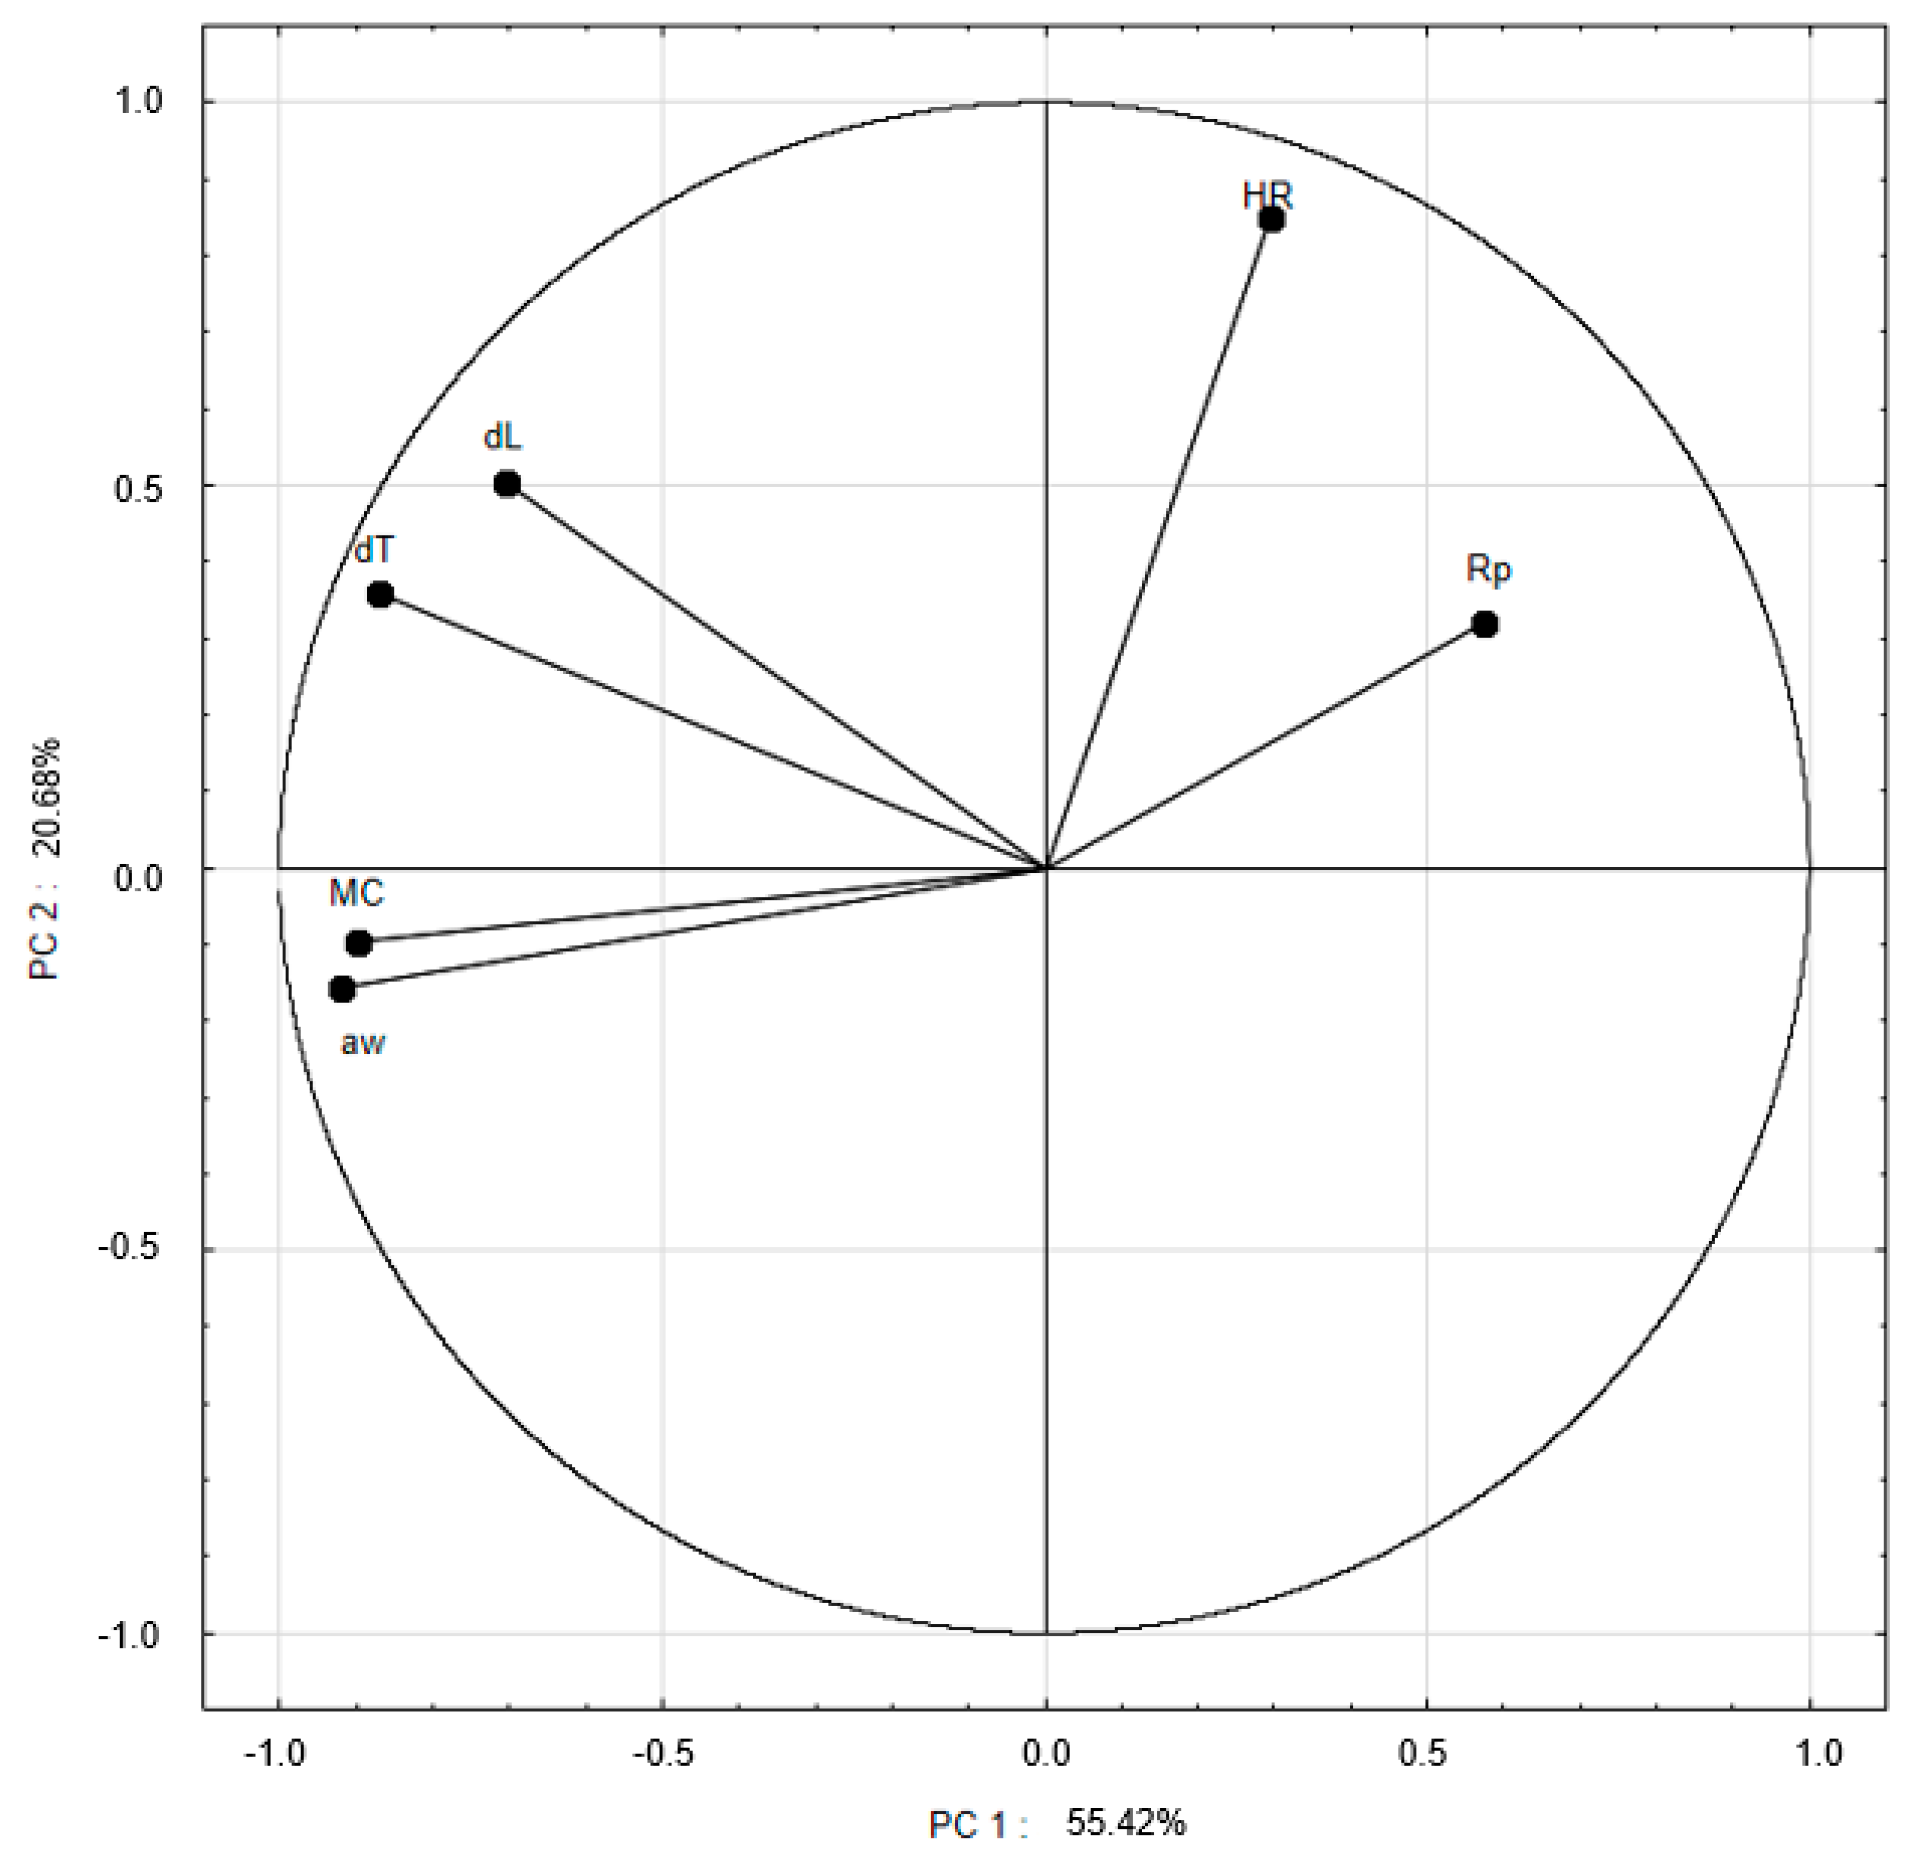
When considering product’s stability, it is important to also consider aw, as it translates into water availability for microbial growth, biochemical reactions and physical changes; thus, MC cannot be analyzed separately from aw [24]. In this research, the strong positive correlation was noted between MC and aw, based on the PCA (Figure A2). All of the three variables analyzed influenced aw (Figure 4B). Powders of aw below 0.2 were regarded to be stable as the water is bound structurally [26]. MD powders that can be labeled as stable were produced mostly at the first three levels of feed rate (0.16–0.38 mL/s) at all of the tested IAT and IAH, which underlined the FR as the most important variable in producing a powder of satisfying aw. FR influenced the size distribution of droplets and finer droplets indicated large surface area, thus increased heat and mass transfer. For most of the tested variants, regardless of IAT and IAH, increased FR led to the distribution of droplets that were too large in size, which made it impossible to evaporate water effectively, leading to the production of MD powders of aw pointing to their shelf-stability. Considering IAH, the lowest and the medium levels (0.1–0.3 and 1.1–1.3 g/m3) at the highest IAT (120 °C) made it possible to obtain MD powders of aw below or equal to 0.2, regardless of FR, which was not likely to be observed using ambient IAH. These results would seem to suggest that IAT of 120 °C is the most satisfying when considering decreased IAH in order to ensure effective water evaporation to produce MD powders considered as shelf-stable both in terms of MC and aw.

3.2.4. Bulk Density

Higher bulk density is considered as more desirable while managing powders in the industry, as it corresponds to less air filling the empty spaces between particles in the bed. It lowers the risk of oxidation and decreases the costs of packaging and transportation [27]. Regardless of IAH and IAT, the highest level of FR led to the production of powders of the highest bulk density (Figure 5). Moreover, the variant of the lowest IAH at the lowest IAT had the highest both dL and dT. Bulk density can be related to many different factors, including the presence of air filling the spaces between the particles, the air trapped within the particle, the inter-particle forces, particle size and morphology, and moisture content. Evaporation rate thus plays an essential role in shaping bulk density, as it influences the formation of the shell on the droplet [27,28].
However, spray drying using the medium IAH (1.1–1.3 g/m3) at 100 °C led to the production of powders of not significantly different dL, regardless of FR. A similar relationship was observed for dT, when the lowest IAH (0.1–0.3 g/m3) at 120 °C was applied. These findings suggest that increased FR in these conditions did not influence the evaporation rate to the extent that it would disrupt the formation of a shell on the droplet, impacting at the same time the bulk density. According to the literature, higher MC decreases powders’ bulk density, however this relationship is dependent on the interparticle forces [28]. Evidence from this study suggests that MC did not influence the bulk density of powders, as neither dL nor dT increased with decreased MC, which was confirmed by the PCA (Figure A2).

3.2.5. Flowability

Flowability was expressed as HR and, according to the definition, powders can be classified as medium flowing powders (1.1 < HR < 1.25), difficult flowing powders (1.25 < HR < 1.4) or very difficult flowing powders (HR > 1.4) [28]. Powders had HR varying from 1.11 ± 0.06 to 1.67 ± 0.14 (Figure 6). Powders of better flowability were obtained at IAT of 100 and 120 °C using all three levels of IAH, which underlines the importance of temperature in producing powders of satisfying flowability. Many factors may influence the flowability, such as moisture content, powders morphology or particle distribution, which are the obvious consequence of process parameters [29]. At ambient air humidity (9–10 g/m3), the best flowability was achieved at the highest IAT regardless of FR, which would appear that the IAT was the factor that led to the collapse of the structure of particles due to rapid water evaporation. Presumably, this phenomenon resulted in powders of more compact, irregular particles of lower porosity, achieving powders of lower HR. In many cases, the increased MC decreases HR; however, it was not observed in this study as variants of satisfying flowability had generally lower MC, which was confirmed by the PCA as no strong correlation was noted (Figure A2) [29,30]. As aforementioned, the elevated temperature is probably responsible for better flowability of MD powders. This phenomenon was confirmed as well by the particles’ morphology, as generally more particles of a larger size were observed at higher IAT (Figure 3). The evaporation rate would be more rapid, which in consequence enables the formation of the particle at the very beginning of the drying process, resulting in a generally larger particle size and better flowability.

3.2.6. Hierarchical Clyster Analysis

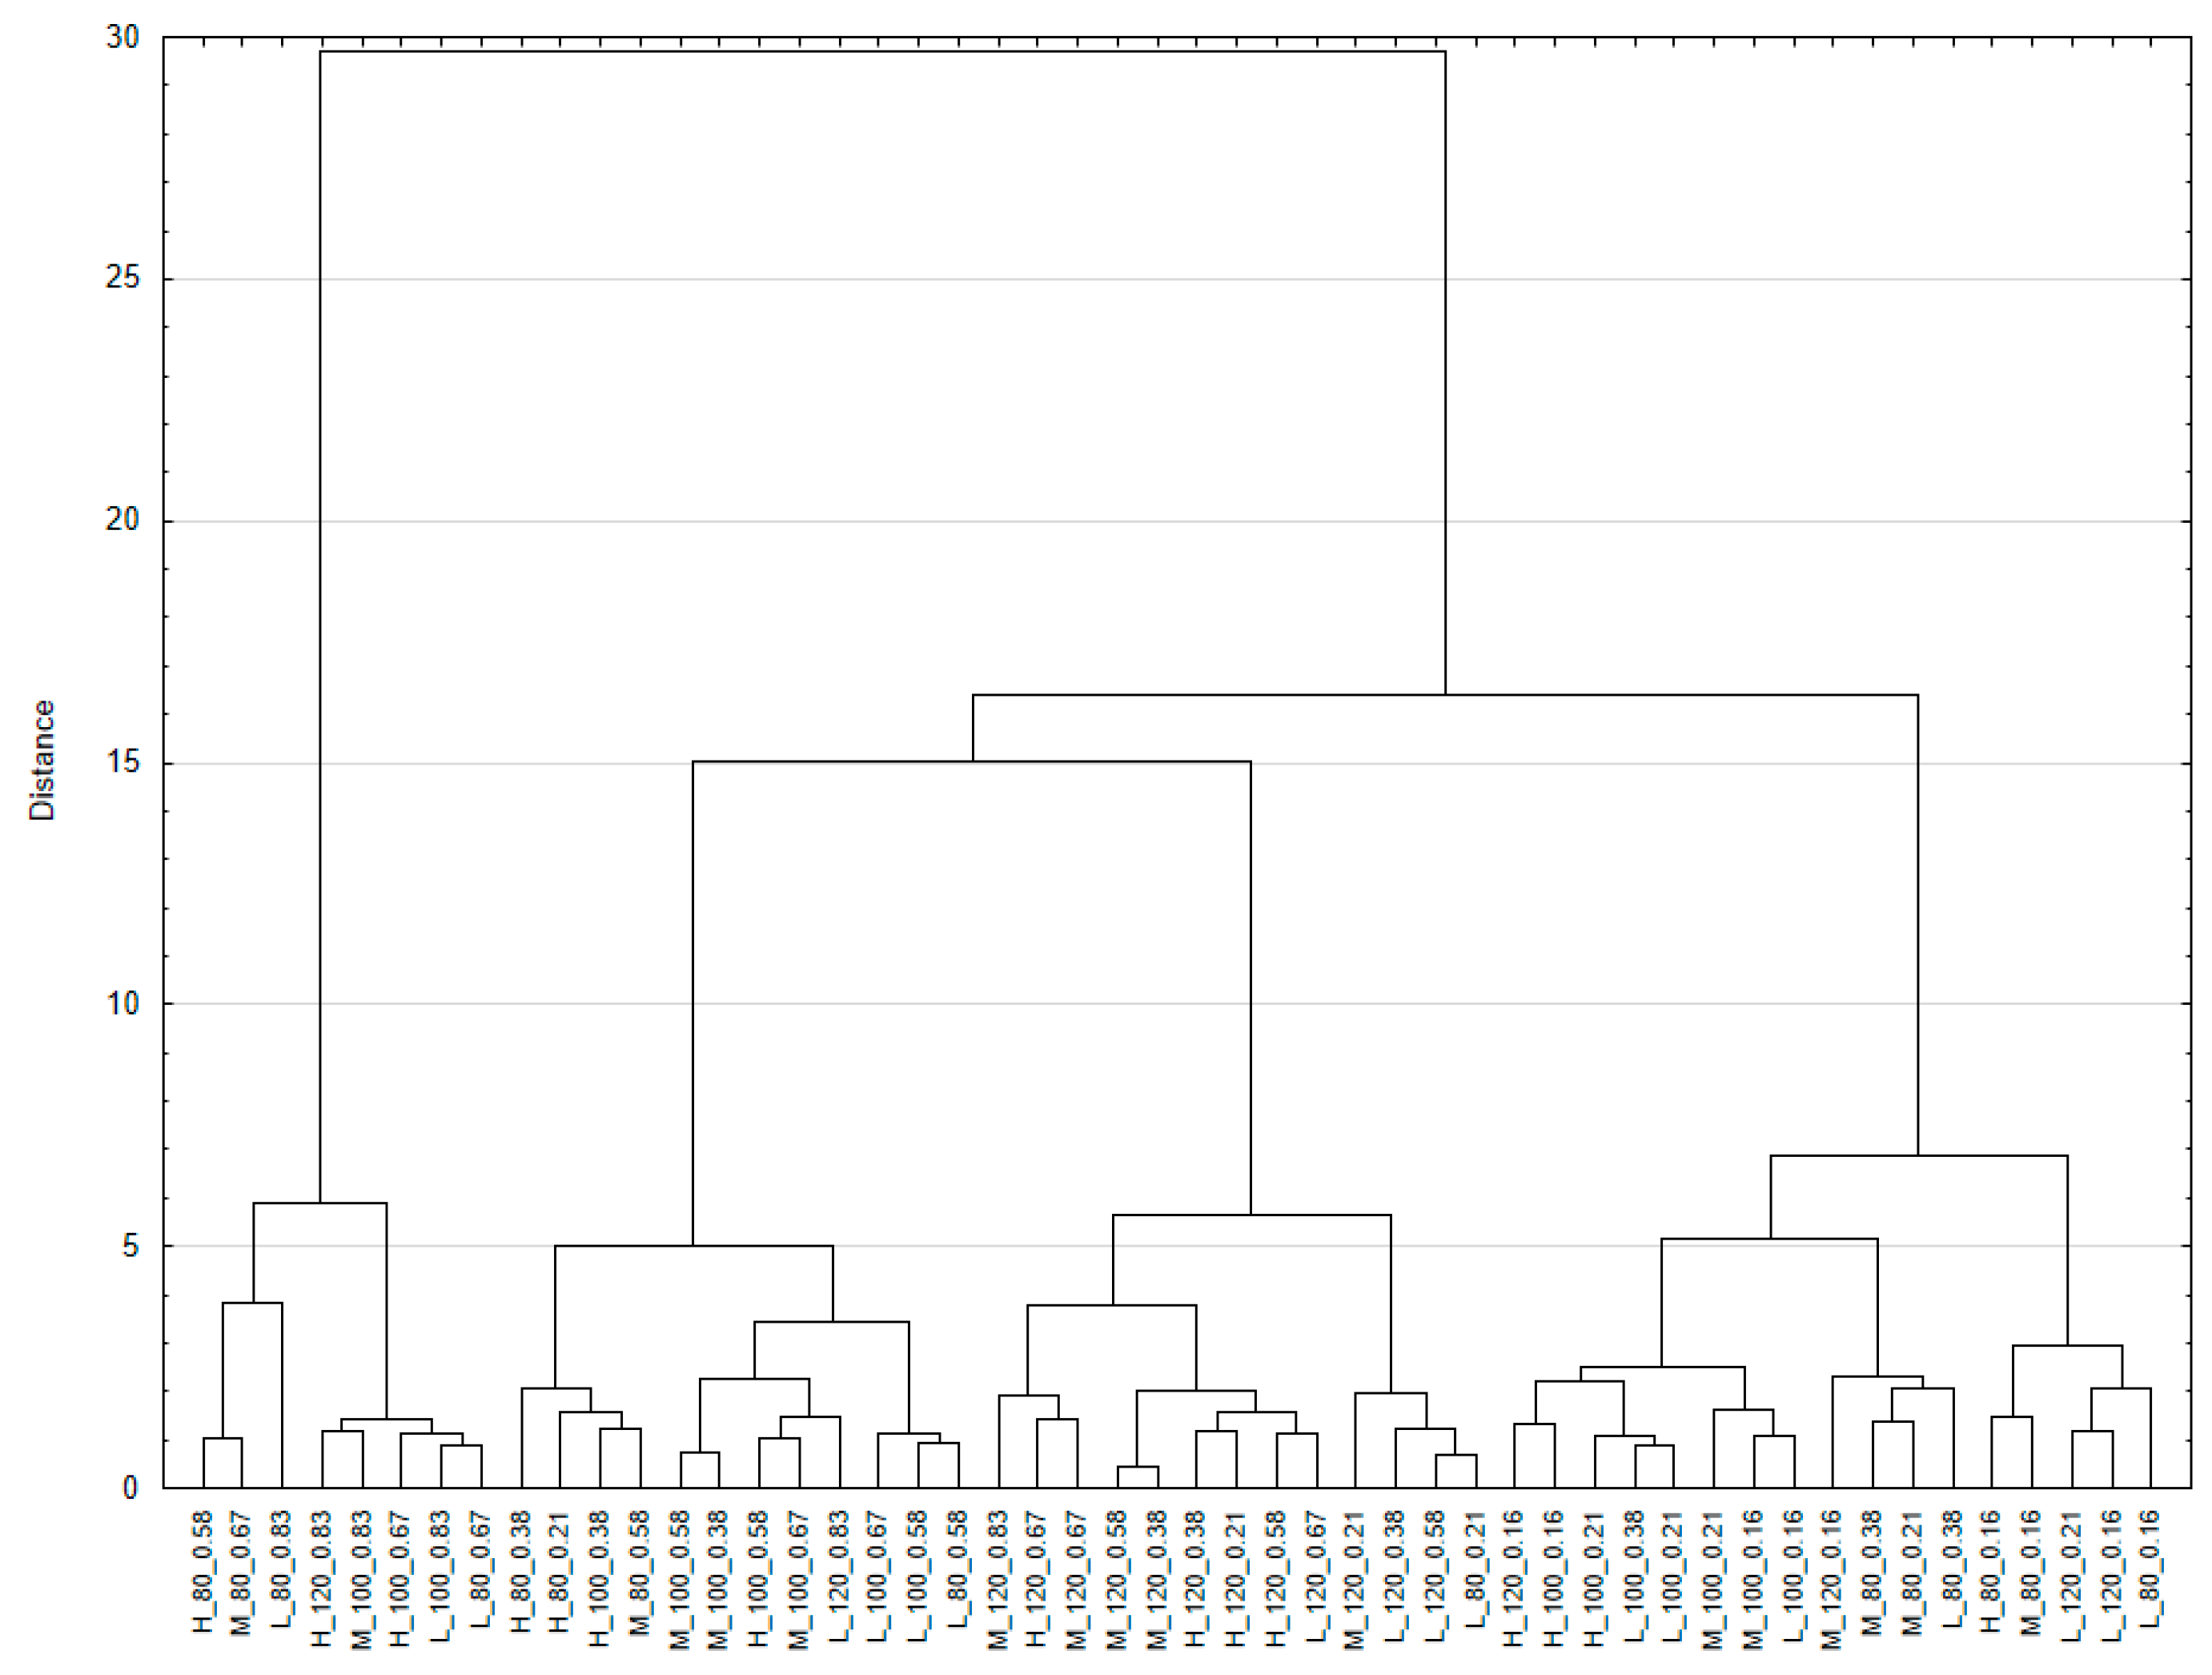
Hierarchical clyster analysis (HCA) was presented on the dendrogram indicate similarities between tested variants (Figure A3). Variants spray dried at IAT of 80–120 °C using every level of IAH and higher FR (0.58–0.83 mL/s) can be distinguished as a separate group, which points to their similarity. Most powders produced using higher FR formed a separate cluster, which confirmed that FR was a crucial factor in effective water evaporation, consequently influencing the tested properties. The variants that were the most similar, as the distance was only 0.5, were the solutions spray dried at 120 °C using medium level of IAH at FR of 0.38 mL/s and 0.58 mL/s.

3.3. Stage III

3.3.1. Powder Recovery

The linear model allowed the significant prediction (p-value < 0.05) of Rp. A satisfactory fit of the model to the data verified experimentally was noted, which was confirmed by the relatively high value of the determination coefficient (R2 = 0.7265) and the insignificant result of the lack of fit test (p-value > 0.05) (Table A2). Based on the estimated parameter values (Equation (3)) and response surface plots (Figure 7), it can be concluded that increasing the IAT and FC had a positive effect on Rp, while increasing IAH had a negative effect. The effect of IAH was larger than IAT and FC; however, as ANOVA showed, all of three tested variables significantly influenced the Rp of MD powders (p-value < 0.05).
As IAT increases, and at the same time drying IAH decreases, it ensures efficient mass and heat transfer that leads to effective and rapid water evaporation, consequently assuring satisfactory powder recovery. Particles that are dried at higher temperatures and additionally use air of decreased humidity become surface-dry quicker; thus, they are less likely to stick to finer particles and to the walls inside the drying chamber during collisions, resulting in the production of powders of a more satisfactory powder recovery. Rp is influenced by a product’s collection efficiency, the particles’ stickiness, and collector’s (cyclone) efficiency [31]. The relationship between drying air temperature and stickiness trend was observed by van Boven et al. (2023) who investigated the agglomeration phenomenon during spray drying of MD solutions, and by Both et al. (2020) who spray dried MD and whey protein mixtures [32,33]. Rp of produced MD powders varied from 32.89% to 78.98% (Table A1), and generally the lowest values were observed for the variants that considered the ambient IAH and the lowest IAT, while FC had a less significant effect (random order 8, 11, 18), underlining the non-effective water evaporation. According to Goula and Adamopoulos (2004), who spray dried tomato pulp with varying solids content, the increase in FC increased the risk of stickiness to the walls of the drying chamber, as the particles become surface-dry later [31]. The authors underlined that the final effect of the solids content in the liquid feed is strongly dependent on the drying medium, which was in accordance with the results of this research. The researchers noted that lowering IAH enabled rapid water evaporation from the particles, thus the particles became surface-dry quicker, lowering the risk of the stickiness between the particles and the walls of the drying chamber. Taken together, these conclusions further support the findings of this research.
R p = 14.13401 + 0.389094 · I A T 1.48332 · I A H + 0.618937 · F C

3.3.2. Moisture Content

The quadratic model facilitated the significant prediction (p-value < 0.05) of MC of tested model solutions. A very well-fitting model to the data obtained from the experiment was observed, which was confirmed by the high value of the determination coefficient (R2 = 0.8754) and the insignificant result of the lack of fit test (p-value > 0.05) (Table A2). On the basis of the estimated parameter values (Equation (4)) and response surface plots (Figure 8), it can be noted that increasing the IAT and FC had a negative effect on MC, while increasing IAH had a positive influence on MC. The effect of IAT was larger than IAH and FC. However, ANOVA showed IAT significantly influenced the MC of MD powders (both linear and quadratic effects), while IAH and FC terms were not significant (p-values < 0.05).
As aforementioned, powders with MC below 5% can generally be considered as stable [23]. MC produced MD powders varied from 4.6 ± 0.1% to 8.3 ± 0.6% (Table A1). A higher IAT in combination with drying air of low humidity, as mentioned before, increase the heat transfer rate, thus the driving force of water evaporation is greater, which leads to the production of powders of lower MC. Taking into account the effect of solely IAT, which was the term that significantly influenced the MC of model powders, Fazaeli et al. (2012) and Cuevas-Glory et al. (2017) observed the same relationship between IAT and MC of black mulberry juice and stingless bee honey powders [34,35]. As for the IAH, Schuck et al. (2008), who spray dried skim milk powder, noted that when the relative humidity of drying air increased, the MC of powders increased as well [24]. Moreover, the authors underlined that MC is strongly dependent on the aw of the material, which was confirmed as well by PCA in this research (Figure A4). FC influences the MC of the final product, as with the increased FC, there is less total moisture to evaporate. Secondly, increased FC usually leads to formation of particles of a larger diameter, thus the surface from which the moisture must evaporate is larger, which consequently increases the MC of the powders. When considering the effect of FC combined with IAT or IAH, which is similar to the effect of solely FC, the increase in both terms at the same time, decreased the MC of the model MD powders (Figure 8, Equation (4)).
M C = 8.09 0.9063 · I A T + 0.2437 · I A H 0.21833 · F C + 0.2063 · I A T · I A H 0.0062 · I A T · F C 0.3562 · I A H · F C 1.63 · I A T 2

3.3.3. Water Activity

The transformed quadratic model facilitated the significant prediction (p-value < 0.05) of aw of tested MD model solutions. A very well-fitting model to the data obtained from the experiment was noted, which was confirmed by the high value of the determination coefficient (R2 = 0.8840) and the insignificant result of the lack of fit test (p-value > 0.05) (Table A2). As the estimated parameter values (Equation (5)) and response surface plots (Figure 9) showed, which was similar to MC, it can be observed that increasing the IAT and FC had a negative effect on aw, while increasing IAH had a positive influence on aw. The effect of IAT was larger than IAH and FC. As ANOVA showed, IAT influenced significantly the aw of model MD powders (both linear and quadratic effects), but at the same time, IAH and FC terms were not significant (p-value < 0.05).
MD model powders had aw varying from 0.064 ± 0.002 to 0.375 ± 0.001 (Table A1). As aforementioned, powders of aw below 0.2 can be considered as shelf-stable, thus most of variants fall within the safe range for aw. It should be underlined that aw parameter should be taken into consideration in parallel with MC, as MC itself is not sufficient to evaluate the product’s stability. Strong positive correlation was noted according to PCA (Figure A4), confirming this statement. Aw describes the water availability, thus when powder has a high MC, but at the same time a low aw, it would indicate that the water present is bound structurally. The variants that were distinguished with the highest aw above 0.3, and MC higher than 5% were all center points, obtained from 20% MD solution at 100 °C using medium IAH, and were labeled as not shelf-stable (Table A1). It would seem that either increasing IAT or lowering IAH would drastically enhance the product’s shelf-stability by increasing the water evaporation rate.
a w = 0.6173 0.0603 · I A T + 0.0145 · I A H 0.0054 · F C + 0.0186 · I A T · I A H + 0.0019 · I A T · F C 0.026 · I A H · F C 0.225 · I A T 2

3.3.4. Loose Bulk and Tapped Density

The 2FI model facilitated the significant prediction (p-value < 0.05) of dL and dT of model MD powders. A satisfactory fit of the model to the data verified experimentally was noted, which was confirmed by the relatively high value of the determination coefficients (R2 = 0.7691 for dL and R2 = 0.7726 for dT) and the insignificant result of the lack of fit test (p-value > 0.05) (Table A2). Based on the estimated parameter values (Equations (6) and (7)) and response surface plots (Figure 10 and Figure 11) it can be concluded that increasing IAT and FC had a positive effect on dL and dT, while increasing IAH had negative effect on both parameters. The effect of IAH was larger than IAT and FC; however, as ANOVA showed, IAH and FC had a significant influence on dL and dT, while the IAT term was not significant (p-value < 0.05).
In general, the bulk density decreases with increasing temperature, which is related to the larger particle size of powders obtained at a higher temperature [34,36,37]. However, according to the PCA (Figure A4), the particle size was not correlated with dL.
d L = 0.1335568 + 0.002916 · I A T 0.077194 · I A H + 0.010992 · F C + 0.000218 · I A T · I A H 0.000109 · I A T · F C + 0.001952 · I A H · F C
d T = 0.5520 + 0.0556 · I A T 0.1210 · I A H + 0.1190 · F C + 0.0506 · I A T · I A H 0.0281 · I A T · I A H + 0.1244 · I A H · F C

3.3.5. Flowability

The 2FI model allowed the significant prediction (p-value < 0.05) of HR of model MD powders. A satisfactory fit of the model to the data verified experimentally was noted, which was confirmed by the relatively high value of the determination coefficients (R2 = 0.7510) and the insignificant result of the lack of fit test (p-value > 0.05) (Table A2). Based on the estimated parameter values (Equation (8)) and response surface plots (Figure 12), it can be concluded that increasing IAT and FC had a positive effect on HR, while increasing IAH had a negative effect. The effect of IAH was larger than IAT and FC; however, as ANOVA showed, IAH and FC had a significant influence on HR, while IAT term was not significant (p-value < 0.05).
It was found that with increasing IAT, powders were more cohesive and less flowable, and increasing humidity resulted in the formation of powders with better flowability. Thus, the powder obtained at the lowest temperature (80 °C), and the ambient humidity with the low maltodextrin concentration (10%) in the feed solution, is considered the most satisfying in terms of flowability (Table A1). At the same time, Himmetagaoglu and Erbay (2019) also found that the decrease in IAT (from 190 to 150 °C) resulted in better flowability properties for the microencapsulated cream powders [36]. George et al. (2025) noted as well that when the spray drying of milk powder with curcumin Cissus quadrangularis (CQ) extract lowered IAT from 200 to 160 °C, the powders’ flowability improved [38].
H R = 1.10 + 0.1444 · I A T 0.4503 · I A H + 0.1163 · F C + 0.1413 · I A T · I A H 0.0431 · I A T · F C + 0.1362 · I A H · F C

3.3.6. Particle Size and Particles Morphology

The quadratic model allowed the significant prediction (p-value < 0.05) of D50 of model MD powders. A very well-fitting model to the data verified experimentally was noted, which was confirmed by the high value of the determination coefficients (R2 = 0.9610) and the insignificant result of the lack of fit test (p-value > 0.05) (Table A2). Based on the estimated parameter values (Equation (9)) and response surface plots (Figure 13), it can be concluded that increasing IAT, IAH, and FC had a positive effect on D50. The effect of FC was larger than IAT and IAH; however, as ANOVA showed, all of the three terms had a significant influence on D50 (both linear and quadratic effects) (p-value < 0.05).
Tao et al. (2024) also found that grapeseed oil microcapsules on maltodextrin base, obtained by spray-drying at a higher IAT (180 °C), had a higher proportion of large-sized particles (average microcapsule diameter was 18.31 μm), compared to powders obtained at 140 °C (average microcapsule diameter was 8 μm) [39]. This may be due to the fact that at 180 °C the rate of evaporation of surface water of microcapsules was higher than the rate of water migration from the interior to the surface. According to the drying kinetics theory, unbalanced water migration leads to the expansion of microcapsules. Goula and Adamopoulos (2007) and Littringer et al. (2012), during spray drying the tomato pulp and mannitol, respectively, also observed that at higher FC, the particle size of powder particles was larger [31,40]. This phenomenon was explained by higher viscosity, which increases the droplet size of solutions at higher concentrations.
D 50 = 14.07 + 0.6292 · I A T + 0.6014 · I A H + 1.22 · F C 0.2167 · I A T · I A H 0.2202 · I A T · F C 0.1139 · I A H · F C + 1.53 · I A T 2
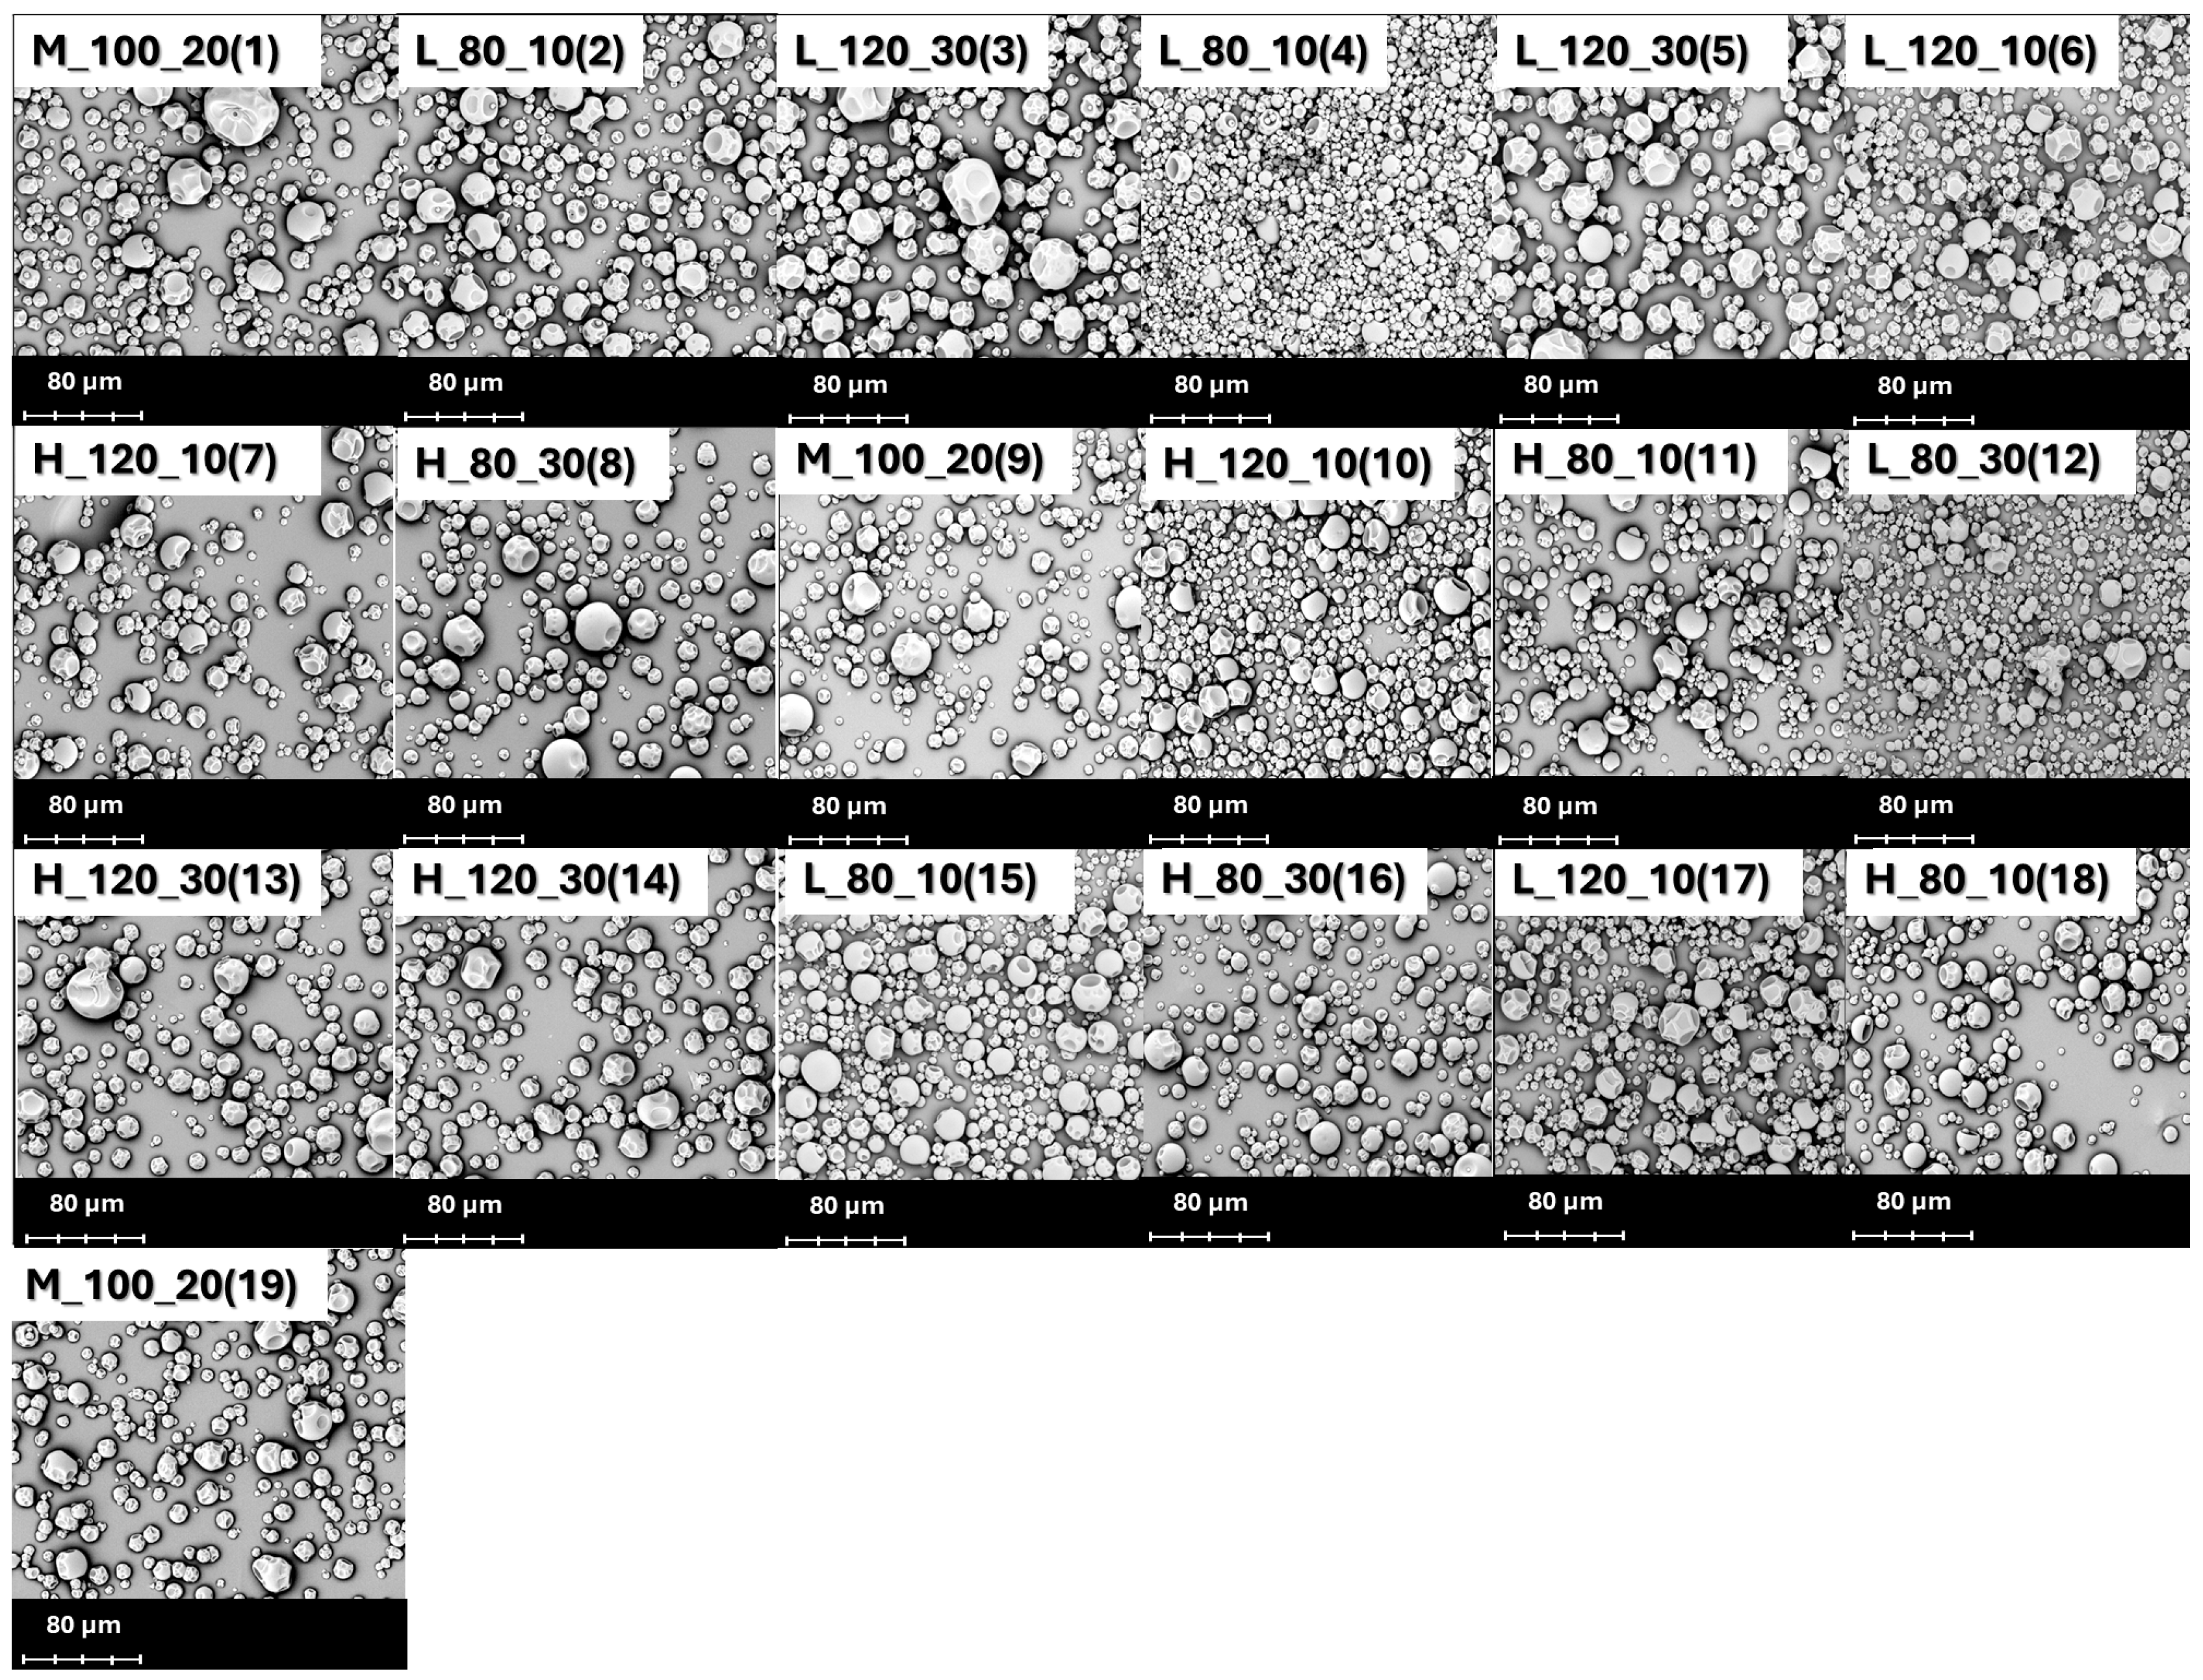
The particles were characterized by typical morphology for maltodextrin-based spray-dried powders (Figure 14). The particles were spherical with characteristic cavities. The maltodextrin-based powders obtained by Both et al. (2020) had similar appearances [33]. Similarly to Both et al. (2020), no effect of IAH or IAT on the morphology of the obtained particles was found. The maltodextrin concentration also did not affect the particle morphology [33].

3.3.7. Process Optimization

Parameters that were taken into consideration for optimization were Rp, aw and MC. The optimal spray drying parameters (IAT, IAH, FC) were selected using RSM considering selected criteria. Rp was maximized while MC and aw were minimized, as these parameters are crucial for the economic aspect of production and powders’ stability. As for the remaining powder properties (D50, dL, dT, HR), they were not a crucial factor in optimization as their minimization or maximization is dependent on the character of the producer and its expectations for the final product. Determined by the field of industry, not necessarily the food or biotechnological sector, producers can prioritize different powder properties, such as texture, chemical reactivity, antioxidant activity, bioactive compounds retention over flowability, density, or particle size. All of the terms (IAT, IAH, FC) and powders’ parameters (Rp, MC, aw) had the same importance. The Stat-Ease 23.1.8 program that was used to generate the optimal variants found 87 combinations, and the best solution was selected, taking into consideration the highest value of desirability. The IAT of 120 °C, IAH of 0.1 g/m3 and FC of 29.571% were found to be optimal parameters with a desirability of 0.89. According to the predicted model, this variant would have Rp of 78.98%, MC of 5.226%, and aw of 0.105.

3.3.8. Hierarchical Clyster Analysis

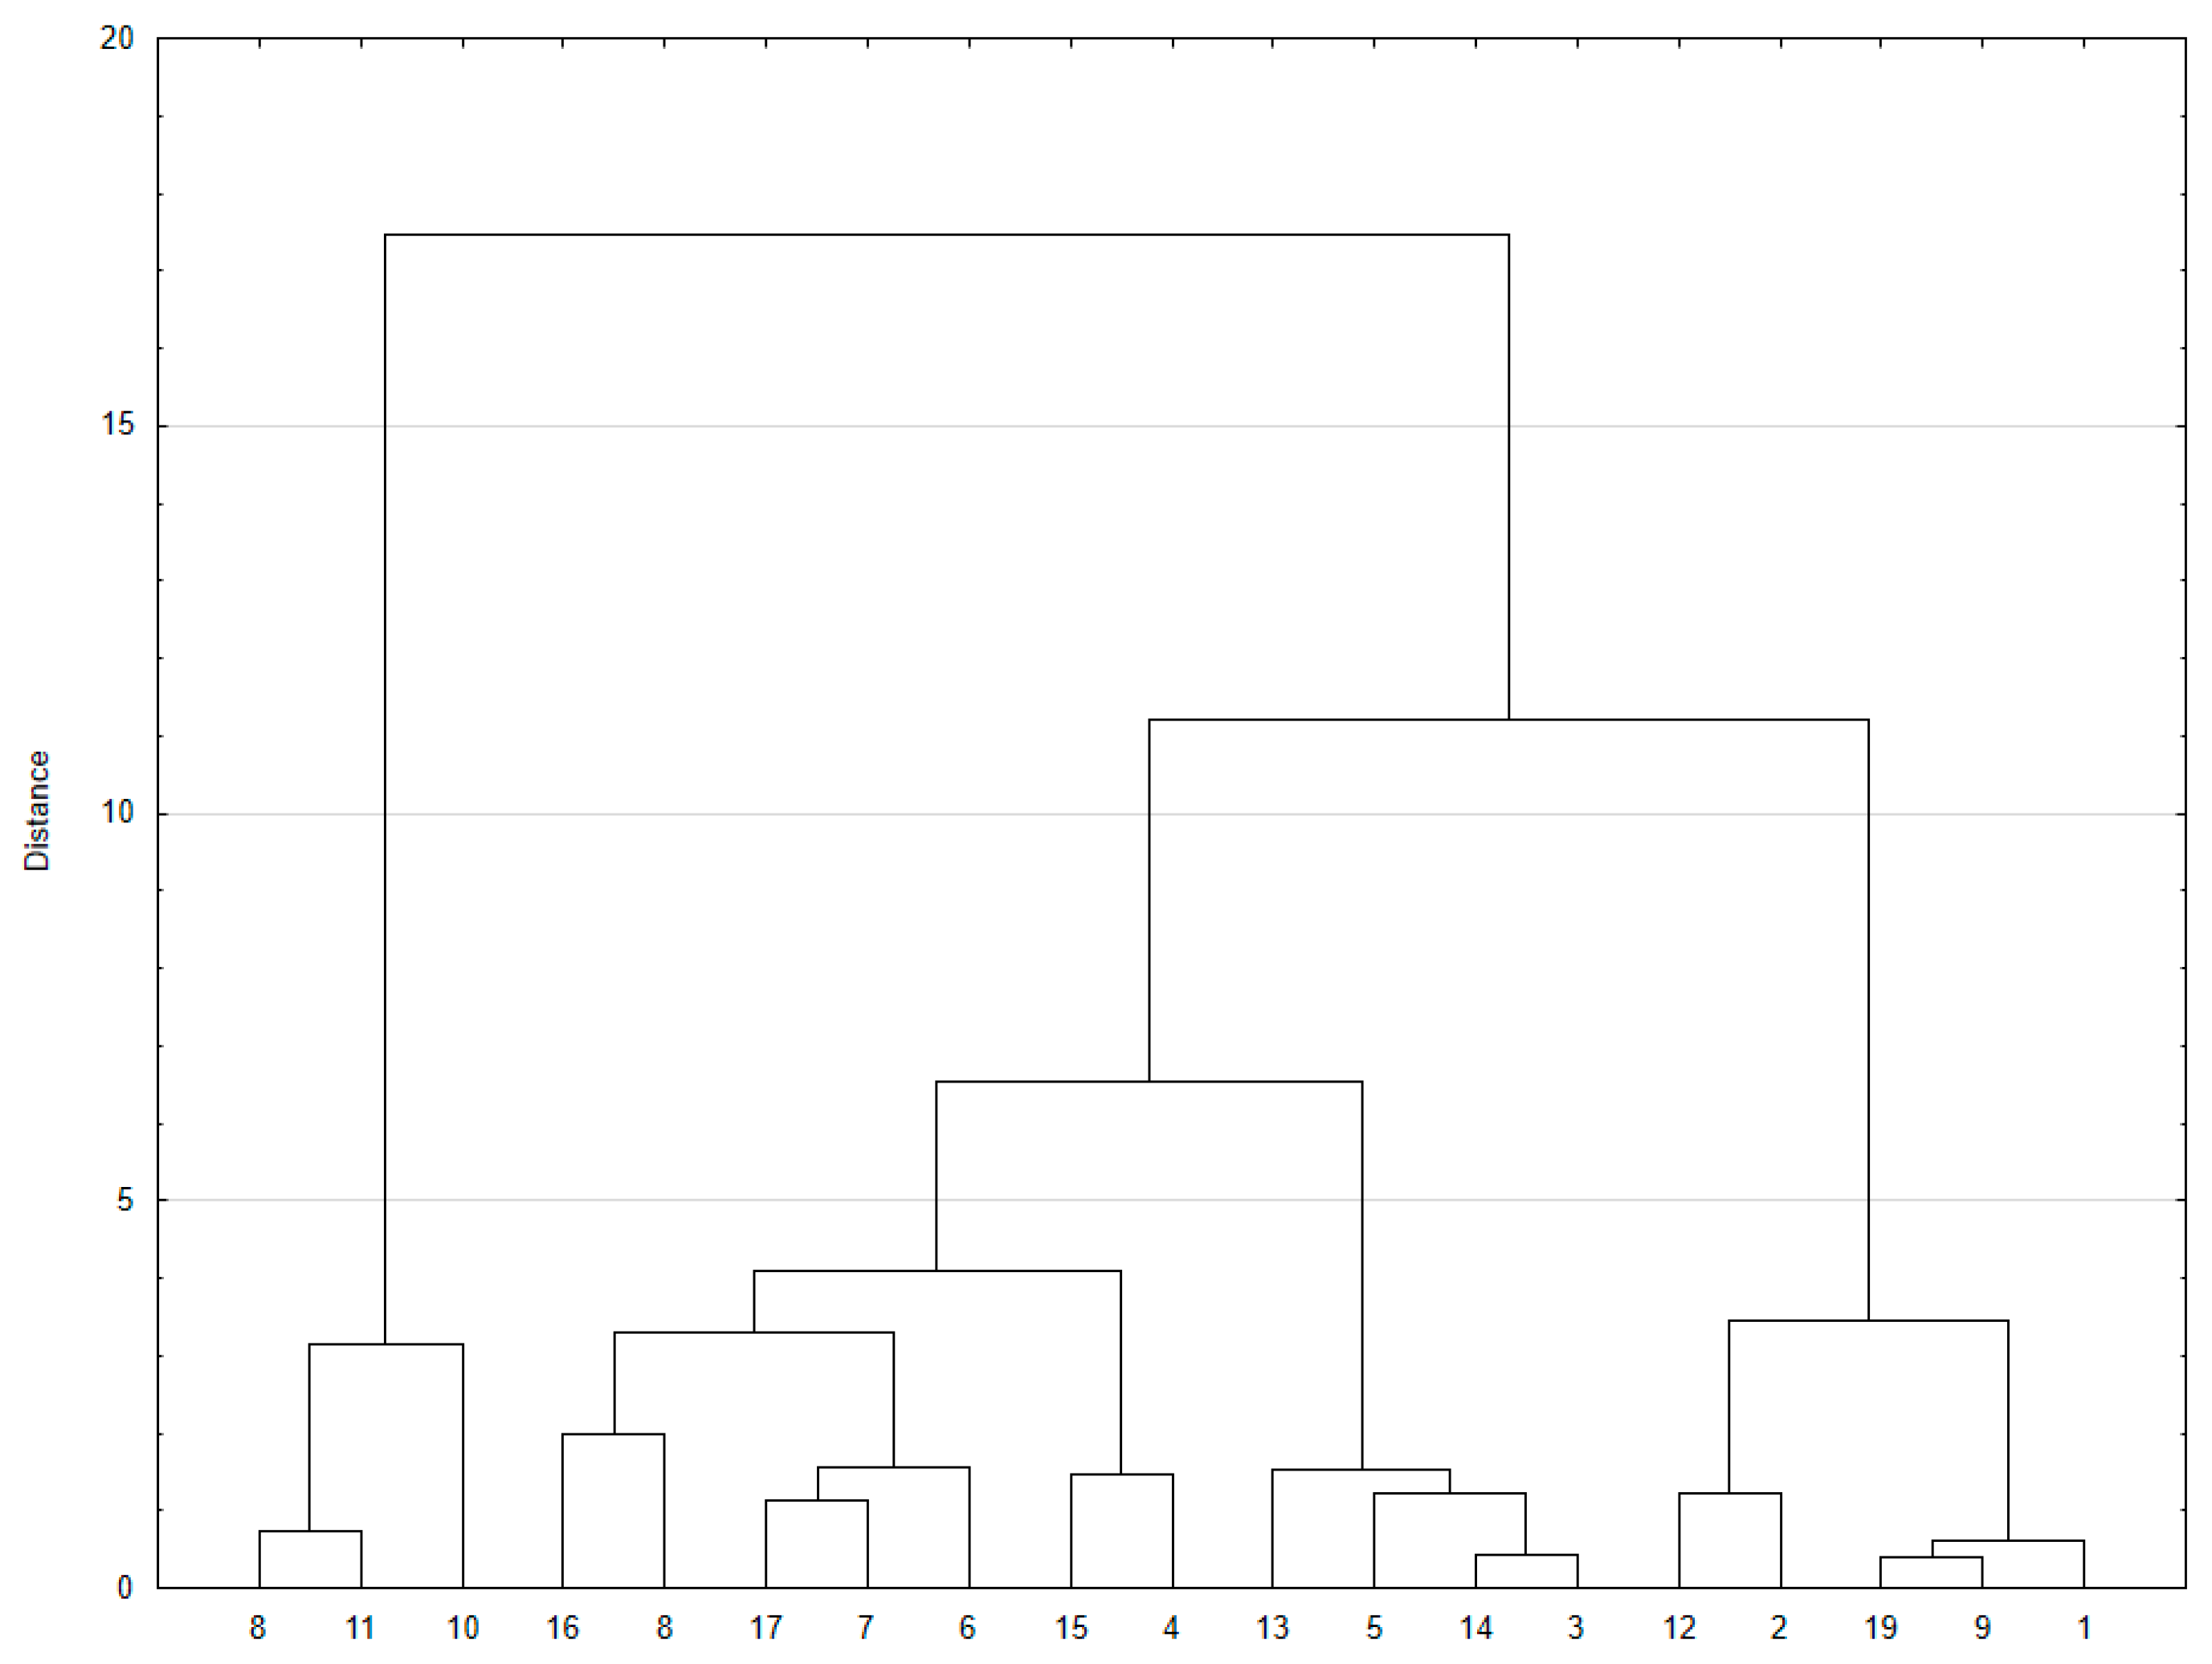
Based on the HCA dendrogram, a cluster of three variants can be distinguished from all of the analyzed MD powders (Figure A5). In these variants, 10% and 30% feed concentrations were used, and they were spray dried using the highest IAH (9–10 g/m3) at 80 °C at 120 °C (random order 8, 10, 11). Moreover, in the case of powders produced from 10% and 30% FC and spray dried at 80 °C using the highest IAH (random order 8 and 11), the similarity was strong as the distance was only 0.8. However, the highest similarity between tested variants can be observed for the MD model powders of random order 9 and 19, which were both center points (0.4 distance) and for the variants of random order 3 and 14 (0.4 distance). As for the latter variants, these were the powders that were both produced from 30% solution and at 120 °C, nevertheless using the highest and the lowest level of humidity of drying air. It would seem to appear that in these two variants IAT and FC had a more significant influence on powders’ properties than IAH.

4. Conclusions

Stage I: IAH had a significant impact on both s and Es of spray drying/evaporation of model solution of distilled water. The ambient IAH increased the s significantly compared to experiments conducted at lower values. Es was also influenced by the FR but the effect was the most visible at the lowest value (0.16 mL/s). At higher FR, irrespective of the inlet air temperature, the effect was less significant as the same energy input was needed to evaporate the same amount of water. Obtained results highlight potential improvements in the drying process while modifying FR regardless of the drying temperature or air humidity. The approach presented in this stage has the potential to reduce energy consumption in order to lower operational costs.
Stage II: The evidence from this stage of the research suggests that the decreased IAH to the medium (1.1–1.3 g/m3) or low (0.1–0.3 g/m3) levels of the medium level led to the production of model maltodextrin powders of the most satisfying Rp, MC and aw. In order to enhance the mass and heat transfer, especially when spray drying at ambient IAH, and in consequence improve powders’ properties, it was important to increase the IAT.
Stage III: Presented results proved that it was possible to optimize maltodextrin solutions spray drying due to the application of the dehumidified air. The findings imply that lowered IAH in combination with increased IAT supported more efficient mass and heat transfer, leading to production of powders with more satisfactory Rp, lower MC and aw. It was also concluded that increasing FC was favorable in order to lower MC and aw, as there was less total moisture to evaporate. When taking into consideration the highest Rp, the lowest MC, and aw, the conditions that were the most optimal for spray drying of maltodextrin solutions were inlet air temperature of 120 °C, inlet air humidity of 0.1 g/m3 and feed solution concentration of 29.571%.
This three-stage research adds substantially to fundamental knowledge on the impact of drying air humidity in spray drying based on the use of model materials. These findings have important implications for optimizing process parameters in order to enhance powder properties and at the same time lower operational costs. However, as this study has only investigated the distilled water evaporation and maltodextrin solutions spray drying, further experimental investigation should be taken into consideration to validate results with real food matrices.

Author Contributions

Conceptualization, A.B.-D. and K.S.; methodology, A.B.-D. and K.S.; formal analysis, A.B.-D., A.J. and K.S.; investigation, A.B.-D. and K.S.; data curation, A.B.-D.; writing—original draft preparation, A.B.-D. and A.J.; writing—review and editing, A.B.-D. and K.S.; visualization, A.B.-D.; supervision, K.S.; project administration, A.B.-D.; funding acquisition, A.B.-D. All authors have read and agreed to the published version of the manuscript.

Funding

This research was funded by the National Science Center, Poland (in Polish: NCN—Narodowe Centrum Nauki), program: PRELUDIUM–20, grant number 2021/41/N/ST8/01742 (“Investigation on the role of drying air humidity in shaping the conditions of spray drying”, in Polish: “Badanie roli wilgotności powietrza suszącego w kształtowaniu warunków suszenia rozpyłowego”).

Institutional Review Board Statement

Not applicable.

Informed Consent Statement

Not applicable.

Data Availability Statement

The original contributions presented in this study are included in the article. Further inquiries can be directed at the corresponding author.

Acknowledgments

The research for this publication was carried out with the use of equipment purchased as part of the “Food and Nutrition Center—modernization of the WULS campus to create a Food and Nutrition Research and Development Centre (CŻiŻ)”, co-financed by the European Union from the European Regional Development Fund under the Regional Operational Program of the Mazowieckie Voivodeship for 2014–2020 (Project No. YMA.01.01.00-14-8276/17).

Conflicts of Interest

The authors declare no conflicts of interest.

Appendix A

Figure A1. Schematic diagram of the three stages of the research.
Applsci 15 05761 g0a1
Figure A2. PCA for analyzed properties (moisture content (MC), water activity (aw), loose bulk density (dL), tapped bulk density (dT), flowability (HR) and powder recovery (Rp) of MD model powders in Stage II of the research.
Applsci 15 05761 g0a2
Figure A3. HCA classification of tested variants of MD model powders in Stage II of the research. L, M, H signifies the low, medium, or high level of drying air humidity; 80, 100, 120 signifies the drying air temperature; 0.16, 0.58, 0.67, 0.83 signifies the feed rate.
Applsci 15 05761 g0a3
Figure A4. PCA for analyzed properties (moisture content (MC), water activity(aw), loose bulk density (dL), tapped bulk density (dT), flowability (HR), median particle diameter (D50), and powder recovery (Rp) of MD model powders in Stage III of the research.
Applsci 15 05761 g0a4
Figure A5. HCA classification of tested variants of MD model powders in Stage III of the research.
Applsci 15 05761 g0a5
Table A1. Powder recovery (Rp), moisture content (MC), water activity (aw), loose bulk density (dL), tapped bulk density (dT), flowability (HR), and median particle diameter (D50) of MD powders in Stage III of the research. L, M, H signifies the low, medium, or high level of drying air humidity; 80, 100, 120 signifies the drying air temperature; 10, 20, 30 signifies the feed solution concentration.
OrderDrying
Parameters
Rp [%]MC [%]awdL [g/cm3]dT [g/cm3]HR [-]D50 [µm]
1M_100_2067.867.8 ± 0.1 hi0.359 ± 0.010 j0.42 ± 0.04 ab0.60 ± 0.02 ab1.43 ± 0.10 ab13.91 ± 0.03 abc
2L_80_1069.917.2 ± 0.1 fgh0.230 ± 0.001 gh0.44 ± 0.02 abc0.63 ± 0.01 ab1.43 ± 0.10 ab15.43 ± 0.08 efg
3L_120_3067.395.2 ± 0.2 abc0.101 ± 0.005 bc0.45 ± 0.03 abc0.66 ± 0.03 abc1.47 ± 0.12 ab16.80 ± 0.12 ghij
4L_80_1054.076.3 ± 0.2 def0.136 ± 0.003 e0.42 ± 0.00 ab0.65 ± 0.01 abc1.54 ± 0.00 b12.57 ± 0.23 a
5L_120_3078.984.9 ± 0.1 ab0.079 ± 0.013 a0.46 ± 0.02 bc0.62 ± 0.06 ab1.34 ± 0.09 ab17.17 ± 0.39 hij
6L_120_1059.444.6 ± 0.1 a0.064 ± 0.002 a0.45 ± 0.02 abc0.66 ± 0.04 bc1.47 ± 0.06 ab14.38 ± 0.12 bcde
7H_120_1049.126.1 ± 0.4 cde0.116 ± 0.001 cd0.42 ± 0.02 ab0.66 ± 0.01 abc1.58 ± 0.07 b15.36 ± 0.45 def
8H_80_3032.896.9 ± 0.1 efg0.167 ± 0.003 f0.40 ± 0.01 ab0.57 ± 0.02 a1.43 ± 0.00 ab17.52 ± 1.34 ij
9M_100_2071.267.8 ± 0.2 hi0.375 ± 0.001 j0.40 ± 0.05 ab0.63 ± 0.03 abc1.61 ± 0.25 b13.22 ± 0.21 ab
10H_120_1059.896.7 ± 0.1 ef0.164 ± 0.005 f---16.17 ± 0.29 fgh
11H_80_1038.658.3 ± 0.6 i0.274 ± 0.002 i---13.99 ± 0.53 abcd
12L_80_3060.918.2 ± 0.2 i0.265 ± 0.008 i0.38 ± 0.01 a0.62 ± 0.03 ab1.62 ± 0.07 b15.94 ± 0.23 fgh
13H_120_3074.836.0 ± 0.9 cde0.164 ± 0.004 f0.48 ± 0.05 bc0.65 ± 0.04 abc1.37 ± 0.05 ab17.85 ± 0.85 j
14H_120_3068.765.2 ± 0.0 abc0.096 ± 0.007 b0.44 ± 0.04 abc0.72 ± 0.03 c1.62 ± 0.07 b17.11 ± 0.80 hij
15L_80_1050.857.8 ± 0.4 ghi0.215 ± 0.004 g0.42 ± 0.00 ab0.66 ± 0.05 bc1.59 ± 0.14 b12.69 ± 0.34 a
16H_80_3055.676.4 ± 0.1 def0.143 ± 0.004 e0.51 ± 0.01 c0.61 ± 0.02 ab1.20 ± 0.04 a16.79 ± 1.16 ghij
17L_120_1063.675.7 ± 0.2 bcd0.118 ± 0.001 d0.42 ± 0.01 ab0.66 ± 0.02 bc1.58 ± 0.07 b15.03 ± 0.04 cdef
18H_80_1034.628.2 ± 0.1 i0.234 ± 0.003 h---14.88 ± 0.43 cdef
19M_100_2071.378.1 ± 0.1 hi0.368 ± 0.003 j0.38 ± 0.02 a0.60 ± 0.01 ab1.58 ± 0.07 b13.69 ± 0.21 abc
a–j indicate the same homogenous groups based on Tukey’s test (p ≥ 0.05).
Table A2. The results of statistical analysis of fitting the equations of the response surfaces to the values obtained experimentally in Stage III of the research.
ResponseModelR2CV [%]p-Value (Model)p-Value (Lack of Fit)
RpLinear0.726512.900.00020.2160
MCQuadratic0.87548.130.00030.1950
awTransformed quadratic (square root)0.884011.290.00020.0656
D50Quadratic0.96102.75<0.00010.7811
dL2FI0.769126.680.00270.5085
dT2FI0.772626.220.00250.7196
HR2FI0.751027.710.00410.7139
The p-value model < 0.05 and p-value lack of fit > 0.05 indicate that the terms of the model are significant.

References

  1. Bhandari, B.R.; Datta, N.; Howes, T. Problems associated with spray drying of sugar-rich foods. Dry. Technol. 1997, 15, 671–684. [Google Scholar] [CrossRef]
  2. Hayashi, H. Drying Technologies of Foods-Their History and Future. Dry. Technol. 1989, 7, 315–369. [Google Scholar] [CrossRef]
  3. Ameri, M.; Maa, Y.F. Spray drying of biopharmaceuticals: Stability and process considerations. Dry. Technol. 2006, 24, 763–768. [Google Scholar] [CrossRef]
  4. Babalis, S.J.; Belessiotis, V.G. Influence of the drying conditions on the drying constants and moisture diffusivity during the thin-layer drying of figs. J. Food Eng. 2004, 65, 449–458. [Google Scholar] [CrossRef]
  5. Goula, A.M.; Adamopoulos, K.G. Spray drying of tomato pulp in dehumidified air: I. The effect on product recovery. J. Food Eng. 2005, 66, 25–34. [Google Scholar] [CrossRef]
  6. Goula, A.M.; Adamopoulos, K.G. Effect of maltodextrin addition during spray drying of tomato pulp in dehumidified air: II. powder properties. Dry. Technol. 2008, 26, 726–737. [Google Scholar] [CrossRef]
  7. Goula, A.M.; Adamopoulos, K.G. A new technique for spray drying orange juice concentrate. Innov. Food Sci. Emerg. Technol. 2010, 11, 342–351. [Google Scholar] [CrossRef]
  8. Jedlińska, A.; Samborska, K.; Wieczorek, A.; Wiktor, A.; Ostrowska-Ligęza, E.; Jamróz, W.; Skwarczyńska-Maj, K.; Kiełczewski, D.; Błażowski, Ł.; Tułodziecki, M.; et al. The application of dehumidified air in rapeseed and honeydew honey spray drying-Process performance and powders properties considerations. J. Food Eng. 2019, 245, 80–87. [Google Scholar] [CrossRef]
  9. Samborska, K.; Sarabandi, K.; Tonon, R.; Topuz, A.; Eroğlu, E.; Kaymak-Ertekin, F.; Malekjani, N.; Jafari, S.M. Recent progress in the stickiness reduction of sugar-rich foods during spray drying. Dry. Technol. 2023, 41, 2566–2585. [Google Scholar] [CrossRef]
  10. Samborska, K. Powdered honey-drying methods and parameters, types of carriers and drying aids, physicochemical properties and storage stability. Trends Food Sci. Technol. 2019, 88, 133–142. [Google Scholar] [CrossRef]
  11. Samborska, K.; Edris, A.; Jedlińska, A.; Barańska, A. The production of white mulberry molasses powders with prebiotic carrier by dehumidified air-assisted spray drying. J. Food Process Eng. 2021, 45, e13928. [Google Scholar] [CrossRef]
  12. Barańska, A.; Jedlińska, A.; Samborska, K. Is it Possible to Produce Carrier-Free Fruit and Vegetable Powders by Spray Drying? Pol. J. Food Nutr. Sci. 2023, 73, 214–223. [Google Scholar] [CrossRef]
  13. Velić, D.; Bilić, M.; Tomas, S.; Planinić, M. Simulation, calculation and possibilities of energy saving in spray drying process. Appl. Therm. Eng. 2003, 23, 2119–2131. [Google Scholar] [CrossRef]
  14. Bimbenet, J.J.; Schuck, P.; Roignant, M.; Brulé, G.; Méjean, S. Heat balance of a multistage spray-dryer: Principles and example of application. Lait 2002, 82, 541–551. [Google Scholar] [CrossRef]
  15. Kosasih, E.A.; Rafdi, M.; Firdaus, F. Experimental investigation of vitamin C yield of tomatoes and vitamin C essence by spray drying and dehumidifying the drying air: Product quality and energy consumption. In Proceedings of the 9th International Conference on Thermofluids, Yogyakarta, Indonesia, 9–10 November 2017; Pranoto, I., Deendarlianto, Widyaparaga, A., Majid, A.I., Wiranata, A., Takei, M., Höhne, T., Eds.; AIP Publishing: Melville, NY, USA, 2018. [Google Scholar]
  16. Samborska, K.; Barańska, A.; Szulc, K.; Jankowska, E.; Truszkowska, M.; Ostrowska-Ligęza, E.; Wołosiak, R.; Szymańska, E.; Jedlińska, A. Reformulation of spray-dried apple concentrate and honey for the enhancement of drying process performance and the physicochemical properties of powders. J. Sci. Food Agric. 2020, 100, 2224–2235. [Google Scholar] [CrossRef]
  17. Nguyen, D.Q.; Mounir, S.; Allaf, K. Optimization of the spray drying operating conditions for producing the powder mixture of gum Arabic and maltodextrin. Int. J. Food Eng. 2017, 13, 20160271. [Google Scholar] [CrossRef]
  18. Ravichandran, K.S.; Silva, E.S.; Moncada, M.; Perkins-Veazie, P.; Lila, M.A.; Greenlief, C.M.; Thomas, A.L.; Hoskin, R.T.; Krishnaswamy, K. Spray drying to produce novel phytochemical-rich ingredients from juice and pomace of American elderberry. Food Biosci. 2023, 55, 102981. [Google Scholar] [CrossRef]
  19. Gavarić, A.; Vladić, J.; Ambrus, R.; Jokić, S.; Szabó-Révész, P.; Tomić, M.; Blažić, M.; Vidović, S. Spray drying of a subcritical extract using Marrubium vulgare as a method of choice for obtaining high quality powder. Pharmaceutics 2019, 11, 523. [Google Scholar] [CrossRef]
  20. Siemons, I.; Politiek, R.G.A.; Boom, R.M.; van der Sman, R.G.M.; Schutyser, M.A.I. Dextrose equivalence of maltodextrins determines particle morphology development during single sessile droplet drying. Food Res. Int. 2020, 131, 108988. [Google Scholar] [CrossRef]
  21. Gouaou, I.; Shamaei, S.; Koutchoukali, M.S.; Bouhelassa, M.; Tsotsas, E.; Kharaghani, A. Impact of operating conditions on a single droplet and spray drying of hydroxypropylated pea starch: Process performance and final powder properties. Asia Pac. J. Chem. Eng. 2019, 14, e2268. [Google Scholar] [CrossRef]
  22. Boel, E.; Koekoekx, R.; Dedroog, S.; Babkin, I.; Vetrano, M.R.; Clasen, C.; van der Mooter, G. Unraveling particle formation: From single droplet drying to spray drying and electrospraying. Pharmaceutics 2020, 12, 625. [Google Scholar] [CrossRef] [PubMed]
  23. Žugić, A.; Krgović, N.; Mudrić, J.; Kostov, M.T.; Tomović, M.; Medarević, D.; Nešić, I.; Tadić, V. Pectin as the carrier for the spray drying of green tea extracts: Tailoring microencapsulation to obtain a prospective nutraceutical. Int. J. Biol. Macromol. 2025, 306, 141514. [Google Scholar] [CrossRef]
  24. Schuck, P.; Dolivet, A.; Méjean, S.; Jeantet, R. Relative humidity of outlet air: The key parameter to optimize moisture content and water activity of dairy powders. Dairy Sci. Technol. 2008, 88, 45–52. [Google Scholar] [CrossRef]
  25. Keshani, S.; Daud, W.R.W.; Woo, M.W.; Talib, M.Z.M.; Chuah, A.L.; Russly, A.R. Artificial neural network modeling of the deposition rate of lactose powder in spray dryers. Dry. Technol. 2012, 30, 386–397. [Google Scholar] [CrossRef]
  26. Juarez-Enriquez, E.; Olivas, G.I.; Zamudio-Flores, P.B.; Perez-Vega, S.; Salmeron, I.; Ortega-Rivas, E.; Sepulveda, D.R. A review on the influence of water on food powder flowability. J. Food Process Eng. 2022, 45, e14031. [Google Scholar] [CrossRef]
  27. Koç, B.; Koç, M.; Baysan, U. Food Powders Bulk Properties. In Food Powders Properties and Characterization; Ermiş, E., Ed.; Springer: Cham, Switzerland, 2021; pp. 1–36. [Google Scholar]
  28. Barbosa-Cánovas, G.V.; Ortega-Rivas, E.; Juliano, P.; Yan, H. Bulk properties. In Food Powders: Physical Properties, Processing, and Functionality; Barbosa-Cánovas, G.V., Ed.; Springer: Boston, MA, USA, 2005; pp. 55–90. [Google Scholar]
  29. Suhag, R.; Kellil, A.; Razem, M. Factors Influencing Food Powder Flowability. Powders 2024, 3, 65–76. [Google Scholar] [CrossRef]
  30. Juarez-Enriquez, E.; Olivas, G.I.; Zamudio-Flores, P.B.; Ortega-Rivas, E.; Perez-Vega, S.; Sepulveda, D.R. Effect of water content on the flowability of hygroscopic powders. J. Food Eng. 2017, 205, 12–17. [Google Scholar] [CrossRef]
  31. Goula, A.M.; Adamopoulos, K.G. Spray drying of tomato pulp: Effect of feed concentration. Dry. Technol. 2004, 22, 2309–2330. [Google Scholar] [CrossRef]
  32. van Boven, A.P.; Calderon Novoa, S.M.; Kohlus, R.; Schutyser, M.A.I. Investigation on nozzle zone agglomeration during spray drying using response surface methodology. Powder Technol. 2023, 429, 118910. [Google Scholar] [CrossRef]
  33. Both, E.M.; Boom, R.M.; Schutyser, M.A.I. Particle morphology and powder properties during spray drying of maltodextrin and whey protein mixtures. Powder Technol. 2020, 363, 519–524. [Google Scholar] [CrossRef]
  34. Fazaeli, M.; Emam-Djomeh, Z.; Kalbasi Ashtari, A.; Omid, M. Effect of spray drying conditions and feed composition on the physical properties of black mulberry juice powder. Food Bioprod. Process. 2012, 90, 667–675. [Google Scholar] [CrossRef]
  35. Cuevas-Glory, L.F.; Pino, J.A.; Sosa-Moguel, O.; Sauri-Duch, E.; Bringas-Lantigua, M. Optimization of the spray-drying process for developing stingless bee honey powder. Int. J. Food Eng. 2017, 13, 20160217. [Google Scholar] [CrossRef]
  36. Himmetagaoglu, A.B.; Erbay, Z. Effects of spray drying process conditions on the quality properties of microencapsulated cream powder. Int. Dairy J. 2019, 88, 60–70. [Google Scholar] [CrossRef]
  37. Chegini, G.R.; Ghobadian, B. Effect of spray-drying conditions on physical properties of orange juice powder. Dry. Technol. 2005, 23, 657–668. [Google Scholar] [CrossRef]
  38. George, S.; Kumar, M.V.P.; Kumar, B.R. Investigating the impact of spray drying parameters on milk powder bio fortification with curcumin and veld grape (Cissus quadrangularis) extract. Food Hum. 2025, 4, 100572. [Google Scholar] [CrossRef]
  39. Tao, Y.; Tang, Z.; Huang, Q.; Xu, X.; Cheng, X.; Zhang, G.; Jing, X.; Li, X.; Liang, J.; Granato, D.; et al. Effects of spray drying temperature on physicochemical properties of grapeseed oil microcapsules and the encapsulation efficiency of pterostilbene. Lebensm. Wiss. Technol. 2024, 193, 115779. [Google Scholar] [CrossRef]
  40. Littringer, E.M.; Mescher, A.; Eckhard, S.; Schröttner, H.; Langes, C.; Fries, M.; Griesser, U.; Walzel, P.; Urbanetz, N.A. Spray drying of mannitol as a drug carrier—The impact of process parameters on product properties. Dry. Technol. 2012, 30, 114–124. [Google Scholar] [CrossRef]
Figure 1. (A) Drying air consumption (s); (B) specific energy consumption (Es) during spray drying/evaporation of distilled water at different inlet air temperature (80–120 °C), inlet air humidity (0.1–10 g/m3), and feed rate (0.16–0.83 mL/s) (Stage I); blue areas indicate the experiments where not-evaporated water was observed inside the drying chamber. The gradient of blue, orange and red color indicate the increasing inlet air temperature, while blue color demonstrates the lowest level, orange the middle level and red the highest level of inlet air humidity.
Applsci 15 05761 g001
Figure 2. Powder recovery (Rp) after MD spray drying at different inlet air temperature (80–120 °C), inlet air humidity (0.1–10 g/m3) and feed rate (0.16–0.83 mL/s) (Stage II); blue areas on the figure indicate the experiments, where not-evaporated water was observed inside the drying chamber. The gradient of blue, orange and red color indicate the increasing inlet air temperature, while blue color demonstrates the lowest level, orange the middle level and red the highest level of inlet air humidity.
Applsci 15 05761 g002
Figure 3. SEM images of chosen variants produced in Stage II of the research. The presented samples are those obtained using the lowest and the highest speed rate (0.16–0.83 mL/s) that was possible to produce at each drying temperature. L, M, H signifies the low, medium or high level of drying air humidity; 80, 100, 120 signifies the inlet air temperature; 0.16, 0.58, 0.67, 0.83 signifies the feed rate.
Applsci 15 05761 g003
Figure 4. (A) moisture content (MC); (B) water activity (aw) of MD powders spray dried at different inlet air temperature (80–120 °C), inlet air humidity (0.1–10 g/m3), and feed rate (0.16–0.83 mL/s) (Stage II); blue areas on the figure indicate the experiments, where not-evaporated water was observed inside the drying chamber. The gradient of blue, orange and red color indicate the increasing inlet air temperature, while blue color demonstrates the lowest level, orange the middle level and red the highest level of inlet air humidity.
Applsci 15 05761 g004
Figure 5. (A) loose bulk density (dL); (B) tapped bulk density (dT) of MD powders spray dried at different inlet air temperature (80–120 °C), inlet air humidity (0.1–10 g/m3) and feed rate (0.16–0.83 mL/s) (Stage II); blue areas on the figure indicate the experiments, where not-evaporated water was observed inside the drying chamber. The gradient of blue, orange and red color indicate the increasing inlet air temperature, while blue color demonstrates the lowest level, orange the middle level and red the highest level of inlet air humidity.
Applsci 15 05761 g005
Figure 6. Flowability (HR) of MD powders spray dried at different inlet air temperature (80–120 °C), inlet air humidity (0.1–10 g/m3) and feed rate (0.16–0.83 mL/s) (Stage II); blue areas on the figure indicate the experiments where not-evaporated water was observed inside the drying chamber. The gradient of blue, orange and red color indicate the increasing inlet air temperature, while blue color demonstrates the lowest level, orange the middle level and red the highest level of inlet air humidity.
Applsci 15 05761 g006
Figure 7. Powder recovery (Rp) response surface plots for paired factors: (A) inlet air temperature (IAT) and inlet air humidity (IAH); (B) inlet air temperature and feed solution concentration (FC); (C) feed solution concentration (FC), and inlet air humidity (IAH), when the third factor was adjusted to its midpoint.
Applsci 15 05761 g007
Figure 8. Moisture content (MC) response surface plots for paired factors: (A) inlet air temperature (IAT) and inlet air humidity (IAH); (B) inlet air temperature and feed solution concentration (FC); (C) feed solution concentration (FC) and inlet air humidity (IAH), when the third factor was adjusted to its midpoint.
Applsci 15 05761 g008
Figure 9. Water activity (aw) response surface plots for paired factors: (A) inlet air temperature—IAT and inlet air humidity (IAH); (B) inlet air temperature and feed solution concentration (FC); (C) feed solution concentration (FC) and inlet air humidity (IAH) when the third factor was adjusted to its midpoint.
Applsci 15 05761 g009
Figure 10. Loose bulk density (dL) response surface plots for paired factors: (A) inlet air temperature (IAT) and inlet air humidity (IAH); (B) inlet air temperature and feed solution concentration (FC); (C) feed solution concentration (FC), and inlet air humidity (IAH) when the third factor was adjusted to its midpoint.
Applsci 15 05761 g010
Figure 11. Loose bulk density (dT) response surface plots for paired factors: (A) inlet air temperature (IAT) and inlet air humidity (IAH); (B) inlet air temperature and feed solution concentration (FC); (C) feed solution concentration (FC) and inlet air humidity (IAH), when the third factor was adjusted to its midpoint.
Applsci 15 05761 g011
Figure 12. Flowability (HR) response surface plots for paired factors: (A) inlet air temperature (IAT) and inlet air humidity (IAH); (B) inlet air temperature and feed solution concentration (FC); (C) feed solution concentration (FC) and inlet air humidity (IAH), when the third factor was adjusted to its midpoint.
Applsci 15 05761 g012
Figure 13. Median particle diameter (D50) response surface plots for paired factors: (A) inlet air temperature (IAT) and inlet air humidity (IAH); (B) inlet air temperature and feed solution concentration (FC); (C) feed solution concentration (FC) and inlet air humidity (IAH) when the third factor was adjusted to its midpoint.
Applsci 15 05761 g013
Figure 14. SEM images of model MD powders in Stage III of the research. L, M, H signifies the low, medium or high level of drying air humidity; 80, 100, 120 signifies the drying air temperature; 10, 20, 30 signifies the feed solution concentration.
Applsci 15 05761 g014
Table 1. Experimental plan for spray drying/evaporation of distilled water (Stage I) and spray drying of 30% (solids, w/w) maltodextrin solution (Stage II).
Feed Rate
[mL/s]
Inlet Air Humidity [g/m3]Inlet Air Temperature
[°C]
0.16
0.21
0.38
0.58
0.67
0.83
0.1–0.380
100
120
1.1–1.380
100
120
9–1080
100
120
Table 2. The independent variables and representative coded levels in Stage III.
Independent VariablesSymbolCoded Values
−10+1
Inlet air absolute humidity [g/m3]X10.1–0.31.1–1.39–10
Inlet air temperature [°C]X280100120
Feed solution concentration [%]X3102030
Table 3. The experimental plan—Stage III; the full factorial design (FFD) experiment matrix with randomization and center points.
Random OrderX1X2X3
1000
2−1−1+1
3−1+1+1
4−1−1−1
5−1+1+1
6−1+1−1
7+1+1−1
8+1−1+1
9000
10+1+1−1
11+1−1−1
12−1−1+1
13+1+1+1
14+1+1+1
15−1−1−1
16+1−1+1
17−1+1−1
18+1−1−1
19000
Disclaimer/Publisher’s Note: The statements, opinions and data contained in all publications are solely those of the individual author(s) and contributor(s) and not of MDPI and/or the editor(s). MDPI and/or the editor(s) disclaim responsibility for any injury to people or property resulting from any ideas, methods, instructions or products referred to in the content.