Featured Application
This study presents a novel sensor-based approach to optimize bread drying kinetics by providing precise real-time data on water loss speed and energy efficiency under convective and infrared drying conditions. The findings offer practical applications for the food industry, enabling improved energy efficiency, better product (bread slices) quality, and sensor-driven process control in bakery drying systems.
Abstract
This study explores the combined use of convective and infrared drying (CIRD) for bread slices, utilizing advanced MEMS sensors to monitor temperature, moisture, and drying rates in real time, optimizing efficiency, and energy use. The dehydration kinetics of 1 cm thick bread slices under a controlled CIRD method was used. This analyzes drying rate (water loss speed, WLS) and energy efficiency (EE) using sensor technology. IR drying used 150 W lamps at 7 cm and 15 cm, while convective drying involved 60 °C hot air at 3 m/s. Sensor data aligned with gravimetric measurements. The most energy-efficient model used a 150 W IR lamp at 7 cm (0.645 kWh, 21.572 kWh/kg water removed) but had the longest drying time (220 min at 15 cm). The least efficient model used a 250 W IR lamp at 15 cm (EE = 32.734 kWh/kg). These results of CIRD in bread drying are statistically significant and can be applied to industrial bakery drying processes, helping manufacturers to reduce energy costs, and adopt sensor-driven process control for enhanced sustainability. The CIRD model, which uses a 150 W IR lamp placed 15 cm above the bread slices being dried, represents the most effective optimization strategy.
1. Introduction
Drying is a time-honored food preservation technique that extends the shelf life of perishable products by reducing their moisture content. Among the various drying methods, convective drying is widely utilized due to its simplicity and effectiveness. This method involves the application of heated air to remove moisture from food products, thereby lowering water activity, inhibiting microbial growth, and prolonging shelf life [1,2].
Infrared (IR) drying has gained attention for its efficiency and ability to enhance product quality. IR radiation penetrates food materials, causing water molecules to vibrate and generate heat, which accelerates moisture removal. This method offers rapid heating and can be combined with other drying techniques to improve overall efficiency [3,4]. Combining convective (as the most traditional drying method) and IR drying (as novel and hybrid drying method) methods has been shown to optimize drying processes. For instance, integrating hot air pre-drying with infrared heating can reduce drying time by approximately 20% compared to infrared drying alone. Such combined approaches leverage the advantages of both methods, resulting in improved energy efficiency and product quality [5,6]. Combined IR–convective drying outperforms conventional methods by leveraging rapid internal heating (IR) and efficient moisture removal (convection). Scientific studies confirm its advantages in speed, energy efficiency, and product quality, making it ideal for heat-sensitive materials like food products [7,8]. IR directly heats the material, while airflow aids in the evaporation of water. Therefore, this method accelerates the drying process by 12–30% and reduces energy consumption by 15–20%. Additionally, it enhances quality by minimizing thermal degradation, which helps preserve the nutritional content of food. Combined IR–convective drying is faster because IR accelerates internal heating. It requires lower energy consumption since IR reduces the air-heating load and offers better preservation for food products due to shorter exposure times comparing to the convective drying method. Additionally, IR lowers the effective equilibrium moisture content through surface heating.
Combining methods for drying stale bread aims to save energy and optimize the drying process. For example, in the work of Heirani et al. (2024), a combined convection–microwave dryer showed the best performance in terms of process duration, energy consumption, and the quality of the dried bread [9]. The sensitivity analysis of the innovative ohmic-assisted drying system (OAD), which combines ohmic heating with conventional air drying, was conducted for the first time, focusing on the effects of varying voltage, temperature, and air velocity using potatoes as a raw material. The optimal parameters identified—approximately 60 °C for temperature, 112 V for voltage, and air velocity between 1.07 and 1.98 m/s—not only reduced drying time by 32–38% compared to traditional methods but also preserved the quality of the potato slices, while providing benefits such as partial starch gelatinization and eliminating the blanching step, indicating strong potential for application in the food industry [10,11]. Hybrid drying technologies offer numerous advantages, including improved drying efficiency, energy savings, better moisture removal, enhanced product quality, and increased retention of nutritional and bioactive compounds. To fully leverage these benefits, thorough investigations and optimization of operating conditions are crucial; however, implementing such systems may incur higher capital costs, necessitating comprehensive techno-economic analyses to clarify the relationship between technology and cost performance. Additionally, most hybrid dryers are still at the laboratory scale, making scaling up more complex than traditional methods, which calls for the development of guidelines for transitioning from lab to pilot-scale operations, along with life cycle assessments to evaluate their environmental and economic viability while further exploring the dynamics of transport phenomena and product quality during the hybrid drying process [12,13].
Recent advancements in sensor technology have significantly enhanced the precision of drying process control and monitoring. The integration of sensors into drying systems enables real-time data collection on critical parameters such as temperature, humidity, and moisture content [14,15]. These data facilitate the optimization of drying conditions, ensuring consistent product quality and energy efficiency [16,17]. The MEMS (BME280) sensor is a tool in the food drying industry, where precise control of environmental conditions is vital for product quality. Proper calibration ensures that the data collected are reliable, enhancing the efficiency and effectiveness of drying processes [18,19]. By integrating this sensor into a drying system, manufacturers can improve their product quality and save energy. The BME280 is a compact, low-power, environmental sensor designed for accurate measurement of temperature, humidity, and pressure. It is widely used in applications such as weather monitoring, smart home systems, and agriculture because of its ability to provide precise data on environmental conditions. Its calibration guarantees reliable performance, with temperature, humidity, and pressure readings adjusted against known references to ensure accuracy [20,21].
This study further develops the hybrid dryer design principles established in earlier foundational works by presenting a framework suited for continuous industrial ovens. Recent advances in MEMS sensor technology [22,23], such as the BME-280’s capability to measure absolute air moisture content with a systematic error reduced to 0.09 mg/kg after calibration, now allow precise tracking of moisture loss and temperature gradients during bread drying. This alleviates the temporal resolution limitations of prior studies, which relied on post-drying quality assessments. For instance, Lukyanov et al. (2023) demonstrated that integrating MEMS sensors into convective dehydrators enables PID-controlled temperature stability (±0.5 °C) and real-time energy efficiency optimization [24]. When applied to CIRD, such sensors provide continuous data on crust-to-crumb moisture migration, directly informing process adjustments to prevent over-drying or structural collapse—key issues in baked goods. By bridging the divide between agricultural hybrid drying models and baked goods’ unique material properties, this sensor-enhanced CIRD framework advances the UN’s 2030 food waste targets through scalable, data-driven drying optimization [25].
This study investigates the effects of combining convective and infrared drying on bread slices, employing advanced sensor technology to monitor and optimize the drying process. By employing advanced sensor technology, the study aims to monitor critical parameters such as temperature, moisture content, and drying rate in real time (without altering or interfering with the sample undergoing the drying process). This approach seeks to optimize the drying process for improved efficiency, uniformity, and food product quality while minimizing energy consumption and potential quality degradation.
2. Materials and Methods
The convective and infrared drying (CIRD) of three 1 cm thick bread slices was conducted in a laboratory-scale drying chamber (Colossus CSS 5330 250W, Shenzhen, China, Figure 1) equipped with advanced sensor technology (MEMS sensors) [26]. Four fundamental bread drying models were examined: A utilized a 150 W IR lamp positioned 7 cm above the bread, B employed a 250 W IR lamp at the same height, C featured a 250 W IR lamp placed 15 cm above the bread, and D used a 150 W IR lamp at a height of 15 cm. The chamber maintained a stable temperature (60 °C), as depicted in Figure 2, with an air velocity of 3 m/s under atmospheric pressure. The moisture content of the bread slice samples was continuously monitored throughout the drying process. White bread was chosen as the subject to clearly observe any changes resulting from IR drying, as convective drying at 60 °C did not produce such alterations. The laboratory drying oven has a chamber volume of 20 L. It takes approximately 6 s to fill the chamber with air, which flows at a speed of 3 m/s through an opening located at the base of the chamber (beneath the tray where the bread is dried). The area of this opening is 0.0011 m2. To minimize potential heat losses, the air velocity was measured and found to remain constant at different key points: the entrance to the insulated chamber, above the tray where the bread was dried, and at the chamber’s exit. This chamber calibration and heat distribution in CIRD involve ensuring uniform airflow and temperature across the chamber to optimize drying efficiency and product quality. Calibration also includes temperature, pressure, and humidity at multiple points within the chamber using precise MEMS sensors.
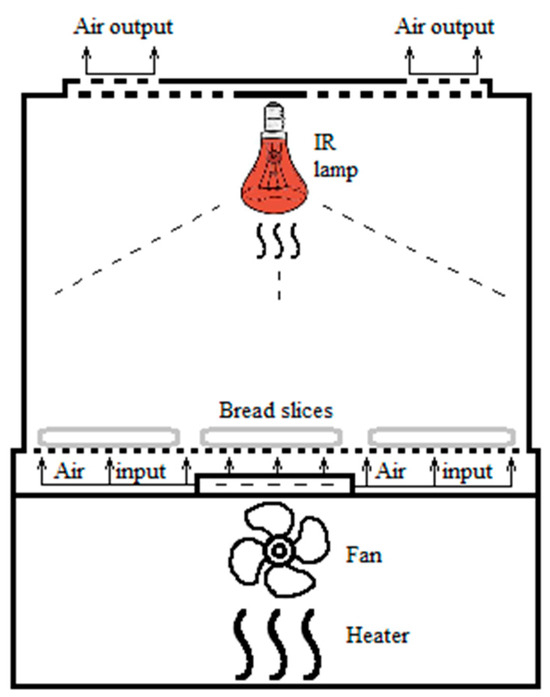
Figure 1.
Laboratory-scale experimental drying chamber.
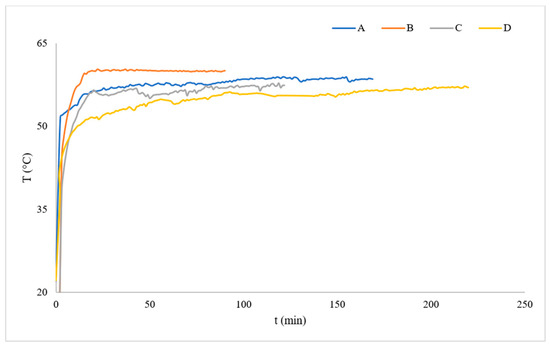
Figure 2.
The temperature range during drying analyzed from the standpoint of the drying air dynamics.
The bread was dried in a single layer to ensure efficient moisture migration from its inner parts. No crust formed on the surface of the bread slices, and the uniform thickness of 1 cm in the dried pieces confirmed an optimal drying setup. These results align with findings from previous literature.
To monitor the dehydration process, a Telegram bot was used to display the dataset in the Telegram mobile or desktop application (Figure 3). This interface enabled users to input commands for adjusting and controlling dehydration parameters. Each data string contained the following information in the sequence, obtained from 2 sensors located at the entrance and exit of the chamber: elapsed time since system activation (s), air temperature after the heater (DS18B20, Shenzhen Jin Maoyuan Weiye Technology Co., Ltd., Shenzhen, China, °C), input air temperature (°C), relative humidity, and pressure (BME280-1, Bosch Sensortec GmbH, Reutlingen, Germany, Pa), output air parameters (BME280-2, Bosch Sensortec GmbH, Reutlingen, Germany), reserved space for an additional sensor (BME280-3, Bosch Sensortec GmbH, Reutlingen, Germany), differential air moisture values between sensors, water loss rate (WLS, g/s or g/min), cumulative energy consumption (W), and average heater duty cycle (in ms).
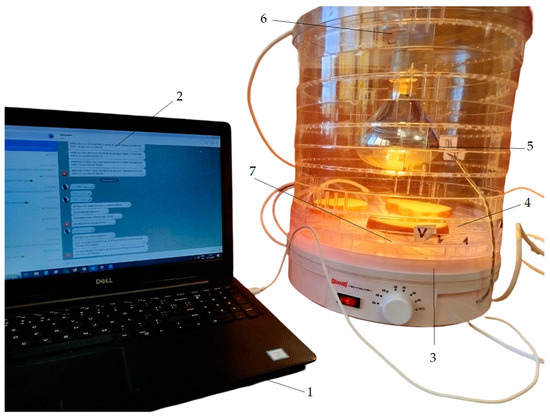
Figure 3.
Integration of the Telegram application with the laboratory drying chamber. (1—Laptop, 2—Telegram application bot, 3—Laboratory-scale experimental drying chamber, 4—Layer with the bread slices, 5—IR lamp, 6—Air outlet, 7—Air inlet).
For mutual calibration, we leveraged the fact that the absolute moisture content of water in the air remains invariant unless there are additional streams of incoming or lost moisture. Therefore, when an empty dryer is activated, regardless of the temperature and relative humidity in the room, the differential moisture loss should be close to zero. By incrementally increasing the temperature in the dryer, we create correction curves along the humidity and pressure channels based on temperature. The parameters of these curves are incorporated into the program of the dehydrator control system as regression coefficients, and the correction of the acquired data occurs immediately after each measurement.
The second stage involves calibrating the system for the rate of moisture loss and the total mass of lost water. The determination of correction coefficients for moisture loss was performed using a model product of cotton cosmetic discs (sponges). This material is easy to handle, affordable, and stable in its properties.
To calibrate the measuring system based on absolute moisture loss, a set of cotton discs was moistened, weighed, and placed in a dehydrator. During the drying period, approximately every 30 min, one pre-labeled sponge was removed and weighed. After drying, the dried sponges were also weighed. The data obtained (the difference in the masses of wet and dry sponges) enabled us to calculate the correction factor for the moisture loss curve.
3. Results
3.1. Sensor Systems and Data Collection
The sensors were integrated into a data acquisition system (Figure 4) based on the IoT microcontroller ESP32 WROOM 32 (Espressif Systems, Shenzhen, China), which recorded measurements every minute and transmitted the data via Wi-Fi to Telegram cloud storage. This technology enabled continuous monitoring and precise control of the drying conditions, optimizing both energy efficiency and product quality. A digital PID controller, implemented as a subroutine within the microcontroller program, regulated the hot air temperature.
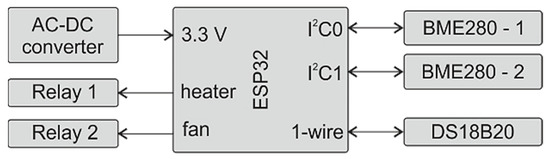
Figure 4.
Data acquisition system architecture.
The digital thermometer DS18B20 was used to monitor the hot air temperature. Relay 1 controlled the heater, while Relay 2 managed the fan, which operated in a simple on/off mode. To maintain a stable hot air temperature, the heater’s solid-state relay functioned in a quasi-PWM mode with a one-second control period, which was sufficient due to the high thermal inertia of the heating element.
3.2. The Telegram Bot and Kinetics Calculation
The Telegram bot is based on Alex Gyver’s Telegram bot library “FastBot” [27,28]. Differential air moisture was determined by calculating the difference between the output air moisture (dout) and the input air moisture (dinp) in equation:
d = dout − dinp
Air moisture is determined using the air moisture equation [29]:
where H represents relative humidity, Ps denotes partial vapor pressure, and Patm is the atmospheric pressure.
The partial vapor pressure Ps is determined using the Arden Buck equation [30,31]:
By calculating differential air moisture as the difference between output air moisture, we effectively eliminate the influence of external air humidity variations on moisture loss measurements. This approach ensures that any changes in outside air humidity do not affect the accuracy of our moisture loss data, leading to more reliable and consistent results.
A key challenge in analyzing moisture loss in convective dehydrators is accurately determining the actual moisture loss during the measurement process. Typically, cumulative moisture loss is computed using the following formula:
where Fair(t) represents the airflow through the dehydrator. The airflow can be expressed as
where Vair(t) is the measured air velocity and S is the cross-sectional area at the velocity measurement point. It is important to note that this velocity differs from the speed at which hot air flows over the dehydrated samples. If we assume a constant airflow rate through the laboratory dehydrator, then Equation (4), considering Equation (5), can be rewritten as
Fair(t) = S · Vair(t)
The assumption of a constant airflow rate is only partially valid due to the interaction between the dehydrated bread samples and the air. As moisture is removed, the flow area increases, reducing air resistance and potentially leading to a higher airflow rate by the end of the drying process. However, since the drying chamber trays are loosely filled with bread slices, this increase is considered negligible in this experiment.
The total water loss of the dehydrated product can be determined by subtracting its final mass from the initial mass. If m0 represents the mass of moisture (water) and me denotes the mass of dry matter, the removed water mass Δm is given by
Δm = m0 − me
The total water loss at time T can be expressed as [32]
Equations (8) and (9) can be reformulated as
In Equation (9), the values for S · Vair are not precisely defined. This implies that the integral curve of W(t) must be calibrated, starting from zero at the beginning of the process and reaching the final value Δm at the end of dehydration:
In the next step, the is differentiated to obtain a corrected sequence of instantaneous water loss throughout the dehydration process:
Equation (12) represents the final formula for correcting the measured data.

Table 1.
Mass balance during CID drying of bread slices.
Table 2.
Time duration and the energy efficiency during CID drying of bread slices.
The rate of water loss during drying analyzed from the standpoint of the drying air dynamics is shown on Figure 5. Figure 6 illustrates the most invasive CID method, where “burnt” areas can be observed on the dried bread slices as a result of the high intensity of the IR lamp.
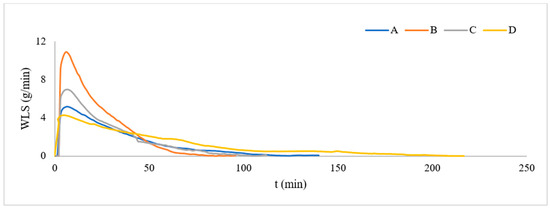
Figure 5.
WLS as a function of dehydration time in CIRD.
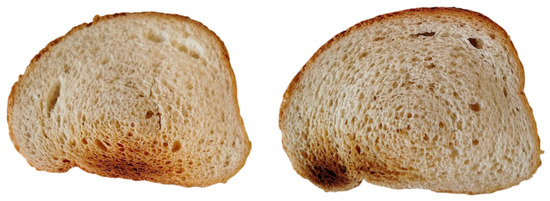
Figure 6.
Appearance of bread dried using method B.
3.3. Statistical Parameters for Evaluating the Kinetics of CIRD Using Sensor Technology
To illustrate the statistical relationships among the variables and their outcomes (drying time, weight loss, energy consumption, and water loss rate), a color-coded correlation diagram (Figure 7) was developed. This visualization employs varying circle sizes and a dual-color scheme—blue indicating positive associations and red denoting negative ones—to effectively convey the intensity and nature of the interconnections between the examined factors.
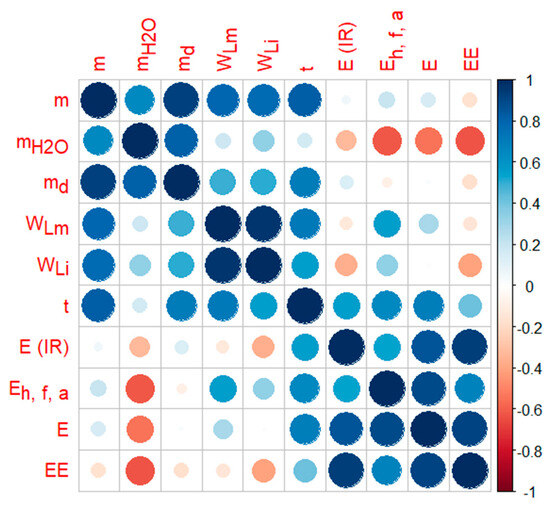
Figure 7.
A color correlation diagram illustrating the relationship between the independent variable parameters and the responses in CIRD.
The drying method (CID) and its parameters, including IR lamp power and position, were considered independent variables. PCA was utilized to examine the correlation structure between these parameters and the dependent variables, namely drying time, weight loss, energy consumption, and water loss speed (Figure 8).
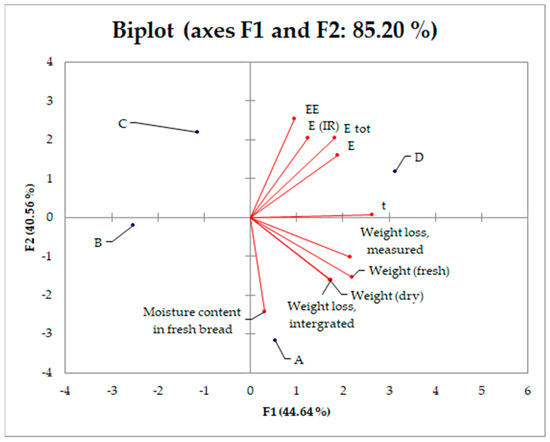
Figure 8.
PCA of independent variables and responses during the CIRD drying of bread slices.
4. Discussion
The experimental results show that the drying efficiency and WL of bread slices varied statistically significantly across the four methods (A, B, C, and D). Method C achieved the lowest WL (25.0 ± 0.1 g) while method D achieved the highest WL (29.8 ± 0.1 g, Table 1). This aligns with findings in the literature where higher IR power and shorter distances enhance drying rates due to increased energy transfer and surface temperature [33,34], but we must also include the differences in the initial masses of bread slices for drying. The measured and integrated weight loss followed similar trends, with method B showing the smallest differences (WLm = 28.0 ± 0.1 g, WLi = 27.8 ± 0.1 g). This suggests greater consistency and uniformity in drying performance under higher IR power at a closer distance. These results are consistent with studies on hybrid infrared–convective drying systems, where synergistic effects of IR radiation and convective air enhance moisture diffusion and evaporation rates [35,36]. The experimental results are supported by prior research showing that increased radiation intensity or reduced emitter–sample distance accelerates drying by raising surface temperatures and enhancing moisture migration [2,37,38]. Similar to results for apple slices, dried under combined IR–hot air conditions, higher IR intensity significantly reduced drying time and improved efficiency (Table 2). The rapid diffusion of moisture under high-intensity IR radiation is a shared characteristic. The synergistic effect of combining IR with convection has been shown to reduce energy consumption while maintaining product quality. This is particularly evident in method B’s superior performance at lower total weights.
The results of this study reveal significant differences in drying time and energy consumption across the four experimental methods (A, B, C, and D). Method B achieved the shortest drying time 90 min) and relatively low total energy consumption (E = 0.655 ± 0.026 kWh), demonstrating the most efficient drying performance. This aligns with findings in previous studies on combined infrared–convective drying systems, where higher IR power and shorter emitter–sample distances accelerate moisture removal due to rapid surface heating and enhanced mass transfer [30,39]. Conversely, method D required the longest drying time (220 ± 7 min) and consumed the highest total energy (0.976 ± 0.018 kWh). The increased distance and lower IR power likely reduced the intensity of radiation reaching the bread surface, resulting in slower moisture diffusion. Similar observations have been reported in previous research, where lower IR intensity or greater emitter–sample distances led to prolonged drying times [30,40]. Energy efficiency varied significantly among the methods, with method B showing the highest efficiency (23.393 ± 0.171 kWh/kg) and method C showing the lowest (32.734 ± 1.627 kWh/kg). The high energy efficiency of method B can be attributed to its optimal combination of high IR power and short distance, which maximized energy utilization for moisture removal. Previous studies on hybrid infrared–convective systems have similarly demonstrated that combining high-intensity IR radiation with convective air enhances energy efficiency by reducing heat losses [33,35]. In contrast, method C’s low indicates inefficiencies associated with increased emitter_sample distance despite using a high-power IR lamp (250 W). This finding is consistent with the literature emphasizing that closer emitter placement improves energy efficiency by concentrating thermal energy on the material surface [35,41]. Studies on apple slices and vegetables have shown that hybrid IR–convective systems reduce drying time by up to 57% compared to convective-only methods while maintaining high product quality [42]. Similarly, in bread baking processes, hybrid heating modes have been shown to reduce process times by up to 28% compared to conventional methods while improving product characteristics such as volume and texture [39]. The IR drying system not only reduced drying time by up to 69% but also lowered the system’s energy consumption by 43.2%. This reduction in drying time is attributed to the synergistic effect of IR heating, which accelerates heat and mass transfer, leading to faster evaporation of water from the material [43].
The bread slices exhibited drying kinetics marked by an initial rapid moisture loss, which transitioned into a slower drying phase controlled by diffusion (Figure 5). Sensor data showed a sharp decrease in moisture content over the first 50 min of drying, which correlated with the removal of free water from the surface of the bread slices. Following the initial phase, the moisture loss rate decreased as the drying process transitioned to being controlled by the diffusion of water from the bread’s interior to its surface. Sensors recorded the maximum WLS values over 5 min of CIRD (WLSA = 5.15 g/min, WLSB = 10.91 g/min, WLSC = 6.95 g/min and WLSD = 4.30 g/min).
Towards the end of the observed period (around 100 min onwards), the WLS curves tend to flatten out, suggesting that the rate of water loss slows down significantly and approaches a steady state. Model D maintains a slightly higher WLS than the others during this phase. Samples A and C exhibit similar behavior, showing a moderate initial WLS followed by a comparable reduction in water loss over time. The observed trends in WLS are consistent with the general principles of drying processes.
In Model B (Figure 6), both Maillard and caramelization reactions occurred. Ramiréz-Jimenéz et al. observed similar browning indicators during the toasting of 10 mm thick, 25 g slices of bread [44]. At the peak of WLS, marking the onset of drying and maximum water evaporation, Maillard reactions predominantly contributed to the formation of “burnt” areas on the bread. In the study by Aktaş et al. (2016), it was also noted that the color saturation of bread slices increased with rising temperature, and that IR drying resulted in more intense color reactions [43]. Figure 2 supports this claim, showing the highest average drying temperatures that the bread slices are subjected to. The color pigments formed on the surface area generally agree with the fact that the browning precursors experience caramelization and Maillard reactions which are highly influenced by the quality and quantity of the precursors, thermal processing parameters, pH, and quantitative ratio of amino nitrogen to reducing sugar during baking [45]. Bread is a raw material abundant in amino acids and reducing sugars, primarily glucose, which are formed through the breakdown of proteins and starch. The interactions between these components, combined with the reduction of water activity and the rise in the bread’s surface temperature above 100 °C, create favorable conditions for the formation of melanoidins—the characteristic products of the Maillard reaction [46,47].
The color correlation matrix visually represents the relationships between various independent parameters and response variables in the CIRD (Figure 7). The color intensity and size of the circles indicate the strength and direction of the correlations, where darker blue signifies strong positive correlations and darker red indicates strong negative correlations [48,49]. Water loss parameters (WLm, WLi) exhibit strong positive correlations among themselves and with drying time (t), indicating that higher drying times result in greater water loss, consistent with established drying kinetics. The drying time (t) also shows a strong positive correlation with mass-related parameters, which aligns with drying principles where prolonged exposure to heat and air movement leads to more moisture removal. The energy efficiency parameter (EE) and other energy-related factors exhibit a negative correlation with moisture-related parameters. As drying removes more moisture, energy efficiency tends to decrease because it becomes harder to remove the remaining water. In the research of Musielak et al., and Abbaspour-Gilandeh et al., the strong correlation between water loss and drying time supports these findings [50,51]. The negative correlation between energy efficiency and moisture parameters aligns with findings from Chua [52], which state that energy efficiency decreases as drying progresses due to the reduced moisture diffusion rate in the later drying stages. Research by Süfer et al. [53] highlights that IR energy input shows variable effects on drying kinetics depending on material properties and initial moisture content. The relatively weak correlation of E(IR) with mass retention in this dataset aligns with this observation.
The biplot (Figure 8, axes F1 and F2: 85.20%) shows the relationships between variables and models (different drying conditions) in a two-dimensional space defined by the first two principal components (PCs) [54]. The first two PCs explain 85.20% of the total variance in the data, indicating that the biplot provides a good representation of the overall data structure. F1 captures the variation related to drying progress. Variables such as WLm, m and md have strong positive loadings on F1. F2 captures the variation related to energy input and efficiency. EE, E(IR), and E have strong positive loadings on F2. Model D is associated with high weight loss and intermediate values of E(IR), E and EE, model C is associated with higher E(IR), E and EE but lower drying, model B is associated with higher mH20 and model A is associated with higher WLI. The analysis highlights a critical trade-off between energy consumption and drying efficiency, with Model D offering the most promising optimization pathway. Key implications include adjusting energy inputs (e.g., reducing energy in model C), improving moisture removal because of Maillard reactions (model B), and leveraging model A’s initial drying rate in multi-stage processes.
The high level of correlation between measured and integrated values is consistent with the research of Heirani et al. [9]. It has been demonstrated that combined drying methods are significantly more efficient and productive compared to individual methods.
The rationale for selecting specific infrared (IR) power levels and distances of IR lamps above the drying material in combined convective and IR drying methods lies in optimizing drying efficiency, energy use, and product quality. Higher IR power levels are often chosen to accelerate drying rates by providing sufficient radiant energy for rapid moisture removal, while lower power levels may be used to minimize energy consumption and prevent overheating of the material. The distance between the IR lamp and the drying material is critical for controlling heat intensity; shorter distances enhance energy transfer efficiency but may risk uneven heating or surface degradation, whereas longer distances reduce heat intensity and allow for gentler drying, especially for heat-sensitive products. These parameters are tailored based on factors such as slice thickness, material type, desired drying time, and others. This study has shown that optimal combinations of IR power and lamp distance can significantly reduce drying time, improve energy efficiency, and preserve product quality, making these variables essential for process optimization.
The study’s scope was limited to bread slices under specific conditions of power and distance. Additional variables such as airflow rate or ambient temperature could further influence outcomes. Moreover, extending the analysis to other food materials would validate the broader applicability of these findings. For instance, more in-depth research could be conducted using a multi-layered model for drying bread slices, by varying the thickness of the slices, hot air speed, and IR power. This would incorporate a quantitative analysis of the bread, focusing on rehydration capacity, sensory evaluation, and water activity in the dried samples as well. Such efforts could help overcome limitations and provide a solid foundation for adapting the process for industrial drying.
5. Conclusions
The integration of convective and infrared drying methods (CIRD), coupled with advanced sensor technologies, offers a promising approach for optimizing food drying processes. These innovations not only enhance drying efficiency but also ensure superior product quality, aligning with the evolving demands of the food processing industry.
CIRD model (250 W, 7 cm) achieved the most efficient drying of bread slices with the shortest drying time, highest energy efficiency, the highest initial water loss rate and the occurrence of Maillard and caramelization reactions. CIRD model (250 W, 15 cm) associated with high energy consumption but lower drying. The model that consumed the least energy per unit of water removed used a lower-powered IR lamp (150 W) placed further away from the sample (15 cm) but required the longest drying time. CIRD model (150 W, 15 cm) offers the most promising optimization pathway.
The study’s limitations include its focus on bread slices, which may limit generalizability to other foods with varying moisture contents or structures; its reliance on controlled laboratory conditions that may not reflect industrial-scale processes; and its lack of consideration for IR lamp performance variations over time or ambient condition impacts. Additionally, the lack of a quantitative evaluation of dried bread quality, multilayer drying, the sample size and thickness of the bread samples, and the feasibility of drying and processing stale bread underscores potential directions for future research to address these limitations of hybrid CIRD. Future research should explore scaling CIRD models for industrial use, including airflow rate or ambient temperature, energy cost and process integration analyses, test CIRD’s effectiveness on diverse food products to confirm its versatility, develop advanced sensors for real-time drying parameter monitoring, assess long-term IR lamp performance and maintenance in industrial settings and investigate multi-stage drying processes.
Author Contributions
Conceptualization, N.M., A.L. and M.P.; methodology, A.L. and M.P.; software, A.L.; validation, N.M. and I.Đ.; formal analysis, I.Đ. and M.P.; investigation, A.L. and M.P.; resources, N.M. and M.P.; data curation, A.L. and M.P.; writing—original draft preparation, M.P.; writing—review and editing, A.L., N.M. and I.Đ.; visualization, M.P.; supervision, N.M., A.L. and I.Đ.; project administration, N.M., A.L., I.Đ. and M.P.; funding acquisition, N.M. and M.P. All authors have read and agreed to the published version of the manuscript.
Funding
This research was funded by the Ministry of Science, Technological Development, and Innovation of the Republic of Serbia, grant number 451-03-136/2025-03/200088.
Institutional Review Board Statement
Not applicable.
Informed Consent Statement
Not applicable.
Data Availability Statement
The study includes the original contributions presented, and any further inquiries can be addressed to the corresponding author.
Conflicts of Interest
The authors declare no conflicts of interest.
Abbreviations
The following abbreviations are used in this manuscript:
| CIRD | Convective and infra-red drying |
| IR | Infra-red drying |
| WL | Weight loss, (g) |
| WLm | Weight loss (measured), (g) |
| WLi | Weight loss (integrated), (g) |
| WLS | Water Loss Speed, (g/min) |
| t | Dehydration time, (min) |
| m | Weight of fresh bread slices, (g) |
| md | Content of dry matter in fresh bread slices, (g) |
| mH2O | Moisture content in fresh bread slices, (g) |
| E (IR) | Energy consumption of Infra-Red lamp, (kWh) |
| Eh, f, a | Energy consumption of heater, fan and arduino, (kWh) |
| EE | Energy efficiency, (kWh/kg removed water) |
References
- Li, J.; Li, Z.; Wang, N.; Raghavan, G.S.V.; Pei, Y.; Song, C.; Zhu, G. Novel Sensing Technologies During the Food Drying Pro-cess. Food Eng. Rev. 2020, 12, 121–148. [Google Scholar] [CrossRef]
- Radojčin, M.; Pavkov, I.; Bursać Kovačević, D.; Putnik, P.; Wiktor, A.; Stamenković, Z.; Kešelj, K.; Gere, A. Effect of Selected Drying Methods and Emerging Drying Intensification Technologies on the Quality of Dried Fruit: A Review. Processes 2021, 9, 132. [Google Scholar] [CrossRef]
- Sakare, P.; Prasad, N.; Thombare, N.; Singh, R.; Sharma, S.C. Infrared Drying of Food Materials: Recent Advances. Food Eng. Rev. 2020, 12, 381–398. [Google Scholar] [CrossRef]
- Obajemihi, O.I.; Cheng, J.H.; Sun, D.W. Novel sequential and simultaneous infrared-accelerated drying technologies for the food industry: Principles, applications and challenges. Crit. Rev. Food Sci. Nutr. 2023, 63, 1465–1482. [Google Scholar] [CrossRef]
- Adonis, M.; Khan, M.T.E. Combined convective and infrared drying model for food applications. IEEE Africon 2004, 2, 1049–1052. [Google Scholar]
- Guiné, R. The drying of foods and its effect on the physical-chemical, sensorial and nutritional properties. Int. J. Food Eng. 2018, 2, 93–100. [Google Scholar] [CrossRef]
- Lobachevsky, Y.P.; Pavlov, S.A. Infrared Drying of Seeds in a Fluidized Bed. Dir. Open Access J. 2018, 12, 39–43. [Google Scholar] [CrossRef]
- Zhang, J.; Zheng, X.; Xiao, H.; Li, Y.; Yang, T. Effect of Combined Infrared Hot Air Drying on Yam Slices: Drying Kinetics, Energy Consumption, Microstructure, and Nutrient Composition. Foods 2023, 12, 3048. [Google Scholar] [CrossRef]
- Heirani, S.; Movagharnejad, K.; Nanvakenari, S. Optimization and modeling of stale bread drying using three different dryers. Innov. Food Technol. 2024, 12, 17–33. [Google Scholar]
- Turgut, S.S.; Karacabey, E.; Küçüköner, E. A Novel System—The Simultaneous Use of Ohmic Heating with Convective Drying: Sensitivity Analysis of Product Quality Against Process Variables. Food Bioprocess Technol. 2022, 15, 440–458. [Google Scholar] [CrossRef]
- Panirani, P.N.; Darvishi, H.; Hosainpour, A.; Behroozi-Khazaei, N. Comparative study of different bread baking methods: Combined ohmic–infrared, ohmic–conventional, infrared–conventional, infrared, and conventional heating. Innov. Food Sci. Emerg. Technol. 2023, 86, 103349. [Google Scholar] [CrossRef]
- Hii, C.L.; Ong, S.P.; Yap, J.Y.; Putranto, A.; Mangindaan, D. Hybrid drying of food and bioproducts: A review. Dry. Technol. 2021, 39, 1554–1576. [Google Scholar] [CrossRef]
- Ouyang, N.; Ma, H.; Liu, D.; Guo, L.; Guo, Y.; Wang, Y. Improvement and Development of Physical Field Drying Technology: Principles, Models, Optimizations and Hybrids. Food Eng. Rev. 2025. [Google Scholar] [CrossRef]
- Adeyeye, S.A.O.; Ashaolu, T.J.; Babu, A.S. Food drying: A review. Agric. Rev. 2002, 46, 86–93. [Google Scholar] [CrossRef]
- Pateiro, M.; Vargas-Ramella, M.; Franco, D.; da Cruz, A.G.; Zengin, G.; Kumar, M.; Dhama, K.; Lorenzo, J.M. The role of emerging technologies in the dehydration of berries: Quality, bioactive compounds, and shelf life. Food Chem. 2022, 16, 100465. [Google Scholar] [CrossRef] [PubMed]
- Ingeaua, M.; Prisecaru, T.; Pirna, I.; Sorică, C. Analysis of a convective drying process of plums. INMATEH Agric. Eng. 2015, 46, 2068–2239. [Google Scholar]
- da Silva Ferreira, M.V.; Ahmed, M.W.; Oliveira, M.; Sarang, S.; Ramsay, S.; Liu, X.; Malvandi, A.; Lee, Y.; Kamruzzaman, M. AI-Enabled Optical Sensing for Smart and Precision Food Drying: Techniques, Applications and Future Directions. Food Eng. Rev. 2024, 17, 75–103. [Google Scholar] [CrossRef]
- Chattopadhyay, A.; Huertas, A.; Rebeiro-Hargrave, A.; Fung, P.L.; Varjonen, S.; Hieta, T. Low-Cost Formaldehyde Sensor Evaluation and Calibration in a Controlled Environment. IEEE Sens. J. 2022, 22, 11791–11802. [Google Scholar] [CrossRef]
- Kojima, M. Characteristics evaluation of MEMS atmospheric pressure sensors. Meas. Sens. 2024, 101679. [Google Scholar] [CrossRef]
- Bolanakis, D.E. MEMS barometers in a wireless sensor network for position location applications. In Proceedings of the 2016 IEEE Virtual Conference on Applications of Commercial Sensors (VCACS), Piscataway, NJ, USA, 15 June 2016–15 January 2017; IEEE: Piscataway, NJ, USA; pp. 1–8. [Google Scholar]
- Bolanakis, D.E. Evaluating performance of MEMS barometric sensors in differential altimetry systems. IEEE Aerosp. Electron. Syst. Mag. 2017, 32, 34–39. [Google Scholar] [CrossRef]
- Alcesilas, R.; Bastien, J.C.; Sansa, M.; Jouvaud, C.; Rey, P.; Delaveaud, C. Co-Design and Characterization of a Differential Wireless Passive Micro-Electromechanical System Pressure Sensor. Proceedings 2024, 97, 24. [Google Scholar] [CrossRef]
- Emperhoff, S.; Eberl, M.; Dwertmann, T.; Wöllenstein, J. Humidity Impact on Thermal Conductivity Sensors. Proceedings 2024, 97, 93. [Google Scholar] [CrossRef]
- Lukyanov, A.D.; Studennikova, S.G.; Alekseenko, L.A.; Bidenko, D.E.; Mladenović, V.; Petković, M.; Mardasova, E.A. Microcontroller control system for a convective dehydrator. SymBioTech 2023, 32, 365–374. [Google Scholar]
- United Nations. Transforming Our World: The 2030 Agenda for Sustainable Development. Available online: https://sdgs.un.org/2030agenda#:~:text=We%20are%20committed%20to%20ending,including%20through%20social%20protection%20systems (accessed on 10 January 2025).
- Bosch Sensortec. BME280 Datasheet Rev. 1.23; Bosch Sensortec: Reutlingen, Germany, 2022; p. 60. [Google Scholar]
- FastBot. Available online: https://www.arduinolibraries.info/libraries/fast-bot (accessed on 14 January 2025).
- FastBot. Available online: https://github.com/GyverLibs/FastBot/blob/main/library.properties (accessed on 14 January 2025).
- Kowalska, M.; Janas, S.; Woźniak, M. Innovative application of the moisture analyzer for determination of dry mass content of processed cheese. Heat Mass Transf. 2018, 54, 3071–3080. [Google Scholar] [CrossRef]
- Buck, A.L. New equations for computing vapor pressure enhancement factor. J. Appl. Meteorol. 1981, 20, 1527–1532. [Google Scholar] [CrossRef]
- Kaplya, V.I.; Kaplya, E.V.; Silaev, A.A. Identification of the Transient Response of a Capacitive Relative Humidity Sensor. Meas. Tech. 2020, 62, 1099–1105. [Google Scholar] [CrossRef]
- Swamee, P.K.; Mishra, G.C.; Chahar, B.R. Design of minimum water-loss canal sections. J. Hydraul. Res. 2002, 40, 215–220. [Google Scholar] [CrossRef]
- El-Mesery, H.S.; Abomohra, A.E.F.; Kang, C.U.; Cheon, J.K.; Basak, B.; Jeon, B.H. Evaluation of infrared radiation combined with hot air convection for energy-efficient drying of biomass. Energies 2019, 12, 2818. [Google Scholar] [CrossRef]
- Delfiya, D.S.A.; Prashob, K.; Murali, S.; Alfiya, P.V.; Samuel, M.P.; Pandiselvam, R. Drying kinetics of food materials in infrared radiation drying: A review. J. Food Process Eng. 2021, 45, e13810. [Google Scholar] [CrossRef]
- El-Mesery, H.S.; Mwithiga, G. Performance of a convective, infrared and combined infrared- convective heated conveyor-belt dryer. J. Food Sci. Technol. 2015, 52, 2721–2730. [Google Scholar] [CrossRef]
- Taghinezhad, E.; Szumny, A.; Kaveh, M.; Rasooli Sharabiani, V.; Kumar, A.; Shimizu, N. Parboiled Paddy Drying with Different Dryers: Thermodynamic and Quality Properties, Mathematical Modeling Using ANNs Assessment. Foods 2020, 9, 86. [Google Scholar] [CrossRef] [PubMed]
- Calín-Sánchez, Á.; Lipan, L.; Cano-Lamadrid, M.; Kharaghani, A.; Masztalerz, K.; Carbonell-Barrachina, Á.A.; Figiel, A. Comparison of Traditional and Novel Drying Techniques and Its Effect on Quality of Fruits, Vegetables and Aromatic Herbs. Foods 2020, 9, 1261. [Google Scholar] [CrossRef] [PubMed]
- Abbaspour-Gilandeh, Y.; Kaveh, M.; Fatemi, H.; Khalife, E.; Witrowa-Rajchert, D.; Nowacka, M. Effect of Pretreatments on Convective and Infrared Drying Kinetics, Energy Consumption and Quality of Terebinth. Appl. Sci. 2021, 11, 7672. [Google Scholar] [CrossRef]
- Chhanwal, N.; Ezhilarasi, P.N.; Indrani, D.; Anandharamakrishnan, C. Influence of electrical and hybrid heating on bread quality during baking. J. Food Sci. Technol. 2015, 52, 4467–4474. [Google Scholar] [CrossRef]
- Cherono, K.; Mwithiga, G.; Schmidt, S. Infrared drying as a potential alternative to convective drying for biltong production. Ital. J. Food Saf. 2016, 5, 140–145. [Google Scholar] [CrossRef]
- Jeevarathinam, G.; Pandiselvam, R.; Pandiarajan, T.; Preetha, P.; Krishnakumar, T.; Balakrishnan, M.; Thirupathi, V.; Ganapathy, S.; Amirtham, D. Design, development, and drying kinetics of infrared-assisted hot air dryer for turmeric slices. J. Food Process Eng. 2022, 45, e13876. [Google Scholar] [CrossRef]
- Ghaboos, S.H.H.; Ardabili, S.M.S.; Kashaninejad, M.; Asadi, G.; Aalami, M. Combined infrared-vacuum drying of pumpkin slices. J. Food Sci. Technol. 2016, 53, 2380–2388. [Google Scholar] [CrossRef]
- Aktaş, M.; Şevik, S.; Aktekeli, B. Development of heat pump and infrared-convective dryer and performance analysis for stale bread drying. Energy Convers. Manag. 2016, 113, 82–94. [Google Scholar] [CrossRef]
- Ramírez-Jiménez, A.; García-Villanova, B.; Guerra-Hernández, E. Effect of toasting time on the browning of sliced bread. J. Sci. Food Agric. 2001, 81, 513–518. [Google Scholar] [CrossRef]
- Soleimani Pour-Damanab, A.; Jafary, A.; Rafiee, S. Kinetics of the crust thickness development of bread during baking. Food Sci. Technol. 2012, 51, 3439–3445. [Google Scholar] [CrossRef]
- Purlis, E.; Salvadori, V.O. Modelling the browning of bread during baking. Food Res. Int. 2009, 42, 865–870. [Google Scholar] [CrossRef]
- Giovanelli, G.; Cappa, C. 5-Hydroxymethylfurfural Formation in Bread as a Function of Heat Treatment Intensity: Correlations with Browning Indices. Foods 2021, 10, 417. [Google Scholar] [CrossRef] [PubMed]
- Baranwal, A.; Verma, P.; Agrawal, K. 9 Statistical Strategies for Analyzing the Production of Polyphenol Oxidase. In Polyphenol Oxidases: Function, Wastewater Remediation, and Biosensors; Pradeep, V., Komal, A., Maulin, P.S., Eds.; De Gruyter: Berlin, Germany; Boston, MA, USA, 2024; pp. 223–256. [Google Scholar]
- Jamanca-Gonzales, N.C.; Ocrospoma-Dueñas, R.W.; Eguilas-Caushi, Y.M.; Padilla-Fabian, R.A.; Silva-Paz, R.J. Food grain quality: Analysis of physical, biometric, and colorimetric properties to promote consumption. Heliyon 2024, 10, e29234. [Google Scholar] [CrossRef] [PubMed]
- Musielak, G.; Mierzwa, D.; Pawłowski, A.; Rajewska, K.; Szadzińska, J. Hybrid and Non-stationary Drying—Process Effectiveness and Products Quality. In Practical Aspects of Chemical Engineering; Lecture Notes on Multidisciplinary Industrial Engineering; Ochowiak, M., Woziwodzki, S., Doligalski, M., Mitkowski, P., Eds.; Springer: Cham, Switzerland, 2018; pp. 319–337. [Google Scholar]
- Abbaspour-Gilandeh, Y.; Zadhossein, S.; Kaveh, M.; Szymanek, M.; Hassannejad, S.; Wojciechowska, K. Drying Time, Energy and Exergy Efficiency Prediction of Corn (Zea mays L.) at a Convective-Infrared-Rotary Dryer: Approach by an Artificial Neural Network. Energies 2025, 18, 696. [Google Scholar] [CrossRef]
- Chua, K.J. Applications of Several Hybrid Drying Methods for a Bioproduct: Effects on Drying Kinetics Product Colour. Int. J. Food Eng. 2007, 2, 1085. [Google Scholar] [CrossRef]
- Süfer, Ö.; Çalışkan, K.O.Ç.G.; Öztekin, S.; Özkan Karabacak, A.; Su, D.; Wang, D.; Eroğlu, S.; Durgut Malçok, S.; Hilal Uslu, Ü.; Ada, S.; et al. Evaluation of the Effect of Sustainable Drying Techniques and Intensification Technologies on Color Profile of Dehydrated Fruits and Vegetables. Food Bioprocess. Technol. 2024, 18, 3148–3194. [Google Scholar] [CrossRef]
- Ren, Y.; Linter, B.R.; Linforth, R.; Foster, T.J. A comprehensive investigation of gluten free bread dough rheology, proving and baking performance and bread qualities by response surface design and principal component analysis. Food Funct. 2020, 11, 5333–5345. [Google Scholar] [CrossRef]
Disclaimer/Publisher’s Note: The statements, opinions and data contained in all publications are solely those of the individual author(s) and contributor(s) and not of MDPI and/or the editor(s). MDPI and/or the editor(s) disclaim responsibility for any injury to people or property resulting from any ideas, methods, instructions or products referred to in the content. |
© 2025 by the authors. Licensee MDPI, Basel, Switzerland. This article is an open access article distributed under the terms and conditions of the Creative Commons Attribution (CC BY) license (https://creativecommons.org/licenses/by/4.0/).