Article

Preliminary Prediction of the Increase in Flood Hazard from Wind Surges for the City of Elbląg Due to Climate Change †

by
Michał Szydłowski
1,*,
Abdata Wakjira Galata
2 and
Khansa Gulshad
2
1
Faculty of Civil and Environmental Engineering, Gdańsk University of Technology, 80-233 Gdańsk, Poland
2
Doctoral School, Gdańsk University of Technology, 80-233 Gdańsk, Poland
*
Author to whom correspondence should be addressed.
This article is a revised and expanded version of a paper entitled Szydłowski, M. Wind Surge Modeling in the Vistula Lagoon Using HEC-RAS 2D—Today’s and Tomorrow’s Perspective. In Proceedings of the XLII International School of Hydraulics, Radocza, Poland, 20–23 May 2025.
Appl. Sci. 2025, 15(10), 5654; https://doi.org/10.3390/app15105654
Submission received: 19 March 2025 / Revised: 9 May 2025 / Accepted: 11 May 2025 / Published: 19 May 2025
(This article belongs to the Special Issue City Resilience to Windstorm Hazard)

Abstract

:

Featured Application

The results of this work can be used to assess and manage flood risk in the city of Elbląg and the surrounding polder areas. These actions are necessary to protect the negative effects of storm floods in this region and to adapt the city to ongoing climate change. In order to better assess the state of changes in flood hazard and risk, further research is necessary, especially in the field of forecasting the upcoming changes in wind parameters, which the authors are already working on.

Abstract

This study investigates the potential increase in flood hazard in the city of Elbląg, Poland, due to the climate-induced intensification of wind surges in the Vistula Lagoon. Using the HEC-RAS 2D (version 6.6) model—typically applied to riverine systems but here adapted for wind-driven lagoon dynamics—we simulate both historical and hypothetical storm events to evaluate water level changes under varying wind speeds. Model validation was performed using the January 2019 surge event, demonstrating strong agreement with observed water levels (NSE > 0.93). Subsequent simulations using synthetic wind scenarios show that extreme NE winds of 35 m·s−1 could raise water levels above 3.5 m asl, significantly surpassing warning and alarm thresholds. The results reveal a non-linear response between wind speed and water accumulation, underscoring the elevated hazard for low-lying areas such as Żuławy Elbląskie. The novelty of this study lies in the innovative application of HEC-RAS to a wind-driven lagoon environment and in the generation of synthetic surge scenarios for climate resilience planning. These findings provide critical insight for improving flood risk assessment and infrastructure adaptation in the face of ongoing climate change.

1. Introduction

1.1. Flood Hazard in the City of Elbląg

The city of Elbląg, situated in northeastern Poland, faces significant flood risks due to its complex hydrological setting. The city lies along the Elbląg River, which flows from Druzno Lake to the Vistula Lagoon (Figure 1), creating a unique hydrological system with specific challenges [1,2,3,4]. The primary flood hazards in this region stem from two main sources. First, the phenomenon of ‘backflow’ occurs when strong northeastern winds cause water from the Vistula Lagoon to flow upstream in the Elbląg River [3,5,6]. This process leads to elevated water levels throughout the river’s course and causes water accumulation in Druzno Lake, significantly increasing flood risk for the city. The second risk factor relates to the geographical location within Żuławy Wiślane, a vast delta plain of the Vistula River. The area known as Żuławy Elbląskie (Figure 1) forms part of this region, with substantial portions lying below sea level in depressive areas. Żuławy Elbląskie belongs to the catchment area of the estuary of the right bank of the Nogat and the Elbląg River. The landscape is characterized by extensive polder systems along the western bank of the Elbląg River, bordered by the Elbląg Upland to the east. The flood vulnerability of this region is further complicated by potential storm surges from the Vistula Lagoon [5], the formation of ice phenomena on the surface of the reservoir [7] and also the increasingly frequent heavy rains due to climate change [8]. Additionally, the low-lying polder areas face flood risks from the Nogat and Szkarpawa rivers, making the entire Żuławy Wiślane region particularly susceptible to flooding [9]. This complex interaction of geographical, hydrological, and meteorological factors creates a challenging environment for flood management and risk mitigation [10].
The flood hazard level for the city of Elbląg is assessed based on warning and alarm water levels at two representative gauging stations—Nowakowo, located in the Elbląg Bay of the Vistula Lagoon, and Elbląg on the Elbląg River (Figure 2). According to the Polish Institute of Meteorology and Water Management (IMGW-PIB), these warning and alarm levels are 590 and 630 for Nowakowo, and 590 and 610 for Elbląg, respectively. When converted to elevation ordinates, these correspond to water stages 0.82 and 1.22 m above sea level (m asl) in Nowakowo, and 0.79 and 0.99 m asl in Elbląg. Flood threats in this region, caused by wind surges in the Baltic Sea and the Vistula Lagoon, occur frequently, as evidenced by recorded water levels at the Nowakowo gauging station—approximately 1.0 m asl in 1986 [6], 1.6 m asl in 2019 [11], 1.3 m asl in 2025 and the absolute maximum of nearly 2.0 m asl in 2009.

1.2. Impact of Climate Change on Wind

The world has warmed over the last 50 years, mainly due to anthropogenic activities. The rising temperatures and the associated threats, particularly the frequency and intensity of extreme events, are the most concerning ones [13,14]. Europe has experienced several extreme events since the start of the 21st century, including the floods of 2002, 2013, 2021 and 2024 [15].
Among these extreme events, extreme winds caused one of the largest economic damages to Europe. According to MunichRe (international insurance group), natural disasters caused losses of USD 320bn in 2024. Extreme meteorological events, including winds, were responsible for 93% of overall losses and 97% of insured losses [16]. Other sectors also rely on knowledge of extreme winds like infrastructure construction, afforestation, wind power, etc. [13]. Due to the growing demand of these sectors, assessments of the frequency and intensity of extreme wind events are very important, particularly in the future under climate change. The common notion is that wind-speed alterations under climate change might be generally insignificant.
Many broad-scale assessments (e.g., IPCC AR5, IPCC 2021) report low to medium confidence that average near-surface wind speeds will undergo large or consistent trends in mid-latitude regions. Several modeling studies suggest that any future changes in typical or seasonal-mean wind speeds could be small compared to temperature or precipitation changes [17].
However, storm-related extremes can still strengthen, regardless of modest mean-wind shifts. For instance, extratropical cyclone intensification or poleward storm-track shifts [18] may cause more frequent and stronger peak wind episodes. A shift was found that increases both the intensity and frequency of high-impact windstorms in northern and central Europe, particularly under higher warming (SSP5-8.5) [19]. Thus, from an impact/risk viewpoint, extreme-wind events potentially become more damaging, even if long-term averages remain relatively stable [18].
The Second Assessment of Climate Change for the Baltic Sea Basin (BACC II) confirms that observed average wind speeds across the Baltic region display multi-decadal fluctuations rather than robust linear trends [20]. In future projections, the ensemble of earlier RCM (Regional Climate Model) runs indicates fairly small changes in mean wind speeds [17,21,22]. Yet BACC II also stresses that extreme wind speeds or storm episodes may well intensify, especially north of 55° N. While the overall significance of these changes varies across model ensembles, they do not always align with insignificant mean-wind shifts.
BACC II also highlights that even small wind changes can have greater coastal impact under rising sea levels. Projected sea-level increases in the Baltic Sea (e.g., around 0.3–0.8 m by late century) amplify storm-surge risks [23]. Consequently, marginal changes in average wind speeds can still become crucial if storm surges strike at higher baselines. Similarly, Outten and Sobolowski [13], using 12 km Euro-CORDEX data, found that wind changes remained fairly modest, but local extremes could become slightly more frequent, especially in coastal/mountainous areas. For example, an event historically expected once every 30 years might recur every 20–25 years by 2070–2100.
Consequently, focusing solely on insignificant average-wind changes misses the more critical possibility that storms (and thus peak wind speeds) may become stronger or more frequent. Therefore, adaptation planning around ports, offshore wind infrastructure, and flood defenses in the southern Baltic region must not disregard extreme-wind scenarios. Considering this, this study was conducted to model the wind surges in the Vistula Lagoon using the HEC-RAS model.

1.3. Applications of the HEC-RAS Model

HEC-RAS 2D (version 6.6), developed by the U.S. Army Corps of Engineers Hydrologic Engineering Center [24], is widely recognized as a robust tool for hydrodynamic modeling. This software has gained significant traction in simulating various surface flow conditions, ranging from riverine channel flows to floodplain inundation, rainfall-runoff processes in catchment areas, and even tsunami propagation [25]. Its numerical capabilities, including both full momentum and diffusion wave formulations of the shallow water equations, allow for the accurate representation of flow complexities in diverse hydraulic environments [26].
The application of HEC-RAS 2D in riverine channel flow modeling is well established, particularly in steady and unsteady flow simulations, flood hazard mapping, and urban drainage system analysis [27,28]. Studies have demonstrated its effectiveness in flood risk assessments, such as in Palembang [29] and the Ouémé Basin [30], where the model has been instrumental in predicting inundation extents and hydrodynamic behavior. Its capabilities extend to simulating rainfall–runoff interactions in small basins, as seen in Scuropasso, Italy, where the model was validated for discharge hydrograph computation [26]. Beyond riverine applications, HEC-RAS 2D has proven to be effective in simulating floodplain dynamics and extreme hydrological events. Floodplain mapping applications, such as those in Wajo Regency and the Veseočica River [31,32], have demonstrated its ability to capture complex flow interactions in urban and rural settings. The model has also been used to integrate hydrological and hydraulic processes in extreme rainfall events, facilitating early warning and mitigation strategies [33].
HEC-RAS has been successfully utilized to simulate tsunami propagation, demonstrating its ability to accurately compute wave elevation and velocity in two different locations, namely Hilo Bay, Hawaii, and Tauranga Harbor, New Zealand [25]. The model has also been applied to wind-driven hydrodynamic studies, though to a significantly lesser extent. Some investigations have explored its suitability for modeling hydrodynamics in regulated lagoons and tidal-influenced systems [34,35]. However, its application to wind-induced surges in coastal and semi-enclosed water bodies, such as lagoons, bays, and estuaries, remains uncommon. The hydrodynamics of the Vistula Lagoon, a semi-enclosed coastal water body in the Baltic Sea, is primarily driven by wind forcing and fluctuations in the Gulf of Gdańsk water levels [11]. The lack of extensive research on HEC-RAS 2D’s suitability for wind-induced surge modeling necessitates an in-depth evaluation of its capabilities in this context.
Given the model’s proven reliability in various hydrodynamic applications but its limited verification for wind-driven flows, this study aims to assess the feasibility of using HEC-RAS 2D for simulating wind-induced surges in the Vistula Lagoon. The findings will contribute to evaluating its suitability for lagoon hydrodynamics and potentially expanding its application beyond traditional riverine and floodplain scenarios.

1.4. Research Objectives

Taking into account the current flood hazard in the vicinity of the city of Elbląg and its adjacent polder areas, as well as the potential increase in this hazard due to greater storm surges in the Vistula Lagoon, the primary practical goal of this research is to estimate possible maximum water levels in the Elbląg area through mathematical modeling of the lagoon’s hydrodynamics. An additional goal is to validate the applicability of the HEC-RAS 2D model (version 6.6) for simulating wind surges, a factor not commonly employed in hydrodynamic modeling. The preliminary results of the work on this issue were presented by the authors in a conference paper [36].

2. Materials and Methods
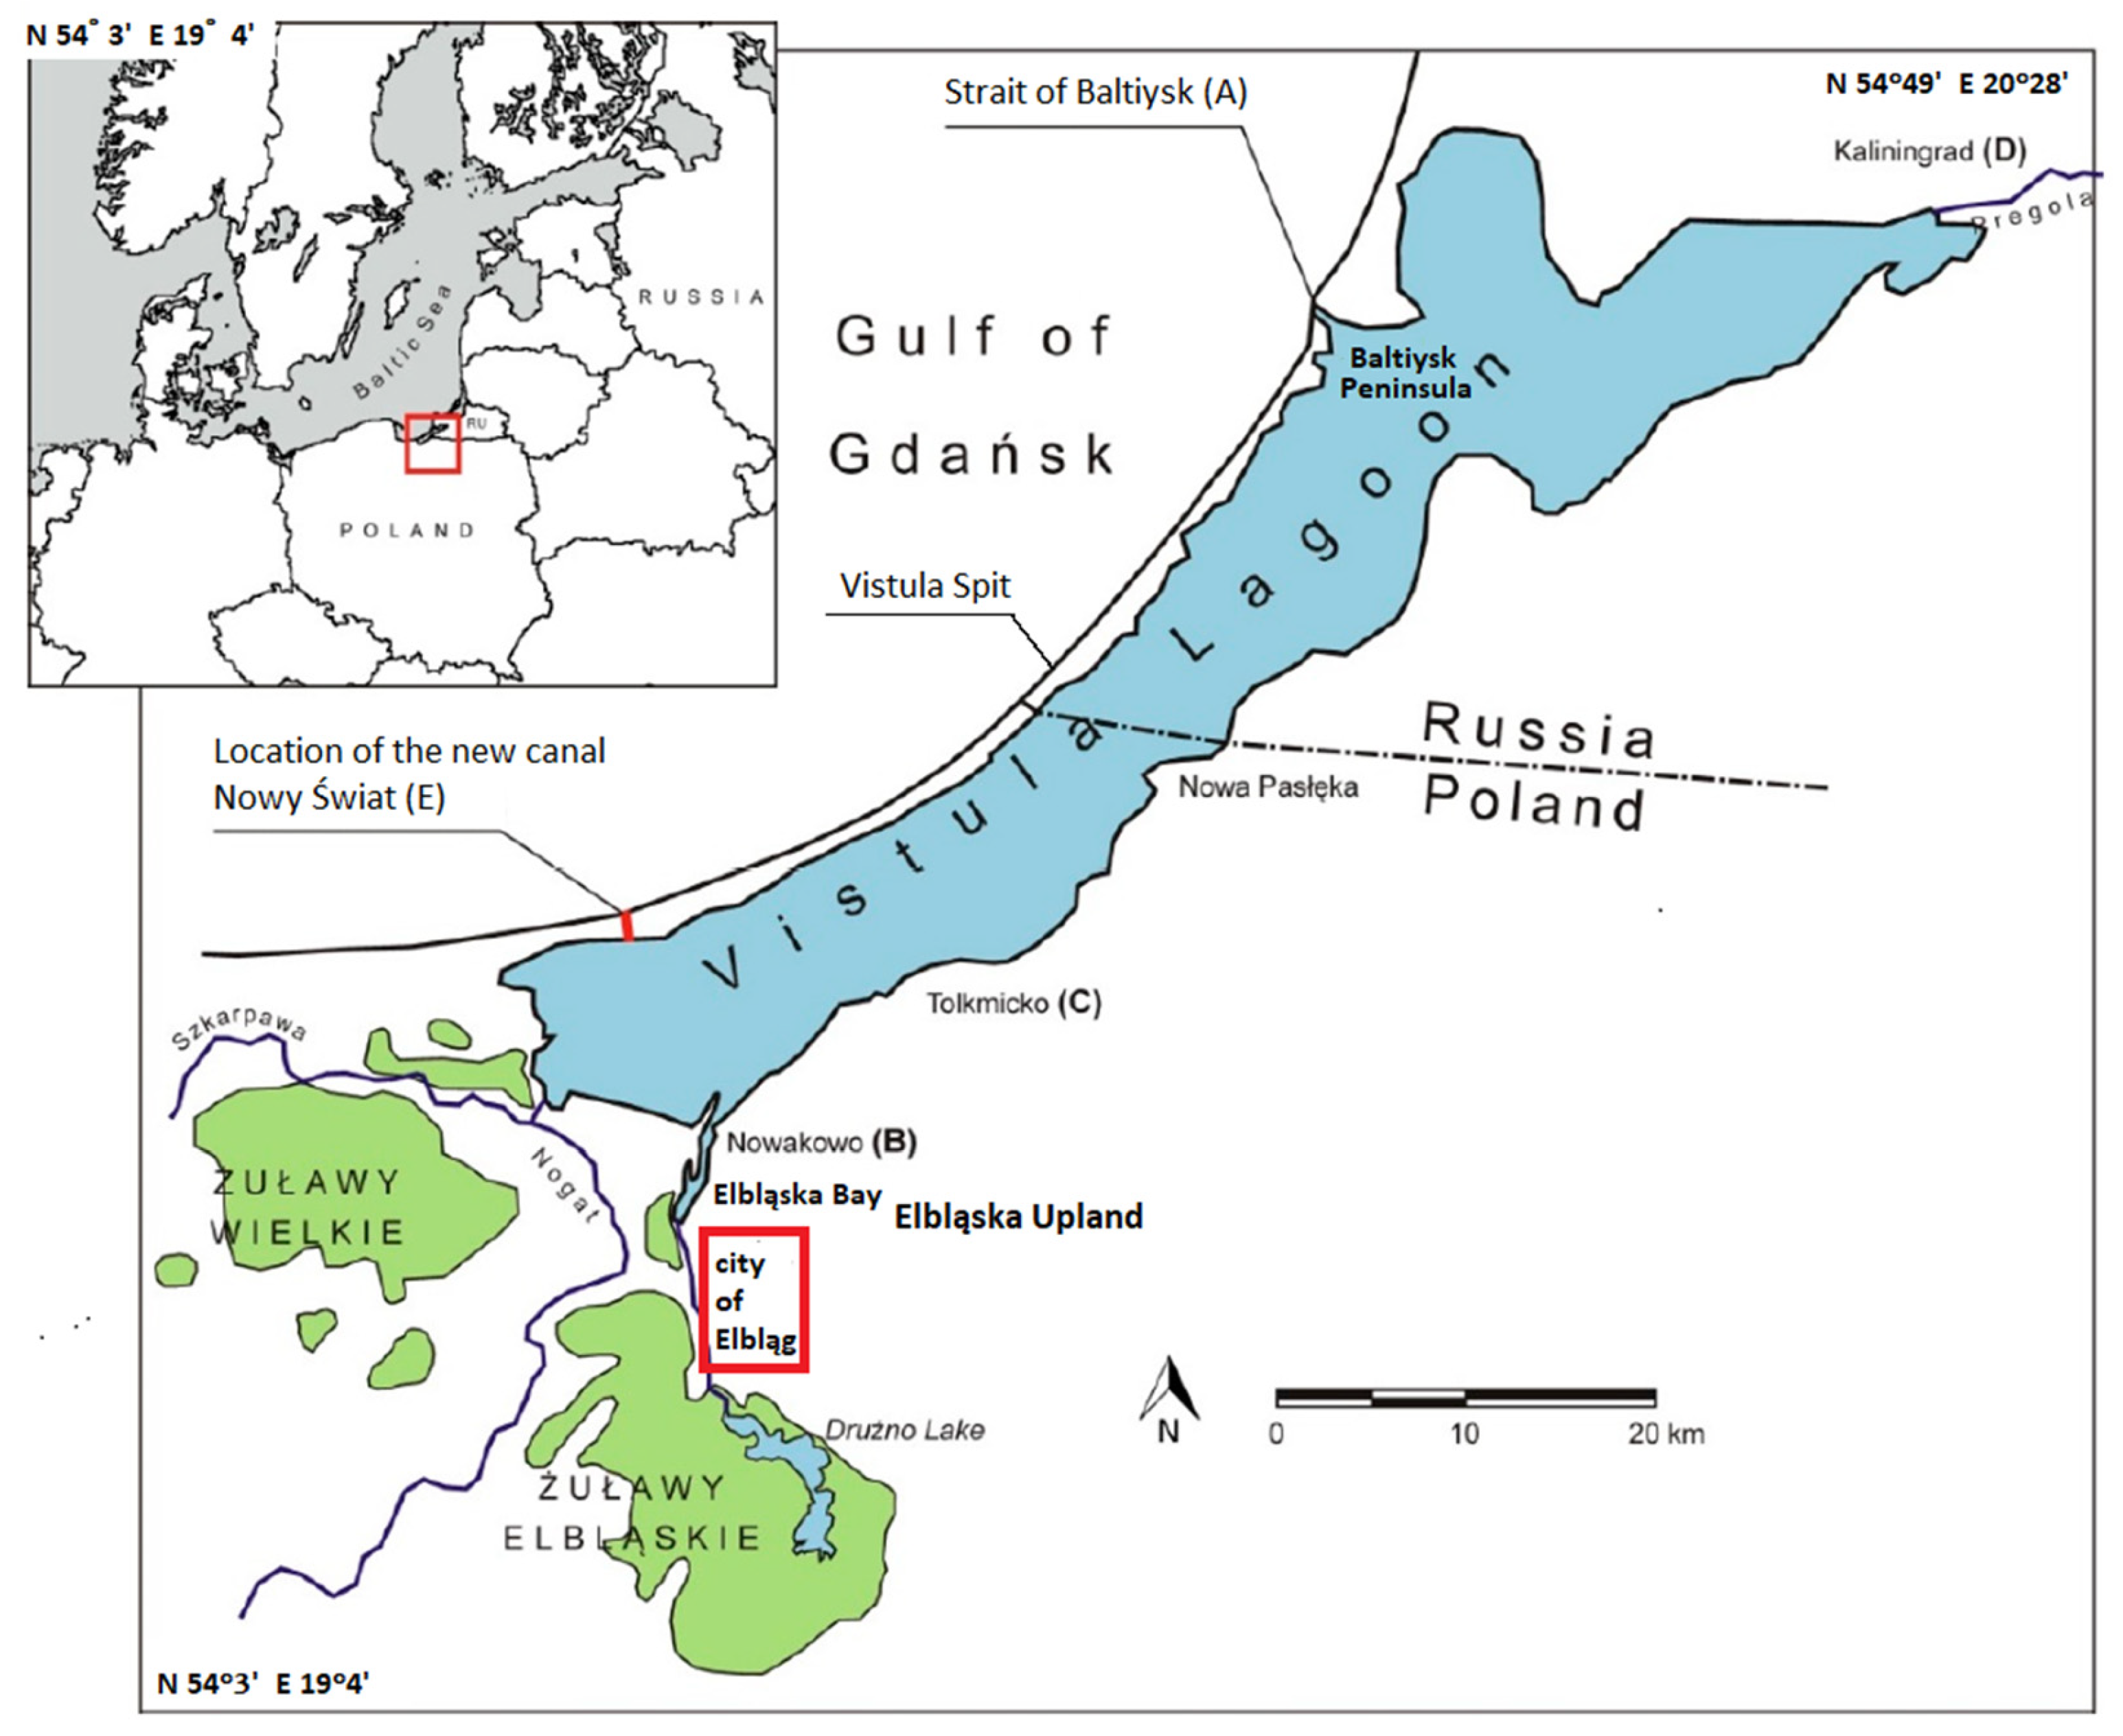
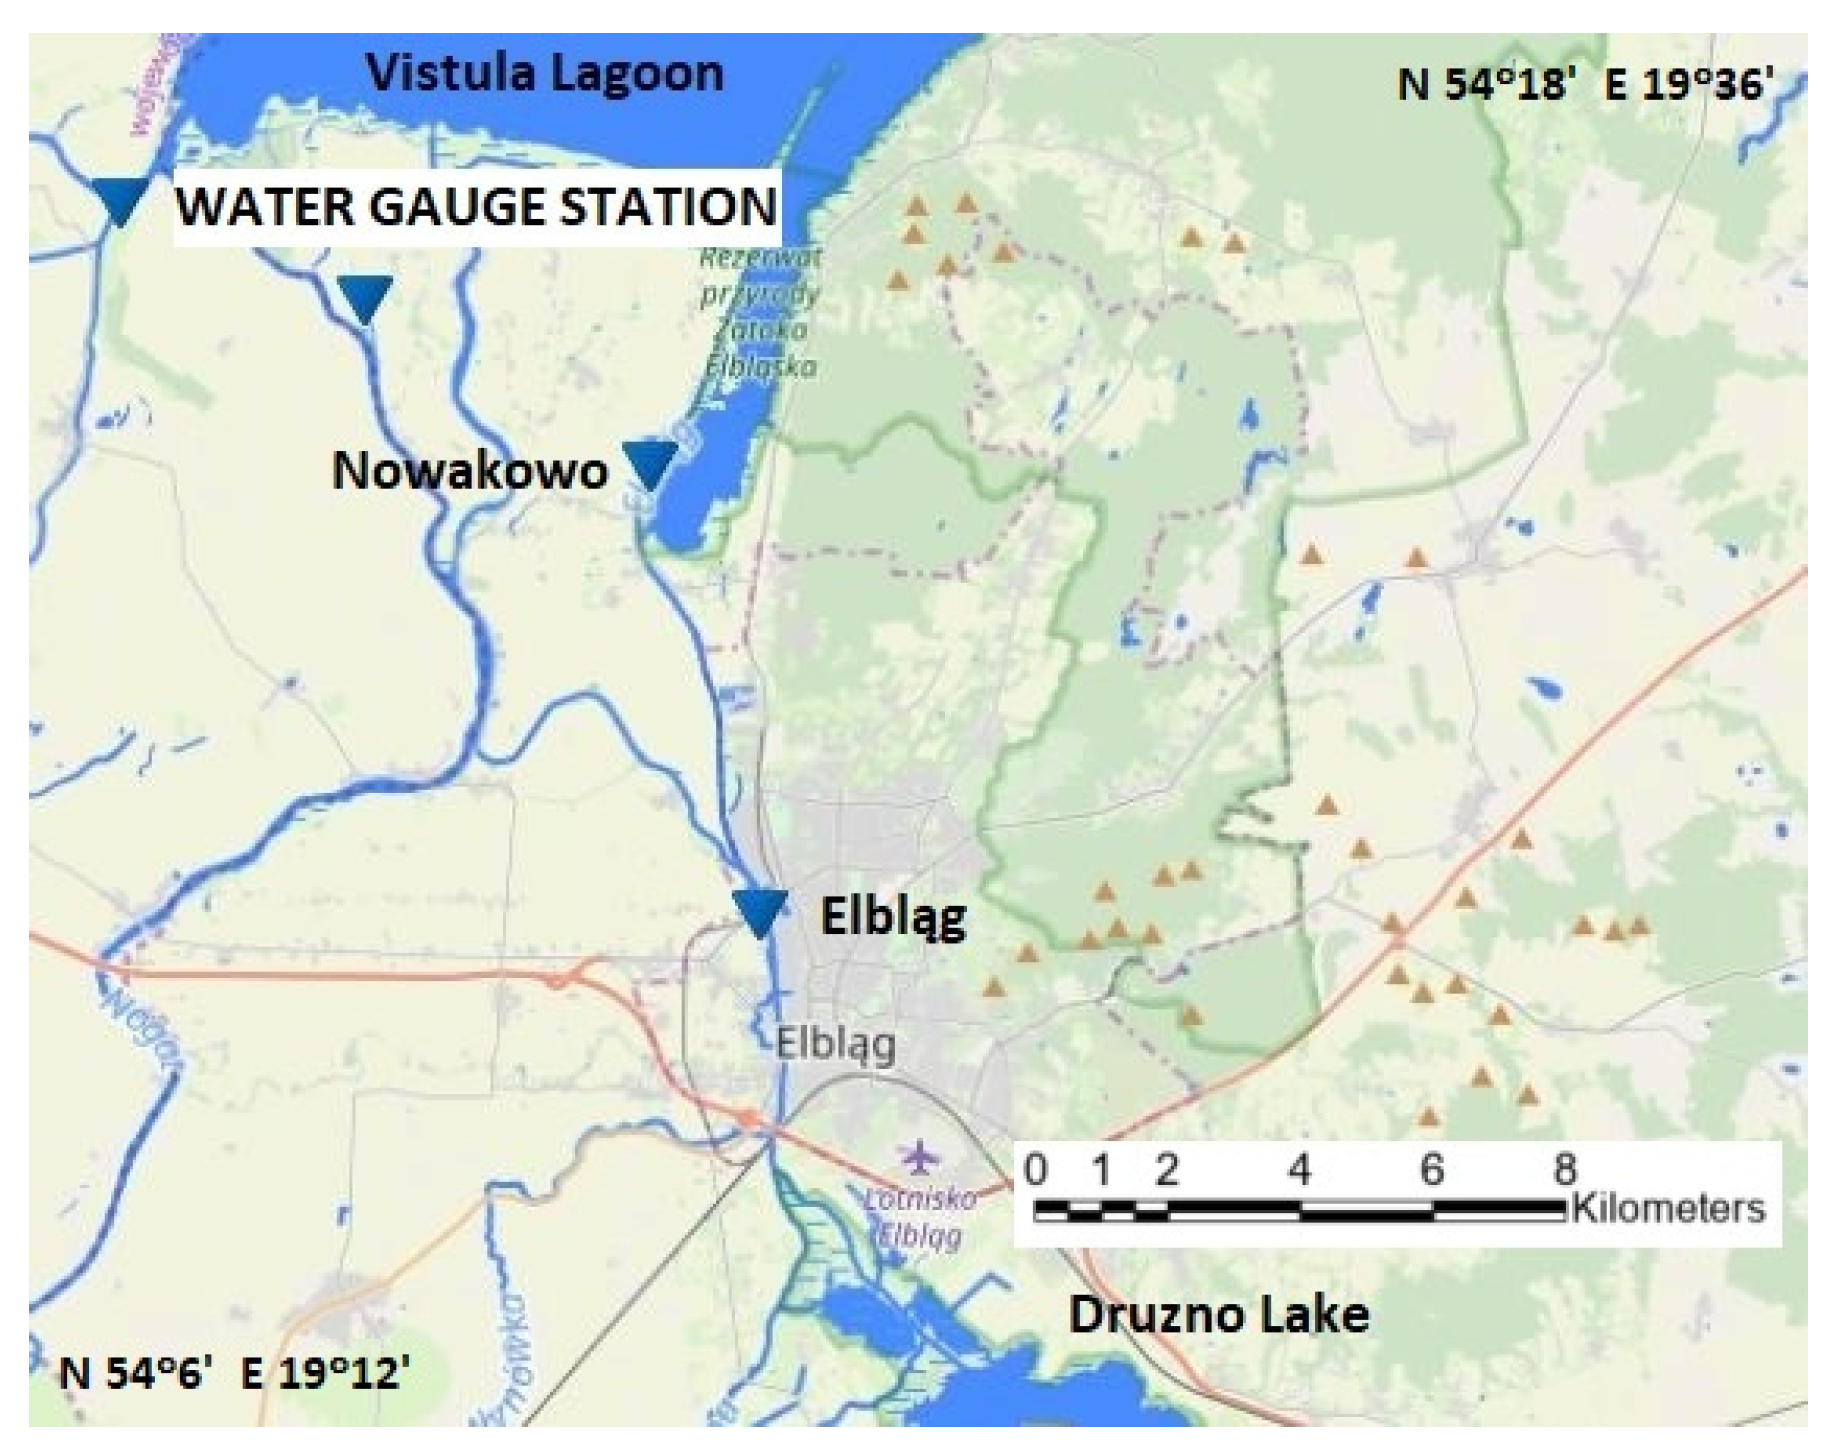
To conduct hydrodynamic modeling, bathymetric data of the Vistula Lagoon were obtained [3,6,11], as the lagoon’s water accumulation poses a direct flood hazard to the city of Elbląg. Additionally, bathymetric data of a part of the Gulf of Gdańsk, near the Strait of Baltiysk, were collected [7] to account for the boundary conditions related to water exchange between the bay and the lagoon in hydrodynamic simulations. The hydrodynamic modeling required hydro-meteorological data, which were acquired from previously published studies [11] utilizing public observational data from IMGW-PIB.
The widely available HEC-RAS 2D model (version 6.6) [24] was employed for the mathematical modeling of the lagoon’s hydrodynamics. The obtained results were subsequently compared with calculations derived from our custom solution of the shallow water flow equations (SWE) and available water level observations from the Nowakowo gauging station [11,37].
To analyze the impact of potential climate change on flood hazards in the southwestern Vistula Lagoon area, synthetic wind parameters were implemented, assuming a constant north-easterly wind direction and selected wind speeds up to a maximum value of 35 ms−1, as suggested in the IMGW-PIB studies [9].

2.1. Study Area

The Vistula Lagoon is a coastal water body located on the southern coast of the Baltic Sea, in the eastern part of the Gulf of Gdańsk (Figure 1). It is a transboundary water body shared between Poland and Russia, with a total area of 838 km2, of which 328 km2 belongs to Poland and 472.5 km2 to Russia. The lagoon stretches approximately from 19°13′30″ E to 20°24′47″ E longitude and from 54°15′15″ N to 54°43′25″ N latitude [2,3,38].
The lagoon is separated from the Baltic Sea by the Vistula Spit, which is approximately 65 km long. The total length of the lagoon is 90.7 km, with an average width of 9.2 km (maximum width of 13 km). The lagoon is relatively shallow, with an average depth of 2.0–3.0 m and a maximum depth of 5.2 m. The total water capacity of the lagoon is 2.3 km3. Until 2022, the only connection between the Vistula Lagoon and the Baltic Sea was through the Strait of Baltiysk located in the Russian part. The strait is approximately 2 km long, 400 m wide, and 8–12 m deep. In September 2022, a new navigable canal (Nowy Świat ship canal) was opened in the Polish part of the Vistula Spit [39]. The canal is 1.3 km long with a lock 25 m wide and 5 m deep [11,37,40].
The shoreline of the lagoon is poorly developed, except for two major bays: Primorsk Bay in the north and Elbląska Bay in the south. The salinity of the lagoon varies spatially, decreasing with distance from the Strait of Baltiysk—from about 5.5 near the strait to 2.2 in the western part. The lagoon experiences rapid water level changes exceeding 1.0 m at its SW and NE edges, primarily driven by winds and Baltic Sea-level fluctuations. The dominant winds are from the SW direction with velocities ranging from 4 to 6 ms−1 (measured at 10 m in height) [5,41,42].
The hydrological regime of the Vistula Lagoon is characterized by complex water exchange between the Baltic Sea, river inflows, precipitation, and evaporation. About 75% of the water input comes from the Baltic Sea through the Strait of Baltiysk, while river inflows contribute approximately 20% of the total water budget [2,37,41].

2.2. HEC-RAS Hydrodynamic Mathematical Model

HEC-RAS (version 6.6) is an open-source hydraulic modeling software developed by the U.S. Army Corps of Engineers for simulating water flow through natural rivers and channels. The software enables users to perform various types of hydraulic analyses, including one-dimensional steady and unsteady flow modeling, two-dimensional unsteady flow modeling, coupled 1D-2D unsteady flow routing, sediment transport computations, and water quality modeling [24].
The two-dimensional unsteady flow solver in HEC-RAS implements an implicit finite volume algorithm, allowing for larger computational time steps compared to explicit methods. The software accommodates both unstructured and structured computational meshes, with the former being the primary design focus. For computing flow fields in 2D meshes, HEC-RAS offers two computational approaches: the full momentum (Saint-Venant) equations and the diffusion wave model. The first of these mathematical models was used in this study.
The governing 2D Saint-Venant equations in their non-conservative form are expressed as:
Continuity equation:
H t + h u x + h v y = q
Momentum equations:
u t + u u x + v u y = g H x + v t 2 u x 2 + 2 u y 2 c f u + f v + τ w x ρ h
v t + u v x + v v y = g H y + v t 2 v x 2 + 2 v y 2 c f v + f u + τ w y ρ h
where
  • t—time (s);
  • u, v—velocity components in x and y directions (m·s−1);
  • q—source/sink flux term (m3·s−1·m−2);
  • H—water surface elevation (m asl);
  • h—water depth (m);
  • g—gravitational acceleration (m·s−2);
  • vt—horizontal eddy viscosity coefficient (m2·s−1);
  • cf—bottom friction coefficient (-);
  • f—Coriolis parameter (s−1);
and terms like τw/ρh represent surface wind stresses in the x and y directions, respectively, and are crucial in simulations of wind surges in shallow reservoirs such as lagoons.
In order to solve the set of Equations (1)–(3), the initial and boundary conditions are needed. The initial condition was determined by the hydrostatic state, with the horizontal water table corresponding to the initial water level in the Gulf of Gdańsk and Vistula Lagoon. The boundary conditions were chosen in the following way. At open boundaries of the Gulf of Gdańsk, the sea water level (representing storm surges) was forced. The other boundaries are located along the shore line of the lagoon and they were treated as closed boundaries. The observed wind direction and speed at the Nowa Pasłęka meteorological station (Figure 1) were used as the input data for the simulation. The inflow of rivers entering into the lagoon was neglected.

3. Results and Discussion

This chapter is divided into two parts. The first one (Section 3.1) presents a simulation of a historical episode of water accumulation in the Vistula Lagoon, which took place in January 2019. That episode was the result of both the water level rise in the Gulf of Gdańsk and the resulting inflow of water into the lagoon through the Strait of Baltiysk, as well as friction from the wind above the water surface of this reservoir. This episode was analyzed and described earlier in the publication [11], thanks to which it was possible to use it to verify the results obtained from the hydrodynamic model made in the HEC-RAS 2D software used in this work. The second part of the results chapter (Section 3.2) presents simulations of hypothetical episodes of water accumulation in the Vistula Lagoon, resulting solely from wind stresses.

3.1. Historical Storm Surge Event, January 2019

The primary objective of this study was to assess the feasibility of using the HEC-RAS 2D (version 6.6) model to simulate wind surges in the Vistula Lagoon. To validate the model, the January 2019 storm event was analyzed. The validation was made possible primarily by hydrometeorological data obtained from field measurements conducted by IMGW-PIB, which are described and analyzed in detail in Section 3.1.1, Section 3.1.2 and Section 3.1.3. Subsequently, a numerical simulation of the storm event was carried out, as outlined in Section 3.1.4. The validation of the computational model was based on a comparison of the field measurement data with both current and previous [11] simulation results, as presented in Section 3.1.5.

3.1.1. Meteorological Conditions and Situation in the Gulf of Gdańsk

In early January 2019, a significant storm surge event occurred in the Vistula Lagoon due to a combination of meteorological factors, including high sea levels in the Gulf of Gdańsk and strong wind action. Observations recorded by IMGW-PIB indicate that the water level in the Gulf of Gdańsk reached 1.11 m above mean sea level, approaching the 10% probability maximum level [11]. This elevation in sea level was driven by prolonged periods of strong easterly and north-easterly winds, reaching speeds of over 18 ms−1. The meteorological pattern included shifts in wind direction and velocity, leading to multiple episodes of water accumulation in the southern part of the Vistula Lagoon.

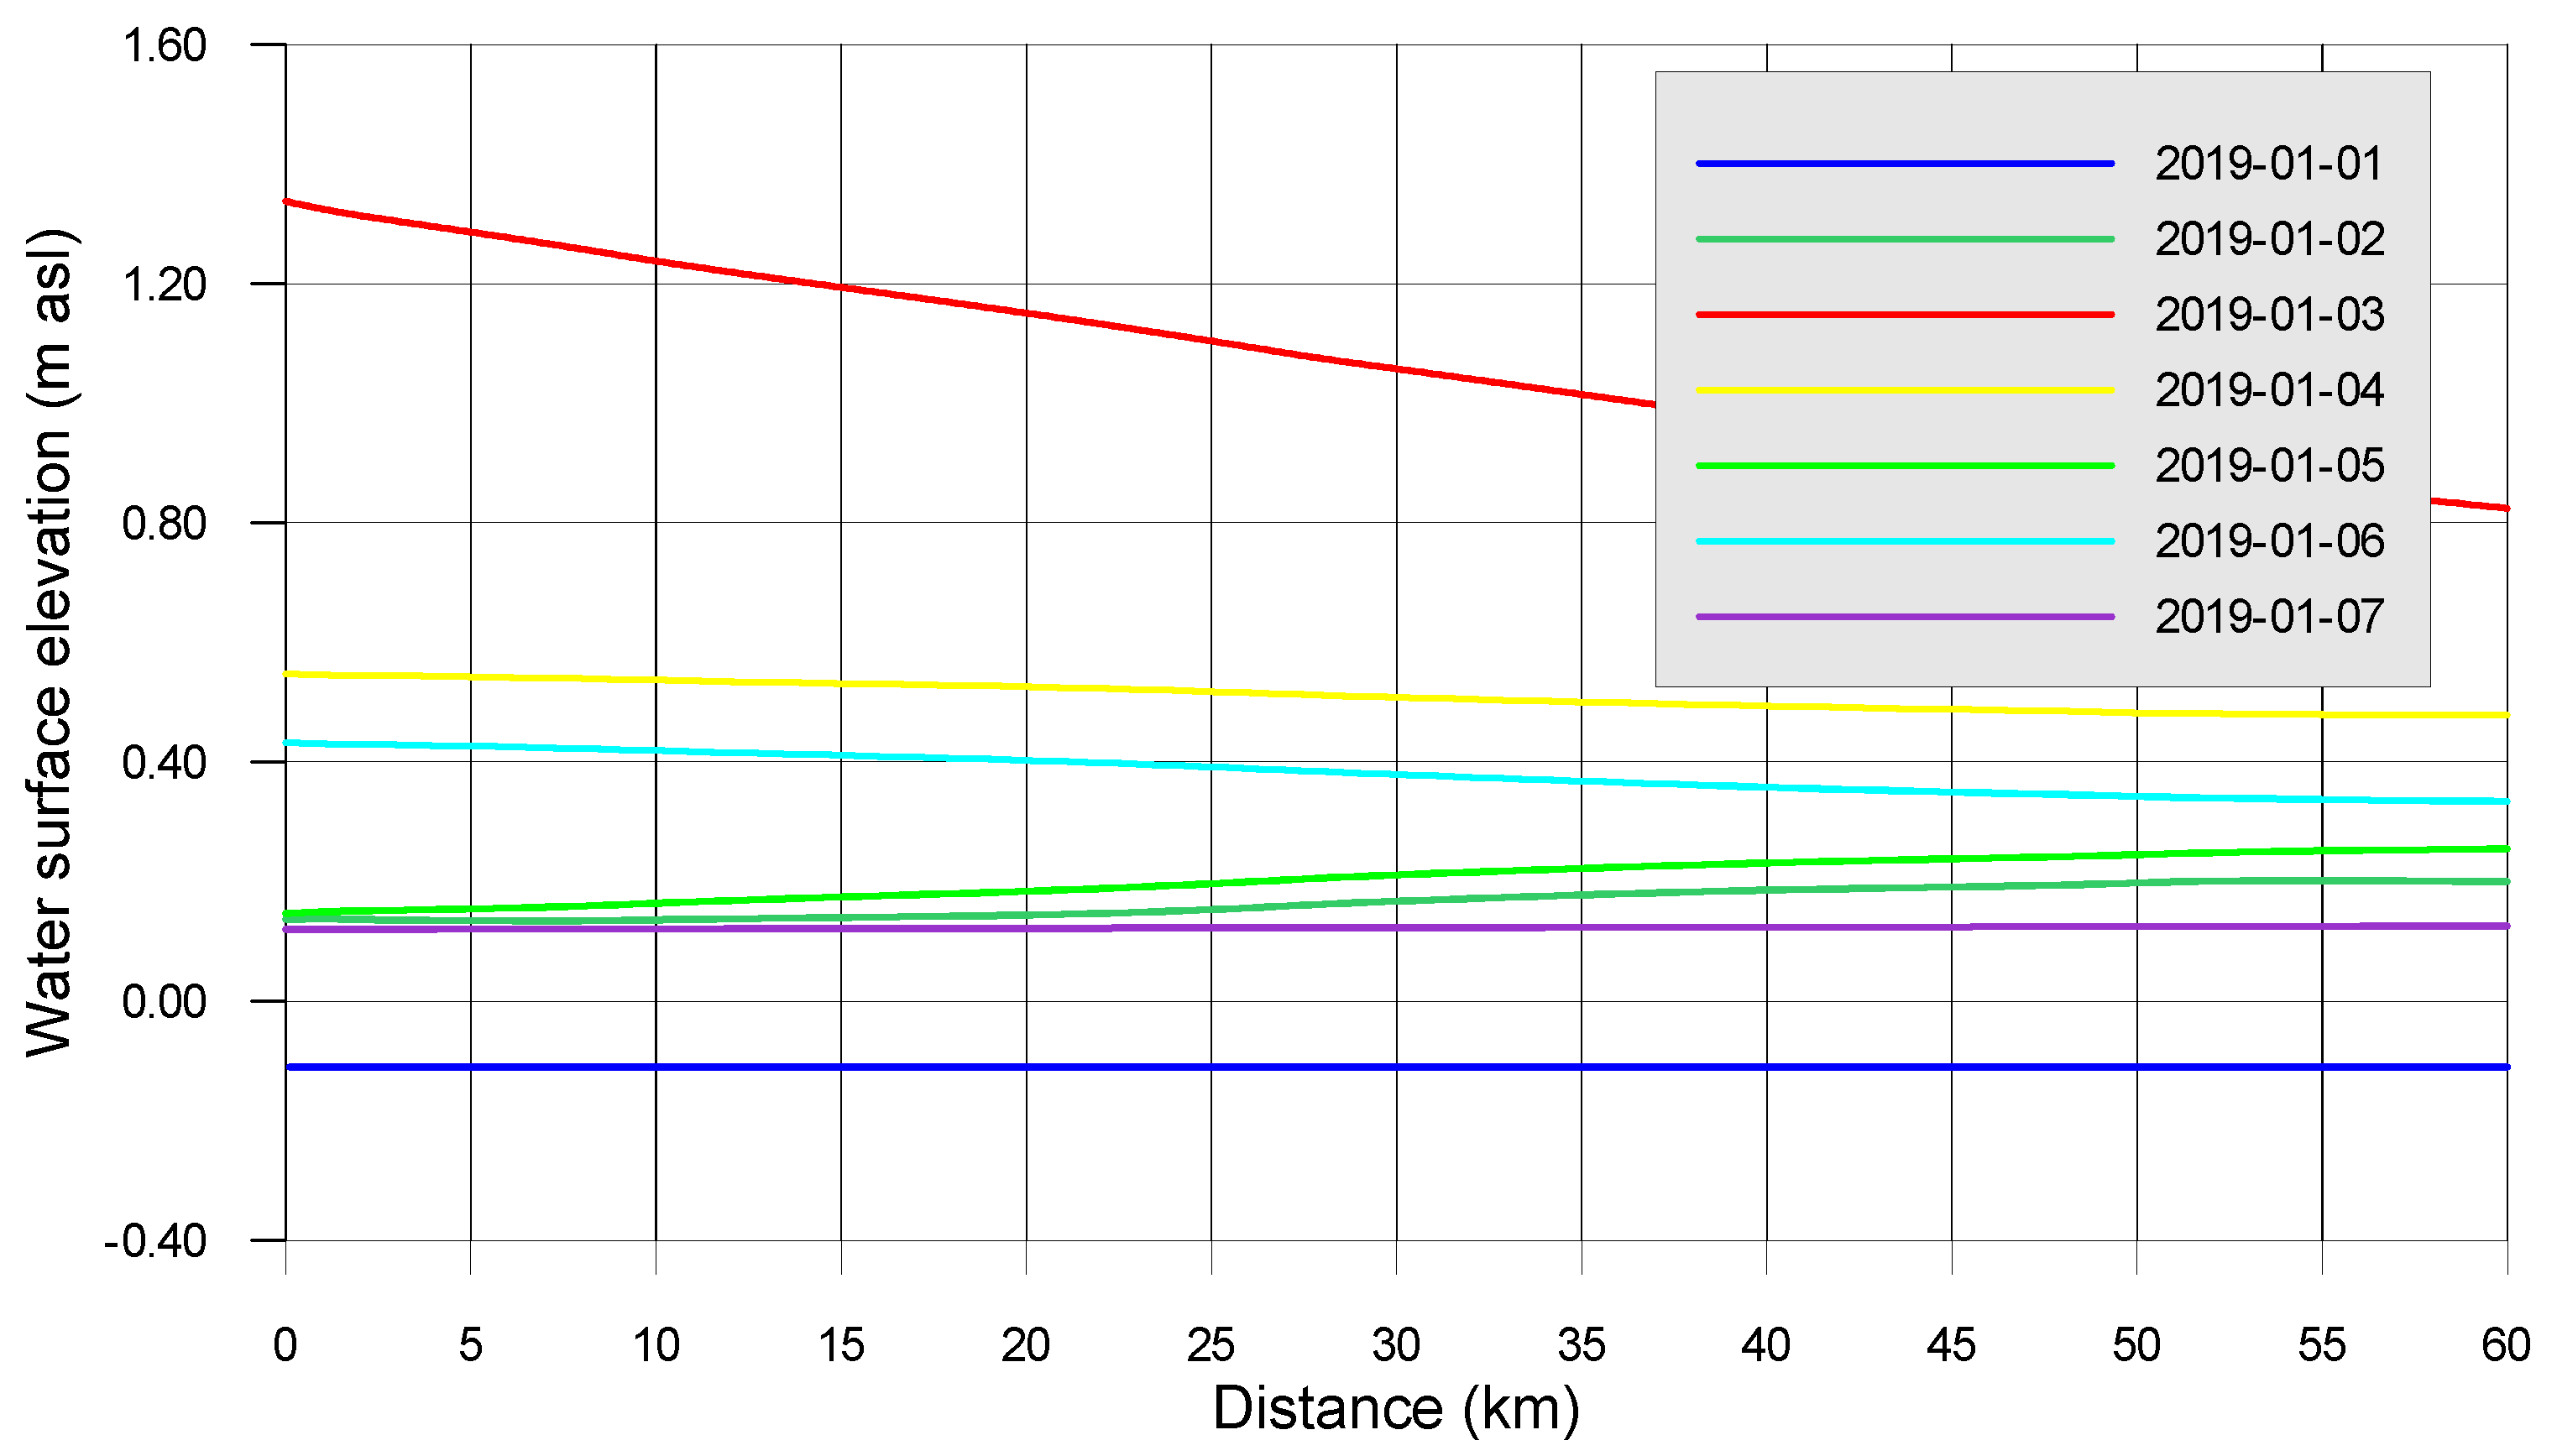
3.1.2. Impact on the Vistula Lagoon

The hydrodynamics of the Vistula Lagoon during the event were largely governed by the exchange of water through the Strait of Baltiysk. The high sea level in the Gulf of Gdańsk created a pressure gradient, forcing water into the lagoon. Simultaneously, strong NE winds amplified the surge effect by pushing additional water toward the southern parts of the lagoon, further exacerbating flooding risks.
The combined effect of high sea levels and persistent easterly winds resulted in severe water accumulation in the southern part of the Vistula Lagoon. This pattern of damming in the Polish part of the lagoon is consistent with previous studies conducted for the period of 2008–2017 [5]. The storm surge caused a rapid rise in water levels near Elbląg (Nowakowo) with recorded values exceeding 1.5 m asl, surpassing both the warning and alarm levels. Similar conditions were observed in Tolkmicko (Figure 1), where water levels reached approximately 1.38 m asl. These extreme water levels posed a significant flood risk to the adjacent polder areas of Żuławy Elbląskie, a low-lying region that is highly susceptible to inundation.

3.1.3. Correlation Between Sea Level, Wind Parameters and Storm Surge in the Lagoon

The time series plot in Figure 3 shows fluctuations in water levels at the Gulf of Gdańsk (sea level), Nowakowo and Tolkmicko (southwest lagoon level) gauging stations (Figure 1) throughout January 2019.
The analysis of water level variations in the Gulf of Gdańsk and the southwestern Vistula Lagoon (stations: Nowakowo and Tolkmicko) reveals a strong correlation between sea-level fluctuations and water levels in the lagoon. The Pearson correlation coefficient between the Gulf water level and that of Nowakowo and Tolkmicko reached 0.77, indicating that water level changes in the Gulf significantly influenced the lagoon. A lagged correlation analysis showed that the highest correlation (0.95 for Tolkmicko and 0.94 for Nowakowo) occurred with a 6 h delay, confirming that the storm surge propagated from the Gulf into the lagoon over time. The maximum recorded water levels during the event were 1.11 m in the Gulf, 1.57 m in Nowakowo, and 1.36 m in Tolkmicko, demonstrating the amplifying effect of hydrodynamic interactions within the confined lagoon.
The delayed response of water level fluctuations is also a characteristic feature of many Mediterranean coastal lagoons and has been extensively analyzed using tidal propagation models. In these systems, lagoon hydrodynamics, water exchange efficiency, and water level variability are significantly influenced by shallow bathymetry, bottom friction, and the morpho-geometric attributes of tidal inlets. These factors collectively modulate the amplitude and phase of the tidal signal during its propagation from offshore waters—typically from the adjacent gulf—into the confined lagoon environment [43,44].
Wind conditions (Figure 4) played a crucial role in the storm surge. The average wind speed during the analyzed period was 9.41 ms−1, with a peak of 18.0 ms−1. The dominant wind direction was variable, but during surge events, it was predominantly from the northeast (NE), which is critical for water accumulation in the southwestern part of the lagoon and plays a role in driving water masses towards the Polish coast. The correlation between wind speed and water levels was 0.50 for Nowakowo and 0.57 for Tolkmicko, indicating that stronger winds contributed significantly to water level rise.
This analysis confirms that the storm surge in January 2019 resulted from a combination of external sea-level rise, wind-driven transport, and lagoon hydrodynamics, with a peak response occurring several hours after the initial sea-level rise in the Gulf. The storm parameters, presented in the analysis, were used to perform and validate the numerical simulation of lagoon hydrodynamics during the January 2019 storm event.

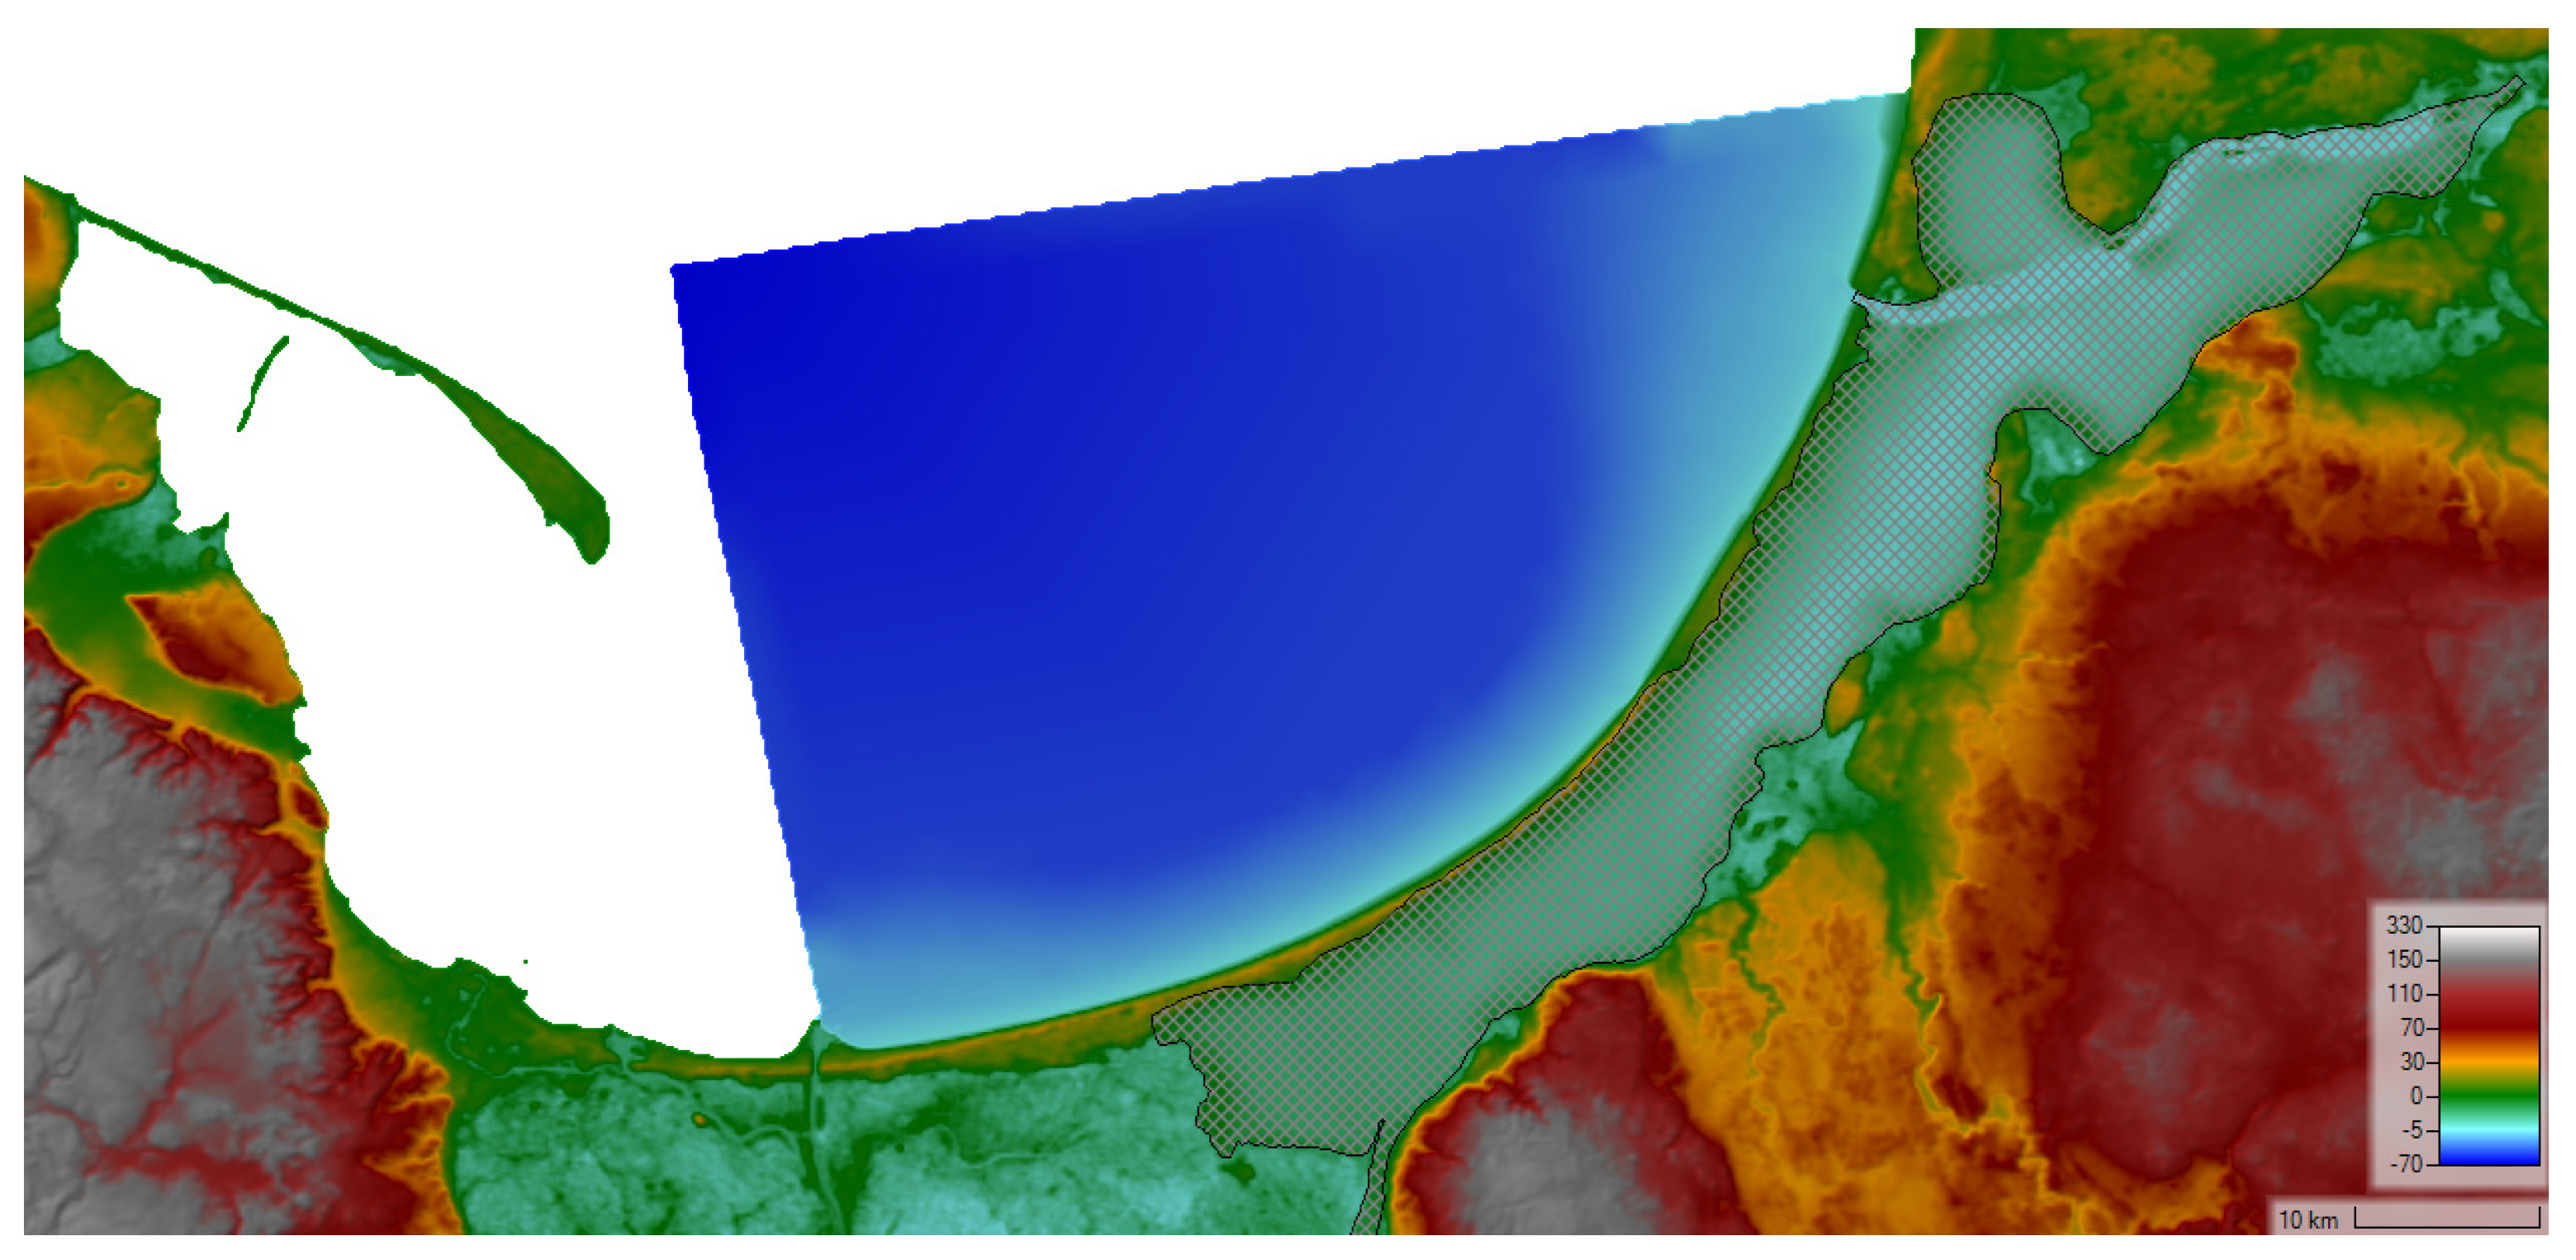
3.1.4. Numerical Simulation

In order to validate the results of modeling the storm surge using the two-dimensional HEC-RAS model, a numerical simulation of the historical episode described above was performed. To achieve this, the flow area was represented using a rectangular numerical grid with a mesh size of 100 × 100 m (Figure 5).
The hydrostatic state was used as the initial condition, assuming a water level of −0.11 m asl. In the computational options of the HEC-RAS program, the dynamic wave model, described in the manual [24] as shallow water equations with a Eulerian–Lagrangian approach to solving for advection (SWE-ELM), was selected as the mathematical model of the hydrodynamics. The wind shear stress was modeled using the Hsu concept [45], lagoon’s bottom friction was given as a constant value of Manning’s roughness coefficient 0.025 m−1/3∙s and turbulent viscosity was neglected. In the present study, turbulent viscosity was neglected due to the large spatial and temporal scales considered, where the dynamics of the shallow coastal lagoon are primarily governed by gravitational and inertial forces [46]. The conditions forcing the water movement in the lagoon were the evolution of the sea state in the Gulf of Gdańsk according to IMGW-PIB observations (Figure 3) and the measured changes in wind parameters according to the graph in Figure 4. The same wind action was assumed at each point of the Vistula Lagoon water surface, although the measurement came from a single station (Nowa Pasłęka), which is a significant simplification of the meteorological situation. The total simulation time was 6 days, and the calculations were performed with a time step of 5 min.
Figure 6 shows the longitudinal profiles of the water surface, along the SW-NE axis of the lagoon, calculated with the HEC-RAS model at selected time moments (at 12 a.m. each day).
These illustrate the evolution of the spatial distribution of the surge from the Polish to the Russian end of the lagoon. During the storm surge event, significant water level fluctuations occurred due to strong wind-driven water displacement. Initially, on 1 January, the water table was horizontal (−0.11 m asl). Then, on 2 January, the first water accumulation was observed in the northeastern (Russian) part of the lagoon, where the maximum water level exceeded 0.2 m. This indicates that strong winds initially pushed water towards the northeast. However, on 3 January, a sudden reversal occurred, with the highest water level recorded at over 1.3 m asl in the Polish section, while the lowest water level was observed in the northeastern part. This suggests a strong storm-driven backflow, pushing water back towards the southwest. From 4 January onward, the water levels gradually decreased, with the highest level still observed in the Polish end (0.55 m), but significantly lower than the peak on 3 January. By 5 January, water levels continued stabilizing, with water re-accumulation at the Polish side. This sequence of water level changes clearly illustrates the two-phase storm surge dynamics, where the first phase involved water accumulation in the northeastern part, followed by a strong backflow and peak water level in the Polish section, before finally subsiding. These calculated variations highlight the dominant influence of wind-driven water movement and are consistent with observations.

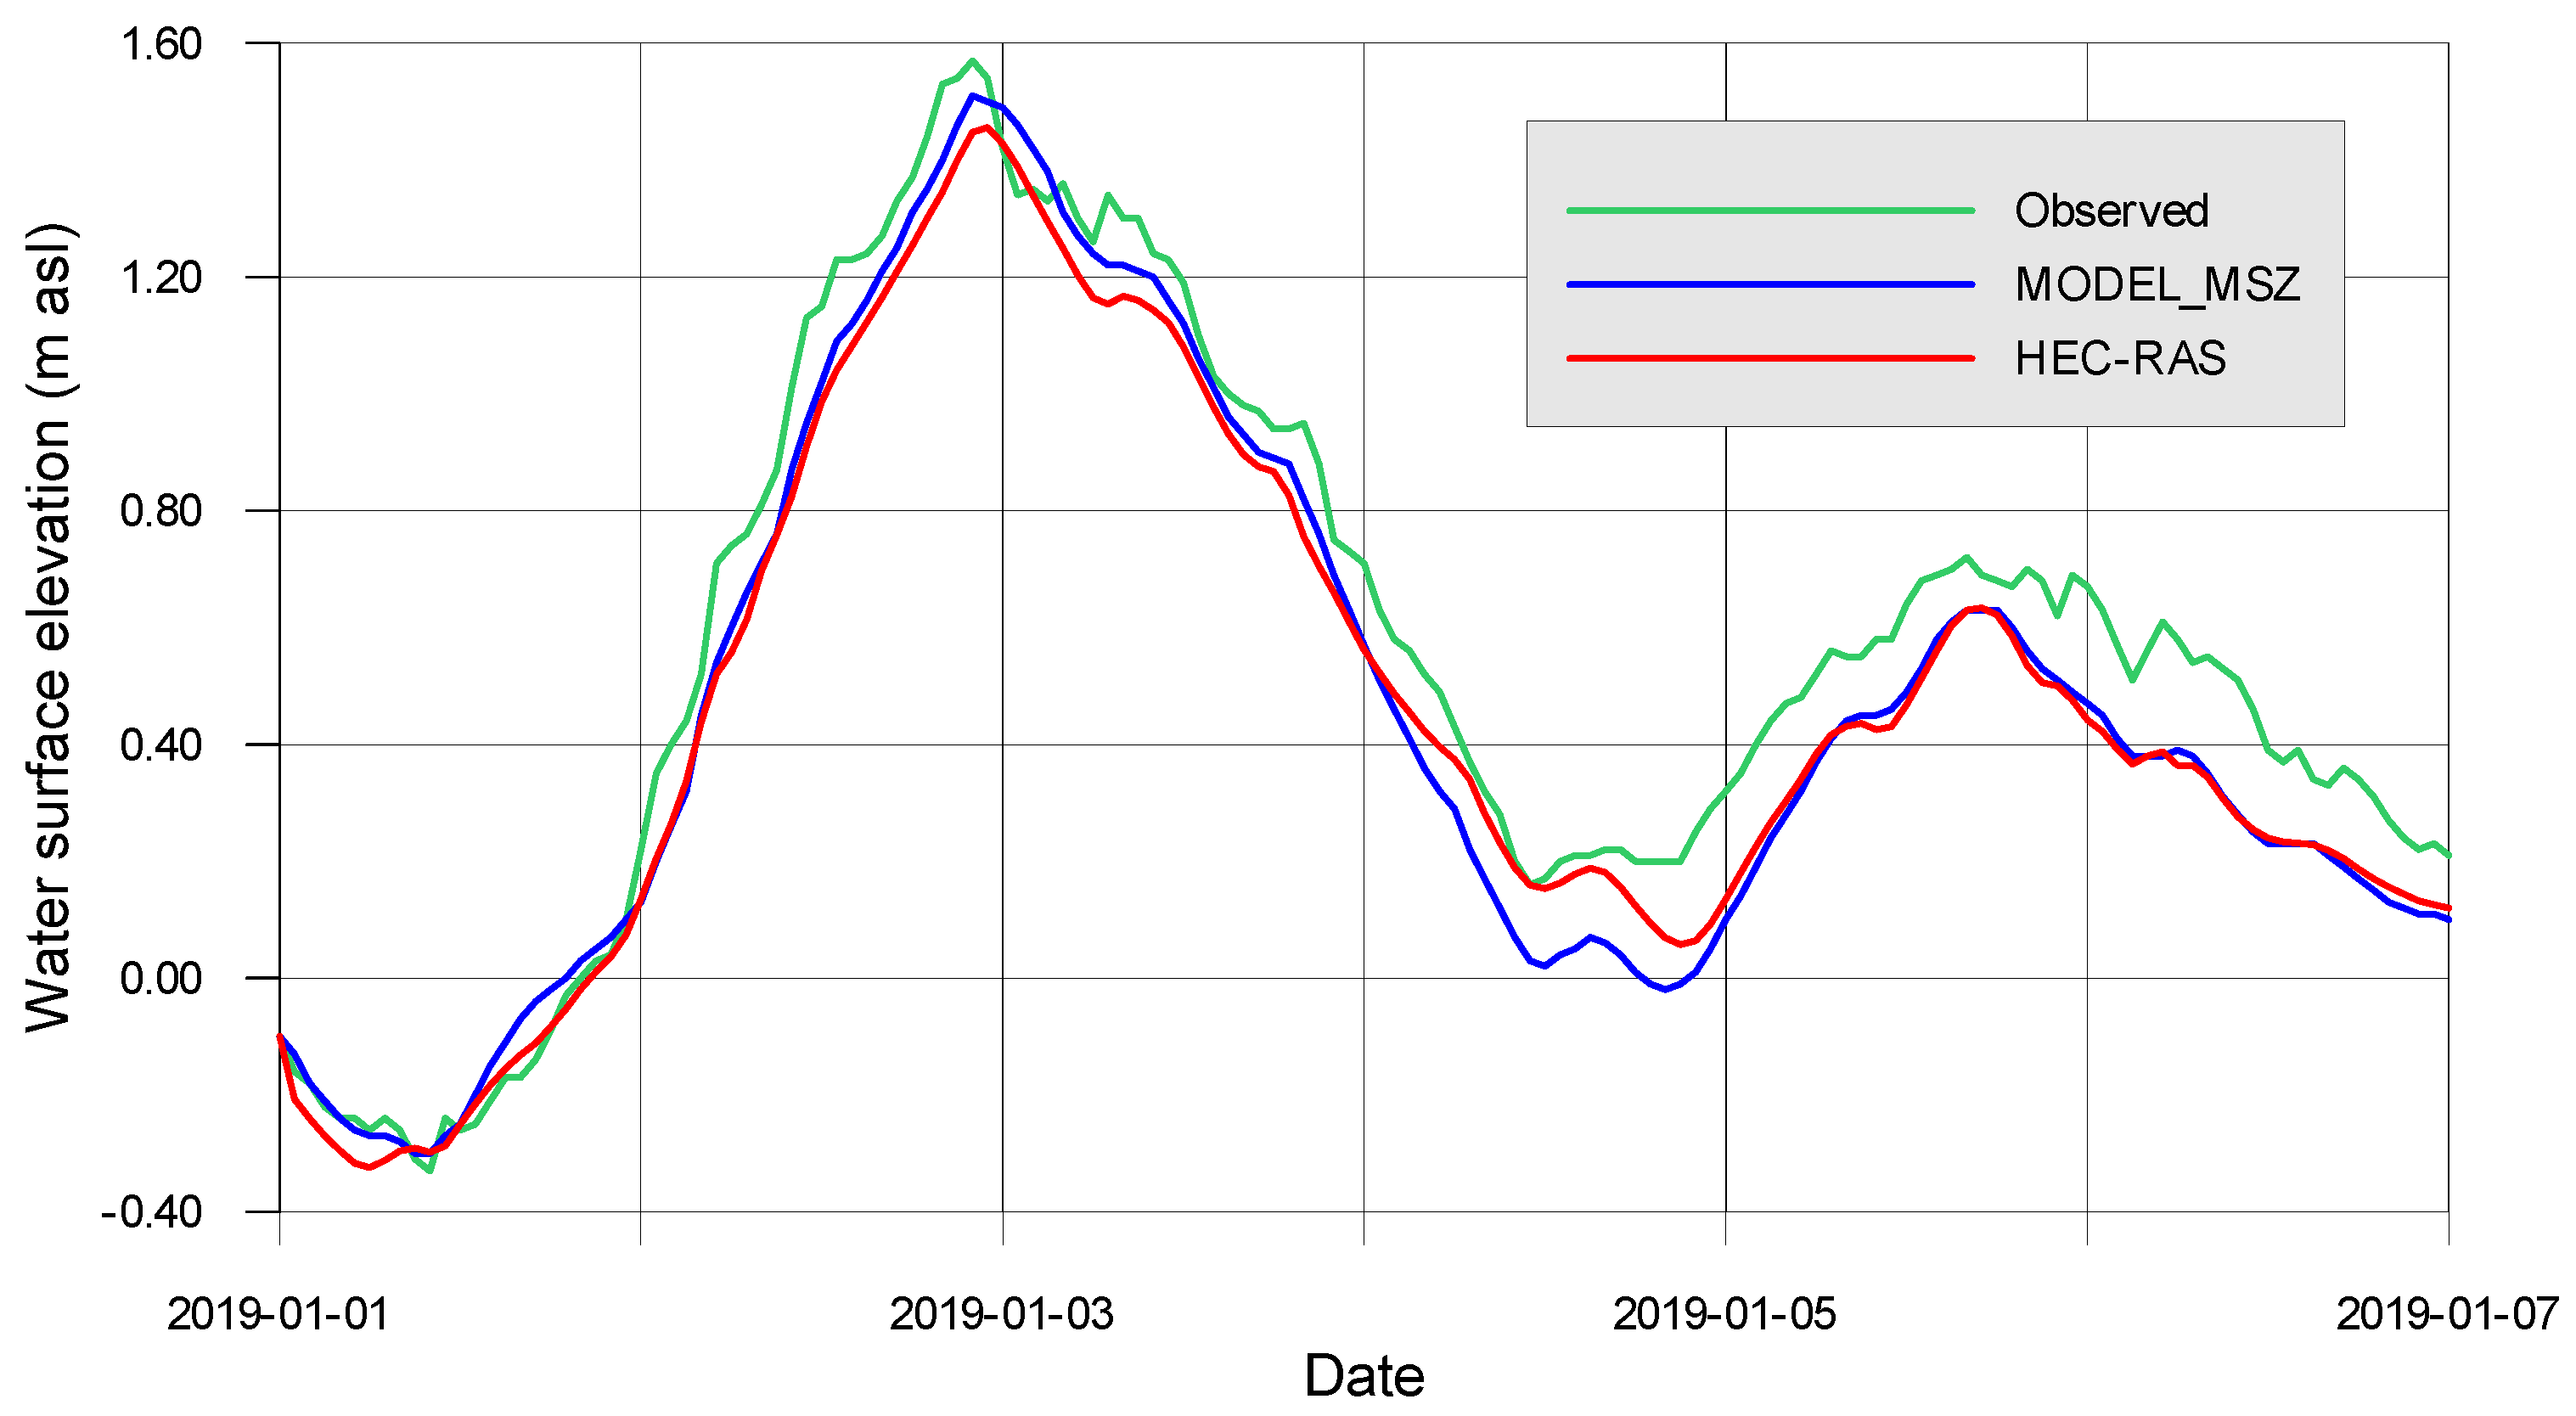
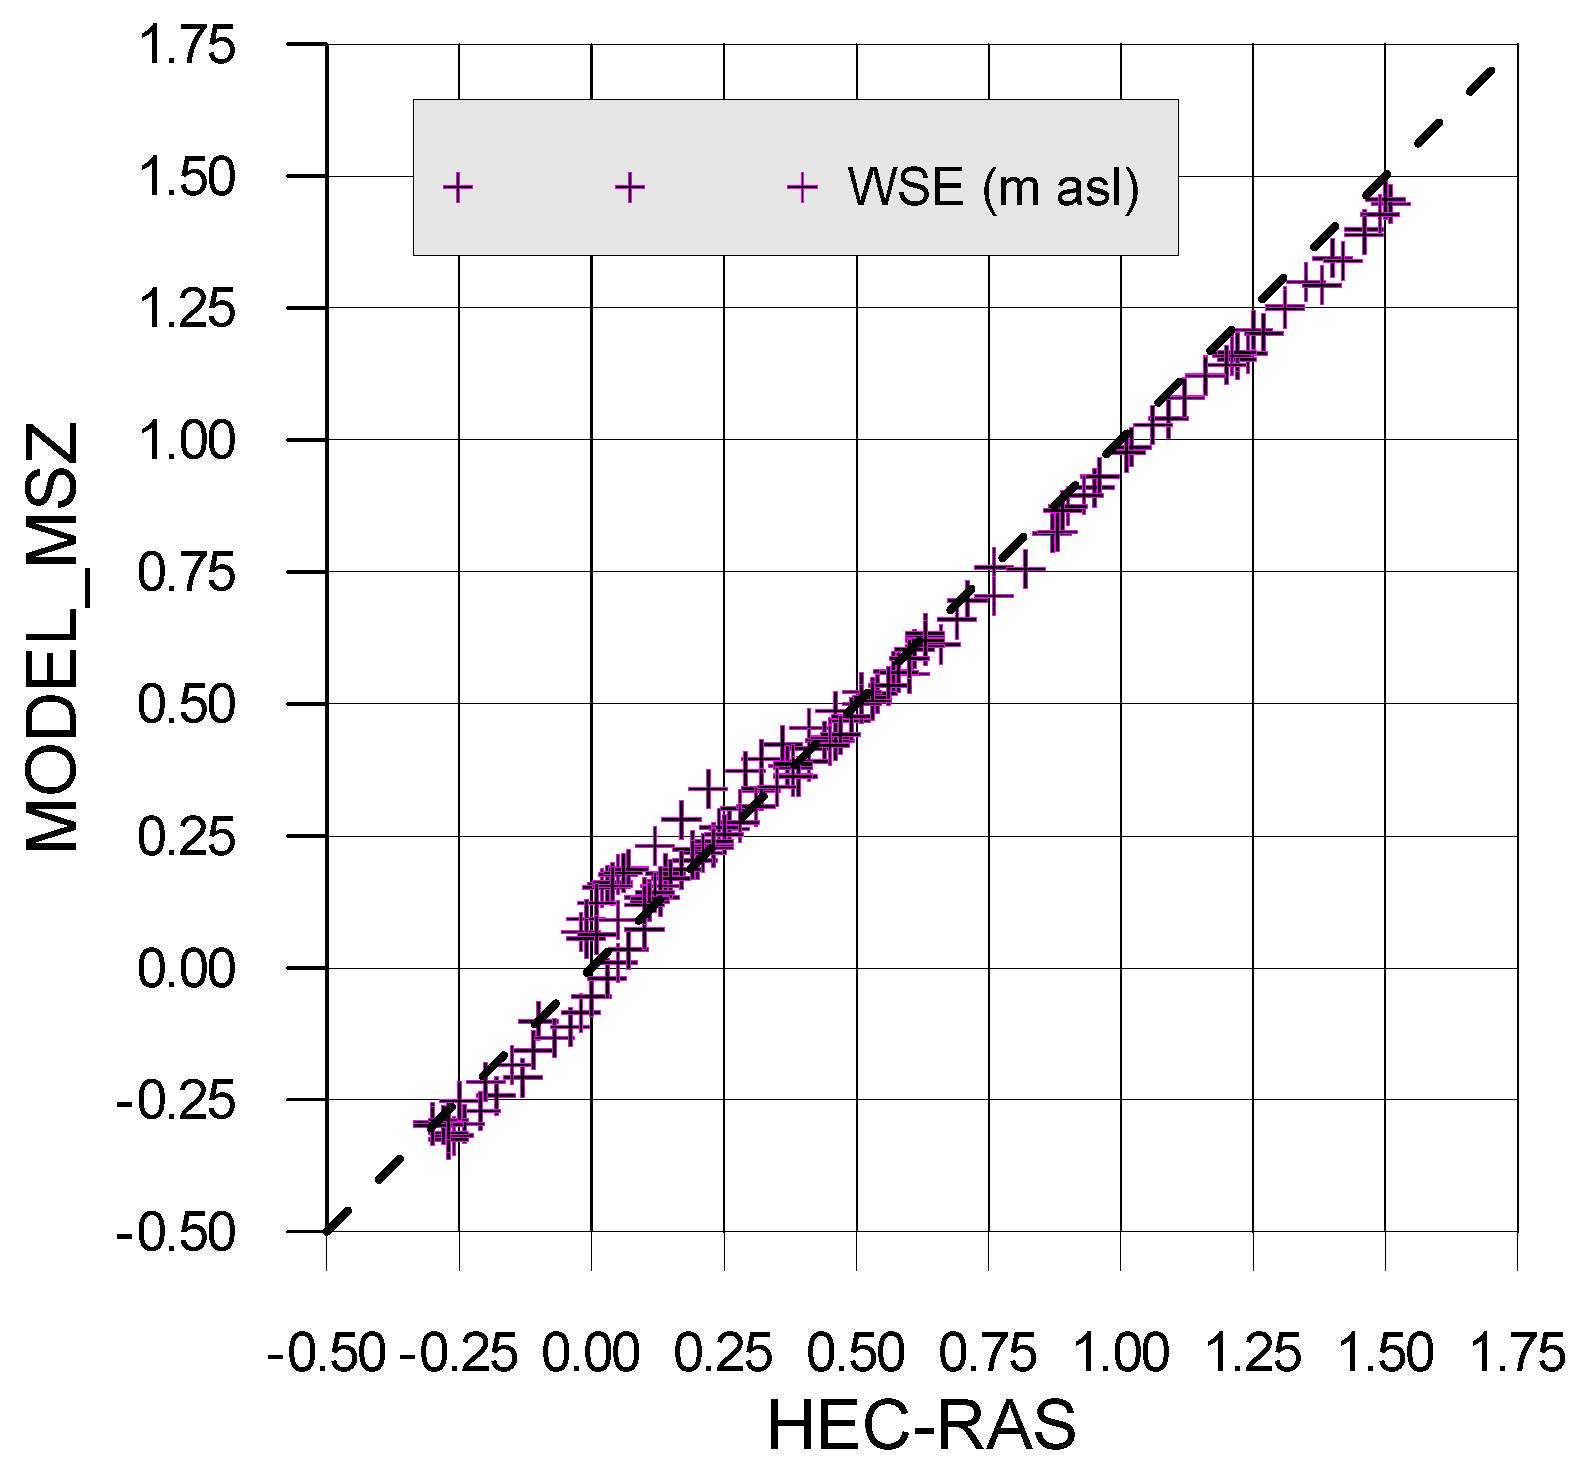
3.1.5. HEC-RAS Model Validation

The validation of the HEC-RAS model of the Vistula Lagoon was possible thanks to the comparison of the calculated water stages at Nowakowo gauging station with IMGW-PIB observations and earlier numerical simulations [11].
The time series plot in Figure 7 shows the observed water levels alongside the two modeled predictions. Both models follow the observed trend well, with minor deviations. For this episode, both our own model MODEL_MSZ and HEC-RAS underestimate the results of water table elevation calculations, especially in the second part of the event.
The statistical performance metrics for the two models are presented in Table 1. The statistical analysis of the modeled water surface elevation at Nowakowo reveals that both computational models exhibit strong accuracy in replicating observed values. The Mean Absolute Error (MAE) and Root Mean Square Error (RMSE) indicate that both models provide similar levels of precision, with HEC-RAS performing slightly better. The Nash-Sutcliffe Efficiency (NSE) values, exceeding 0.93 for both models, confirm their high reliability, as NSE values above 0.9 denote an excellent fit between modeled and observed data. However, a slight systematic underestimation of water levels is observed in both models, as reflected in the bias values, which are negative and of a similar magnitude. This suggests that while the models capture the overall trend effectively, they tend to predict water surface elevations as marginally lower than the actual measurements.
Additionally, the scatter plots in Figure 8 show a strong correlation between observed and modeled values for both models, with most points clustering around the 1:1 reference line. This confirms that both models perform well, with minor underestimation trends.
The scatter plot in Figure 9 comparing Model_MSZ and HEC-RAS demonstrates a strong correlation, suggesting that both models yield comparable water surface elevation results. The majority of the data points align closely along the 1:1 reference line, confirming that the two computational approaches follow a similar pattern in simulating water levels. However, small deviations are noticeable, which may indicate systematic differences in their numerical formulations, parameterizations, or sensitivity to boundary conditions.
To sum up the validation of the HEC-RAS model, it can be stated that the simulation results of the historical storm event that occurred in the Vistula Lagoon in January 2019 sufficiently well represent the actual course of the phenomenon. This means that the HEC-RAS model is well suited for modeling wind-driven storm surges in shallow water bodies, such as lagoons.

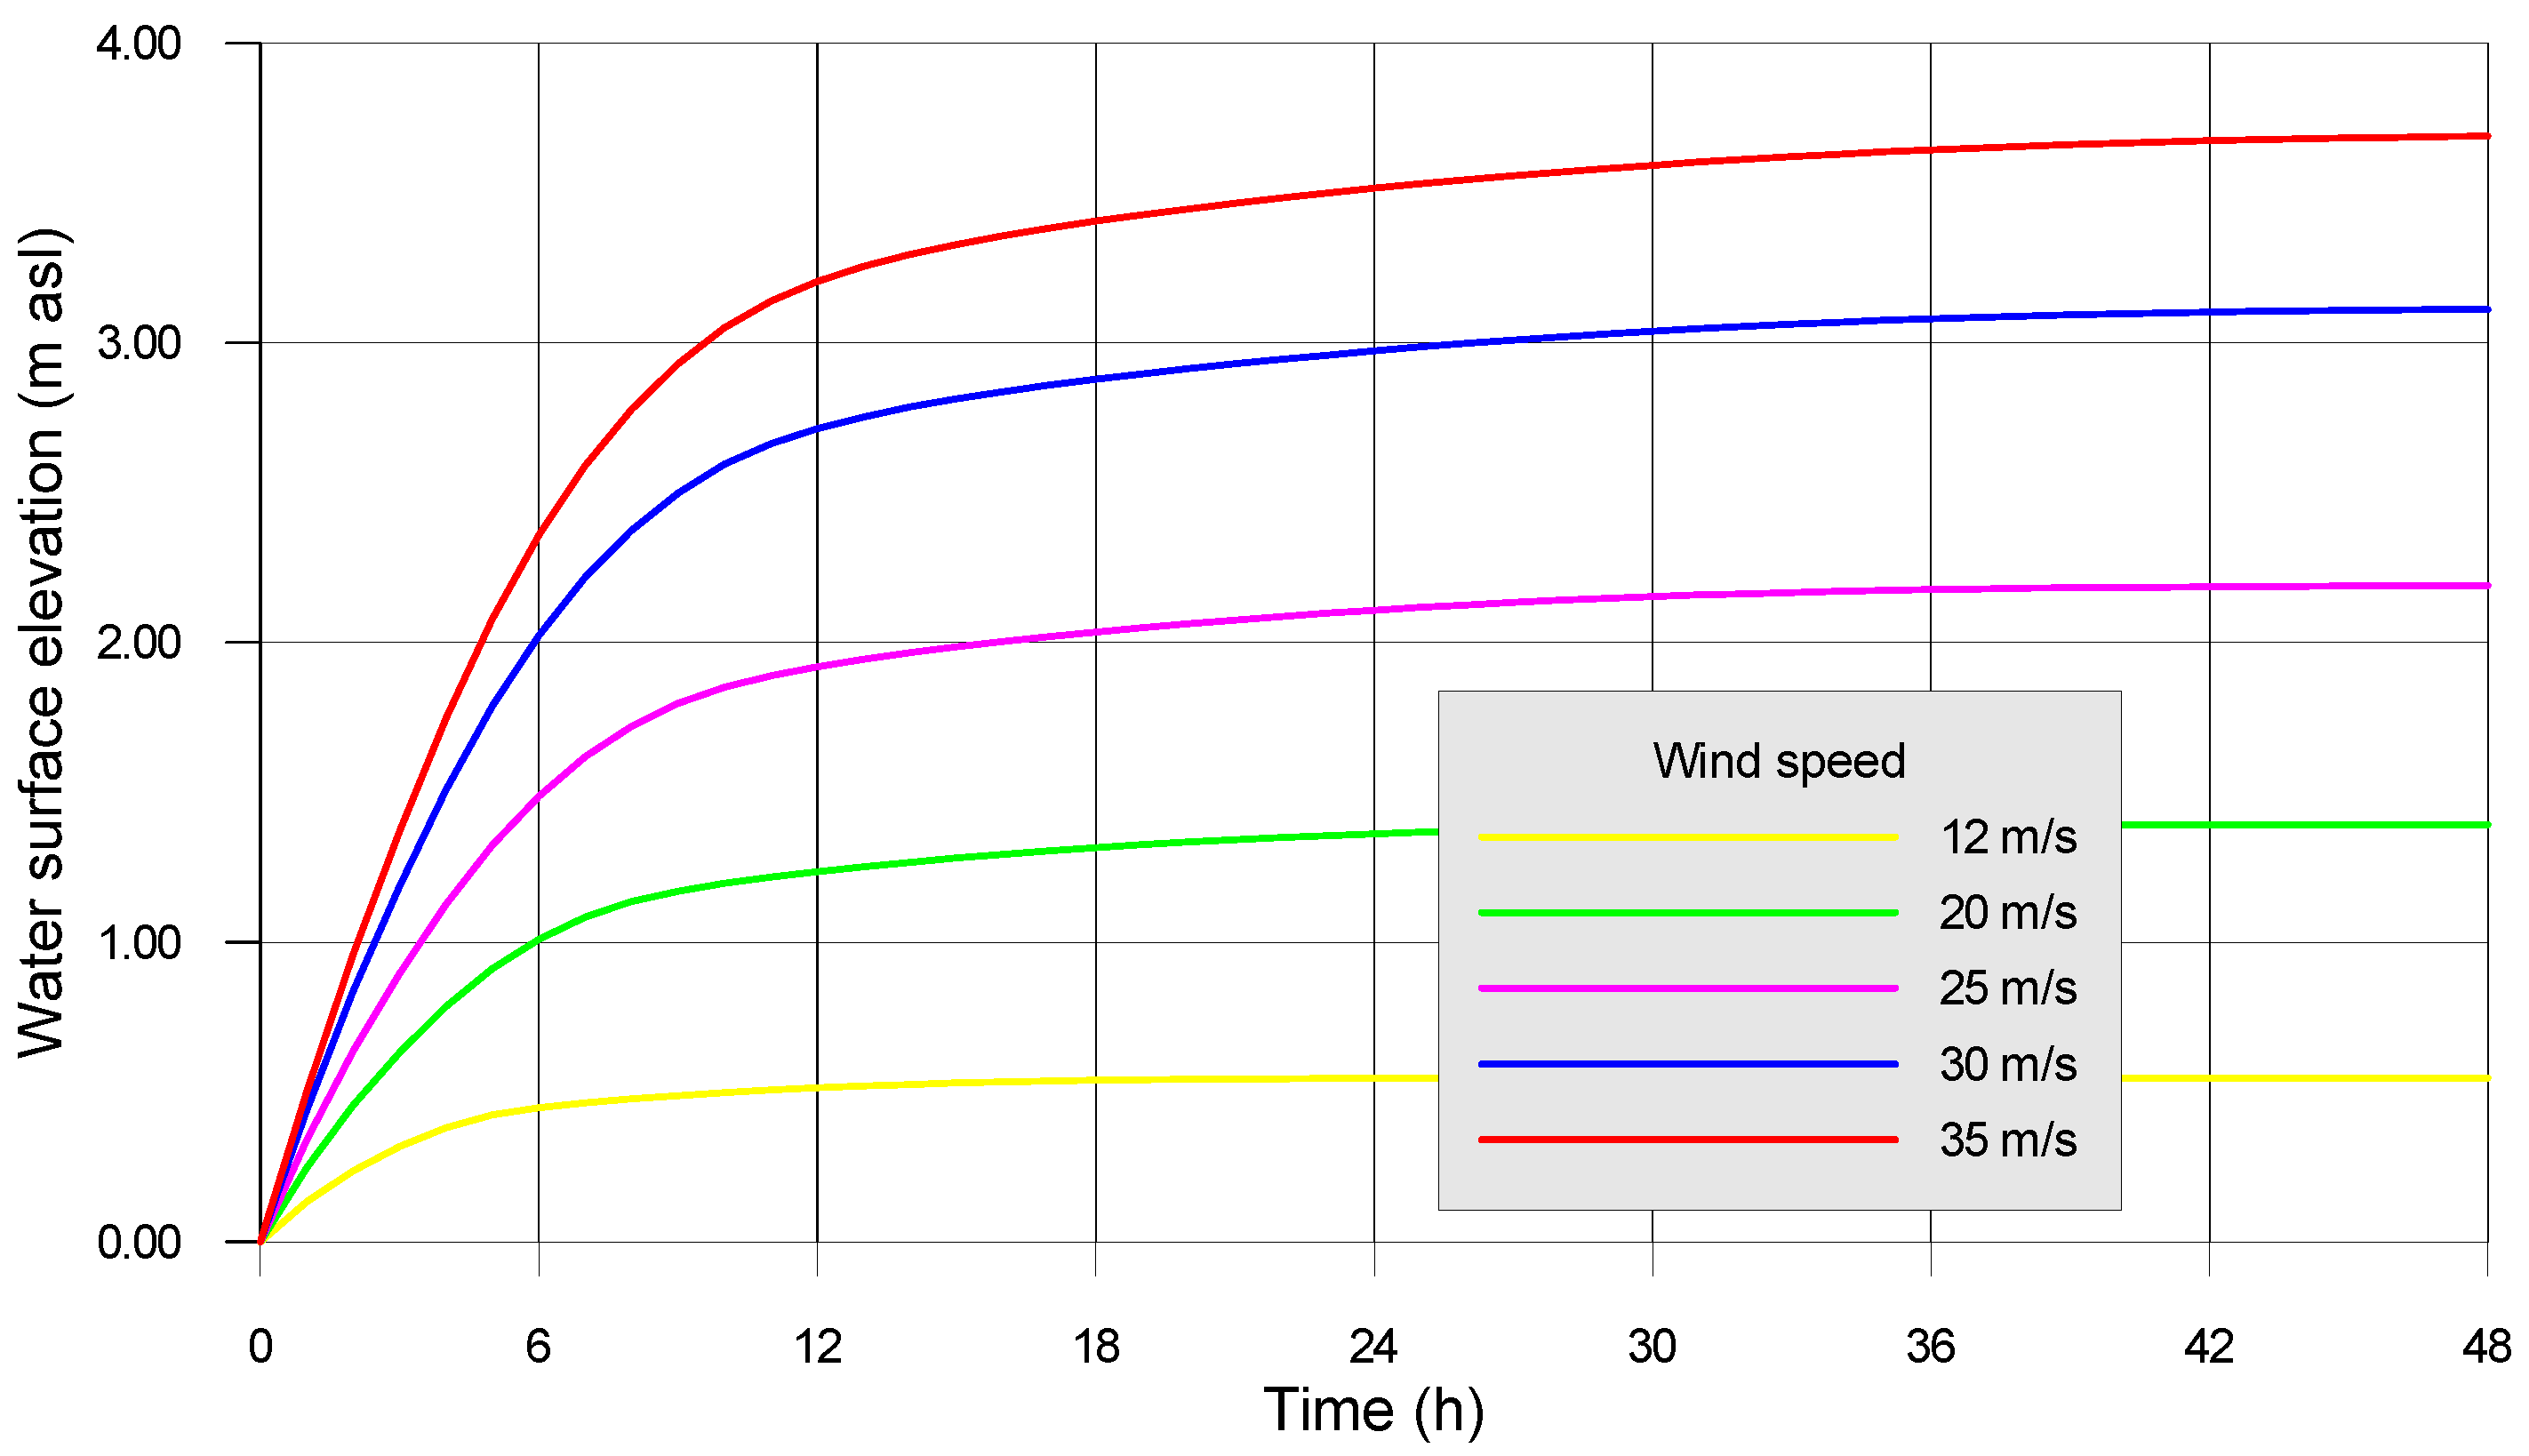
3.2. Synthetic Wind Surge Epizodes

In order to assess the impact of the potential increase in the speed of strong storm winds during extreme events that can be expected in the future on the increase in maximum water levels in the Elbląg city area, five numerical simulations of synthetic storms were performed. In these hypothetical events, it was assumed that initially the water in the Vistula Lagoon would be in a hydrostatic state, with the water surface at 0 m above sea level. Then, the only factor forcing the water movement was the wind blowing from a constant NE direction and with a constant speed. The synthetic wind data were assumed to be 12, 20, 25, 30 and 35 ms−1. The duration of the phenomenon was assumed to be equal to 48 h, which resulted in the almost complete stabilization of the maximum water level in the lagoon in each of the calculation scenarios. All other physical and computational parameters were assumed as in the previously described simulation of the historical episode. The evolution of water stage elevation at Nowakowo gauging station for all five hypothetical scenarios is shown in Figure 10.
The graph illustrates the changes in water level elevation at the southwest end of Vistula Lagoon, due to wind-driven water accumulation. The wind, coming from the northeast (NE), maintains a constant speed for 48 h, leading to a progressive rise in water levels. Higher wind speeds, particularly in the range of 30–35 ms−1, result in more significant and rapid water level increases. The system approaches equilibrium after approximately 48 h, indicating the stabilization of storm surge effects. The response is non-linear, meaning that stronger winds lead to disproportionately higher water accumulation. This analysis highlights the potential impacts of storm surges under climate change conditions, demonstrating how increasing wind intensities could exacerbate coastal flooding risks in the future.
The maximum water levels in the vicinity of Nowakowo for each scenario are presented in Table 2. The results indicate a significant flood hazard for Elbląg due to wind-driven water accumulation in the Vistula Lagoon. In scenarios with wind speeds of 20 ms−1 and higher, the warning level of 0.82 m asl and alarm level of 1.22 m asl are exceeded. With wind speeds of 25 ms−1 or more, water levels reach or exceed 2 m, posing a severe threat of flooding along the Elbląg River, which connects the city to the Vistula Lagoon. Such water levels could result in the overtopping of riverbanks, backflow into urban drainage systems, and increased inundation risks for low-lying areas of Elbląg, Żuławy Elbląskie and Żuławy Wielkie. The trend highlights the growing flood hazard in the context of climate change, where more frequent and intense storms could lead to more severe storm surges. Measures such as reinforced flood defenses, improved drainage infrastructure, and early warning systems would be crucial to mitigating the impacts of these extreme events.

4. Conclusions, Limitations and Future Research

4.1. Conclusions

This study assessed the potential increase in flood hazard for the city of Elbląg due to storm surges in the Vistula Lagoon under changing climatic conditions. The hydrodynamic simulations conducted using the HEC-RAS 2D model demonstrated a strong correlation between wind-driven water accumulation and the flood hazard in the southwestern part of the lagoon.
Key findings of the study include the following:
  • The historical storm surge event of January 2019 was successfully reproduced using the HEC-RAS 2D model, validating its applicability for simulating wind-induced water level changes in shallow lagoons;
  • The numerical simulations of synthetic extreme wind scenarios showed that water levels in the lagoon could exceed 3 m above sea level when wind speeds reach 35 ms−1, significantly surpassing flood warning and alarm thresholds;
  • A non-linear relationship was observed between wind speed and water accumulation, indicating that even moderate increases in storm intensity could lead to disproportionately higher flood hazards.
The results highlight the increasing vulnerability of Elbląg and the surrounding Żuławy Elbląskie polder areas to extreme weather events, emphasizing the need for enhanced flood risk management strategies.

4.2. Limitations

Despite the robustness of the findings, several limitations should be acknowledged:
  • Simplified wind representation. The simulations assumed a time-invariant and spatially uniform wind field over the lagoon, whereas in reality, wind characteristics are unsteady and may vary locally, influencing surge dynamics in a more complex manner.
  • Neglect of additional hydrological inputs. The study focused primarily on wind-driven surges, without considering the potential contribution of river inflows, precipitation, or ice cover effects, which may also influence water levels.
  • Static sea level assumption. The boundary conditions did not incorporate a projected long-term sea level rise due to climate change, which could exacerbate future flood hazards.

4.3. Future Research Directions

To enhance the understanding of flood risks in the Vistula Lagoon and develop more effective adaptation strategies, future research should address the following areas:
  • Integration of dynamic climate projections. The latest IPCC-based climate models to refine predictions of wind intensification and sea level rise effects should be incorporated.
  • Coupling wind surge and precipitation-driven flooding. Compound flooding scenarios in the city of Elbląg that combine storm surges, extreme rainfall, and riverine floods should be investigated.
  • Adaptation and mitigation strategies. The effectiveness of potential flood protection measures, such as storm barriers, retention restoration, and improved drainage infrastructure should be assessed.
In conclusion, while this study provides a valuable preliminary assessment of storm surge-induced flood risks in the Elbląg region, further interdisciplinary research is necessary to refine hazard and risk predictions and develop robust flood management policies in the face of climate change.

Author Contributions

Conceptualization, M.S.; methodology, M.S.; validation, M.S; formal analysis, M.S. and K.G.; investigation, M.S., K.G. and A.W.G.; resources, M.S. and K.G.; data curation, K.G. and A.W.G.; writing—original draft preparation, M.S., K.G. and A.W.G.; writing—review and editing, M.S., K.G. and A.W.G.; visualization, M.S., K.G. and A.W.G. All authors have read and agreed to the published version of the manuscript.

Funding

This research received no external funding.

Institutional Review Board Statement

Not applicable.

Informed Consent Statement

Not applicable.

Data Availability Statement

The raw data supporting the conclusions of this article will be made available by the authors on request.

Conflicts of Interest

The authors declare no conflicts of interest.

Abbreviations

The following abbreviations are used in this manuscript:
SWEShallow water equations
IMGW-PIBPolish Institute of Meteorology and Water Management
HEC-RASHydrologic Engineering Center’s River Analysis System

References

  1. Chubarenko, B.; Margoński, P. The Vistula Lagoon. In Ecology of Baltic Coastal Waters; Schiewer, U., Ed.; Ecological Studies; Springer: Berlin/Heidelberg, Germany, 2008; pp. 167–195. ISBN 978-3-540-73524-3. [Google Scholar]
  2. Cieśliński, R.; Chlost, I. Water Balance Characteristics of the Vistula Lagoon Coastal Area along the Southern Baltic Sea. Baltica 2017, 30, 107–117. [Google Scholar] [CrossRef]
  3. Szymkiewicz, R. Hydrodynamics of Vistula Lagoon. Monography of P.A.S.: Warsaw, Poland, 1992. [Google Scholar]
  4. Łazarenko, N.N.; Majewski, A. Hydrometeorological System of the Vistula Lagoon; Communication Publishing House: Warsaw, Poland, 1975. [Google Scholar]
  5. Szydłowski, M.; Artichowicz, W.; Zima, P. Analysis of the Water Level Variation in the Polish Part of the Vistula Lagoon (Baltic Sea) and Estimation of Water Inflow and Outflow Transport through the Strait of Baltiysk in the Years 2008–2017. Water 2021, 13, 1328. [Google Scholar] [CrossRef]
  6. Szymkiewicz, R. A Mathematical Model of Storm Surge in the Vistula Lagoon, Poland. Coast. Eng. 1992, 16, 181–203. [Google Scholar] [CrossRef]
  7. Kolerski, T.; Zima, P.; Szydłowski, M. Mathematical Modeling of Ice Thrusting on the Shore of the Vistula Lagoon (Baltic Sea) and the Proposed Artificial Island. Water 2019, 11, 2297. [Google Scholar] [CrossRef]
  8. Konieczny, R.; Pińskwar, I.; Kundzewicz, Z. The September 2017 Flood in Elbląg (Poland) in Perspective. Meteorol. Hydrol. Water Manag. 2018, 6, 67–78. [Google Scholar] [CrossRef]
  9. Topiłko, J. Modeling Storm Surge Floods—Case Study Żuławy Elbląskie—Obserwator IMGW-PIB 2021. Available online: https://obserwator.imgw.pl/2021/10/21/modeling-storm-surge-floods-case-study-zulawy-elblaskie/ (accessed on 30 January 2025).
  10. Kistowski, M. Strategic Planning of Flood Protection: A Case Study of „Programme for Żuławy Region—To 2030 Complex Flood Protection”. In Issues of Landscape Conservation and Water Management in Rural Areas; Contemporary Problems of Management and Environmental Protection; University of Warmia and Mazury: Olsztyn, Poland, 2011; Volume 7, pp. 221–231. [Google Scholar]
  11. Szydłowski, M.; Kolerski, T.; Zima, P. Impact of the Artificial Strait in the Vistula Spit on the Hydrodynamics of the Vistula Lagoon (Baltic Sea). Water 2019, 11, 990. [Google Scholar] [CrossRef]
  12. IMGW-PIB Map Hydro. Available online: https://hydro.imgw.pl (accessed on 30 January 2025).
  13. Outten, S.; Sobolowski, S. Extreme Wind Projections over Europe from the Euro-CORDEX Regional Climate Models. Weather Clim. Extrem. 2021, 33, 100363. [Google Scholar] [CrossRef]
  14. Forzieri, G.; Feyen, L.; Russo, S.; Vousdoukas, M.; Alfieri, L.; Outten, S.; Migliavacca, M.; Bianchi, A.; Rojas, R.; Cid, A. Multi-Hazard Assessment in Europe under Climate Change. Clim. Chang. 2016, 137, 105–119. [Google Scholar] [CrossRef]
  15. Busker, T.; van den Hurk, B.; de Moel, H.; Aerts, J.C.J.H. The Value of Precipitation Forecasts to Anticipate Floods. Bull. Am. Meteorol. Soc. 2025, 106, E473–E491. [Google Scholar] [CrossRef]
  16. NatCatSERVICE|Munich Re. Available online: https://www.munichre.com/en/solutions/for-industry-clients/natcatservice.html (accessed on 17 March 2025).
  17. Kjellström, E.; Nikulin, G.; Hansson, U.; Strandberg, G.; Ullerstig, A. 21st Century Changes in the European Climate: Uncertainties Derived from an Ensemble of Regional Climate Model Simulations. Tellus A Dyn. Meteorol. Oceanogr. 2011, 63, 24–40. [Google Scholar] [CrossRef]
  18. Intergovernmental Panel On Climate Change (IPCC). Climate Change 2021—The Physical Science Basis: Working Group I Contribution to the Sixth Assessment Report of the Intergovernmental Panel on Climate Change, 1st ed.; Cambridge University Press: Cambridge, UK, 2023; ISBN 978-1-00-915789-6. [Google Scholar]
  19. Little, A.S.; Priestley, M.D.K.; Catto, J.L. Future Increased Risk from Extratropical Windstorms in Northern Europe. Nat. Commun. 2023, 14, 4434. [Google Scholar] [CrossRef] [PubMed]
  20. Rasool, S.I.; Menenti, M.; Bolle, H.-J. Second Assessment of Climate Change for the Baltic Sea Basin; Springer: Berlin/Heidelberg, Germany, 2015; ISBN 978-3-319-16005-4. [Google Scholar]
  21. Donat, M.G.; Leckebusch, G.C.; Wild, S.; Ulbrich, U. Future Changes in European Winter Storm Losses and Extreme Wind Speeds Inferred from GCM and RCM Multi-Model Simulations. Nat. Hazards Earth Syst. Sci. 2011, 11, 1351–1370. [Google Scholar] [CrossRef]
  22. Nikulin, G.; Kjellström, E.; Hansson, U.; Strandberg, G.; Ullerstig, A. Evaluation and Future Projections of Temperature, Precipitation and Wind Extremes over Europe in an Ensemble of Regional Climate Simulations. Tellus A Dyn. Meteorol. Oceanogr. 2011, 63, 41–55. [Google Scholar] [CrossRef]
  23. Meier, H.E.M.; Kniebusch, M.; Dieterich, C.; Gröger, M.; Zorita, E.; Elmgren, R.; Myrberg, K.; Ahola, M.P.; Bartosova, A.; Bonsdorff, E.; et al. Climate Change in the Baltic Sea Region: A Summary. Earth Syst. Dyn. 2022, 13, 457–593. [Google Scholar] [CrossRef]
  24. Brunner, G.W. HEC-RAS River Analysis System 2D Modeling User’s Manual; US Army Corps of Engineers—Hydrologic Engineering Center: Davis, CA, USA, 2016. [Google Scholar]
  25. Amaliah, R.; Ginting, B.M. Investigating the Capability of HEC-RAS Model for Tsunami Simulation. J. Civ. Eng. Forum 2023, 9, 161–180. [Google Scholar] [CrossRef]
  26. Costabile, P.; Costanzo, C.; Ferraro, D.; Macchione, F.; Petaccia, G. Performances of the New HEC-RAS Version 5 for 2-D Hydrodynamic-Based Rainfall-Runoff Simulations at Basin Scale: Comparison with a State-of-the Art Model. Water 2020, 12, 2326. [Google Scholar] [CrossRef]
  27. Saini, D.S.; Barik, D.K. Simulation of the Hydraulic Model HEC-RAS Coupled with GIS and Remote Sensing to Study the Effect of River Cross-Section Width in Detecting Flood-Prone Areas. J. Geol. Soc. India 2024, 100, 367–376. [Google Scholar] [CrossRef]
  28. Shaikh, A.A.; Pathan, A.I.; Waikhom, S.I.; Agnihotri, P.G.; Islam, M.d.N.; Singh, S.K. Application of Latest HEC-RAS Version 6 for 2D Hydrodynamic Modeling through GIS Framework: A Case Study from Coastal Urban Floodplain in India. Model. Earth Syst. Environ. 2023, 9, 1369–1385. [Google Scholar] [CrossRef]
  29. Alia, F.; Rendana, M.; Idris, W.M.R.; Sarino, S.; Yuono, A.L. Flood Mapping Using HEC-RAS and GIS: A Case Study of Palembang Watersheds. J. Adv. Res. Appl. Sci. Eng. Technol. 2024, 61, 138–150. [Google Scholar] [CrossRef]
  30. Amoussou, E.; Amoussou, F.T.; Bossa, A.Y.; Kodja, D.J.; Totin Vodounon, H.S.; Houndénou, C.; Borrell Estupina, V.; Paturel, J.-E.; Mahé, G.; Cudennec, C.; et al. Use of the HEC RAS Model for the Analysis of Exceptional Floods in the Ouémé Basin. Proc. IAHS 2024, 385, 141–146. [Google Scholar] [CrossRef]
  31. Latif, F.; Hakim, A. Utilization of hec-ras 2d for flood influence modeling due to peak discharge of walanae river in wajo district. J. Inform. Dan Tek. Elektro Terap. 2025, 13, 1529–1539. [Google Scholar] [CrossRef]
  32. Milišić, H.; Hadžić, E. Estimation of Channel and Flood Plain Roughness Using HEC-RAS Model: A Case Study of the Veseočica River, Bosnia and Herzegovina. IOP Conf. Ser. Mater. Sci. Eng. 2023, 1298, 012031. [Google Scholar] [CrossRef]
  33. Zeiger, S.J.; Hubbart, J.A. Measuring and Modeling Event-Based Environmental Flows: An Assessment of HEC-RAS 2D Rain-on-Grid Simulations. J. Environ. Manag. 2021, 285, 112125. [Google Scholar] [CrossRef] [PubMed]
  34. Muñoz, D.F.; Yin, D.; Bakhtyar, R.; Moftakhari, H.; Xue, Z.; Mandli, K.; Ferreira, C. Inter-Model Comparison of Delft3D-FM and 2D HEC-RAS for Total Water Level Prediction in Coastal to Inland Transition Zones. JAWRA J. Am. Water Resour. Assoc. 2022, 58, 34–49. [Google Scholar] [CrossRef]
  35. Pandey, S.; Rao, A.D.; Haldar, R. Modeling of Coastal Inundation in Response to a Tropical Cyclone Using a Coupled Hydraulic HEC-RAS and ADCIRC Model. J. Geophys. Res. Ocean. 2021, 126, e2020JC016810. [Google Scholar] [CrossRef]
  36. Szydłowski, M. Wind Surge Modeling in the Vistula Lagoon Using HEC-RAS 2D—Today’s and Tomorrow’s Perspective. In Proceedings of the XLII International School of Hydraulics, Radocza, Poland, 20–23 May 2025. [Google Scholar]
  37. Cieśliński, R.; Chlost, I.; Szydłowski, M. Impact of New, Navigable Canal through the Vistula Spit on the Hydrologic Balance of the Vistula Lagoon (Baltic Sea). J. Mar. Syst. 2024, 241, 103908. [Google Scholar] [CrossRef]
  38. Chubarenko, B.V.; Zakirov, R.B. Water Exchange of Nontidal Estuarine Coastal Vistula Lagoon with the Baltic Sea. J. Waterw. Port Coast. Ocean Eng. 2021, 147, 05021005. [Google Scholar] [CrossRef]
  39. Breś, J.; Lorens, P. Shaping the New Vistula Spit Channel: Political, Economic, and Environmental Aspects. Urban Plan. 2023, 8, 275–288. [Google Scholar] [CrossRef]
  40. Szydłowski, M.; Kolerski, T. Hydrodynamic Model of the New Waterway through the Vistula Spit. Pol. Marit. Res. 2020, 27, 159–167. [Google Scholar] [CrossRef]
  41. Cieśliński, R.; Lewandowski, A. Hydrological regime of the Vistula Lagoon and the possible changes due to the construction of the waterway connecting the Vistula Bay with the Gulf of Gdansk. Inżynieria Morska I Geotech. 2013, 1, 69–78. [Google Scholar]
  42. Bielecka, M.; Kazmierski, J. A 3d Mathematical Model of Vistula Lagoon Hydrodynamics—General Assumptions and Results of Preliminary Calculations. Ground Water 2003, 80, 2–4. [Google Scholar]
  43. Fourniotis, N.T.; Horsch, G.M.; Leftheriotis, G.A. On the Hydrodynamic Geometry of Flow-Through versus Restricted Lagoons. Water 2018, 10, 237. [Google Scholar] [CrossRef]
  44. Fourniotis, N.T.; Leftheriotis, G.A.; Horsch, G.M. Towards Enhancing Tidally-Induced Water Renewal in Coastal Lagoons. Environ. Fluid Mech. 2021, 21, 343–360. [Google Scholar] [CrossRef]
  45. Hsu, S.-A. Coastal Meteorology; Academic Press Inc.: San Diego, California, USA, 1988; ISBN 978-0-08-050215-1. [Google Scholar]
  46. Tan, W. Shallow Water Hydrodynamics; Elsevier Science: Amsterdam, The Netherlands, 1992. [Google Scholar]
Figure 1. Vistula Lagoon (blue), Żuławy low-lands (green) and city of Elbląg (based on [11]).
Applsci 15 05654 g001
Figure 2. Location of Nowakowo and Elbląg gauging stations (blue triangles, based on [12]).
Applsci 15 05654 g002
Figure 3. Water stage elevation measured by IMGW-PIB at gauging stations.
Applsci 15 05654 g003
Figure 4. Wind parameters measured by IMGW-PIB.
Applsci 15 05654 g004
Figure 5. HEC-RAS 2D numerical mesh (gray grid) against the background of DEM (color scale).
Applsci 15 05654 g005
Figure 6. Calculated longitudinal profiles of the water surface in the Vistula Lagoon.
Applsci 15 05654 g006
Figure 7. Observed vs. modeled water stage elevation at Nowakowo.
Applsci 15 05654 g007
Figure 8. Scatter plots of observed vs. modeled water stage elevation at Nowakowo.
Applsci 15 05654 g008
Figure 9. Scatter plot of WSE at Nowakowo calculated with own model and HEC-RAS.
Applsci 15 05654 g009
Figure 10. Calculated water stage elevation at Nowakowo for synthetic wind scenarios.
Applsci 15 05654 g010
Table 1. Statistical metrics for hydrodynamics models.
MetricModel_MSZModel_HEC_RAS
MAE (m)0.11260.1088
RMSE (m)0.12830.1243
NSE0.93000.9343
Bias (m)−0.0994−0.1051
Table 2. Water accumulation in the SW part of the Vistula Lagoon depending on the wind speed.
Speed of NE Wind (ms−1)1220253035
Water stage elevation (m asl)0.551.402.193.123.69
Disclaimer/Publisher’s Note: The statements, opinions and data contained in all publications are solely those of the individual author(s) and contributor(s) and not of MDPI and/or the editor(s). MDPI and/or the editor(s) disclaim responsibility for any injury to people or property resulting from any ideas, methods, instructions or products referred to in the content.

