Article

Research on the Implementation Effect of Incentive Policies for Prefabricated Buildings Based on System Dynamics: A Chinese Empirical Study

1
School of Civil Engineering, Shenyang Jianzhu University, Shenyang 110168, China
2
School of Civil Engineering, Central South University, Changsha 410083, China
*
Author to whom correspondence should be addressed.
Appl. Sci. 2025, 15(10), 5627; https://doi.org/10.3390/app15105627
Submission received: 17 April 2025 / Revised: 13 May 2025 / Accepted: 16 May 2025 / Published: 18 May 2025

Abstract

Incentive policies for prefabricated buildings (PBIP) can effectively promote the development of prefabricated buildings (PB) and improve the sustainability of the construction industry, attracting increasing attention from academia and industry. The government has issued many PBIPs (including land policy, plot ratio reward policy, fund policy, financial support policy, preferential tax policy, research and development support policy, and construction process management policy) but the implementation effect of PBIP remains to be clarified, especially regarding the research gap from a dynamic perspective. This study proposes an analytical framework of policy implementation effect based on the chain of “policy text content–policy impact path–policy implementation effect”, aiming to analyze the implementation stage and effect of PBIPs using the system theory analysis method. Combining the main factors affecting the PBIP impact system, a quantitative model containing 50 variables is established based on the system dynamics (SD) model. Finally, using Shenyang, one of China’s first PB pilot cities, as an example, the system simulation and sensitivity analysis of main parameters are carried out in Vensim software. The research results indicate that PBIP in Shenyang has not been fully utilized and targeted improvements and strengthened implementation of PBIP are needed. In the simulation of individual policies, the implementation effect of fund policy is the best, and the impact of research and development support policy on carbon reduction is the most significant. The promotional effect of the policy combination on PB development is more prominent. Using the policy combination reasonably is necessary to leverage the incentive effect fully. Simulation and sensitivity analysis results provide valuable insights for government departments to enhance the implementation effectiveness of the existing PBIP. This study responds to the global trend of promoting sustainable building development. It proposes a new framework for systematically analyzing the implementation effects of PBIPs, filling the research gap in policy evaluation from a dynamic perspective. Its methods and findings are not only applicable to the Chinese context but also provide valuable experience for other countries to develop and optimize PBIPs.

1. Introduction

With the rapid development of the construction industry, its extensive construction modes have caused severe resource waste and pollution [1]. The prefabricated building (PB) realizes the industrialized production of buildings and has the advantages of resource conservation and reduced environmental pollution [2,3]. The development of PBs can enhance the construction industry’s sustainable development [4,5], making it an inevitable choice for transforming and upgrading the traditional construction industry [6]. As the world’s largest developing country, China has the most significant construction scale globally, generating over 2 billion tons of construction waste annually and accounting for one-third of the world’s carbon dioxide emissions [7]. To address issues such as high resource consumption and severe construction pollution, the Chinese government urgently needs to promote the use of PB. However, PBs face limitations such as high costs and a limited pool of professional and technical personnel [8], and the PB market is immature and small in scale. The incentive policies for prefabricated buildings (PBIPs) refer to the encouraging policy measures formulated and implemented by the government in land supply, financial support, market management, and other aspects to promote PB [9]. They enhance the application of PBs by stimulating the productivity of all parties [10]. For a long time, incentive policies for prefabricated buildings (PBIPs) have been regarded as a driving force for promoting the application of PBs [11,12,13], aiding in overcoming various constraints encountered during the development process of PB [10,14]. Countries worldwide have also implemented numerous PBIPs as government intervention tools [15]. Developed countries such as Europe, America, and Singapore started researching and applying PBs earlier and have already formed a complete policy system [16]. As early as 1945, the British government proposed using industrialized building technology to replace traditional construction methods and provided subsidies and public investment to promote PBs [8,17]. Since 1976, the United States has introduced multiple codes and standards for the PB industry, which still guide the development of PB [18]. The Singaporean government has proposed a series of PBIPs, such as prioritizing land supply, tax incentives, and cash rewards, which have extensively promoted the scale of PBs in Singapore [19]. In recent years, Chinese central and local governments have issued many PBIPs to help promote the application of PBs [20,21]. Presently, the types and quantities of PBIP in China are complete but, compared with developed countries, the systematic synergy and implementation of incentive policies for PB are relatively poor [22,23]. At present, the implementation effect of PBIP is not known, and the promotion effect of PBIP on applying PB is not significant [10]. To enhance the promotional impact of PBIP on the development of PBs, it is imperative to research the implementation outcomes of PBIP and put forward scientifically viable suggestions for policy improvement.
The academic community has conducted rich research on PBIPs, mainly evaluating policy texts, policy performance, and policy effects. Firstly, some literature has reviewed the policy texts of PBIP and emphasized the importance of these texts for PBs but did not propose an impact mechanism for the implementation process of the PBIP [18,24]. Secondly, existing research on the performance and implementation effectiveness of PBIPs mainly focuses on a static perspective, evaluating the effectiveness of policies through the sorting and comparative analysis of policy texts, lacking dynamic consideration of the policy implementation process [22,25]. Third, most of the literature mainly studies from the standpoint of government departments, real estate enterprises, and consumers without considering all the stakeholders of PBIPs [26,27]. To get a comprehensive and objective assessment of PBIP, the study needs to consider all its stakeholders.
To fill this knowledge gap, this paper studies the influence mechanism and implementation effect of the PBIP. System dynamics (SD) is often used to solve complex and dynamic system problems and predict the dynamic trend of the system based on scenario simulation [28,29]. This study uses SD theory to establish a dynamic model of the implementation effect of the PBIP. From the perspective of all stakeholders of the PBIP, simulating and verifying the implementation effects of PBIPs fills a gap in the dynamic system modelling research on policy evaluation in the existing literature. The evaluation results can help policymakers identify key weak links in current policies, optimize policy combination design, and enhance the practical guidance role of PBIPs in promoting PBs. It also provides a reference for the government to formulate and implement the effective PBIP. This paper proposes three fundamental problems to be solved: (1) revealing the impact path of PBIPs on the development of PB and analyzing the critical role of PBIPs; (2) an innovative evaluation model based on SD has been established to reflect the dynamic process and system feedback of PBIP implementation; and (3) evaluate the effectiveness of PBIPs through simulation and sensitivity analysis, and propose improvement suggestions for PBIPs. Therefore, the primary objective of this study is to assess the implementation effect of PBIPs from a dynamic perspective and offer recommendations for enhancing and refining PBIPs.
The remainder of this paper is organized as follows: Section 2 summarizes the research status of PBIPs. Section 3 explains the research methods, analyzes the influence mechanism of PBIPs, and establishes an SD model. Section 4 discusses the simulation and sensitivity analysis of PBIPs. Section 5 discusses the research results and puts forward policy suggestions. Finally, this research is summarized in Section 6.

2. Literature Review

2.1. Research on PBIP

In recent years, sustainable development in the construction industry has become a global consensus. The United Nations’ Sustainable Development Goals clearly emphasize the importance of promoting sustainable development in the construction industry [30]. PBIPs promote the application of prefabricated buildings, which helps improve resource utilization efficiency, reduce construction waste and carbon emissions, and achieve sustainable development goals [9]. PBIPs are not only an essential tool for promoting the development of green buildings at the national level but also a key strategy for implementing the international sustainable development agenda. Therefore, the academic community has conducted extensive discussions on PBIPs. For a long time, scholars have paid attention to the text content of PBIPs, emphasized the importance of text measurement in policy research, and conducted qualitative research on its validity based on text mining and content analysis [8,31]. Research shows that the government must release PBIPs to improve the application scale of PBs and formulate targeted incentive policies that consider the policy’s benefit goal [32,33]. With the increase in the number of PBIPs, some scholars have carried out research from a quantitative perspective. The PBIP is classified, and the evaluation index system of PBIPs is established from capital, land, construction, and technical support [23]. Zhang, et al. (2018) used the PMC index model to study the effectiveness of the five policies issued by China from 2014 to 2017 [24]. The results show that the PBIP has been paid attention to by the government, and the policy system is gradually maturing.
With the continuous improvement of the text content of PBIPs, the following documents analyse their implementation effect. The introduction and application of PBIPs have improved the growth rate of indicators such as the number of prefabricated component suppliers, PB area, the ratio of PB area, the size of the PB market, and the reduction of carbon emissions in the construction industry [15,34], which has a positive impact on construction performance. However, not all PBIPs have sound implementation effects. On the one hand, the promotion effect of different PBIPs on the development of PBs is different. On the other hand, the needs of stakeholders for policy tools are different [35]. Detailed quantitative policies need to be formulated to produce a significant promotion effect [36]. Land supply, tax preference, and financial support policies are the most cost-effective [10]. Reputation and financial incentive policies are effective in increasing real estate enterprises’ willingness to adopt PB [13]. Policy tools such as technology development, talent support, and public services also deserve attention. The above research only interprets the effect of the PBIP from the perspective of performance evaluation, and the dynamic impact of PBIPs on the development of PBs is insufficiently considered [37].
The following studies used game theory to study the PBIP and analyzed the effect of the primary beneficiaries of the PBIP on the development of PBs. First of all, in the game study of both sides, the incentive behavior of the government affects prefabricated component suppliers and real estate enterprises, especially the fiscal and tax policies that effectively promote the prefabricated component suppliers to provide prefabricated components [38]. Through financial subsidies, fund incentives, technical support, and other incentives, the government helps reduce real estate enterprises’ production costs and improve the popularity of PBs in the construction market [39]. However, some real estate enterprises’ response to the incentive policy is insufficient, hindering the policy’s application and implementation [40]. The government must also fully play its guiding role and encourage real estate enterprises to participate actively in applying for PBs. As buyers of PBs, consumers play an essential role in promoting their development. Scholars began to explore the tripartite game among the government, real estate enterprises, and consumers [41]. The government formulates a perfect fund compensation system to relieve the financial pressure on real estate enterprises and consumers, reduce the additional cost of real estate enterprises, improve consumers’ acceptance of PBs, and improve the scale [42,43]. Contractors play an important role in applying PBs, and incentive policies focusing on real estate companies and consumers also need to consider contractors [26]. Therefore, a four-party evolutionary game model of contractors, real estate enterprises, consumers, and government has been established. It proposes improving reward and punishment mechanisms, regulatory systems, and information transparency to avoid policy implementation obstacles [44]. At present, relevant research mainly focuses on the perspectives of the government, real estate enterprises, and consumers without considering all stakeholders who benefit from PBIPs [45].
In summary, although scholars have conducted in-depth research on PBIPs from the perspectives of policy text content, implementation performance, and multi-party games, there are still shortcomings. Firstly, existing research emphasizes the static analysis of text content and fails to reveal the dynamic impact mechanism of PBIPs on the development of PBs, lacking a tracking of the long-term evolution path of policies. Secondly, most empirical studies are limited to the improvement of performance indicators and overlook the differential effects of different policy tool combinations at different stages of development. Thirdly, although some scholars have attempted to construct game models and introduce multiple perspectives, the current analysis still primarily focuses on the government, real estate enterprises, and consumers. The behavioral logic and feedback mechanisms of contractors and other stakeholders have not been systematically integrated, and research on the interaction process and feedback effects among stakeholders remains insufficient. In addition, research on the effectiveness of policy implementation is based on analyzing the content of the text, considering all stakeholders of PBIPs, examining the impact road of PBIP implementation, and exploring the effectiveness of PBIP implementation. Therefore, this study considers all stakeholders of PBIPs from a dynamic perspective and adopts the research chain of “policy text content–policy impact path–policy implementation effect” to examine the implementation effect of PBIPs [46].

2.2. The Application of SD in the Research of Policy Implementation Effect
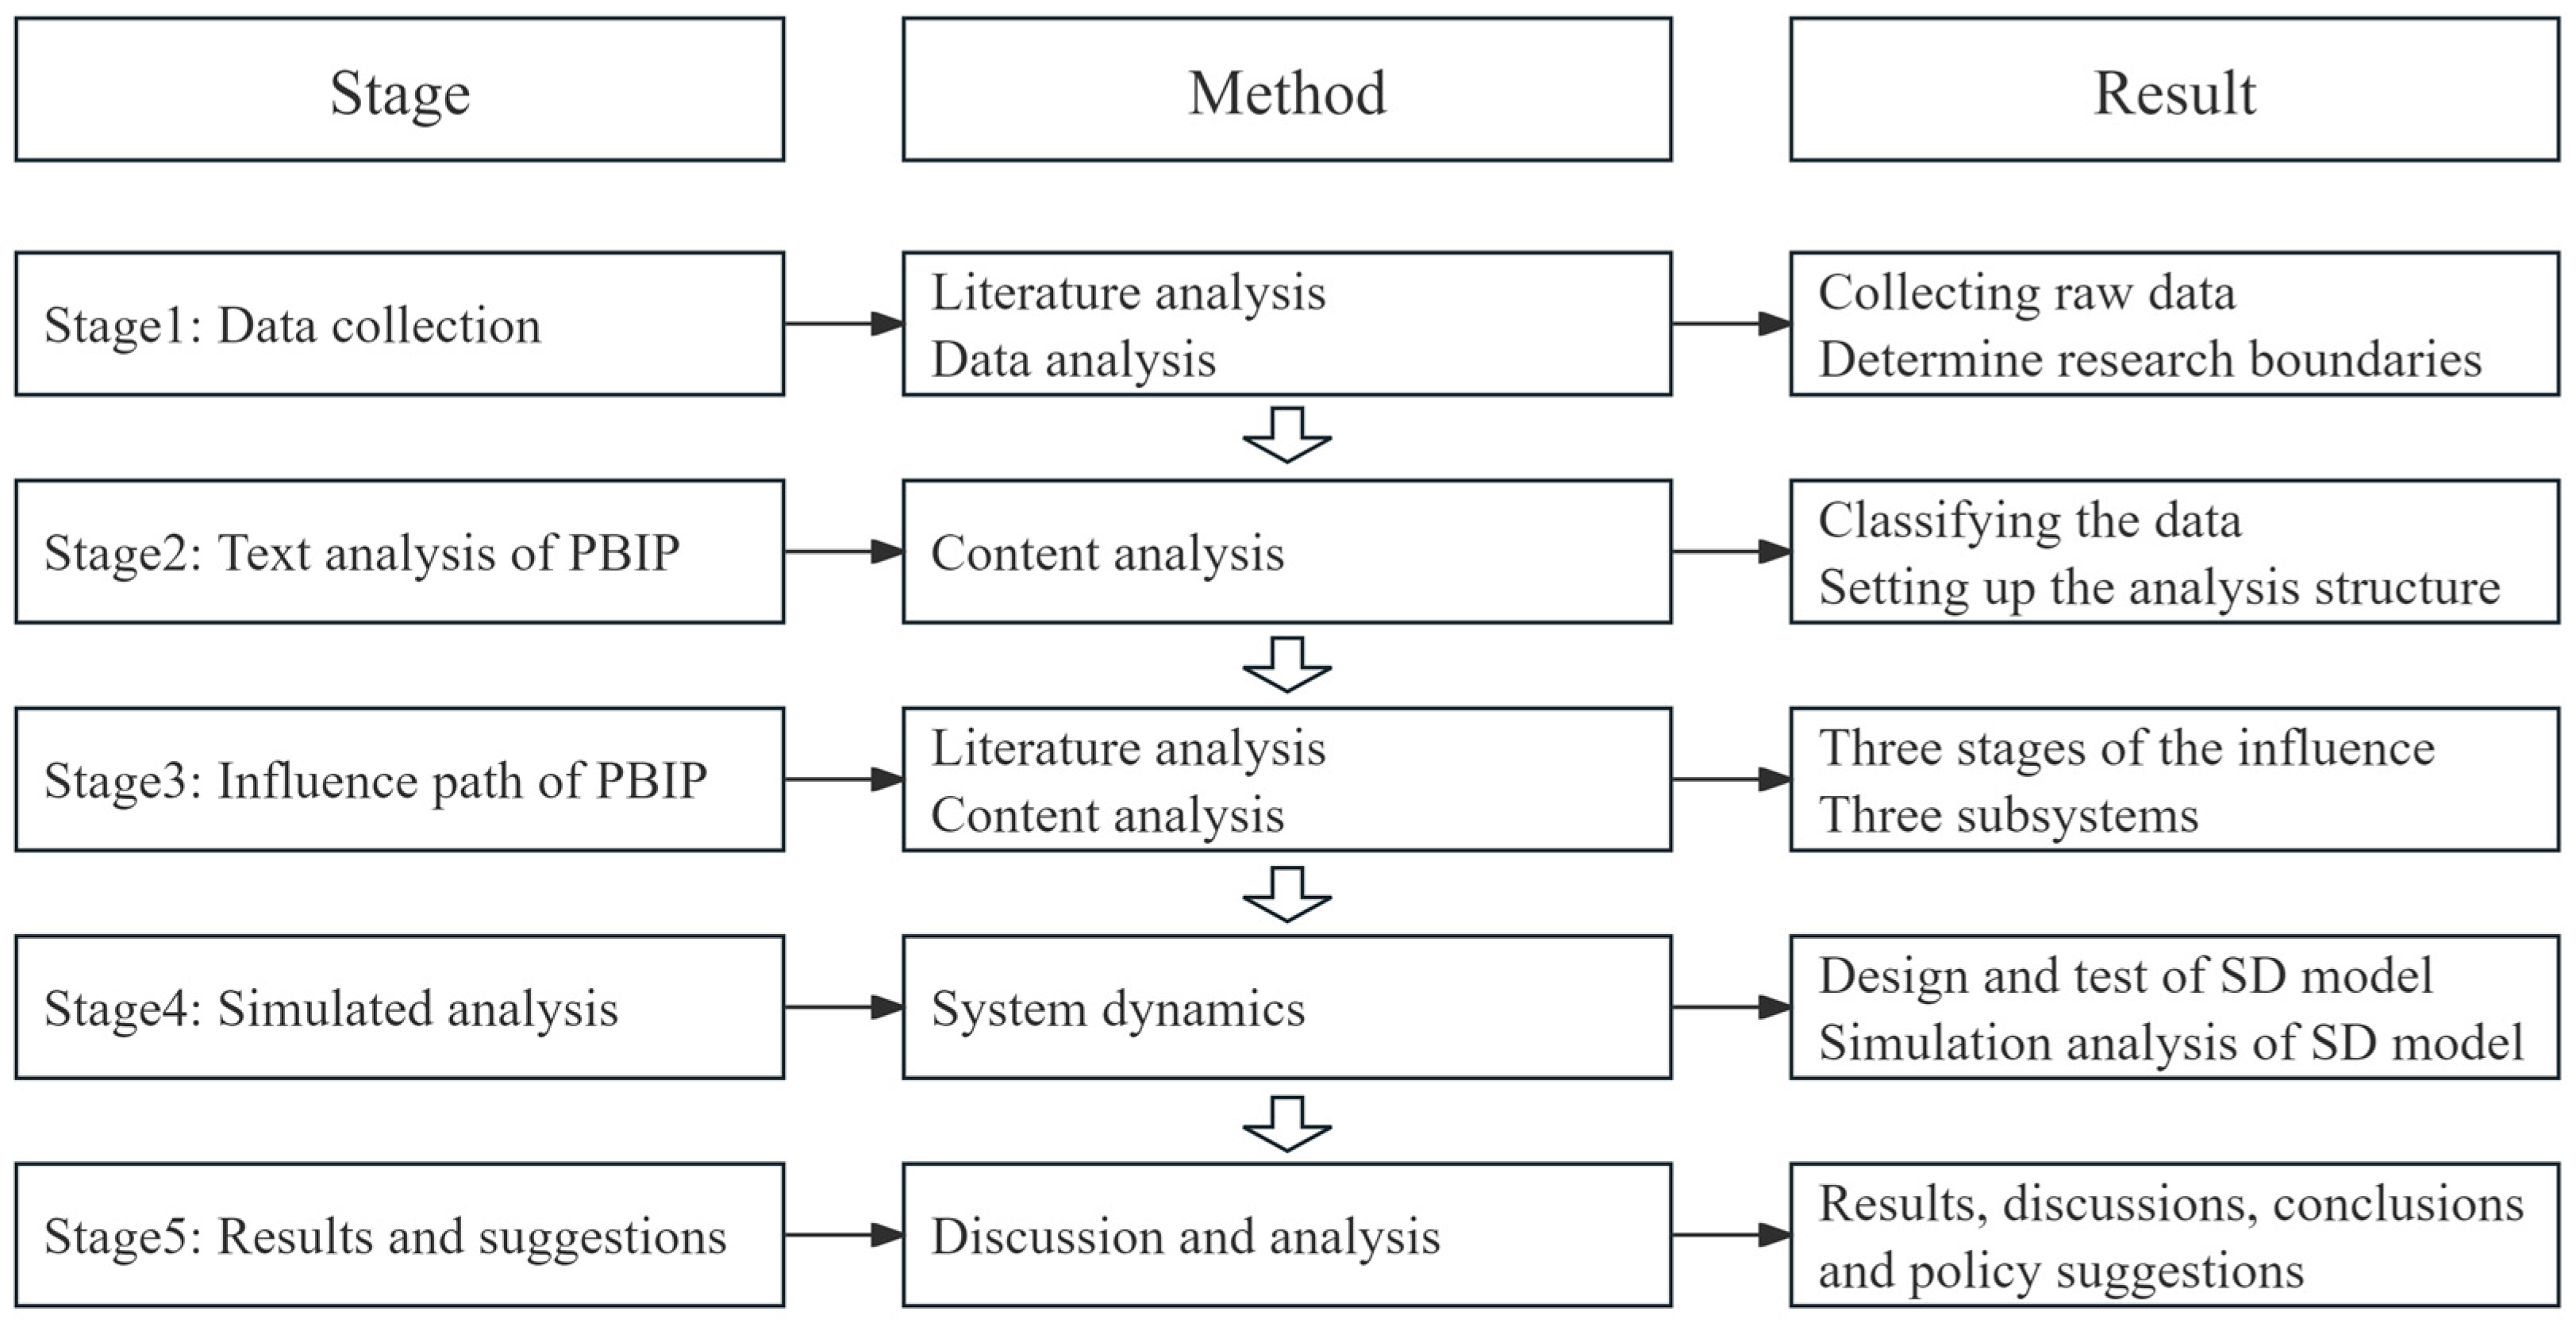
SD is a branch of management science that analyzes the interactive behavior and feedback mechanisms of multiple actors in a system through modeling and simulation [47,48]. The SD model and systems thinking approach has been widely applied in policy impact and evaluation [41]. Compared with traditional quantitative methods, the systematic and forward-looking features of SD are more suitable for evaluating policy implementation [49]. SD has long been widely applied in policy research in the social, economic, and environmental fields, such as the EU’s agricultural environmental policy [50], Latvia’s energy policy [51], and Singapore’s long-term care policy [52]. Many stakeholders are involved in the PBIP, mainly government, real estate enterprises, contractors, prefabricated component suppliers, consumers, and research institutes [45,53]. Considering the complexity of incentive policies’ impact on the promotion of PB and their dynamic influence, it is reasonable to use SD to evaluate the implementation effect of PBIPs.

3. Methodology

3.1. Data Sources

As the central city in Northeast China, Shenyang actively promotes the development of PBs. In 2011, Shenyang became China’s first pilot city for the modern construction industry. In 2014, the Ministry of Housing and Urban–Rural Development rated Shenyang as a city demonstrating the modern construction industry. In 2017, Shenyang became one of the first cities to demonstrate PBs in China [54]. During this period, the Shenyang municipal government vigorously promoted the development of PBs, issued a series of PBIPs, and formed a complete policy document system [55]. In recent years, the application projects, scale, and output value of PBs in Shenyang are backward compared with those in similar regions, resulting in development bottlenecks [56]. In the face of the lag of Shenyang’s PB development from the pilot demonstration city to the present, this study chooses Shenyang as the research object, analyzes the implementation effect of Shenyang’s PBIP, and comprehensively evaluates the implementation effect of Shenyang’s PBIPs from a systematic perspective.

3.2. Research Design

The mixed research method is used to study the implementation effect of PBIPs, which is divided into five stages, as shown in Figure 1.
This study aims to analyze the implementation effect of PBIPs, which is mainly divided into text analysis, impact path analysis, SD model establishment, and simulation analysis. Figure 2 shows the modeling steps of SD. First, based on the research objectives, the system boundary and main research assumptions of the SD model must be determined. Secondly, by reviewing relevant literature, the variables that affect the implementation effect of PBIP are identified, and causal relationships among these variables are established. Subsequently, a system flow diagram for the PBIP impact system will be created, and the quantitative relationships among its elements will be analyzed. Vensim software will be utilized to assess the model’s structural soundness and validate its effectiveness using relevant data from Shenyang’s construction industry. A simulation analysis will be conducted once the model attains a certain confidence level. Finally, based on the research findings, the practical significance of this study will be proposed. The data come from the Shenyang Urban and Rural Development Bureau documents and announcements and statistical publications such as the China Statistical Yearbook, China Science and Technology Statistical Yearbook, Liaoning Provincial Statistical Yearbook, and Shenyang Statistical Yearbook.

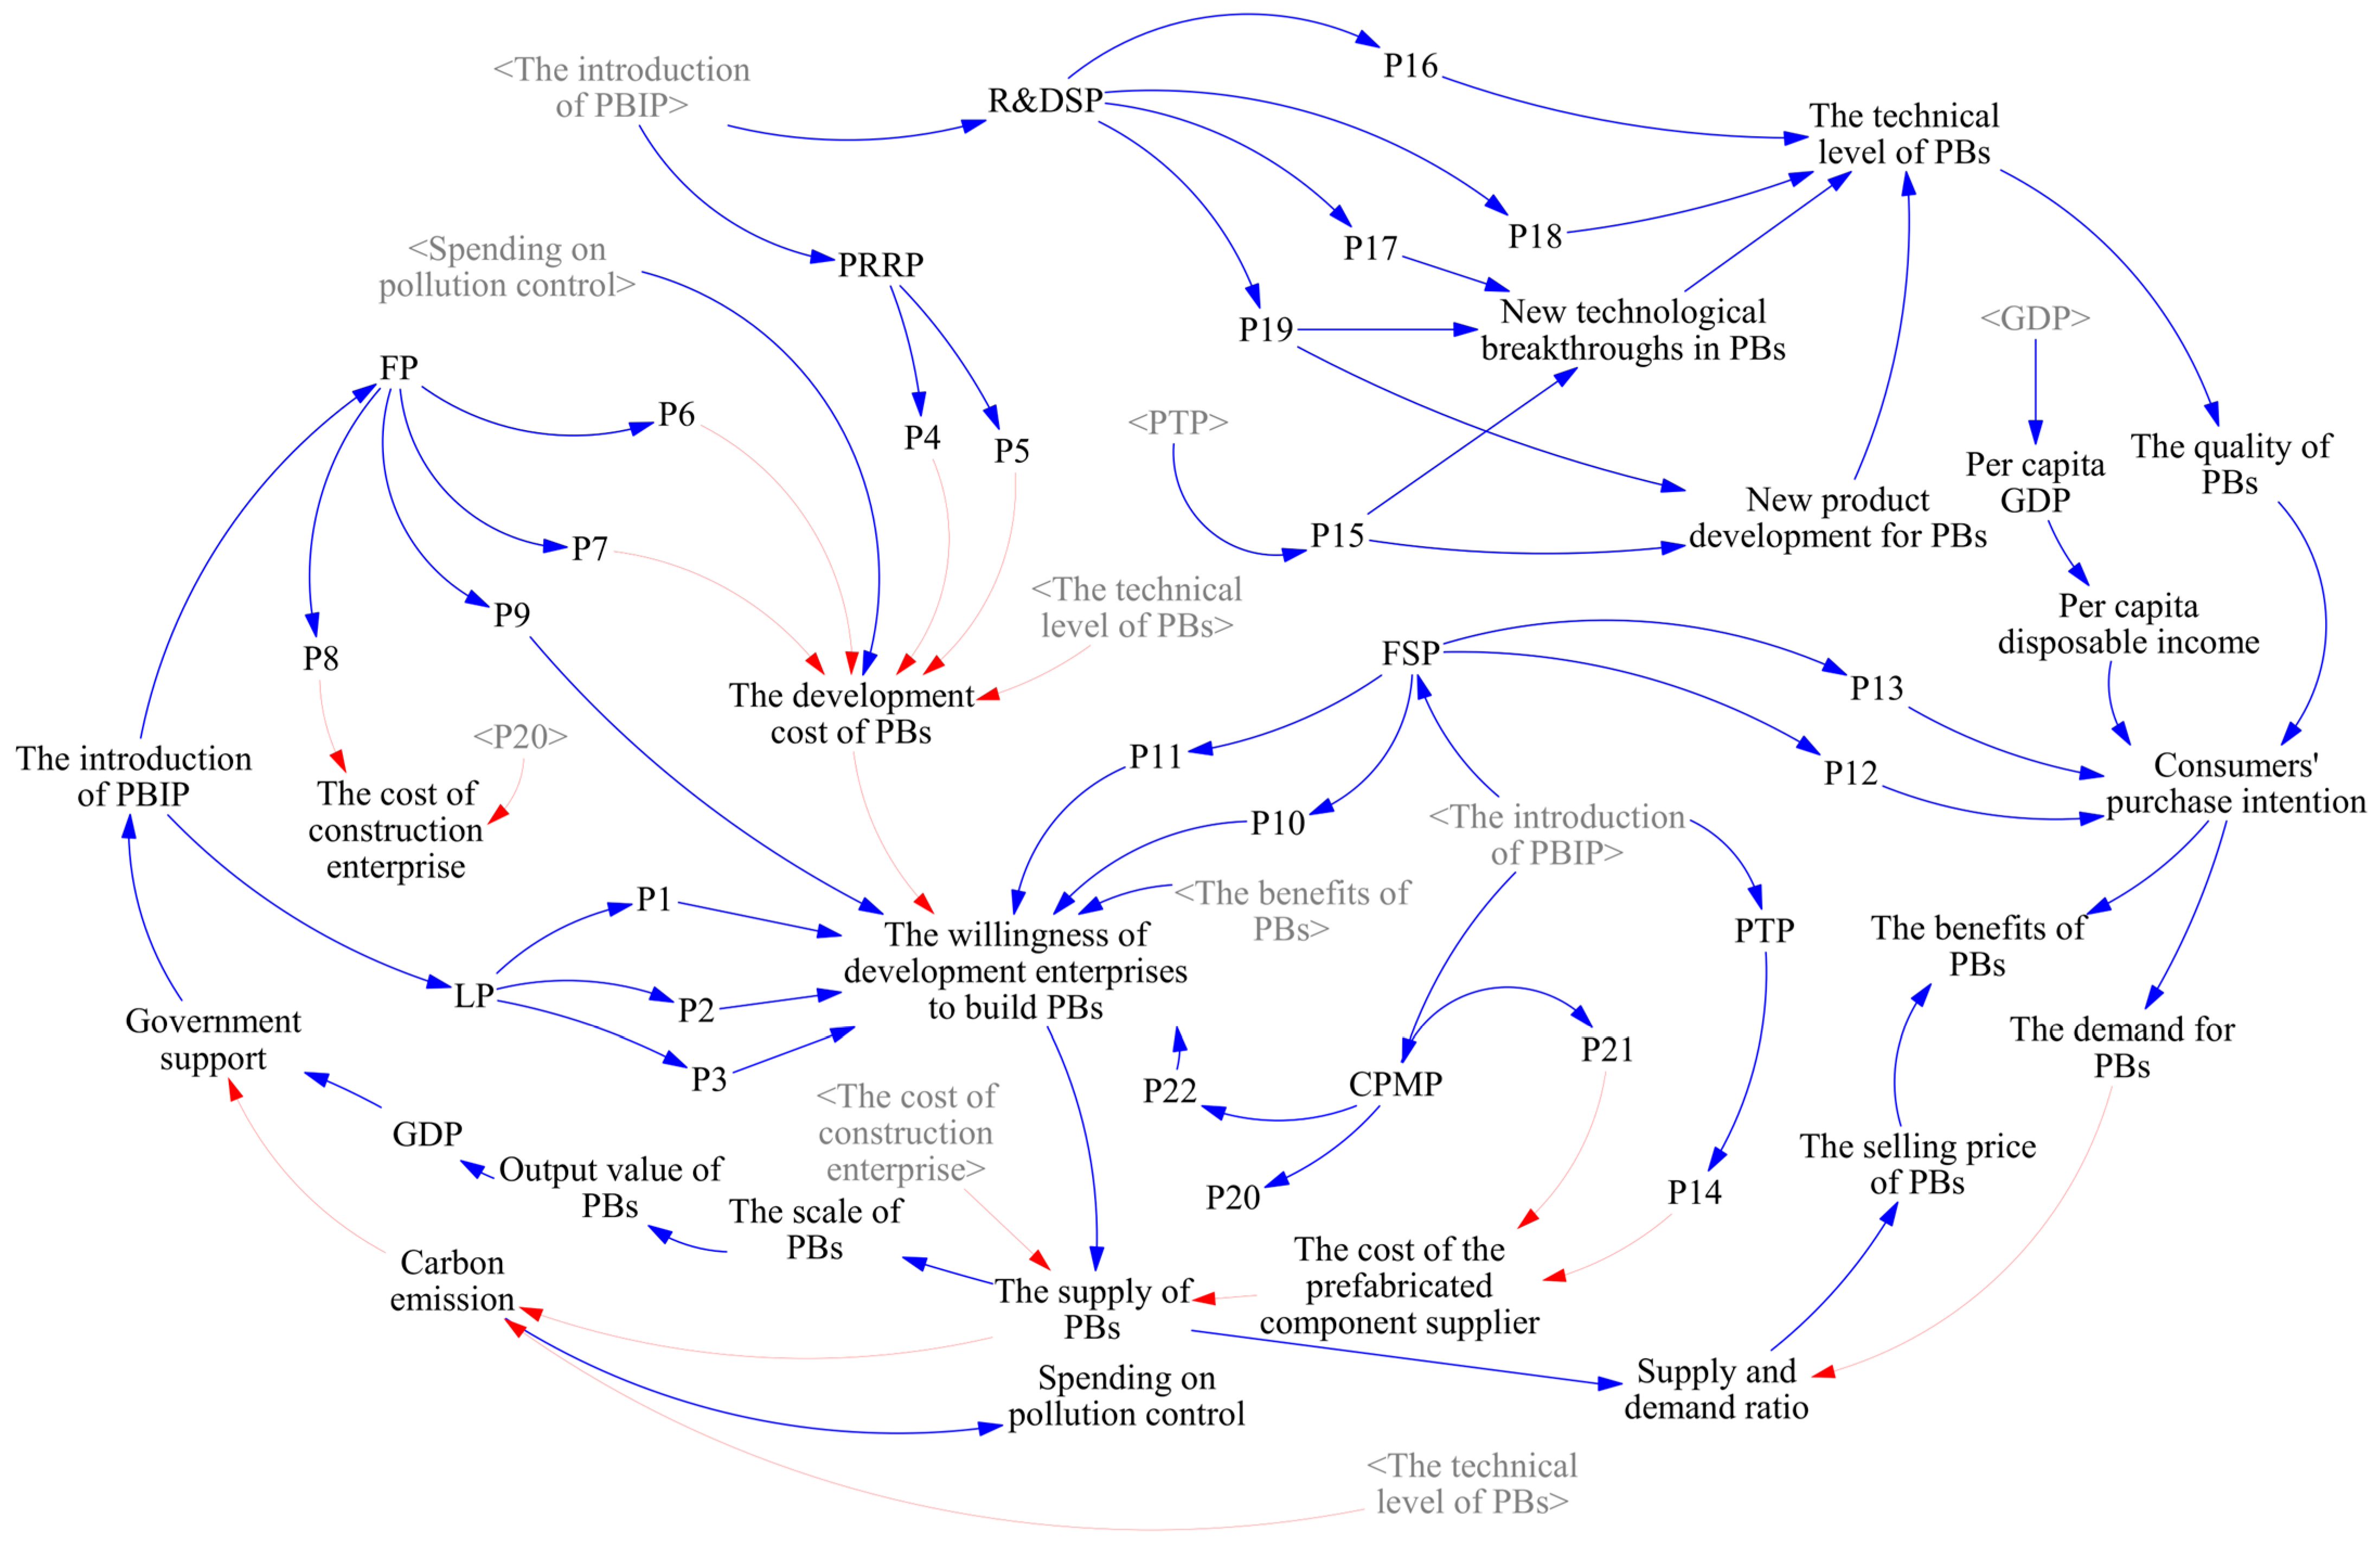
3.3. Combing and Induction of PBIP
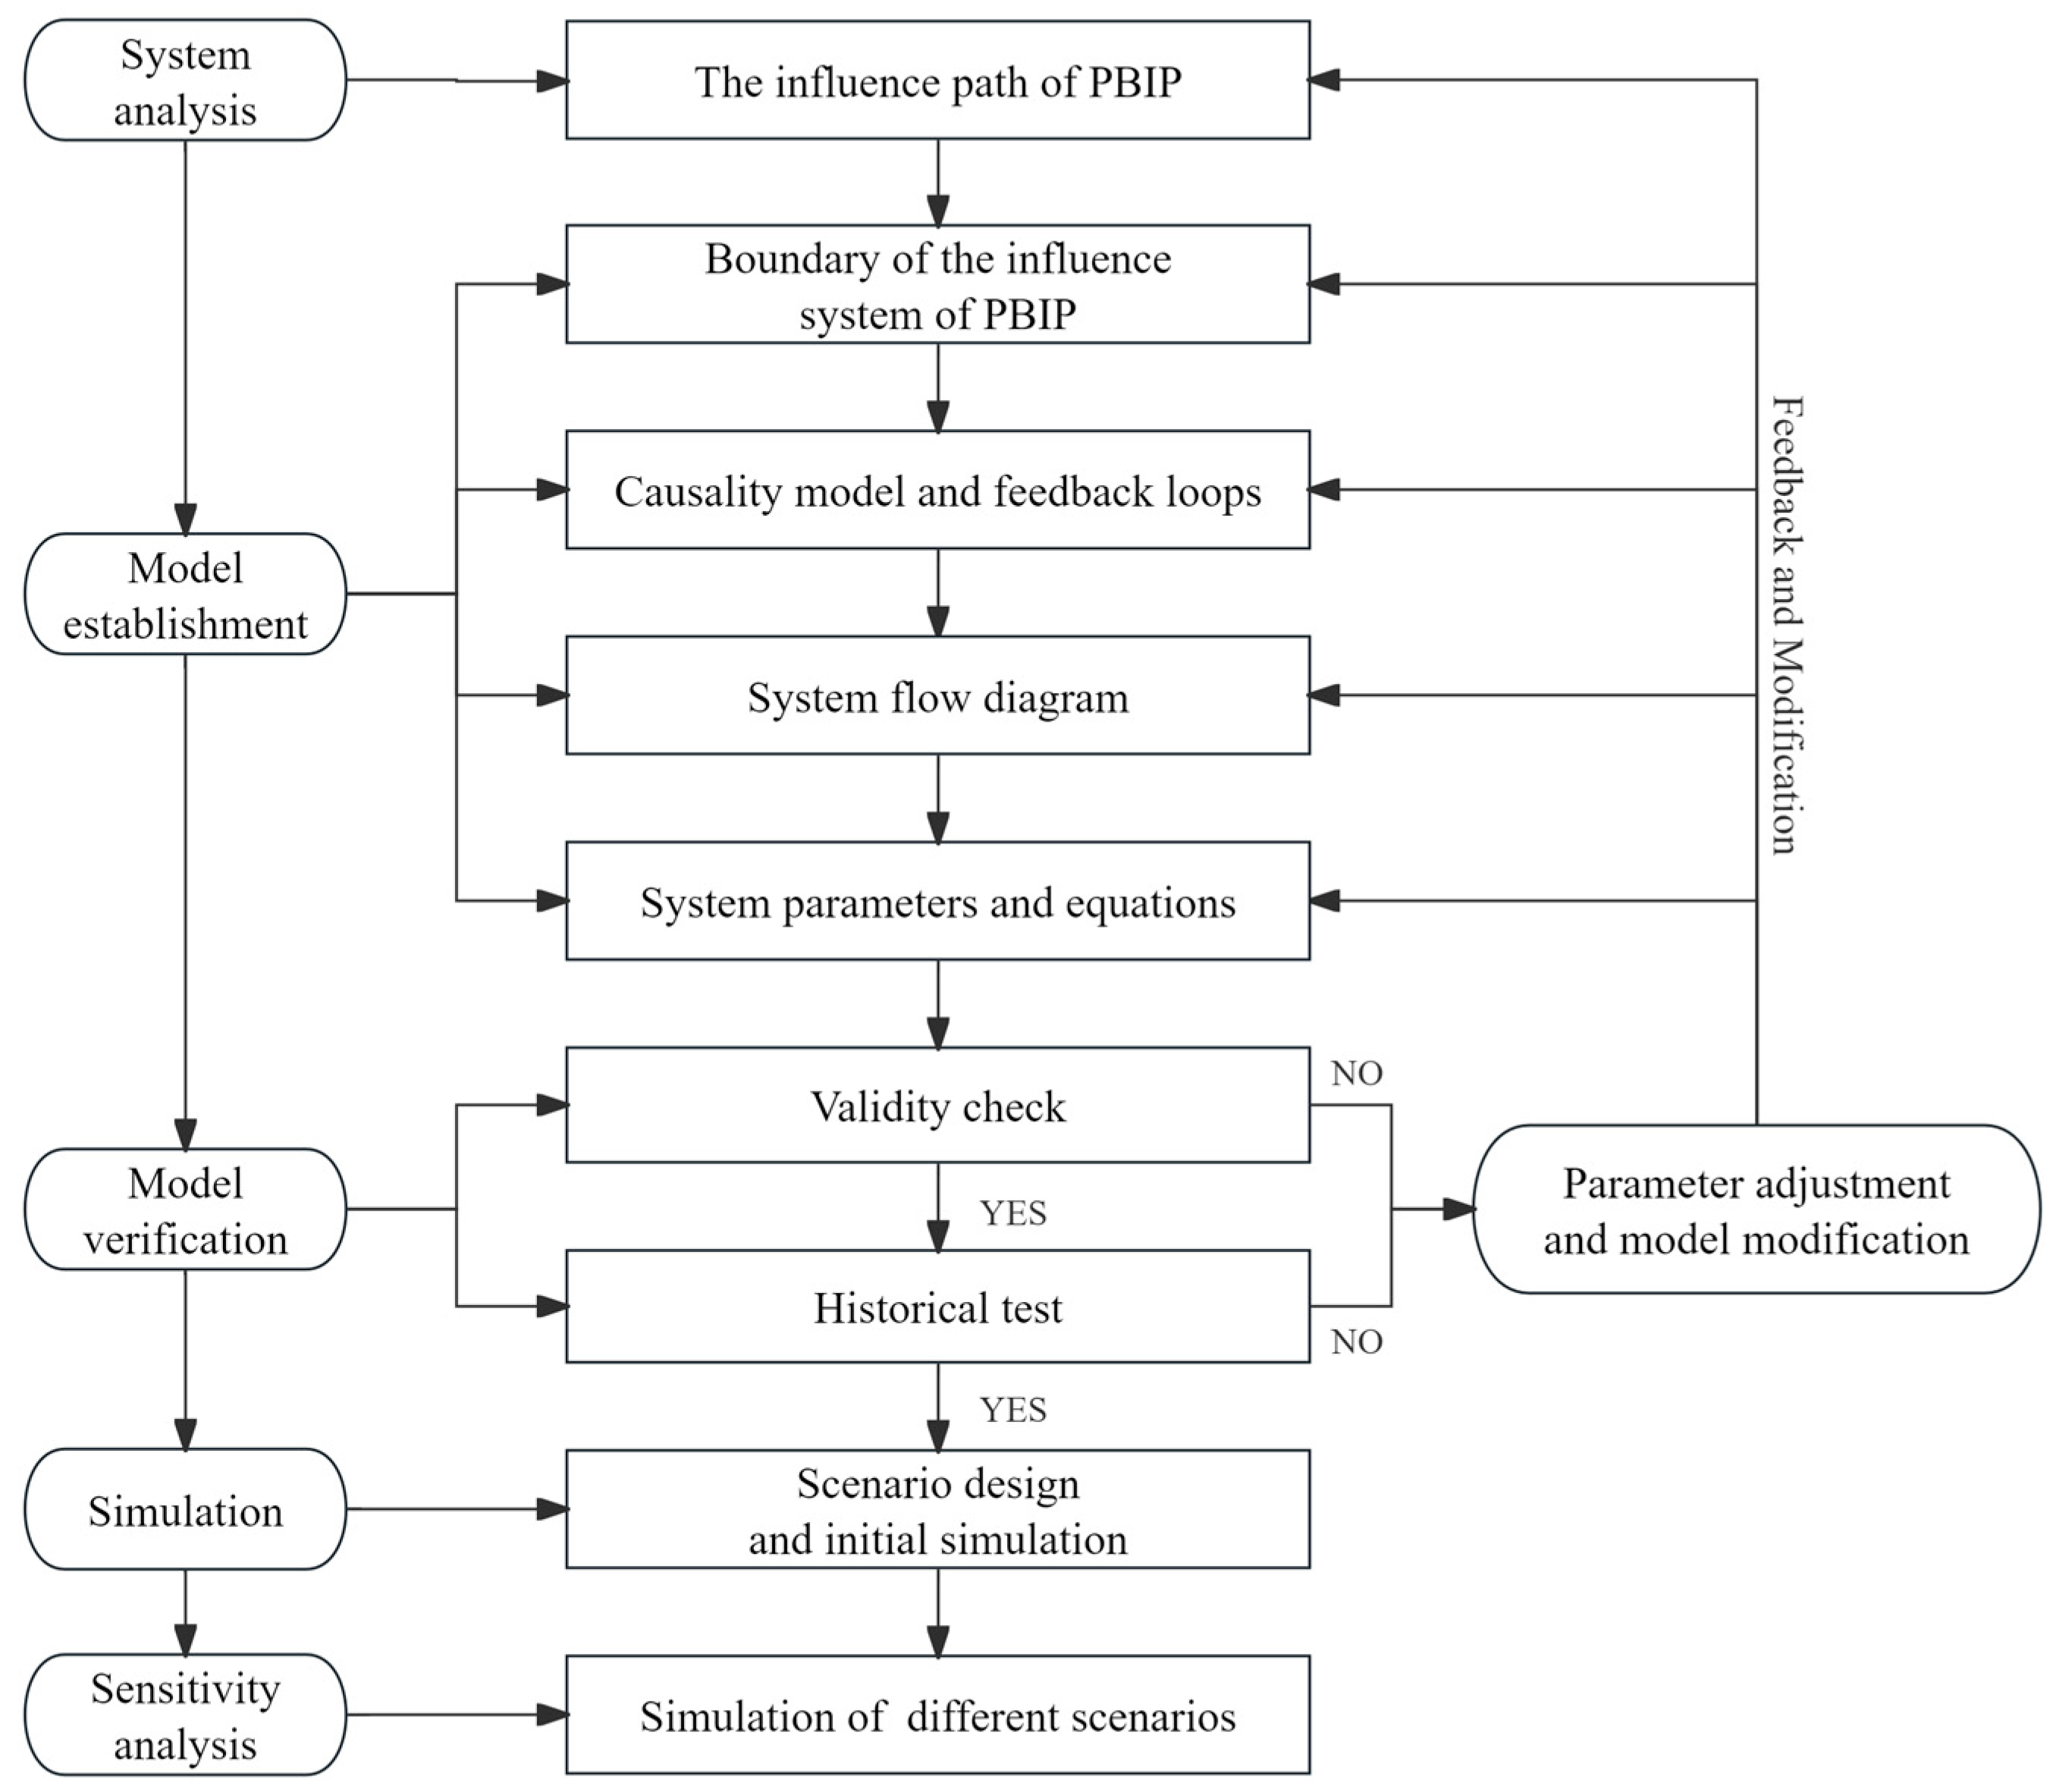
First, this study reviewed 12 policies released by Shenyang from 2010 to 2022, analyzed the content of each policy document, and extracted and summarized effective policy tools, as shown in Table 1. The content of PBIPs in Shenyang is divided into seven aspects: land policy (LP), plot ratio reward policy (PRRP), fund policy (FP), financial support policy (FSP), preferential tax policy (PTP), research and development support policy (R&DSP), and construction process management policy (CPMP), which are applied in the preconstruction preparation stage (Stage 1), the construction process (Stage 2), and the construction completion and housing sales stage (Stage 3), where “√” means that the policy has an impact at this stage, and “×” means that the policy has no impact. This study considered stakeholders of PBIPs, including real estate enterprises, contractors, prefabricated component suppliers, R&D institutions, and consumers [53]. The government is the policymaker and needs to be considered in the study. Figure 3 analyzes the impact of PBIP on stakeholders.

3.4. Model Analysis

PBIPs impact the whole process of PB development. Considering all stakeholders of PBIPs, this study combs the influencing factors in the implementation process of PBIPs, constructs the causal relationship diagram and system flow diagram of the implementation process of PBIPs based on SD theory, and puts forward the impact system of PBIPs.

3.4.1. Causality and Feedback Loop

In the impact system of PBIPs, PBIPs encourage real estate enterprises, contractors, and prefabricated component suppliers to participate in the construction and promotion of PBs, encourage consumers to buy PB houses actively, and provide an essential guarantee for the research and development of PB technology and products. Based on the above analysis, the causal relationship and influence path of the PBIP implementation effect is established, as shown in Figure 4. Among them, the solid blue line represents the positive feedback effect, and the dashed red line represents the adverse feedback effect.

3.4.2. Model Assumptions and System Flow Diagram

The causal feedback diagram reflects the causal relationship among the influencing factors in the PBIP system, and the system flow diagram is the performance of the quantitative relationship between the influencing factors. Under the influence of LP, PRRP, FP, FSP, PTP, R&DSP, and CPMP, the PBIP system determines the functional equation relationship between factors through the information flow and realizes the organic combination of interrelated and influencing factors in the system.
The system flow chart reflects the characteristics of the PBIP implementation process and identifies the above seven policy tools as the input elements of the system dynamics model. From the perspective of simulation research, set the experimental data of input elements to determine the ultimate goal of the PBIP implementation effect, that is, set the newly added area of PBs, the supply of PBs, and carbon emission reduction as the output elements of the system model. The system flow diagram of the PBIP system dynamics model is shown in Figure 5. To ensure the smooth progress of the empirical research, the following basic assumptions are put forward for the PBIP system model.
(1) The influence of force majeure, such as war, disaster, and public health emergencies on the development of PBs is not considered in the system;
(2) It is assumed that the national economic level and population of Shenyang maintain the current state of stable development;
(3) According to data availability, the reality of 2016–2022 is mainly considered.

3.4.3. Equation Design and Parameter Interpretation

Based on the analysis of PBIPs in the existing literature, the relationship between variables is obtained through the historical data of confirmed cases and expert interview data. The relationship between variables mainly includes endogenous equation, regression equation, and table function about time. (1) Expert interview and questionnaire survey: interview PB researchers and employees to determine the technical level growth rate, the influence coefficient of FP on cost savings for contractors, and other data. (2) Literature analysis: sort out the relationship between variables, such as the functional equation of carbon emission reduction, the technical level of PBs, and the newly added area of PBs. (3) According to the historical data, the relationship between variable data and time is analyzed, and the table function of variable data about time is obtained, such as the values of land transfer price and land transfer area. (4) The regression equation of variable correlation was obtained based on regression analysis, such as the regression equation of the newly added total building area.
Therefore, the assignment of parameters in this study is reasonable to a certain extent. In this study, the spatial boundary of the system is set as Shenyang, one of the first pilot cities of PB in China. The time boundary is set to 2015–2030, and the simulation step size is set to one year. The model’s validity is verified by comparing the system simulation data from 2015 to 2022 with the actual data. The data from 2023 to 2030 are used to predict critical variables such as the newly added area of PBs and carbon emission reduction. See Appendix A for the variable settings and essential equations of the PBIP impact system.

3.5. Model Checking

Firstly, verify the model’s boundaries. After randomly deleting a variable in Figure 5, analyze whether the circuit containing this variable can operate normally. Next, all variables will be checked individually to ensure that each variable in the model has practical significance, thereby verifying the rationality of the model’s system boundary.
Next, a comprehensive inspection of the model’s functionality was conducted using the “Check Model” feature in Vensim software 7.3.2 to verify the functional equation relationships and dimensions of the model, ensuring the effectiveness of the SD model’s structure and logic.
Finally, conduct an effectiveness test. The model simulation results are compared with the actual data to minimize the error of equation parameters. It is generally believed that the test’s error rate is within ±10%, indicating that the model’s simulation effect is good [57]. The model has a causal relationship between GDP and several vital variables, such as the newly added area of PBs and the increased market demand, which impact the system’s critical path. GDP participates in the key feedback loop in the system flow diagram and can serve as an indicator to validate the model’s effectiveness. Additionally, historical GDP data are readily available. Therefore, GDP is used to verify the model’s effectiveness. GDP simulated by the system is compared with the actual value of Shenyang. The results are shown in Table 2. The error rate of the simulated value and the exact value of GDP are stable within ±5%, so it can be shown that the dynamic model of the system is accurate and can truly reflect the actual operational state of the PBIP.

4. Results

4.1. Sensitivity Analysis

This study conducted a sensitivity analysis on the implementation effect of the above seven types of policies to determine the impact of different kinds of PBIP on the development level of PBs. Therefore, LP, PRRP, FP, FSP, PTP, R&DSP, and CPMP, sorted out in Table 1, are used as the system’s input elements and independent variables. The newly added area of PB, the supply of PB, and carbon emission reduction are taken as the system’s output elements and dependent variables. Adjust the quantitative value of the target policy within a specific range while ensuring that other variables remain unchanged and analyze the impact of increasing the value of the target variable on the system. Increase the quantitative value of various policies by 10%, 20%, and 30%, and analyze the impact of PBIP changes on the newly added area of PB, the supply of PB, and carbon emission reduction. The time range of the PBIP impact system simulation is from 2023 to 2030.

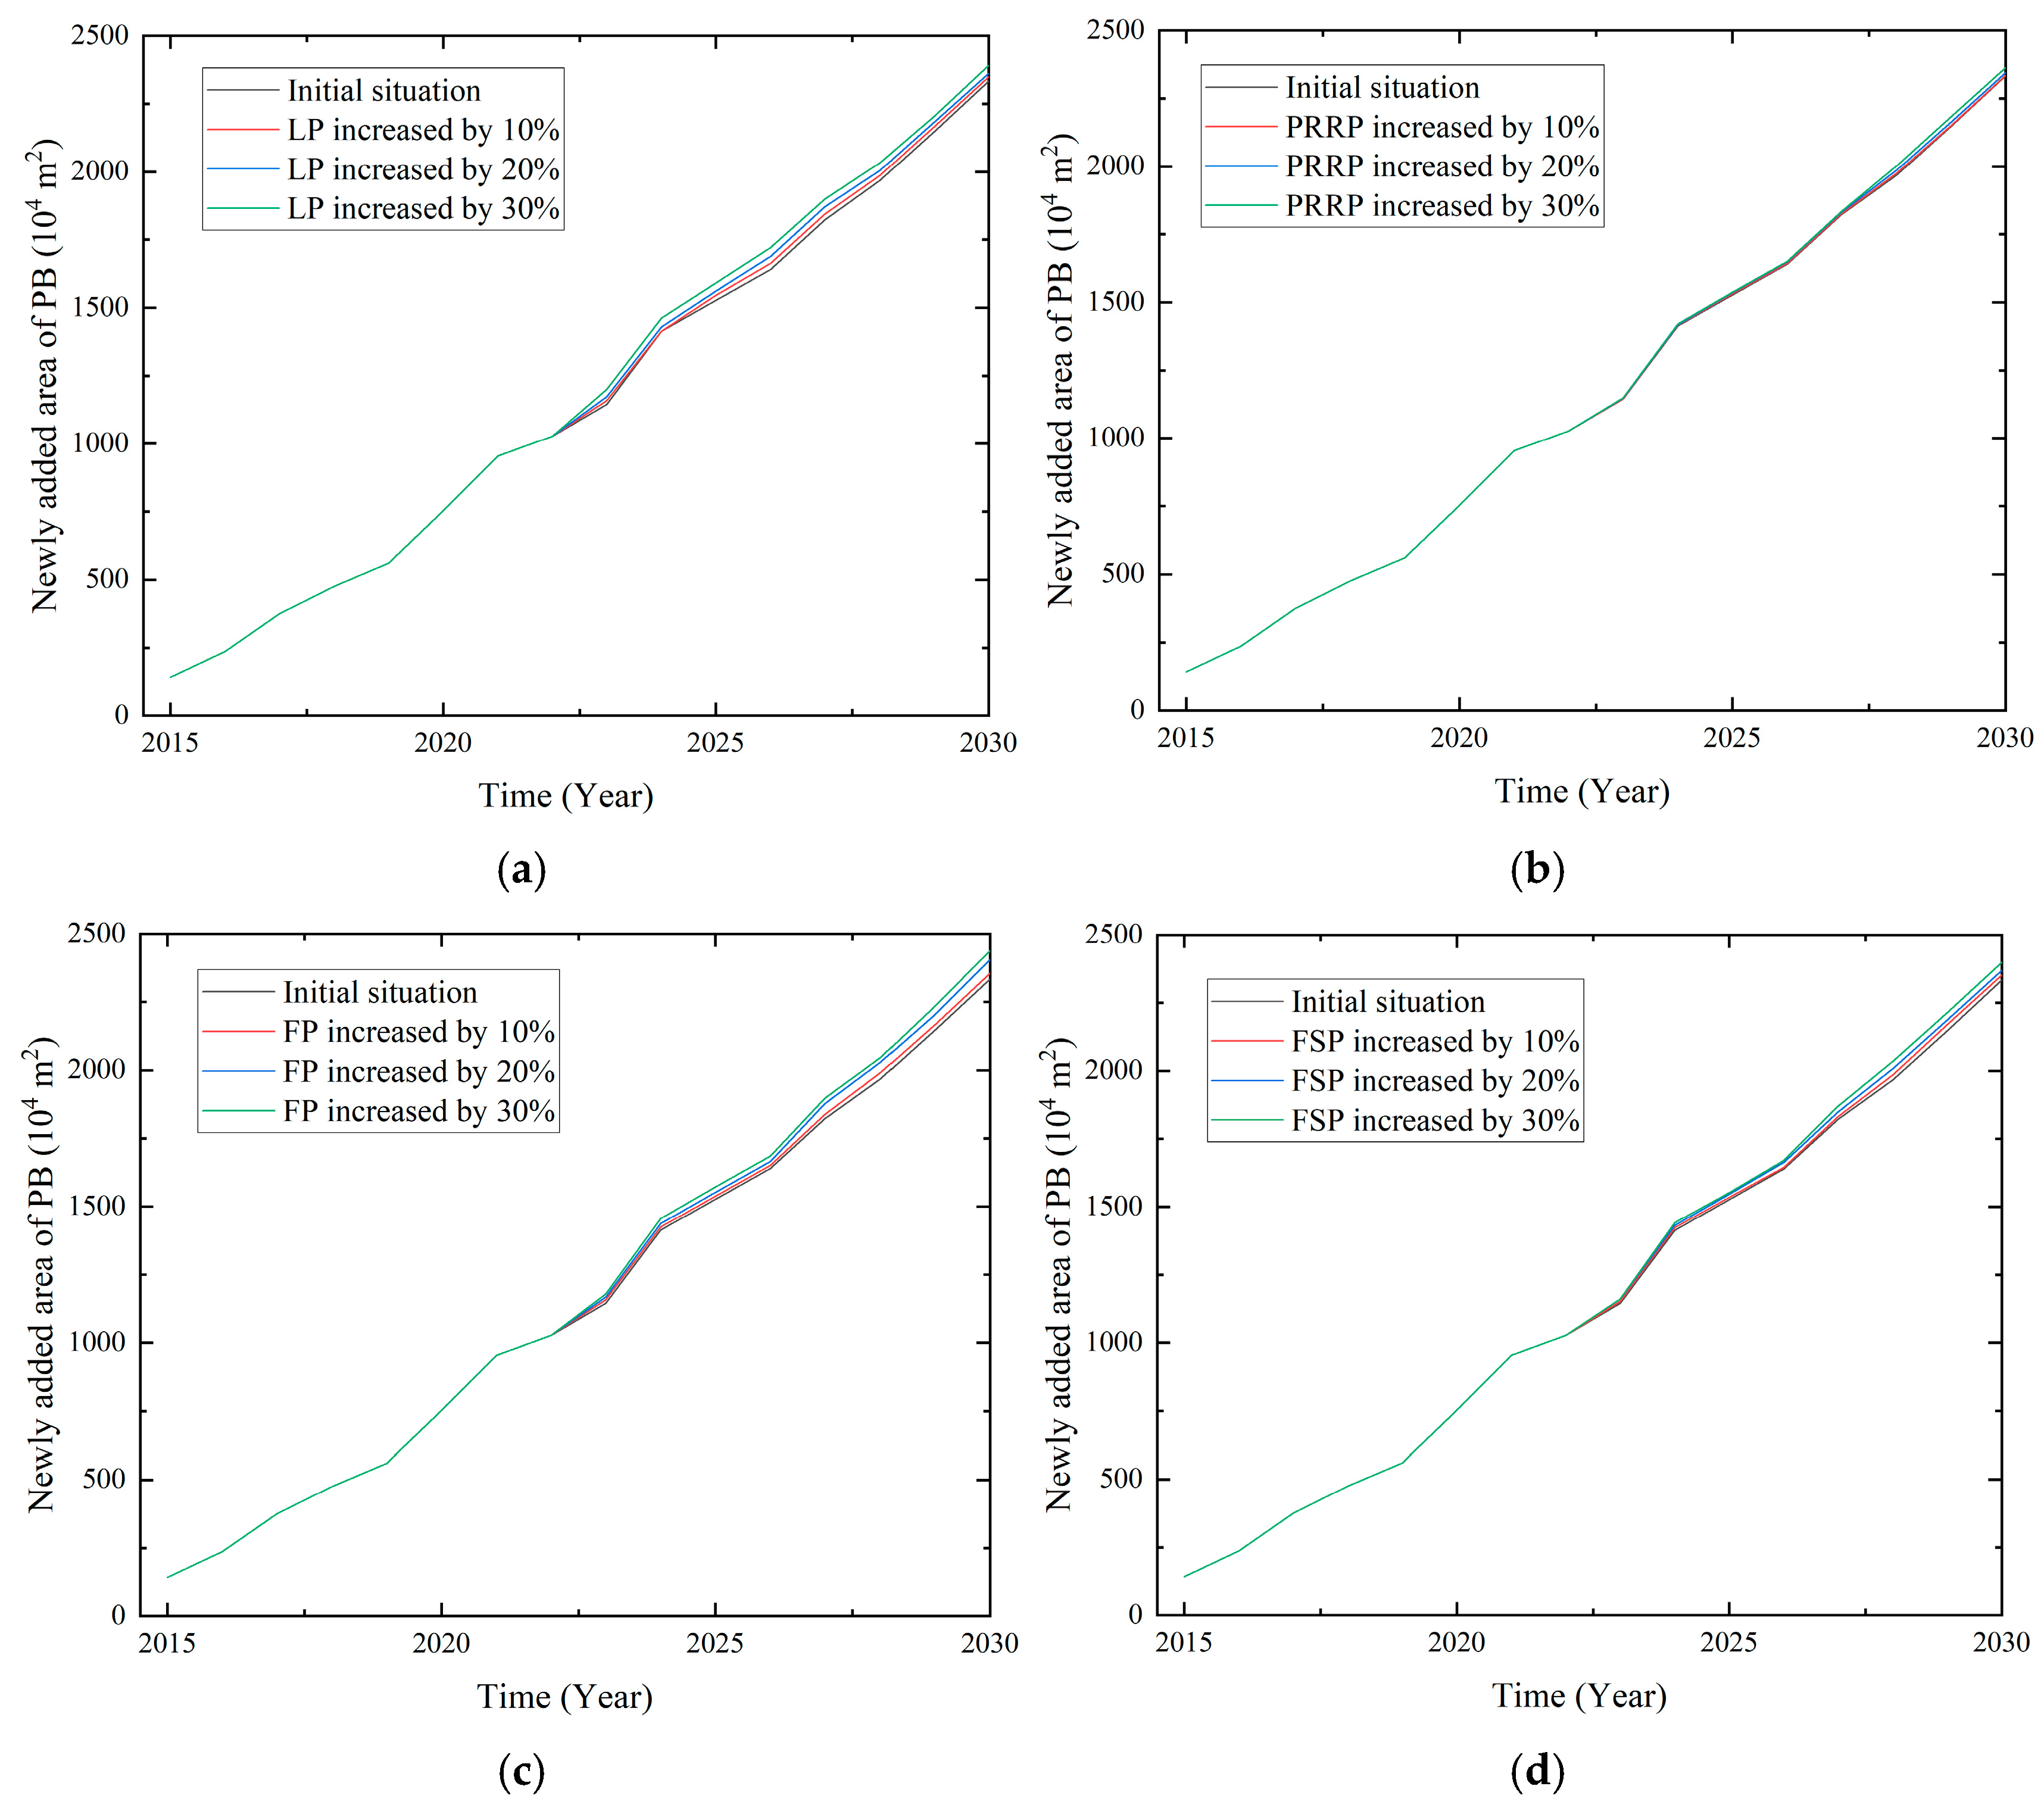
4.1.1. The Newly Added Area of PBs

When FP is increased by 10%, the promotion effect on the newly added area of PBs is not apparent and, when FP is increased by 20% or more, it will achieve a good promotion effect. On the contrary, when the PTP is increased by 10%, it will have a better effect, and the result of further increasing the PTP level is not prominent enough. When R&DSP is increased by 10%, it has a specific promotion effect on the newly added area of PBs, and the promotion effect is more obvious when it is increased by 20% or more. When LP increased by 30%, the promotion effect on the newly added area of PBs was very obvious at that time. The impact of FSP on the newly added area of PBs is not high, and the effect of increasing FSP by 30% is the best. The overall impact of CPMP on the newly added area of PBs is weak, and the newly added area of PBs increases with the increase of CPMP. PRRP has the least impact on the newly added area of PBs. Only when the PRRP is increased by more than 30% can it promote the newly added prefabricated building area. The simulation results of the newly added area of PBs are shown in Figure 6.

4.1.2. The Supply of PB

The PBIP has a positive impact on improving the supply of PBs. The impact and trend of the change of PBIPs on the supply of PBs are consistent with the simulation results of the newly added area of PBs. The simulation results of the supply of PBs clearly show the sensitivity of various policies and their impact on the development of PBs. Figure 7 shows that the order of the PBIPs’ effect on the supply of PB is FP > PTP > R&DSP > LP > FSP > CPMP > PRRP. When FP and PTP are 30% higher than the initial level, the simulation value of PB supply will increase significantly in 2030, reaching 170.02 million m2 and 166.16 million m2, respectively.

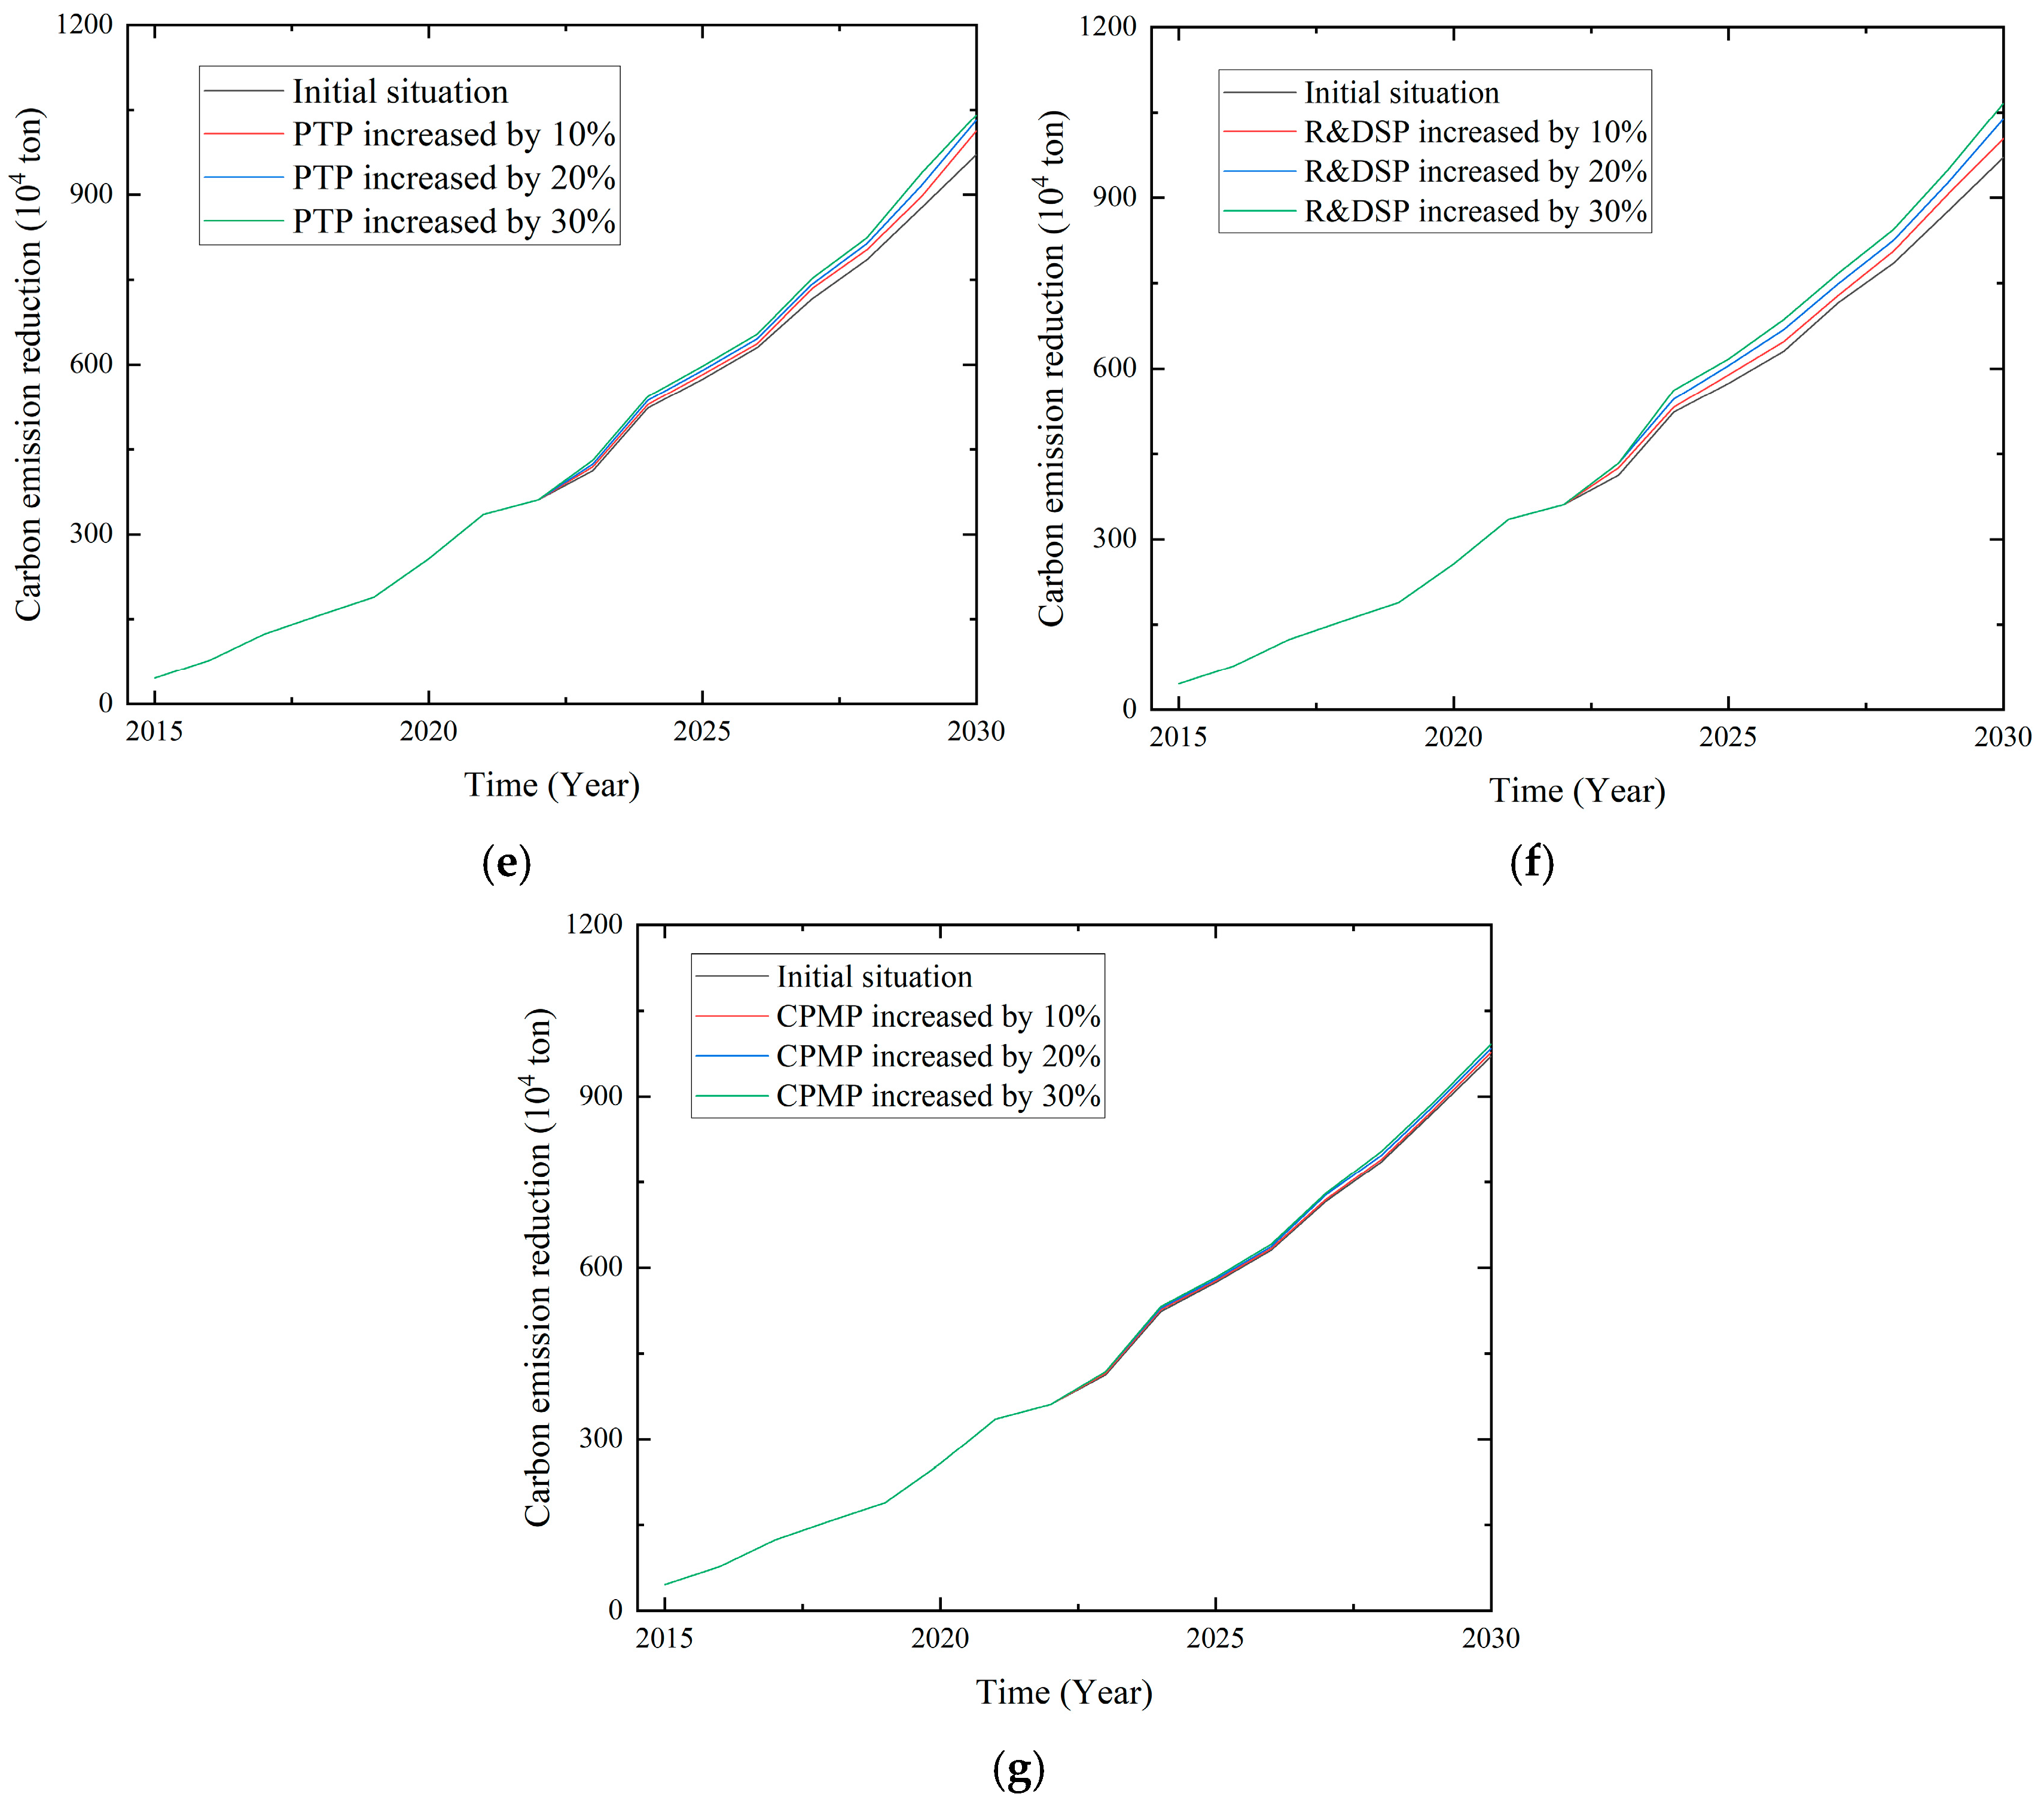
4.1.3. Carbon Emission Reduction

The simulation results of PBIPs on carbon emission reduction are shown in Figure 8. The order of impact of PBIPs on carbon emission reduction is R&DSP > PTP > FP > LP > FSP > CPMP > PRRP. The promotion effect of R&DSP on carbon emission reduction is the most obvious and improving R&DSP will continue to promote carbon emission reduction. The impact of PTP on carbon emission reduction is also undeniable, and the increase of 10% can produce a significant promotion effect. Still, the further improvement of PTP makes it challenging to increase the proportion of carbon emission reduction. A slight increase in FP and LP does not impact reducing carbon emissions. It will only have a significant promotion effect when they are increased to 20% or more. CPMP and FSP have little impact on the reduction of carbon emissions. The difference is that the increase of CPMP has a continuous positive effect on reducing carbon emissions. However, FSP needs to be increased by 30% to impact the reduction of carbon emissions significantly. The impact of PRRP on carbon emission reduction is small, and the promotion effect of improving PRRP on carbon emission reduction is not significant.

4.1.4. Statistical Analysis of the Simulation Results

To further clarify the differences in promoting PB development through different policy tools, this study calculated and analyzed the confidence intervals of SD simulation results. By introducing a 95% confidence interval, the stability and significance of PBIP implementation can be more scientifically assessed, providing a reliable basis for improving PBIPs. The calculation results are shown in Table 3.
In terms of the newly added area of PBs, all policies have shown significant promoting effects at three levels of intensity. However, there are considerable differences in the degree of incentives. FP maintains its optimal performance under three levels of policy intensity. When FP increases from 10% to 30%, its mean increases from 1765.10 to 1813.26, and the confidence interval also expands from [1506.55, 2023.64] to [1541.29, 2085.22]. The incentive effect is the most significant, and it remains in a leading position among all policies. LP comes second, with confidence intervals increasing to [1555.51, 2069.05] when LP intensity is increased by 30%, demonstrating strong stability. The PTP and R&DSP also performed well, with a significant impact on indicator growth as policy intensity increased to medium to high intensity. The FSP is slightly lower than the previous measures, but it still has a positive impact. CPMP and PRRP are relatively weak, with limited mean increases and confidence interval changes under different enhancement scenarios, reflecting their positioning as supportive policies.
In terms of the supply of PBs, the incentive effect of fiscal policy (FP) remains the most significant. Although the effect under the 10% increase scenario is not significant enough, when it increases by 20%, the confidence interval expands to [7208.90, 12,776.90], which is far higher than that of other policies. Under the 30% increase scenario, the confidence interval further increases significantly to [7261.30, 12,964.35], reflecting its substantial positive effect on the large-scale expansion of the PB market. LP also demonstrates strong incentive capabilities. When the intensity of LP increases by 30%, the confidence interval increases significantly, reaching [7255.83, 12,806.57]. PTP and R&DSP have shown stable performance under three levels of intensity, with strong auxiliary driving forces. FSP is at a mid-level. In contrast, CPMP and PRRP increase relatively slowly, with confidence intervals similar to the initial values. These two policies have limited direct impact on the supply of PBs.
In terms of carbon emission reduction, different policies have significant differences in their driving ability for energy conservation and emission reduction in PB. The R&DSP has the best effect among all policies in the three intensity scenarios. When its intensity increases by 30%, the average carbon emission reduction reaches 7.4072 million tons, and the confidence interval also increases to [605.10, 876.33], demonstrating its key role in the low-carbon transformation of PB. PTP and FP are second, and when the policy intensity increases by 30%, the confidence interval is also significantly higher than the initial value. LP and FP also demonstrate good carbon emission reduction capabilities and have a specific synergistic emission reduction effect when policy intensity is increased. The marginal impact of CPMP and PRRP on reducing carbon emissions is relatively small. When their policy intensity increases by 30%, the mean is below 700, and their confidence intervals remain around the initial range.
Based on the above analysis, FP performs exceptionally well in all three key indicators and is a crucial lever for promoting the rapid development of PB. R&DSP plays the most significant role in reducing carbon emissions in PB and should be given priority in the green building policy system. PTP, LP, and FSP are equally crucial as stable and effective supporting tools, as they all have sound motivational effects. CPMP and PRRP are more responsible for supporting and guiding functions and are considered components of long-term institutional safeguards.

4.2. Comprehensive Simulation Analysis

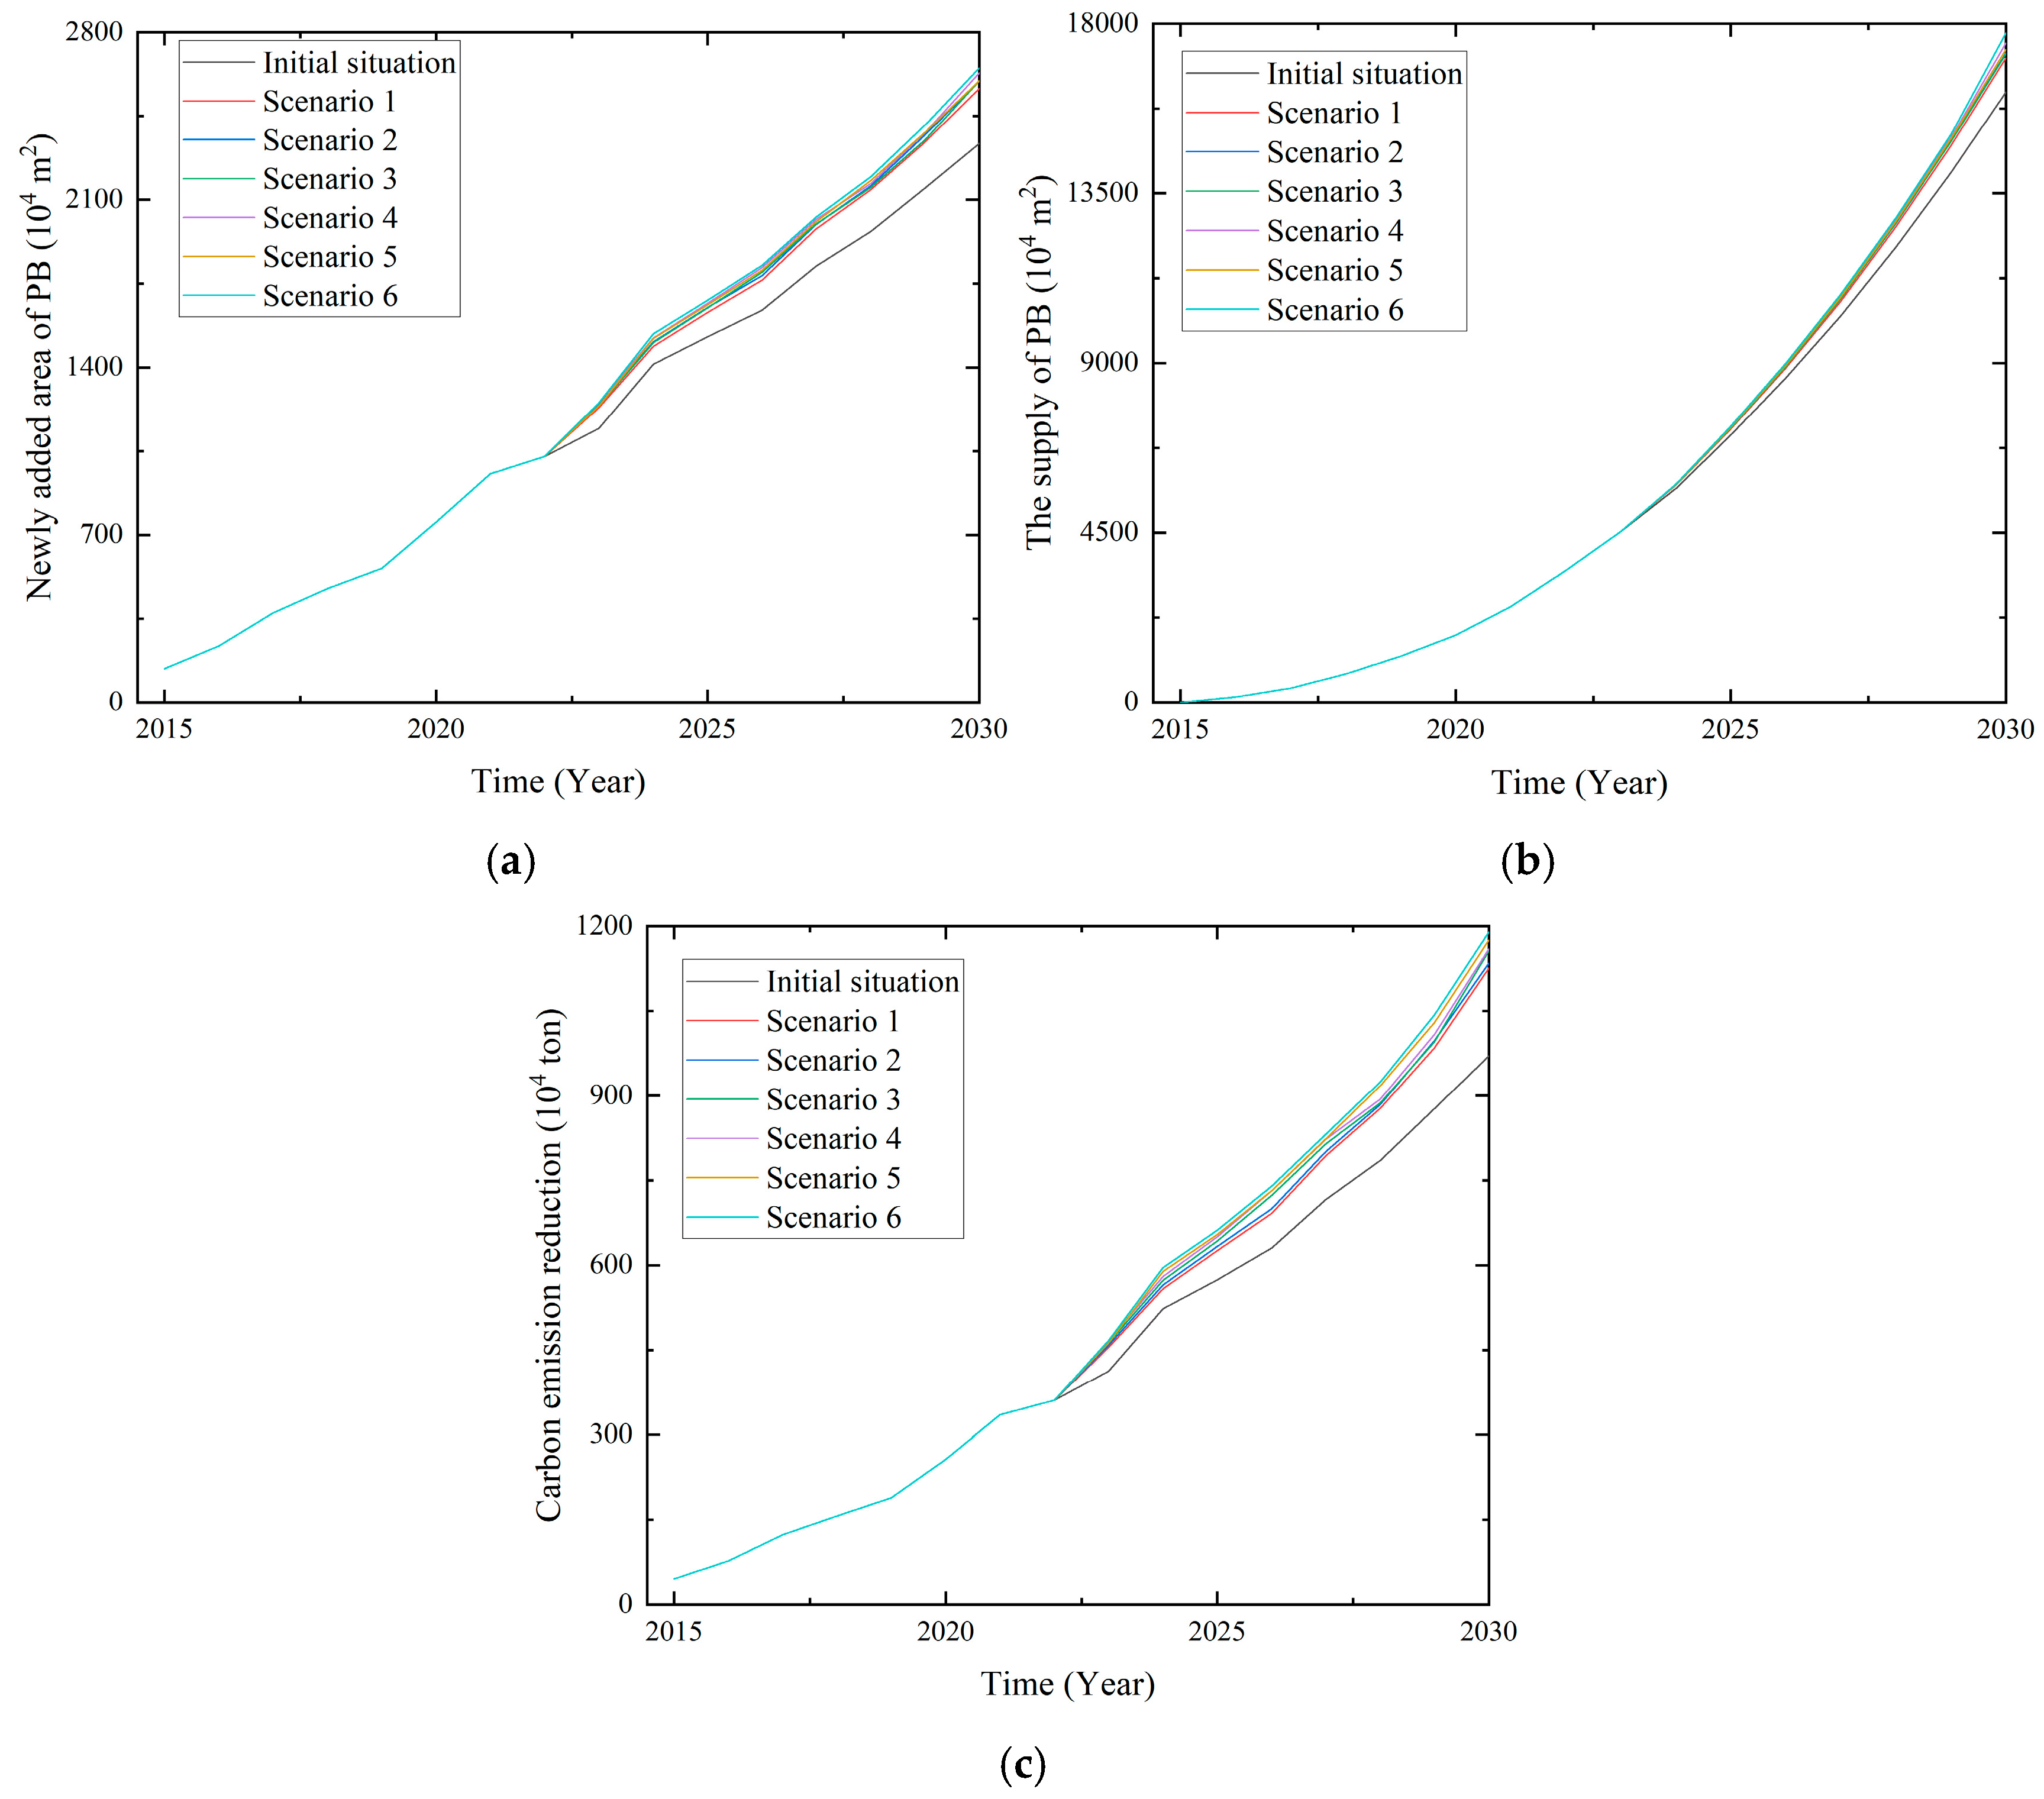
4.2.1. Comprehensive Simulation Scenario Setting

In the natural system, there is no single policy change, and according to Figure 6, Figure 7 and Figure 8, it is found that the change of a single factor has a limited effect on the improvement of indicators such as the supply of PB and the reduction of carbon emissions. Therefore, it is necessary to consider the impact of multiple policies on the PBIP system to simulate the objective facts. The research results show that continuously increasing policy incentives cannot bring the most valuable promotional effect. To maximize the effect of policy promotion, it is necessary to set reasonable policy combination parameters for comprehensive simulation. According to the above statistical analysis, it was found that LP, PRRP, FSP, and CPMP had a relatively small impact on the system when increased by 10% and 20% and only had a significant effect when they were increased to 30%. Therefore, the comprehensive simulation value of LP, PRRP, FSP, and CPMP was set to 30%. The promotional effect is stronger when PTP is increased by 10%, but it becomes limited when PTP is further increased. Therefore, PTP is increased by 10%. The promotional effect of FP on the entire system is most significant, and when FP increases to 20% or more, it has a substantial impact on the system. The simulation scheme for FP is set to increase by 20% and 30%. The improvement of R&DSP will have a sustained positive impact on the entire system, resulting in increases of 10%, 20%, and 30% in R&DSP. This study sets six scenario control schemes for comprehensive simulation, as shown in Table 4.

4.2.2. Analysis of Comprehensive Simulation Results

Simulations were conducted on the six scenarios in Table 4 to study the promotion effect of policy combination schemes on the entire system, as shown in Figure 9. By comparing the increase of three critical indicators caused by six different scenarios, the newly added area of PBs and the supply of PB scale are similar, and the promotion effect of various scenarios is ranked as Scenario 6 > Scenario 4 > Scenario 5 > Scenario 2 > Scenario 3 > Scenario 1 > initial value. The promotion effect of a policy combination is much higher than that of a single policy. The policy control schemes in scenario 6 can bring the maximum promotion effect, which is much more significant than other scenarios. Scenario 4 also causes a greater promotion effect, while the promotion effects of Scenario 5, scenario 2, and Scenario 3 are similar, and the promotion effect of Scenario 1 is the least. For carbon emission reduction, the ranking of the increasing effect caused by different scenarios is Scenario 6 > Scenario 5 > Scenario 4 > Scenario 3 > Scenario 2 > Scenario 1 > initial value. Scenario 6 and Scenario 5 can significantly improve the effect of reducing carbon emissions of PBs in Shenyang. Scenario 4 and Scenario 3 have the same promotion effect, while Scenario 1 and Scenario 2 have the same effect. It can be seen that the reduction of carbon emissions is greatly affected by the R&DSP.

5. Discussion

The increase of FP significantly affects the increase of the newly added area of PBs [58], which is the most effective policy to promote the development of PBs [37]. After a slight increase in FP, the effect of promotion on the development of PBs is not apparent. Expanding the amount and scope of subsidies for PB development is necessary. The research results of Wang et al. also show such characteristics [26]. The high construction cost is still the main obstacle to the development of PBs. The government must increase financial subsidies to compensate for the incremental cost of developing PB projects [9]. The higher the project subsidy, the greater the improved effect of the newly added area of PBs and reduced carbon emissions. This result is consistent with the research by Yan, et al. (2024) [9]. This study further proposes the positive correlation between PB promotion and FP intensity, providing precise recommendations for policy design. However, a substantial increase in subsidies will increase the financial pressure on the government and lead to many real estate enterprises joining the PB market, quickly bringing adverse effects to the construction market [34]. Therefore, with the government’s financial permission, various enterprises involved in PB development, design, production, and construction should be given the highest possible financial subsidies [59]. The level and scope of subsidies shall be gradually expanded. Set attractive subsidies according to the project assembly rate and standardization level, and improve the enthusiasm of relevant industries to invest in PBs [27]. However, this study has not yet established a clear boundary between the subsidy scale and market saturation, and further simulation and verification are needed in future research based on regional fiscal capacity and the PB market’s carrying capacity.
The increase in the production of prefabricated components and the application of energy-saving technology can significantly improve the scale of PBs and reduce carbon emissions [60,61]. PTP mainly provides tax incentives for the R&D of PB technology and the production of prefabricated components, which significantly affects the development of PBs. According to Figure 6e, Figure 7e, and Figure 8e, and Table 4, when the PTP is increased by 10%, it can produce a noticeable promotion effect, but when the PTP is doubled, it cannot make benefits match the investment. Therefore, there is no need to increase tax incentives significantly. The government can increase the intensity of tax incentives within a reasonable range, based on the actual financial situation. According to the simulation results, this reasonable range should be around 10% but should not exceed 20%. The enterprises benefiting from PTP in Shenyang are mainly prefabricated component suppliers and R&D institutions. The coverage of PTP is small, and it is impossible to study the possible improvement effect of PTP on other enterprises. In the future, the government can consider expanding the application scope and beneficiary groups of PTP.
Technological innovation and achievement transformation promote the development of PBs, generating high economic and environmental benefits [37]. R&DSP supports technological innovation and research achievement transformation related to PBs, the policy with the most significant effect on carbon emission reduction. Regarding the supply of PBs, the R&DSP will produce good results only when it needs to be increased by 20% or more. Regarding carbon emission reduction, R&DSP has a sustained effect, and the reduction of carbon emissions rises significantly with the improvement of R&DSP. Technological innovation and technical personnel training are essential means to promote the development of PBs [10]. The government should invest funds vigorously to encourage the research and development of new technologies for PBs, supporting enterprises and research institutes in their cooperation on technical research. Promote the effective transformation of scientific and technological achievements in PBs and enhance PBs’ economic benefits and construction level [9,62]. In the future, performance evaluation should be used to allocate R&D funds effectively, guiding them towards high-achieving transformation projects. In addition, the study proposes combining technology subsidies with talent cultivation and incorporating PB-related courses into vocational and higher education systems, which can serve as an institutional innovation for linking human resources and technology policies [63]. Finally, promote the application of new technologies, provide special subsidies for projects utilizing the latest technologies, such as “Internet+”, “BIM Technology”, “RFID technology”, and “UAV+AI technology”. Additionally, encourage the adoption of production and energy-saving technologies throughout the entire process of PBs.
The promotion effect of LP on the development of PBs is not as good as the first three policies, but obtaining land use rights is the first step in developing PBs. Giving full play to the function of LP has a considerable promotion effect on improving the supply of PBs and reducing carbon emissions [10]. The government must prioritize ensuring the land area is suitable for developing PBs. Incorporate PB development into the overall national spatial planning and urban renewal strategy and promote the deep integration of land management policies and construction industrialization strategies. In land transactions, priority should be given to PBs with a high assembly rate and standardization level, and the land area planning of PB projects should be increased yearly. However, this study has not yet proposed feasible suggestions for coordinating stock and incremental land development in the land supply of PBs, nor has it fully addressed the policy implementation difficulties caused by differences in land resource endowments in different regions.
FSP considers consumers and pays attention to the demand side of PBs. Improving PBs’ income will directly stimulate real estate enterprises to invest in PBs. The sustainable development of PBs depends on the growth of both supply and demand. When the FSP is increased by 10%, the ideal promotion effect can be achieved, and the improvement of the FSP will not consume excessive government funds. The government can further increase the amount of provident fund loans to stimulate consumers to purchase prefabricated houses, thereby improving demand for PBs [37,64]. Carry out effective publicity and incentives, provide consumers with a certain number of house purchase subsidies, increase the vitality of Shenyang’s PB market, and jointly promote the sustainable development of PBs from the supply and demand sides [27].
The implementation effect of CPMP is average, but it will not bring tremendous economic pressure to the government. In addition, CPMP supports contractors and prefabricated component suppliers, playing a vital role in PBs’ construction process [45]. Therefore, the government can further improve the strength and scope of CPMP. First, the conditions for a pre-sale permit should be relaxed, and the PB, whose construction quality and progress pass the periodic inspection, should be allowed to handle the pre-sale procedures. Secondly, the project with the required assembly rate shall be prioritized in the acceptance procedures. Finally, it supports transporting foreign prefabricated components, improves transportation efficiency, and reduces wear costs.
Compared with other policies, PRRP has less promotion effect on the whole system. When PRRP is increased by 30% or more (more than 3.9% of the plot ratio reward), it will have a specific promotion effect. The low level of PRRP will not significantly affect the development of PBs. If the PRRP is increased too much, it will affect the living experience of consumers. Therefore, the government can consider adjusting the existing floor area ratio incentive target from 3% to 4%, ensuring that the PRRP is increased to more than 30% and ensuring residents’ comfort to a certain extent.

6. Conclusions

This study takes Shenyang as an example and systematically evaluates the implementation effectiveness of seven types of PBIPs. Firstly, through literature analysis, the impact stages and implementation logic of policies are sorted out. Secondly, key variables such as economy, technology, and population were introduced to establish an SD model for the implementation effect of PBIPs. The model has been validated using historical data from Shenyang City from 2015 to 2022 and exhibits good predictive ability, which can be utilized to simulate the dynamic impact of PBIPs on PB development from 2023 to 2030. The research results indicate that PBIPs in Shenyang have not been fully utilized, and targeted improvements and strengthening of policy implementation are needed. Among them, the FP has the most significant promoting effect on the newly added area of PBs and the supply of PBs. The greater the financial subsidy, the more pronounced the promotional effect. It is currently the most effective incentive method. But consideration should be given to the government’s fiscal capacity to avoid excessive pressure on policy expenditures. PTP and R&DSP play a significant role in promoting technological innovation, reducing construction costs, and controlling carbon emissions. In particular, R&DSP has a lasting impact on reducing carbon emissions and serves as a key support for achieving sustainable development. The LP provides basic support for the PB project and has strong strategic significance. In contrast, FSP, CPMP, and PRRP have a positive impact on the development of PBs, but their promotional effect is relatively limited. The comprehensive simulation results show that the implementation effect of policy combination is better than that of a single policy, which can more effectively promote the development of PBs. However, excessive strengthening of various policies may lead to increased fiscal burden and increased dependence on enterprises. According to the regional development stage and financial situation, policy resources should be allocated reasonably to promote the construction of a dynamic adjustment and hierarchical classification policy system, thereby achieving the sustainable development goals for PBs.

6.1. Implications

This study has rich theoretical and practical significance. For governments and policymakers, this study divides the impact stages of PBIPs on the development of PBs. It constructs a dynamic policy system that covers the entire production process of PBs. Through simulation and sensitivity analysis, the relative contributions and marginal effects of seven types of policies on PB development were revealed, providing data support and decision-making basis for policy optimization, resource allocation, and fiscal regulation. The research results can provide theoretical references for the government to formulate more targeted, phased, and regionally adaptable policy combinations. This helps accelerate the sustainable development of the construction industry. For enterprises, this study helps them identify key policy tools, such as fiscal subsidies, tax incentives, and research and development support, enabling them to develop more targeted strategic plans and allocate resources more effectively. Based on the analysis of the implementation stages and effects of different policies, enterprises can adjust their technological paths, optimize their production structure, actively participate in government incentive programs, and enhance their market competitiveness. For the academic community, this study proposes an analytical framework of “policy text content–policy impact path–policy implementation effect” at the theoretical level, filling the gap in existing research on the dynamic impact mechanism and system feedback modeling of PBIPs. The constructed SD model is based on literature and empirical data, possessing strong universality and scalability. It provides a methodological paradigm and model foundation for future research in policy evaluation, green and low-carbon development simulation, and other related areas. This not only helps stakeholders such as governments, universities, and businesses pay attention to the implementation process and effectiveness of PBIPs but also provides theoretical references for other regions to research the effectiveness of PBIP implementation.

6.2. Limitations and Further Directions

The limitations of this study are as follows. (1) Due to the difficulty in quantifying some indicators and obtaining data, individual system factors that are difficult to quantify, such as the social responsibility of the real estate enterprise, have been excluded. It may cause a slight deviation in the simulation accuracy of the study but it does not affect the evolution trend of the system. In subsequent research, scientific and professional methods should be employed to quantify these indicators and incorporate them into the PBIP impact system, thereby making the study more comprehensive. (2) This article only considers current PBIPs in Shenyang. Future research may consider including the punishment policies issued by the Shenyang Municipal Government. (3) There was no discussion on model uncertainty: the next step of the research should analyze whether the model is easily affected by specific parameter changes.

Author Contributions

Conceptualization, C.G., W.Y. and Z.G.; methodology, C.G.; software, C.G.; validation, C.G. and W.Y.; formal analysis, C.G. and Z.G.; investigation, C.G.; resources, W.Y.; data curation, C.G. and Z.G.; writing—original draft preparation, C.G. and Z.G.; writing—review and editing, W.Y.; supervision, W.Y.; project administration, W.Y.; funding acquisition, W.Y. All authors have read and agreed to the published version of the manuscript.

Funding

This research was funded by the National Natural Science Foundation of China, grant number U23A20603.

Institutional Review Board Statement

Not applicable.

Informed Consent Statement

Not applicable.

Data Availability Statement

Data for this study are available upon request to the corresponding author.

Conflicts of Interest

The authors declare no conflicts of interest.

Abbreviations

The following abbreviations are used in this manuscript:
PBsPrefabricated buildings
PBIPsIncentive policies for prefabricated buildings
LPLand policy
PRRPPlot ratio reward policy
FPFund policy
FSPFinancial support policy
PTPPreferential tax policy
R&DSPResearch and development support policy
CPMPConstruction process management policy

Appendix A

Table A1 shows the variables of the PBIP impact system, and Table A2 shows the essential equation design.
Table A1. The variables of the PBIP impact system.
Types of VariablesNumberVariablesUnits
State variable1The supply of PBs104 m2
2The demand for PBs
Rate variable3The newly added area of PBs104 m2
4Increased market demand
Auxiliary variable5Land transfer priceYuan
6Land transfer area104 m2
7Newly added total building area104 m2
8Output value of PBs108 Yuan
9Carbon emission reduction104 tons
10GDP108 Yuan
11Per capita GDP104 Yuan
12Supply and demand ratio%
13The selling price of PBsYuan
14Permanent population104 persons
15Per capita disposable incomeYuan
16Technical level growth rate%
17The benefits of PBsYuan
18LPDmnl
19PRRP
20FP
21FSP
22PTP
23R&DSP
24CPMP
25Supply and demand ratio influence factors
26The quality of PBs
27Consumers’ purchase intention
28Increase in the purchase of PBs
29The influence coefficient of FP on cost savings for construction enterprises
30The influence coefficient of CPMP on cost savings for construction enterprises
31Cost savings for construction enterprise
32The influence coefficient of LP on cost savings for development enterprises
33The influence coefficient of LP on degree of support for the development of PBs
34The influence coefficient of FP on cost savings for development enterprises
35The influence coefficient of PRRP on cost savings for development enterprises
36Cost savings for development enterprises
37Cost incentives for the development of PBs
38The willingness of development enterprises to build PBs
39The influence coefficient of R&DSP on the technical level of PBs
40The influence coefficient of PTP on the technical level of PBs
41The influence coefficient of PTP on cost savings for prefabricated component supplier
42The influence coefficient of FSP on cost savings for development enterprises
43The influence coefficient of the quality of PBs on consumers’ purchase intention
44The influence coefficient of FSP on consumers’ purchase intention
45The influence coefficient of benefits on the development of PBs
46The influence coefficient of FSP on degree of support for the development of PBs
47The influence coefficient of CPMP on degree of support for the development of PBs
48The influence coefficient of CPMP on cost savings for prefabricated component supplier
49Degree of support for the development of PBs
50Cost savings for prefabricated component supplier
Table A2. The essential equations of the PBIP impact system.
VariablesEquations
The demand for PBsINTEG (Increased market demand, 0), the initial value is 0.
Newly added area of PBsNewly added total building area × The willingness of development enterprises to build PBs
Increased market demandConsumers’ purchase intention × (0.057 × The selling price of PBs + 0.49 × Per capita disposable income + 0.56 × Permanent population) × 0.2 + Carbon emission reduction × 0.8
Land transfer areaWITH LOOKUP{[(2015,0)-(2030,9110)],(2015,425),(2016,396),(2017,410),(2018,530),(2019,535),(2020,704),(2021,843),(2022,955),(2023,1020),(2024,1260),(2025,1310),(2026,1352),(2027,1450),(2028,1494),(2029,1508),(2030,1521)}
Newly added total building area450.578 + Land transfer price × 0.139 + Land transfer area × 1.023
Output value of PBsNewly added area of PBs × The selling price of PBs/10000
Carbon emission reduction0.26 × (1 + 0.8 × The technical level of PBs) × Newly added area of PBs
GDP(Output value of PBs × 0.804) + 4879.48
Per capita GDPGDP/Permanent population
Supply and demand ratioThe supply of PBs/The demand for PBs
Supply and demand ratio influence factors1.55 × Supply and demand ratio
The selling price of PBsSupply and demand ratio influence factors × 10,000
Permanent populationWITH LOOKUP{[(2015,800)-(2030,900)],(2015,829.1),(2016,829.2),(2017,829.4),(2018,831.6),(2019,832.2),(2020,832.8),(2021,833.7),(2022,834.6),(2023,835.5),(2024,836.6),(2025,837.2),(2026,838.1),(2027,838.9),(2028,839.8),(2029,840.6),(2030,841.5)}
Per capita disposable incomePer capita GDP × 0.615
The quality of PBsThe technical level of PBs × 0.85
Consumers’ purchase intentionThe influence coefficient of FSP on consumers’ purchase intention × 0.5 + The influence coefficient of the quality of PBs on consumers’ purchase intention × 0.5
Increase in the purchase of PBsConsumers’ purchase intention × The supply of PBs
The benefits of PBsIncrease in the purchase of PBs × The selling price of PBs
The influence coefficient of FP on cost savings for construction enterprisesIF THEN ELSE(FP ≤ 0.1,0.09, IF THEN ELSE(FP ≤ 0.15,0.13, IF THEN ELSE(FP ≤ 0.2,0.156, IF THEN ELSE(FP ≤ 0.25, 0.178, IF THEN ELSE(FP ≤ 0.3,0.212, IF THEN ELSE(FP ≤ 0.35,0.2416, IF THEN ELSE(FP ≤ 0.4,0.26, IF THEN ELSE(FP ≤ 0.45,0.29, IF THEN ELSE(FP ≤ 0.5,0.32, IF THEN ELSE(FP ≤ 0.55,0.36, IF THEN ELSE(FP ≤ 0.6,0.395, IF THEN ELSE(FP ≤ 0.65,0.425, IF THEN ELSE(FP ≤ 0.7,0.458, IF THEN ELSE(FP ≤ 0.75,0.534, IF THEN ELSE(FP ≤ 0.8,0.574, IF THEN ELSE(FP ≤ 0.85, 0.62, IF THEN ELSE(FP ≤ 0.88,0.66, IF THEN ELSE(FP ≤ 0.9,0.69, IF THEN ELSE(FP ≤ 0.95, 0.72, IF THEN ELSE(FP ≤ 0.98, 0.75,0.79))))))))))))))))))))
Cost savings for development enterprises0.4 × The influence coefficient of FP on cost savings for development enterprises + 0.2 × The influence coefficient of FSP on cost savings for development enterprises + 0.3 × The influence coefficient of LP on cost savings for development enterprises + 0.1 × The influence coefficient of PRRP on cost savings for development enterprises
Cost incentives for the development of PBs0.2 × Cost savings for construction enterprise + 0.2 × Cost savings for prefabricated component supplier + 0.6 × Cost savings for development enterprises
Cost savings for prefabricated component supplierThe influence coefficient of CPMP on cost savings for prefabricated component supplier × 0.4 + The influence coefficient of PTP on cost savings for prefabricated component supplier × 0.6

References

  1. Huang, L.Z.; Krigsvoll, G.; Johansen, F.; Liu, Y.P.; Zhang, X.L. Carbon emission of global construction sector. Renew. Sustain. Energy Rev. 2018, 81, 1906–1916. [Google Scholar] [CrossRef]
  2. Sebaibi, N.; Boutouil, M. Reducing energy consumption of prefabricated building elements and lowering the environmental impact of concrete. Eng. Struct. 2020, 213, 8. [Google Scholar] [CrossRef]
  3. Li, Y.L.; Gao, Y.; Meng, X.X.; Liu, X.L.; Feng, Y.C. Assessing the air pollution abatement effect of prefabricated buildings in China. Environ. Res. 2023, 239, 12. [Google Scholar] [CrossRef]
  4. El-Abidi, K.M.A.; Ofori, G.; Zakaria, S.A.S.; Aziz, A.R.A. Using Prefabricated Building to Address Housing Needs in Libya: A Study based on Local Expert Perspectives. Arab. J. Sci. Eng. 2019, 44, 8289–8304. [Google Scholar] [CrossRef]
  5. Cheng, B.Q.; Wei, Y.H.; Zhang, W.; Zhou, X.T.; Chen, H.H.; Huang, L.P.; Huang, J.L.; Kang, X.F. Evolutionary Game Simulation on Government Incentive Strategies of Prefabricated Construction: A System Dynamics Approach. Complexity 2020, 2020, 11. [Google Scholar] [CrossRef]
  6. Han, Y.H.; Yan, X.Y.; Piroozfar, P. An overall review of research on prefabricated construction supply chain management. Eng. Constr. Archit. Manag. 2023, 30, 5160–5195. [Google Scholar] [CrossRef]
  7. Dong, C.; Dong, X.C.; Jiang, Q.Z.; Dong, K.Y.; Liu, G.X. What is the probability of achieving the carbon dioxide emission targets of the Paris Agreement? Evidence from the top ten emitters. Sci. Total Environ. 2018, 622, 1294–1303. [Google Scholar] [CrossRef]
  8. Luo, T.; Xue, X.L.; Wang, Y.N.; Xue, W.R.; Tan, Y.T. A systematic overview of prefabricated construction policies in China. J. Clean. Prod. 2021, 280, 17. [Google Scholar] [CrossRef]
  9. Yan, W.D.; Guo, C.B.; Li, L.H. Evaluating the Effect of Prefabricated Building Incentive Policies Using Structural Equation Modeling: A Chinese Empirical Study. Buildings 2024, 14, 1304. [Google Scholar] [CrossRef]
  10. Su, Y.K.; Xue, H.; Han, R.; Zhang, S.J.; Sun, Z.; Song, Y.R. Policies of Improving Developers? Willingness to Implement Prefabricated Building: A Case Study from China. J. Civ. Eng. Manag. 2023, 29, 289–302. [Google Scholar] [CrossRef]
  11. Lopez, D.; Froese, T.M. Analysis of Costs and Benefits of Panelized and Modular Prefabricated Homes. In Proceedings of the International Conference on Sustainable Design, Engineering and Construction (ICSDEC), Tempe, AZ, USA, 18–20 May 2016; pp. 1291–1297. [Google Scholar]
  12. Pujadas-Gispert, E.; Sanjuan-Delmás, D.; Josa, A. Environmental analysis of building shallow foundations: The influence of prefabrication, typology, and structural design codes. J. Clean. Prod. 2018, 186, 407–417. [Google Scholar] [CrossRef]
  13. Zhou, J.Y.; Qin, Y.J.; Fang, S.Z. Impacts of Consumers and Real Estate Enterprises on the Implementation of Prefabrication in Residential Buildings: The Moderating Role of Incentive Policies. Sustainability 2019, 11, 4827. [Google Scholar] [CrossRef]
  14. Sewerin, S.; Beland, D.; Cashore, B. Designing policy for the long term: Agency, policy feedback and policy change. Policy Sci. 2020, 53, 243–252. [Google Scholar] [CrossRef]
  15. Jiang, W.P.; Luo, L.R.; Wu, Z.Z.; Fei, J.B.; Antwi-Afari, M.F.; Yu, T. An Investigation of the Effectiveness of Prefabrication Incentive Policies in China. Sustainability 2019, 11, 5149. [Google Scholar] [CrossRef]
  16. Lopes, G.C.; Vicente, R.; Azenha, M.; Ferreira, T.M. A systematic review of Prefabricated Enclosure Wall Panel Systems: Focus on technology driven for performance requirements. Sustain. Cities Soc. 2018, 40, 688–703. [Google Scholar] [CrossRef]
  17. Howes, R. Industrialized Housing Construction—The UK Experience. In Proceedings of the International Conference on Advances in Building Technology (ABT 2002), Hong Kong, China, 4–6 December 2002; pp. 383–390. [Google Scholar]
  18. Wang, Y.N.; Xue, X.L.; Yu, T.; Wang, Y.W. Mapping the dynamics of China’s prefabricated building policies from 1956 to 2019: A bibliometric analysis. Build. Res. Inf. 2021, 49, 216–233. [Google Scholar] [CrossRef]
  19. Xu, Z.; Zayed, T.; Niu, Y.M. Comparative analysis of modular construction practices in mainland China, Hong Kong and Singapore. J. Clean. Prod. 2020, 245, 14. [Google Scholar] [CrossRef]
  20. Gan, X.L.; Xie, K.X.; Liu, H.Q.; Rameezdeen, R.; Wen, T. A bibliometric and content analysis of policy instruments on facilitating the development of prefabricated construction in China. Eng. Constr. Archit. Manag. 2023, 30, 3976–3996. [Google Scholar] [CrossRef]
  21. Han, Y.H.; Xu, X.B.; Zhao, Y.; Wang, X.P.; Chen, Z.Y.; Liu, J. Impact of Consumer Preference on the Decision-Making of Prefabricated Building Developers. J. Civ. Eng. Manag. 2022, 28, 166–176. [Google Scholar] [CrossRef]
  22. Wang, Q.Y.; Gong, Z.Q.; Li, N.; Liu, C.K. Policy Framework for Prefabricated Buildings in Underdeveloped Areas: Enlightenment from the Comparative Analysis of Three Types of Regions in China. Buildings 2023, 13, 201. [Google Scholar] [CrossRef]
  23. Wang, S.M.; Wang, C.J.; Li, W.L. Research on Incentive Policy Evaluation of Prefabricated Buildings Based on Grey Relational Analysis. Mob. Inf. Syst. 2022, 2022, 13. [Google Scholar] [CrossRef]
  24. Zhang, Y.; Jin, Y.; Xue, X. Evaluation of Construction Industrialization Policy Based on PMC Index Model. In Proceedings of the International Conference on Construction and Real Estate Management, Charleston, SC, USA, 9–10 August 2018. [Google Scholar]
  25. Wang, L.Y.; Zhang, J.R.; Lei, X.; Yang, B.Z. Effect and Mechanism of China’s Prefabricated Building Policies to Promote Patent Output with Carbon-Neutrality as a Target. J. Green Build. 2024, 19, 28. [Google Scholar] [CrossRef]
  26. Wang, J.; Qin, Y.J.; Zhou, J.Y. Incentive policies for prefabrication implementation of real estate enterprises: An evolutionary game theory-based analysis. Energy Policy 2021, 156, 12. [Google Scholar] [CrossRef]
  27. Huang, Q.Y.; Wang, J.W.; Ye, M.W.; Zhao, S.M.; Si, X. A Study on the Incentive Policy of China’s Prefabricated Residential Buildings Based on Evolutionary Game Theory. Sustainability 2022, 14, 1926. [Google Scholar] [CrossRef]
  28. Fang, D.B.; Zhao, C.Y.; Kleit, A.N. The impact of the under enforcement of RPS in China: An evolutionary approach. Energy Policy 2019, 135, 13. [Google Scholar] [CrossRef]
  29. Selya, A.S. Reducing the smoking-related health burden in the USA through diversion to electronic cigarettes: A system dynamics simulation study. Harm Reduct. J. 2021, 18, 15. [Google Scholar] [CrossRef]
  30. United Nations Department of Economic and Social Affairs. Transforming Our World: The 2030 Agenda for Sustainable Development. 2015. Available online: https://sdgs.un.org/2030agenda (accessed on 13 May 2020).
  31. Li, X.; Wang, Y.; Geng, Y.; Wang, Q. Policy Trends and Policy Analysis for the Industrialization of the Construction Industry: A Review. In Proceedings of the International Conference on Construction and Real Estate Management, Charleston, SC, USA, 9–10 August 2018. [Google Scholar]
  32. Egmond, C.; Jonkers, R.; Kok, G. A strategy to encourage housing associations to invest in energy conservation. Energy Policy 2005, 33, 2374–2384. [Google Scholar] [CrossRef]
  33. Steinhardt, D.A.; Manley, K. Adoption of prefabricated housing-the role of country context. Sustain. Cities Soc. 2016, 22, 126–135. [Google Scholar] [CrossRef]
  34. Du, H.; Han, Q.; Sun, J.; Wang, C.C. Adoptions of prefabrication in residential sector in China: Agent-based policy option exploration. Eng. Constr. Archit. Manag. 2023, 30, 1697–1725. [Google Scholar] [CrossRef]
  35. Gan, X.L.; Liu, L.C.; Wen, T. Evaluation of Policies on the Development of Prefabricated Construction in China: An Importance-Performance Analysis. J. Green Build. 2022, 17, 149–168. [Google Scholar] [CrossRef]
  36. Gao, Y.; Tian, X.L. Prefabrication policies and the performance of construction industry in China. J. Clean. Prod. 2020, 253, 13. [Google Scholar] [CrossRef]
  37. Zhang, Y.B.; Yi, X.; Li, S.S.; Qiu, H. Evolutionary game of government safety supervision for prefabricated building construction using system dynamics. Eng. Constr. Archit. Manag. 2023, 30, 2947–2968. [Google Scholar] [CrossRef]
  38. Yao, P.B.; Liu, H.D. Research on Behavior Incentives of Prefabricated Building Component Manufacturers. Information 2021, 12, 284. [Google Scholar] [CrossRef]
  39. Han, Y.H.; Song, S.Y.; Zhuang, W.L. Behavioral Strategies between Government and Real Estate Developers on Prefabricated Buildings Based on Triangular Fuzzy Matrix Game. Buildings 2022, 12, 2102. [Google Scholar] [CrossRef]
  40. Li, X.J.; Wang, C.; Kassem, M.A.; Bimenyimana, S. Fairness Theory-Driven Incentive Model for Prefabricated Building Development. Arab. J. Sci. Eng. 2022, 47, 13487–13498. [Google Scholar] [CrossRef]
  41. Zhang, Y.; Wang, S.X.; Yao, J.T.; Tong, R.P. The impact of behavior safety management system on coal mine work safety: A system dynamics model of quadripartite evolutionary game. Resour. Policy 2023, 82, 14. [Google Scholar] [CrossRef]
  42. Xia, Y.X.; Qi, Y.; Chen, J.Y. Research on the Development Policy of Prefabricated Building based on asymmetric Evolutionary Game. In Proceedings of the 2nd International Conference on Civil Engineering, Environment Resources and Energy Materials, Changsha, China, 18–20 September 2020. [Google Scholar]
  43. Shen, K.C.; Li, X.D.; Cao, X.Y.; Zhang, Z.H. Prefabricated Housing Subsidy Analysis in China Based on an Evolutionary Game Model. J. Civ. Eng. Manag. 2021, 27, 553–570. [Google Scholar] [CrossRef]
  44. Song, Y.H.; Wang, J.W.; Liu, D.H.; Huangfu, Y.R.; Guo, F.; Liu, Y.P. The Influence of Government’s Economic Management Strategies on the Prefabricated Buildings Promoting Policies: Analysis of Quadripartite Evolutionary Game. Buildings 2021, 11, 444. [Google Scholar] [CrossRef]
  45. Jin, X.; Shen, G.F.; Luo, L.Z.; Zhou, X. Influence of policies on stakeholders to drive the success of modular integrated construction in Hong Kong. Eng. Constr. Archit. Manag. 2024, 32, 2814–2843. [Google Scholar] [CrossRef]
  46. Wu, C.K.; Li, X.; Guo, Y.J.; Wang, J.; Ren, Z.L.; Wang, M.; Yang, Z.L. Natural language processing for smart construction: Current status and future directions. Autom. Constr. 2022, 134, 22. [Google Scholar] [CrossRef]
  47. Eghbali, M.A.; Rasti-Barzoki, M.; Safarzadeh, S. A hybrid evolutionary game-theoretic and system dynamics approach for analysis of implementation strategies of green technological innovation under government intervention. Technol. Soc. 2022, 70, 16. [Google Scholar] [CrossRef]
  48. Bach, M.P.; Tustanovski, E.; Ip, A.W.H.; Yung, K.L.; Roblek, V. System dynamics models for the simulation of sustainable urban development A review and analysis and the stakeholder perspective. Kybernetes 2020, 49, 460–504. [Google Scholar] [CrossRef]
  49. Liu, P.; Lin, B.R.; Zhou, H.; Wu, X.Y.; Little, J.C. CO2 emissions from urban buildings at the city scale: System dynamic projections and potential mitigation policies. Appl. Energy 2020, 277, 13. [Google Scholar] [CrossRef]
  50. Vesterager, J.P.; Frederiksen, P.; Kristensen, S.B.P.; Vadineanu, A.; Gaube, V.; Geamana, N.A.; Pavlis, V.; Terkenli, T.S.; Bucur, M.M.; van der Sluis, T.; et al. Dynamics in national agri-environmental policy implementation under changing EU policy priorities: Does one size fit all? Land Use Policy 2016, 57, 764–776. [Google Scholar] [CrossRef]
  51. Romagnoli, F.; Barisa, A.; Dzene, I.; Blumberga, A.; Blumberga, D. Implementation of different policy strategies promoting the use of wood fuel in the Latvian district heating system: Impact evaluation through a system dynamic model. Energy 2014, 76, 210–222. [Google Scholar] [CrossRef]
  52. Ansah, J.P.; Matchar, D.B.; Malhotra, R.; Love, S.R.; Liu, C.; Do, Y. Projecting the effects of long-term care policy on the labor market participation of primary informal family caregivers of elderly with disability: Insights from a dynamic simulation model. BMC Geriatr. 2016, 16, 14. [Google Scholar] [CrossRef]
  53. Wu, H.J.; Qian, Q.K.; Straub, A.; Visscher, H. Stakeholder Perceptions of Transaction Costs in Prefabricated Housing Projects in China. J. Constr. Eng. Manag. 2021, 147, 15. [Google Scholar] [CrossRef]
  54. Ministry of Housing and Urban-Rural Development of the People’s Republic of China. Letter from the General Office of the Ministry of Housing and Urban-Rural Development on the Recognition of the First Batch of Demonstration Cities and Industrial Bases for Prefabricated Buildings. 2017. Available online: https://www.mohurd.gov.cn/gongkai/zc/wjk/art/2017/art_17339_233987.html (accessed on 10 May 2025).
  55. Office of the People’s Gorvernment of Shenyang City. Notice of the Office of the People’s Government of Shenyang City on Printing and Distributing the Work Plan for Vigorously Developing Prefabricated Buildings in Shenyang City. 2021. Available online: https://www.shenyang.gov.cn/zwgk/zcwj/zfwj/szfbgtwj1/202112/t20211201_1700616.html (accessed on 8 February 2025).
  56. Gao, Y. Research on the Development of National Demonstration Cities for Prefabricated Buildings—Shenyang. 2020. Available online: https://zhuanlan.zhihu.com/p/339681342 (accessed on 8 February 2025).
  57. Li, L.H.; Shi, J.; Liu, H.; Zhang, R.Y.; Guo, C.B. Simulation of Carbon Emission Reduction in Power Construction Projects Using System Dynamics: A Chinese Empirical Study. Buildings 2023, 13, 3117. [Google Scholar] [CrossRef]
  58. Jiang, L.; Li, Z.F.; Li, L.; Gao, Y.L. Constraints on the Promotion of Prefabricated Construction in China. Sustainability 2018, 10, 2516. [Google Scholar] [CrossRef]
  59. Baek, C.H.; Park, S.H. Changes in renovation policies in the era of sustainability. Energy Build. 2012, 47, 485–496. [Google Scholar] [CrossRef]
  60. Li, C.Z.; Hong, J.K.; Fan, C.; Xu, X.X.; Shen, G.Q. Schedule delay analysis of prefabricated housing production: A hybrid dynamic approach. J. Clean. Prod. 2018, 195, 1533–1545. [Google Scholar] [CrossRef]
  61. Chen, Q.; Liu, P.-H.; Chen, C.-T. Evolutionary game analysis of government and enterprises during promotion process of prefabricated construction. J. Interdiscip. Math. 2017, 20, 1587–1593. [Google Scholar] [CrossRef]
  62. Hong, J.K.; Shen, G.Q.P.; Li, Z.D.; Zhang, B.Y.; Zhang, W.Q. Barriers to promoting prefabricated construction in China: A cost-benefit analysis. J. Clean. Prod. 2018, 172, 649–660. [Google Scholar] [CrossRef]
  63. Jiang, R.; Mao, C.; Hou, L.; Wu, C.K.; Tan, J.J. A SWOT analysis for promoting off-site construction under the backdrop of China’s new urbanisation. J. Clean. Prod. 2018, 173, 225–234. [Google Scholar] [CrossRef]
  64. Jiang, W.; Yuan, M. Coordination of Prefabricated Construction Supply Chain under Cap-and-Trade Policy Considering Consumer Environmental Awareness. Sustainability 2022, 14, 5724. [Google Scholar] [CrossRef]
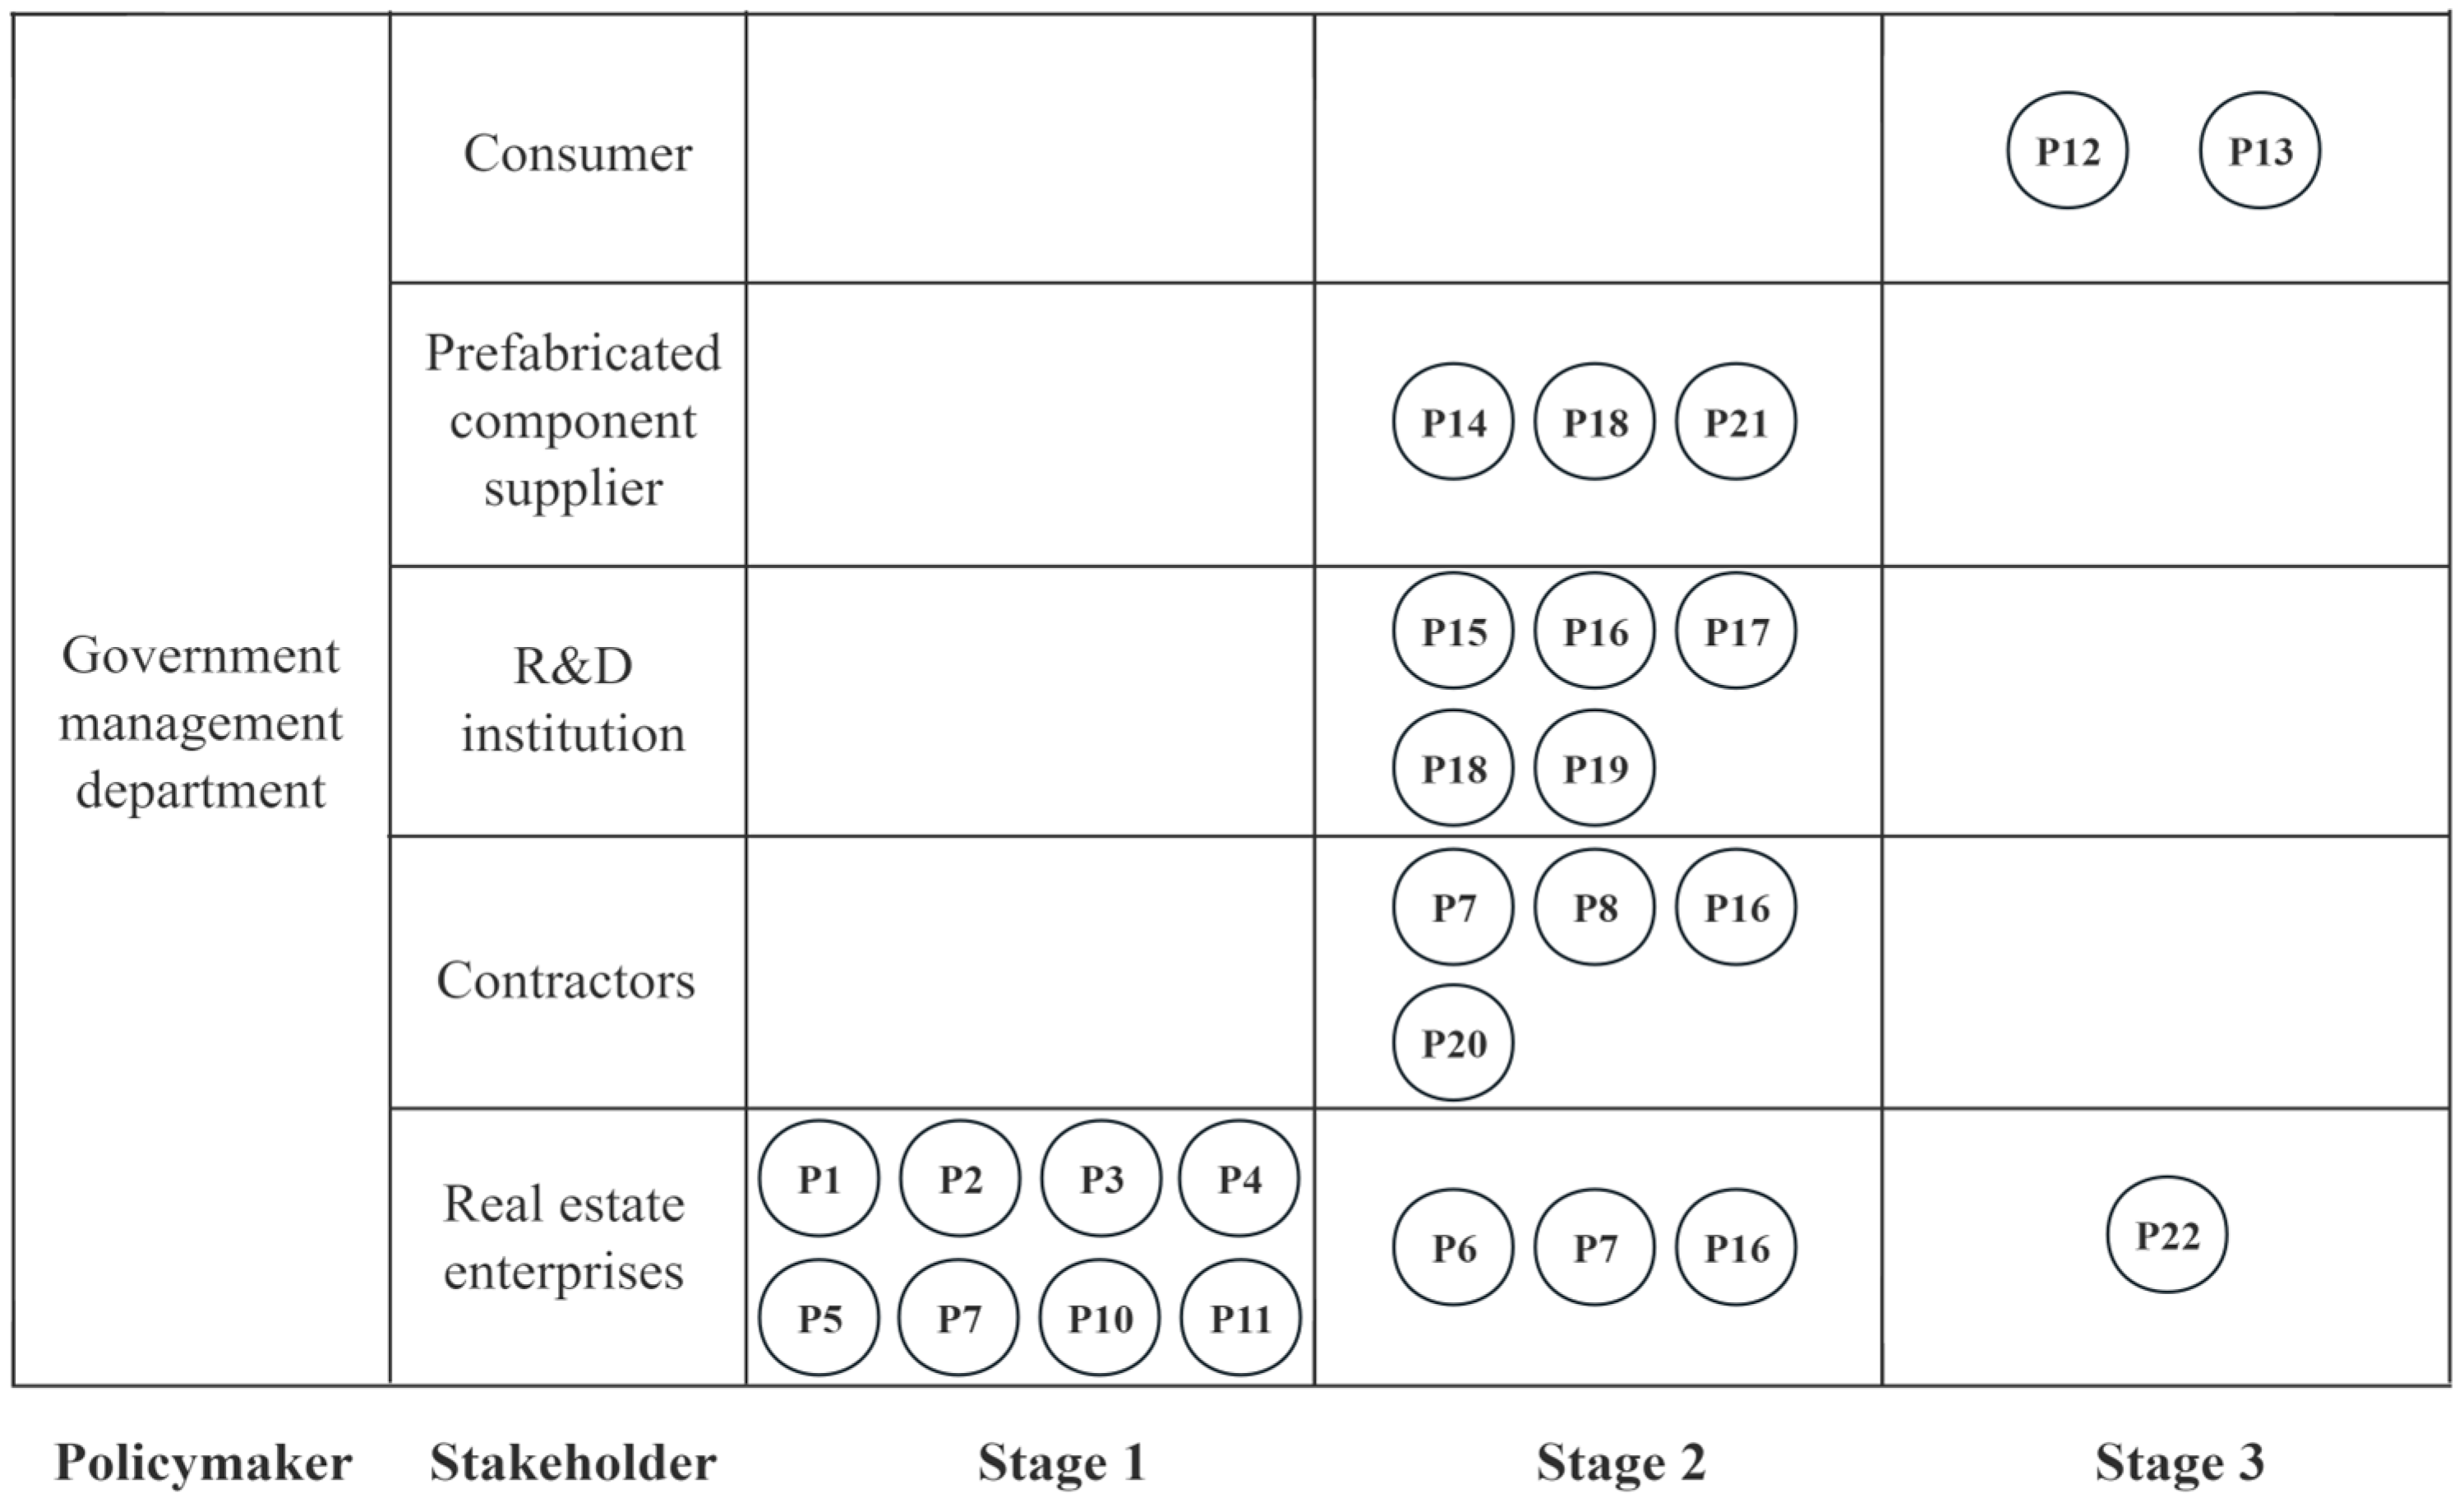
Figure 1. Research flow chart.
Applsci 15 05627 g001
Figure 2. The framework for studying the effect of PBIP implementation using SD.
Applsci 15 05627 g002
Figure 3. Impact of PBIP on stakeholders.
Applsci 15 05627 g003
Figure 4. Causal feedback diagram of PBIP implementation effect.
Applsci 15 05627 g004
Figure 5. System flow chart of PBIP implementation effect.
Applsci 15 05627 g005
Figure 6. Simulation results of the impact of PBIP on the newly added area of PB. (a) Simulation results of LP, (b) Simulation results of PRRP, (c) Simulation results of FP, (d) Simulation results of FSP, (e) Simulation results of PTP, (f) Simulation results of R&DSP, (g) Simulation results of CPMP.
Applsci 15 05627 g006aApplsci 15 05627 g006b
Figure 7. Simulation results of the impact of PBIPs on the supply of PBs. (a) Simulation results of LP, (b) Simulation results of PRRP, (c) Simulation results of FP, (d) Simulation results of FSP, (e) Simulation results of PTP, (f) Simulation results of R&DSP, (g) Simulation results of CPMP.
Applsci 15 05627 g007
Figure 8. Simulation results of PBIPs on carbon emission reduction. (a) Simulation results of LP, (b) Simulation results of PRRP, (c) Simulation results of FP, (d) Simulation results of FSP, (e) Simulation results of PTP, (f) Simulation results of R&DSP, (g) Simulation results of CPMP.
Applsci 15 05627 g008aApplsci 15 05627 g008b
Figure 9. Comprehensive simulation results of PBIPs. (a) Simulation results of the newly added area of PBs, (b) Simulation results of the supply of PBs, (c) Simulation results of the carbon emission reduction.
Applsci 15 05627 g009
Table 1. Classification and stage of action of PBIP.
PoliciesThe Specific Contents of the PolicyStage
123
LPProvide priority land for PB. (P1)××
Reduce the land transfer conditions of PB. (P2)××
Land transfer fees can be paid in installments. (P3)××
PRRPThe prefabricated area of the exterior wall is not included in the plot ratio calculation. (P4)××
Reward PBs with a plot ratio of no more than 3%. (P5)××
FPGrant financial subsidies to eligible PB projects. (P6)×
Provide financial subsidies to PB-related enterprises. (P7)
Qualified PB projects may not pay waste discharge fees. (P8)××
Give priority to returning PBs’ wall reform fund. (P9)××
FSPGive priority to lending to PB-related enterprises. (P10)××
Discount interest on loans to PB-related enterprises. (P11)××
Give priority to lending to consumers who buy PBs. (P12)××
The down payment ratio was reduced to 20%. (P13)××
PTPVAT refund for prefabricated components. (P14)××
R&D expenses of PB technology are not subject to tax. (P15)××
R&DSPThe government promotes the preparation of PB technical standards. (P16)××
Set up a government fund to support the R&D of PBs. (P17)××
Support technology transformation of PBs. (P18)××
Building the Key Laboratory of PB Technology. (P19)××
CPMPHydropower projects enter the construction site in advance. (P20)××
Approval process for reducing transportation of large prefabricated components. (P21)××
Provide a fast track for PB sales approval. (P22)××
Note: The “√” means that the policy has an impact at this stage, and “×” means that the policy has no impact.
Table 2. Verification of GDP simulation results.
YearSimulation Value (108 yuan)Actual Value (108 yuan)Error (%)
20155056.525242.93.55%
20165376.825288.9−1.66%
20175702.545549.3−2.76%
20186021.356101.91.32%
20196407.266464.50.89%
20206815.226571.5−3.71%
20217264.727249.7−0.21%
20227519.717695.82.29%
Table 3. Confidence interval of PBIP implementation effect simulation values.
VariablesPoliciesRate of IncreaseMean ValueStandard DeviationConfidence Interval (95%)
The newly added area of PB
(104 m2)
Initial value1749.58130.65[1493.51, 2005.65]
LP+10%1765.53131.38[1508.02, 2023.03]
PRRP1752.41130.69[1496.25, 2008.56]
FP1765.10131.91[1506.55, 2023.64]
FSP1762.06132.28[1502.80, 2021.32]
PTP1771.04135.03[1506.38, 2035.69]
R&DSP1768.08131.90[1509.54, 2026.61]
CPMP1759.37131.48[1501.66, 2017.07]
LP+20%1784.04131.52[1526.25, 2041.82]
PRRP1758.99131.96[1500.35, 2017.63]
FP1792.03136.75[1523.99, 2060.07]
FSP1776.88133.57[1515.09, 2038.67]
PTP1785.05136.56[1517.39, 2052.71]
R&DSP1788.05133.52[1526.35, 2049.76]
CPMP1772.28132.84[1511.92, 2032.63]
LP+30%1812.28131.00[1555.51, 2069.05]
PRRP1767.12134.37[1503.76, 2030.48]
FP1813.26138.76[1541.29, 2085.22]
FSP1792.98137.10[1524.26, 2061.69]
PTP1801.76138.36[1530.57, 2072.94]
R&DSP1797.33133.64[1535.41, 2059.26]
CPMP1783.12134.81[1518.90, 2047.34]
The supply of PB
(104 m2)
Initial value9803.541356.91[7143.98, 12,463.09]
LP+10%9861.291373.35[7169.53, 12,553.05]
PRRP9812.711359.38[7148.33, 12,477.09]
FP9864.441376.10[7167.28, 12,561.59]
FSP9836.691365.82[7159.68, 12,513.70]
PTP9885.671388.56[7164.10, 12,607.24]
R&DSP9866.011374.86[7171.30, 12,560.73]
CPMP9845.101371.44[7157.07, 12,533.12]
LP+20%9919.241388.23[7198.31, 12,640.16]
PRRP9827.341364.49[7152.94, 12,501.74]
FP9992.901420.41[7208.90, 12,776.90]
FSP9884.811380.19[7179.64, 12,589.99]
PTP9931.021402.43[7182.26, 12,679.78]
R&DSP9932.311393.57[7200.90, 12,663.71]
CPMP9873.771377.12[7174.61, 12,572.93]
LP+30%10,031.201416.00[7255.83, 12,806.57]
PRRP9868.701381.34[7161.28, 12,576.11]
FP10,112.831454.86[7261.30, 12,964.35]
FSP9955.751403.34[7205.21, 12,706.30]
PTP9980.491417.48[7202.24, 12,758.75]
R&DSP9985.591413.82[7214.50, 12,756.68]
CPMP9894.031382.30[7184.73, 12,603.32]
Carbon emission reduction
(104 ton)
Initial value685.9861.90[564.66, 807.29]
LP+10%693.5162.53[570.96, 816.06]
PRRP687.0761.92[565.71, 808.43]
FP692.0662.50[569.57, 814.56]
FSP690.2862.33[568.10, 812.45]
PTP701.7565.42[573.53, 829.96]
R&DSP704.9264.41[578.67, 831.17]
CPMP689.8262.29[567.72, 811.91]
LP+20%701.5463.09[577.88, 825.20]
PRRP688.7962.17[566.94, 810.64]
FP702.7764.56[576.23, 829.31]
FSP696.0962.89[572.84, 819.35]
PTP712.4367.09[580.93, 843.94]
R&DSP724.1466.67[593.47, 854.81]
CPMP694.9062.90[571.62, 818.18]
LP+30%714.0963.66[589.31, 838.86]
PRRP691.3963.00[567.90, 814.88]
FP712.9966.23[583.19, 842.79]
FSP701.3963.95[576.04, 826.73]
PTP722.5568.04[589.18, 855.91]
R&DSP740.7269.19[605.10, 876.33]
CPMP699.2163.72[574.31, 824.11]
Table 4. Setting of comprehensive simulation scheme.
ScenarioLPPRRPFPFSPPTPR&DSPCPMP
Scenario 1↑30%↑30%↑20%↑30%↑10%↑10%↑30%
Scenario 2↑30%↑30%↑30%↑30%↑10%↑10%↑30%
Scenario 3↑30%↑30%↑20%↑30%↑10%↑20%↑30%
Scenario 4↑30%↑30%↑30%↑30%↑10%↑20%↑30%
Scenario 5↑30%↑30%↑20%↑30%↑10%↑30%↑30%
Scenario 6↑30%↑30%↑30%↑30%↑10%↑30%↑30%
Note: “↑” represents an increase in policy intensity.
Disclaimer/Publisher’s Note: The statements, opinions and data contained in all publications are solely those of the individual author(s) and contributor(s) and not of MDPI and/or the editor(s). MDPI and/or the editor(s) disclaim responsibility for any injury to people or property resulting from any ideas, methods, instructions or products referred to in the content.

