Article

Study on Energy Efficiency of Retrofitting Existing Residential Buildings Based on System Dynamics Modeling

1
City Institute, Dalian University of Technology, Dalian 116600, China
2
School of Management, Shenyang Jianzhu University, Shenyang 110168, China
*
Author to whom correspondence should be addressed.
Appl. Sci. 2025, 15(11), 6072; https://doi.org/10.3390/app15116072
Submission received: 13 April 2025 / Revised: 11 May 2025 / Accepted: 16 May 2025 / Published: 28 May 2025

Abstract

:
This study constructs a system dynamics (SD)-based energy efficiency model for retrofitting existing residential buildings by considering urban residential buildings in Liaoning Province, China. In this study, we sorted the boundaries of building energy efficiency accounting, analyzed the current status of related research and system dynamics theory, determined the influencing factors and transmission mechanisms of residential building energy efficiency renovation, set the research boundaries and assumptions, drew the circuit diagrams of various subsystems, determined the main equations and parameters of the model, and ensured the reliability of the model through stability and historicity tests. Through scenario simulation and analysis, it was found that, from 2016 to 2035, the comprehensive benefits of urban residential building renovation will grow slowly in the early stage and rapidly in the late stage, which will potentially have large benefits. The socio-economic environment, governmental policies, energy-saving technologies, market demand, and other factors influence each other, among which the progress of energy-saving technologies has the greatest impact on the comprehensive benefits. Changing the inputs of a certain aspect cannot make the benefits of energy consumption, environment, and economic tripartite grow equally. The energy consumption benefit potential of centralized heating renovation is larger. The results of this study provide a theoretical basis and decision support for the energy-saving transformation of existing residential buildings.

1. Introduction

The building construction industry is a major energy-consuming industry that has important ecological impacts. The global residential building stock accounts for 28% of the world’s energy consumption and is a focal point for current and future climate policies [1]; however, the operational energy consumption and carbon emissions of China’s urban residential buildings account for about 40% of the country’s total building stock [2]. Residential energy efficiency retrofit programs are a widely employed means to achieve energy savings in existing housing [3]. As a major aspect of the action plan for urban renewal, renovation of old residential communities is an important work that enhances people’s sense of gain.
Many studies focused on retrofit strategies from the technical perspective [4,5,6], and these technical measures of renovating old residential communities mainly include external wall insulation, replacement of windows and doors, and upgrading of the heating system. Furthermore, researchers have investigated the impact of policy and standard changes on the retrofit programs [7,8]. As the development of building energy efficiency gradually turns to marketization, retrofit programs shift focus from government to market [9,10]; however, the marketization of retrofit programs is a huge challenge [11,12]. The above study found that the decision of retrofit programs was related to many factors.
Although impact studies have been conducted on the renovation of old urban residential communities, retrofit programs are affected by a series of complex processes. These studies generally ignore the fact that retrofit programs are complex and dynamic systems. The interaction between the various influencing factors indicates that even small changes can have significant effects. Moreover, relevant studies that focus on how retrofit program strategy can maximize energy savings while maintaining cost are lacking.
Therefore, in order to overcome these limitations mentioned in the literature, this study developed a system dynamics model considering market policies, regulations, and technology. We first considered various factors that affect retrofit programs on a macro scale, and based on factor interconnection, we established a transmission mechanism model for the old urban residential communities. In order to validate the proposed model, this research conducts a case study on Liaoning Province in China and assesses retrofit program effects.

2. Literature Review

The retrofit program is a complex, systematic project, and the main concern of evaluating retrofit efficiency is also the ability to balance the harmonious development among the three subsystems of the 3E (energy–economic–environment) system. The performance measures can be classified into three classes of objectives that are taken into account: energy, economic, and environmental issues [13]. In the retrofit program, the performance objectives related to the energy subsystem include energy saving, energy demand, thermal comfort, heating load, etc. [14,15,16]; the objectives related to the economic subsystem include whole-life cost, retrofit investment cost, energy cost, net present value, internal rate of return, payback period, etc. [17,18,19,20]; and the indicators of the environmental subsystem are focused on the whole-life cycle environmental impacts and emission levels, etc. [21,22].
The performance of the retrofit program can be evaluated using a wide variety of methods. Life cycle cost analysis(LCCA) is one of the common methodologies used in the literature for this evaluation: Liu [23] quantitatively analyzed the cost-effectiveness of different energy-saving retrofits for existing residential buildings in northern heating zones using the life cycle cost analysis method, considering only the incremental cost of energy efficiency retrofit construction; Ren [24] analyzed the energy-saving technologies by maximizing the incremental cost-effectiveness of a unit and found that the combined scheme had the optimal benefit, and the research objects were specific green buildings. Another important method is life cycle assessment (LCA). Owing to the complexity of residential buildings, Gustavsson [25] analyzed only the production and operation phases and excluded the on-site construction and demolition, and renovation phases of buildings. These studies only evaluated the distinct parts of the performance measures of the retrofit program problem rather than using a global approach. This is, however, a difficult task, as residential buildings and their environment are a complex whole influenced by economic, environmental, and social aspects, among others. All imaginable actors and their mutual interactions can therefore have a significant impact on the energy efficiency performance of residences.
Most of the above studies have examined the benefit value of project cases from a micro perspective, and the comprehensive performance of the urban-scale retrofitting is yet to be explored from the macro perspective, where multiple factors affect the energy efficiency of the construction industry in a comprehensive manner. System dynamics can reflect the complexity of the energy efficiency retrofit process in residential buildings. It can clearly reflect the composition of the internal elements of the system, by connecting the various subsystems, showing the corresponding positive and negative feedback cause and effect relationships that make the system form a holistic framework, and system dynamics can reflect the complex logic of the subsystems in the process of energy-saving renovation of residential buildings’ feedback relationship between the various subsystems as well as the relationship between the subsystems. System dynamics can be used for predicting carbon emissions [26,27], assembling industrial policy simulations [28], and public building energy saving path [29] by determining feedback loops to decipher the causal relationships and clarify the influencing factors of the complex system, and it can also be used for dynamic simulation.
In this study, we propose an evaluation model of provincial-level region retrofit program based on previous publications, and we endeavor to identify influencing factors of the retrofit program and their transmission mechanisms as shown in Figure 1. Then, we use energy saving, cost of retrofit, and carbon emission reduction as the comprehensive benefits and evaluate the different performances of the retrofit program while changing the influencing factors.

3. Research Methodology

Based on the research results of residential building energy efficiency development, it is found that the analysis of building energy efficiency influencing factors is mostly based on building energy consumption as the dependent variable. The energy benefit of buildings is accounted for in the quantification of energy savings on the basis of building energy consumption. This study considers urban residential buildings in Liaoning Province as the research object, and constructs a system dynamics-based energy efficiency model for retrofitting existing residential buildings. By sorting the boundaries of building energy efficiency accounting, analyzing the current status of related research and system dynamics theory, and determining the influencing factors and transmission mechanisms of residential building energy efficiency renovation, we consider the quantitative building energy efficiency results as the dependent variable, and assess technology, economy, policy, and market to explore the influencing factors of building energy efficiency benefits.

3.1. Influencing Factors and Transmission Mechanisms of Energy Efficiency Retrofits in Residential Building

The construction industry has become a high-energy-consumption industry, and energy saving and emission reduction in this industry need to be addressed. The development of building energy conservation and emission reduction should investigate the reasons for its high energy consumption and constraints, in order to set a target. Research on building energy consumption measurement is broadly divided into micro and macro perspectives. On the micro level, a large number of scholars have measured the energy consumption of civil buildings through computer simulation and field survey methods; as China’s building area is too large, this type of method is not applicable to regional-inter-provincial, or larger-scale, building energy consumption measurements. On the macro level, the mainstream building energy consumption measurement uses historical data on energy consumption in the building sector to build econometric models with indicators such as gross domestic product (GDP), population density, urbanization rate, technological efficiency, floor area, energy prices, and related policies [30,31], in order to predict the energy consumption of the building industry at the macro level. Zhang [32] found that energy consumption in the construction industry in Shandong Province is positively correlated with floor area, urban productivity, and urbanization rate based on a gray correlation model analysis. Hu [33] found that the production of the construction industry in China continues to be energy-driven. Ozturk [34] used a genetic algorithm to correlate the residential-commercial energy consumption in Turkey with the GDP, population, imports and exports, floor area, and sales of home appliances. We analyzed the literature related to energy efficiency retrofitting of residential buildings to collate the influencing factors as shown in Table 1.

3.2. Research Boundaries and Assumptions

By analyzing the important factors in the process of energy-saving renovation of residential buildings, starting from the perspective of policies and regulations, socio-economics, market demand, and technological level, the subsystem impact indicators and their meanings are shown in Table 2 and Table 3 below. In this study, the comprehensive performance of old residential communities’ renovation is assessed for Liaoning Province of China. Liaoning Province is located at the southern tip of Northeast China, and it has a temperate continental monsoon climate and covers an area of 148,000 km2. In 2020, the total population of Liaoning Province was 42.59 million, compared with 2010, it showed an average annual growth rate of −0.27%, and the urban population accounted for 72.14%. The data are obtained directly from the Liaoning Statistical Yearbook.
This study is a macroscopic study that does not fully take into account the differences in the physical properties of the buildings (geometrical dimensions, building materials, and the age of the buildings, ect.) in each city, and the relevant carbon emission factors and energy intensity standards do not take into the differences between different cities. A lot of cities in Liaoning are cold areas that use heating systems.
Outdoor meteorological conditions have a significant impact on a building’s heating and cooling energy consumption. Here, we consider meteorological corrections for heating and cooling energy consumption using heating degree-days (HDDs) and conditioning degree-days (CDDs). Combining the actual meteorological data of Liaoning in the past years, the simulator generates the future outdoor weather and corrects the energy consumption for the number of degree-days.
The time boundary definition sets the research time boundary in the model as 2000 to 2035, with the time span unit of 1 year, in which 2000–2015 is taken as the model test time boundary, and 2016 to 2035 is taken as the time boundary of the model simulation. Based on the case study, the energy efficiency retrofit influencing factors of urban residential buildings are explored to predict the energy efficiency benefits brought by the retrofit.

3.3. Circuit Diagram of Each Subsystem

3.3.1. Socio-Economic Subsystem Feedback Loops

GDP is an important economic indicator, with the rapid growth of the economy signifying that the people’s discretionary income is increasing, and the conditions and demands for residential buildings are also accompanied by an increase in per capita disposable income. Improvements in the quality of service and discretionary income dually drive residents’ energy conservation awareness and their willing to buy and use energy efficient energy-saving appliances and equipment and to consciously reduce energy waste behavior, so as to reduce the operation and maintenance processes of residential buildings, more precisely the intensity of energy consumption of the equipment, to increase the GDP per capita to improve the socio-economic environment, and to improve the awareness of energy-saving behavior of residents to promote the energy-saving benefits of residential buildings. The socio-economic subsystem causal loop diagram is shown in Figure 2.
GDP (+) → per capita disposable income (+) → expenditure on dwellings per unit area (+) → energy conservation awareness (+) → energy intensity of equipment (−) → GDP (+).

3.3.2. Technical Subsystem Feedback Loops

Energy-saving technologies play a pivotal role in the development of the industry as the core support for building energy efficiency. In 2010, the Ministry of Housing and Urban-Rural Development of the People’s Republic of China issued the “existing building energy-saving renovation technology promotion catalog” for energy-saving technology to promote the energy, systems, equipment, and components of several aspects of their combination for existing building energy-saving technology. The innovative development of technology cannot be separated from the economic foundation of the construction industry, scientific and technological investment, analysis of the characteristics of the construction industry, and technological innovation for the intelligent and refined building construction, operation, and maintenance process for reducing energy consumption. In the technology subsystem, energy consumption, building GDP, energy-saving technology progress, and other factors are integrated to form a causal loop relationship (Figure 3).
Building GDP (+) → investment in science and technology and innovation (+) → technological progress in building energy efficiency (+) → equipment energy intensity (−) → building GDP (+).

3.3.3. Policy Subsystem Feedback Loops

The analysis of building energy-saving transformation factors affecting the analysis found that the building energy-saving development in its early stage needs the government to guide the promulgation of policies, where the policies can be divided into incentives, norms, and standards; energy-saving products and service guides; the cultivation of human resources; and other efforts. Policy guidance for promoting the resources of the building energy efficiency industry intends to attract enterprises to participate in energy-saving project investment, to drive the development and formation of causal loop relationships (Figure 4).
Environmental quality (−) → policy support (+) → normative standards (+) → building energy efficiency (+) → environmental quality.

3.3.4. Market Subsystem Feedback Loop

Whether construction enterprises are willing to invest in energy-saving projects depends on the demand situation of the building energy-saving market, and the building energy-saving market share is dependent on the progress of energy-saving technology, the size of the incremental cost of enterprises, policy incentives to guide the policy, and the corresponding standards and regulations constraints. As the age of existing buildings increases, energy consumption intensifies, forcing the expansion of the scale of building energy-saving renovation, as well as the enhancement of energy-saving awareness of the residents who are willing to invest in residential building energy consumption problems, and then enterprises in the energy-saving projects involved in the process of economic benefits of recovery. The causal loop diagram is shown in Figure 5.
Enterprises’ willingness to develop (+) → market demand and supply (+) → scale of renovation (+) → economic returns (+) → owners’ awareness of energy conservation (+) → enterprises’ willingness to develop.
Analyzing the factors in the causality diagram, a complete stock flow diagram is drawn based on the causality diagram of the above subsystems, as shown in Figure 6 below.

3.4. Determination of the Main Equations and Parameters of the System

The determination of the parameters of the equations in this study mainly includes the following methods: ① regression analysis method, the use of univariate regression to determine the parameters of the urban population and the proportion of investment in education; ② the table function method, some variables in the model parameters can not be obtained by simple linear regression, and table function can accurately describe the parameter changes in non-linear relationship variables, such as energy prices, urbanization rate, etc.; ③ the questionnaire survey method, the parameter data cannot be obtained directly for the variables from the parameter data, and it is necessary to combine the quantitative situation with the expert judgment. Its main data sources are as follows: China Statistical Yearbook, Liaoning Statistical Yearbook, building energy-saving-related reports, and data from questionnaires; the benchmarks for the energy consumption of all kinds of electrical equipment are determined in accordance with the requirements of the Standard for energy consumption of building. The relationship between the key variables is shown in Table 4.
When developing the equations, the model incorporated a variety of quantitative and qualitative data collected from a survey of aging residential buildings in Liaoning Province of China. The survey questions included basic information and subjective factors like the energy-saving market, policy support, ect. This questionnaire survey mainly focuses on the personnel engaged in building energy efficiency in energy-saving service companies, construction units, real estate enterprises, and some universities. A total of 50 questionnaires were distributed, and 38 were returned. And excluding 3 invalid questionnaires, 35 valid questionnaires were obtained. The standardization of the final scores of the factors is performed through expert percentage scoring.

3.5. Model Checking

Model testing includes rationality and validity testing, and historicity testing of the model.
(1) Stability testing is a study to assess whether a dynamic system can return to its initial state or reach a new equilibrium state after a disturbance. In this study, the stability of the simulation system structure is examined by setting different system simulation steps or time intervals. By selecting the two factors of “energy consumption of urban residential buildings” and “reduction in building energy consumption” for the stability test, the proposed modeling step “TIME STEP” is set as 1 year, 0.5 year, and 0.25 year, respectively. The proposed modeling step “TIME STEP” is set to 1 year, 0.5 year, and 0.25 year, and the corresponding scenarios are named as “Current Baseline Run”, “Current Step 1”, and “Current Step 2”, respectively. The results are shown in Figure 7. Under the three different step-size scenarios, the simulation trend of each indicator is basically the same, which indicates that the system is not sensitive to the change in the step-size, and the constructed model is stable.
(2) Based on the real value measurement and application of simulation value using the model simulation of the historical test results (Table 5), this study selects the Liaoning Provincial gross domestic product (GDP), the total population at the end of the year, and the actual value of the relative error test. The results show that, in addition to the value of some abnormal fluctuations in the year, the error of GDP is within ±8%, and the error of the test of the total population is within ±2%, which shows that the model fit is good, and can better “imitate” the reality, so it is considered that the model passes the validity test, and can better predict the future energy consumption, environment, and the future after the renovation of existing residential building energy efficiency. It shows that the model fits well and “imitates” reality, so the model passes the validity test and can predict the energy consumption, environment, and economic benefits of the energy-saving renovation of existing residential buildings in the future.

4. Results

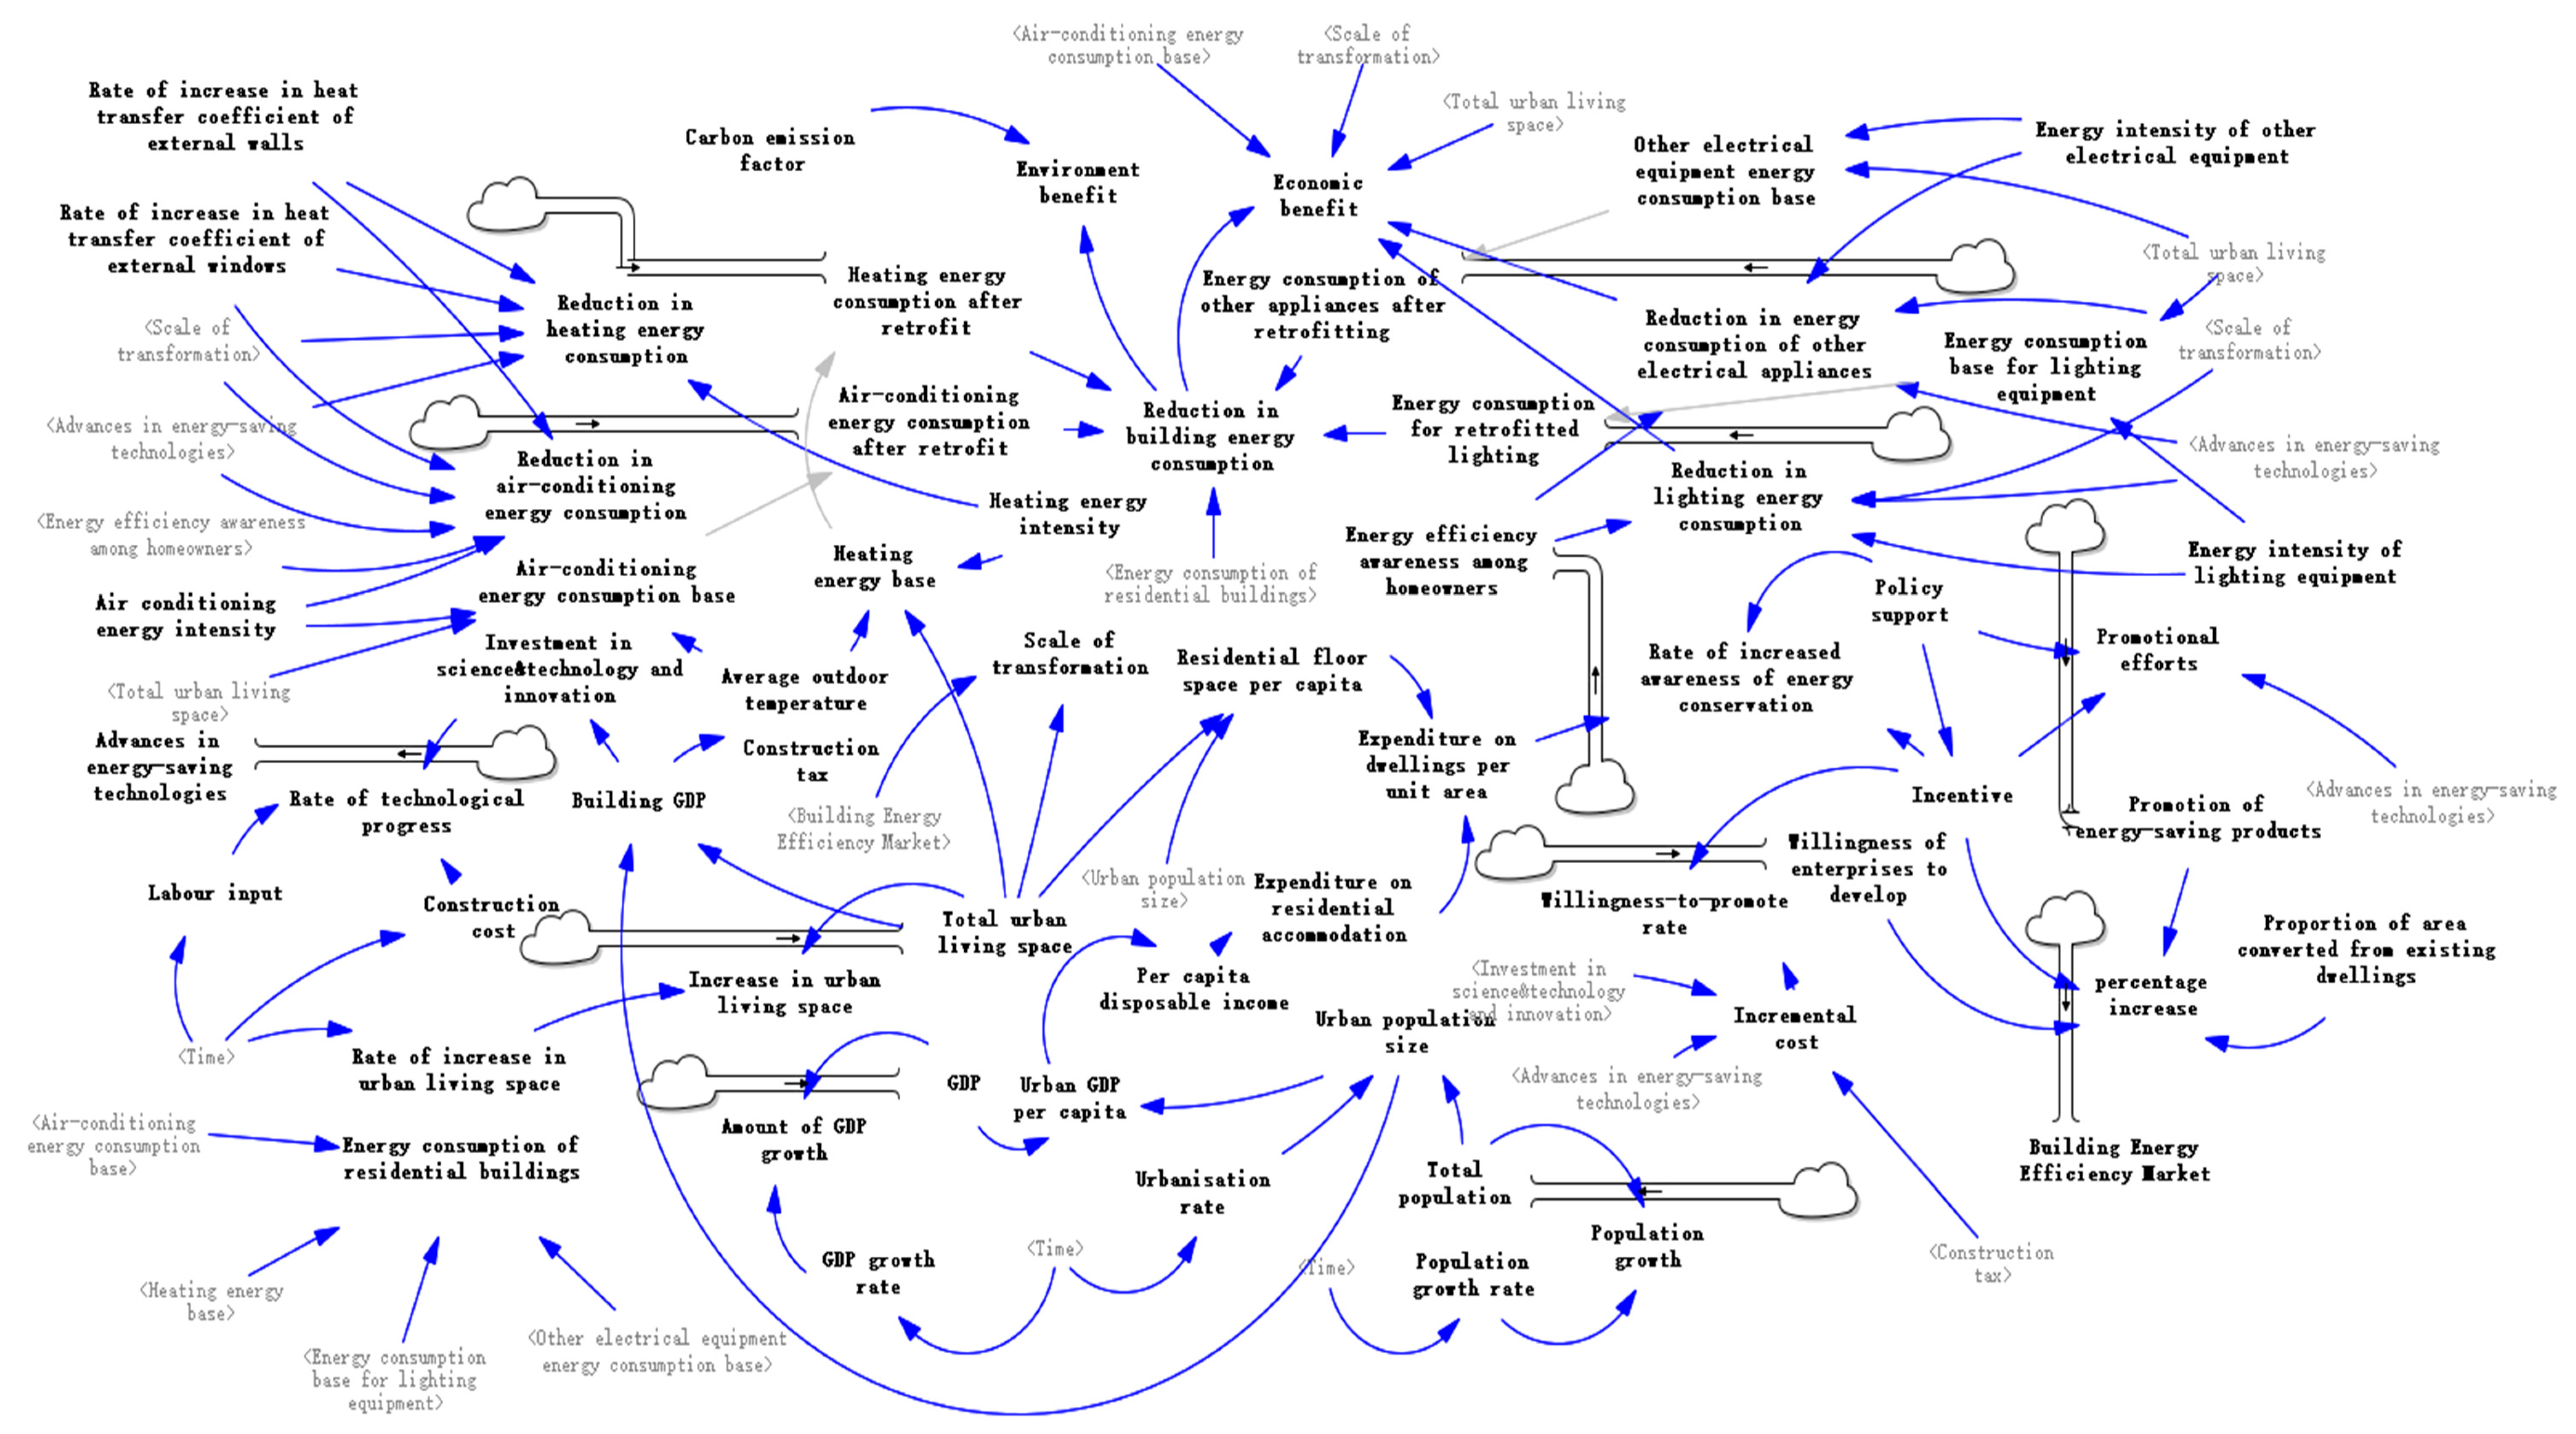
4.1. Scenario Simulation

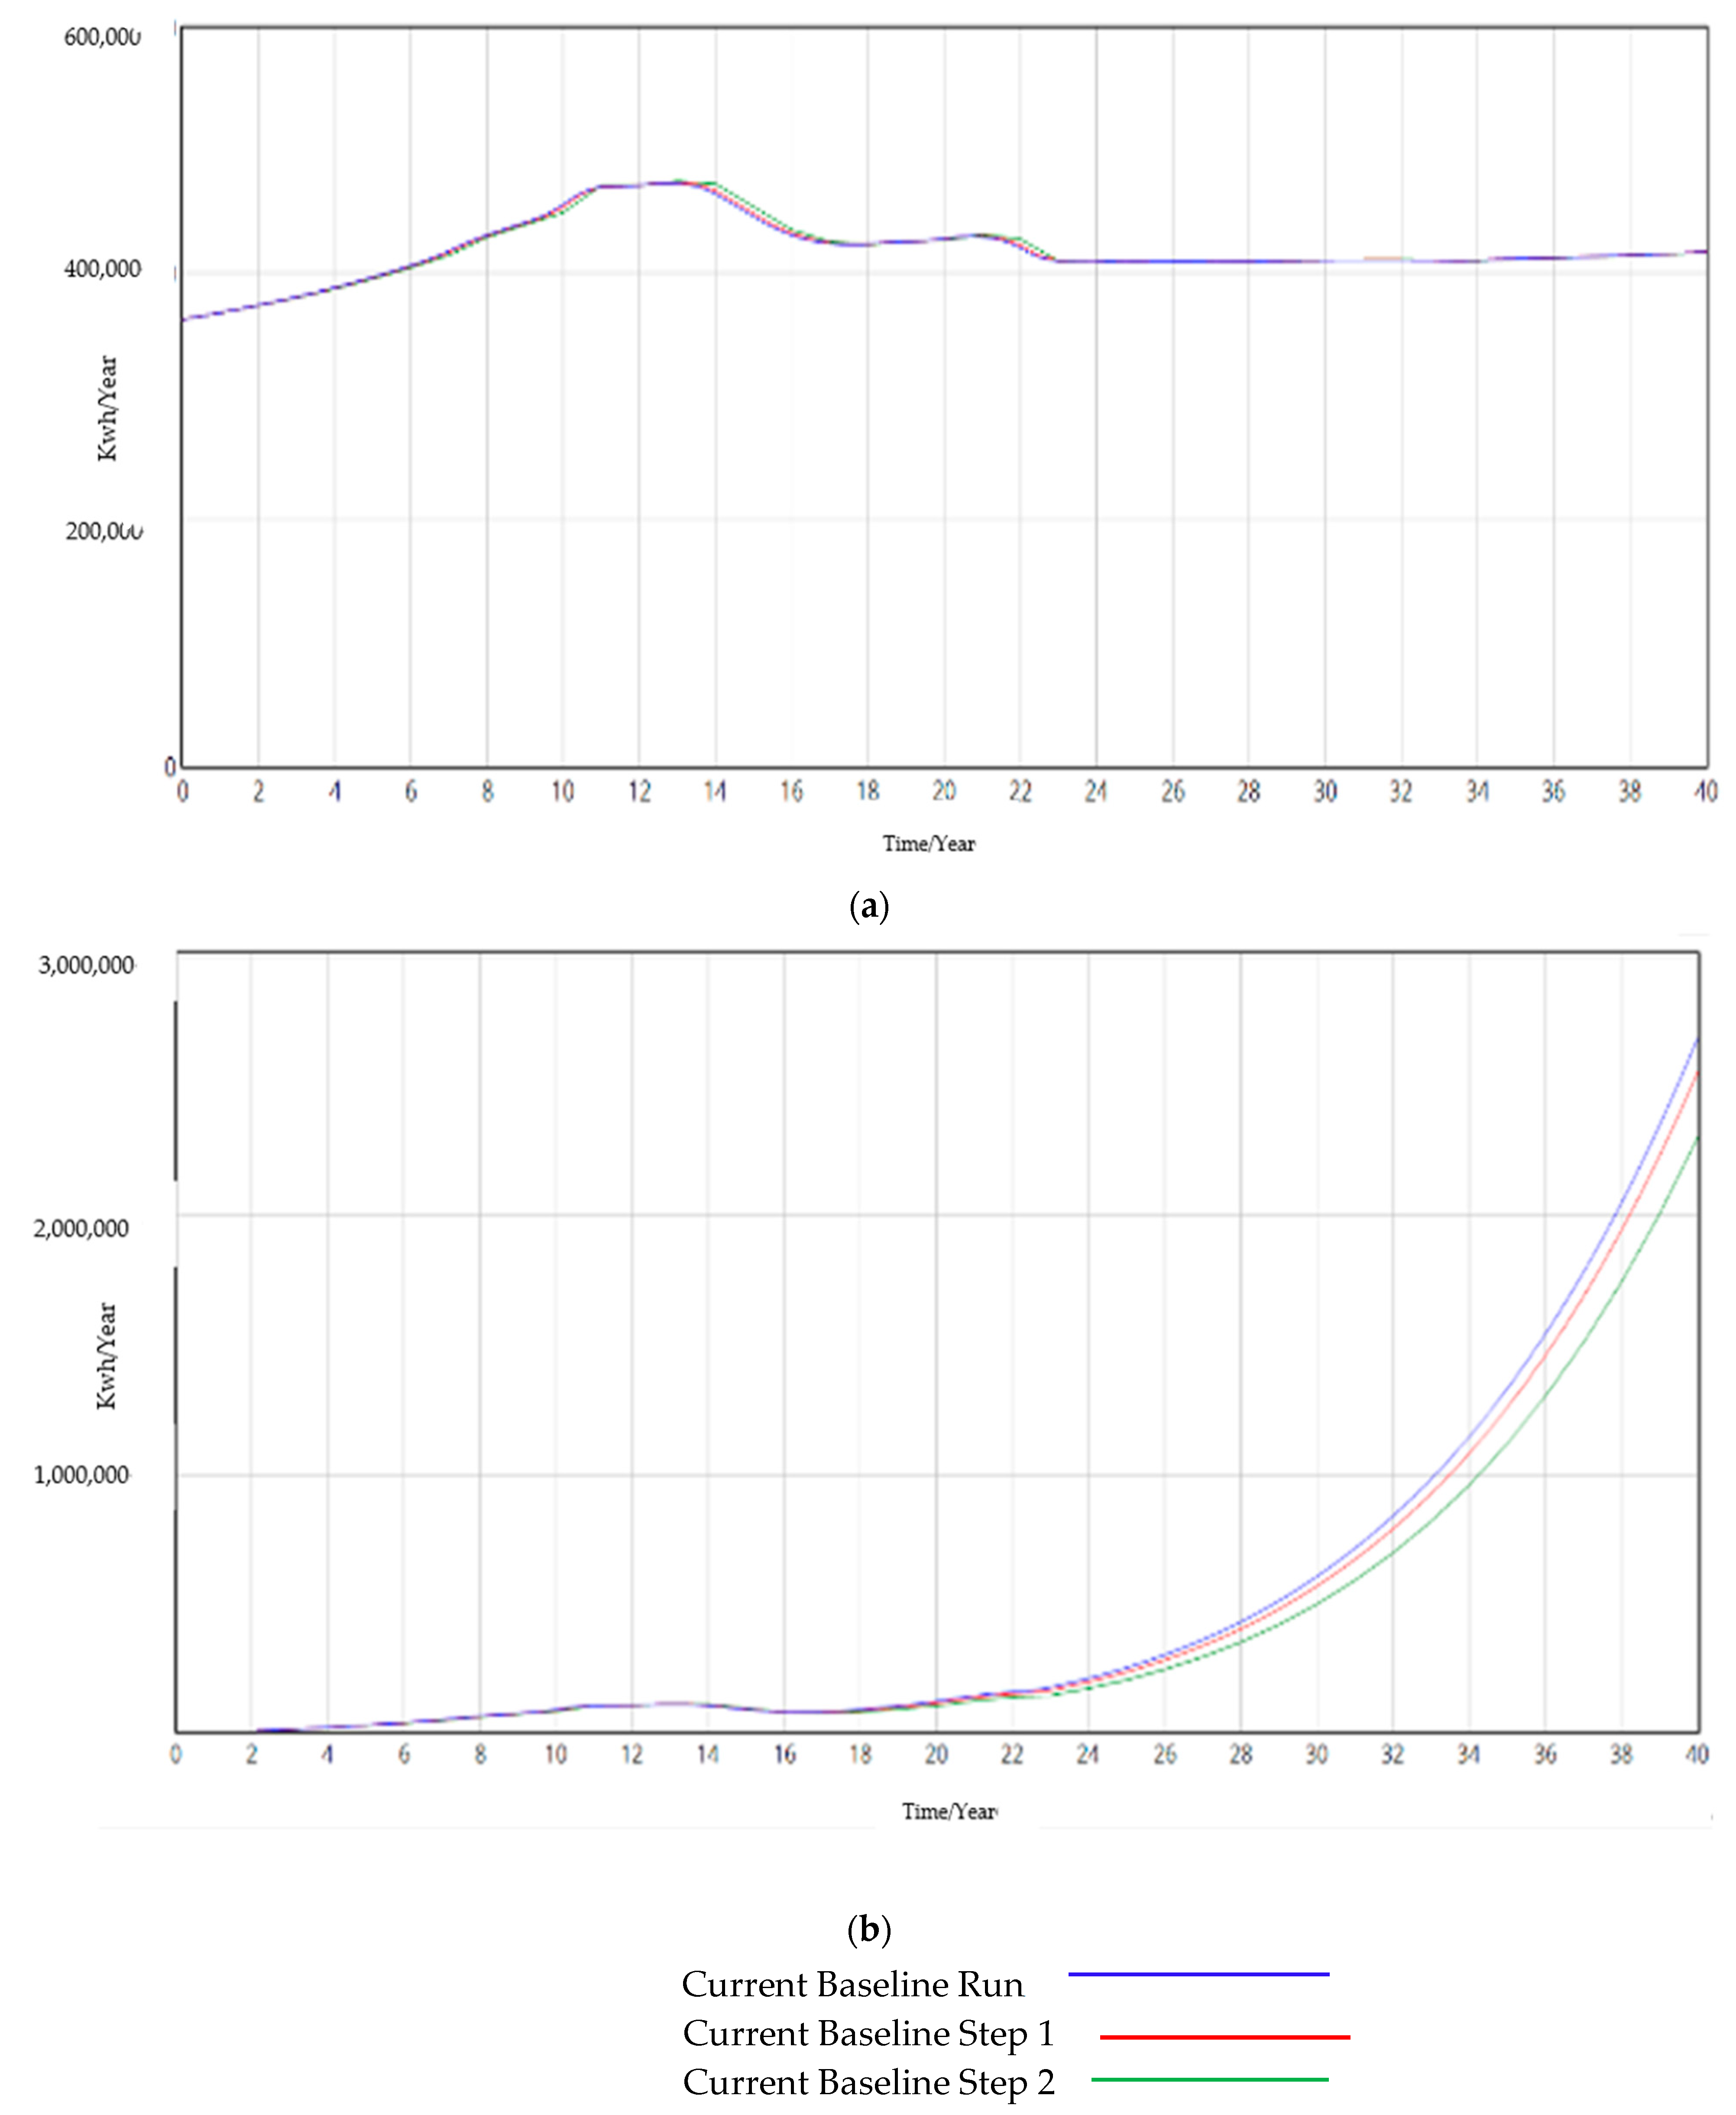
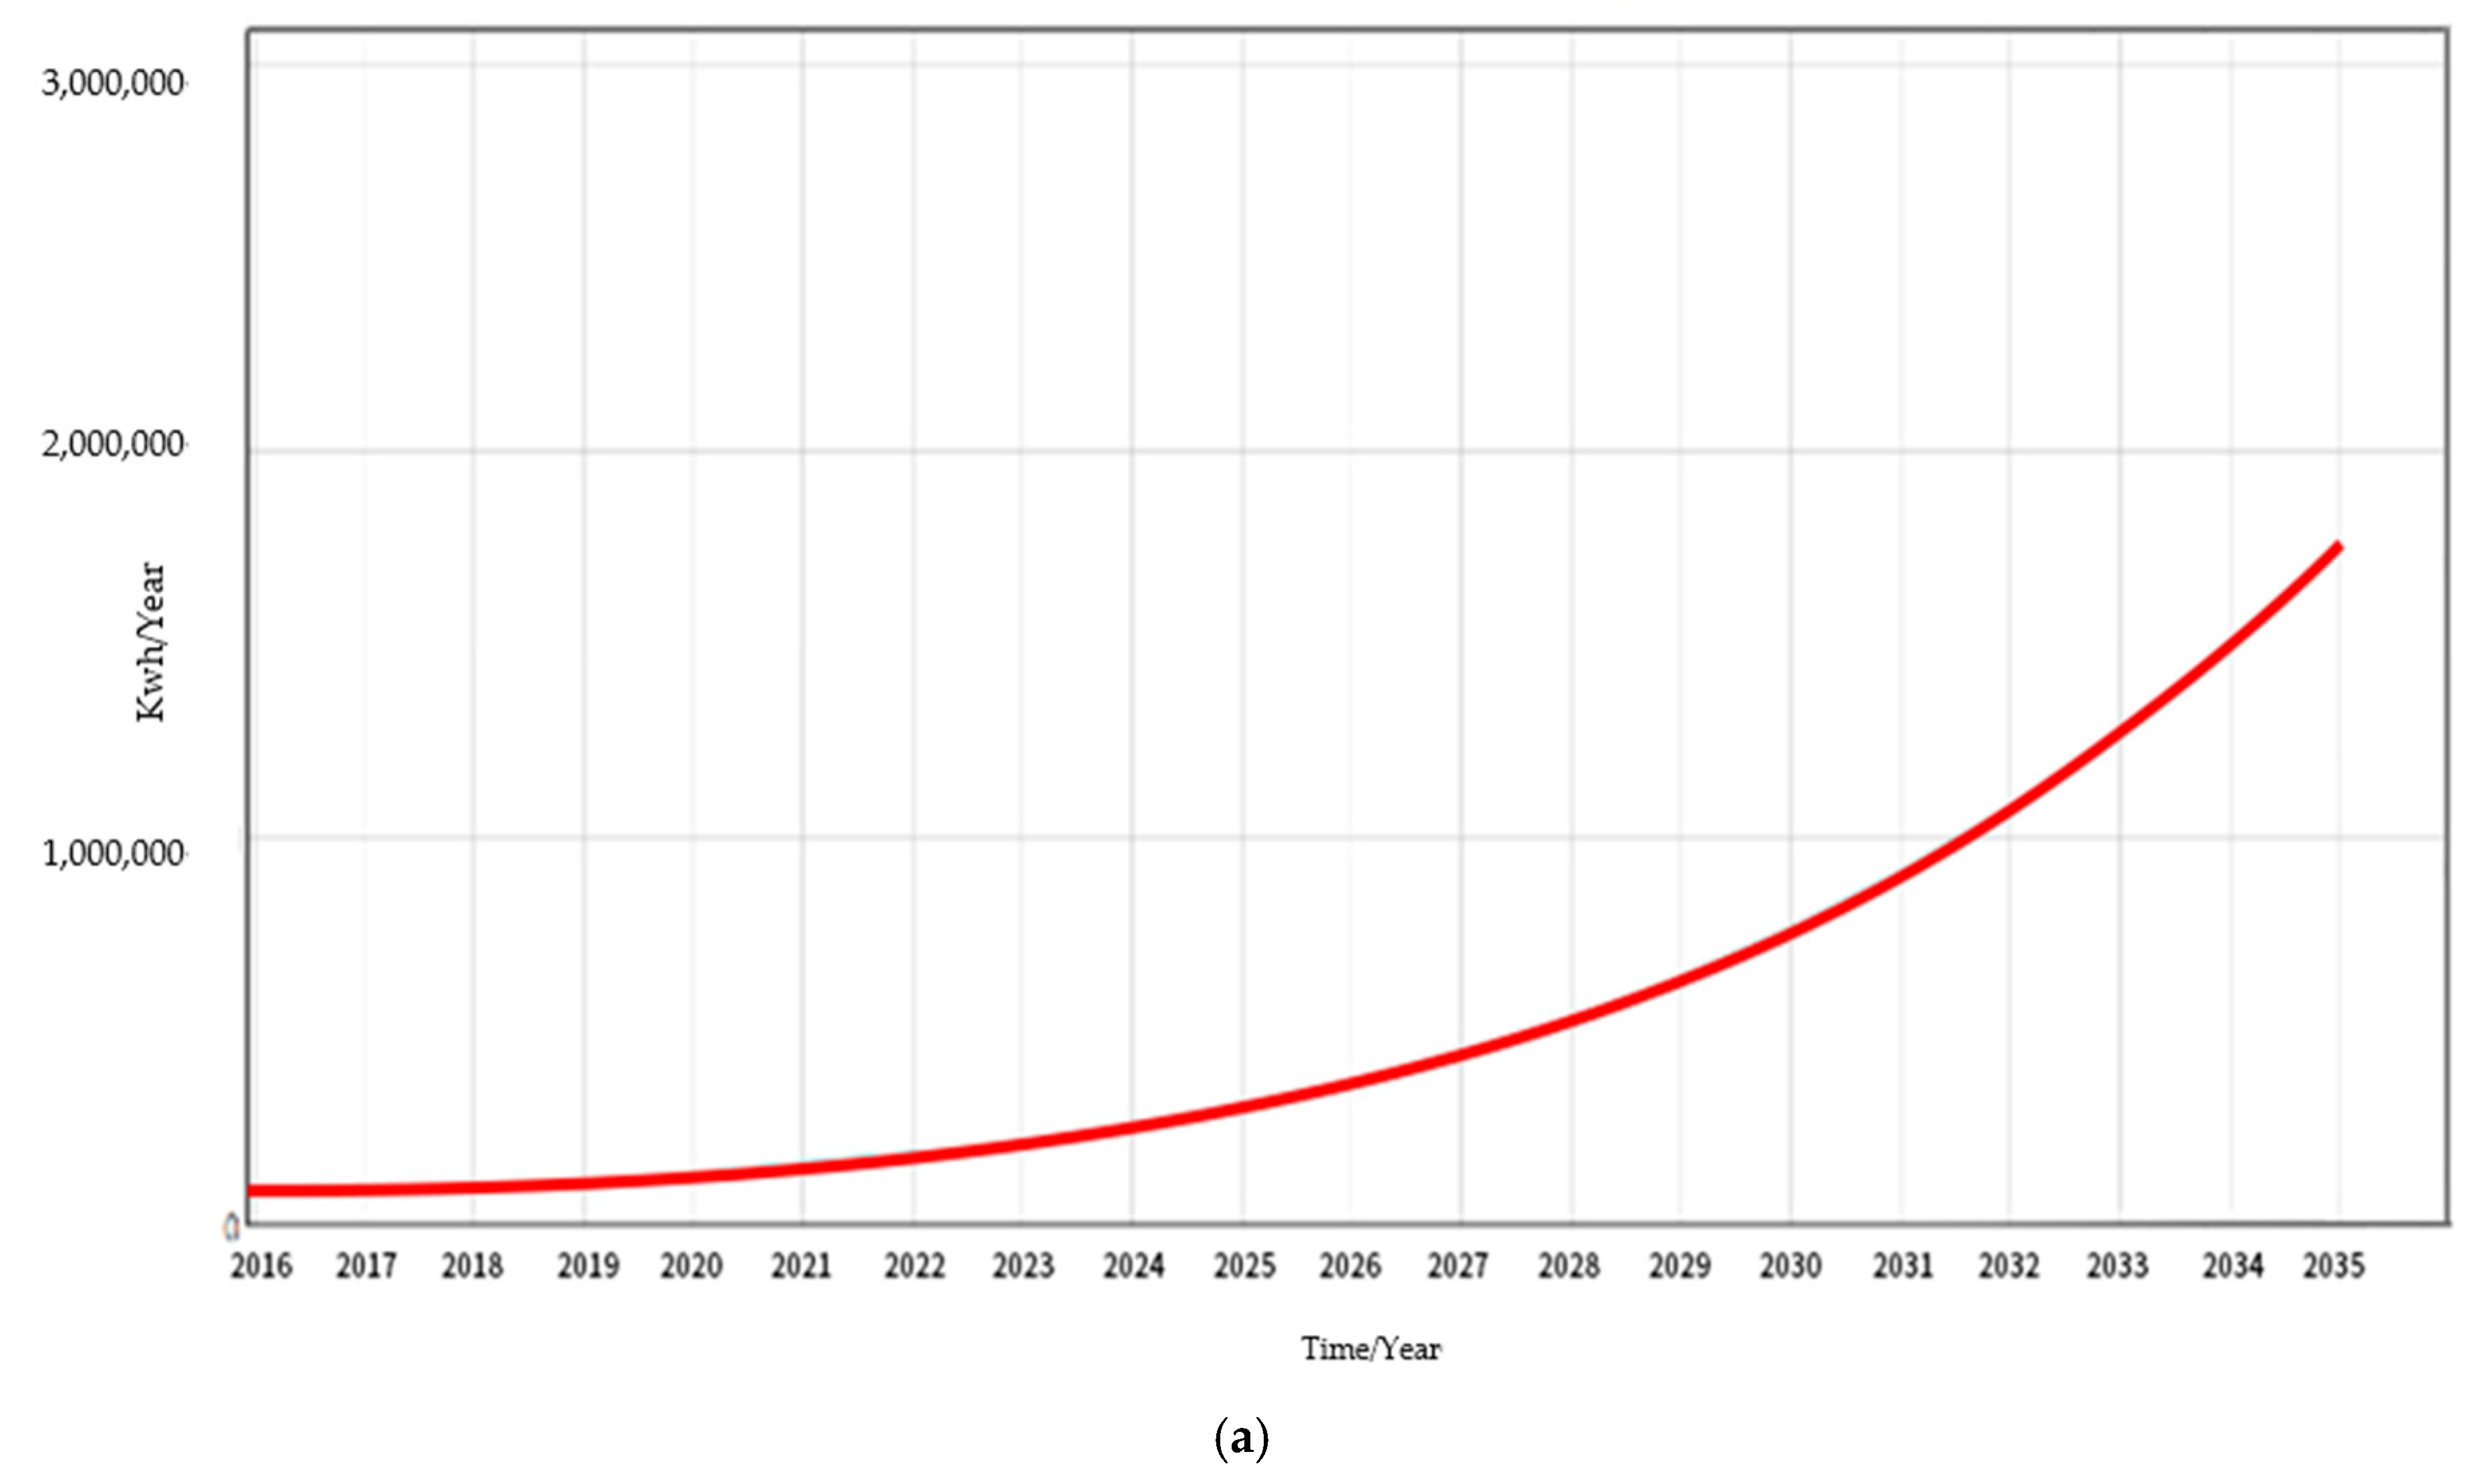
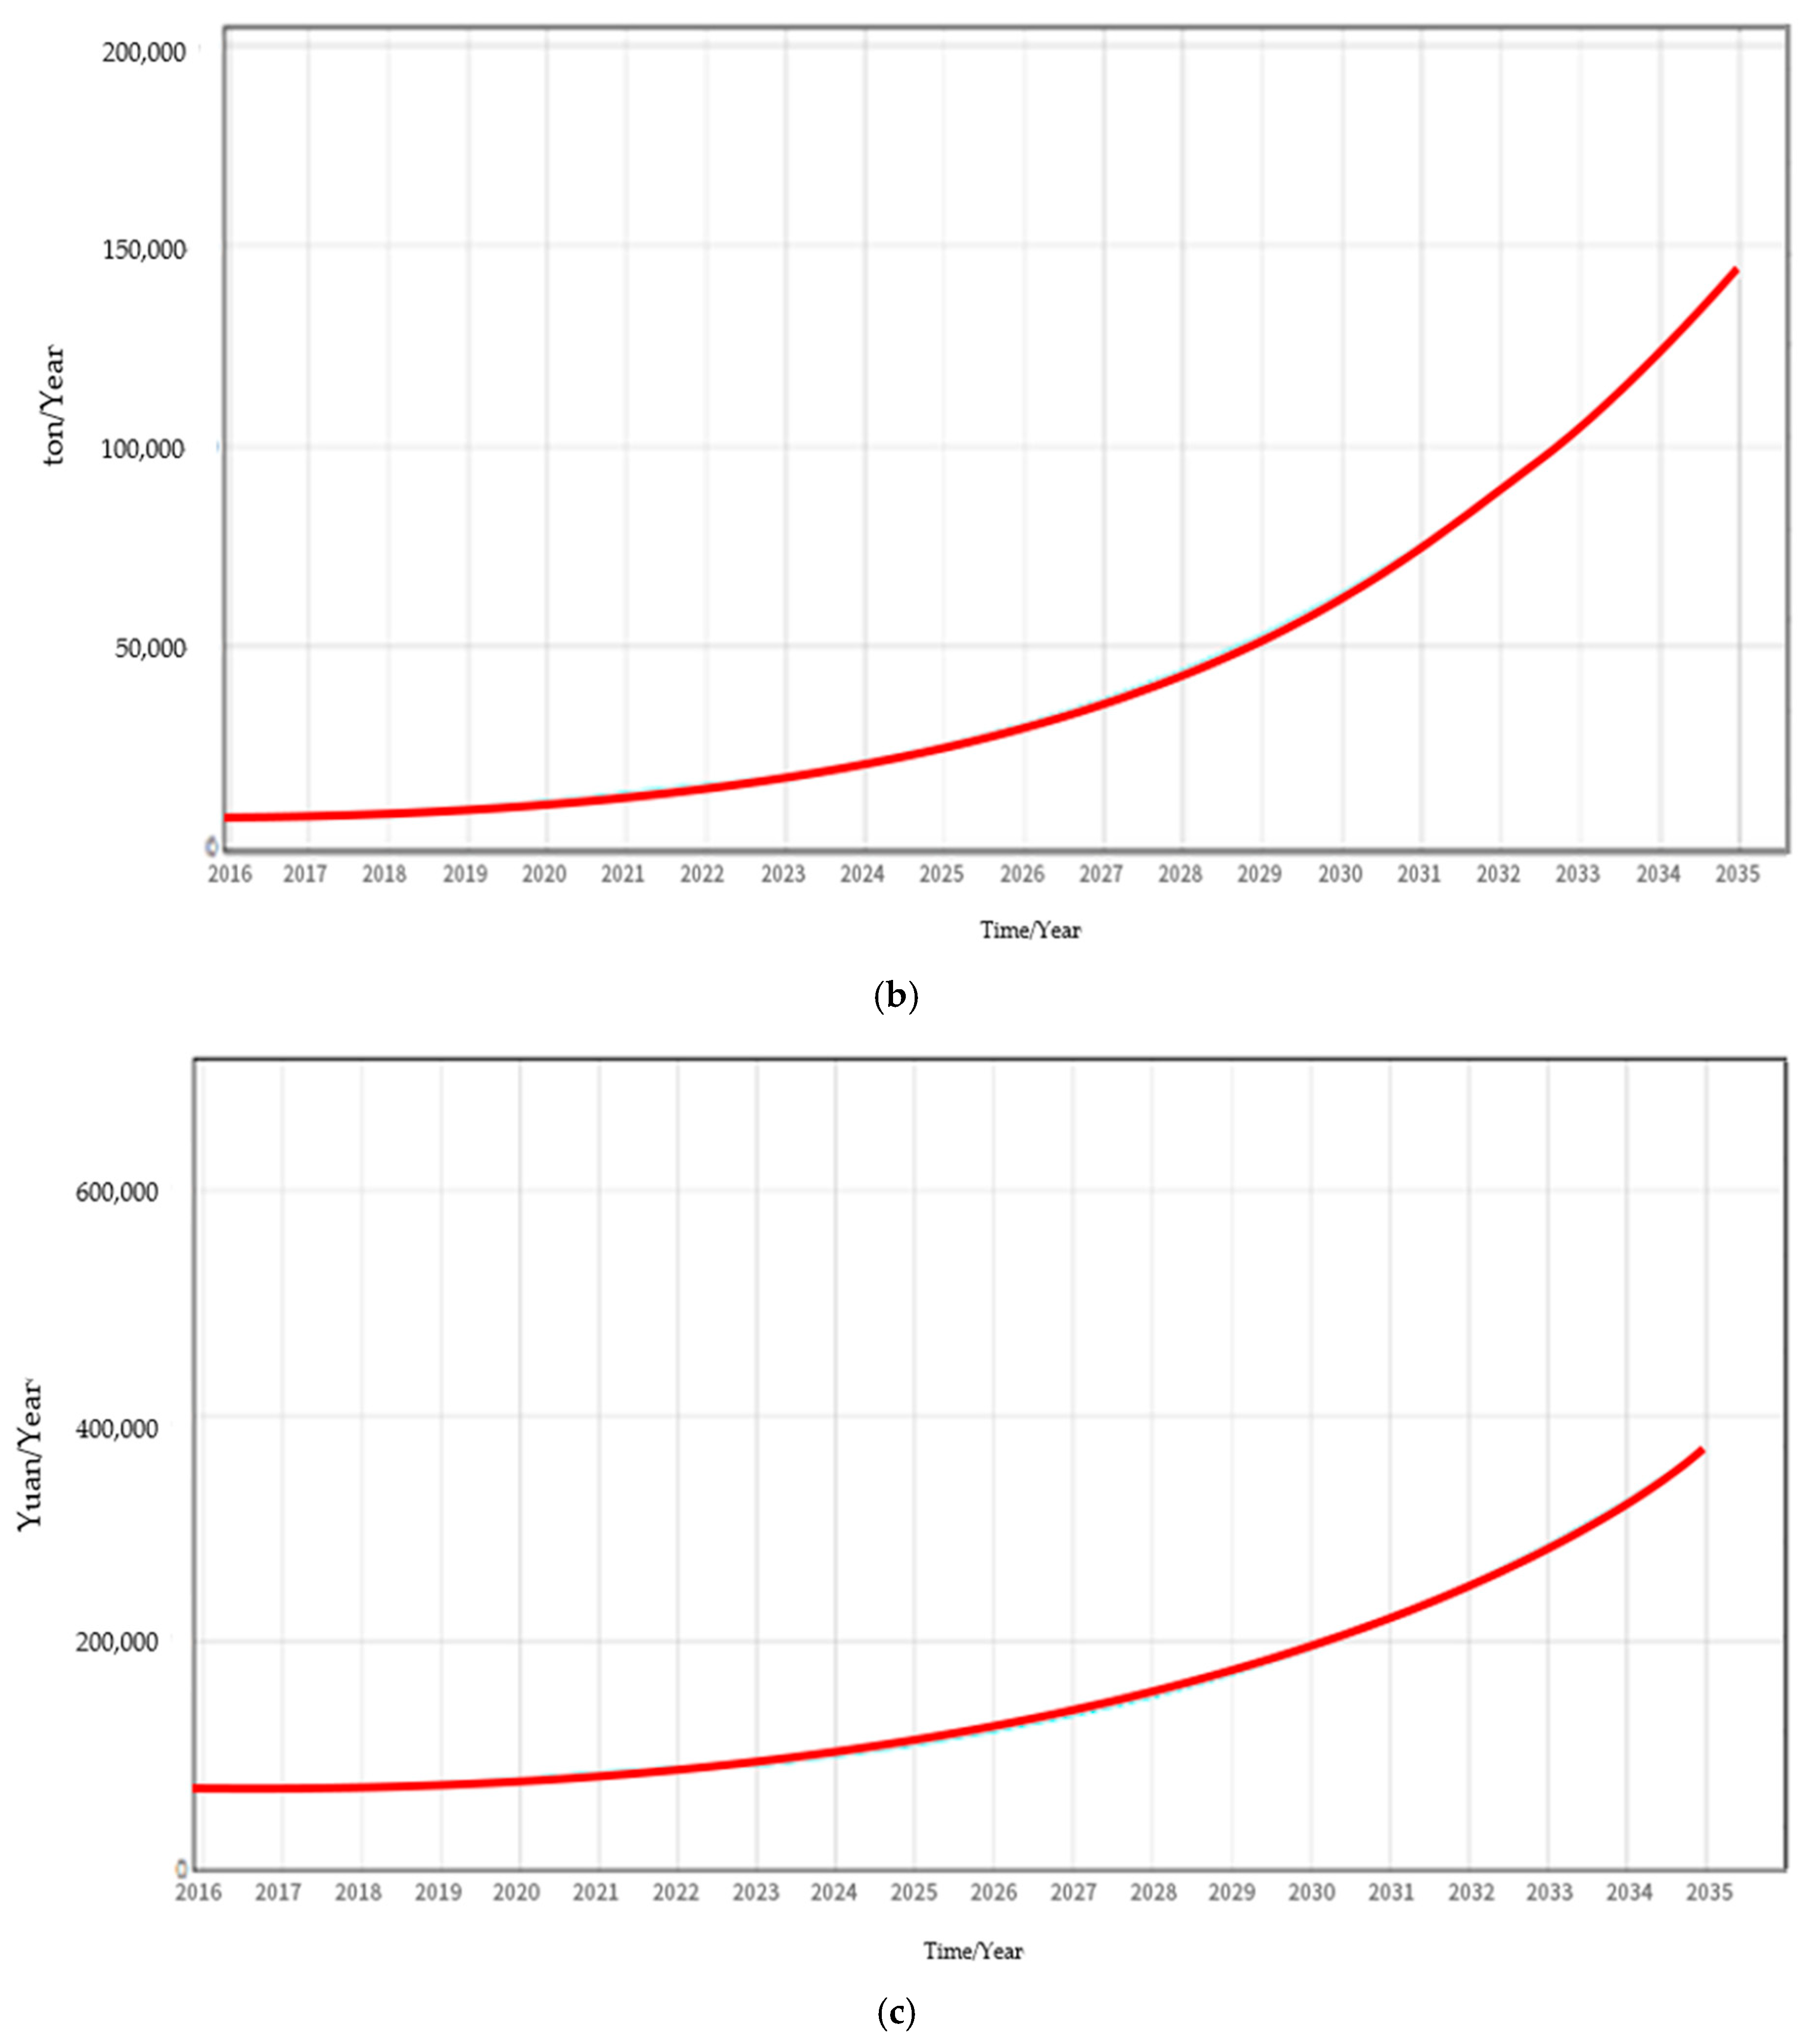
The above modeling setup is used to study the impact of various factors on the energy consumption of existing residential buildings. In the baseline scenario, the four subsystems required within the model and the data related to the baseline energy consumption of residential buildings are included, and the energy gain, environmental gain, and economic gain after the retrofit of urban residential buildings in Liaoning Province in the baseline scenario as of 2035 are shown in Figure 8.
In Figure 8, the energy efficiency retrofit benefit curve reflects the data and trends of energy consumption reductions, carbon emission reductions, and electricity costs for energy savings after energy consumption conversion in older neighborhoods in Liaoning Province, China, after retrofitting. The Liaoning Provincial Government’s Green Building Action Implementation Plan for 2015 states that, by the end of 2015, 50 million square meters of existing residential buildings will be completed with heat metering and energy-saving retrofits. From the results of the simulation, the retrofitting of residential buildings starting in 2016 produced initial effect gains.
In China, in recent years, the practice of housing building renovation is mainly guided by the central and local government investment, from a single project to a demonstration site as the object, in the function of upgrading, energy saving, environmental improvement, social benefits, and other aspects of the obvious effect; however, there are still poor results, an insufficient scale, poor operations, a lack of driving force, and other problems [
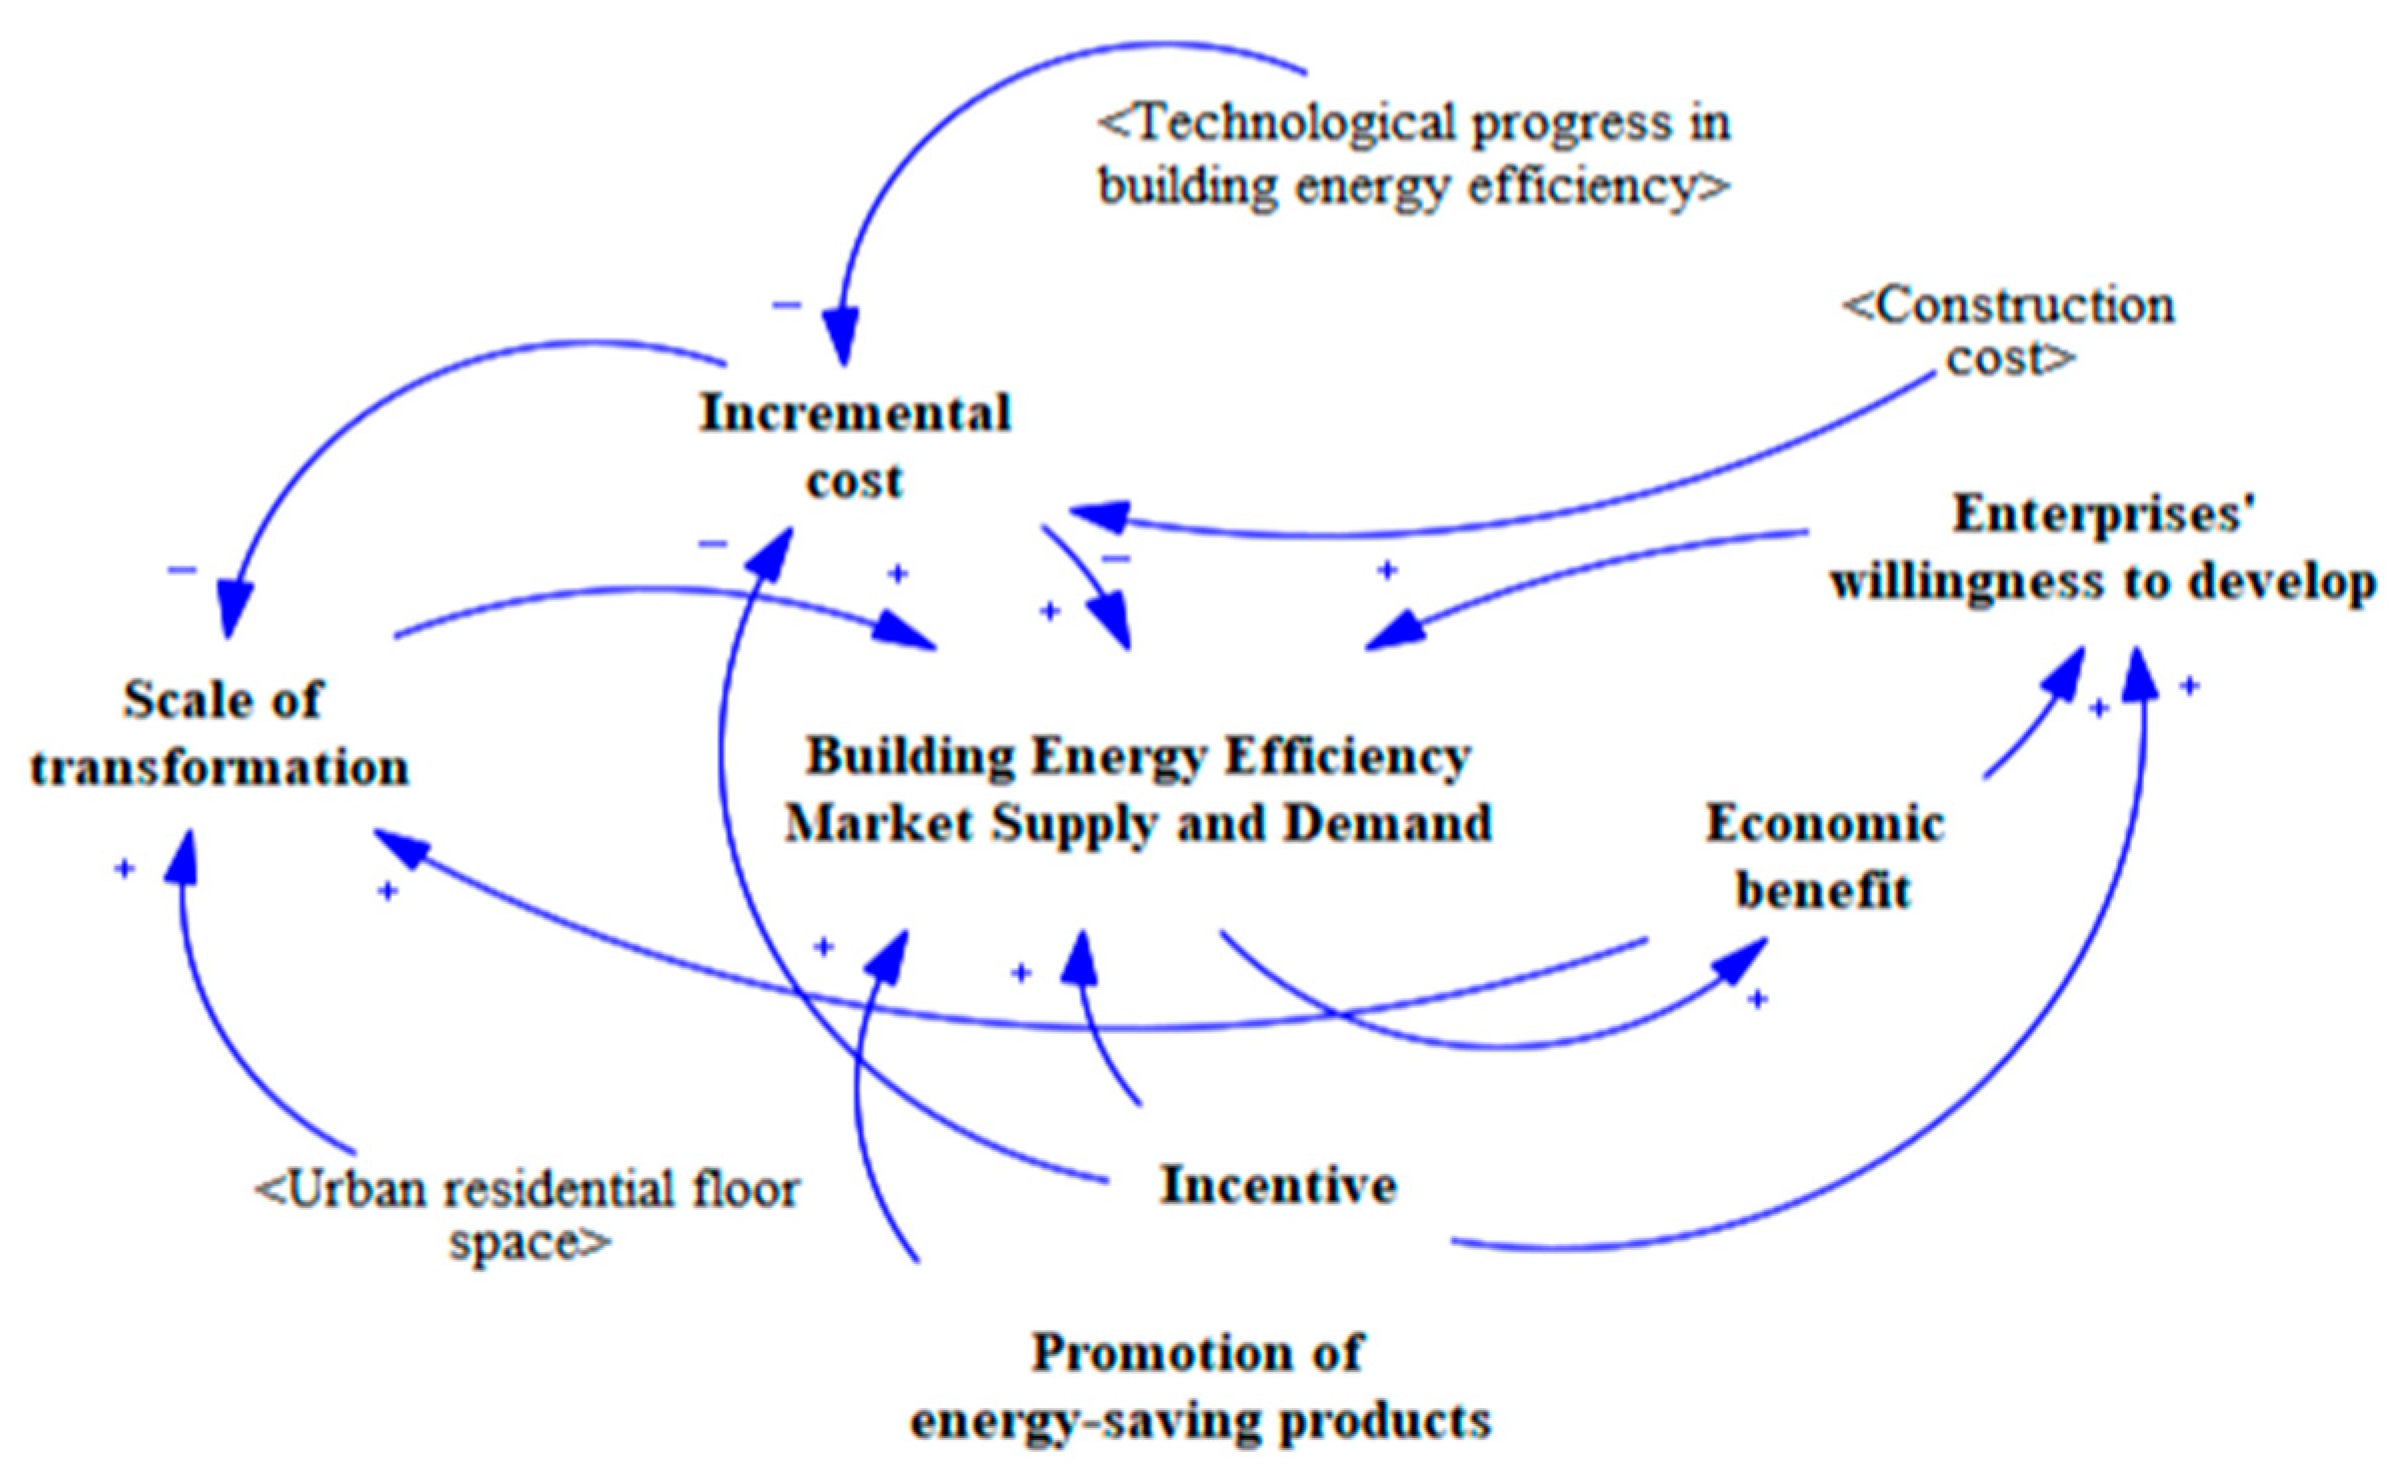
44]. The positive development of energy-saving renovation of existing buildings is bound to promote the market-led model. In the process of building energy-saving marketization, enterprise development willingness, the promotion of energy-saving products, policy support, energy-saving technology advances, and other factors synergistically promote the healthy development of energy-saving renovation marketization. 
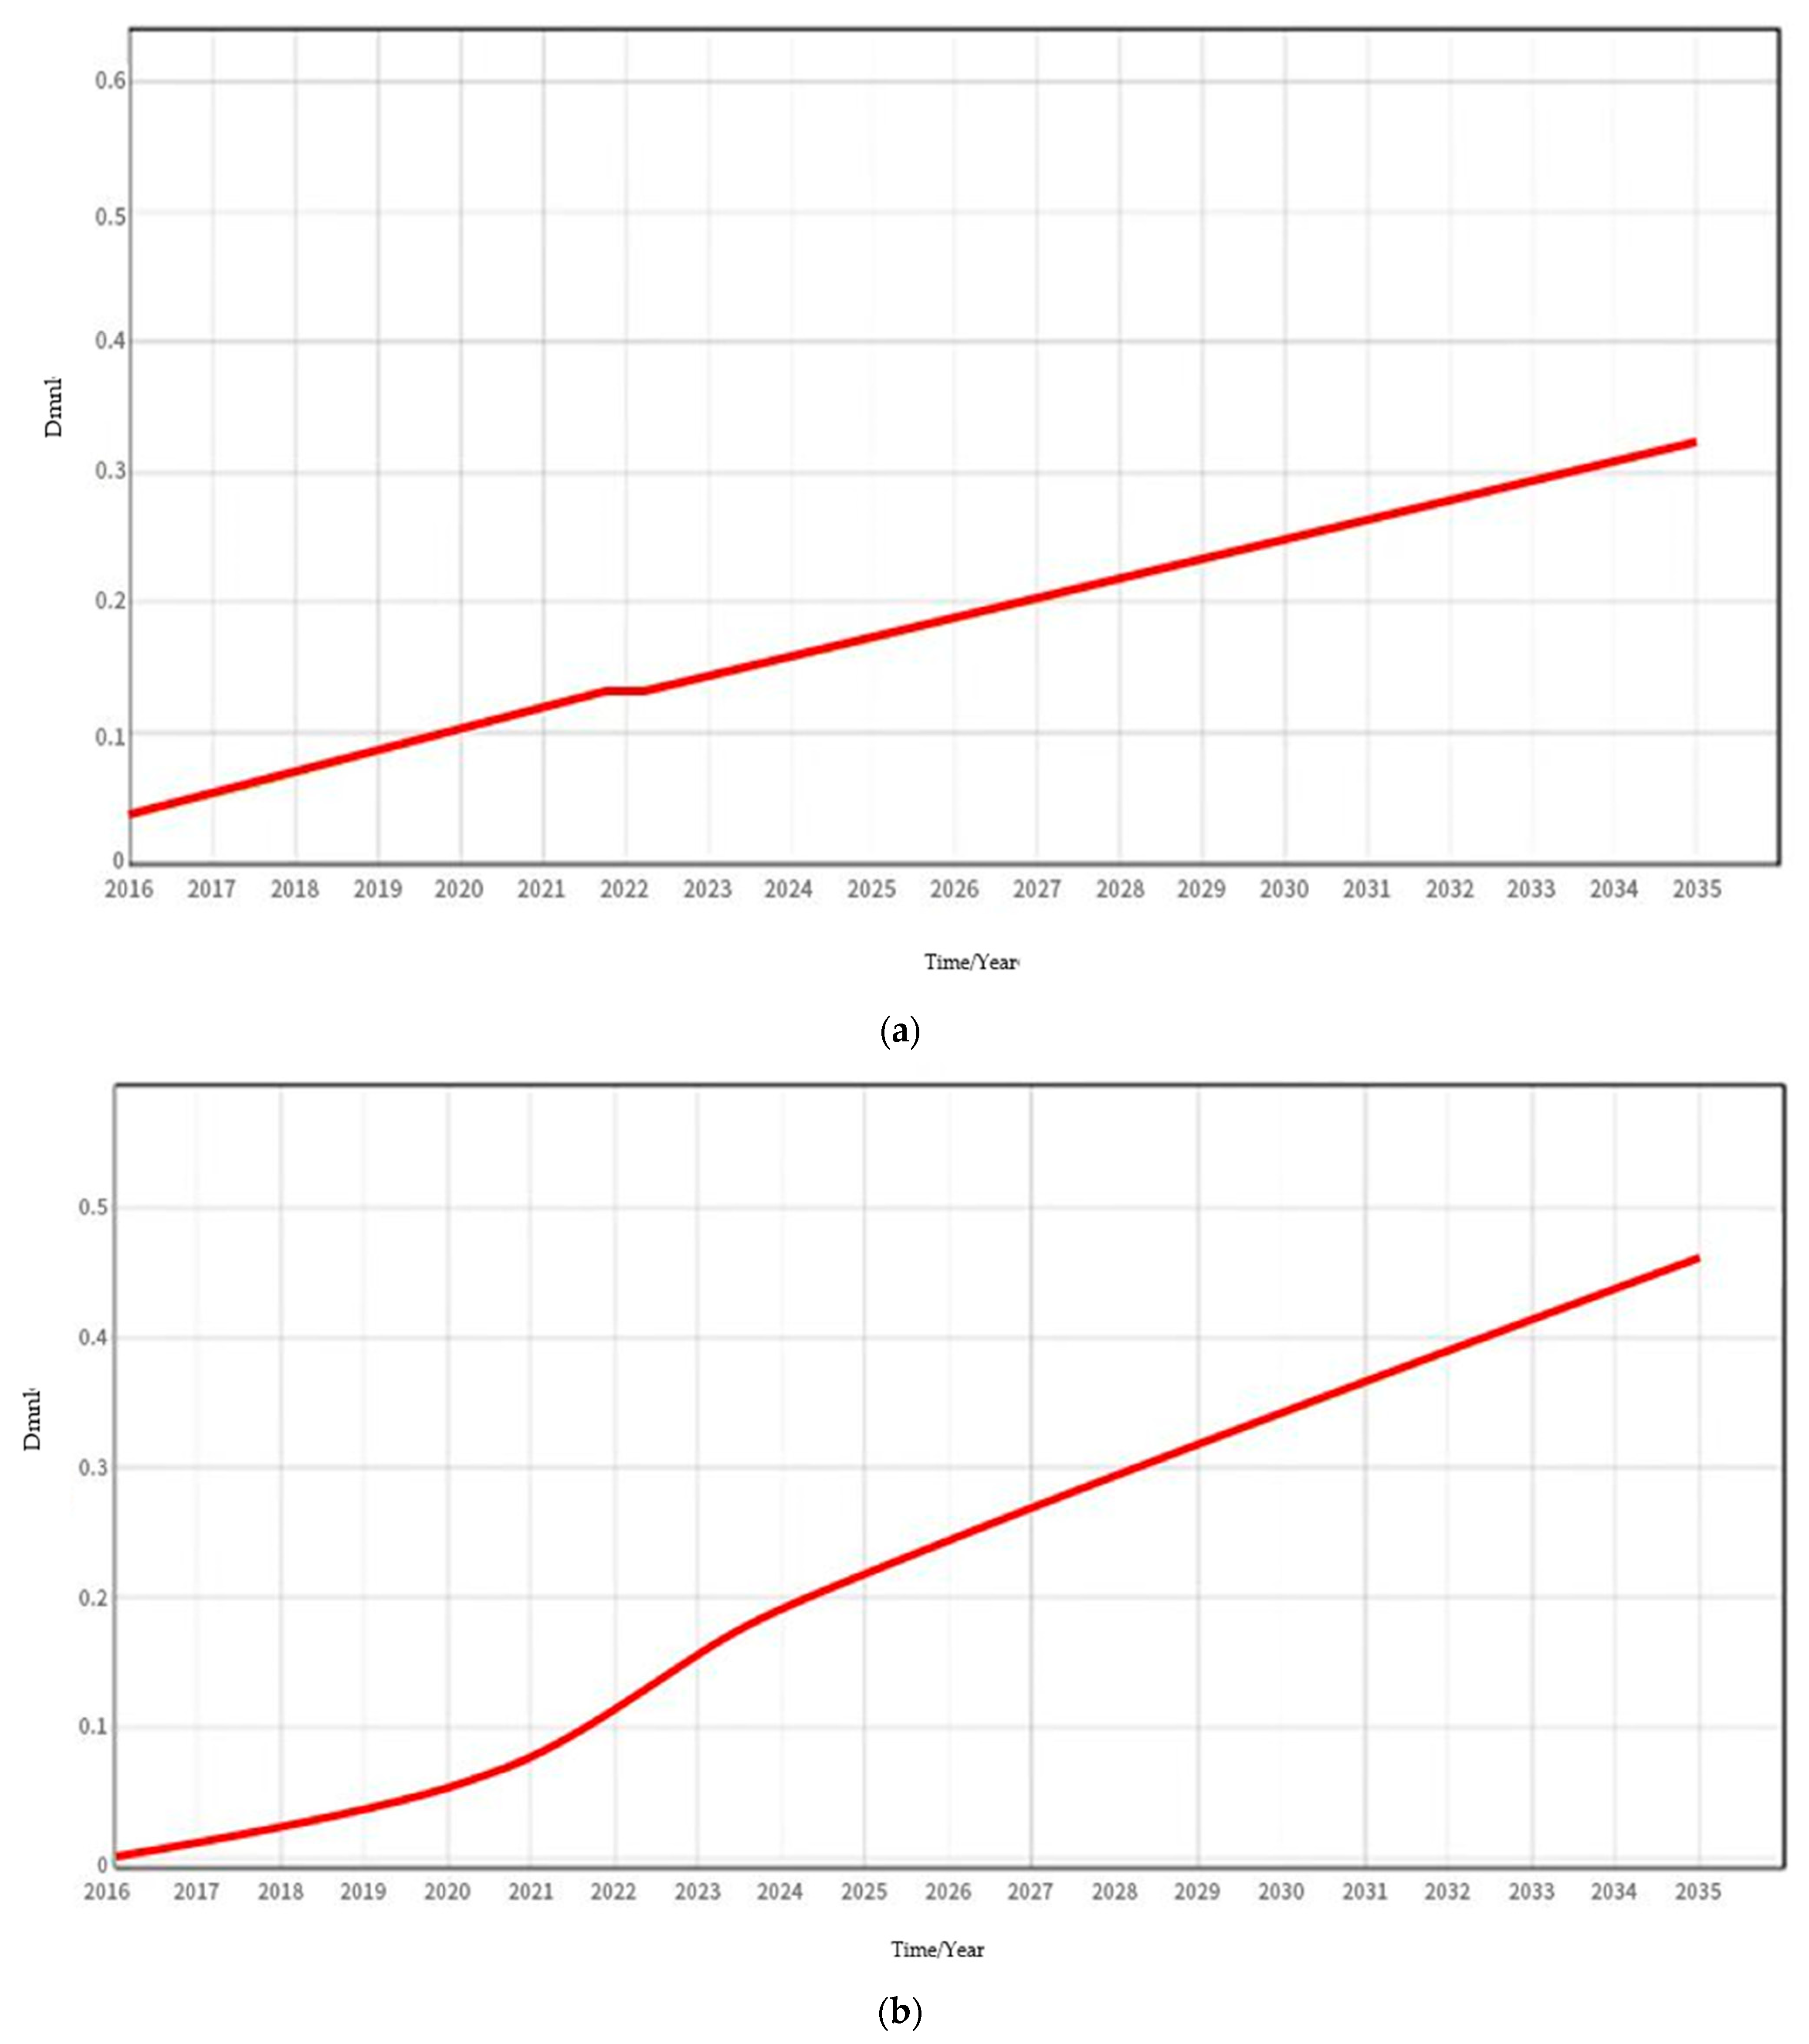
Figure 9 shows the pattern of change in the above four factors in the simulation year in the baseline scenario.
As per Figure 9a, the rate of increase in the willingness level of enterprises to participate in the development of building energy-saving renovation projects is affected by the strength of energy-saving technology research and development, incremental revenue generated by renovation projects, policy support, and incentive mechanisms. According to the figure, the rate of increase in the willingness level is a phased increase, due to the phased increase in the proportion of scientific and technological innovation inputs over time, which is initially set in the model.
As per Figure 9b, the promotion of energy-saving products is influenced by the progress of building energy-saving technology, building energy-saving-related policies issued by governments at all levels, incentive mechanisms, and the successful practice of projects that have been put into practice. In 2010, Ministry of Housing and Urban-Rural Development of the People’s Republic of China issued a notice on the “Catalog of Promotional Techniques for Energy-saving Retrofitting of Existing Buildings”, and then, with the obvious degree of environmental pollution and the gradual implementation of the marketization of building energy-saving retrofitting, the promotion of energy-saving products has also been steadily rising.
As per 
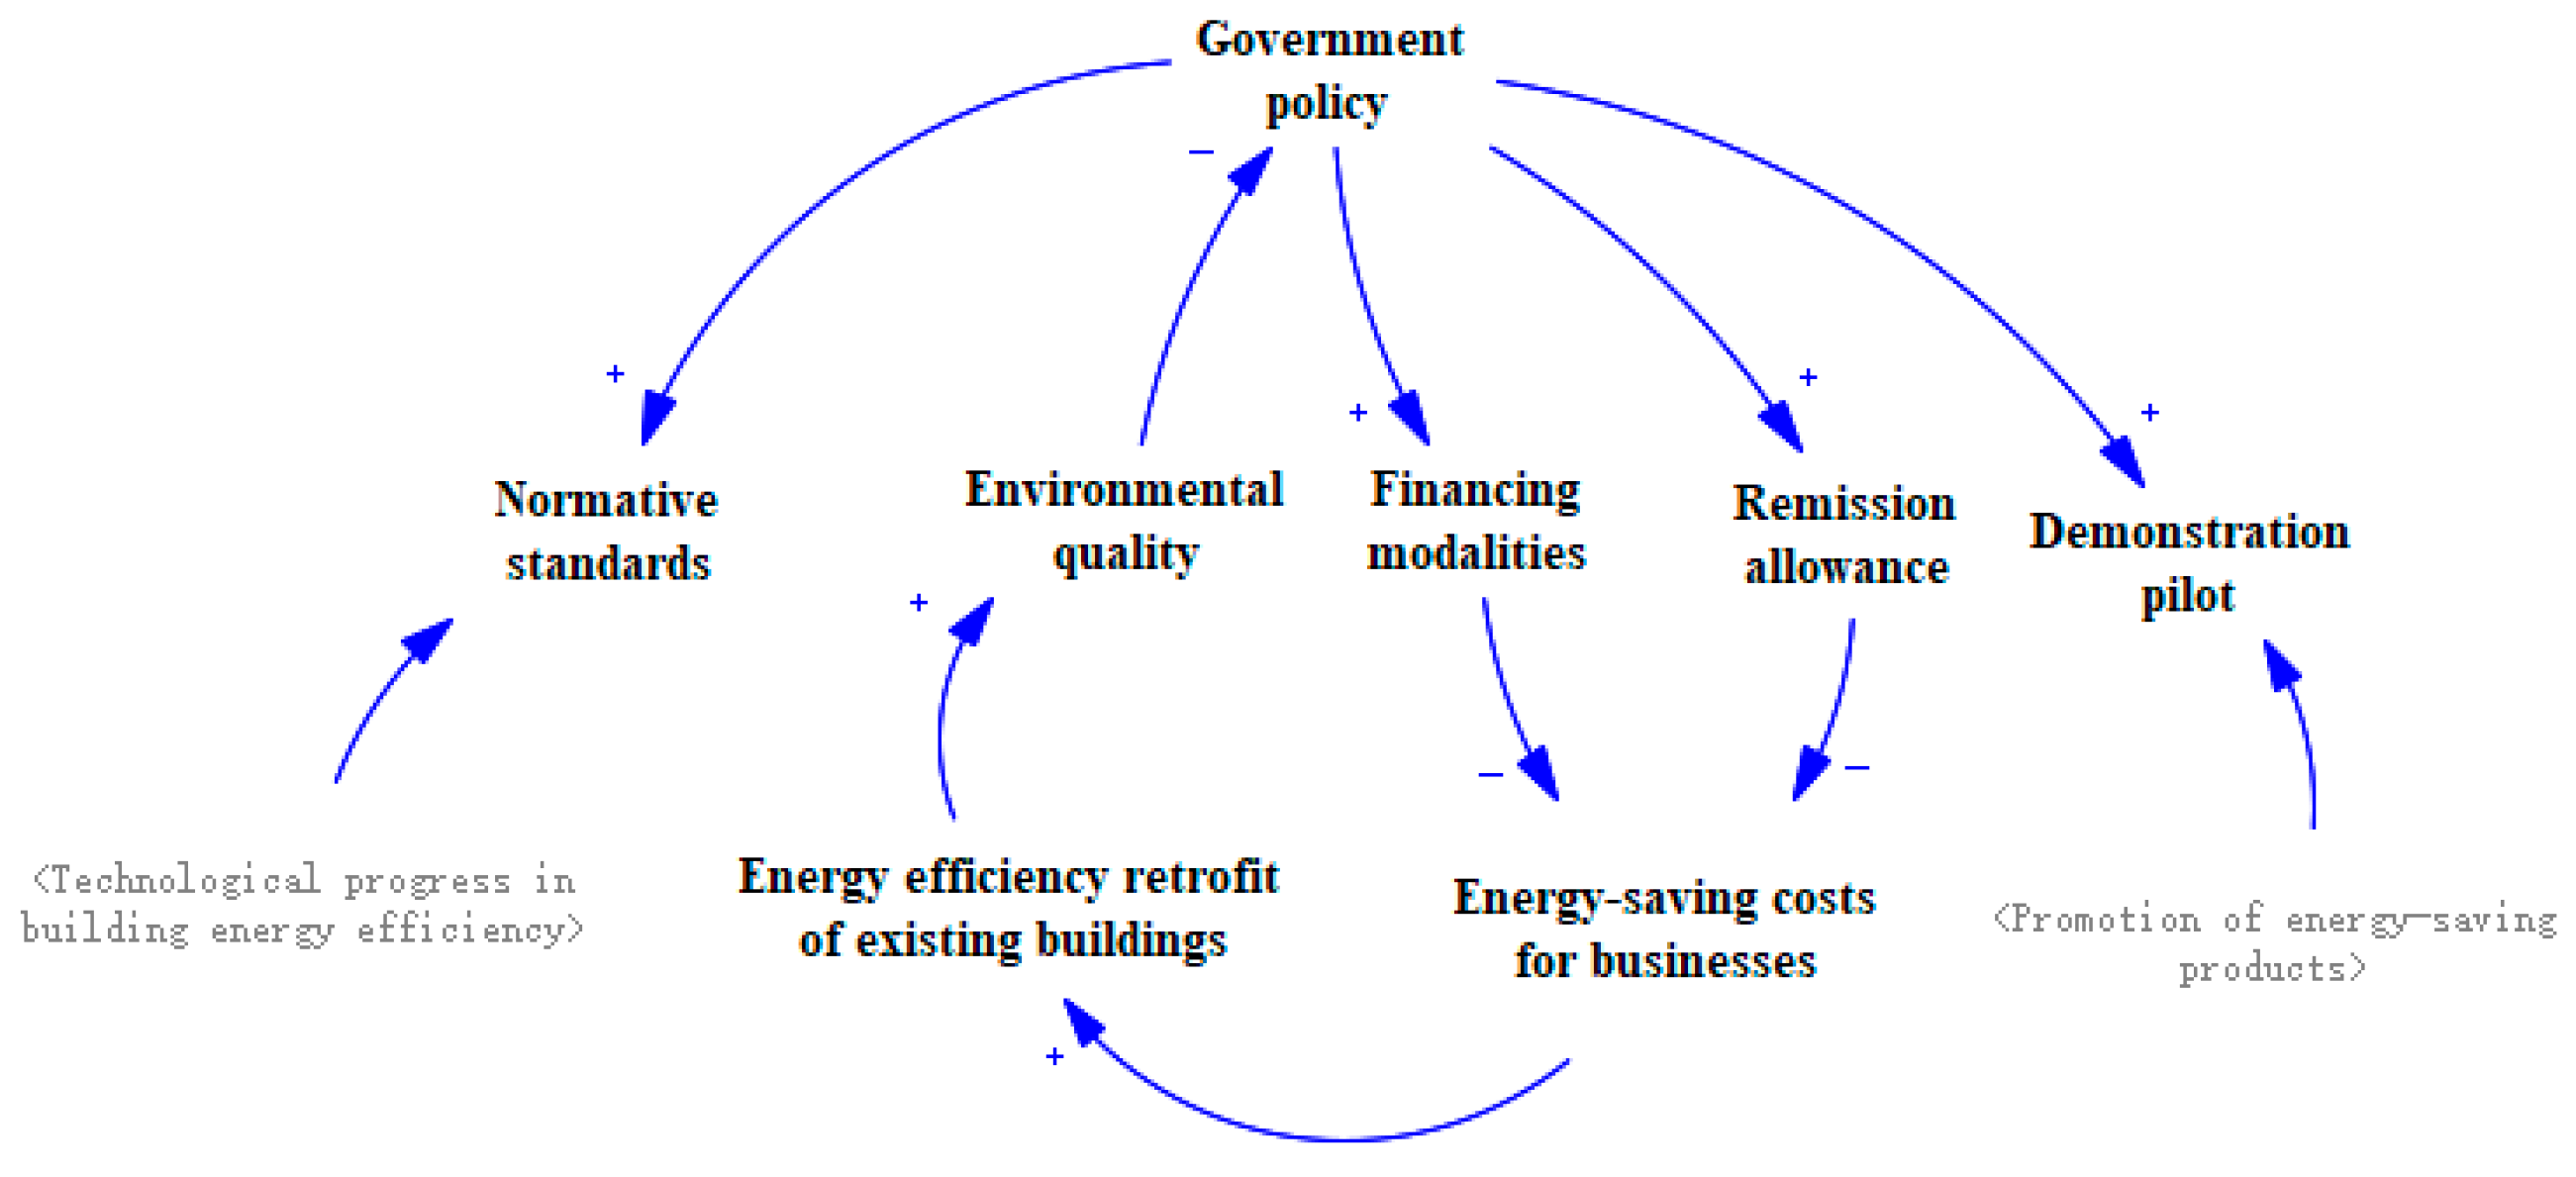
Figure 9c, the government’s perfect policy standards provide important support for the retrofitting of existing residential buildings, which is conducive to promoting the development of building energy-saving retrofitting from the root, which includes building energy-saving-related policies issued by all levels of government. In the early stage of the introduction of mandatory norms and standards or regulations, the constraints of mandatory provisions force the research and development of energy-saving technology innovation, the formation of policy based on the mandatory provisions, and the addition of information types such as product and technical service provisions. After the building energy-saving renovation by the government to promote market-oriented transformation, the government’s policy to improve the rate of improvement appeared to slow down. In the later stage, the economic government guides the market-oriented development of building energy efficiency with regard to the degree of tax relief, financial subsidies, and enterprise credit approval support. The rate of government policy improvement tends to equalize the level.
As per Figure 9d, the rate of progress of building energy-saving technology is influenced by government policy support, investment in science and technology innovation, the level of market demand, the level of consumer willingness to consume, and the GDP of the construction industry, as shown in the figure, which can be seen as a constant and stable upward trend.
Based on this, in order to predict the impact of various factors on the benefits of energy-saving retrofit of existing residential buildings, seven scenarios in three categories are set (Table 6). Scenario 1 simulates the impact of residents’ energy-saving awareness on the benefits of residential building retrofit through the purchase of high-efficiency electrical equipment and energy-saving behaviors. Scenarios 2, 6, and 7 simulate the impact of energy-saving technology (equipment, envelope) factors on the benefits of residential building retrofit. Scenario 4 is to simulate the effect of government policy and regulation on the benefits of building retrofit. Scenarios 3 and 5 are parameters under the market category, which consider the changes brought by the willingness of enterprises to develop and the promotion of energy-saving products for the benefit of retrofitting existing residential buildings under the baseline scenario.

4.2. Situational Analysis

Based on these seven scenarios, the model simulates the energy, environmental, and economic benefits of retrofitting existing residential buildings in Liaoning Province. The energy consumption of residential buildings in the cold region consists of four parts: centralized heating energy consumption, air conditioning energy consumption, lighting energy consumption, and other electrical equipment energy consumption. Overall, parameter changes in each scenario advance the benefits of residential building energy efficiency retrofits to varying degrees.
S1 examines the impact of owners’ energy conservation awareness on the energy-saving retrofit of residential buildings, owners’ energy conservation awareness to change the behavior of energy use or replacement of high-efficiency appliance, owners’ energy conservation awareness to reduce building energy consumption, which in turn reduces the output of carbon emissions to improve the environmental pollution obtained from the environmental benefits, and the economic benefit derived from the replacement of high-efficiency appliances by saving money spent on electricity. This economic benefit comes from the net present value of the difference between the cost of electricity saved by replacing high-efficiency appliances and the cost of buying them.
S2 discusses the benefits of building retrofits brought about by advances in energy-saving technologies, which affect all components of energy consumption in residential buildings, and which have contributed to improved energy efficiency in household electrical equipment, especially air conditioners, as well as to reduced heat loss and thermal imbalance in centralized heating systems through information-based intelligent means. In the baseline scenario of the retrofit process, the reduction in energy consumption of the centralized heating system accounts for 35.09% of the total reduction, the reduction in energy consumption of air-conditioning equipment accounts for 28.07%, lighting equipment accounts for 21.05%, and other electrical equipment accounts for about 15.79%. Obviously, the contribution to the reduction in energy consumption is not only dependent on the advancement in energy-saving technologies. The contribution of energy-saving retrofit benefits brought by the variable of energy-saving technology advancement is the most influential among all the set scenarios, so the advancement of technology plays a central role in the practice of energy saving and emission reduction in urban residential buildings.
S3 studies the influencing factors for the promotion of energy-saving products. The promotion of energy-saving products has contributed to residential building energy-saving renovation, and the environmental benefits and economic gains are greater than the energy consumption gains; furthermore, the marketization of the energy-saving renovation promotes the need to reasonably apportion the incremental costs by means of financial expenditures and tax incentives to increase the enthusiasm of enterprises to participate in energy-saving buildings. Low-interest loans or subsidized loans are provided for retrofit construction projects, and subsidies are given for the incremental cost of energy-saving retrofit projects.
S4 considers the effect of the level of government policy on residential building energy efficiency retrofit benefits based on the simulation for 2035. The improvement in the level of government policy refinement on residential building energy efficiency retrofit in energy consumption benefit and environmental benefit effects is greater than the economic benefit. As mentioned above, the current policy is more about the product technical standards or regulations of the mandatory provisions of incentives and other incentives to guide energy-saving retrofit projects. Market-oriented economic policies, such as incentive policies to guide the marketization of energy-saving retrofit projects, are slightly insufficient, and the changes in energy-saving retrofit benefits caused by government policy level parameters are focused on the reduction in energy consumption and carbon emissions in residential buildings.
S5 focuses on the impact of the willingness to develop parameters, and the marketization of building energy efficiency renovation is undoubtedly driving more construction companies to participate in it. Internally, the incremental revenue of building retrofit projects largely influences the willingness of enterprises to develop and invest innovative resources in research and development of key building energy efficiency technologies to improve industrialization and reduce development costs; externally, the strong support of government policies will increase the willingness of enterprises to participate. Therefore, the factors influencing the willingness of enterprises to develop are only ranked after the parameter of technological progress, and the benefits in energy consumption, environment, and economy are more considerable.
S6 and S7 are the most common strategies for renovating and updating old neighborhoods today, and the heat transfer coefficients of wall structures, roofs, and external windows are 3.5~4.5 times, 3~6 times, and 2~3 times those of developed countries, respectively [5]. The thermal insulation materials are reset, and the windows of the external walls of existing residential buildings are replaced to reduce the cooling and heating loads of the external environment entering the building itself. Improvement in the heat transfer coefficient of the envelope used in the baseline scenario results in a reduction in energy consumption and carbon emissions in residential buildings, which is gradually revealed in the lower feedback at the initial stage of the retrofit and later stages by using the net present value as an indicator of the economic benefits.
To quantitatively compare the different scenarios, we harmonized the range of changes in each scenario variable, i.e., the amount of change in post-retrofit benefits resulting from the unit rate of change in the factor. Table 7 presents an analysis of the changes in the different benefits of residential building renovation due to changes in units under each scenario. By 2035, in the policy-based parameter setting S1 and S4, the post-retrofit energy benefits increase by 0.15% and 0.26%, the environmental benefits increase by 0.98% and 1.92%, and the economic benefits increase by 0.59% and 0.24%, respectively, compared to the baseline scenarios’ unit changes. This indicates that the increase in the level of governmental policy refinement brings about more energy and environmental benefits compared to the increase in the awareness of residents’ energy efficiency. There is no direct effect on the economic benefits, which is more obvious in the improvement in owners’ awareness of energy saving.
The market category parameter changes for the setting of S3 and S5 in the simulation of the year 2035, and the retrofit energy efficiency compared to the baseline scenario residential building energy consumption reduction increased by 1,332,480 kwh and 1,518,430 kwh and the unit change improved by 0.12% and 1.11% for S3 and S5, respectively; the reduction in carbon emissions enhanced 109,720 tons and 125,030 tons for S3 and S5. The environmental benefits improved by 0.95% and 2.37% for S3 and S5, respectively; the economic benefits increased by CNY 403,100 and CNY 392,800 over the baseline scenario, and the unit change improved by 0.59% and 0.24% for S3 and S5, respectively. The increase in the willingness of enterprises to participate can better promote the market-oriented development of residential building energy-saving renovation projects, and the increase in the promotion of energy-saving products has not brought about a large gap in the benefits than the willingness of enterprises to participate, and the multi-pronged approach is more conducive to the efficiency of the market for building energy-saving.
The final set of S2, S6, and S7 correspond to the progress of energy-saving technologies; the benefits produced by the retrofitting of the exterior wall insulation and exterior windows of existing buildings were analyzed; the benefits of energy consumption after retrofitting were increased by 2.22%, 0.28%, and 0.24%, respectively, per unit change; the benefits of the environment were increased by 3.39%, 1.89%, and 0.63%, respectively. The economic benefits were increased by 340, 160, 311, 177, and 311,900, and the unit change was improved by 3.33%, 0.22%, and 0.28%. This shows that the progress of energy-saving technology is much greater than the existing external wall insulation and replacement of external windows for the retrofit of existing residential buildings to produce energy consumption, environmental, and economic benefits, and there should be more choices for energy-saving retrofit strategies such as the use of renewable energy, assembly design, and heat metering for centralized heating.

5. Discussion

This study combines qualitative and quantitative analyses to reveal the mechanism of the interaction of energy-saving technologies, socio-economics, policies and regulations, and market demand factors affecting the comprehensive benefits of residential building renovation by constructing the SD model of the comprehensive benefits generated by the renovation of existing residential buildings and the results of the simulation. Furthermore, a discussion on the limitations and comprehensive benefits of the retrofit and factors affecting the retrofit is necessary.
In analyzing and selecting retrofit strategies for one or more buildings, the main question is how to define the best alternatives. Researchers and professionals have developed several methods to address this issue and aid decision-making [50,51]. Retrofitting the urban-scale models for building type, building age, and other high dimensions increases the difficulty in selecting retrofitting strategies. However, most researchers choose commonly used strategies without considering this.
A change in a certain aspect of the input can enhance the benefits of residential building renovation, but it cannot completely and synergistically produce an equal growth in energy consumption, environment, and economic tripartite benefits, and it cannot solely improve energy consumption at the expense of the economic benefits. Generally, cost benefits constrain energy benefits and environmental benefits. It is noted that the choice of criteria or indicators can influence the results of the benefits and, consequently, the process of selection of retrofit strategies. How to choose the fitting energy-saving technologies and standards to maximize the balance of benefits is an issue to be further explored in the future.
The results of different scenarios simulated by the SD model show that the increase in the rate of technological progress has the greatest impact on the comprehensive benefits of the retrofit of existing residential buildings and plays a central role in the implementation of the retrofit of old neighborhoods. In recent years, several studies have addressed the concept of Building Information Modeling (BIM), renewable energy, and so on. These emerging technologies can enhance the benefits of retrofitting [52,53].
The simulation of market factors found that the willingness of enterprises to participate in comparison to the promotion of energy-saving products to bring more obvious comprehensive benefits and the marketization of building energy-saving renovation shows an inevitable trend to promote the development of the renovation project in the future, which requires the synergism of technology, policy, and market demand. The reduction in incremental cost of the renovation project undoubtedly increases the enterprise’s willingness to participate, providing intrinsic motivation, and the need to renovate the scale of market demand, also increases, and the government incentives and policy regulations also simultaneously play a role in this process.
Furthermore, financial limitations should also be considered, as some retrofit strategies may require a high initial investment or have a long payback period [54]. The retrofitting program will face large challenges. The increase in the level of policy at the later stage is reflected more in the improvement in the type of economic incentives, the degree of building energy efficiency tax breaks introduced by the government, the strength of the financial subsidies, the support of the enterprise credit approval, and the priority of the land grant policy.

6. Conclusions

By constructing the SD model for the comprehensive benefit of energy-saving retrofit of existing residential buildings and simulation results, the growth trend of the comprehensive benefit of urban residential building retrofit during the period from 2016 to 2035 was simulated, and the following conclusions were drawn:
(1) It is found that the growth is relatively slow in the early period and is rapid in the later period, and the curve fits the actual situation of the implementation of urban retrofit of the old neighborhoods better, which means that the urban residential buildings in this Liaoning Province remodeling can potentially obtain large benefits.
(2) At present, the factors affecting the efficiency of existing residential building renovation are the socio-economic environment, government policy level, degree of development of energy-saving technologies, and energy-saving renovation of the market demand for the four aspects. These factors have complex relationships with each other. The implementation of energy-saving renovation projects in the future will focus on the synergistic effect of the socio-economy, policy designation, energy-saving technologies, and market demand.
(3) After changing the parameters for the above four influencing factors, the simulation found that the increase in the rate of technological progress has the greatest impact on the comprehensive benefits of the retrofit of the existing residential buildings. As per the simulation of the year 2035, the unit change in the rate of technological progress in energy saving has increased the energy consumption benefits by 2.22%, the environmental benefits by 3.39%, and the economic benefits by 3.33%, respectively.
(4) To observe an increase in benefits, a certain aspect of the input can be changed to enhance the benefits of the transformation of existing residential buildings, but it cannot fully and synergistically produce an equal growth in energy consumption, environment, and economic tripartite benefits; the early stage exhibited a reduction in the amount of energy consumption and carbon emissions; however, the economic benefits were observed in the later stages.
(5) The reduction in energy consumption of each part of residential buildings is affected by the adoption of retrofitting measures, and this effect varies for each part. In the baseline scenario, the reduction in energy consumption of centralized heating system accounts for 35.09% of the total reduction, of air-conditioning equipment accounts for 28.07%, of lighting equipment accounts for 21.05%, and of other electrical equipment accounts for about 15.79%; thus, the centralized heating retrofit has a greater potential of producing energy consumption benefits.

Author Contributions

Conceptualization, S.L.; Methodology, L.L. and H.L.; Data curation, R.S. All authors have read and agreed to the published version of the manuscript.

Funding

Project supported by the Scientific Research Foundation of the Higher Education Institutions of Liaoning Province, China (No. JYTQN2023140).

Institutional Review Board Statement

Not applicable.

Informed Consent Statement

Not applicable.

Data Availability Statement

The original contributions presented in this study are included in the article. Further inquiries can be directed to the corresponding author.

Conflicts of Interest

The authors declare no conflicts of interest.

References

  1. Global Influencer Agency at Interstellar International Entertainment Agency. The Critical Role of Buildings: Perspectives for the Clean Energy Transition; Energy Agency: Paris, France, 2019. [Google Scholar]
  2. Emissions(CABEE), P.C.o.B.E.a. Research Report on Carbon Emissions in the Field of Urban and Rural Development in China (2024); Chongqing University: Chongqing, China, 2024. [Google Scholar]
  3. Kirme, S.K.; Kapse, V.S. A comprehensive review of residential building energy efficiency measures in India. Annu. Rev. Resour. Econ. 2022, 14, 689–708. [Google Scholar] [CrossRef]
  4. Sarihi, S.; Mehdizadeh Saradj, F.; Faizi, M. A Critical Review of Façade Retrofit Measures for Minimizing Heating and Cooling Demand in Existing Buildings. Sustain. Cities Soc. 2021, 64, 102525. [Google Scholar] [CrossRef]
  5. Su, Y.; Gong, A.; Pu, M.; Liu, C. Thermal Performance Improvement of External Envelope Structure of Existing Residential Buildings: Taking Dalian as an Example. J. BEE 2022, 12, 87–105. [Google Scholar]
  6. Zhao, J.; Wu, Y.; Zhu, N. Check and evaluation system on heat metering and energy efficiency retrofit of existing residential buildings in northern heating areas of china based on multi-index comprehensive evaluation method. Energy Policy 2009, 37, 2124–2130. [Google Scholar] [CrossRef]
  7. Jaggs, M.; Palmer, J. Energy performance indoor environmental quality retrofit—A European diagnosis and decision making method for building refurbishment. Energy Build. 2000, 31, 97–101. [Google Scholar] [CrossRef]
  8. Liu, X.; Qiang, C. Evaluation of Building Energy Efficiency Policies Based on a Policy Instrument Perspective. Urban Probl. 2019, 10, 83–89. [Google Scholar]
  9. Liu, K.; Long, W. Risks Analysis of Energy Performance Contracting for Building Energy Efficiency Industry in China. Build. Energy Effic. 2016, 44, 121–124. [Google Scholar]
  10. Jie, Y. Research on Building Energy Efficiency Management Mechanism Based on Stakeholders. Shandong Soc. Sci. 2010, 10, 93–98. [Google Scholar]
  11. Dadzie, J.; Runeson, G.; Ding, G.; Bondinuba, F. Barriers to Adoption of Sustainable Technologies for Energy-Efficient Building Upgrade—Semi-Structured Interviews. Buildings 2018, 8, 57. [Google Scholar] [CrossRef]
  12. Dolšak, J.; Hrovatin, N.; Zorić, J. Factors impacting energy-efficient retrofits in the residential sector: The effectiveness of the Slovenian subsidy program. Energy Build. 2020, 229, 15. [Google Scholar] [CrossRef]
  13. De Boeck, L.; Verbeke, S.; Audenaert, A.; De Mesmaeker, L. Improving the energy performance of residential buildings: A literature review. Renew. Sustain. Energy Rev. 2015, 52, 960–975. [Google Scholar] [CrossRef]
  14. Domínguez, S.; Sendra, J.J.; León, A.L.; Esquivias, P.M. Towards Energy Demand Reduction in Social Housing Buildings: Envelope System Optimization Strategies. Energies 2012, 5, 2263–2287. [Google Scholar] [CrossRef]
  15. Das, P.; Chalabi, Z.; Jones, B.; Milner, J.; Shrubsole, C.; Davies, M.; Hamilton, I.; Ridley, I.; Wilkinson, P. Multi-objective methods for determining optimal ventilation rates in dwellings. Build. Environ. 2013, 66, 72–81. [Google Scholar] [CrossRef]
  16. Gong, X.; Akashi, Y.; Sumiyoshi, D. Optimization of passive design measures for residential buildings in different Chinese areas. Build. Environ. 2012, 58, 46–57. [Google Scholar] [CrossRef]
  17. Hamdy, M.; Hasan, A.; Siren, K. Applying a multi-objective optimization approach for Design of low-emission cost-effective dwellings. Build. Environ. 2011, 46, 109–123. [Google Scholar] [CrossRef]
  18. Elsawaf, N.; Abdel-Salam, T.; Abaza, H. Economic evaluation and calculations of energy savings by upgrading the heating systems in pre manufactured homes. Energy Build. 2013, 59, 187–193. [Google Scholar] [CrossRef]
  19. Yu, J.; Tian, L.; Yang, C.; Xu, X.; Wang, J. Optimum insulation thickness of residential roof with respect to solar-air degree-hours in hot summer and cold winter zone of china. Energy Build. 2011, 43, 2304–2313. [Google Scholar] [CrossRef]
  20. Saari, A.; Kalamees, T.; Jokisalo, J.; Michelsson, R.; Alanne, K.; Kurnitski, J. Financial viability of energy-efficiency measures in a new detached house design in Finland. Appl. Energy 2012, 92, 76–83. [Google Scholar] [CrossRef]
  21. Dylewski, R.; Adamczyk, J. Economic and environmental benefits of thermal insulation of building external walls. Build. Environ. 2011, 46, 2615–2623. [Google Scholar] [CrossRef]
  22. Georges, L.; Massart, C.; Van Moeseke, G.; De Herde, A. Environmental and economic performance of heating systems for energy-efficient dwellings: Case of passive and low-energy single-family houses. Energy Policy 2012, 40, 452–464. [Google Scholar] [CrossRef]
  23. Liu, Y. Cost-benefit analysis of energy efficiency improvement of existing residential buildings in heating regions based on LCCA. China Civ. Eng. J. 2011, 44, 118–123. [Google Scholar]
  24. Ren, J.; Yang, S.; Qi, S.; Yin, Y. Case Study on Incremental Benefits of Energy-saving in Green Building Based on Genetic Algorithms. Resour. Dev. Mark. 2019, 35, 452–455+577. [Google Scholar]
  25. Gustavsson, L.; Joelsson, A. Life cycle primary energy analysis of residential buildings. Energy Build. 2010, 42, 210–220. [Google Scholar] [CrossRef]
  26. Shi, X.; Liu, Y. Energy Conservation and Emission Reduction Path of Public Buildings Based on System Dynamics. Build. Energy Effic. 2023, 51, 137–144. [Google Scholar]
  27. Liu, J.; Zhao, J. Building Carbon Emissions Prediction Research Based on System Dynamics. Sci. Technol. Manag. Res. 2018, 38, 219–226. [Google Scholar]
  28. Li, W.; Zhang, T.; Liu, M. Policy Simulations of the Prefabricated Building Industry and Evaluations of Benefits for Energy Conservation and Emission Reduction Based on System Dynamics. Ind. Constr. 2022, 52, 196–205. [Google Scholar]
  29. Li, Q.; Tan, Y.; Liu, P. Research on the Comprehensive Benefits of Energy-saving Reconstruction for Existing Public Buildings Based on SD. J. Eng. Manag. 2021, 31, 7–12. [Google Scholar]
  30. Ramos, A.; Labandeira, X.; Löschel, A. Pro-environmental Households and Energy Efficiency in Spain. Environ. Resour. Econ. 2015, 63, 367–393. [Google Scholar] [CrossRef]
  31. Ahn, Y.; Sohn, D.-W. The effect of neighbourhood-level urban form on residential building energy use: A GIS-based model using building energy benchmarking data in Seattle. Energy Build. 2019, 196, 124–133. [Google Scholar] [CrossRef]
  32. Lu, Z.; Yong-an, L.; Xue-lai, L. Research on energy consumption prediction of civil buildings based on grey relational analysis. Archit. Technol. 2020, 51, 1129–1134. [Google Scholar]
  33. Hu, Y.; Zhu, D. Disconnect Analysis Between CO2 Emission Output Value and Energy Consumption of China Construction. China Popul. Resour. Environ. 2015, 25, 50–57. [Google Scholar]
  34. Ozturk, H.K.; Ceylan, H.; Canyurt, O.E.; Hepbasli, A. Electricity estimation using genetic algorithm approach: A case study of Turkey. Energy 2005, 30, 1003–1012. [Google Scholar] [CrossRef]
  35. Zhang, Y.; Li, N.; Zhao, T.; Li, Z. An energy-saving design method for residential building group based on convolutional neural network. J. Build. Eng. 2024, 82, 108291. [Google Scholar] [CrossRef]
  36. Queiroz, N.; Westphal, F.S.; Ruttkay Pereira, F.O. A performance-based design validation study on EnergyPlus for daylighting analysis. Build. Environ. 2020, 183, 107088. [Google Scholar] [CrossRef]
  37. Li, L.; Wang, Y.; Wang, M.; Hu, W.; Sun, Y. Impacts of multiple factors on energy consumption of aging residential buildings based on a system dynamics model--Taking Northwest China as an example. J. Build. Eng. 2021, 44, 102595. [Google Scholar] [CrossRef]
  38. Chen, L.; Zhang, M.; Li, S.; Li, X. Influencing Factors of Energy Saving Retrofit of Existing Buildings Based on DEMATEL-ISM Model. Constr. Econ. 2022, 43, 84–92. [Google Scholar]
  39. Yi, H.; Wang, X.; Peng, S.; Wang, F. Research and development suggestions on the present situation of the reconstruction of existing residential buildings in China. Build. Sci. 2021, 37, 127. [Google Scholar]
  40. He, Z.; She, L. Evaluation research on the influencing factors of building energy efficiency promotion based on AHP. J. Guangzhou Universily (Nat. Sci. Ed.) 2013, 12, 76–81. [Google Scholar]
  41. Qiao, W.; Guo, H. Research on Influencing Factors of Subject Cooperation of Existing Buildings Energy-Saving Renovation Based on SNA. Ecol. Econ. 2022, 38, 84–90. [Google Scholar]
  42. Li, W.; Guo, H. Research on Influencing Factors of Endogenous Power for Owners of Energy-saving Renovation of Existing Residential Buildings Based on the Perspective of Social Network Analysis. J. Civ. Eng. Manag. 2020, 37, 8–14. [Google Scholar]
  43. Huang, M.; Lin, R. Evolutionary Game Analysis of Energy-Saving Renovations of Existing Rural Residential Buildings from the Perspective of Stakeholders. Sustainability 2022, 14, 5723. [Google Scholar] [CrossRef]
  44. Han, Q.; Yang, X.; Zhan, S.; Liu, C. Implementation Effect Evaluation Index System Construction of Economic Incentive Policies for Building Energy Efficiency. J. Beijing Jiaotong Univ. (Soc. Sci. Ed.) 2010, 9, 59–63. [Google Scholar]
  45. Yearwood Travezan, J.; Harmsen, R.; van Toledo, G. Policy analysis for energy efficiency in the built environment in Spain. Energy Policy 2013, 61, 317–326. [Google Scholar] [CrossRef]
  46. Song, S.; Leng, H. Modeling the Household Electricity Usage Behavior and Energy-Saving Management in Severely Cold Regions. Energies 2020, 13, 5581. [Google Scholar] [CrossRef]
  47. He, Y.; Ding, N. Comparative analysis of energy performance assessment for green buildings:China green building rating system vs other major certification systems. Heat. Vent. Air Cond. 2016, 46, 79–96. [Google Scholar]
  48. Huang, Z. Investment Decision of Existing Building Energy Efficiency Retrofitting Projects under Uncertainty. Urban Dev. Stud. 2015, 22, 4–8. [Google Scholar]
  49. Guo, H.; Zhang, Y.; Liu, R. Implementation Strategies for the Healthy Development of the Existing Building Energy-saving Renovation Market. Constr. Econ. 2023, 44, 32–35. [Google Scholar]
  50. Hwang, J.; Lim, H.; Lim, J. Reducing uncertainty of building shape information in urban building energy modeling using Bayesian calibration. Sustain. Cities Soc. 2024, 116, 105895. [Google Scholar] [CrossRef]
  51. Sun, Z.; Gao, Y.; Yang, J.; Chen, Y.; Guo, B.H.W. Development of urban building energy models for Wellington city in New Zealand with detailed survey data on envelope thermal characteristics. Energy Build. 2024, 321, 114647. [Google Scholar] [CrossRef]
  52. Shim, J.; Park, S.; Park, S.; Song, D. Energy signature approach for retrofit prioritization: A proposal for building identification methodology. Sustain. Cities Soc. 2024, 115, 105844. [Google Scholar] [CrossRef]
  53. Yang, Z.; An, H.; Li, S. Study on Influence of Window–wall Area Ratio on Building Energy Consumption in Dalian Based on Grasshopper Parametric Design. J. Dalian Minzu Univ. 2023, 25, 238–243. [Google Scholar]
  54. Pardo-Bosch, F.; Cervera, C.; Ysa, T. Key aspects of building retrofitting: Strategizing sustainable cities. J. Environ. Manag. 2019, 248, 109247. [Google Scholar] [CrossRef] [PubMed]
Figure 1. Structure of building energy efficiency simulation.
Applsci 15 06072 g001
Figure 2. Socio-economic subsystem feedback loops.
Applsci 15 06072 g002
Figure 3. Technical subsystem feedback loop.
Applsci 15 06072 g003
Figure 4. Policy subsystem feedback loop.
Applsci 15 06072 g004
Figure 5. Market subsystem feedback loop.
Applsci 15 06072 g005
Figure 6. System flow diagram of energy efficiency benefits in existing residential buildings.
Applsci 15 06072 g006
Figure 7. Model stability test: (a) energy consumption of urban residential buildings; (b) reduction in energy consumption after retrofit.
Applsci 15 06072 g007
Figure 8. Energy efficiency retrofit benefits of existing residential buildings in the baseline: (a) energy consumption benefits; (b) environmental benefits; (c) economic benefits.
Applsci 15 06072 g008aApplsci 15 06072 g008b
Figure 9. Results of the baseline scenario impact factor run: (a) willingness rate of enterprises to develop; (b) efforts to promote energy-saving products; (c) policy support rate; (d) energy efficiency technology progress rate.
Applsci 15 06072 g009aApplsci 15 06072 g009b
Table 1. Factors affecting energy efficiency retrofits in residential buildings.
FactorLiterature
Architecture geometry[11,12,35,36,37]
Standards regulation[8,10,37,38,39,40,41,42,43,44]
Government incentives[8,10,12,37,38,39,40,42,43,44,45,46]
Financing methods[10,11,12,38,39,42,43,44,45]
Energy conservation awareness[37,38,39,40,45,46]
Level of technology[37,38,39,40,42,47,48]
Earnings distribution[38,41,43,44]
Risk sharing[38,41]
Energy efficiency benefit[11,38,41,42,43,48]
Organization[8,10,38,39,41]
Energy efficiency promotion[8,40,42,44]
Government regulation[10,39,42,43]
Retrofit costs[10,12,40,46]
Retrofit of building structures[12,35,39,47]
Local climate[47]
Retrofit external spaces[12,35,36,37,39,47]
Energy price[12,37,41,42,44,45,46,48]
Quality of service [10,41,42]
Comfort gains[37,48]
Investment income[41,48]
Table 2. Building energy efficiency simulation study boundary.
SubsystemsTargets
Policy subsystem PStandard regulatory system, incentive policy, government regulation
Socio-economic subsystem EHomeowner awareness of energy efficiency, energy efficiency benefits
Market subsystem SFinancing methods, revenue sharing, risk sharing, promotion of energy-saving products, retrofit costs, quality of energy-saving services, investment returns
Technical subsystem TLevel of energy-saving technology, organization, comfort gains
Building energy consumptionBuilding geometry, retrofitting the building proper (envelope, heating, shading, renewable energy) local climate, retrofitting exterior spaces
Table 3. Explanation of impact factor indicators.
FactorExplanation of Content
Environmental benefitsCarbon emissions reduced by the implementation of energy efficiency measures
Economic benefitsCost of converting building energy into electrical energy reduced by the implementation of energy efficiency measures
Energy-saving technologies for buildingsEnclosure energy-saving technology, equipment and system energy-saving technology, heating energy-saving technology
Incremental costAdditional costs paid to realize energy efficiency benefits in energy efficiency measures
Willingness of enterprises to developWillingness of construction companies to participate in energy efficiency program investments in the course of their operations
Incentive mechanismRefers to government incentives for the energy efficiency retrofit industry through specific approaches and regulatory models
Owners’ willingness to save energyOwners are intrinsic drivers of building energy efficiency program development
Building energy efficiency market shareRatio of residential building energy efficiency retrofit area to existing residential area
Policy supportSound policy and legal standards and regulatory mechanisms, certain policy promotion efforts
Promotion of energy-saving productsEnergy-saving doors and windows and other products under the energy-saving retrofit technology for existing buildings promoted under the market mechanism
Table 4. Variable equation settings.
Variable NameTypeVariable Expression
Increased market share of building energy efficiencyRate variableEnterprises’ willingness to develop × 0.436 + proportion of existing residential renovation area × 0.285 + incentive mechanism * 0.279
Rate of increased awareness of energy conservationRate variableExpenditures per unit of residential space × 0.357/150 + 0.256 × policy support + 0.387 × incentives
Promotion of energy-saving productsRate variablePolicy support × 0.247 + incentives × 0.429 + progress in energy-saving technologies × 0.324
Rate of increase in willingness of enterprises to developRate variableIncremental cost × 0.615/100 + incentives × 0.385
Rate of technological progressRate variableLabor input × 0.24 + construction cost × 0.28 + STI input × 0.2
Reduced energy consumption for air conditioning volumeAuxiliary variableScale of renovation * intensity of air-conditioning energy consumption (13.5) × (energy-saving awareness of owners × 0.285 + progress in energy-saving technology × 0.215 + 0.25 × rate of reduction of heat transfer coefficient of external walls + rate of reduction of heat transfer coefficient of external windows × 0.25)/10,000
Reduction in heating energy consumptionAuxiliary variableScale of renovation × heating energy intensity (9.7) × (reduction rate of heat transfer coefficient of external walls × 0.3 + reduction rate of heat transfer coefficient of external windows × 0.3 + progress of energy-saving technologies × 0.4)/10,000
Reduction in energy consumption of lighting equipmentAuxiliary variableScale of retrofit × energy intensity of lighting equipment (5.4) × (owner’s awareness of energy saving × 0.5 + progress of energy saving technology × 0.5)/10,000
Reduction in energy consumption of other electrical appliancesAuxiliary variableScale of renovation × energy intensity of other electrical equipment (8.1) × (Owner’s awareness of energy saving × 0.5 + progress in energy saving technology × 0.5)/10,000
Incremental costAuxiliary variableProgress in energy-saving technologies × Investment in science, technology and innovation—Taxes on buildings
Reduction in building energy consumptionAuxiliary variableEnergy consumption in residential buildings—(air conditioning energy + heating energy + lighting energy + other electrical appliances after retrofitting)
Economic benefitAuxiliary variable∑(Savings from retrofit program—initial investment cost of retrofit program)/(1 + 5%)25
Environmental benefitAuxiliary variableBuilding energy consumption reduction × 0.1229 × carbon emission factor
Table 5. Results of historical test of model indicator parameters.
YearProvince GDPTotal Population of the Province
Analog ValueActual ValueInaccuraciesAnalog ValueActual ValueInaccuracies
20004526.284669.13.06%41014135.30.83%
20014901.975033.12.61%41714147−0.58%
20025348.045458.22.02%4176.844155.4−0.52%
20035882.855906.30.40%4182.444161.6−0.50%
20046477.026469.8−0.11%4186.914172.8−0.34%
20057215.47260.80.63%4190.724189.2−0.04%
20068131.758390.33.08%4194.794210.40.37%
20079286.4610,292.29.77%4199.44231.70.76%
200810,987.212,137.79.48%4205.834246.10.95%
200911,444.812,815.710.70%4210.4542561.07%
201012,592.513,896.39.38%4214.544251.70.87%
201114,862.916,354.99.12%4216.3142550.91%
201215,918.617,848.610.81%4214.874244.80.71%
201317,243.319,208.810.23%4213.2342380.58%
201418,593.520,025.77.15%4213.14244.20.73%
201518,86220,210.36.67%4214.24229.70.37%
201619,076.620,392.56.45%4212.4342320.46%
201720,392.921,6935.99%4211.674196.5−0.36%
201821,759.223,510.57.45%4209.824191.9−0.43%
201923,064.824,855.37.20%4205.614190.2−0.37%
202023,572.225,011.45.75%4202.244165.9−0.87%
202125,552.327,584.17.37%4195.944152.1−1.06%
Table 6. Scenario parameter settings.
SchemeFormParametersParameter Setting Change Range
Baseline scenario-Keep the initial value of each parameter unchanged-
Scenario 1Policy category20% increase in homeowners’ awareness of energy efficiencyData from [42]
Scenario 4Policy category10% increase in policy support for enactmentData from [8]
Scenarios 3Market segment20% increase in promotion of energy-saving productsData from [40,43]
Scenario 5Market segment15% increase in willingness of enterprises to developData from [49]
Scenario 2Technical category20% increase in energy-saving technological advancesChina Statistical Yearbook on Construction
Scenario 6Technical category30% increase in heat transfer coefficient of external wallsData from [5]
Scenario 7Technical category10% increase in heat transfer coefficient of external windowsData from [5]
Table 7. (a) Comparative analysis of residential building retrofit energy benefits by scenario. (b) Comparative analysis of residential building retrofit environmental benefits by scenario. (c) Comparative analysis of residential building retrofit economic benefits by scenario.
(a)
YearScenario
S1S2S3S4S5S6S7
20160.02%0.41%0.01%0.05%0.18%0.12%0.08%
20170.02%0.58%0.02%0.06%0.26%0.12%0.08%
20180.03%0.74%0.02%0.07%0.33%0.14%0.09%
20190.04%0.88%0.03%0.09%0.40%0.15%0.09%
20200.04%1.02%0.03%0.10%0.47%0.15%0.10%
20210.05%1.17%0.04%0.11%0.54%0.17%0.10%
20220.06%1.39%0.05%0.13%0.65%0.17%0.11%
20230.07%1.61%0.06%0.15%0.75%0.19%0.12%
20240.08%1.71%0.06%0.16%0.81%0.19%0.13%
20250.09%1.80%0.07%0.17%0.86%0.20%0.14%
20260.09%1.88%0.07%0.18%0.90%0.20%0.15%
20270.10%1.94%0.08%0.19%0.93%0.21%0.16%
20280.11%2.00%0.08%0.20%0.97%0.22%0.17%
20290.11%2.04%0.09%0.21%0.99%0.22%0.18%
20300.12%2.08%0.09%0.21%1.02%0.23%0.19%
20310.12%2.12%0.10%0.22%1.04%0.24%0.20%
20320.13%2.15%0.10%0.23%1.06%0.26%0.21%
20330.13%1.98%0.11%0.23%1.07%0.26%0.23%
20340.14%2.20%0.11%0.25%1.09%0.28%0.23%
20350.15%2.22%0.12%0.26%1.11%0.28%0.24%
(b)
YearScenario
S1S2S3S4S5S6S7
20160.07%0.47%0.07%0.15%0.25%0.14%0.05%
20170.38%0.98%0.37%0.77%0.75%0.75%0.25%
20180.61%1.39%0.60%1.23%1.13%1.20%0.40%
20190.67%1.62%0.66%1.35%1.28%1.31%0.44%
20200.83%1.96%0.81%1.66%1.57%1.63%0.54%
20210.77%2.04%0.75%1.54%1.56%1.50%0.50%
20220.69%2.18%0.67%1.38%1.55%1.34%0.45%
20231.10%2.94%1.08%2.20%2.25%2.15%0.72%
20241.10%3.06%1.08%2.20%2.31%2.16%0.72%
20251.14%3.22%1.12%2.28%2.42%2.24%0.75%
20261.15%3.30%1.12%2.28%2.46%2.24%0.75%
20271.14%3.35%1.11%2.26%2.48%2.22%0.74%
20281.14%3.41%1.11%2.25%2.50%2.22%0.74%
20291.12%3.43%1.09%2.21%2.50%2.18%0.73%
20301.10%3.43%1.07%2.16%2.48%2.13%0.71%
20311.07%3.43%1.04%2.12%2.47%2.08%0.70%
20321.05%3.43%1.02%2.07%2.44%2.04%0.68%
20331.03%3.42%0.99%2.01%2.42%1.99%0.66%
20341.01%3.41%0.97%1.97%2.40%1.95%0.65%
20350.98%3.39%0.95%1.92%2.37%1.89%0.63%
(c)
YearScenario
S1S2S3S4S5S6S7
20160.03%0.02%0.03%0.06%0.02%0.03%0.05%
20170.04%0.22%0.04%0.08%0.03%0.05%0.06%
20180.06%0.32%0.05%0.09%0.04%0.05%0.07%
20190.07%0.43%0.07%0.11%0.06%0.07%0.09%
20200.10%0.58%0.09%0.13%0.08%0.08%0.11%
20210.12%0.73%0.11%0.15%0.10%0.10%0.13%
20220.15%0.93%0.14%0.17%0.12%0.11%0.15%
20230.19%1.20%0.17%0.19%0.15%0.13%0.18%
20240.22%1.41%0.20%0.21%0.18%0.15%0.20%
20250.26%1.63%0.23%0.22%0.20%0.17%0.21%
20260.29%1.85%0.26%0.23%0.23%0.17%0.23%
20270.33%2.06%0.29%0.24%0.25%0.18%0.24%
20280.36%2.27%0.31%0.24%0.28%0.20%0.26%
20290.40%2.46%0.33%0.25%0.30%0.21%0.27%
20300.43%2.64%0.36%0.25%0.32%0.20%0.28%
20310.47%2.80%0.37%0.25%0.34%0.20%0.28%
20320.50%2.96%0.39%0.25%0.35%0.21%0.29%
20330.53%3.10%0.41%0.25%0.37%0.22%0.29%
20340.56%3.22%0.42%0.24%0.38%0.21%0.29%
20350.59%3.33%0.43%0.24%0.39%0.22%0.29%
Disclaimer/Publisher’s Note: The statements, opinions and data contained in all publications are solely those of the individual author(s) and contributor(s) and not of MDPI and/or the editor(s). MDPI and/or the editor(s) disclaim responsibility for any injury to people or property resulting from any ideas, methods, instructions or products referred to in the content.

