Article

A Magnetotelluric Signal Acquisition and Monitoring System Based on a Cloud Platform

1
School of Geoscience and Info-Physics, Central South University, Changsha 410083, China
2
Bureau of Geophysical Prospecting Inc., China National Petroleum Corporation, Zhuozhou 072750, China
3
AIoT Innovation and Entrepreneurship Education Center for Geology and Geophysics, Central South University, Changsha 410083, China
*
Author to whom correspondence should be addressed.
Appl. Sci. 2025, 15(10), 5598; https://doi.org/10.3390/app15105598
Submission received: 31 March 2025 / Revised: 10 May 2025 / Accepted: 15 May 2025 / Published: 16 May 2025

Abstract

:
This study designed and implemented an magnetotelluric signal acquisition and monitoring system (CMT) based on an Internet of Things (IoT) cloud platform. By integrating magnetotelluric monitoring stations, control terminals, and cloud servers, a real-time and efficient monitoring network was constructed. The hardware part of the system adopts a multi-module collaborative design, including signal conditioning circuits, FPGA control modules, DSP processing units, and embedded subsystems, achieving high-precision acquisition and processing of magnetotelluric signals. The software part employs a layered architecture, developing acquisition software, terminal control software, and a cloud platform monitoring system, which support multi-protocol communication, data parsing, and remote interaction. Through server stress testing, consistency testing, and cloud platform functional verification, the results showed that the system performs well under pressure even with limited server hardware bandwidth, with controllable consistency errors compared to the commercial device MTU-5A, and has stable field acquisition performance. The study validated the system’s advantages in real-time performance, reliability, and scalability, providing a feasible technical solution for the field of magnetotelluric monitoring. In the future, the system will be applied to geothermal monitoring.

1. Introduction

Conducting geophysical research requires a large amount of effective data [1], so geophysical instruments that can efficiently acquire data play a crucial role in the geophysical industry. They provide geophysical researchers and engineers with the means to obtain information about the Earth’s internal structure, surface features, and environmental conditions [2]. Geophysical instruments are key in exploring oil, natural gas, minerals, and water resources, while also offering tools for in-depth research into the Earth’s internal structure and crustal movements [3,4].
The magnetotelluric (MT) method [5], proposed in the early 1950s, is a geophysical technique that uses natural alternating electromagnetic fields to study underground electrical structures. Its exploration depth varies with the frequency of the electromagnetic field, ranging from tens of meters to hundreds of kilometers. In the traditional MT instrument market, companies like Canada’s Phoenix, Germany’s Metronix, and the USA’s EMI dominate globally [6].
In the past, geophysical instrument control systems were mainly based on personal computers and Windows operating systems, using wired communication. However, with advancements in communication technology, the field has gradually shifted towards portability and lightweight designs. The new generation of control systems, centered around handheld devices and smartphones, uses wireless communication, marking the beginning of a more flexible and convenient era for instrument control systems. This transformation is expected to improve operational convenience, enhance mobility, and make geophysical instruments more adaptable to different environments and scenarios.
Smartphones, as control terminals, have brought many conveniences to people’s lives. With the widespread adoption of Android smartphones, more control systems have focused on Android platforms. Existing smartphone applications in the geophysical field mainly fall into two categories: educational and data-sharing applications, and control programs for acquisition systems [7,8,9,10]. In 2018, Wen et al. developed an Android application capable of monitoring multiple electromagnetic receivers simultaneously [11]; in 2020, Liu et al. designed an Android-based monitoring program for wireless microseismic stations [12]; in 2021, Zhang et al. developed a wireless microseismic acquisition control system with Android-based control software [13]; and in 2024, Li et al. designed a landslide monitoring data acquisition application based on the Android platform [14]. In 2024, the broadband complex resistivity measurement system for rocks and ores designed by Peng et al. was equipped with an Android platform for monitoring and control [15].
Over the past decade, advancements in wireless communication, computer technology, new materials, and electronics have profoundly influenced the development of geophysical instruments [16,17,18]. The development of geophysical wireless communication systems has undergone a leap from traditional wired transmission to modern intelligent networking. Early cable-dependent wired systems (e.g., seismic stations) were limited by deployment costs and scope, and data-based real-time performance was poor. With the progress of wireless technology, short-range radio frequency (e.g., ZigBee) has realized local networking since the 1980s; satellite communications (e.g., Iridium, Beidou) broke through the bottleneck of polar monitoring at the beginning of the twenty-first century, but there was a problem of high latency; this problem was solved after 2010 when the popularization of 4G/5G mobile communications was achieved. At the same time, efficient data transmission has introduced the Internet of Things and cloud platforms into geophysical wireless communication systems.
The refinement of IoT technology and the widespread adoption of infrastructure such as signal base stations and smart devices have provided geophysical instrument development with wireless control and centralized data management capabilities [19].
The Internet of Things (IoT) is a concept of connecting and interacting devices and objects through the internet [20]. These devices can include sensors, actuators, embedded devices, and smart devices, which can communicate, share data, and perform specific tasks over a network [21]. In IoT, communication between devices can be achieved through various protocols and technologies, such as Wi-Fi, Bluetooth, Zigbee, and LoRa [22,23,24,25].
In 2019, Li et al. designed a distributed hybrid geoelectric data acquisition system based on IoT [26]; in 2021, Zhou et al. integrated IoT technology into a four-dimensional high-density geophysical electrical instrument [27]; in 2022, researchers combined InSAR, GNSS, IoT, and 5G technologies to monitor and forecast earthquakes in Abuja, Nigeria [28]; and in 2024, Indukala et al. designed a landslide monitoring microseismic sensing system and platform based on IoT technology [29].
A cloud platform is a service and resource management platform based on cloud computing technology that provides various computing, storage, and network services over the internet [30]. The deep integration of cloud computing, big data, IoT, and geophysical technology has enabled remote control, fault detection, and real-time data transmission and analysis, making the connection of geophysical instruments to cloud platforms via IoT a hot research direction [31].
Previous research has mainly focused on IoT technology. By connecting devices and instruments to cloud platforms via sensors, they can communicate in real-time, collect data, and be remotely controlled [32]. IoT-connected cloud platforms allow geophysical instruments to monitor environmental parameters in real time and transmit data to the cloud or central servers, providing real-time data acquisition and monitoring. IoT-connected cloud platforms also allow users to adjust and manage geophysical instruments through remote control interfaces. Cloud platforms themselves are resource management platforms, offering more possibilities for interdisciplinary research, big data analysis, and model building [33].
The integration of IoT and cloud platforms has moved from theory to practice in the geophysical field. In 2014, Versteeg et al. implemented a cloud-based electrical geophysical monitoring software package, enabling automatic data transmission, processing, visualization, and delivery to end-users [34]; in 2016, Müller et al. designed a cloud-based 3D visualization software for geophysical data [35]; in 2022, Kurt Martin Strack et al. designed a new electromagnetic acquisition architecture combining artificial intelligence and cloud-based data transmission and quality assurance, achieving near-real-time operations [36]; in 2023, Zhu et al. designed a cloud-based machine learning seismic monitoring workflow [37]; and in 2024, Huebert et al. used cloud modeling technology to establish a UK ground electric field model for simulating geomagnetic storm-induced electric field changes [38].
IoT and cloud platform technologies have also been widely applied in geothermal research. In 2022, Park et al. designed an open-source IoT-based geothermal monitoring system and applied it to a nursing home in South Korea [39]; in 2023, Prauzek et al. proposed a power generation system for IoT-based geothermal monitoring, forming a comprehensive geothermal monitoring system [40]; and in 2023, Dasmen et al. developed an IoT-based monitoring system for measuring hydrogen sulfide concentrations in geothermal environments [41].
In summary, cloud platform technology has already been applied in the geophysical field, but it has the disadvantages of a late start and slow development, as well as shortcomings in integration and systematicity. Most of the previous research mainly focused on the migration of data to cloud platforms and lacks an end-to-end integrated model. Based on this, this study designed a broadband magnetotelluric control system based on an IoT cloud platform. In this system, instruments interact with the cloud platform in real time, and users interact through a web interface, enabling the monitoring of instrument status through various devices.

2. Overall Design

2.1. Method

The geomagnetic method is a geophysical exploration method based on natural electromagnetic fields; it is mainly used to detect the electrical structure of underground media. Its basic principle can be summarized as using the spatial and temporal variations of the natural electromagnetic field outside the earth, and inverting the electrical characteristics of the underground medium through the electromagnetic field signals observed at the surface.
The electromagnetic wave generated by the natural electromagnetic field can be assumed to be a plane wave incident vertically, and according to Maxwell’s system of equations, the propagation equation of the alternating electromagnetic field can be expressed as
× E = B t ,
× H = J + D t ,
· B = 0 ,
· D = q ,
where is the Hamiltonian operator, E is the electric field strength, H is the magnetic field strength, B is the magnetic induction strength, D is the electric flux density, J is the current density, and q is the free charge density.
Assuming that both the electric field strength and the magnetic field strength are harmonic fields, In the free space of vacuum, we can obtain
× E = i ω μ H ,
× H = σ E ,
· E = 0 ,
· H = 0 ,
Due to the orthogonality of the electromagnetic field, the following relationship exists for the electromagnetic field components in a symmetric non-isotropic medium:
E x = Z x x H x + Z x y H y ,
E y = Z y x H x + Z y y H y ,
where E x , E y , H x , and H y are the Fourier transforms of the acquisition timing. When the measurement axis is coincident with the electrical spindle, Z x x = Z y y = 0 , from which it follows that
Z x y = E x H y = i ω μ ρ x y ,
Z x y = E y H x = i ω μ ρ y x ,
This leads to a relationship between the dielectric apparent resistivity ρ and the phase φ with the ground wave impedance Z :
ρ x y = 1 ω μ z x y 2 = 1 5 f z x y 2 ,
ρ y x = 1 ω μ z y x 2 = 1 5 f z y x 2 ,
φ x y = 180 π a r c t a n Z x y I Z x y R ,
φ y x = 180 π a r c t a n Z y x I Z y x R

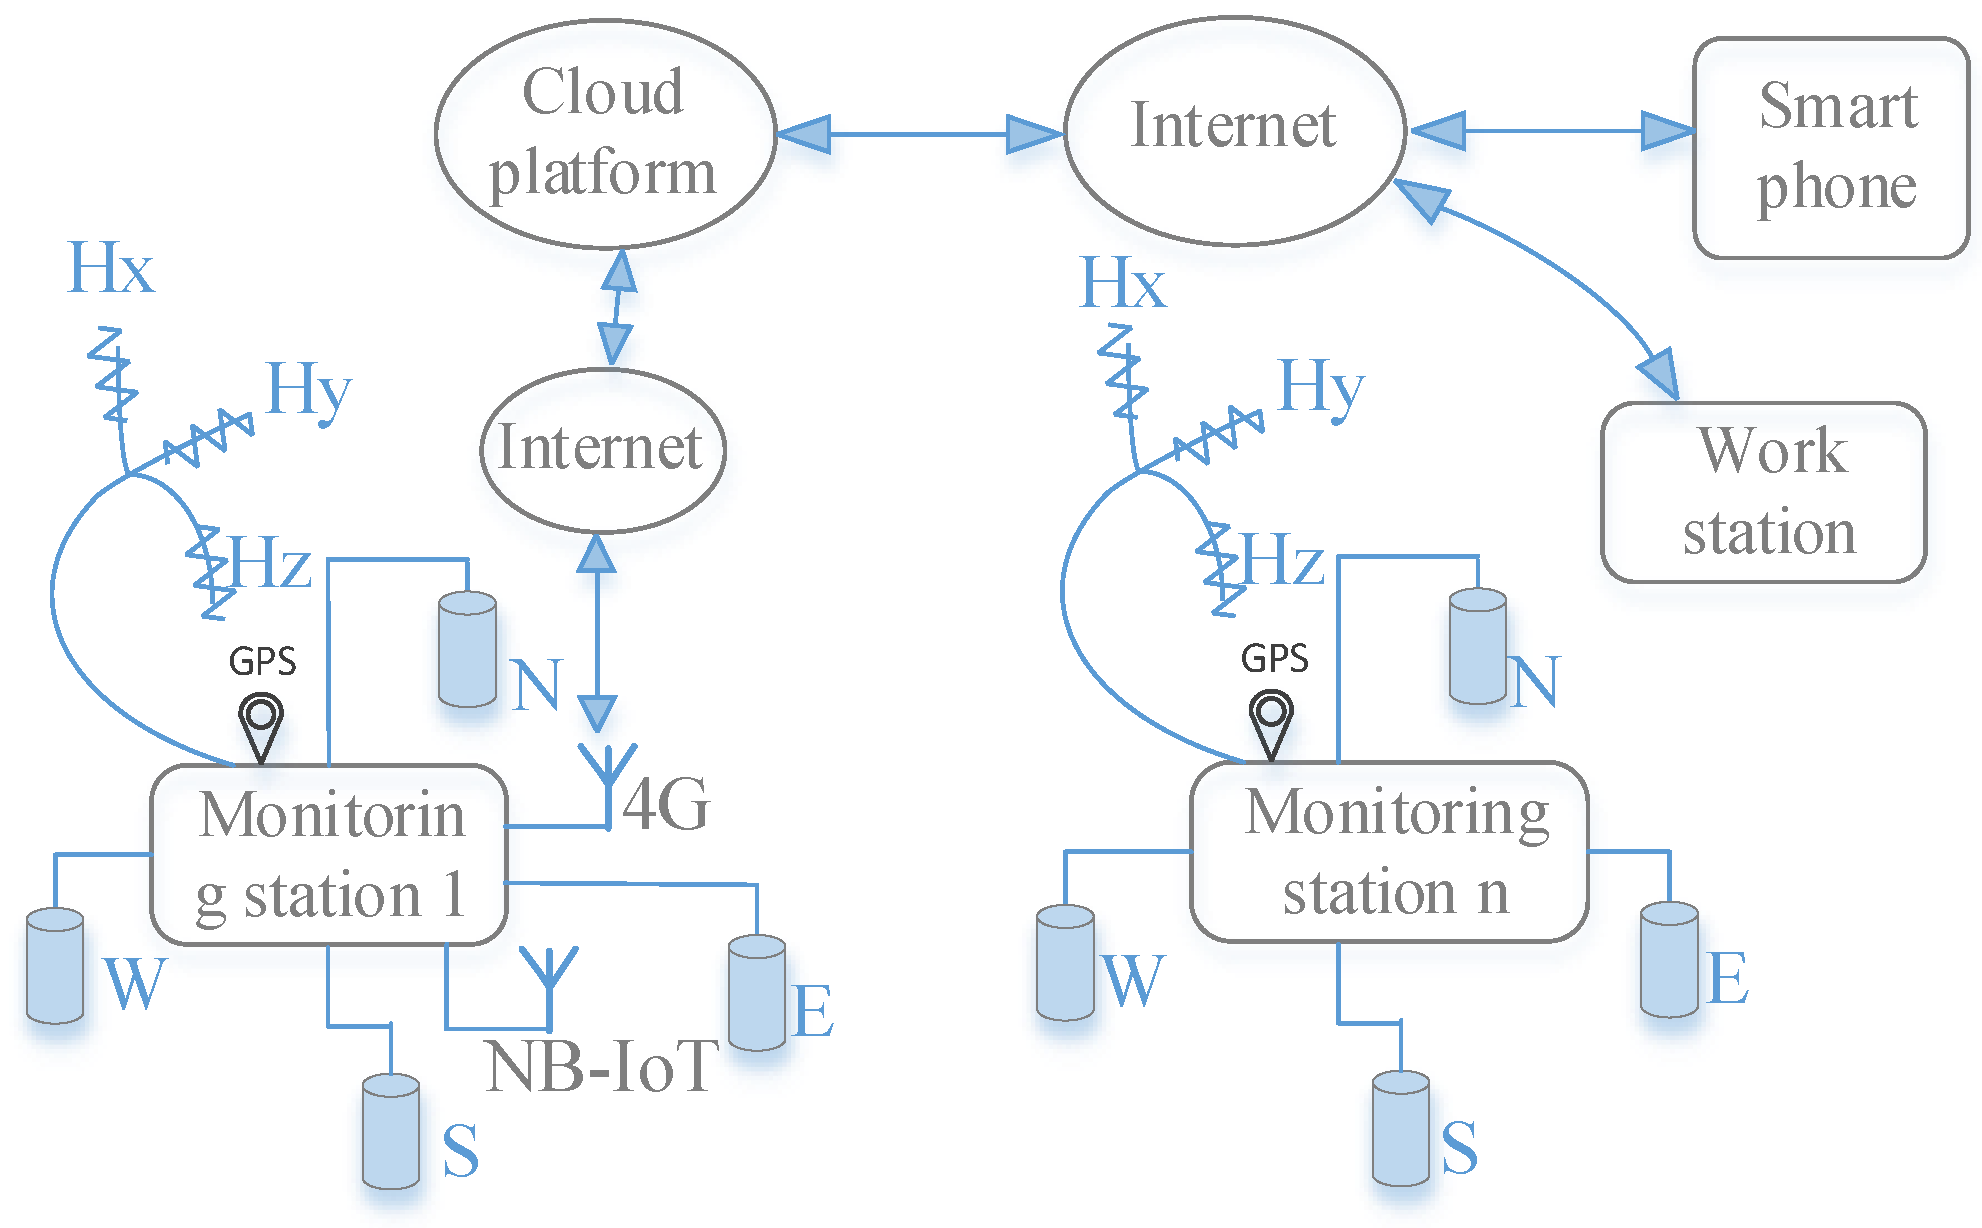
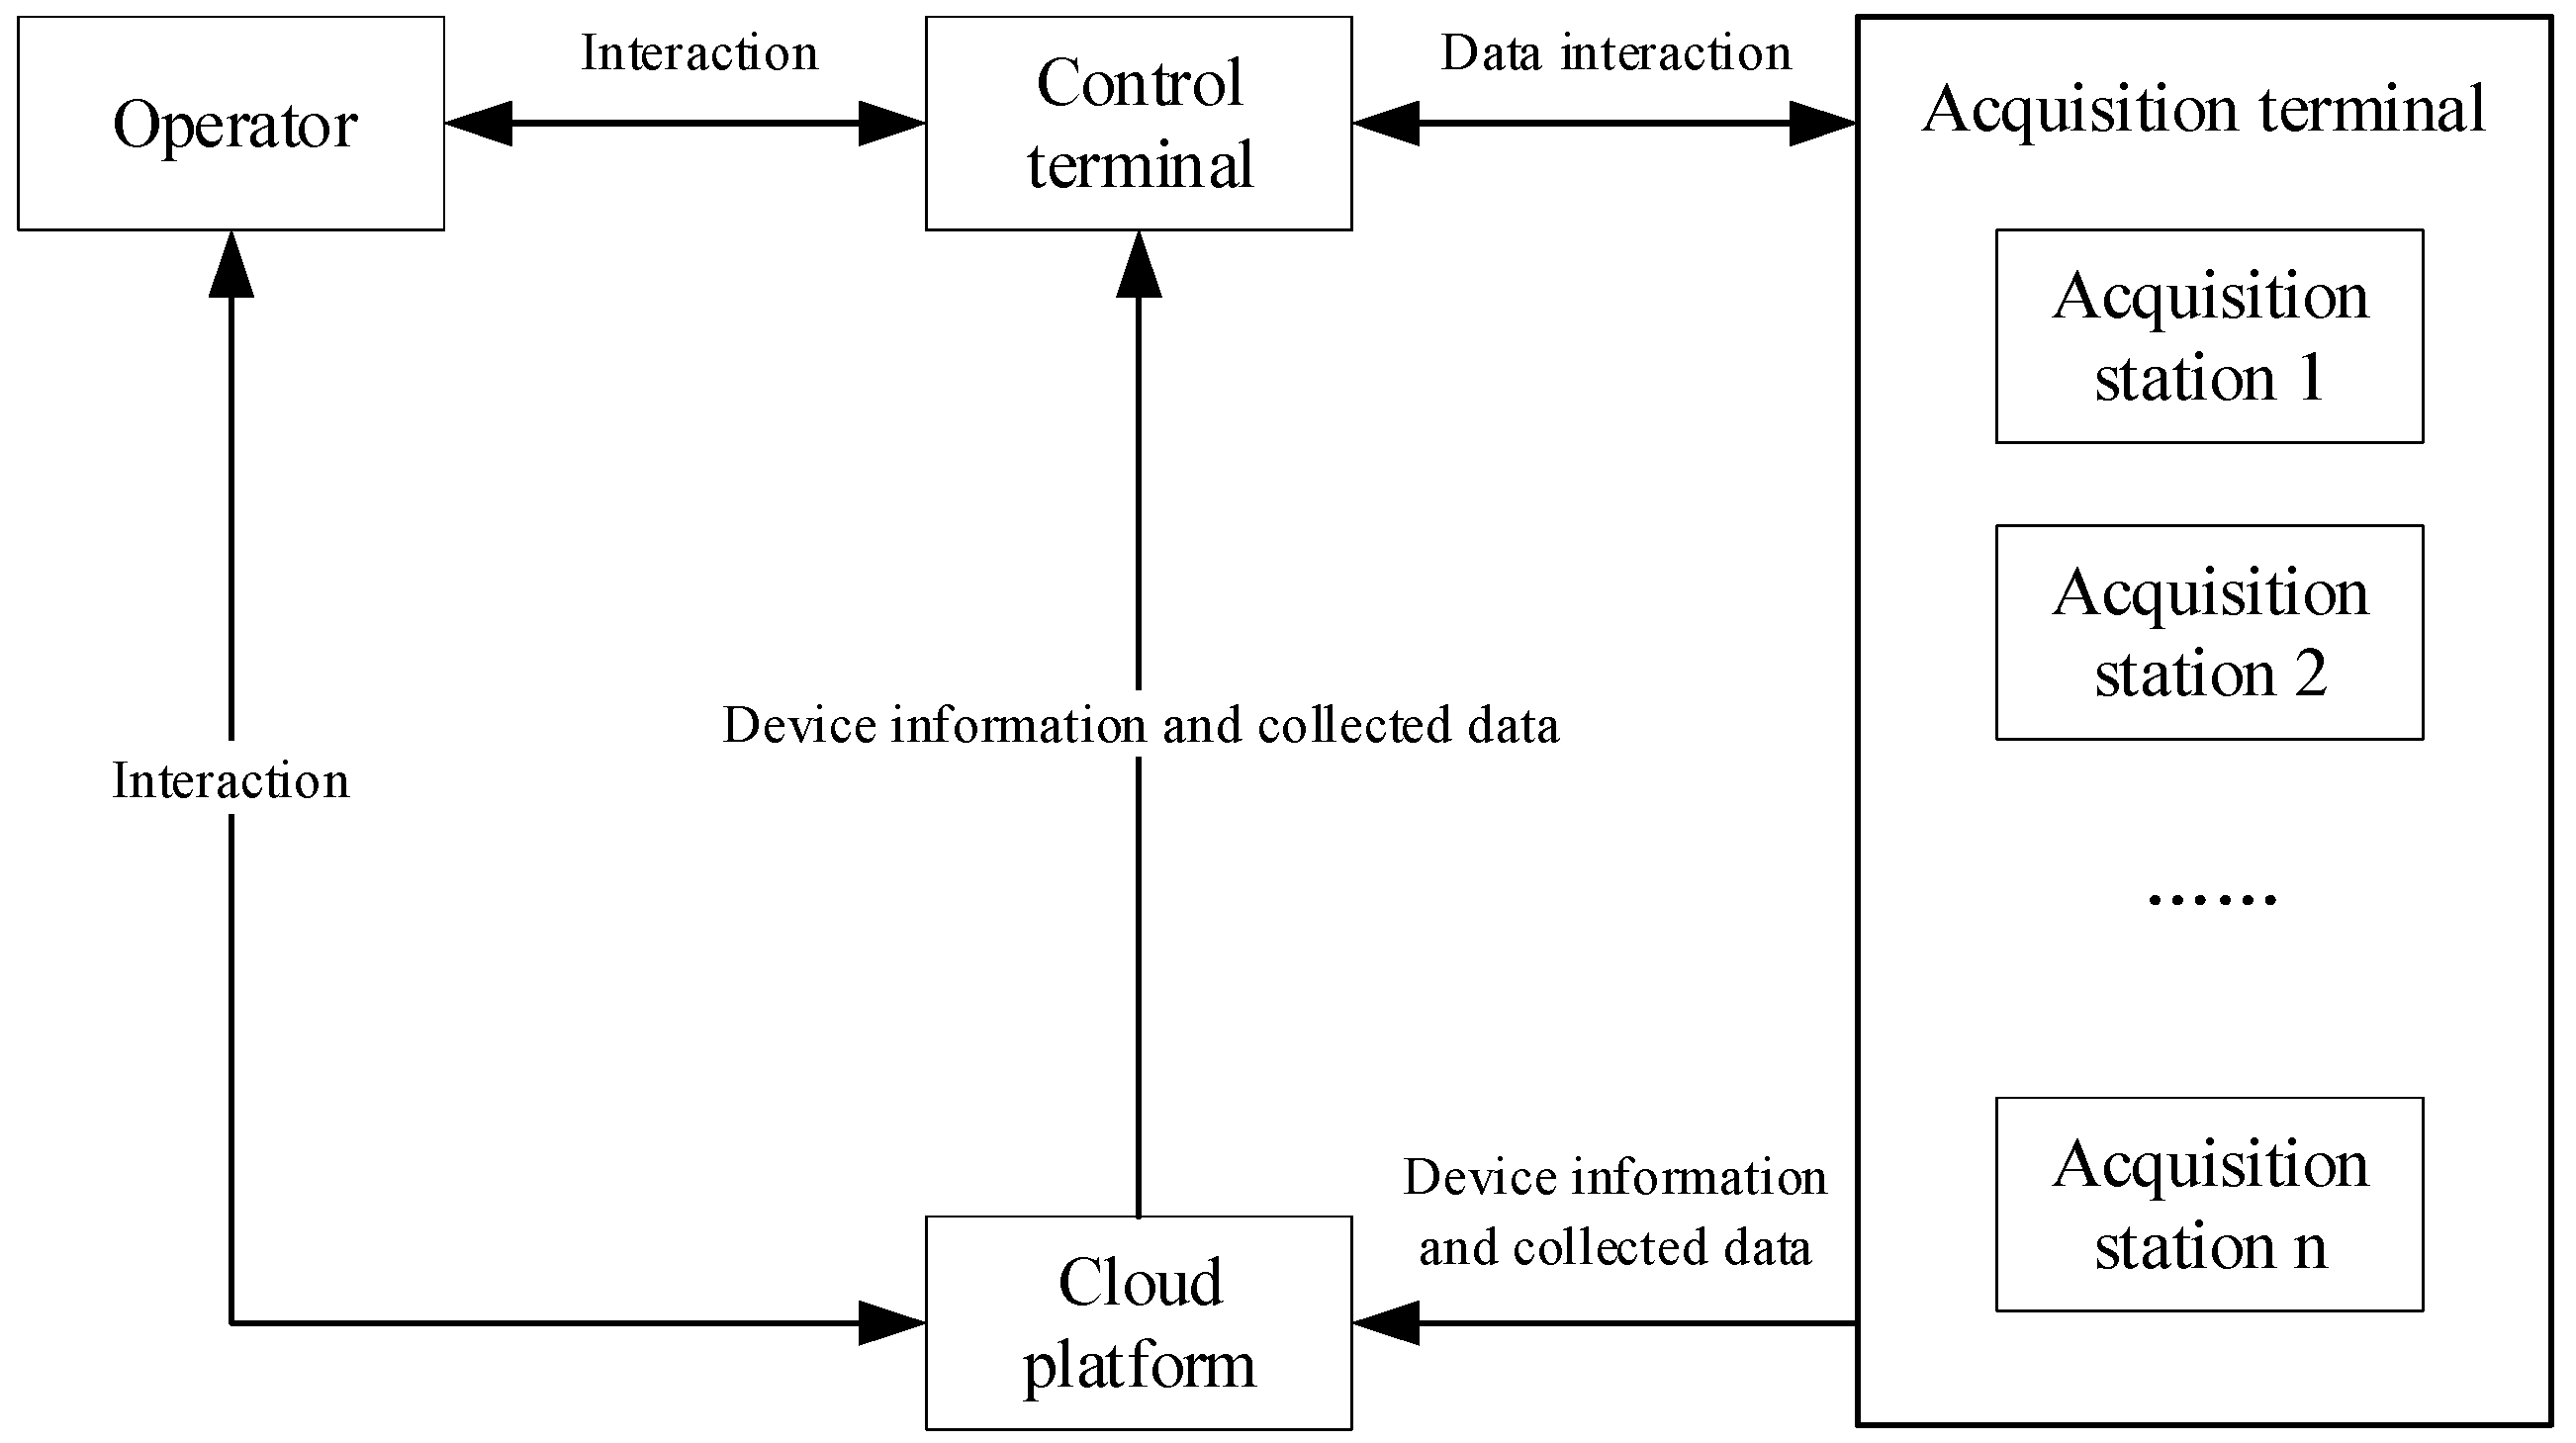
2.2. System Overview

As shown in Figure 1, the project designed an magnetotelluric signal acquisition and monitoring system based on an IoT cloud platform, connecting magnetotelluric monitoring stations, control terminals, and cloud servers via 4G/5G networks to achieve a real-time and efficient monitoring system.
The interaction process between different roles in the IoT cloud platform monitoring system is shown in Figure 2. Operators can directly interact with the control terminal, sending control commands to the acquisition station through the control terminal. The acquisition station executes the corresponding operations and returns the results to the control terminal, which displays the results in real time on the interface. Operators can also interact directly with the cloud platform, viewing online device information and downloading data files uploaded by the acquisition station. Currently, we use a test server that can host up to 50 simultaneous instrument connections. In the future, we plan to expand the server to accommodate more instrument connections.

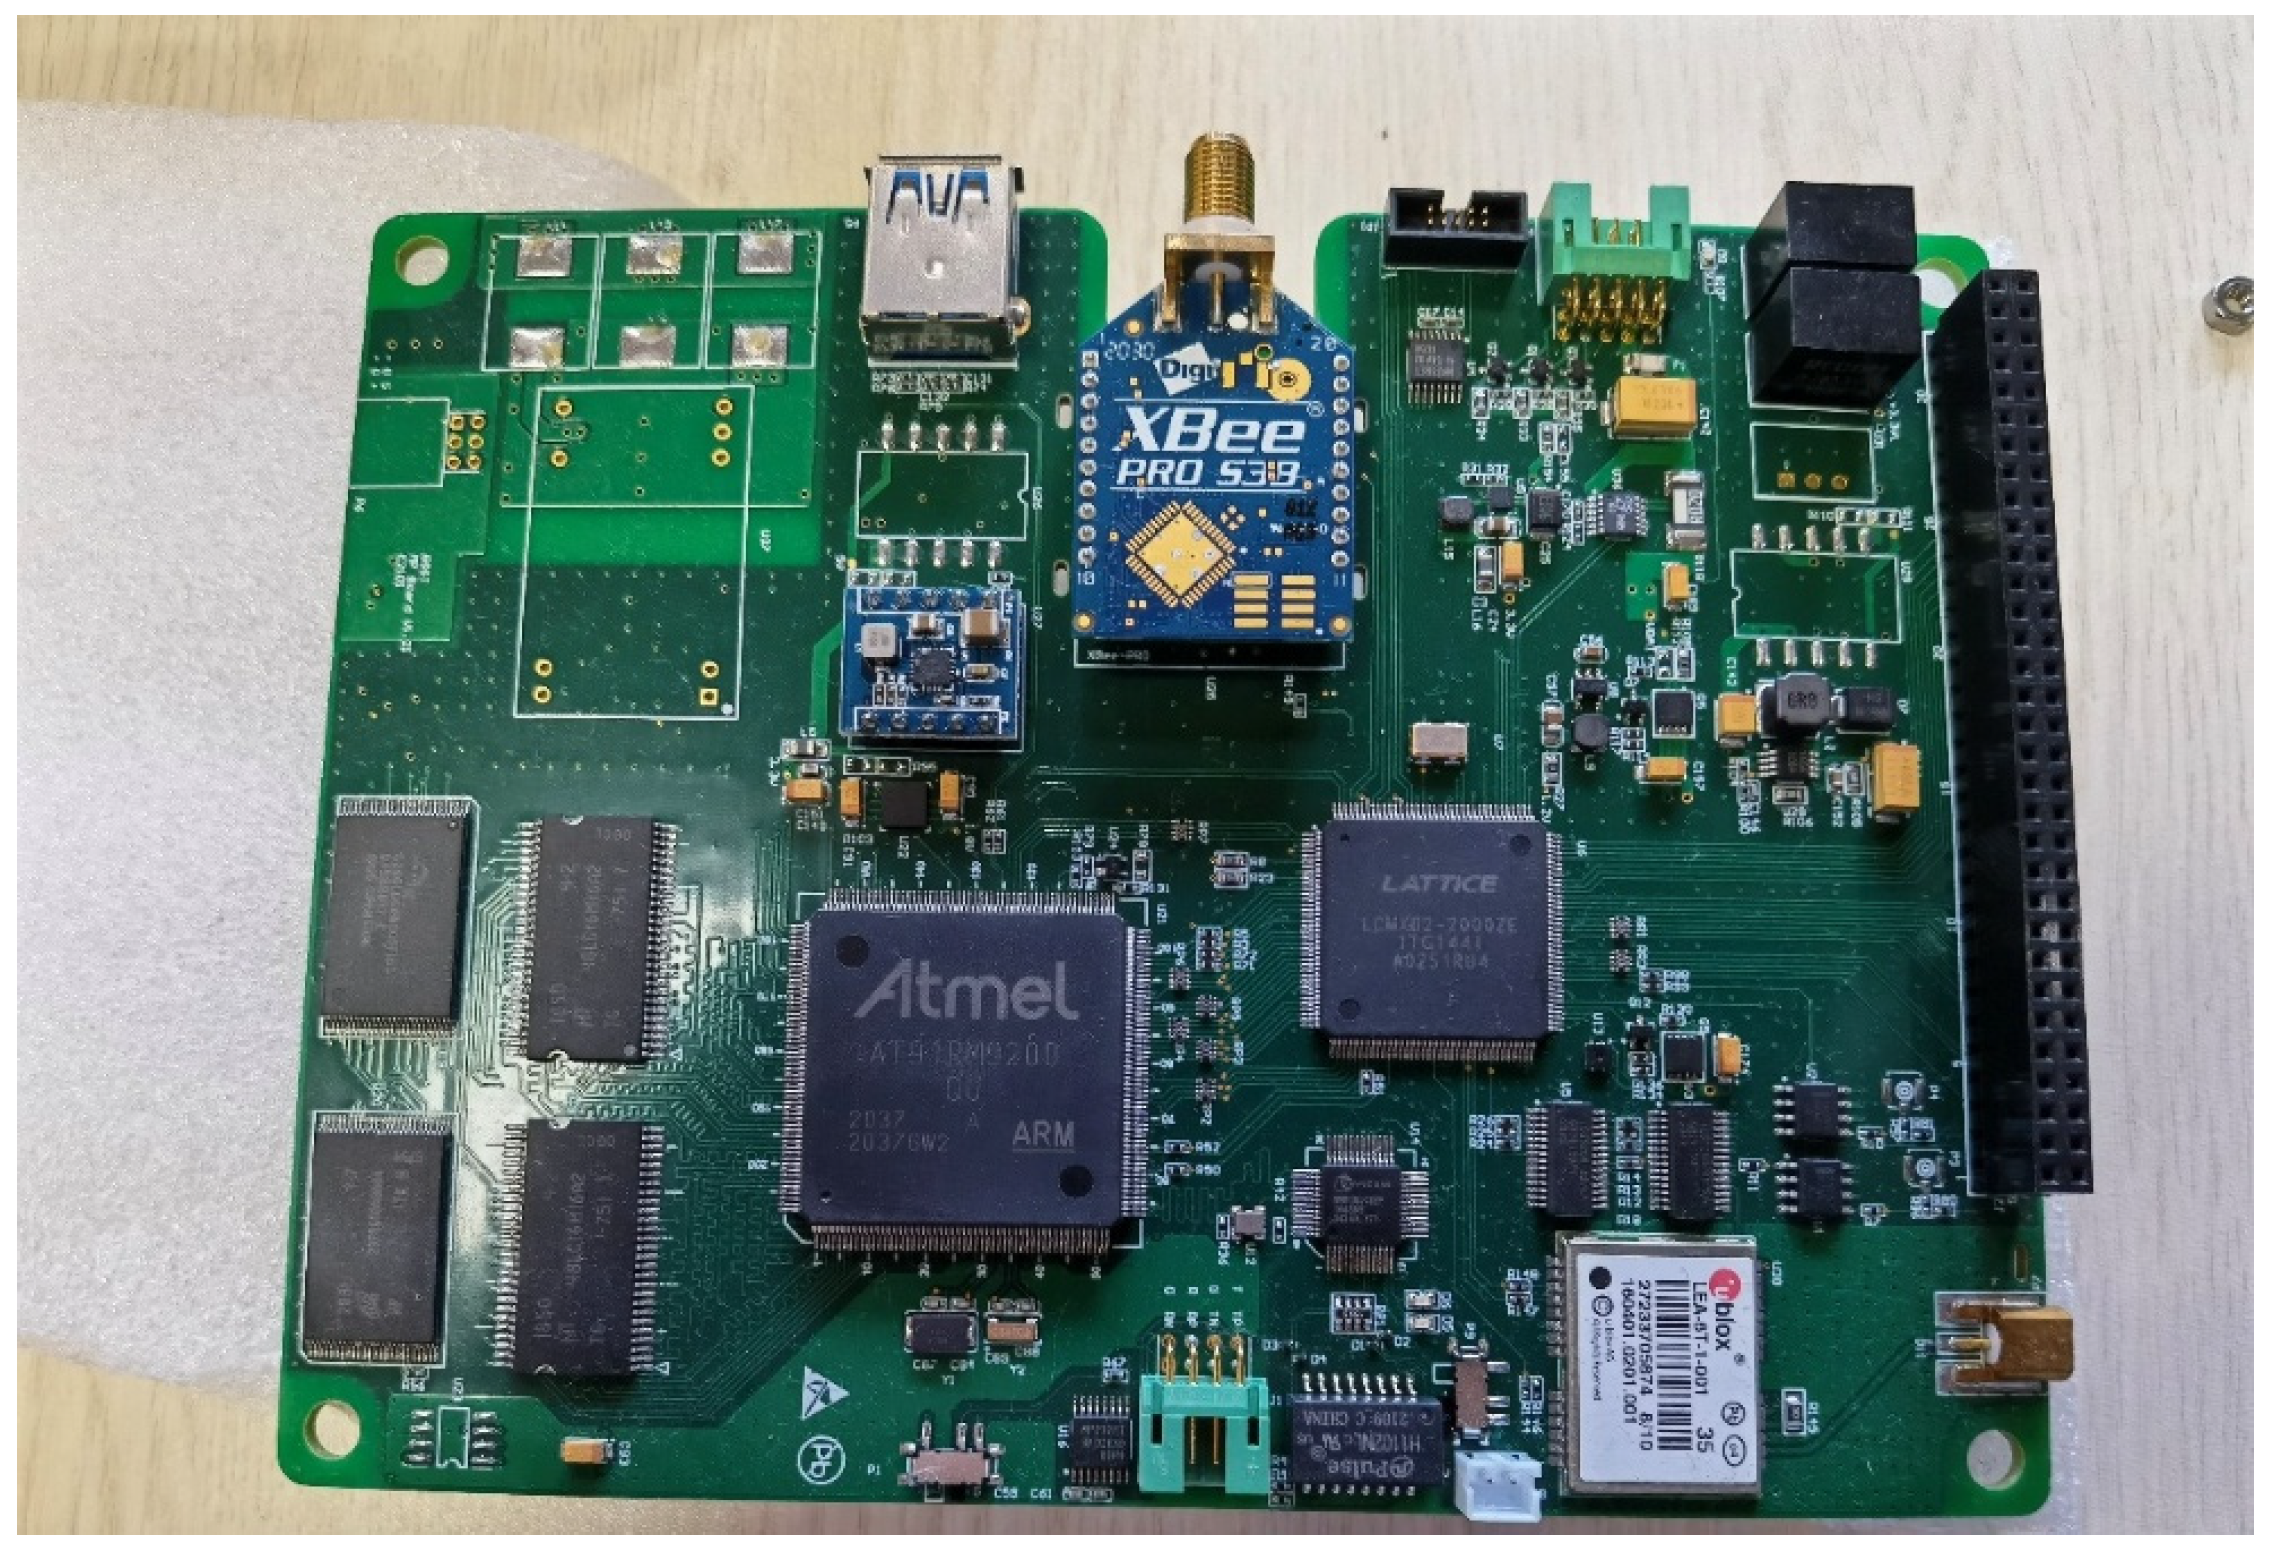
3. Development of the Magnetotelluric Monitoring Receiver

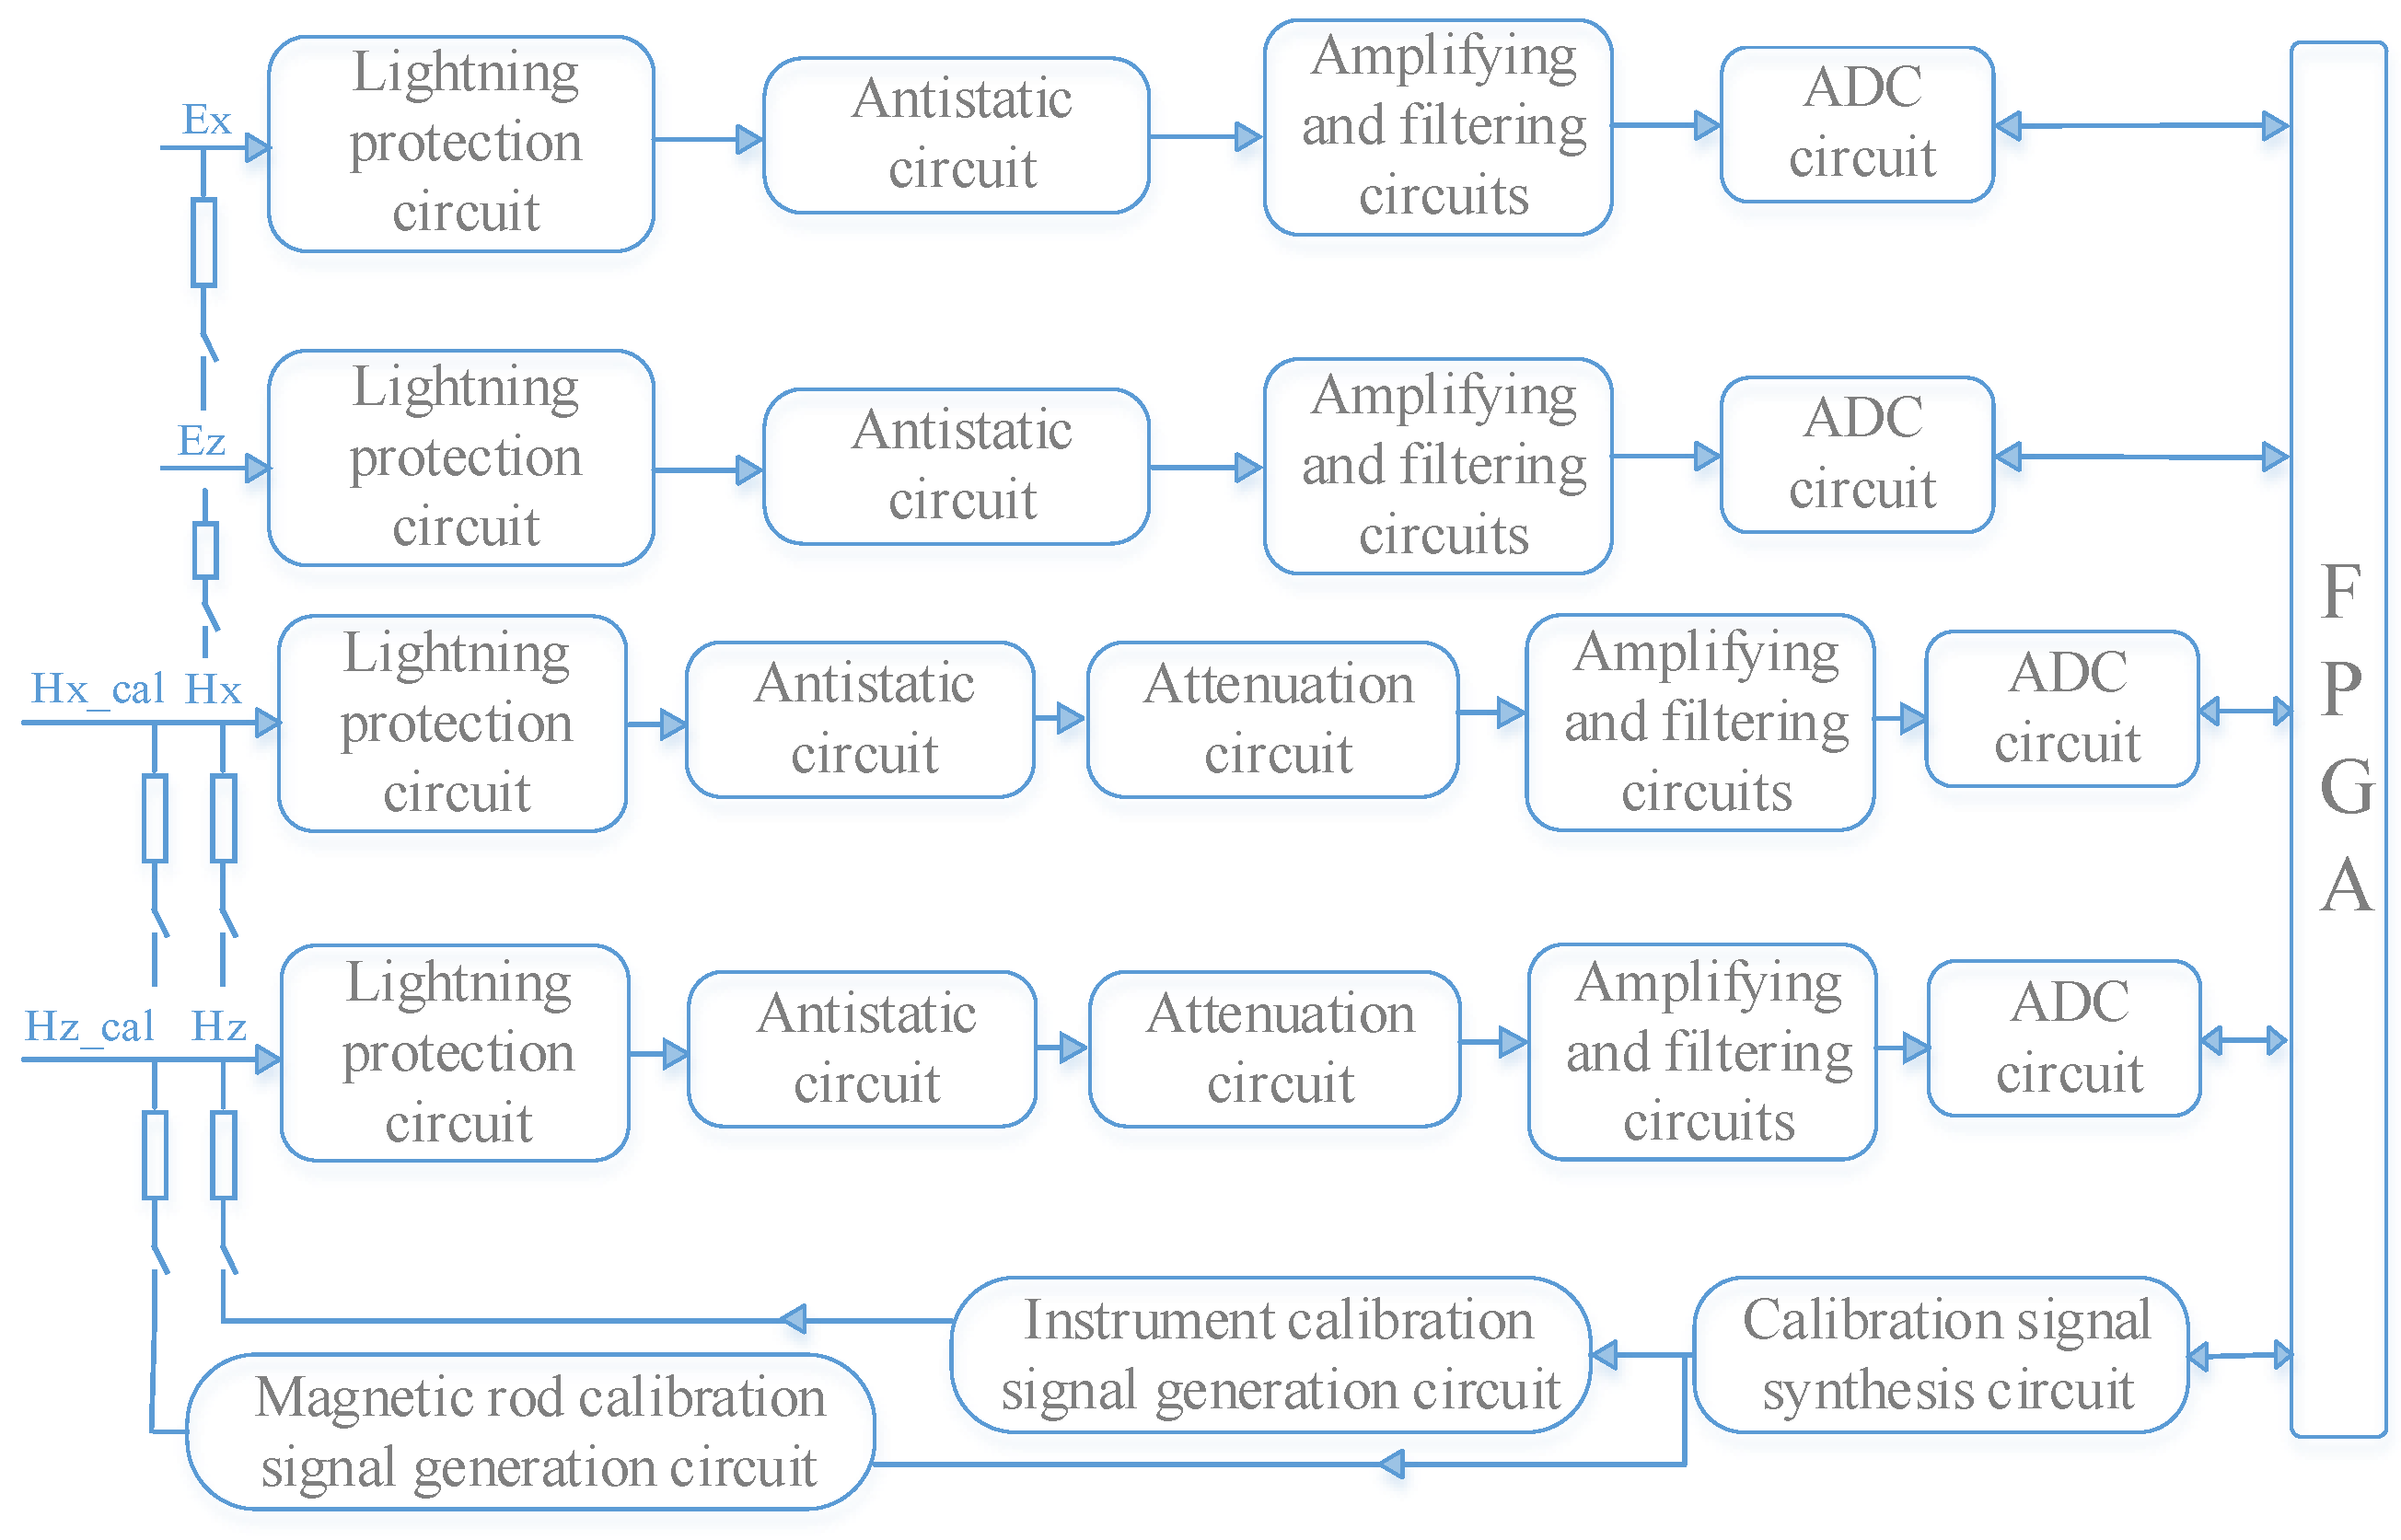
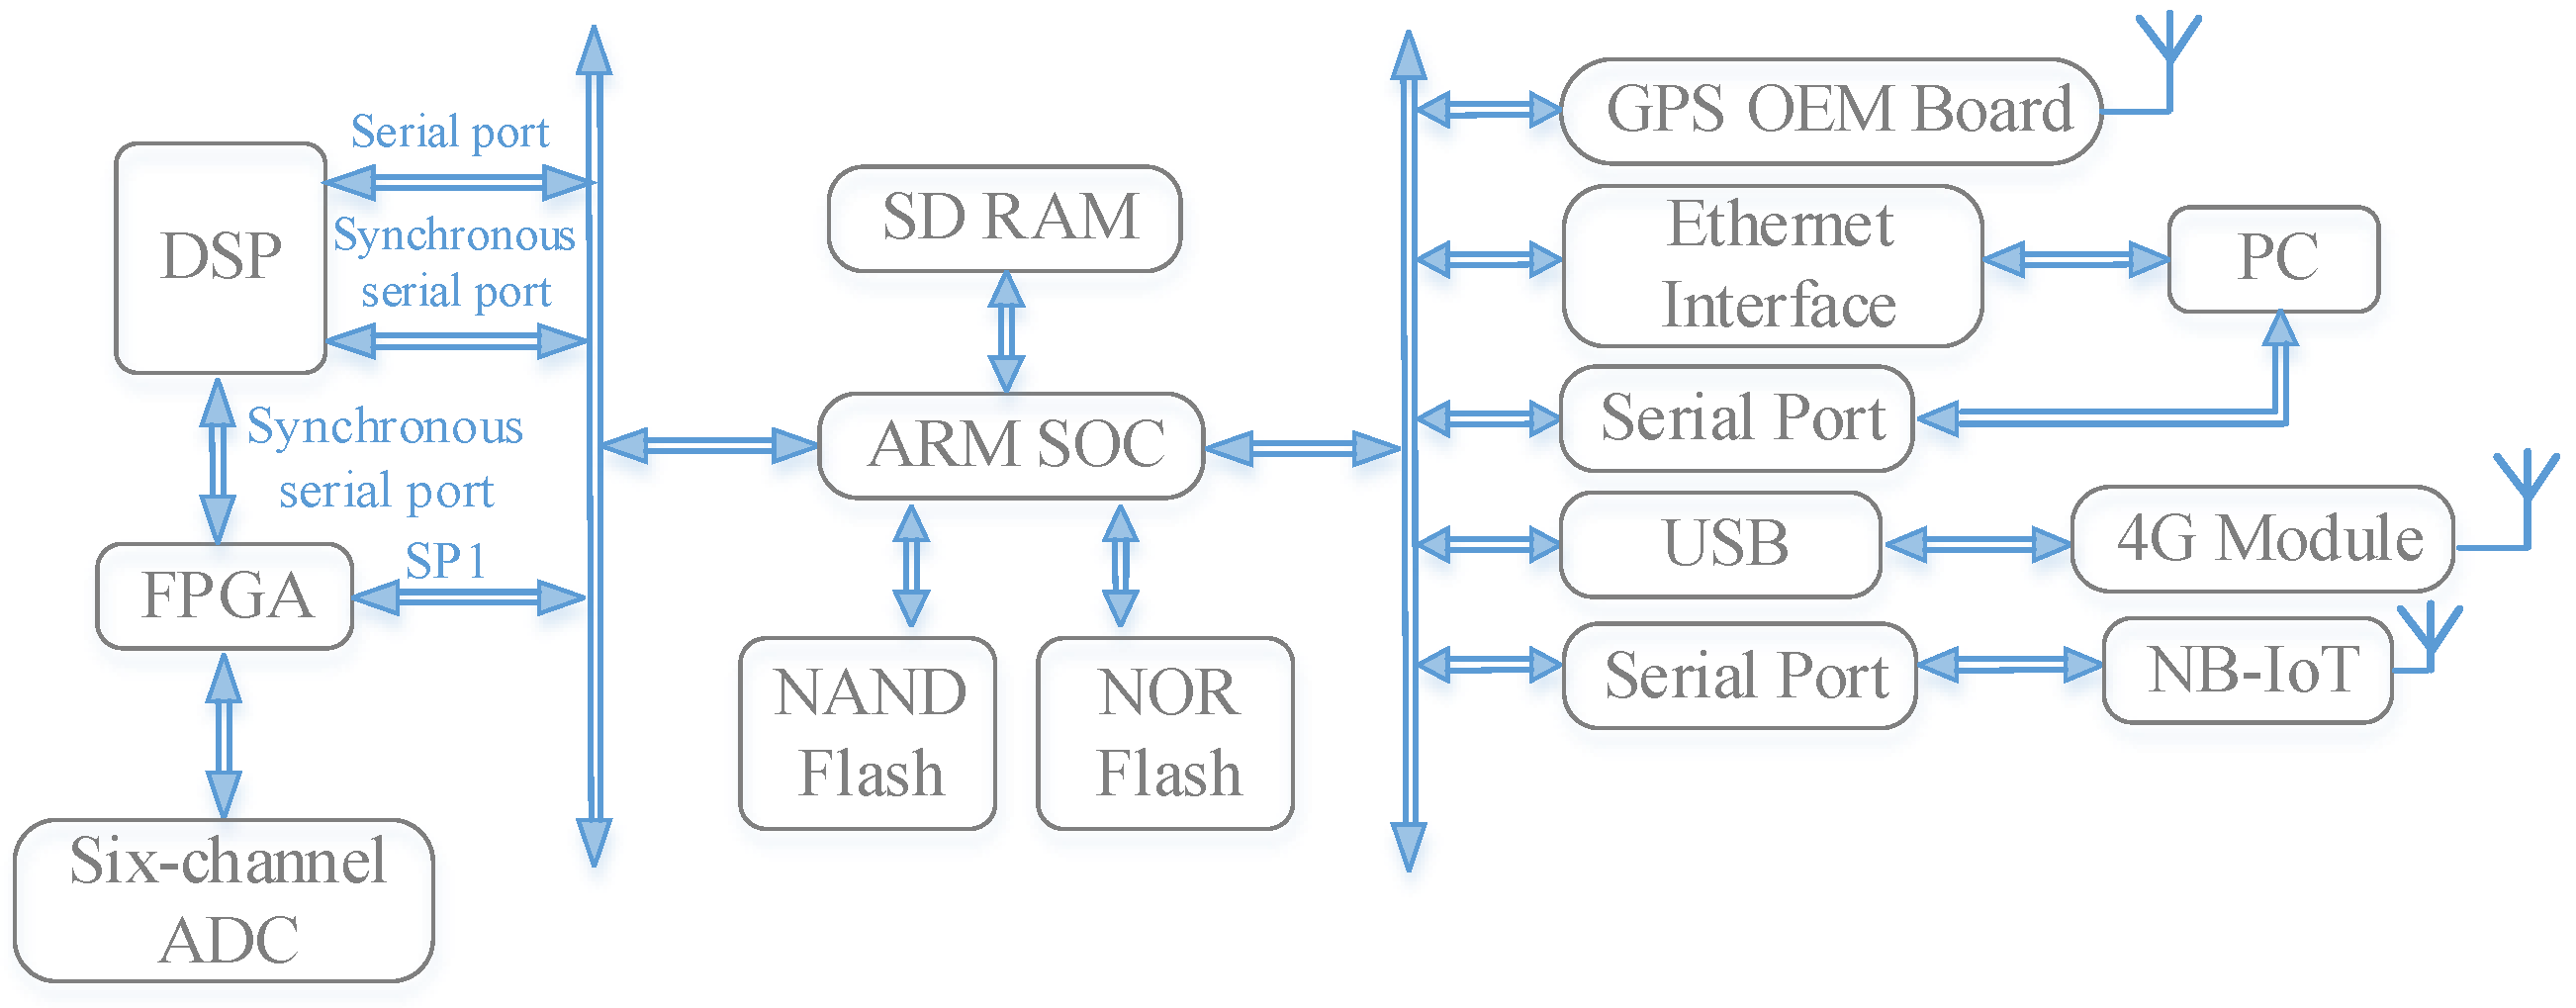
3.1. Hardware Circuit Design

As shown in Figure 3, the magnetotelluric monitoring receiver consists of amplification and filtering circuits, an FPGA (Field Programmable Gate Array) control system, a DSP (Digital Signal Processing) system, and an embedded control system. Five channels of potential difference signals are amplified differentially and then fed into an ADC (Analog to Digital Converter). The entire analog to digital conversion and data transmission processes are controlled by the FPGA, which then sends the data to the DSP for processing, including sampling, notch filtering, low-pass filtering, and high-pass filtering. Finally, the DSP sends the processed data in three frequency bands to the embedded system for storage. The embedded system has both wired and wireless networking capabilities, allowing it to receive control signals from an upper computer to control the entire acquisition process while saving the acquired waveform data on flash memory.
To ensure the reliability of the acquisition system, several additional functions were incorporated. First, lightning protection and electrostatic discharge protection circuits were added, as shown in Figure 4, ensuring that the internal circuits of the measurement system can continue to operate during a lightning strike. Second, various test circuits were included, such as ADC test circuits, amplification and filter test circuits, and ground resistance test circuits. The entire test circuit is controlled by the FPGA, which generates the required test signals via a DAC (Digital to Analog Converter).
In the magnetotelluric monitoring receiver, the embedded system is at the core, as shown in Figure 5. It controls the DSP for magnetotelluric signal data processing and the FPGA for data acquisition. It also receives control signals from the upper computer, ensuring that the measurement system operates with the set parameters. The core of the embedded system is an ARM SoC (Advanced RISC Machines System on a Chip), SDRAM (Synchronous Dynamic Random-Access Memory), NAND flash, and NOR flash. The SoC has more functions than a CPU, with NAND flash used for storing measurement waveforms and NOR flash for storing programs. The SoC controls the FPGA via an SPI interface and communicates with the DSP via serial and synchronous serial interfaces. Using the SoC’s rich interface resources, the ARM can connect to a GPS OEM board for timing and navigation information, a 4G/5G module for wireless networking, and an Ethernet interface chip for communication with a PC. The serial port can be used for debugging the embedded system, and the USB interface can be used for expanding storage or WiFi communication. The PC can communicate with the embedded system via WiFi, Ethernet, or serial ports, meeting the needs for debugging, development, and remote control.
Based on system functionality and stability requirements, the magnetotelluric monitoring receiver was ultimately divided into two circuit boards: one responsible for magnetotelluric signal conditioning and ADC and DSP processing (see Figure 6), and the other for the embedded subsystem (see Figure 7), including the ARM SoC, FPGA, ZigBee Pro module, GPS module, memory, and flash. Both circuit boards were custom-designed for this system, achieving optimal coupling between the embedded system and the acquisition system.
This study used an external IoT module, connected directly to the acquisition station via an Ethernet port, and accessed nearby telecom base stations wirelessly to communicate with the cloud platform. The module selected was the F-NR130 from Four-Faith Communication Technology Co., Ltd. (Xiamen, China), which uses public 3G/4G/5G networks to provide users with long-distance wireless data transmission. The product uses a high-performance industrial-grade 32-bit communication processor and industrial-grade wireless modules, supported by an embedded real-time operating system. It also provides one RS232, one RS485, one Ethernet LAN, and one Ethernet WAN (which can be reused as a LAN port), allowing the simultaneous connection of serial and Ethernet devices for transparent data transmission and routing functions. The IoT module’s network configuration page is shown in Figure 8.

3.2. Acquisition Software Development

The acquisition software adopts a layered structure design, enabling plug-and-play management of business modules to enhance the system’s robustness, scalability, and maintainability. The overall structural design is shown in Figure 9.
The calling layer is the interface between Linux and the software. The CLI service thread in this layer listens to input from the Linux shell terminal after the acquisition software starts. When command characters are input, the CLI service thread converts them into corresponding commands and sends them to the command protocol layer for processing.
The business layer includes the command protocol layer, status monitoring layer, task execution layer, CLI execution layer, and control logic layer. The command protocol layer, similar to the control software’s command protocol layer, mainly implements the encapsulation, sending, receiving, and parsing of command data packets, providing a checksum mechanism to verify the integrity of data packets. The status monitoring layer is responsible for reading the basic status of the hardware layer in real time and updating the corresponding status parameters in the software, such as the GPS lock status, battery voltage, temperature, humidity, and disk space. The task execution layer is responsible for parsing commands from the command protocol layer or CLI execution layer into multiple steps and executing them sequentially or conditionally. The CLI execution layer is responsible for executing single commands from the command protocol layer or forwarding commands to the task execution layer after execution. The control logic layer is responsible for converting single-step operations from the upper layer into operation codes recognizable by the underlying hardware and controlling the hardware to execute the corresponding actions.
The hardware layer includes hardware control interfaces, communication modules, analog boards, GPS boards, and power boards. The hardware control interface layer is the interaction layer between the underlying hardware and upper applications, encapsulating the functions of the underlying hardware into unified interfaces for upper applications to call. This approach shields the differences in underlying hardware details, facilitating module expansion. The communication module, consistent with the control software’s communication module, is responsible for reliable communication between the control software and the acquisition software. The analog board, GPS board, and power board are the basic circuit modules of the instrument, with the analog board mainly implementing analog-to-digital conversion, the GPS board providing positioning and synchronization, and the power board handling voltage conversion.

4. Development of Terminal Control Software

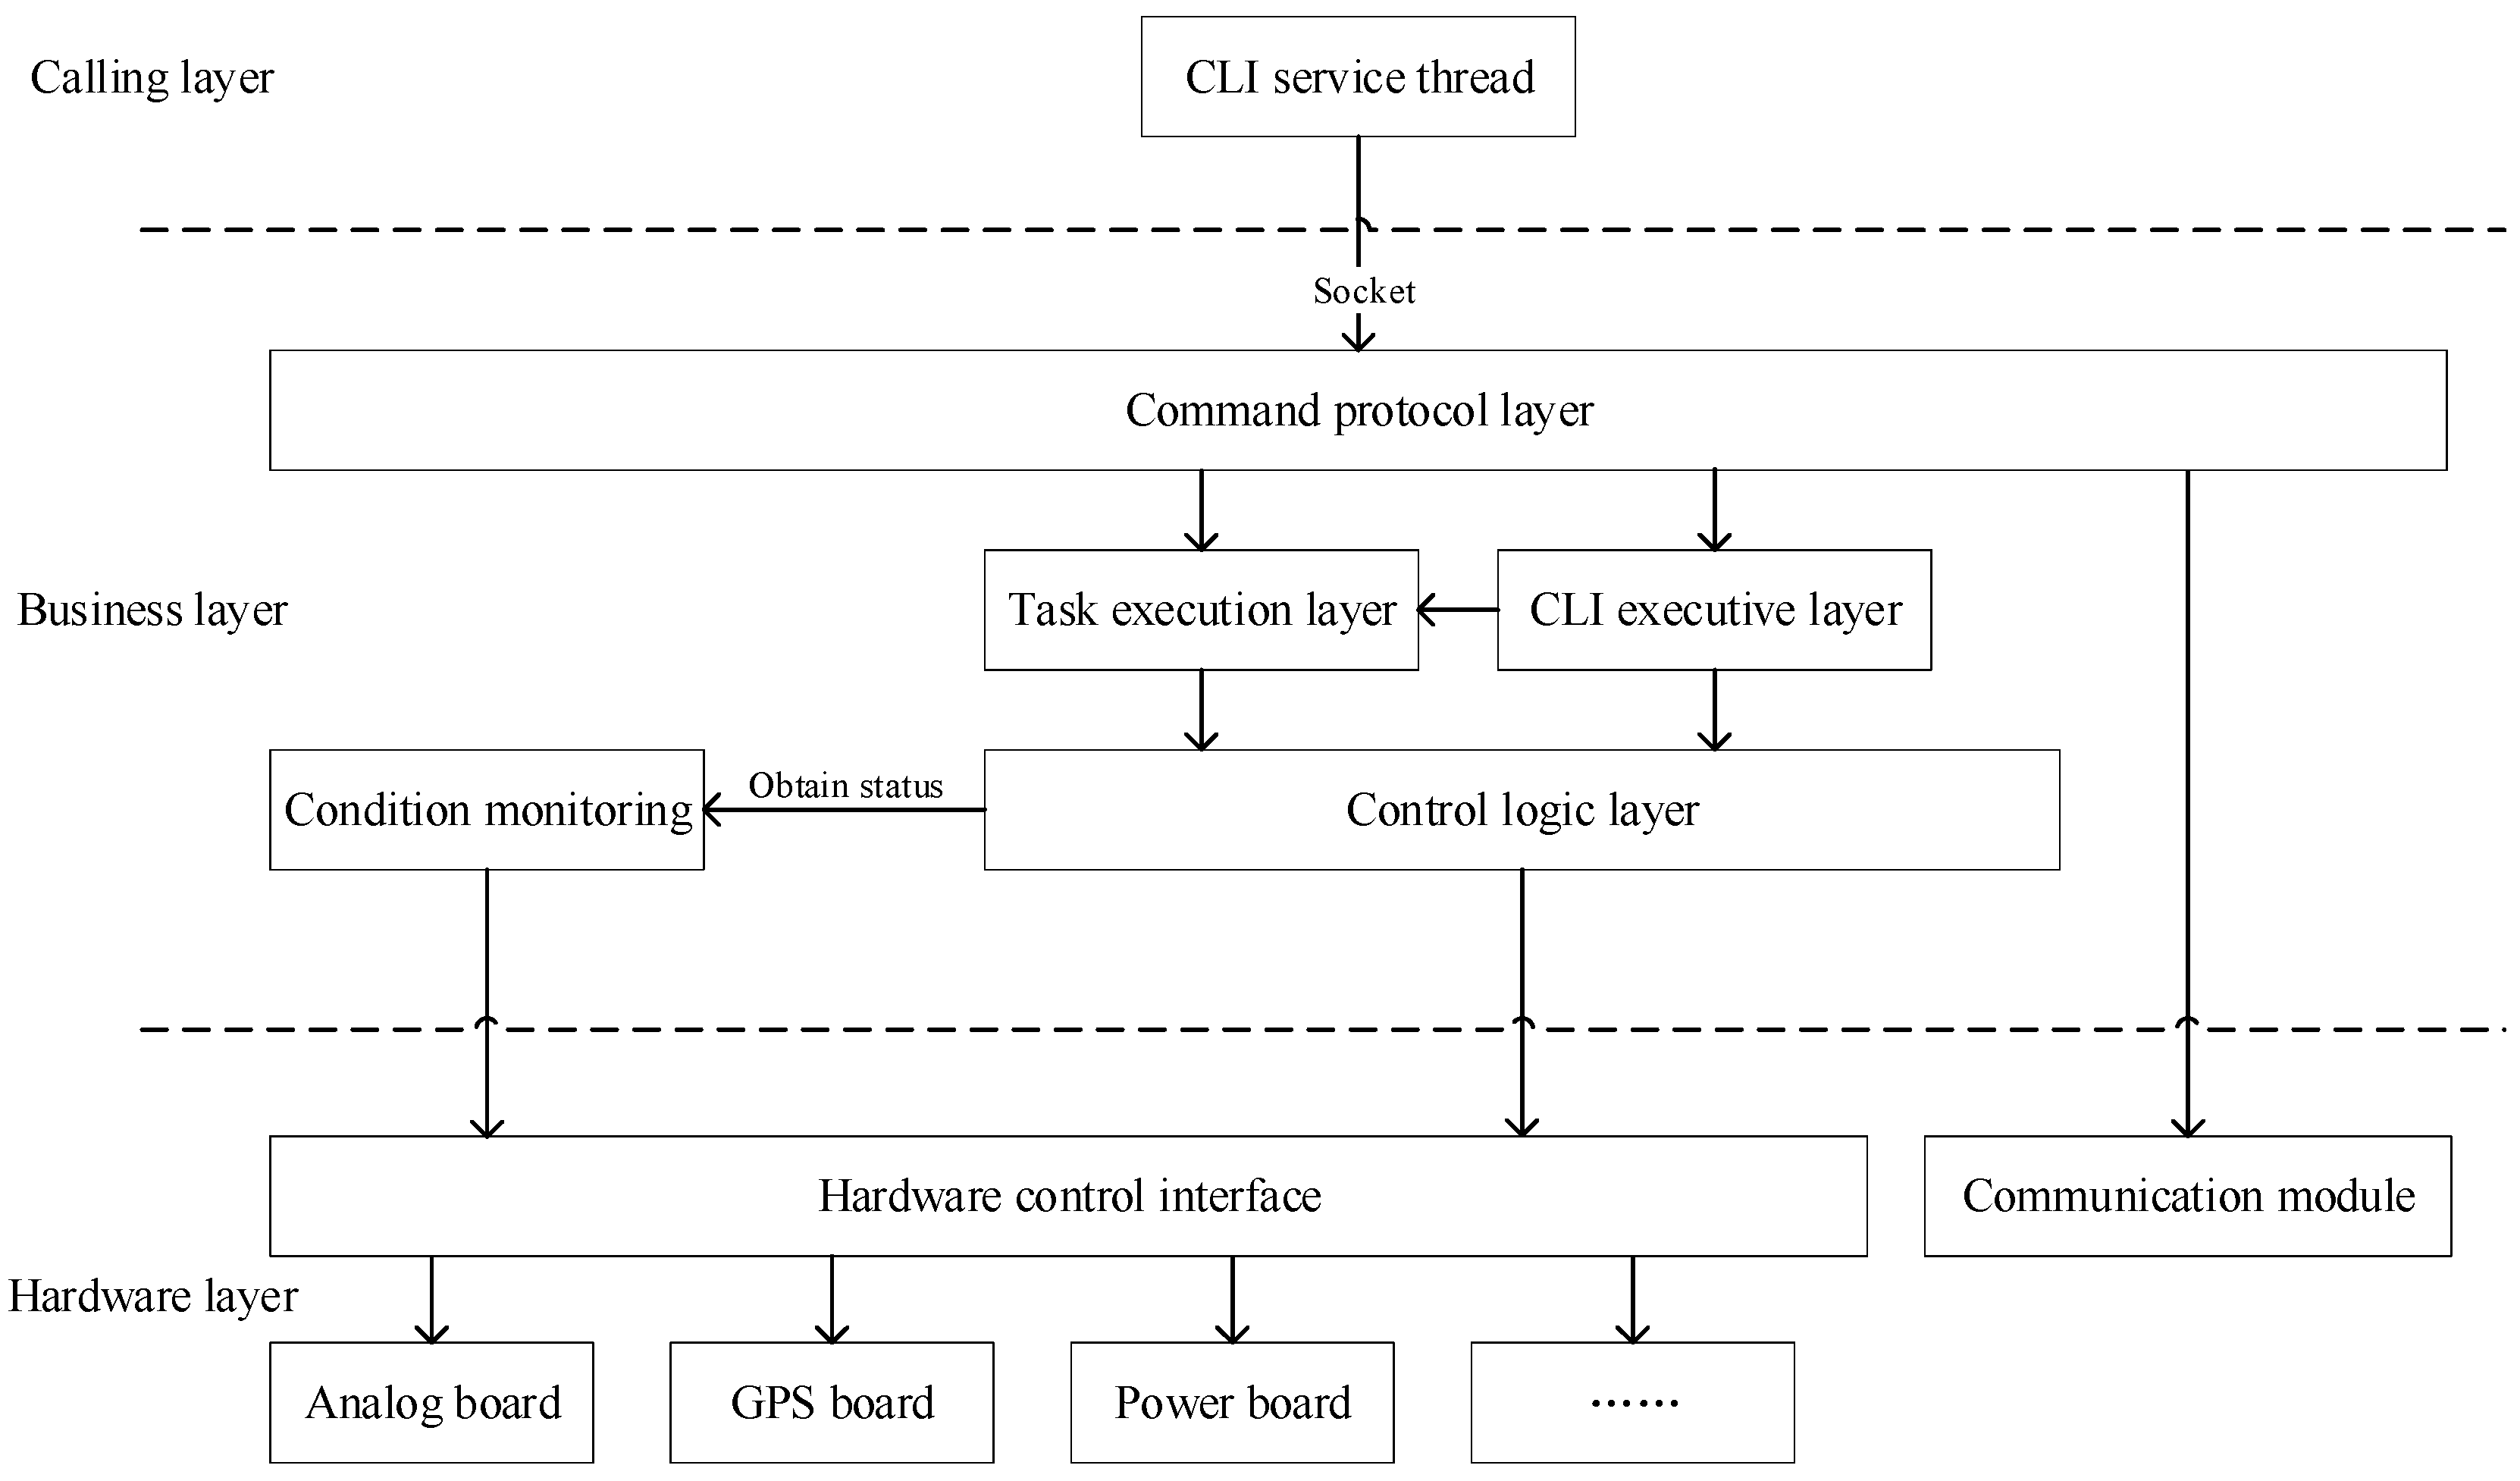
4.1. Functional Framework

The terminal control software is a platform running on a computer that directly interacts with users. It has a user-friendly interface and is mainly responsible for data acquisition, calculation, and display. It can also download data files from acquisition stations and the cloud platform, with its functions including acquisition control, status viewing, CLI command debugging, data downloading, timing monitoring, ground resistance measurements, and device calibration. The software’s main interface displays a list of online acquisition stations on the left, including station numbers, online status, acquisition mode, and acquisition status. The right side of the main interface displays major function buttons, including MT acquisition, file download, instrument information, CLI commands, and instrument configuration.
The control software adopts a layered structure design, enabling plug-and-play management of business modules to enhance the system’s robustness, scalability, and maintainability. The overall structural design is shown in Figure 10.
The presentation layer is the human–machine interface of the software, including MT interface, CSAMT interface, SIP interface, AMT interface, and a general interface. Each interface provides parameter input interfaces, data table display pages, and graphical display pages for the corresponding exploration methods. The general interface includes file transfer pages, instrument status viewing pages, and communication setting pages, which are common functions needed for various exploration methods.
The business layer is the main business logic layer of the software, which is further divided into an exploration business layer, task layer, and command protocol layer. The exploration business layer mainly includes the operational logic and algorithmic logic of the different exploration methods, with the general functions including CLI command modules, device status display modules, file download modules, timing monitoring modules, ground resistance measurement modules, instrument calibration modules, and magnetic rod calibration logic modules. The task layer mainly implements batch processing of upper-level instructions and responses to feedback instructions, with basic functions such as adding, deleting, inserting, clearing, timed detection, and timeout retransmission of instructions. The command protocol layer mainly implements the encapsulation, sending, receiving, and parsing of command data packets, providing a checksum mechanism to verify the integrity of data packets, but does not guarantee the reliable transmission of data packets.
The communication layer is mainly responsible for communication between the control software and the acquisition software. The communication module in this layer supports multiple underlying communication protocols, such as Zigbee, Ethernet, and WiFi. The communication module provides a unified calling interface for upper applications, shielding the differences in underlying communication protocols and facilitating future expansion of communication protocols.

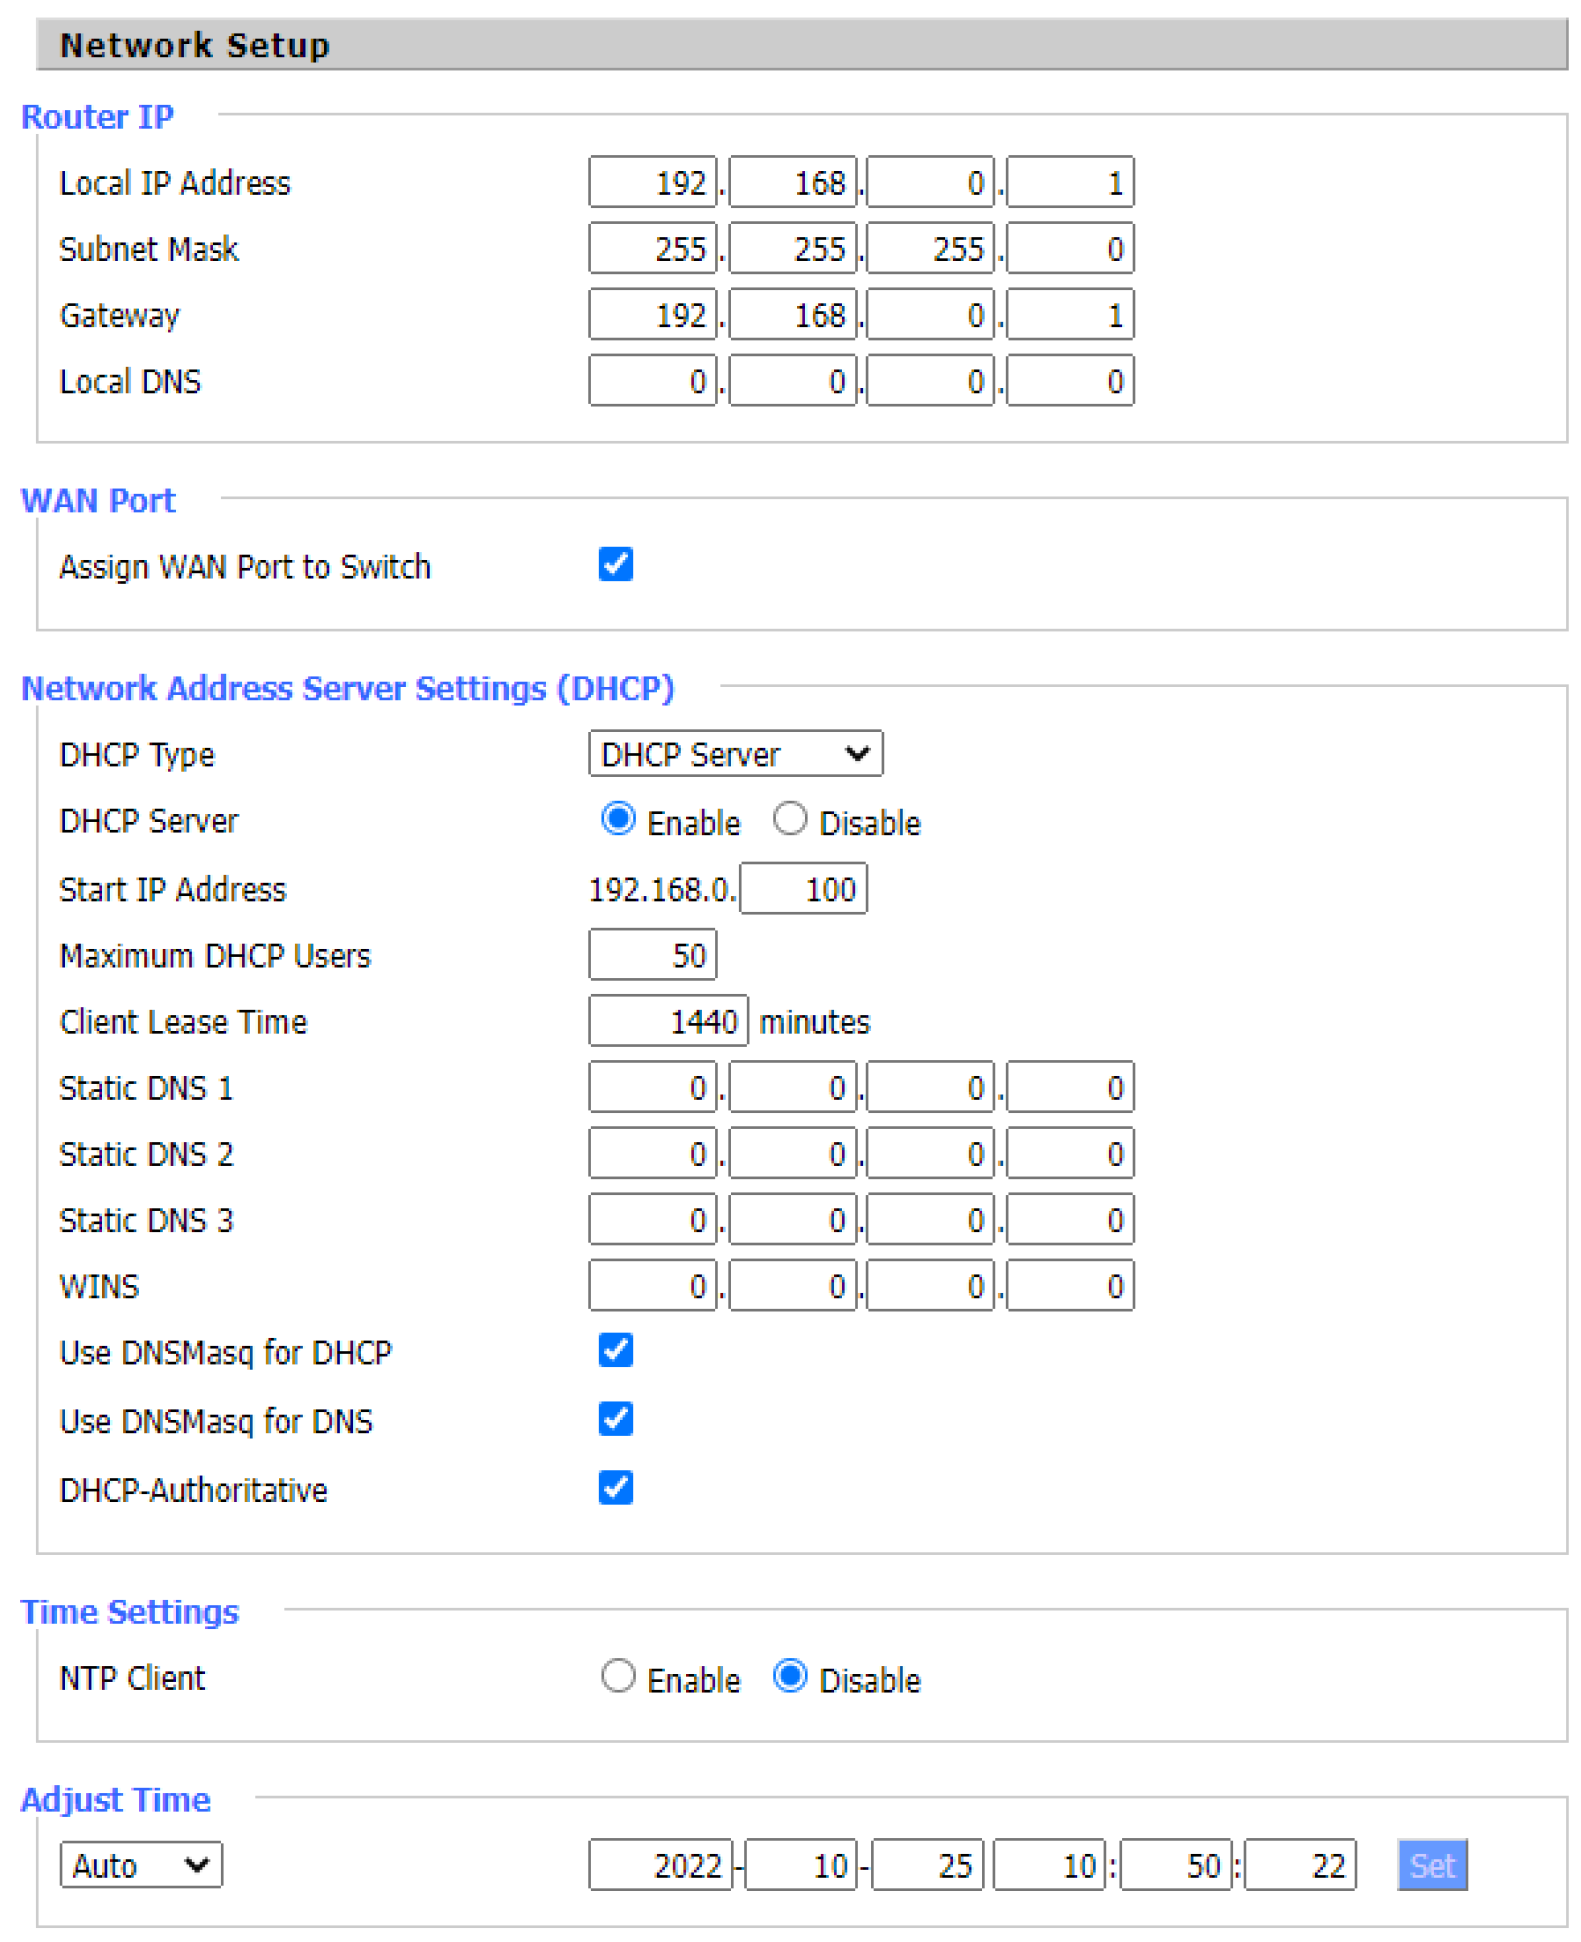
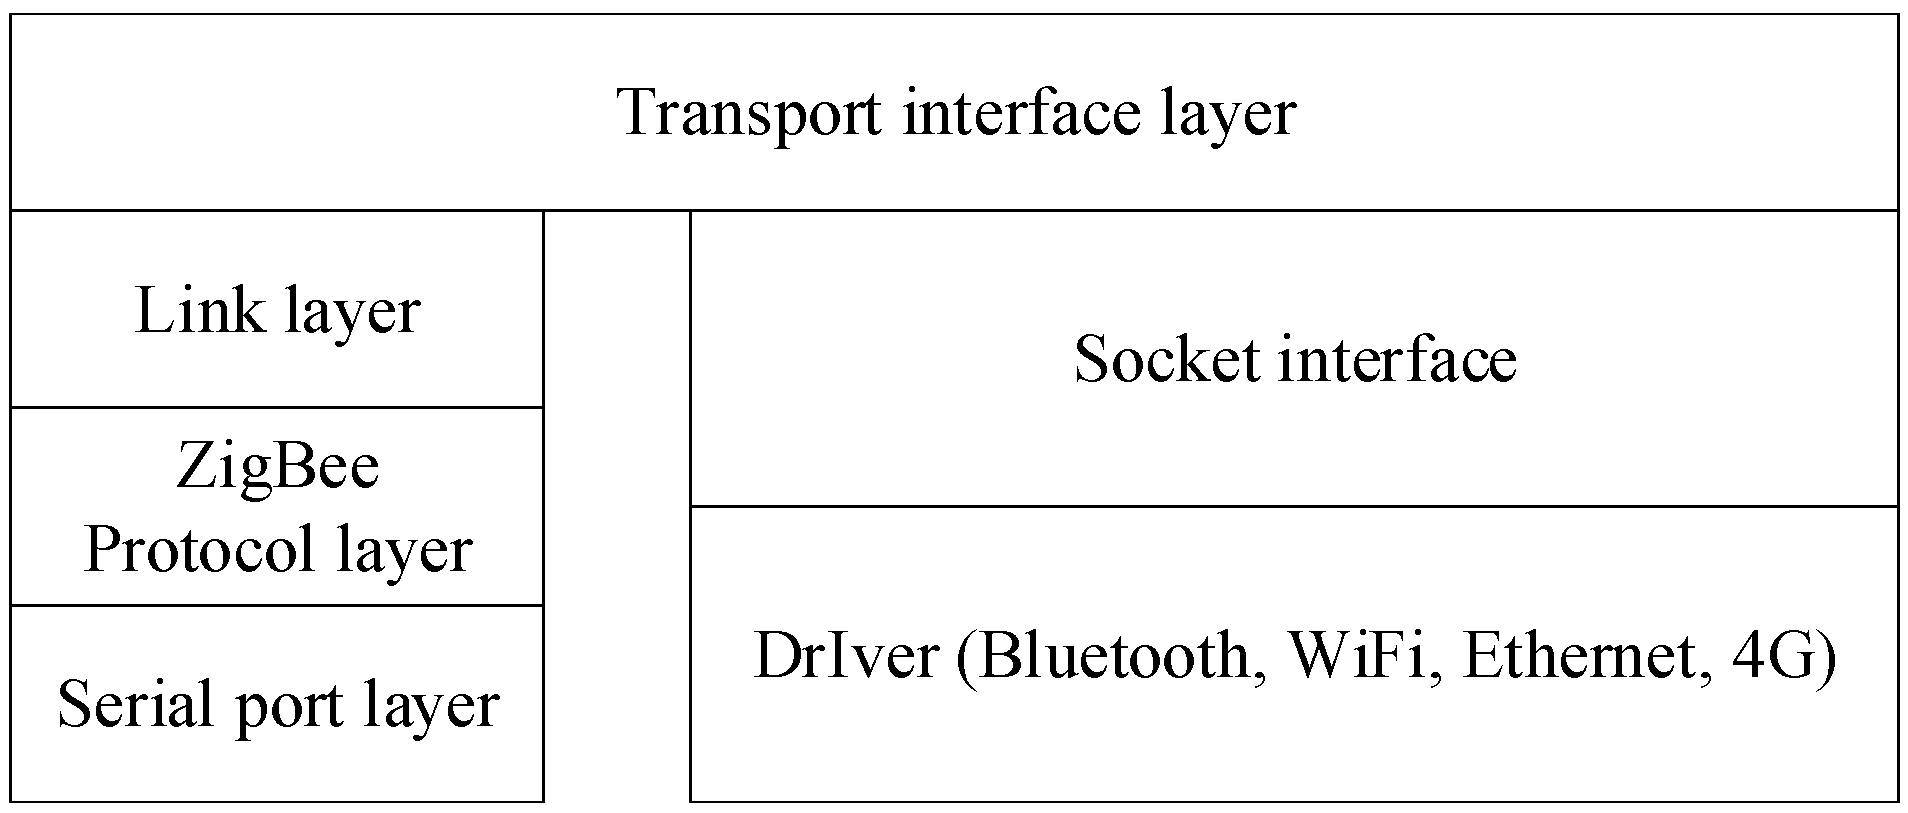
4.2. Communication Module

The communication module adopts a layered design, enabling plug-and-play management to enhance system robustness, scalability, and maintainability. The overall structure design is shown in Figure 11. All modules were developed in C/C++ for easy portability. The transport interface layer is responsible for providing upper layers with unified connection, transmission, reception, and sending interfaces, with specific details implemented by the underlying modules. The link layer is responsible for the reliable transmission of data packets, providing reliable data streams for the upper layers, including packet splitting, assembly, numbering, and encapsulation. The ZigBee protocol layer is responsible for data packet communication between ZigBee modules, without guaranteeing transmission reliability. The underlying communication protocols for Bluetooth, WiFi, 4G, and Ethernet are implemented by drivers, providing unified Socket interface calls.

5. Development of Cloud Platform Monitoring Software

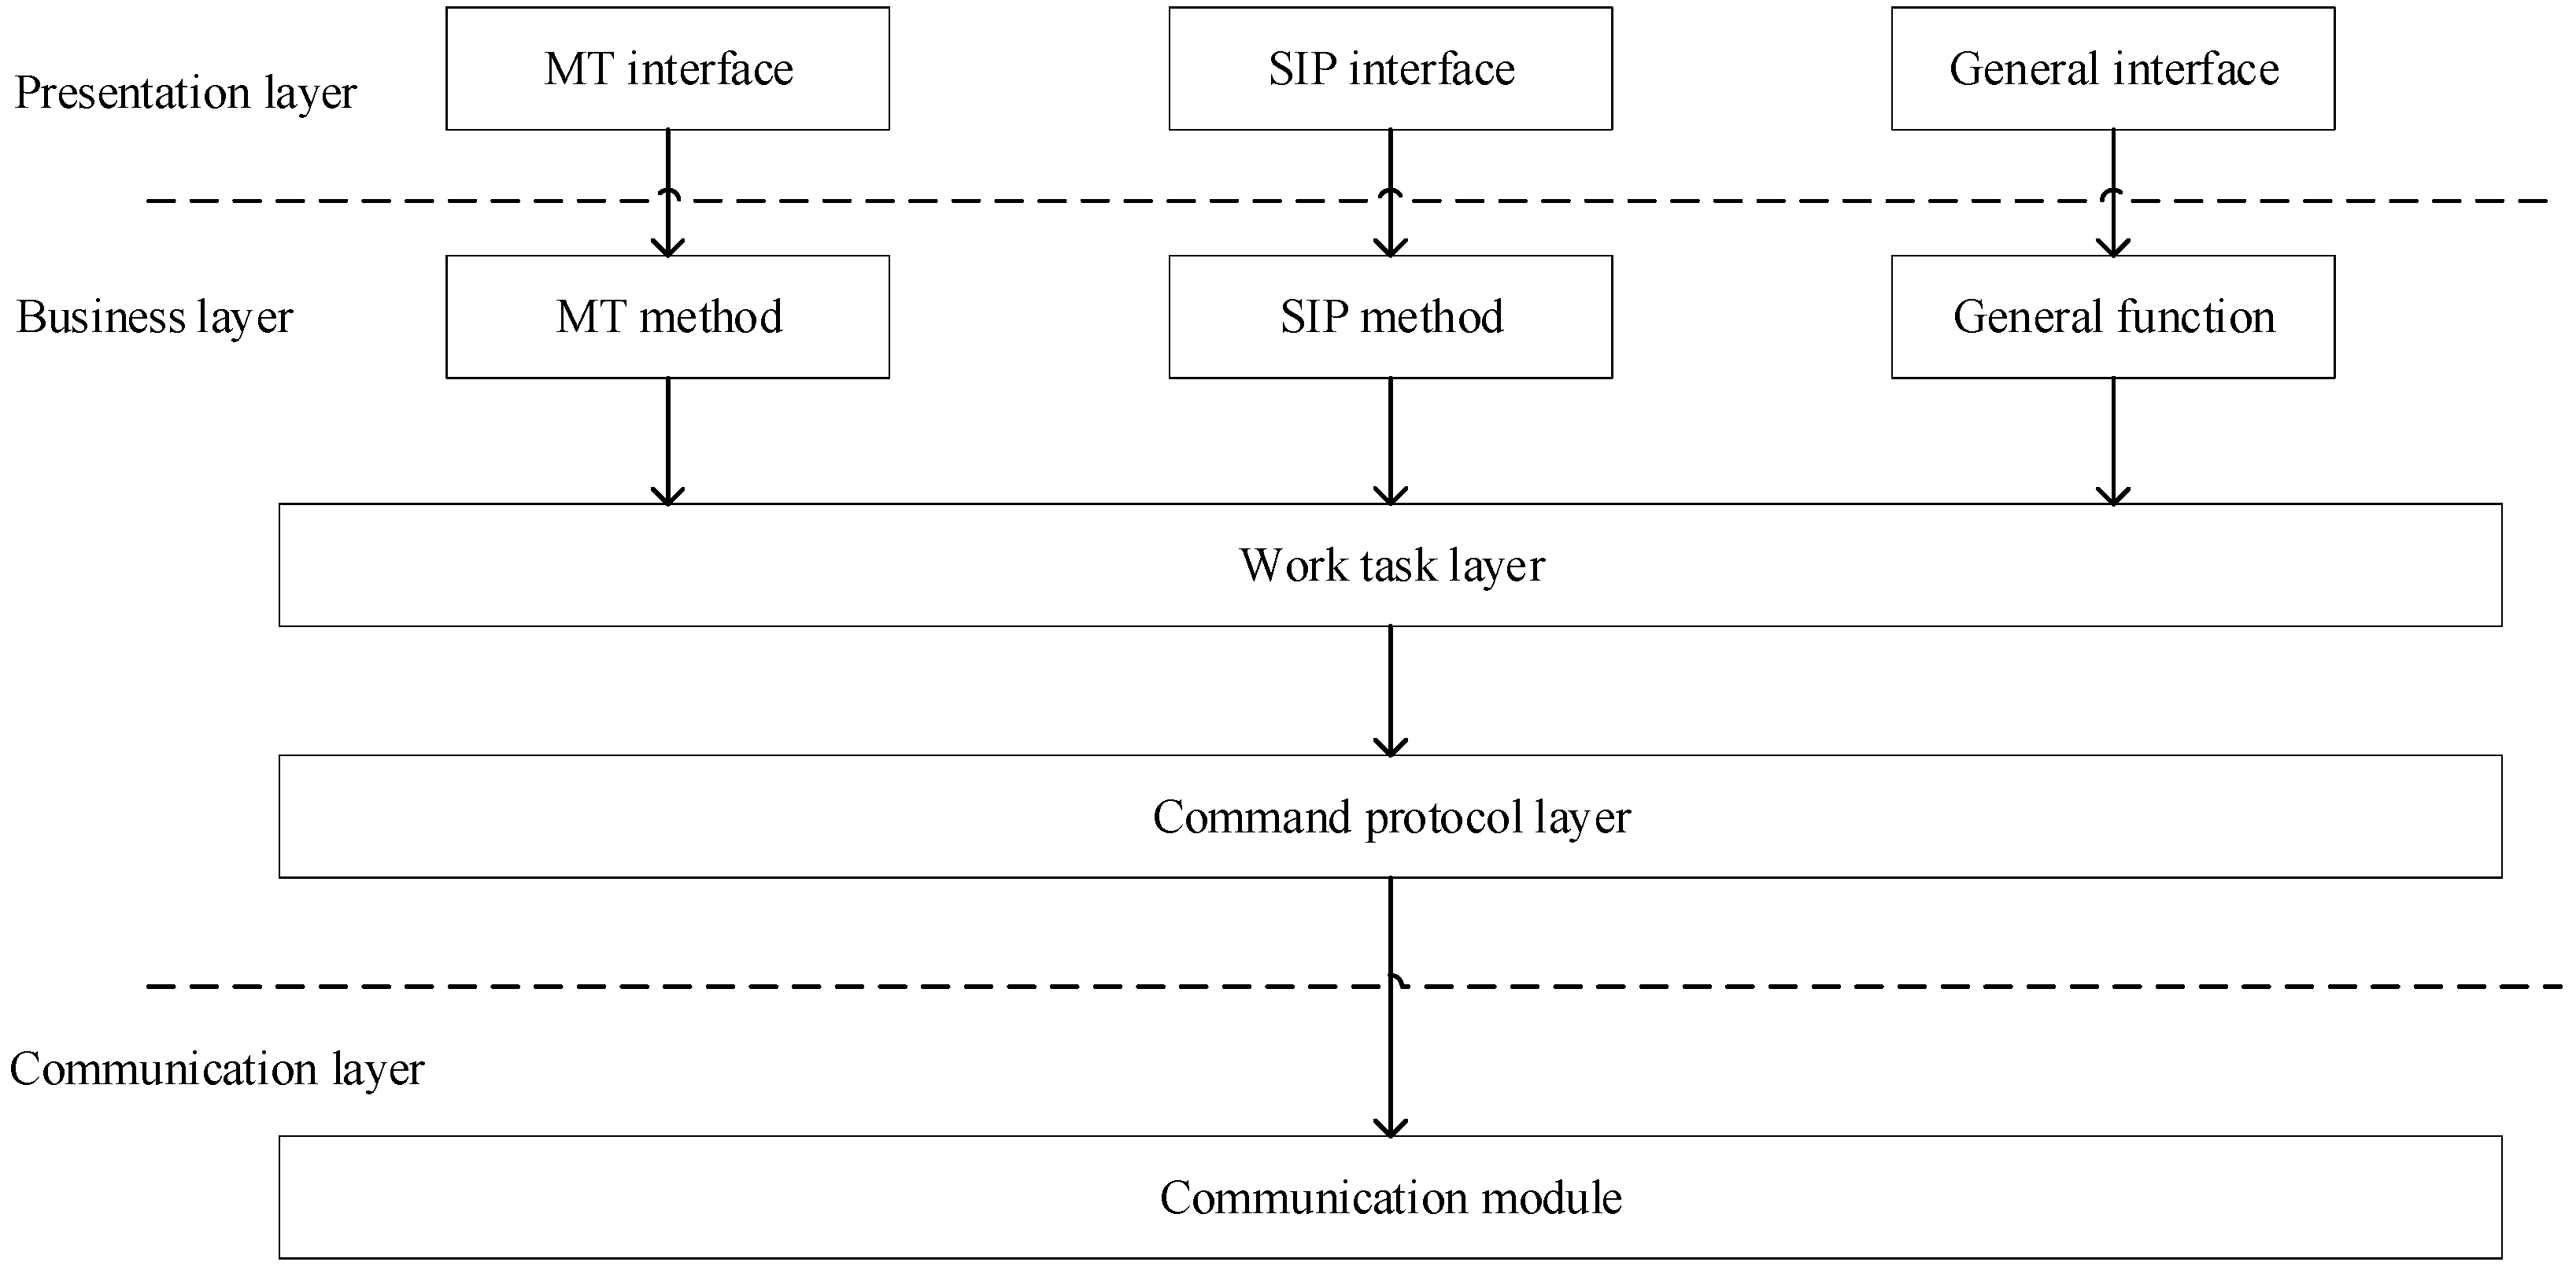
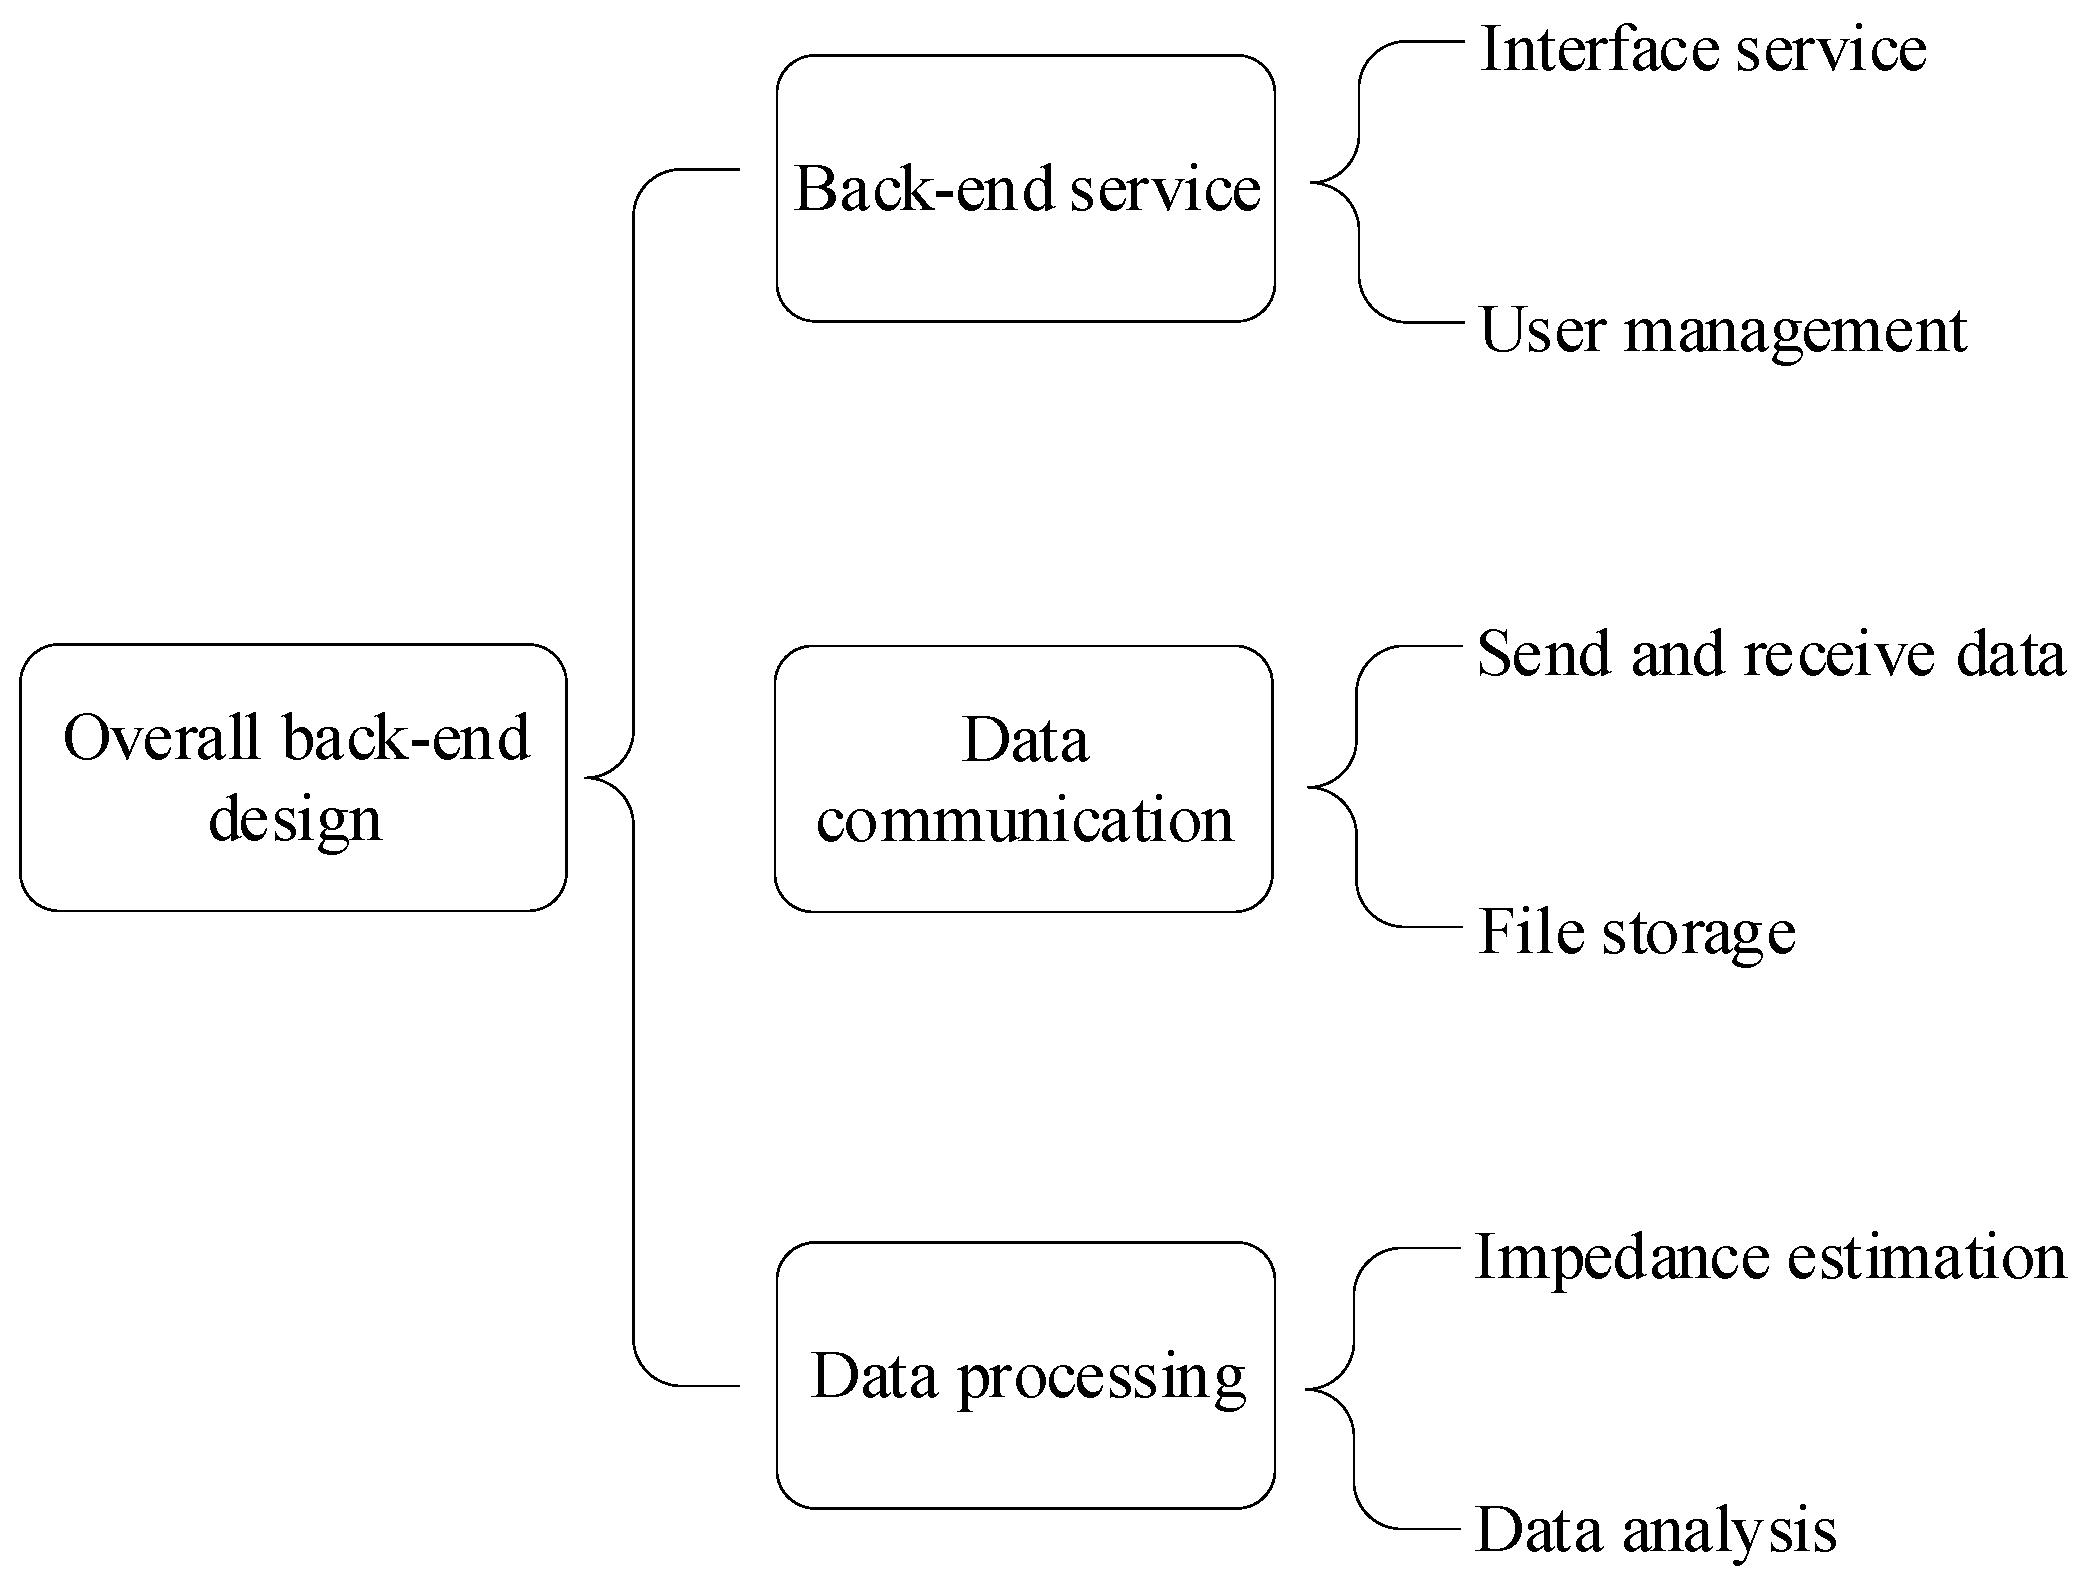
5.1. Functional Framework

The cloud platform backend was designed with three main modules: a Spring Boot-based backend service module, a Socket-based data communication module, and a data processing module, as shown in Figure 12.
In the design, the backend workflow is as shown in Figure 13. First, the data communication module obtains data from the instrument via Socket and stores it locally for the backend service module and data processing module to use. The data processing module mainly includes converting data files to txt format, magnetotelluric impedance estimation, and data analysis. After processing, the data are made available for the backend service to access. The backend service, built on the Spring Boot framework, provides interfaces for the frontend to access and retrieve backend data.

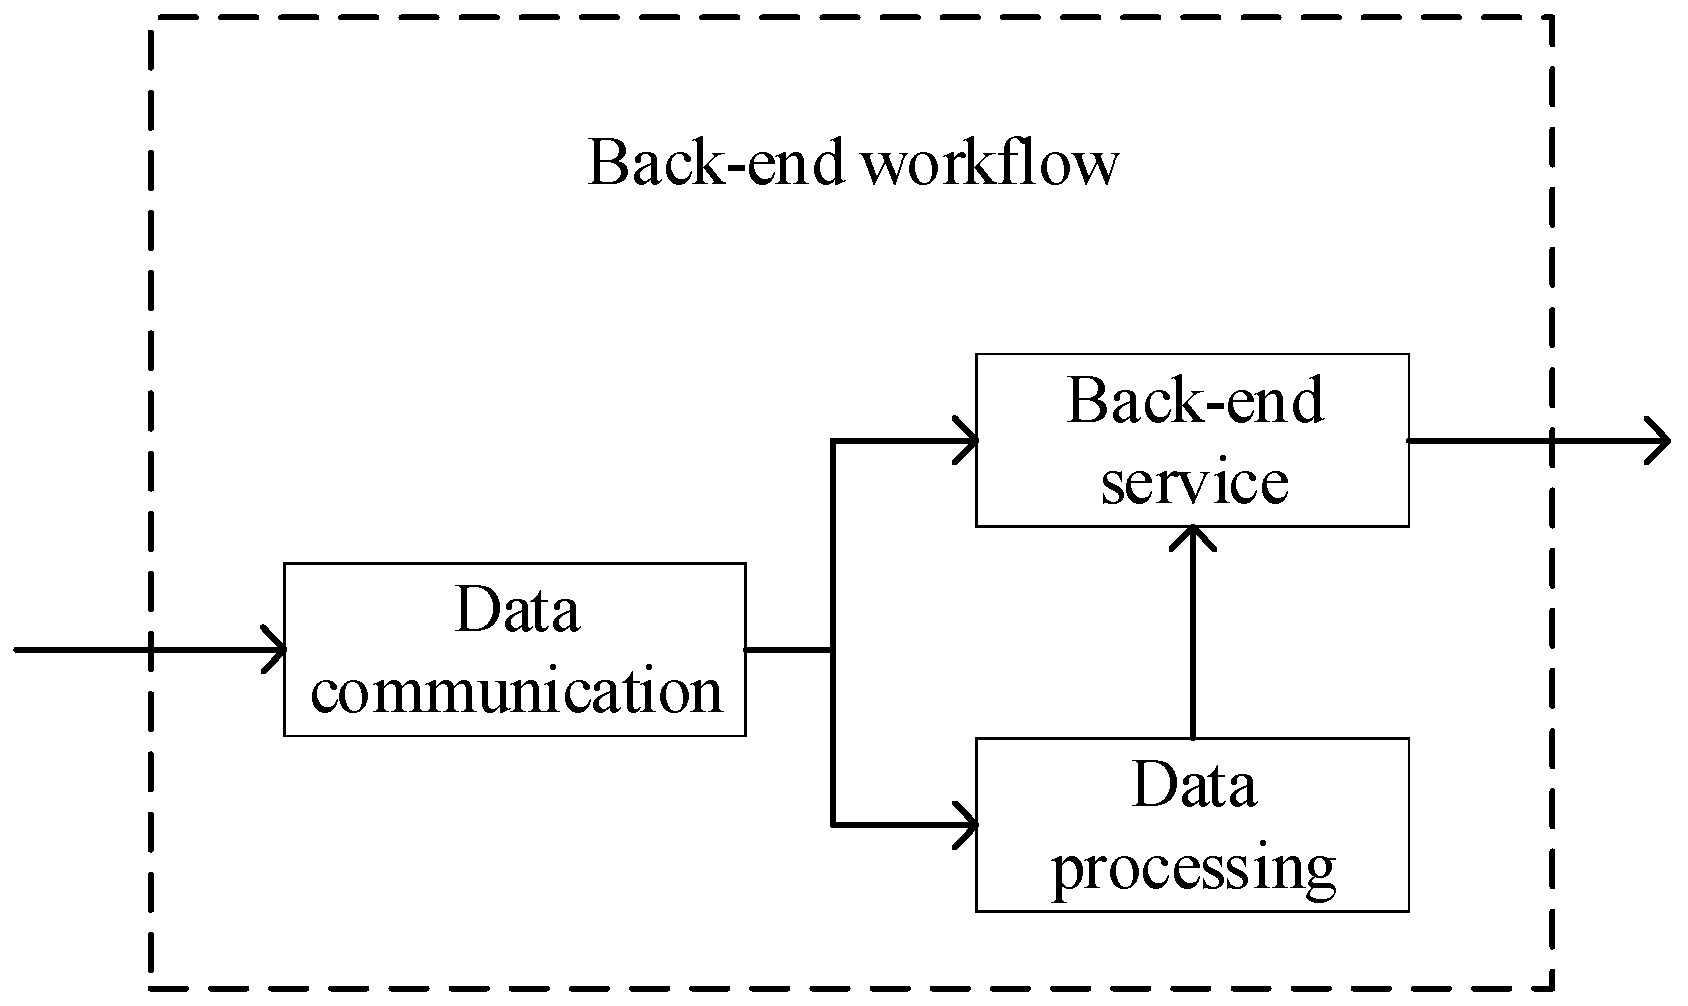
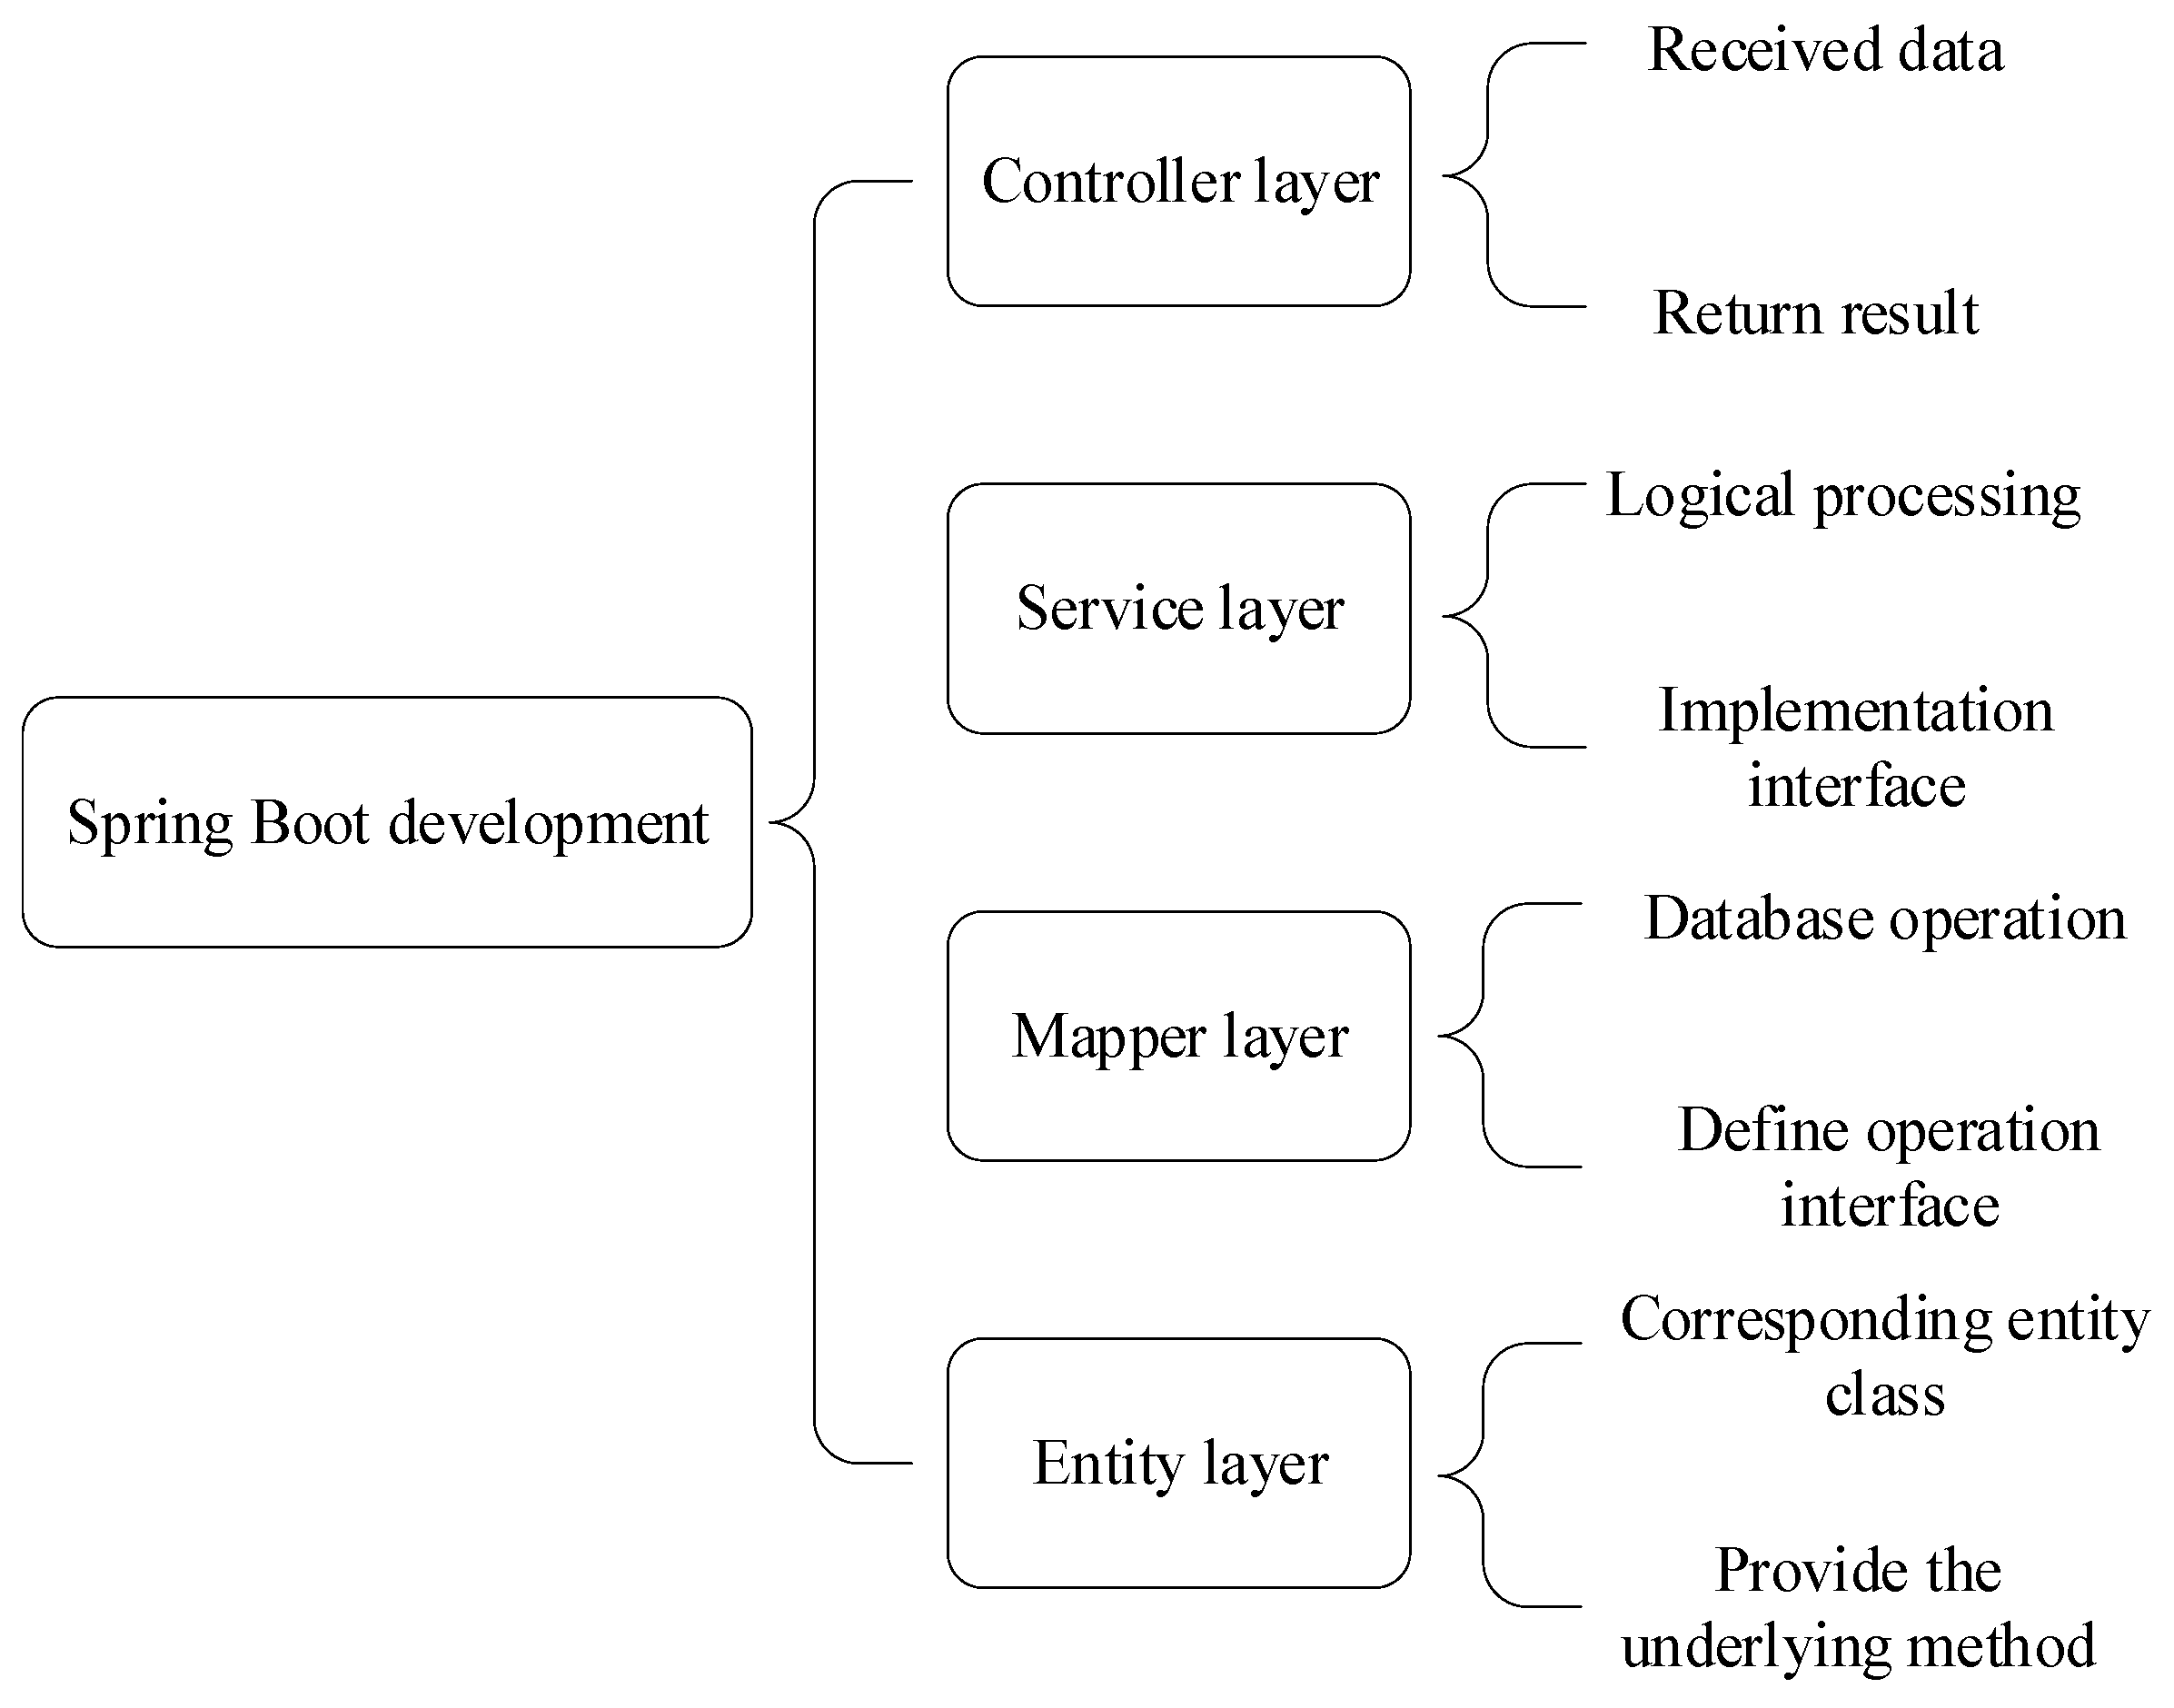
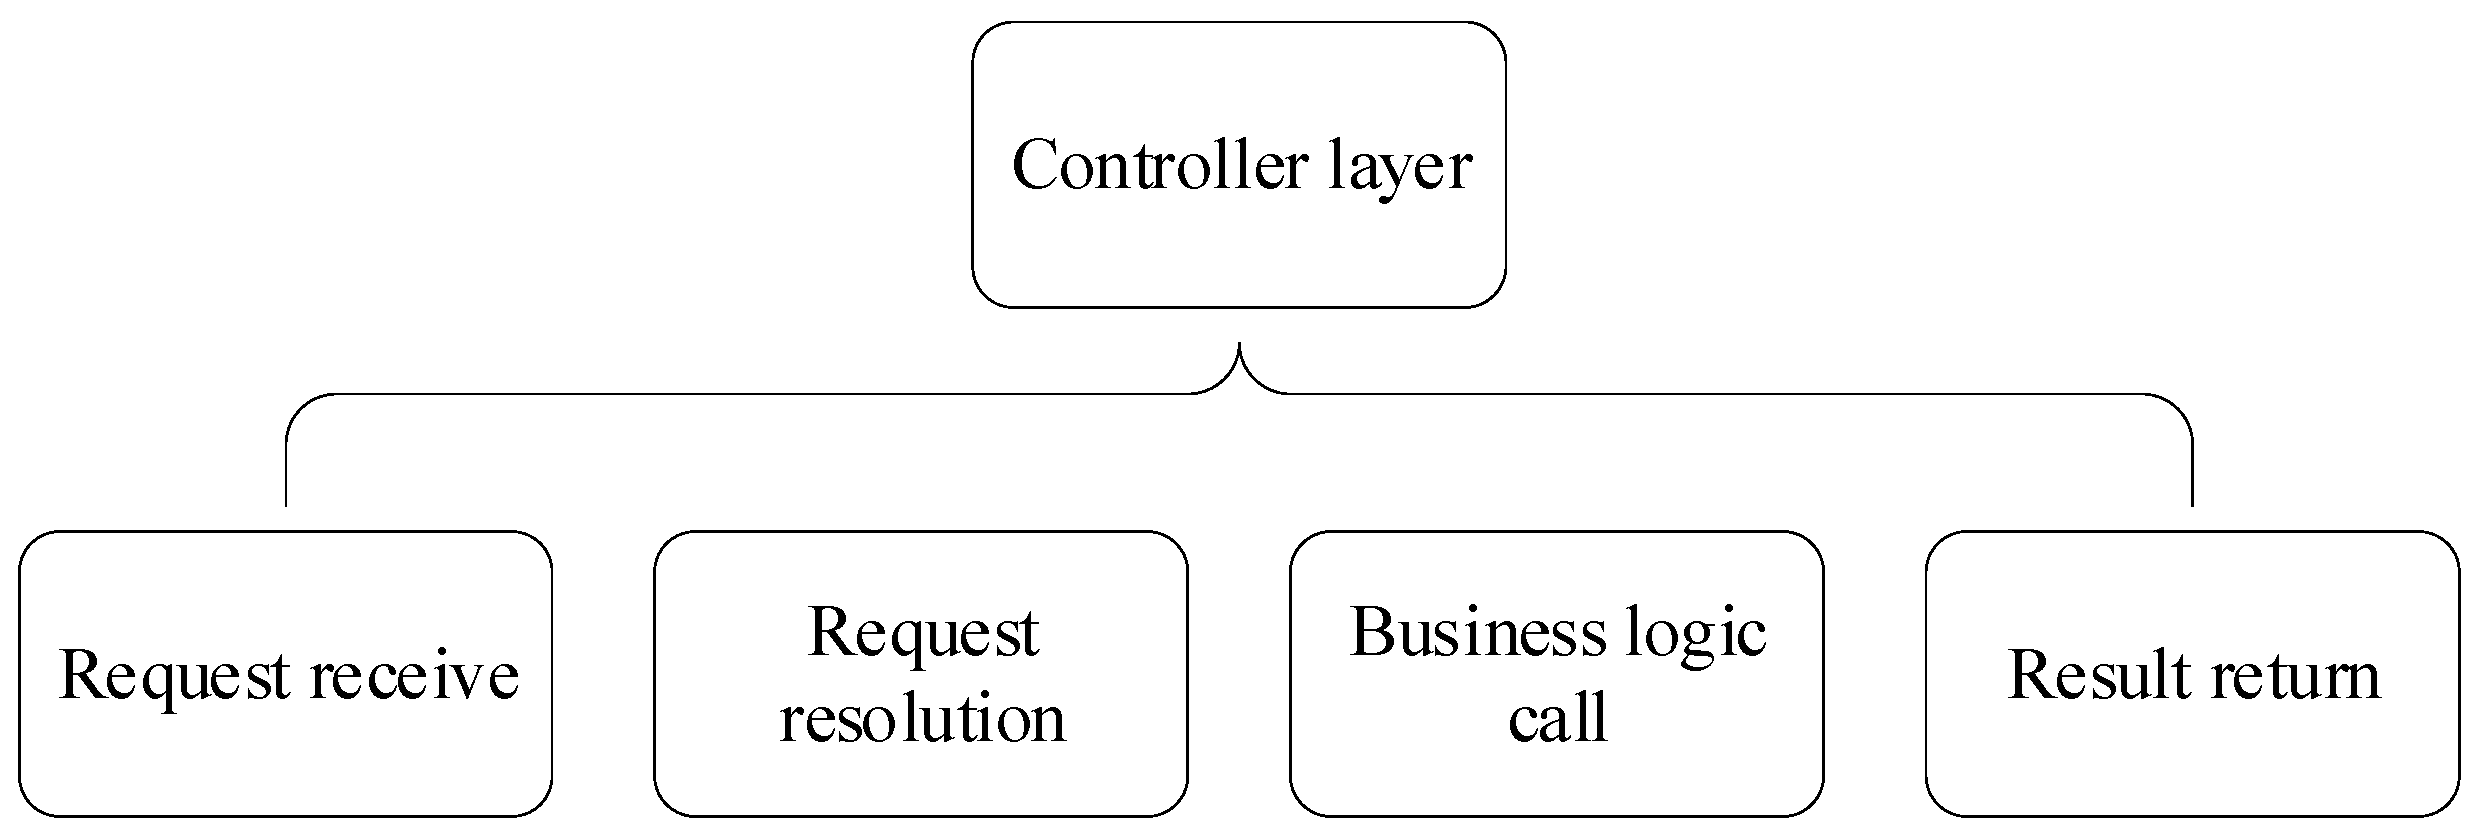
5.2. Backend Service Development

The backend service is mainly built using the Spring Boot framework, with four layers: the Controller layer, Service layer, Dao layer, and Entity layer. The structure and specific functions are shown in Figure 14.
The Controller layer is mainly responsible for receiving user requests, forwarding them to the corresponding Service layer for processing, and then returning the processing results to the user. It acts as the entry point of the application, serving as a “transfer station” to ensure that user requests are correctly processed and appropriate responses are returned, as shown in Figure 15.
In addition to basic operations on various data objects, the Controller layer in this study also implements functions such as file upload, file download, calling Python 3.8 for data processing, and calling C++11 for data processing.
The file download method’s main workflow is as follows: the frontend first obtains the file path from the backend and displays it on the page. After the user selects the file, the frontend requests the backend download interface. The backend then creates an IO stream to read the file stored on the cloud platform and transmits it to the frontend in segments. After transmission, the IO stream is closed. The overall workflow is shown in Figure 16.
The file upload method’s main workflow is as follows: the user selects the file to be uploaded on the frontend page and clicks the upload button. The frontend sends the file stream to the backend upload interface, which saves the file stream as a file. The backend then performs decompression, file classification, and processing of TBL and CLB files to complete the upload. The overall workflow is shown in Figure 17.

5.3. Data Communication Development
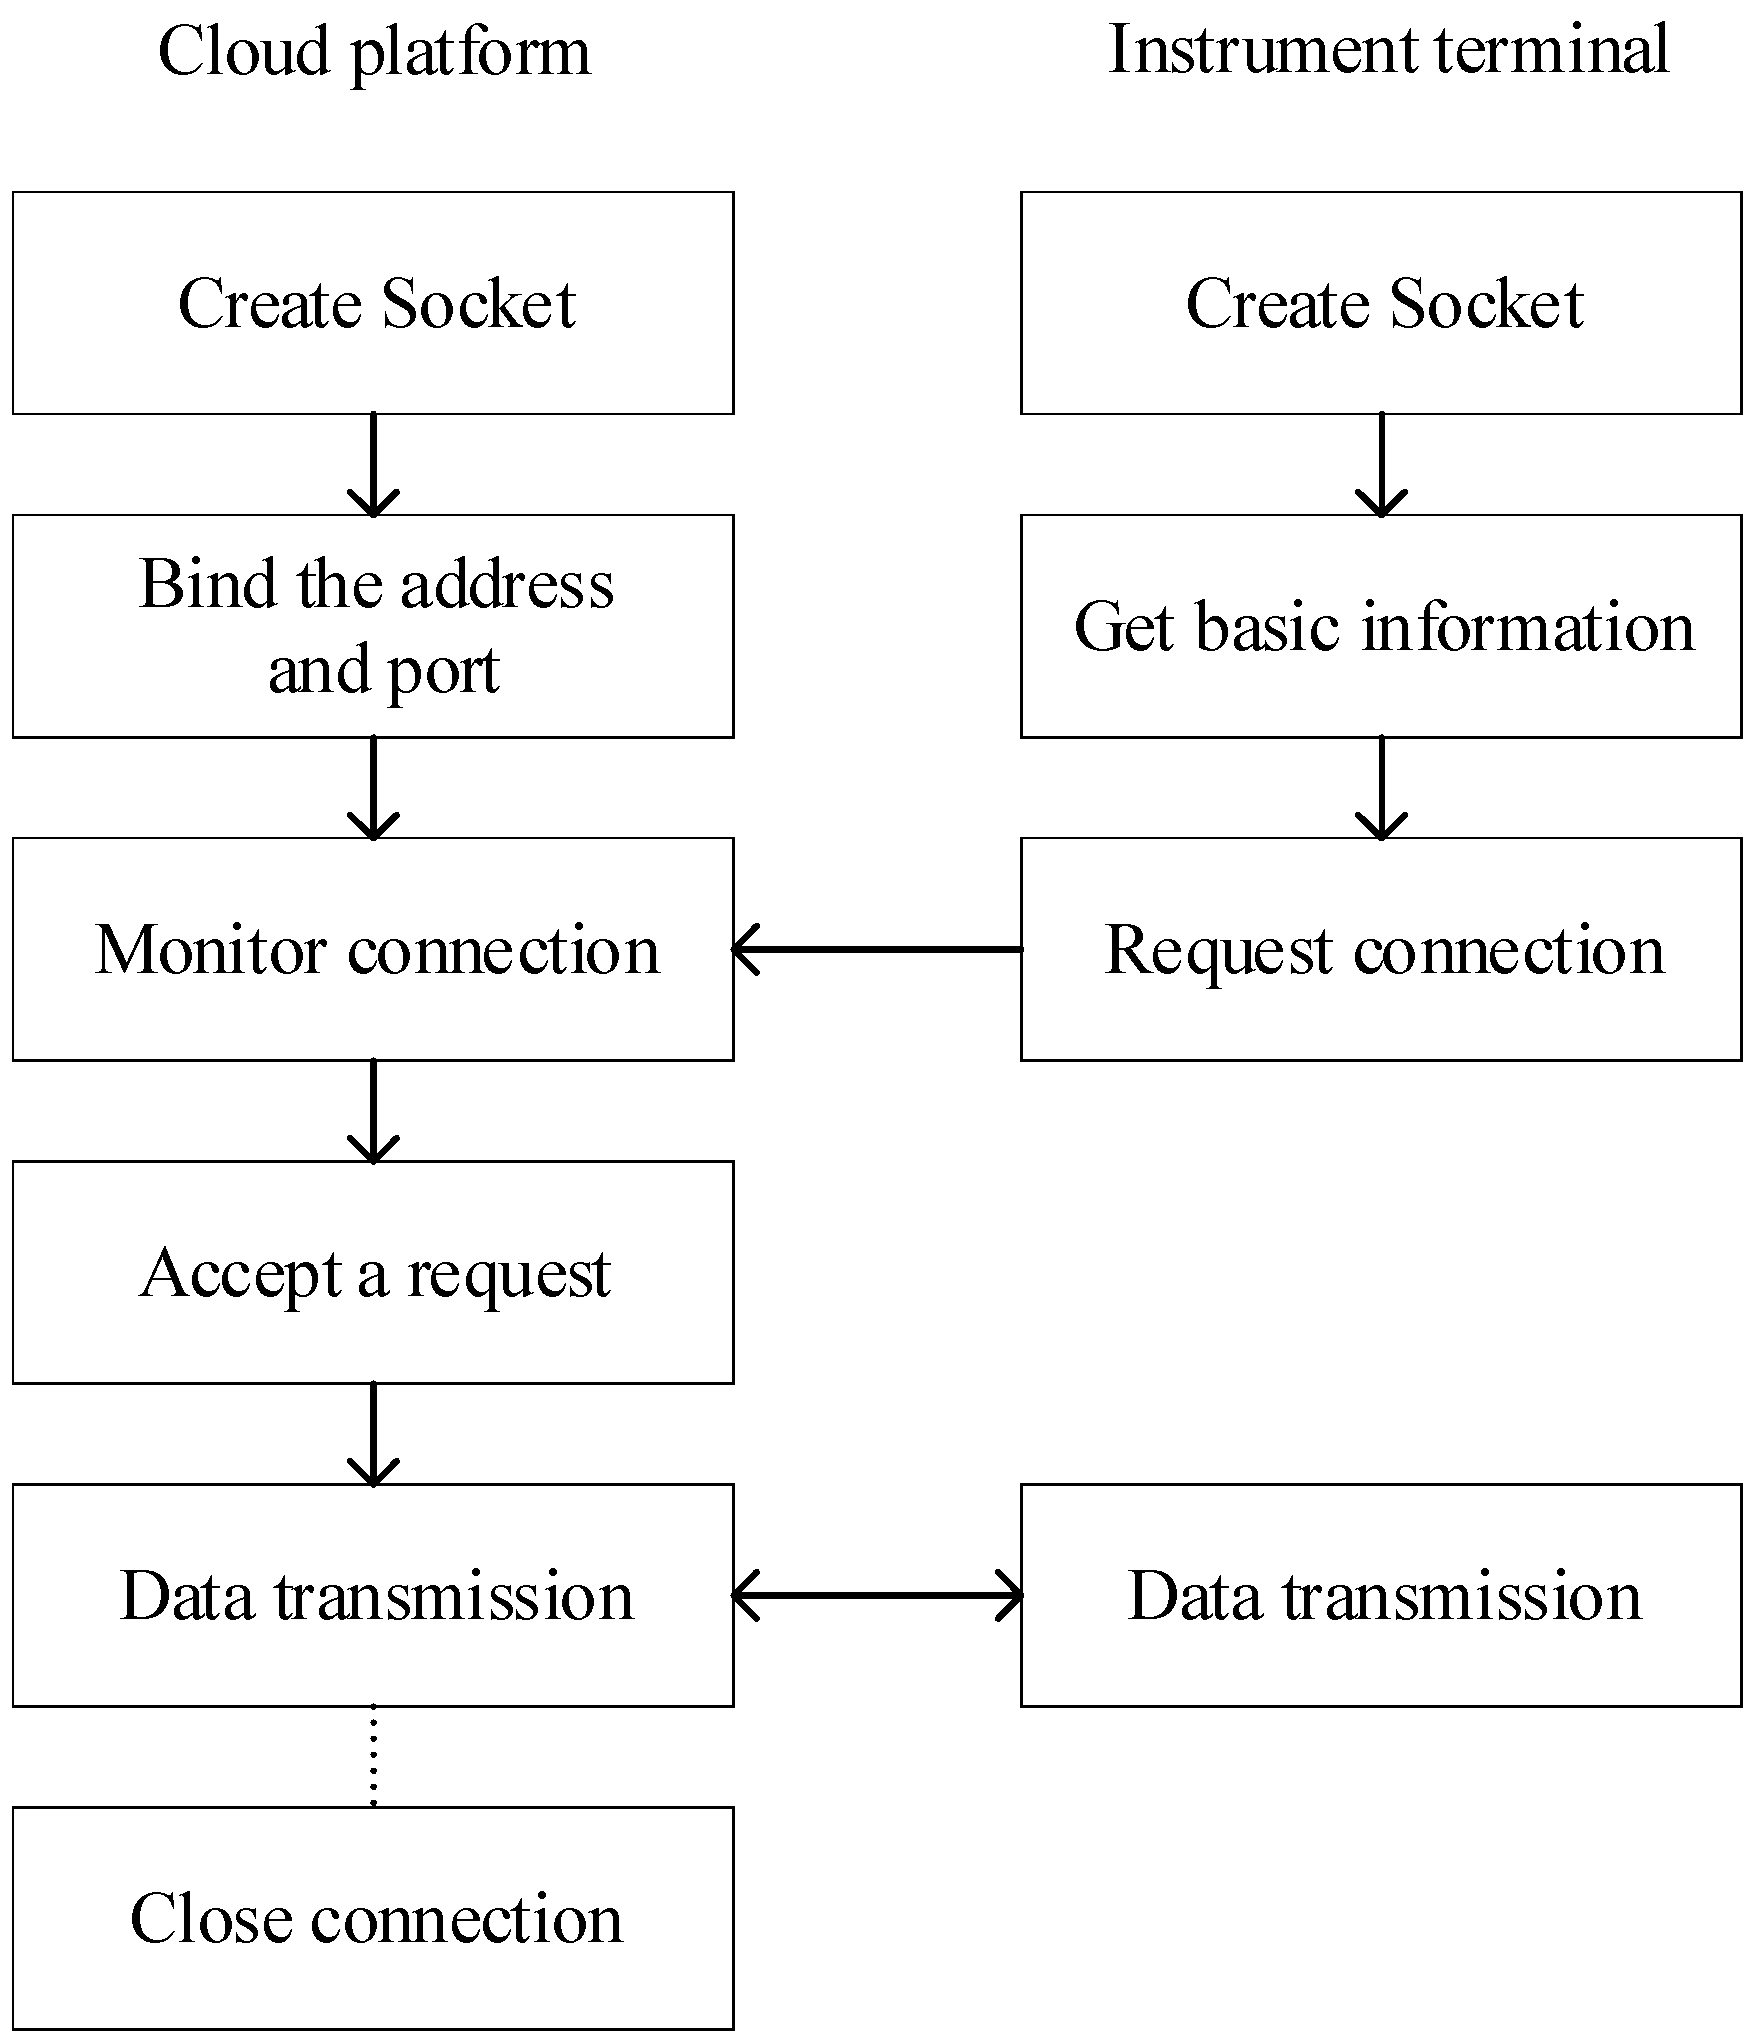
The structure of the data communication module is shown in Figure 18. The data communication module mainly includes the Socket communication module and the data command parsing module. The Socket communication module is responsible for the connection between the instrument and the cloud platform. This study adopted a one-to-many organizational structure, where the instrument actively initiates a connection request to the cloud platform after powering on. The cloud platform, as the server, waits for the instrument’s request and completes the connection. After the connection is established, this module is responsible for maintaining data transmission between the instrument and the cloud platform.
The data command parsing module is mainly used to parse the data obtained by the cloud platform. This study uses a custom data command transmission protocol, and this module is used to parse the protocol and process the data command content accordingly.
As shown in Figure 19, the instrument is responsible for data acquisition and passively waits for connections and request commands from other devices in the system, only actively sending power-on and power-off notifications to the cloud platform’s fixed IP address during startup and shutdown. The cloud platform is responsible for storing the basic information of the acquisition station, obtaining the data collected by the acquisition station, and maintaining a heartbeat handshake with the acquisition station. The terminal is responsible for user interaction functions, obtaining basic information of the acquisition station from the cloud platform, and establishing a direct connection with the acquisition station using the address in the basic information to monitor the acquisition station in real time or obtain stored acquisition data from the cloud platform.
This study introduces Socket to implement data communication between the cloud platform and the instrument. As shown in Figure 19, the cloud platform is the server, and the instrument is the client. The construction process is as follows:
(1)
The instrument and cloud platform first create a Socket object by calling the socket function and specifying the Socket type.
(2)
The cloud platform server binds the Socket object to a specific IP address and port number by calling the bind function. This port is the server’s identifier for establishing a connection with the instrument.
(3)
The cloud platform server starts listening for connection requests from the instrument client by calling the listen function.
(4)
The instrument client sends a connection request to the server via Socket based on the server’s IP address and port number.
(5)
The cloud platform server listens for connection requests from the instrument client and accepts the connection request by calling the accept function, returning a new Socket object for communication with the instrument client.
(6)
After the connection is established, the server and client can transmit data through their respective Socket objects, sending and receiving data by reading and writing data streams on the Socket object.
(7)
When the communication is completed or an error occurs, the Socket object is closed, ending the connection and releasing resources.
The program logic of the cloud platform’s Socket communication is shown in Figure 20. The main thread is responsible for creating the Socket service, binding the specified port, entering the listening state, and waiting for connection requests from the instrument. It continuously monitors the network port, and when an instrument initiates a connection request, the main thread accepts the request and establishes preliminary communication.
After each instrument (e.g., the nth instrument) successfully connects, the main thread assigns an independent thread (e.g., thread n) to achieve concurrent communication with multiple instruments. Thread n first verifies the instrument’s identity and permissions (e.g., IP, key) to ensure that the connection is legal.
The heartbeat thread periodically sends lightweight heartbeat instructions to the instrument to confirm its online status. In this study, the heartbeat instruction is a request for the basic information of the instrument. The instrument responds immediately upon receiving the request. If no response is received multiple times, the instrument is judged to be disconnected, triggering a reconnection or alarm mechanism.
The request thread sends instructions at preset intervals, and the instrument returns real-time data. After receiving the instrument’s data, the format and logic of the returned data need to be checked. Valid data is recorded in the database or log, forming a traceable historical record.
The thread enters a waiting state after sending instructions. If no response is received within the timeout period, it retries or marks an exception. If the connection is interrupted, the thread attempts to re-establish the Socket connection to ensure service continuity. When the instrument actively disconnects or does not respond for a long time, the corresponding Socket resources and thread are released to avoid resource leaks.

6. Results

The acquisition and monitoring system (CMT) produced by this study is shown in Figure 21. The system is equipped with 5-channel synchronous acquisition capabilities (Ex, Ey, Hx, Hy, and Hz), with an operating bandwidth covering DC to 1 kHz, and providing four adjustable gain steps of 0.1/1/16/64. The instrument adopts a 32-bit high-precision ADC, realizes a 160 dB total dynamic range, supports three sampling rates (15 Hz/150 Hz/2400 Hz) for parallel acquisition, and integrates a real-time digital filtering function. Its key technical indicators include a 30 ns GPS synchronization accuracy and less than 2.5 W stand-alone power consumption, supporting Ethernet/WiFi dual-mode measurement and control, and innovative compatibility with universal rechargeable power supply, reflecting the design features of low power consumption and high integration. The data processing part of the system utilizes razorback, an open-source geomagnetic data processing library in Python. The system passed server stress testing and was further tested at the PetroChina base in Bazhou, Hebei, and achieved good experimental results.

6.1. Server Stress Testing

The cloud platform server parameters selected for this study are shown in Table 1. Under these parameters, stress testing was conducted on the cloud platform interface using the cloud platform service provider’s stress testing tool. Due to the small test bandwidth, the concurrency setting was also small. The test duration was one hour, which was conducted ten times over seven days. Table 2 summarizes the stress test results.
The results show that the cloud platform server interface could withstand 200 concurrent connections well, with excellent performance under a peak bandwidth of 5 Mbit/s. The server bandwidth will be upgraded in the future, allowing the platform to support more simultaneous users.

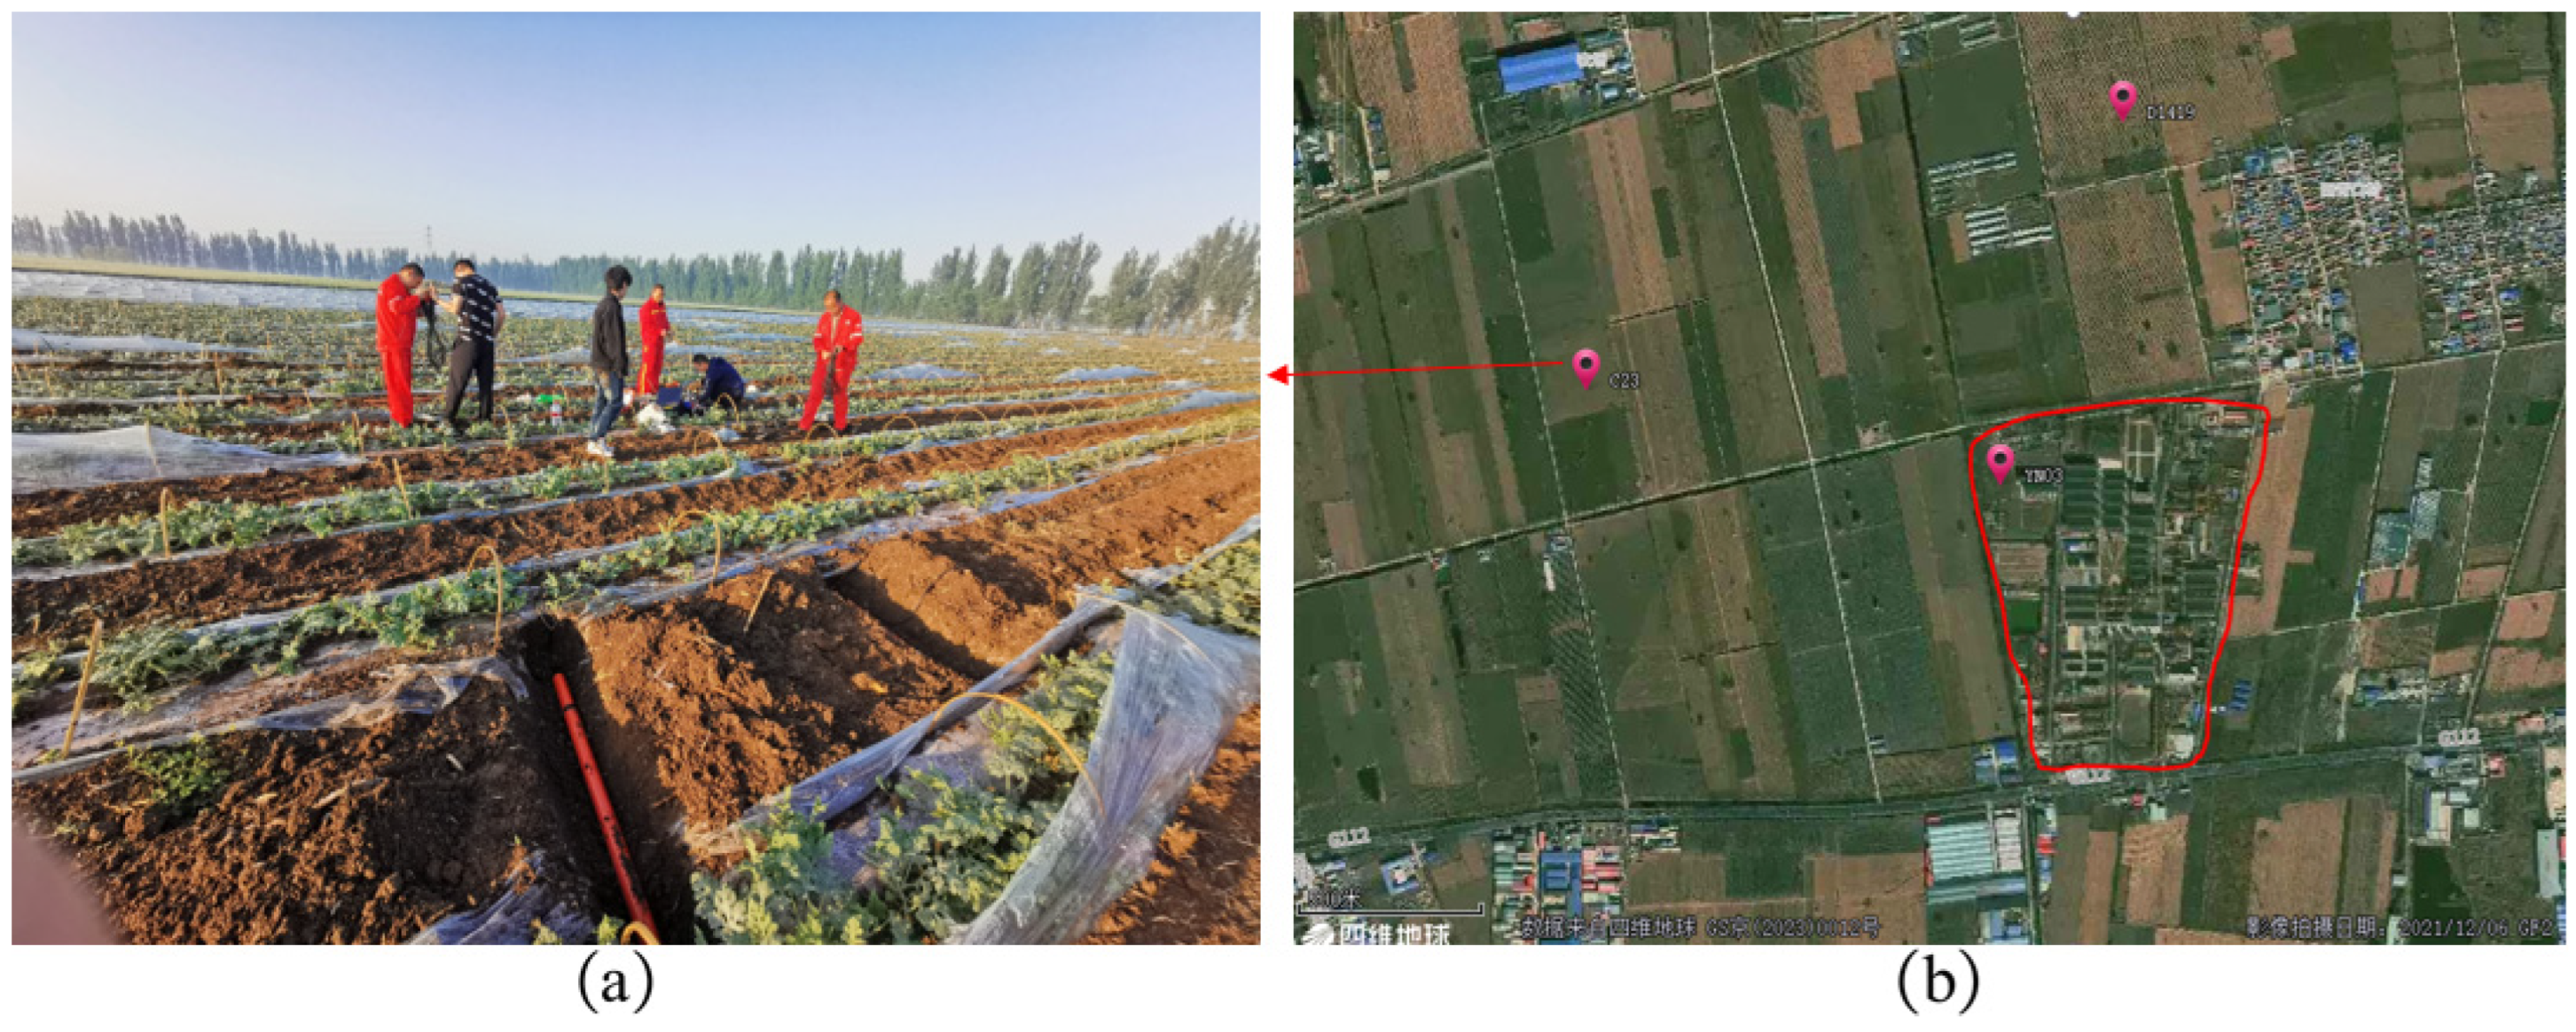
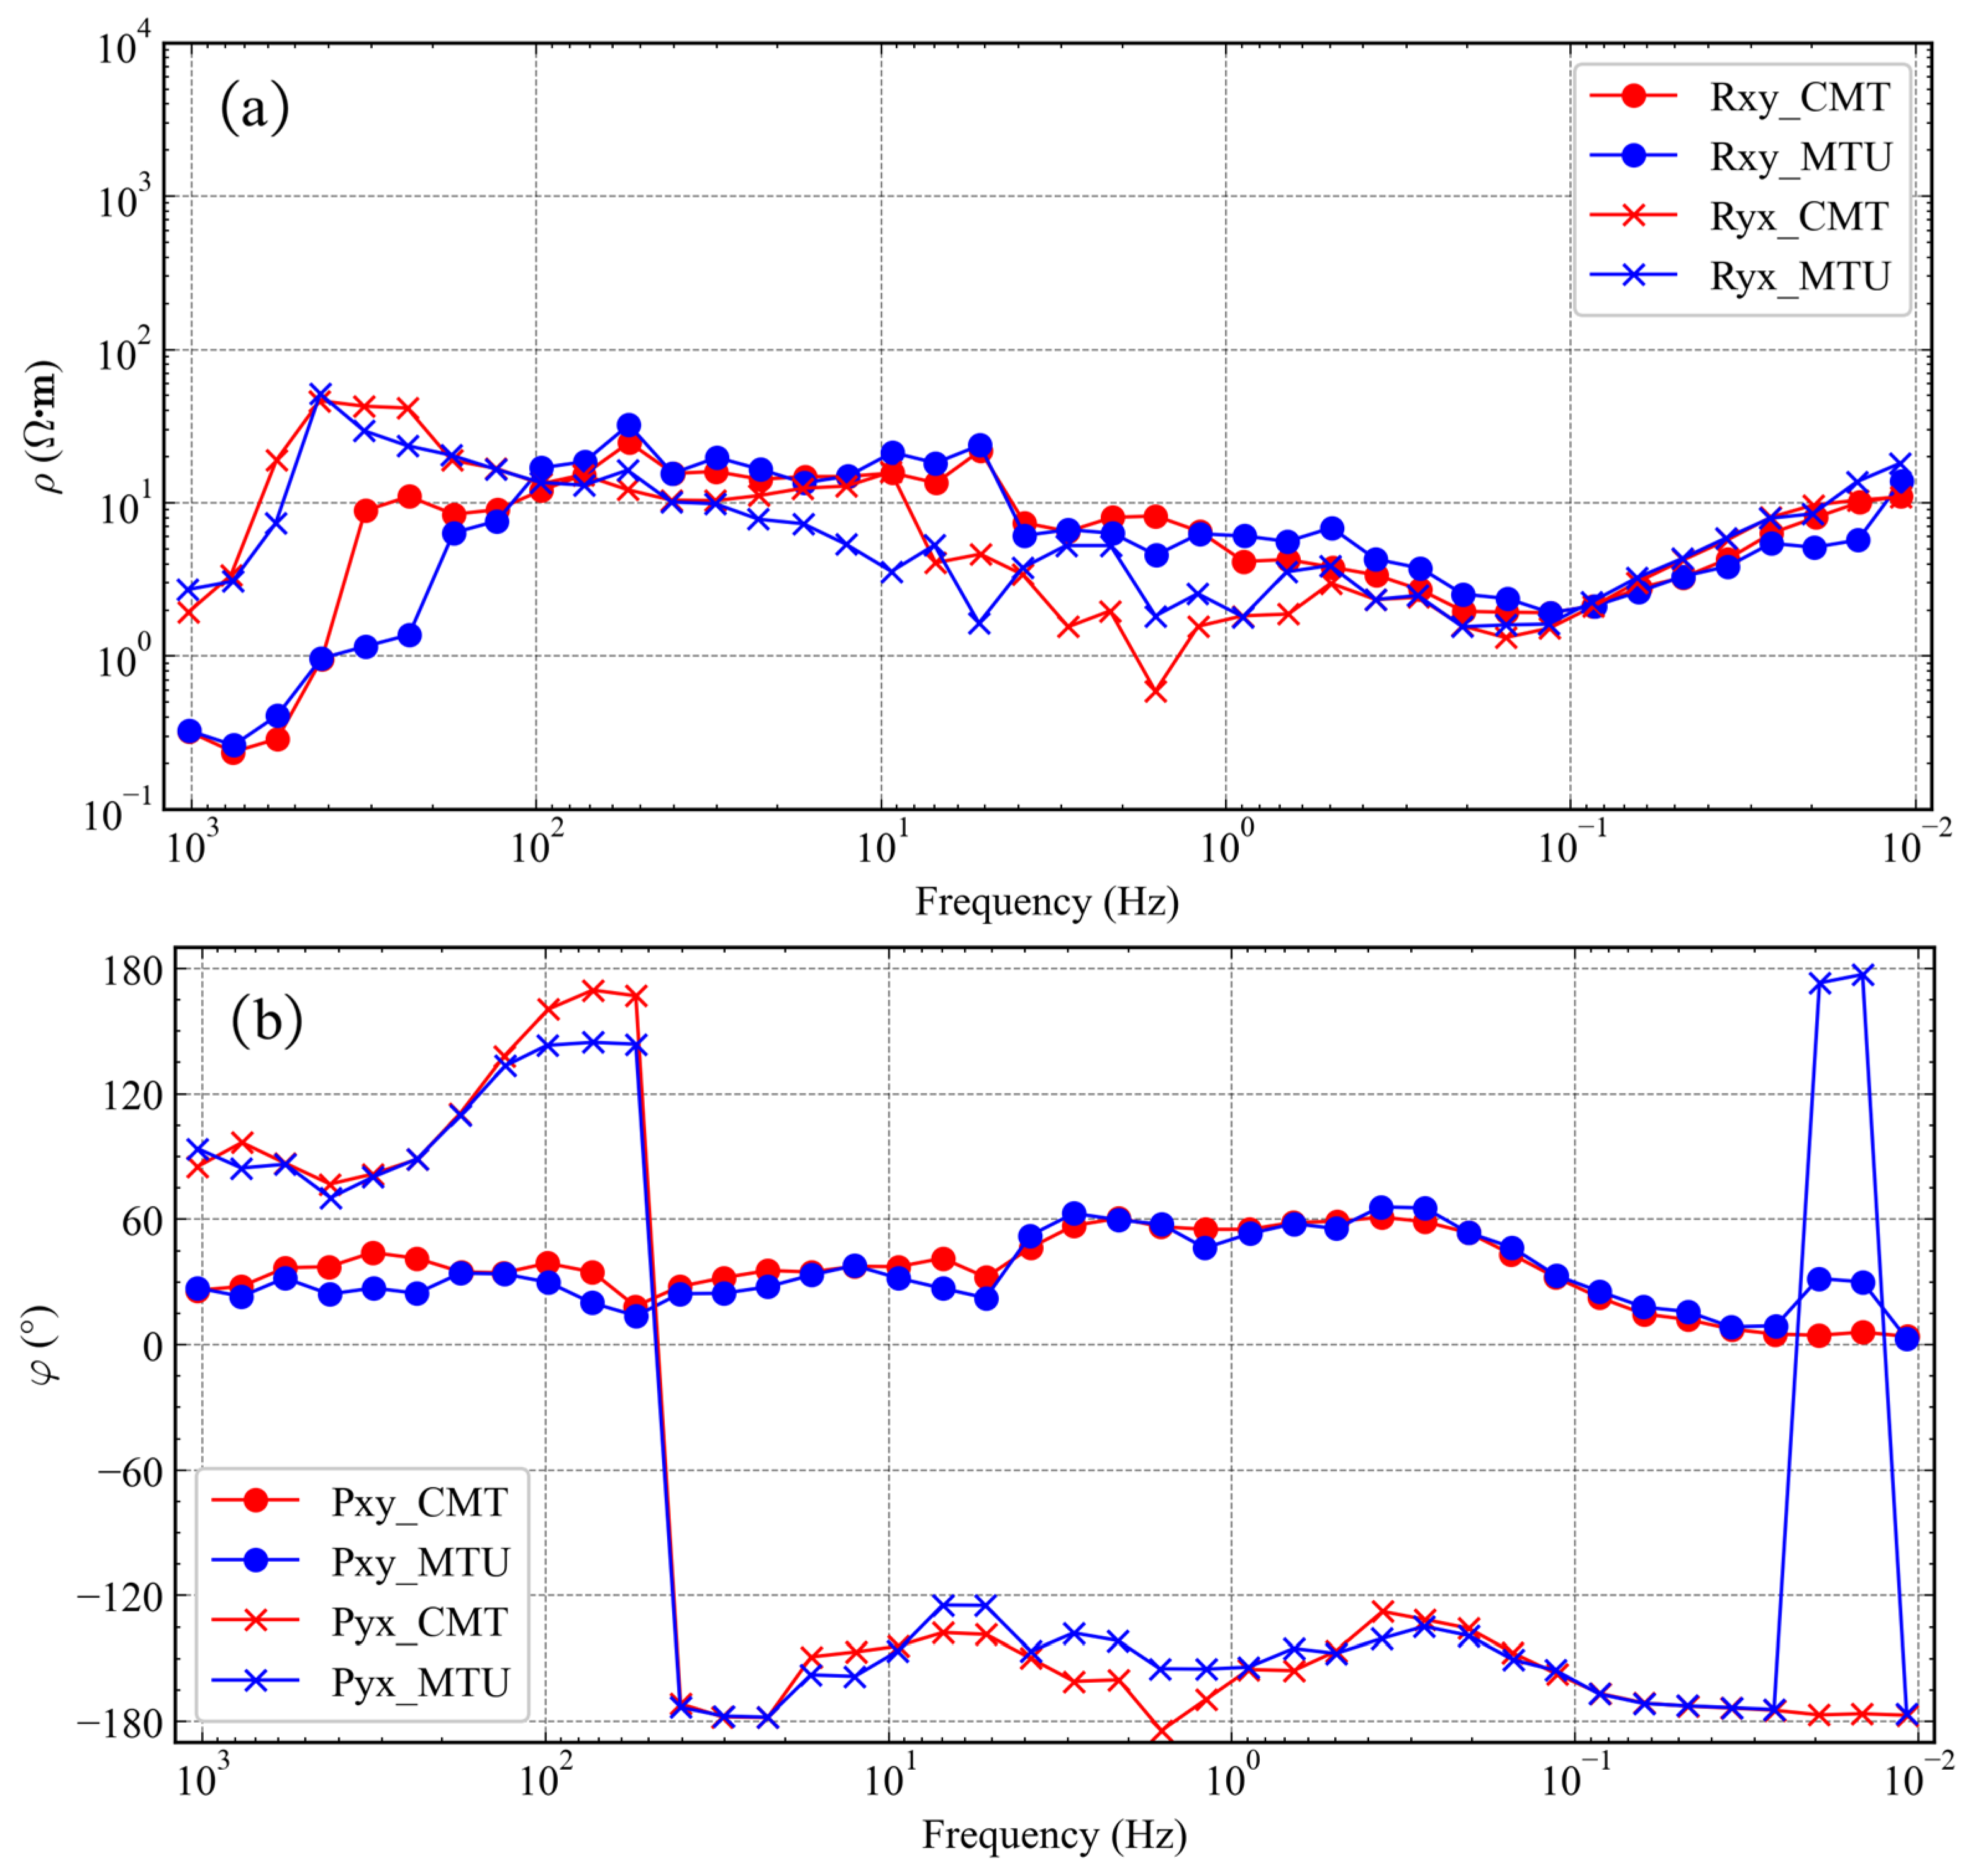
6.2. Consistency Testing

Consistency testing of this acquisition control system was conducted at the PetroChina base in Bazhou, Hebei, with the Phoenix MTU-5A as the reference instrument. The observation method used was two electric channels and two magnetic channels, with an electric dipole spacing of 20 m. The acquisition frequency range was 0.01 Hz to 1000 Hz, and the acquisition duration was eight hours. The test site was chosen by PetroChina (shown in Figure 22), which is a commonly used test site near the base. The same electrodes and magnetic rods were used, and the test was conducted on two consecutive days.
The test results are shown in Figure 23. The two acquisitions showed good consistency below 0.7 Hz, while there were fluctuations above 0.7 Hz, with slight differences at different frequency points, likely due to different interferences during the two time periods. The curve shapes and jump points were consistent with the differences between two acquisitions using the same device. Table 3 shows the error parameters of the test, which are basically consistent between the two instruments. Using the same electrodes and magnetic rods, the curve shapes of the two instruments’ acquisitions were consistent, indicating good consistency between the two instruments, and the instrument differences did not cause changes in the resistivity and phase curves.

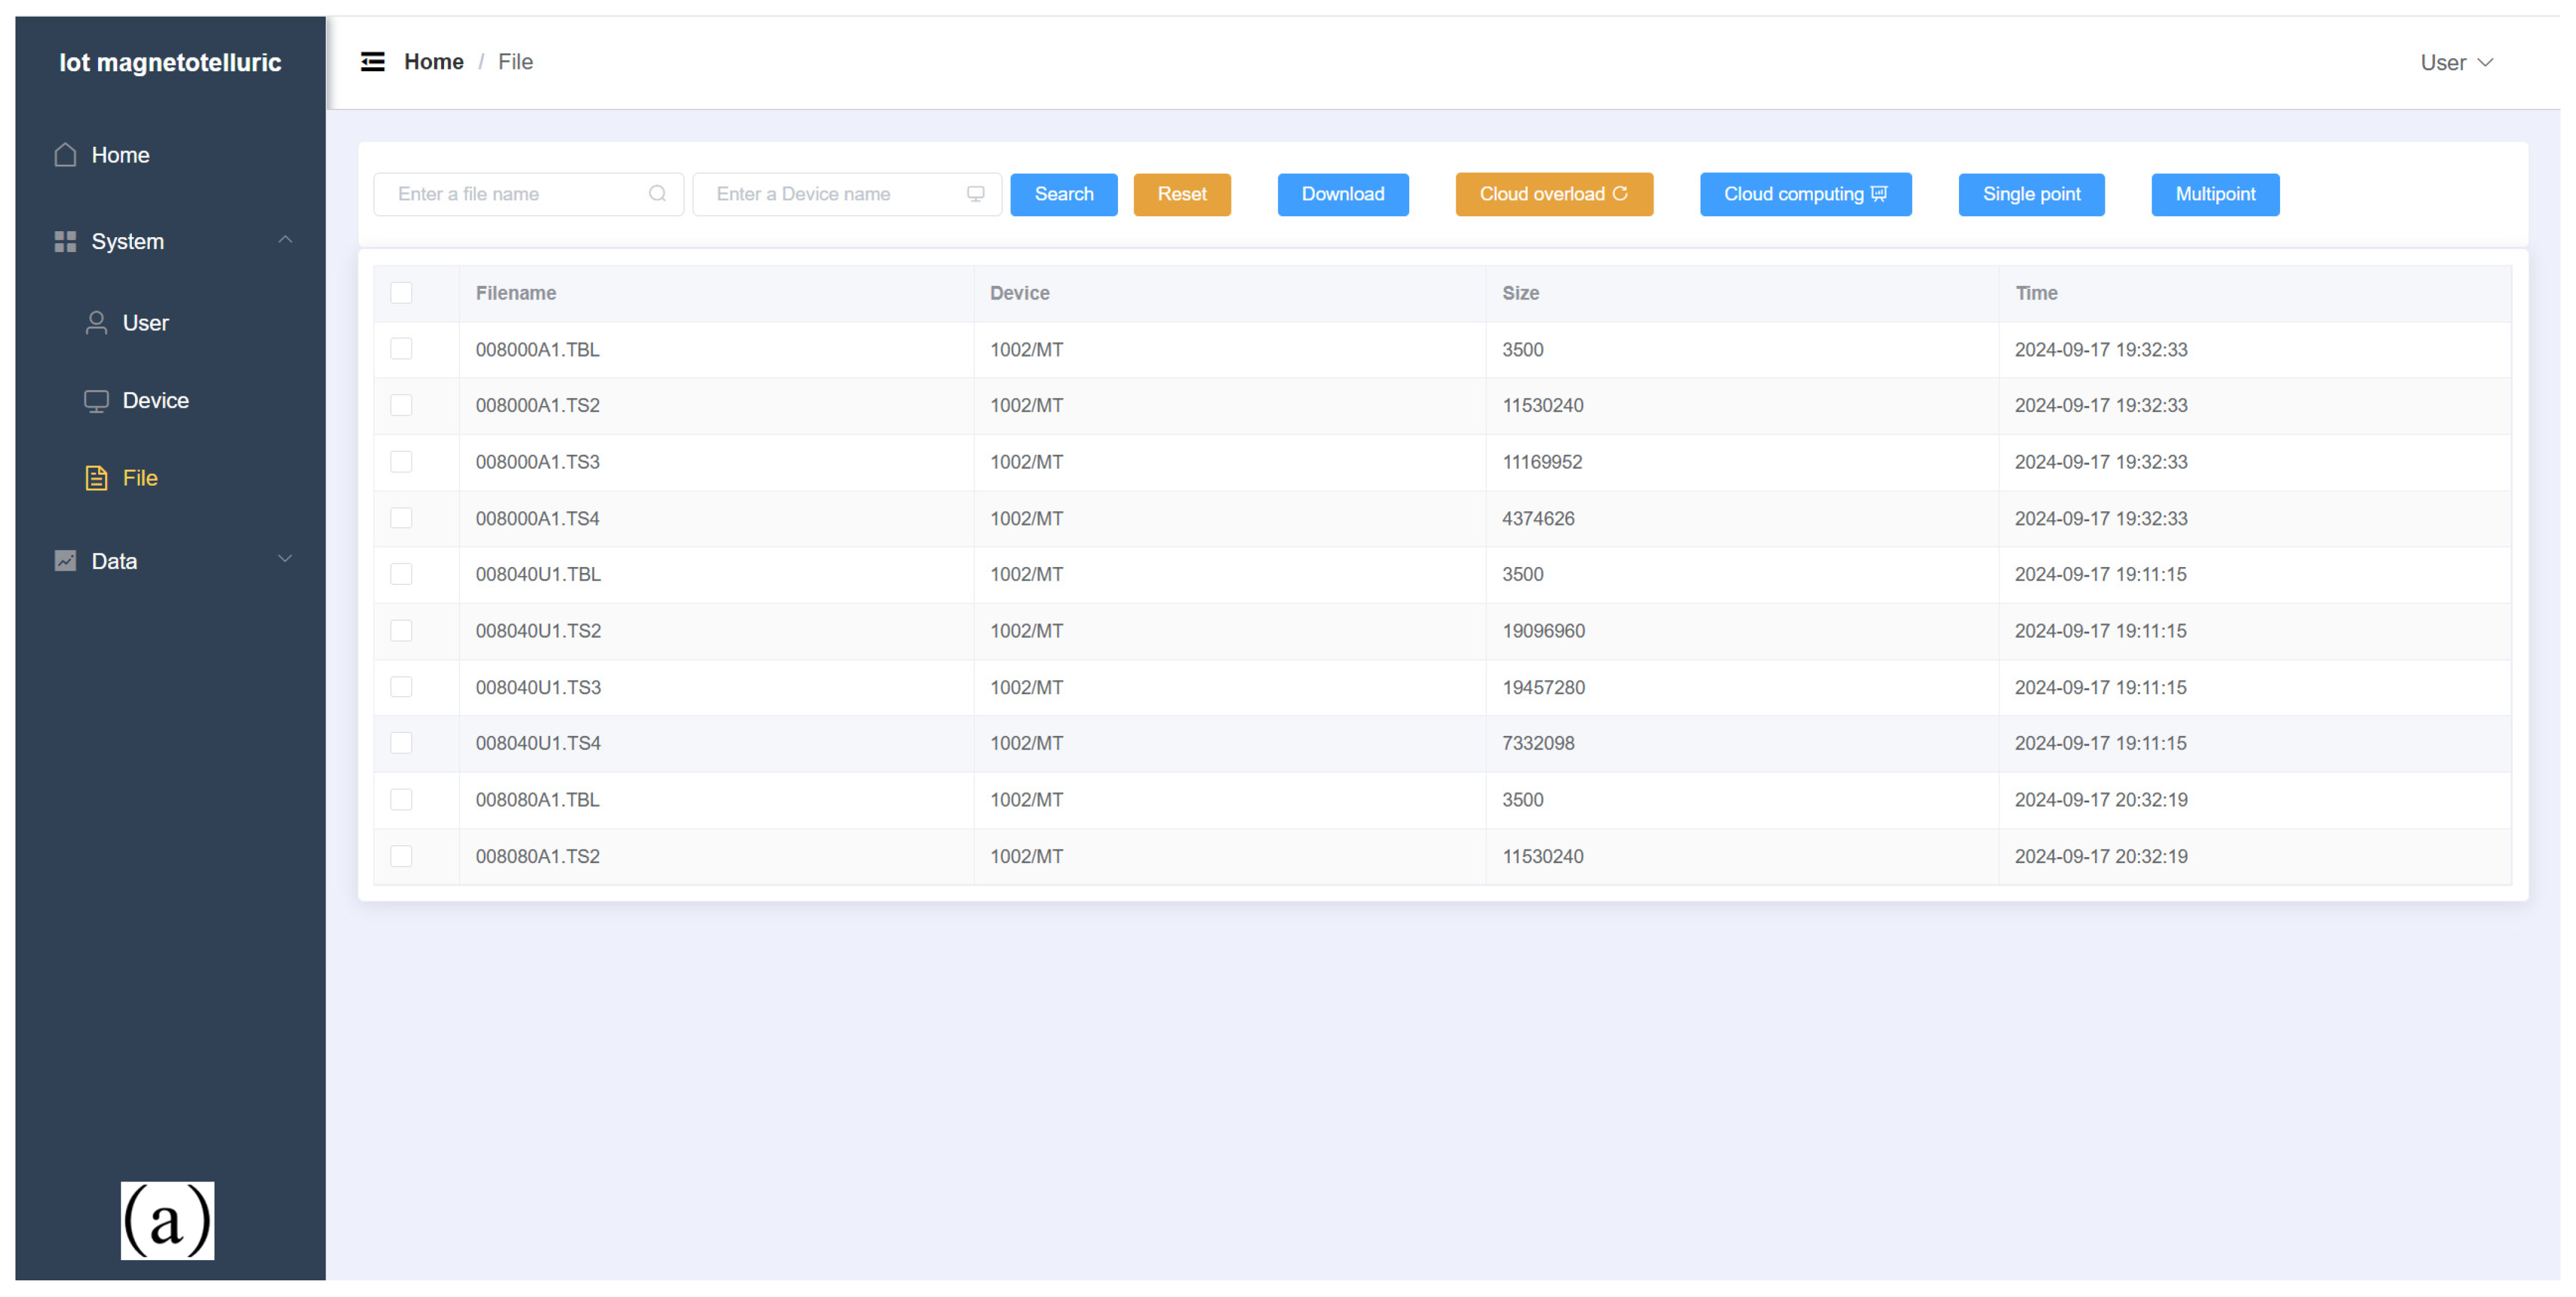
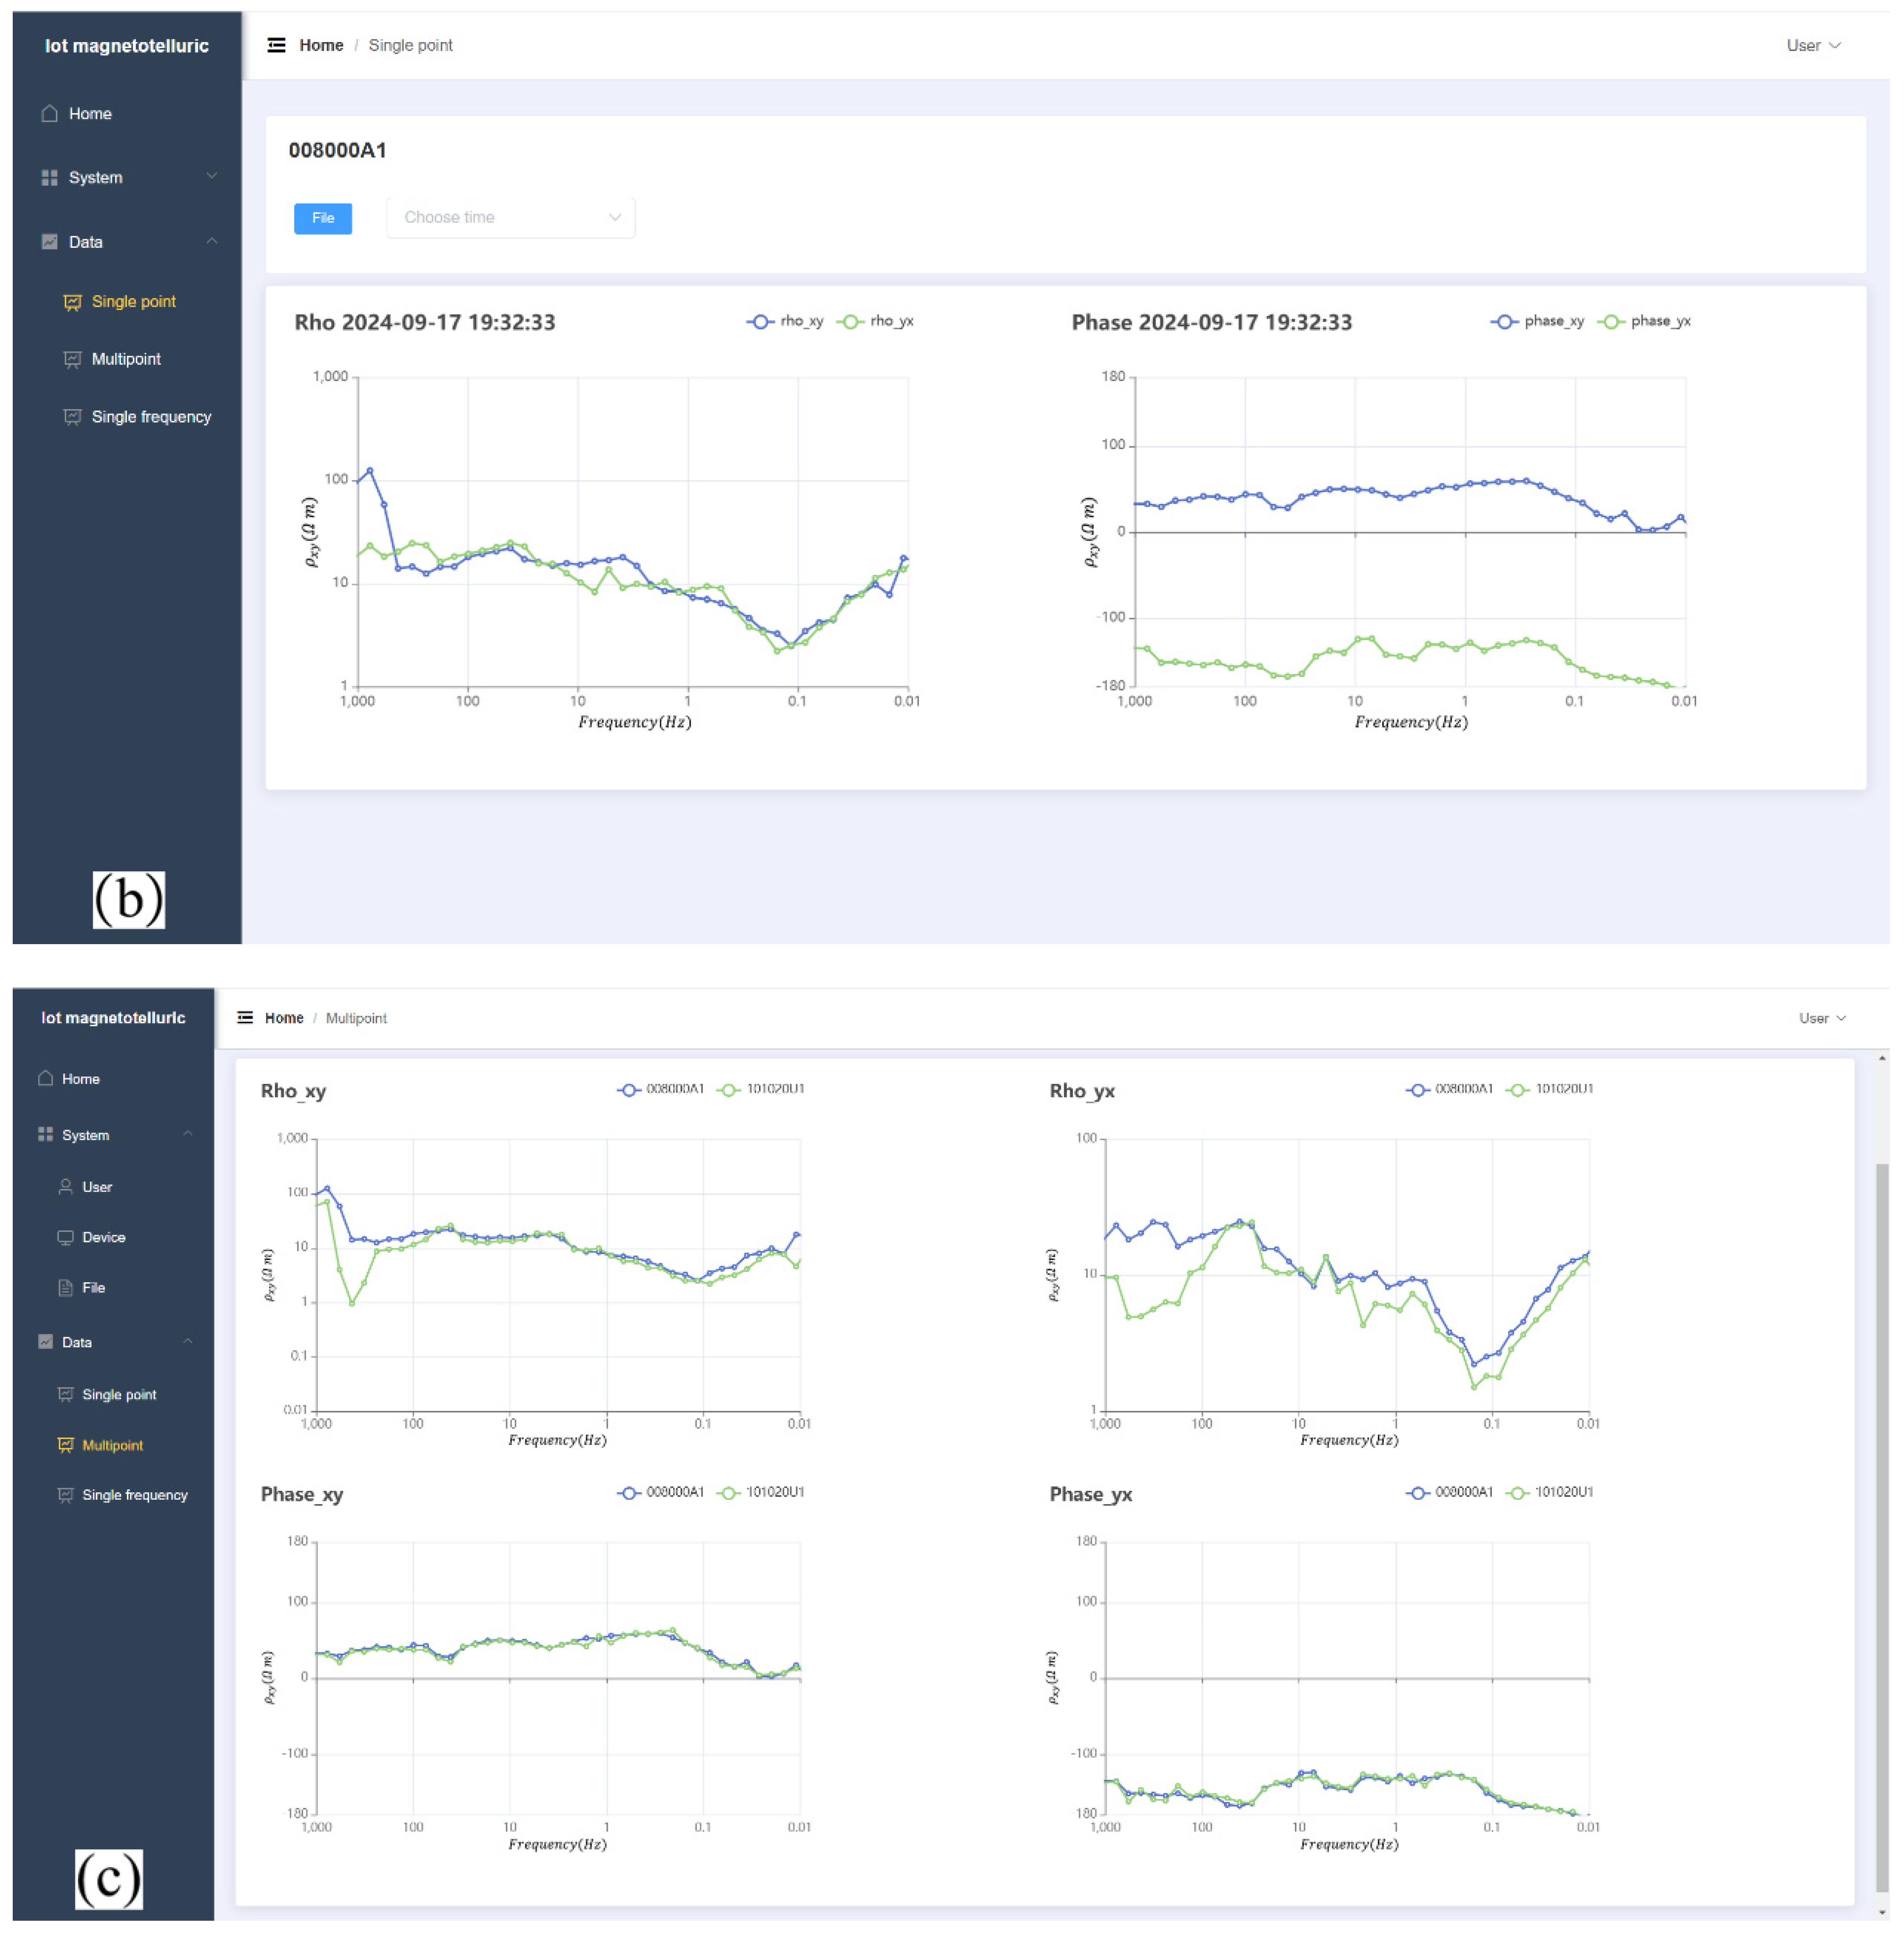
6.3. Cloud Platform Testing

A series of acquisition tests were carried out on the acquisition control system at Bazhou Oil Base in Hebei Province. Data were collected for 6 to 20 h at 20 different measurement points to observe and record the functions of the cloud platform. Table 4 shows that all functions of the cloud platform were working normally.
A screenshot of the cloud platform in operation is shown in Figure 24. During data collection, the platform automatically performs impedance estimation. Users can view the real-time impedance status through the web client and configure scheduled monitoring for specific time periods. Additionally, the collected data can be downloaded directly via the web interface. Throughout testing, the monitoring functions demonstrated a low error rate with stable system performance.

6.4. Inversion Results

We selected the measuring points of the geothermal injection wells in the CNPC base to form a line and carried out a preliminary inversion; the preliminary inversion results of the MT line are shown in Figure 25. From the preliminary inversion results, the geomagnetic data reflected the electrical results of the subsurface well, which was in line with the local stratigraphic data.

7. Conclusions

This study successfully developed an magnetotelluric signal acquisition and monitoring system based on an IoT cloud platform. Through hardware and software co-optimization, efficient acquisition, processing, and cloud management of magnetotelluric signals were achieved. In the hardware design, FPGA and DSP collaborative control, combined with lightning protection, ESD protection, and multi-band processing functions, significantly improved the system’s anti-interference capability and stability. The integration of the embedded subsystem and IoT module supports multiple network protocols, ensuring real-time data transmission and remote control. On the software side, the layered architecture design enhanced the system’s scalability and maintainability. The cloud platform backend, built on the Spring Boot framework, achieved data storage, processing, and visualization functions. The test results showed that the system performed well in stress testing, with good concurrent processing capability. The consistency testing verified the system’s data acquisition accuracy, and that the cloud platform functions ran stably with a low error rate.
The cloud-based geomagnetic monitoring system is of great scientific significance, as it significantly improves the temporal and spatial resolution of geophysical exploration and research efficiency through real-time data aggregation and intelligent analysis capabilities. The cloud-based collaborative computing that can be developed in the future will be able to support global research teams in sharing data and carrying out joint inversion, which provides a technical foundation for geophysical big data.
In our tests, we used a simpler monitoring structure, but the concurrency of our instrumentation will grow as the servers are updated, so it will gradually become a large volume system. In the future, this system will be applied to geothermal monitoring. Future research can further optimize anti-interference algorithms for high-frequency signal processing, expand the scale of the test scenarios, and explore the application of AI technology in automatic data analysis and anomaly detection to further enhance the system’s intelligence level and application scope.

Author Contributions

Conceptualization, R.C.; methodology, R.C.; software, Q.L.; validation, Q.L. and H.Y.; formal analysis, Q.L.; investigation, Q.L.; data acquisition and processing, W.S. and X.M.; writing—original draft preparation, Q.L.; writing—review and editing, R.C.; supervision, R.C.; project administration, H.Y.; funding acquisition, W.S. and X.M. All authors have read and agreed to the published version of the manuscript.

Funding

This research was funded by the Scientific Research and Technology Development Project of the China National Petroleum Corporation under the project “Research on Key Technologies for the Development and Utilization of Geothermal Resources” (project number 2021DJ5502).

Institutional Review Board Statement

Not applicable.

Informed Consent Statement

Not applicable.

Data Availability Statement

Data are contained within the article; further inquiries can be directed to the corresponding author.

Acknowledgments

We would like to thank Bureau of Geophysical Prospecting Inc., China National Petroleum Corporation, for providing the test site and financial support.

Conflicts of Interest

The authors declare that they have no known competing financial interests or personal relationships that could have appeared to influence the work reported in this paper. Weibin Sun and Xiaoli Mi are employees of China National Petroleum Corporation. The authors declare that this study received funding from China National Petroleum Corporation. The funder had no role in the design of the study; in the collection, analysis, or interpretation of data, in the writing of the manuscript, or in the decision to publish the results.

References

  1. Kearey, P.; Brooks, M.; Hill, I. An Introduction to Geophysical Exploration; John Wiley & Sons: Hoboken, NJ, USA, 2002; Volume 4. [Google Scholar]
  2. Kana, J.D.; Djongyang, N.; Raïdandi, D.; Nouck, P.N.; Dadjé, A. A review of geophysical methods for geothermal exploration. Renew. Sustain. Energy Rev. 2015, 44, 87–95. [Google Scholar] [CrossRef]
  3. Chalikakis, K.; Plagnes, V.; Guerin, R.; Valois, R.; Bosch, F.P. Contribution of geophysical methods to karst-system exploration: An overview. Hydrogeol. J. 2011, 19, 1169. [Google Scholar] [CrossRef]
  4. Bogoslovsky, V.A.; Ogilvy, A.A. Geophysical methods for the investigation of landslides. Geophysics 1977, 42, 562–571. [Google Scholar] [CrossRef]
  5. Zhdanov, M.S. Geophysical Electromagnetic Theory and Methods; Elsevier: Amsterdam, The Netherlands, 2009; Volume 43. [Google Scholar]
  6. Thiede, A.; Ramotoroko, C.D.; Junge, A. Combined multivariate MT Processing for MTU (Phoenix) and ADU (Metronix) Measurement Systems. In 28. Schmucker-Weidelt-Kolloquium für Elektromagnetische Tiefenforschung; Deutsche Geophysikalische Gesellschaft e. V.: Kiel, Germany, 2020; pp. 58–65. [Google Scholar]
  7. Rais, A.M.; Nur, A.P.; Tricahyaningati, D. Android Real Time Earthquake & Tsunami Warning Alert System Based on Open Data of Indonesia Government Agency of Geophysics. IOP Conf. Ser. Earth Environ. Sci. 2022, 1095, 012008. [Google Scholar]
  8. Salaree, A.; Stein, S.; Saloor, N.; Elling, R. Turn your smartphone into a geophysics lab. Astron. Geophys. 2017, 58, 6–35. [Google Scholar] [CrossRef]
  9. Fortunato, M.; Ravanelli, M.; Mazzoni, A. Real-time geophysical applications with Android GNSS raw measurements. Remote Sens. 2019, 11, 2113. [Google Scholar] [CrossRef]
  10. Muliyati, D.; Julianti, V.; Mihada, R.; Karentia, A. Augmented reality application design on geophysical encyclopedia for Android smartphones. AIP Conf. Proc. 2021, 2320, 020033. [Google Scholar]
  11. Wen, S.S.; Tang, J.T.; Pei, J.; Jiang, Q.Y.; Zhang, B.M.; Li, G. Research and implementation of wide field electromagnetic receiver acquisition monitoring software based on android platform. Prog. Geophys. 2018, 33, 866–873. [Google Scholar]
  12. Liu, S.Y.; Zhang, Q.S.; Zhang, Q.M.; Qiao, S.Q.; Yan, S.C.; Li, W.H.; Guo, F.; Wang, Y.Q.; Heng, X.; Ke, Z.; et al. Research and implementation of distributed wireless microseismic acquisition station placement and monitoring software based on Android platform. Prog. Geophys. 2020, 35, 331–338. [Google Scholar]
  13. Zhang, Q.; Qiao, S.; Zhang, Q.; Liu, S. Design and implementation of the detection software of a wireless microseismic acquisition station based on the Android platform. Geosci. Instrum. Methods Data Syst. 2021, 10, 91–100. [Google Scholar] [CrossRef]
  14. Li, B.; Xu, Q.; Liu, T.X.; Cheng, Q.; Tang, M.G.; Zheng, G.; Lei, H. Development of data acquisition software for electromagnetic instruments in landslide detection. Appl. Geophys. 2024, 21, 133–146. [Google Scholar] [CrossRef]
  15. Peng, X.; Chun, S.; Su, B.; Chen, R.; Hou, S.; Xu, C.; Zhang, H. Design of Three-Dimensional Electrical Impedance Tomography System for Rock Samples. Appl. Sci. 2024, 14, 1671. [Google Scholar] [CrossRef]
  16. Lü, Q.; Zhang, X.; Tang, J.; Jin, S.; Liang, L.; Niu, J.; Zhao, J. Review on advancement in technology and equipment of geophysical exploration for metallic deposits in China. Chin. J. Geophys. 2019, 62, 3629–3664. [Google Scholar]
  17. Liu, H.F.; Luo, Z.C.; Hu, Z.K.; Yang, S.Q.; Tu, L.C.; Zhou, Z.B.; Kraft, M. A review of high-performance MEMS sensors for resource exploration and geophysical applications. Pet. Sci. 2022, 19, 2631–2648. [Google Scholar] [CrossRef]
  18. Chun, S.; Wang, F.; Chen, R.; Shen, R.; Peng, X.; Xu, C.; Yin, H. Development of transient electromagnetic transmitter based on SiC MOSFET for high-resolution near-surface. Prog. Geophys. 2025, 40, 358–371. [Google Scholar]
  19. Dimililer, K.; Dindar, H.; Al-Turjman, F. Deep learning, machine learning and internet of things in geophysical engineering applications: An overview. Microprocess. Microsyst. 2021, 80, 103613. [Google Scholar] [CrossRef]
  20. Madakam, S.; Ramaswamy, R.; Tripathi, S. Internet of Things (IoT): A literature review. J. Comput. Commun. 2015, 3, 164–173. [Google Scholar] [CrossRef]
  21. Gokhale, P.; Bhat, O.; Bhat, S. Introduction to IOT. Int. Adv. Res. J. Sci. Eng. Technol. 2018, 5, 41–44. [Google Scholar]
  22. Aziz, T.; Koo, I. A Comprehensive Review of Indoor Localization Techniques and Applications in Various Sectors. Appl. Sci. 2025, 15, 1544. [Google Scholar] [CrossRef]
  23. Kim, G.; Shin, J.; Won, J.; Park, J. Cloud-Based Internet-of-Things System for Long-Term Bridge Bearing Monitoring Using Computer Vision. Appl. Sci. 2025, 15, 1622. [Google Scholar] [CrossRef]
  24. Zohourian, A.; Dadkhah, S.; Neto, E.C.P.; Mahdikhani, H.; Danso, P.K.; Molyneaux, H.; Ghorbani, A.A. IoT Zigbee device security: A comprehensive review. Internet Things 2023, 22, 100791. [Google Scholar] [CrossRef]
  25. Aldin, H.N.S.; Ghods, M.R.; Nayebipour, F.; Torshiz, M.N. A comprehensive review of energy harvesting and routing strategies for IoT sensors sustainability and communication technology. Sens. Int. 2024, 5, 100258. [Google Scholar] [CrossRef]
  26. Li, W.; Zhang, Q.; Zhang, Q.; Guo, F.; Qiao, S.; Liu, S.; Heng, X. Development of a distributed hybrid seismic–electrical data acquisition system based on the Narrowband Internet of Things (NB-IoT) technology. Geosci. Instrum. Methods Data Syst. 2019, 8, 177–186. [Google Scholar] [CrossRef]
  27. Zhou, K.; Zhang, Q.; Liu, Y.; Wu, Z.; Lin, Z.; Zhao, B.; Li, P. Internet-of-things-based four-dimensional high-density electrical instrument for geophysical prospecting. Geosci. Instrum. Methods Data Syst. 2021, 10, 141–151. [Google Scholar] [CrossRef]
  28. Unogwu, O.J.; Hiran, K.K.; Doshi, R.; Dadhich, M. Integrating InSAR, GNSS, IoT, 5G, and Cybersecurity for Earthquakes/Tremor Monitoring and Forecasting in Abuja, Nigeria. In 5G, Cybersecurity and Privacy in Developing Countries; River Publishers: Aalborg, Denmark, 2022; pp. 195–209. [Google Scholar]
  29. Indukala, P.K.; Gosh, U.G.; Ramesh, M.V. IoT-Driven Microseismic Sensing System and Monitoring Platform for Landslide Detection. IEEE Access 2024, 12, 97787–97805. [Google Scholar] [CrossRef]
  30. Aleem, A.; Ryan Sprott, C. Let me in the cloud: Analysis of the benefit and risk assessment of cloud platform. J. Financ. Crime 2012, 20, 6–24. [Google Scholar] [CrossRef]
  31. Ray, P.P. A survey of IoT cloud platforms. Future Comput. Inform. J. 2016, 1, 35–46. [Google Scholar] [CrossRef]
  32. Gvishiani, A.D.; Dobrovolsky, M.N.; Dzeranov, B.V.; Dzeboev, B.A. Big data in geophysics and other earth sciences. Izv. Phys. Solid. Earth 2022, 58, 1–29. [Google Scholar] [CrossRef]
  33. Serrano, N.; Gallardo, G.; Hernantes, J. Infrastructure as a service and cloud technologies. IEEE Softw. 2015, 32, 30–36. [Google Scholar] [CrossRef]
  34. Versteeg, R.; Johnson, D.; Henrie, A.; Johnson, T. Cloud based electrical geophysical monitoring. In Proceedings of the Symposium on the Application of Geophysics to Engineering and Environmental Problems 2014, Boston, MA, USA, 16–20 March 2014; Society of Exploration Geophysicists and Environment and Engineering Geophysical Society: Houston, TX, USA, 2014; pp. 149–154. [Google Scholar]
  35. Müller, R.D.; Qin, X.; Sandwell, D.T.; Dutkiewicz, A.; Williams, S.E.; Flament, N.; Seton, M. The GPlates portal: Cloud-based interactive 3D visualization of global geophysical and geological data in a web browser. PLoS ONE 2016, 11, e0150883. [Google Scholar] [CrossRef]
  36. Strack, K.M.; Martinez, Y.L.; Passalacqua, H.; Xu, X. Cloud-Based Array Electromagnetics Contributing to Zero Carbon Footprint. In Proceedings of the Offshore Technology Conference (OTC 2022), Houston, TX, USA, 2–5 May 2022. D021S028R004. [Google Scholar]
  37. Zhu, W.; Hou, A.B.; Yang, R.; Datta, A.; Mousavi, S.M.; Ellsworth, W.L.; Beroza, G.C. QuakeFlow: A scalable machine-learning-based earthquake monitoring workflow with cloud computing. Geophys. J. Int. 2023, 232, 684–693. [Google Scholar] [CrossRef]
  38. Huebert, J.; Eaton, E.; Beggan, C.D. Developing a New Ground Electric Field Model for the UK Based on Long-Period Magnetotelluric Data for the SWIMMR N4 (SAGE) Framework; British Geological Survey: Edinburgh, UK, 2024. [Google Scholar]
  39. Park, C.H.; Shim, B.O.; Park, J.W. Open-source IoT monitoring system of a shallow geothermal system for heating and cooling year-round in Korea. Energy 2022, 250, 123782. [Google Scholar] [CrossRef]
  40. Prauzek, M.; Kucova, T.; Konecny, J.; Adamikova, M.; Gaiova, K.; Mikus, M.; Koziorek, J. Iot sensor challenges for geothermal energy installations monitoring: A survey. Sensors 2023, 23, 5577. [Google Scholar] [CrossRef] [PubMed]
  41. Dasmen, R.N.; Saputra, M.A. The IOT-Based Hydrogen Sulfide Monitoring at PT. Pertamina Geothermal Energy on Lumut Balai Area. Tech-E 2023, 7, 32–42. [Google Scholar] [CrossRef]
Figure 1. Design of the IoT-based magnetotelluric signal acquisition and monitoring system.
Applsci 15 05598 g001
Figure 2. Information flow of the IoT magnetotelluric monitoring system.
Applsci 15 05598 g002
Figure 3. Block diagram of the magnetotelluric monitoring receiver.
Applsci 15 05598 g003
Figure 4. Block diagram of the signal conditioning circuit in the magnetotelluric monitoring receiver.
Applsci 15 05598 g004
Figure 5. Block diagram of the embedded subsystem in the magnetotelluric monitoring receiver.
Applsci 15 05598 g005
Figure 6. Signal acquisition circuit board of the magnetotelluric monitoring receiver.
Applsci 15 05598 g006
Figure 7. Embedded system circuit board of the magnetotelluric monitoring receiver.
Applsci 15 05598 g007
Figure 8. IoT module network configuration page.
Applsci 15 05598 g008
Figure 9. Structural design of the acquisition software.
Applsci 15 05598 g009
Figure 10. Structural design of the control software.
Applsci 15 05598 g010
Figure 11. Structural diagram of the communication module.
Applsci 15 05598 g011
Figure 12. Overall design of the cloud platform backend.
Applsci 15 05598 g012
Figure 13. Backend workflow.
Applsci 15 05598 g013
Figure 14. Hierarchical structure of Spring Boot development.
Applsci 15 05598 g014
Figure 15. Function diagram of the Controller layer.
Applsci 15 05598 g015
Figure 16. File download workflow in the Controller layer.
Applsci 15 05598 g016
Figure 17. File upload workflow in the Controller layer.
Applsci 15 05598 g017
Figure 18. Overall workflow of the data communication module.
Applsci 15 05598 g018
Figure 19. Socket communication process between the cloud platform and instrument.
Applsci 15 05598 g019
Figure 20. Program logic of the cloud platform’s Socket communication.
Applsci 15 05598 g020
Figure 21. Cloud platform-based acquisition and monitoring system equipment. (a) Full set of equipment; (b) acquisition equipment and IoT module during acquisition.
Applsci 15 05598 g021
Figure 22. Consistency test site in Bazhou, Hebei (a) (red circle on the right indicates the four base areas (b)).
Applsci 15 05598 g022
Figure 23. Consistency test results: (a) impedance results; (b) phase Results.
Applsci 15 05598 g023
Figure 24. Cloud platform interface display: (a) cloud platform backend file management interface; (b) cloud platform backend single-point monitoring interface; (c) cloud platform backend multi-point monitoring interface.
Applsci 15 05598 g024aApplsci 15 05598 g024b
Figure 25. Preliminary inversion results.
Applsci 15 05598 g025
Table 1. Cloud platform server parameters.
CPUInternal StoragePeak BandwidthOperating System
Two-core4 GiB5 Mbit/sCentOS 8.2 64 bit
Table 2. Cloud platform server test results.
ConcurrencyAverage Delay (ms)Average RPSSuccess Rate
207.12572.2599.99%
10031.622813.2199.64%
20065.892715.0299.11%
500174.562614.7097.97%
Table 3. Equipment error comparison (all data in the table are error values).
DeviceRxyRyxPxyPyx
MTU-5A13.4616.721.752.18
CMT13.4616.721.752.18
Table 4. External connection test structure.
Number of PointsMinimum TimeMaximum TimeError Rate
206 h20 h0%
Disclaimer/Publisher’s Note: The statements, opinions and data contained in all publications are solely those of the individual author(s) and contributor(s) and not of MDPI and/or the editor(s). MDPI and/or the editor(s) disclaim responsibility for any injury to people or property resulting from any ideas, methods, instructions or products referred to in the content.

