Article

Nitrogen Metabolism in Two Flor Yeast Strains at Mid-Second Bottle Fermentation in Sparkling Wine Production

by
Juan Carlos García-García
1,
Miguel E. G-García
2,
Juan Carbonero-Pacheco
1,
Inés M. Santos-Dueñas
3,
Juan Carlos Mauricio
1,*,
María Trinidad Alcalá-Jiménez
1,
Juan Moreno
1 and
Teresa García-Martínez
1
1
Department of Agricultural Chemistry, Edaphology and Microbiology, Agrifood Campus of International Excellence CeiA3, University of Córdoba, 14014 Córdoba, Spain
2
Department of Cell Biology, Physiology and Immunology, University of Córdoba, 14014 Córdoba, Spain
3
Department of Inorganic Chemistry and Chemical Engineering, Agrifood Campus of International Excellence CeiA3, Nano Chemistry Institute (IUNAN), University of Córdoba, 14014 Córdoba, Spain
*
Author to whom correspondence should be addressed.
Appl. Sci. 2025, 15(10), 5579; https://doi.org/10.3390/app15105579
Submission received: 27 March 2025 / Revised: 5 May 2025 / Accepted: 13 May 2025 / Published: 16 May 2025
(This article belongs to the Special Issue Wine Technology and Sensory Analysis)

Abstract

:
This study investigates nitrogen metabolism during the middle of the second fermentation in stopped bottles of sparkling wine, focusing on two flor Saccharomyces cerevisiae yeast strains (G1 and N62) isolated from the velum of biologically aged wine. Nitrogen compounds, including amino acids, biogenic amines, and ammonium chloride, were quantified, revealing strain-specific differences in nitrogen utilization and production. Proteomic analysis identified 1053 proteins, with 127 showing significant differences between strains. Strain G1 demonstrated enhanced cell wall remodeling and prioritized nitrogen conservation via arginine and lysine biosynthesis, while strain N62 exhibited increased translational activity and alternative carbon utilization pathways. Notably, strain N62 produced higher concentrations of biogenic amines (putrescine and tyramine), likely due to its greater decarboxylation capacity. Principal Component Analysis (PCA) highlighted clear differentiation in the nitrogen compound profiles across the base wine and wines inoculated with the two strains. The proteome of strain N62 showed increased mitochondrial activity and TCA cycle involvement, facilitating faster fermentation (27 days vs. 52 days for G1), growth (46 × 106 cells/mL vs. 21 × 106 cells/mL for G1) and cell viability (4 × 10⁶ cells/mL vs. 0.7 × 10⁶ cells/mL for G1). These findings suggest that yeast strain selection significantly influences nitrogen metabolism and potentially aroma profiles and and fermentation dynamics in sparkling wine production. Understanding these metabolic adaptations provides valuable insights for optimizing yeast performance to enhance wine quality and preserve regional characteristics.

1. Introduction

The industrial production of sparkling wines involves two sequential stages. The first consists of fermenting the sugars in grape must, producing a base wine. The second stage consists of fermenting the base wine in a stopped bottle and aging (traditional method). The traditional method of sparkling wine production presents a unique biochemical challenge for Saccharomyces cerevisiae, requiring yeast to conduct alcoholic fermentation in extreme conditions of high ethanol (10–12% v/v), elevated CO₂ pressure (5–6 bar), and nitrogen limitation in sealed bottles. Therefore, nitrogen metabolism plays a crucial role in sparkling wine production during the second fermentation in the bottle. Amino acids, key components of this process, significantly influence the composition, quality, and sensory characteristics of sparkling wines [1]. These organic compounds impact various aspects of wine production and aging, from fermentation to the development of complex flavor profiles [2]. Sparkling wines contain various amino acids, with L-alanine, L-glutamic acid, L-lysine, L-arginine, L-phenylalanine, L-valine, and glycine being particularly prevalent [3]. The protein content and specific amino acids (L-arginine, L-asparagine, L-histidine, and L-tyrosine) are significantly correlated with foam stability [4,5]. The amino acid composition of sparkling wines is influenced by factors such as grape variety, maturity, winemaking techniques, and aging processes [6]. During fermentation, amino acids serve as essential nutrients for yeast, contributing to the production of volatile compounds that shape the wine’s aroma profile [7,8]. As sparkling wines age, particularly those produced using the traditional method, amino acids participate in various chemical reactions, including the Maillard reaction, which generates compounds associated with desirable sensory attributes such as bready, roasted, and caramel notes [2,9]. Other important compounds associated with nitrogen metabolism are biogenic amines. Biogenic amines are detrimental to health and originate in food, mainly from the decarboxylation of the corresponding amino acid and the transamination of aldehydes and ketones [10]. Biogenic amines play a complex role in the flavor profile of sparkling wines as a flavor influence, aroma influence, concentration variation, and due to their aging effects. During aging, the concentration of some biogenic amines may increase, which can influence the evolution of flavors over time.
Several enzymes are involved in the catabolism and synthesis of amino acids in wine: decarboxylases (catalyze the decarboxylation of amino acids, leading to the formation of biogenic amines), transaminases (play a role in the interconversion of amino acids involved in reamination reactions), proteases (break down proteins into peptides and amino acids through enzymatic hydrolysis), Ehrlich pathway enzymes (crucial for the catabolism of aromatic amino acids, involving transaminases, decarboxylases, and dehydrogenases), glutamate dehydrogenase (involved in the incorporation of ammonia into glutamate), glutamine synthetase (catalyzes the formation of glutamine from glutamate and ammonia, playing a role in nitrogen assimilation), and sulfur amino acid metabolism enzymes (active during the second fermentation, involving the metabolism of methionine and cysteine) [1]. The activity of these enzymes can be influenced by various factors, including yeast strain, fermentation conditions, and nitrogen availability. Understanding and manipulating these enzymatic processes can help winemakers to modulate the amino acid profile and, consequently, the sensory qualities of the wine [7].
The aim of this work is to characterize strain-specific nitrogen metabolism strategies during second fermentation and to establish the relationships between nitrogen utilization, protein expression, and fermentation performance in the two tested flor yeast strains. These yeast strains were isolated from biologically aged wines, with the aim of using native yeast strains together with the traditional Pedro Ximénez grape variety from the Montilla-Moriles region, in order to preserve the unique character of the region in the production of new sparkling wines [11,12]. Significant differences were found in the metabolism of nitrogen compounds between the two flor yeast strains tested, which could influence the aroma composition and foam of the wines produced.

2. Materials and Methods

2.1. Yeast Strains and Acclimation Process

Two different strains of flor yeast (Saccharomyces cerevisiae G1 and N62), previously selected for their suitability for sparkling wine production, were used to start the base wine. They were isolated from the flor velum of fine wines undergoing biological aging at Pérez Barquero winery (Protected Designation of Origin, PDO Montilla-Moriles, Cordoba, Spain).
The G1 strain is the first flor yeast strain on the market for the production of high-quality sparkling wines, and we consider it in the present work as a control for a new flor strain (N62), selected for its specific characteristics for potential use in sparkling wine production, such as flocculation, tolerance to high ethanol concentrations, faster fermentation kinetics, and β-glucosidase positivity, which are valuable for improving wine aroma complexity.
Total yeast cell counts were performed using a Thoma counting chamber. Cell viability was assessed by plating 100 μL aliquots of appropriately diluted cell suspensions onto YPD agar plates (1% yeast extract, 2% peptone, 2% dextrose, and 2% agar). The plates were incubated, and colony-forming units were counted. All determinations were conducted in triplicate.
The acclimatization of yeast cells can affect their fitness and viability and determine the successful completion of the secondary fermentation of sparkling wine [13]. These yeasts were acclimatized according to García-García et al. [14].

2.2. Sparkling Wine Production

The base wine was provided by the Pérez Barquero company. The autochthonous white grape variety used for the base wine was Pedro Ximénez, with a composition as follows: glucose and fructose 0.55 g/L; density 0.9994 g/mL; pH 3.08; 10.01% v/v ethanol; total acidity of 5.30 g/L as tartaric acid; free sulfur dioxide 11 mg; and total sulfur 75 mg. Sparkling wines were produced with the base wine using the traditional method. First, 0.72 g/L of DAP, 24 g/L of sucrose, and an inoculum of 1.5 × 10⁶ cells/mL of each yeast strain was added to 750 mL of base wine in bottle. The bottles were sealed with a stopper and a crown cap. These were placed in a conditioning chamber (12 ± 1 °C and 75% humidity). The second fermentation was monitored via changes in the endogenous pressure of CO2, using an internal aphrometer (Oenotilus, Station Oenotechnique de Champagne, Epernay, France). When the pressure reached 3 bars, three bottles were collected for each yeast (three biological replicates), at which point the added sucrose was half consumed. Strain G1 reached 3 bars of pressure at 52 days and strain N62 at 27 days.

2.3. Nitrogenous Compound Analysis

The quantification of amino acids, biogenic amines, and ammonium chloride was performed via high-performance liquid chromatography using an adapted derivatization methodology with diethyl ethoxymethylenemalonate (DEEMM) (Sigma-Aldrich; St. Louis, MO, USA), following the protocol described by Gómez-Alonso et al. [15]. Samples were collected in triplicate in 2 mL Eppendorf tubes and stored at −20 °C prior to analysis. The derivatization process involved mixing 0.250 mL of untreated sample with methanol (0.500–0.750 mL), 1 M of borate buffer at pH 9 (0.750–1.75 mL), L-2-aminoadipic acid (1 g/L) as internal standard (0.020–0.050 mL), Milli-Q water (0.250 mL, when applicable), and the DEEMM reagent (0.003 mL). The mixture was subjected to ultrasonication for 30 min followed by heating at 70 °C for 2 h. Analysis was carried out using an Agilent HPLC 1260 Infinity system (Palo Alto; Santa Clara, CA, USA) equipped with an ACE C18-HL column (250 mm × 4.6 mm, 5 μm particle size) thermostated at 16 °C, employing a binary gradient of mobile phases A and B, as detailed by Gómez-Alonso et al. [15]. The detection of analytes was achieved using a photodiode array detector set at a wavelength of 280 nm.

2.4. Proteomic Analysis

2.4.1. Protein Extraction

Yeast cells from each sample (from a bottle) were centrifuged at 4500× g for 10 min at 4 °C. The resulting pellets were washed twice with cold sterile distilled water through homogenization and centrifugation at 16,000× g for 1 min at 4 °C. The yeast pellets were then resuspended in 600 μL of an extraction buffer containing 100 mM of Tris-HCl, 1 mM of EDTA, 2 mM of DTT, a pH of 8.0, and one protease inhibitor tablet. Glass beads with a diameter of 500 μm were added to the suspension in a 1:1 ratio. The mixture was mechanically disrupted using a Vibro-gen Cell Mill V6 for 1 min, followed by 1 min on ice, repeating this process at least eight times. After discarding the glass beads via centrifugation at 7000× g for 10 min at 4 °C, the cell debris was removed through a second centrifugation at 16,000× g for 25 min. Proteins were precipitated overnight at −20 °C using ice-cold 10% (w/v) TCA–acetone–DTT. The samples were cleaned with ice-cold acetone–DTT, vacuum dried, and then resuspended in 500 μL of solubilization buffer consisting of 8 M urea, 20 mM of DTT, and 2% CHAPS. The pellets were centrifuged at 15,000× g for 15 min at 4 °C. To ensure thorough mixing, the samples underwent four cycles of vortexing for 1 min followed by 1 min on ice. Finally, the protein concentration in the supernatant was determined using Bradford assays.

2.4.2. LC-MS/MS Analysis

Proteins (at least 50 μg) from each sample were injected for LC-MS/MS analysis at the SCAI, University of Córdoba (Spain). Proteins were separated using 1 D SDS-PAGE at 10% polyacrylamide and next, the bands were faded via protein digestion by applying 200 mM of ammonium bicarbonate (AB) with 50% and 100% acetonitrile for 15 and 5 min, respectively. Afterwards, an alkylation process was carried out, followed by proteolytic digestion being performed using 12.5 ng/μL of trypsin (Promega, Madison, WI, USA) in 25 mM of AB. Upon the completion of incubation at 37 °C overnight, the digestion process was stopped by adding 1% trifluoroacetic acid, and the digested samples were dried in a SpeedVac™.
Using a Dionex Ultimate 3000 nano UHPLC system (Thermo Fisher Scientific, Boston, MA, USA), Nano LC analyses were performed with an Acclaim Pepmap C18 separation column, 500 mm × 0.075 mm (Thermo Fisher Scientific, Boston, MA, USA). For further details of the procedure, see García-García et al. [14].

2.4.3. Protein Identification via Database Search

The raw mass spectrometry data were analyzed using Proteome Discoverer software (version 2.1.0.81, Thermo Fisher Scientific, Boston, MA, USA). The MS/MS spectra were interpreted with the SEQUEST algorithm against the UniProt database. Peptide searches from tryptic digestion were conducted under specific parameters: allowing up to one missed cleavage and setting cysteine carbamidomethylation as a fixed modification and methionine oxidation as a variable modification. Peptide spectral matches (PSMs) were validated using a false discovery rate (FDR) of 1% based on q-value calculations through the percolator algorithm. The quantification of peptides was achieved by measuring precursor ion areas using the Precursor Ion Area Detector, followed by normalization through the total peptide quantity mode in Proteome Discoverer. Protein grouping was performed according to the law of parsimony, with data filtered at an FDR threshold of 1%.

2.4.4. Statistical Procedures

Proteins obtained in at least 50% of some of the sample replicates were retained and plotted on a bar graph. The quantitative changes were checked at 3 bars of pressure for each sparkling wine.
One-way analysis of variance (ANOVA) was performed on amino acids, biogenic amines, ammonium ion, and proteins that were found in 100% of all samples, along with their quantification values, applying the homogeneity of variance test and using the q-value to apply multiple testing correction to the p-value < 0.05 and a fold change (FC) > 2. * mean q < 0.05; ** mean q < 0.01; *** mean q < 0.001; and **** mean q < 0.0001. The amino acid, biogenic amine, and ammonium ion results were subjected to Principal Component Analysis (PCA). MetaboAnalyst was used to create a heat map (nitrogen compounds and proteins) and PCA. Statistical analysis was used for the Prism 9.0 software’s (GraphPad Software, La Jolla, CA, USA) bar diagram, bubble plot, and bar plot. Three replicates were performed.
The biological processes and molecular function of protein groups were also studied by constructing protein–protein interaction network maps (INMs) using the STRING v12.0 database. A high confidence interaction (score = 0.7) was used, with an FDR < 0.05 as the significance value, and protein annotations were based on Gene Ontology databases.

3. Results

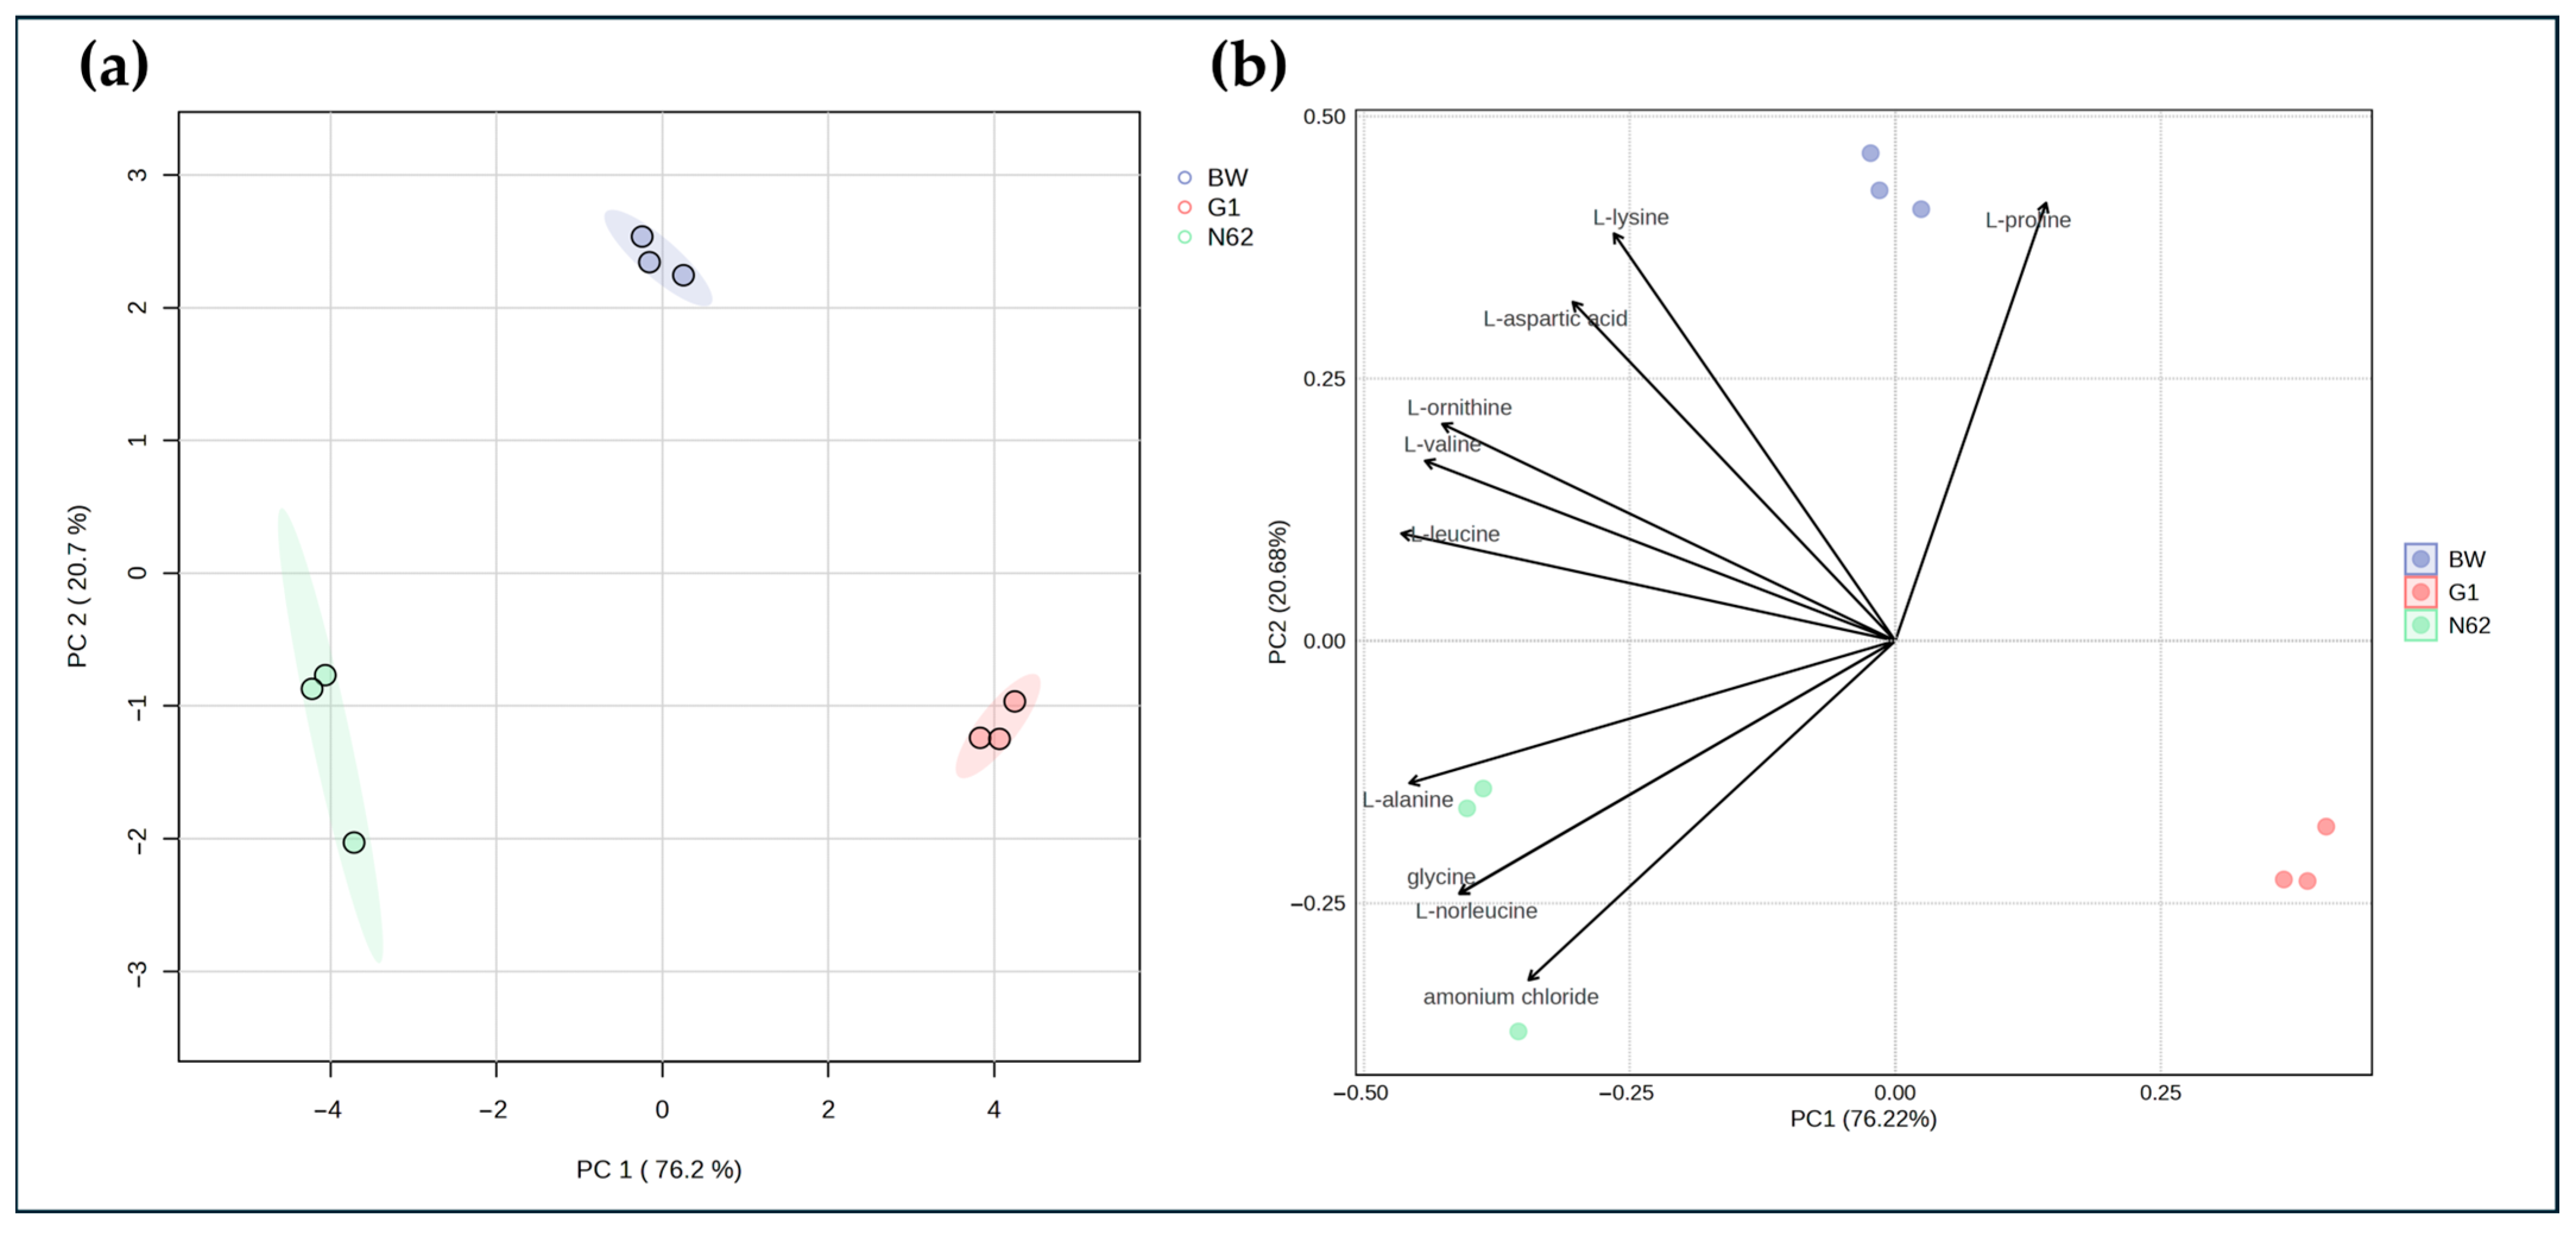
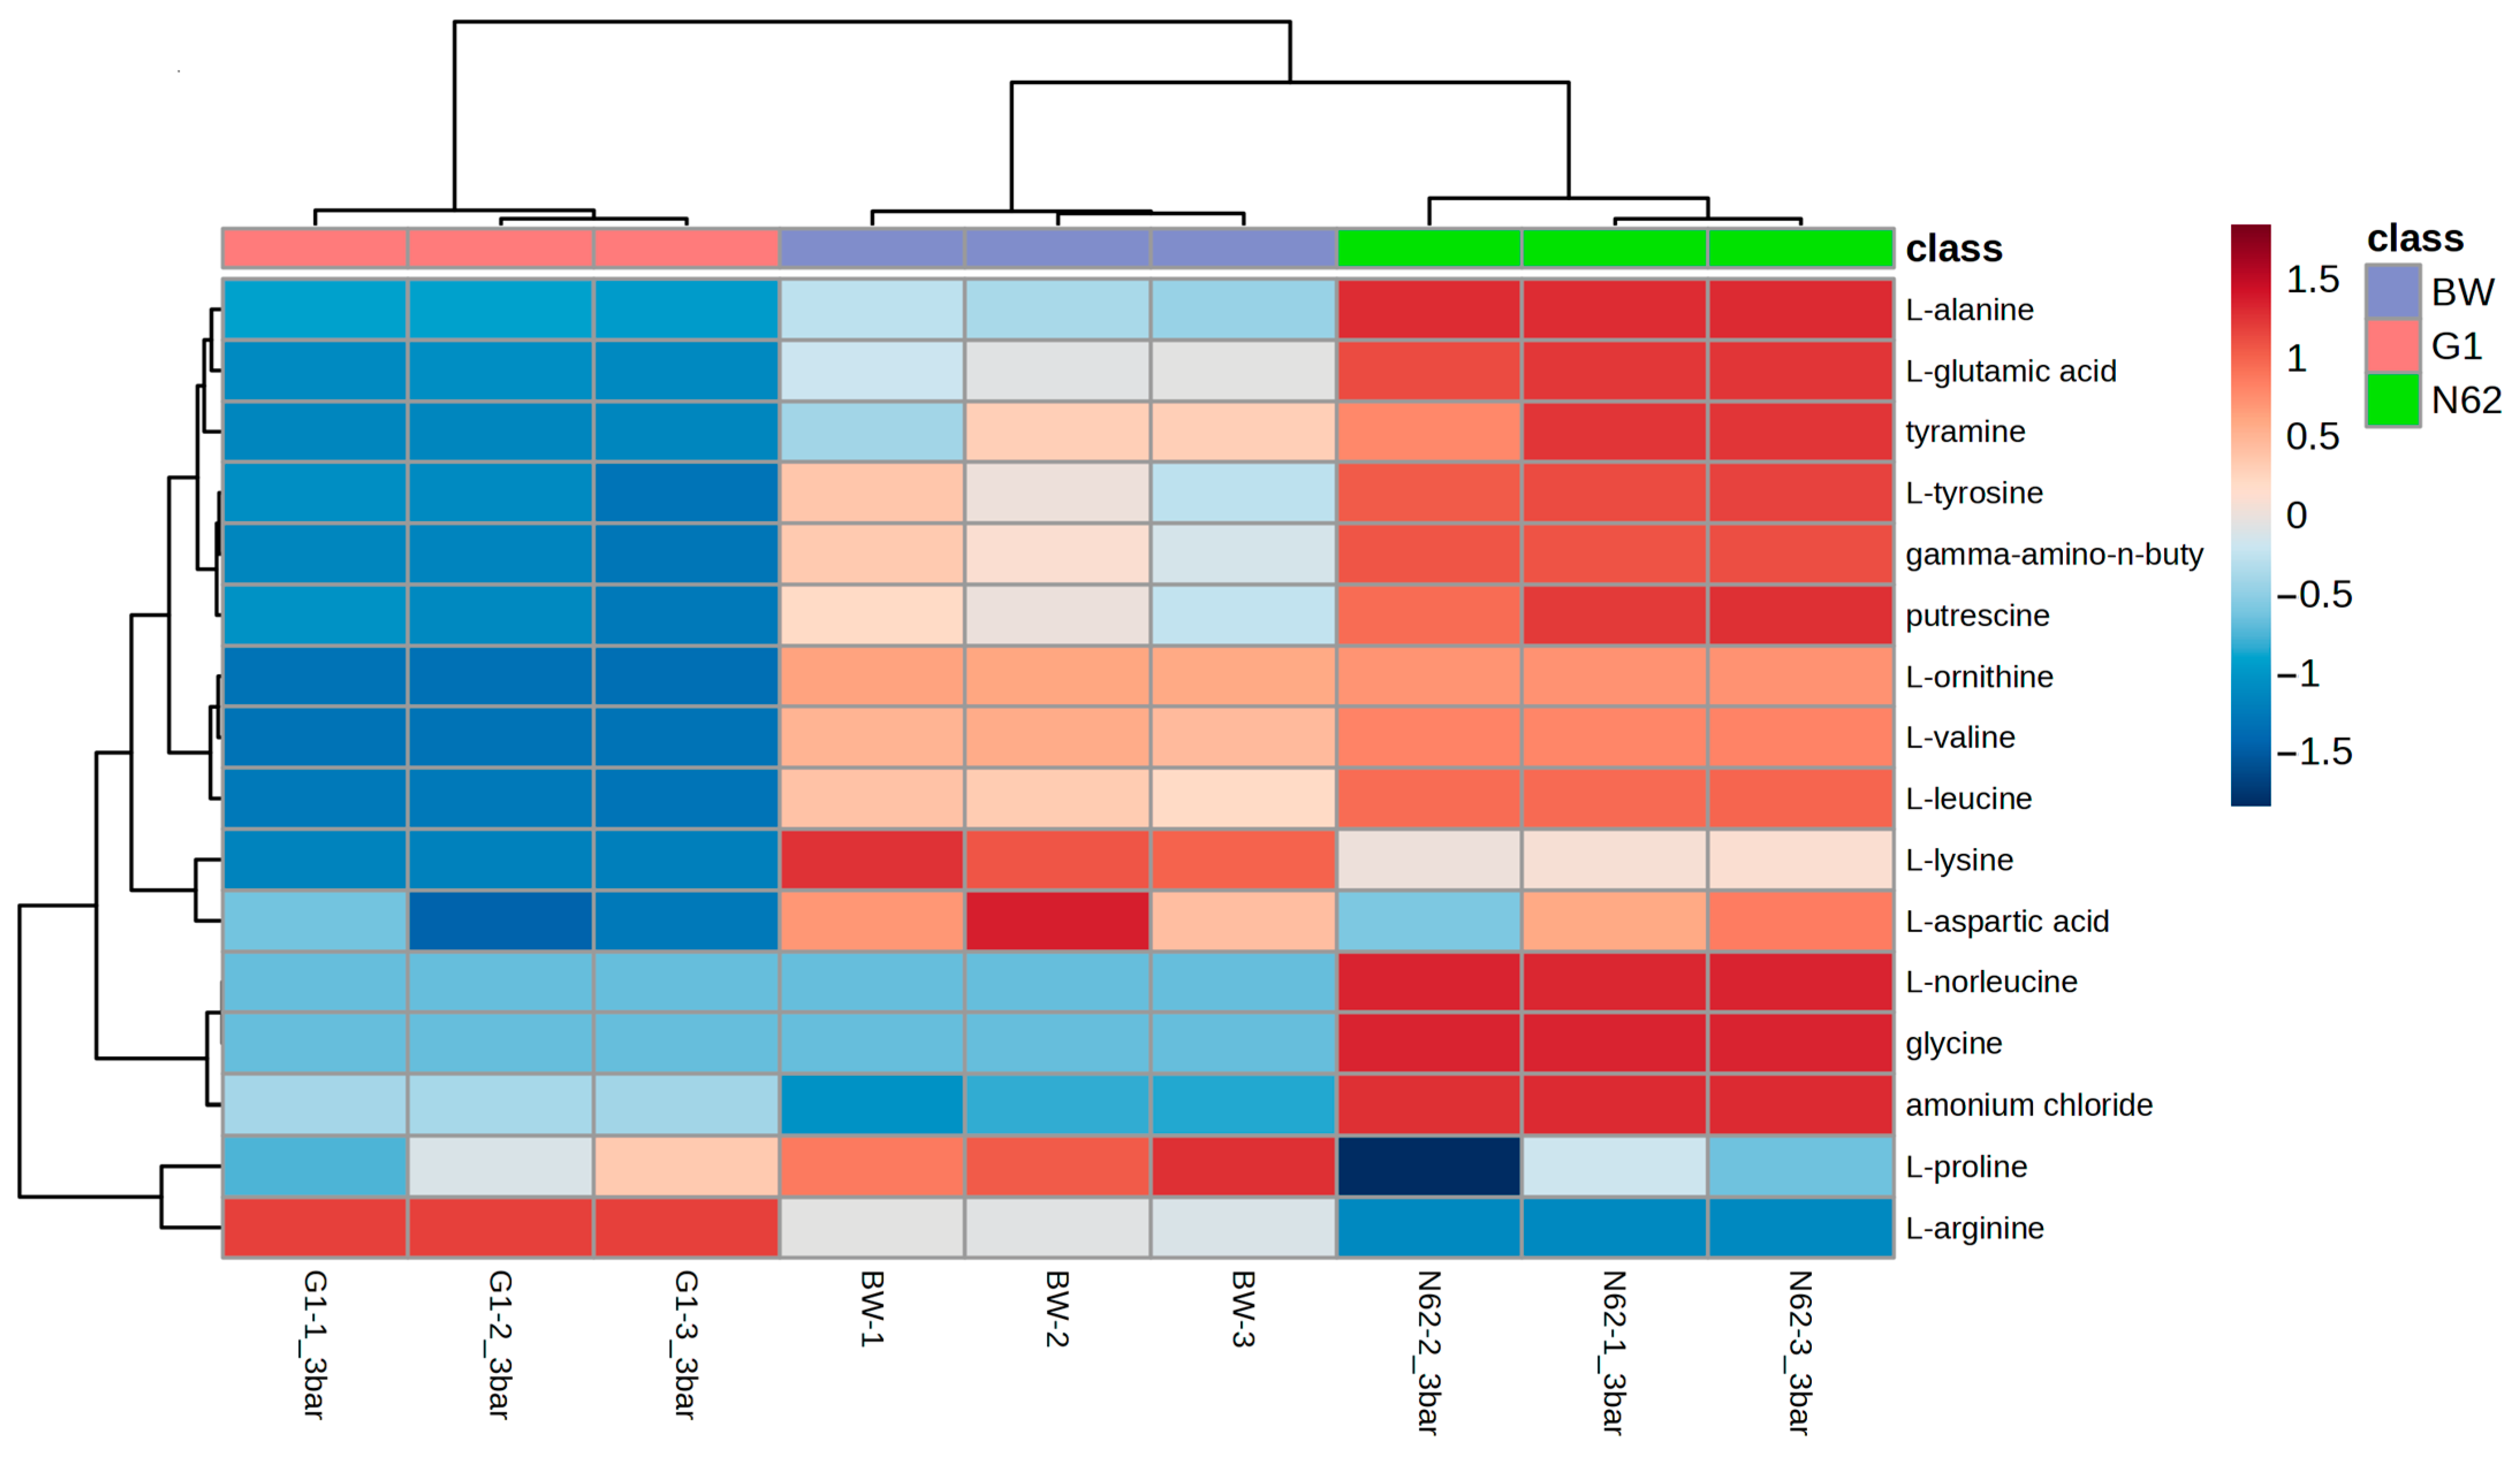
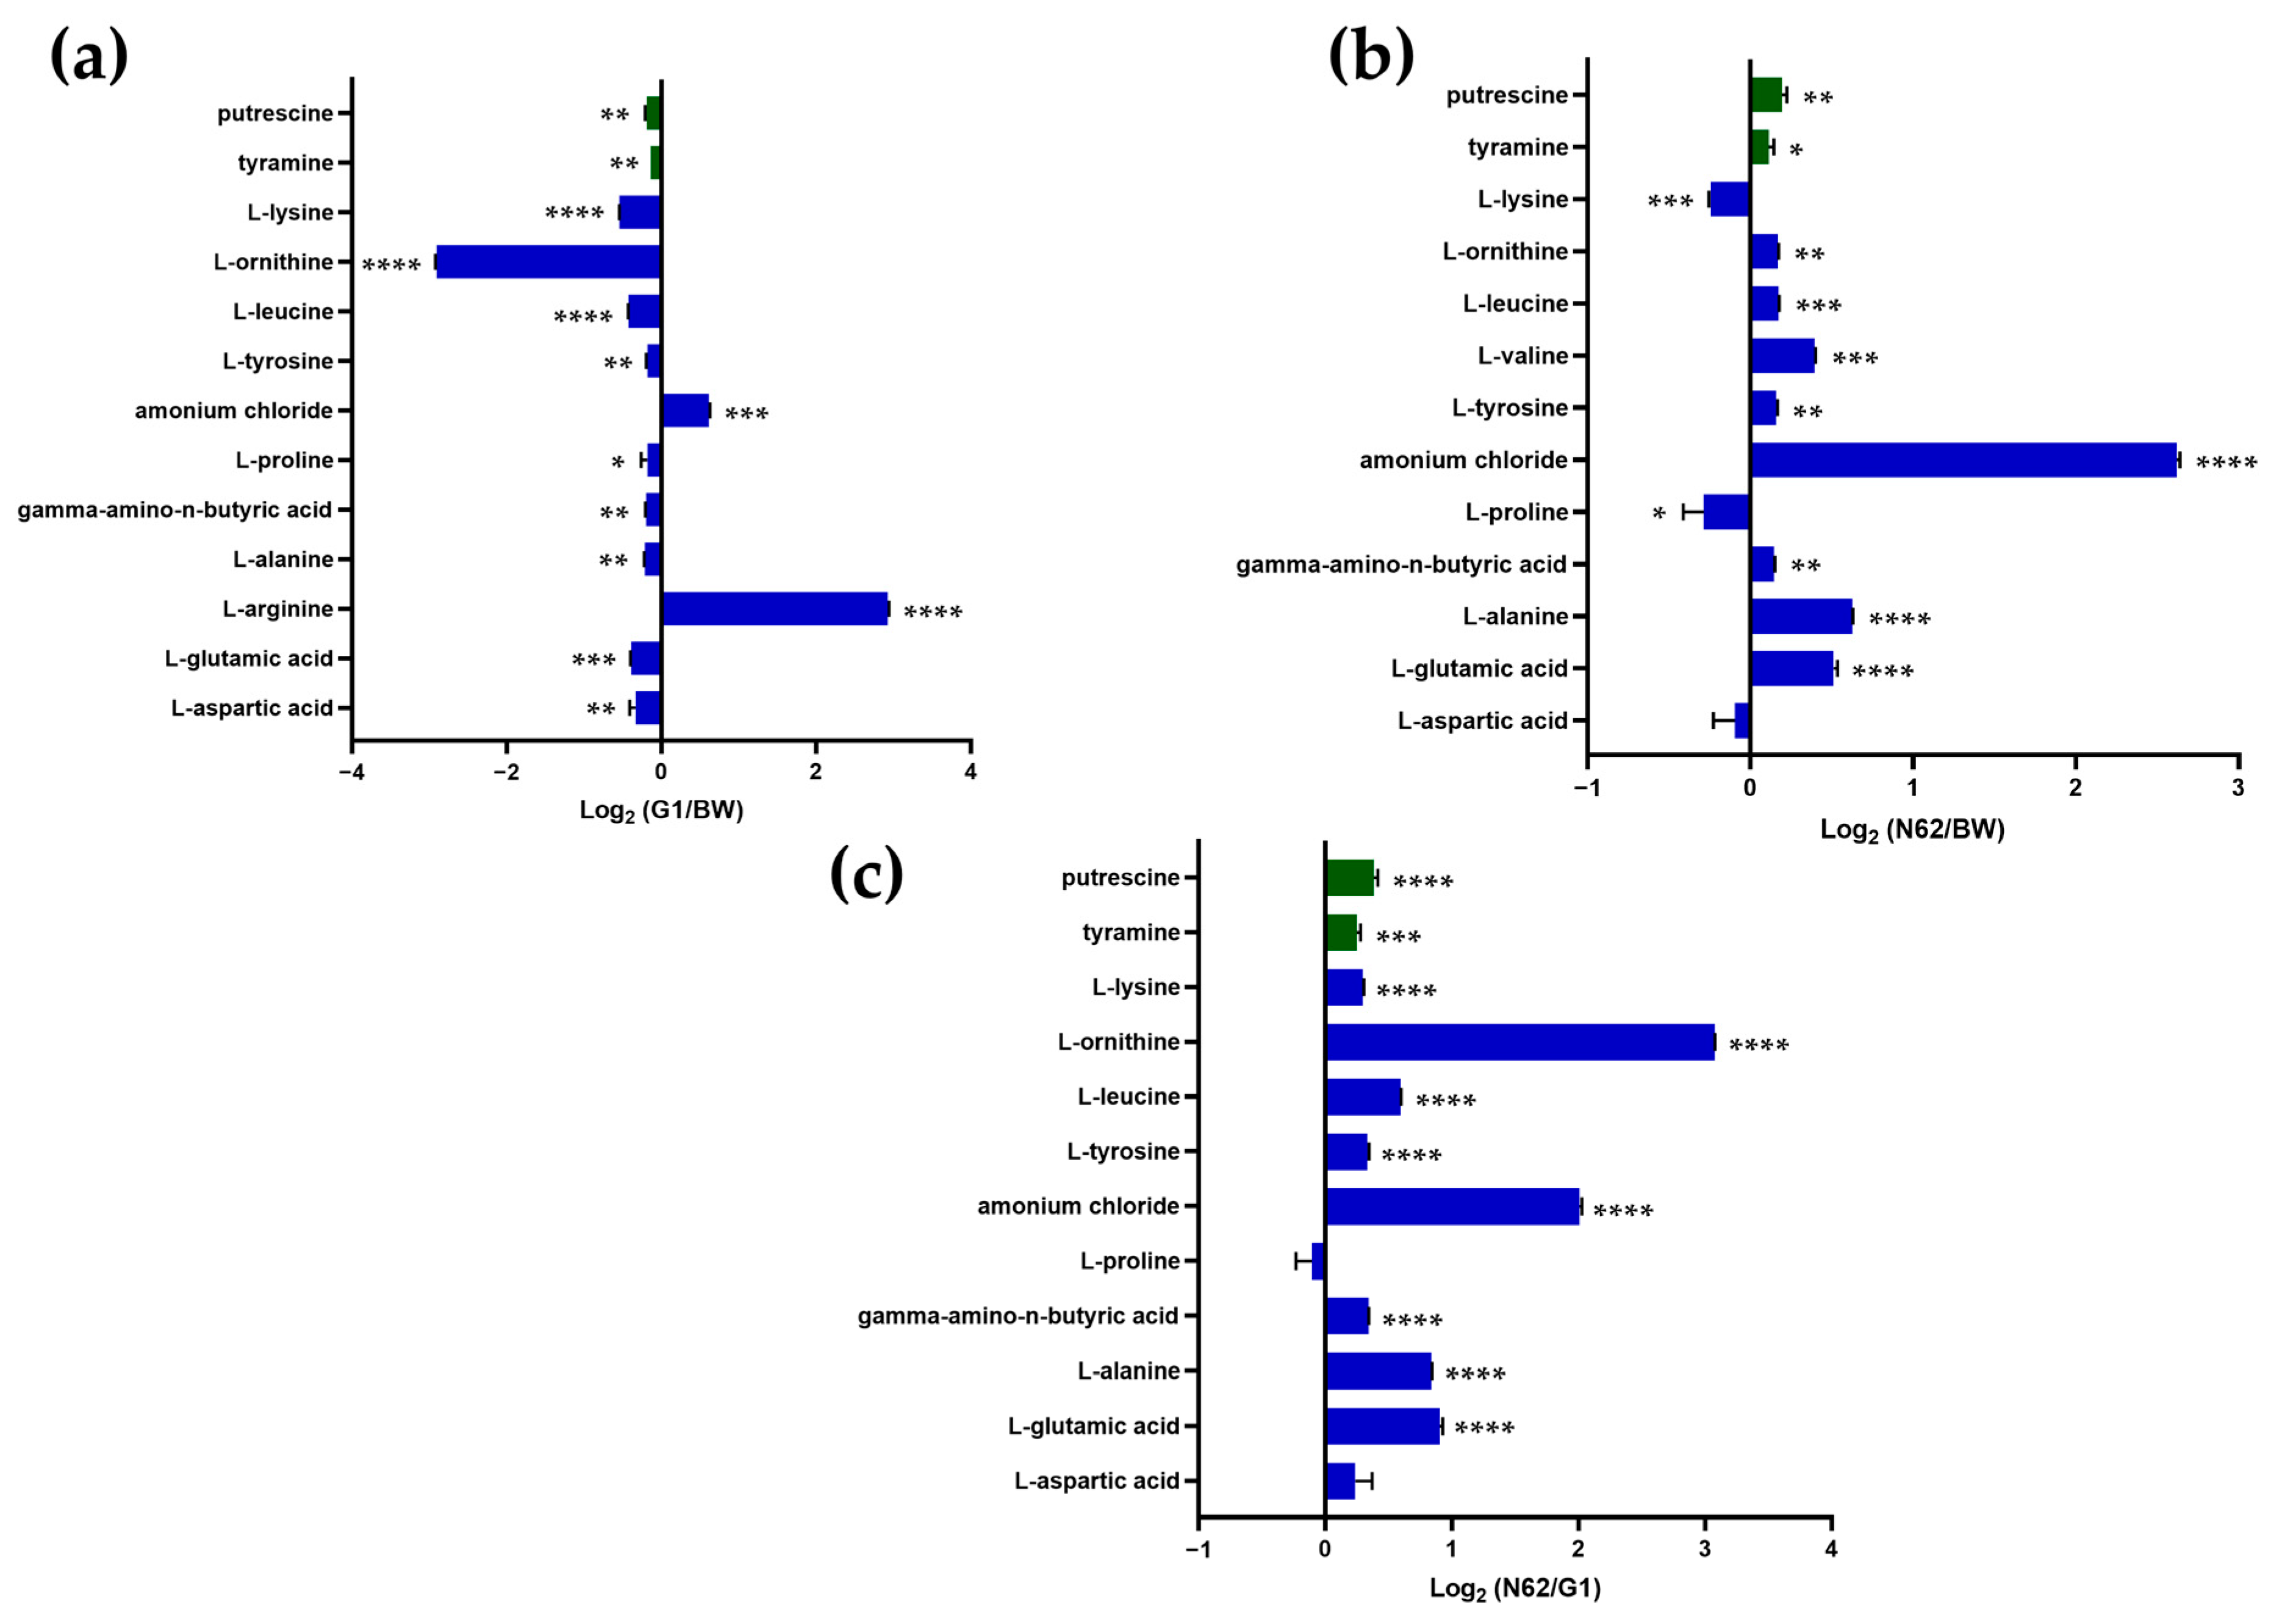
3.1. Comparison of the Nitrogen Compound Profiles of the Base Wine and Wines with Yeast Strains

First, some differences between the two strains should be noted, such as that fermentation was faster in N62 (27 days to reach three atmospheres compared to 52 days in G1), growth was higher in N62 (46 × 106 cells/mL versus 21 × 106 cells/mL in G1), and the cell viability was 4 × 10⁶ cells/mL versus 0.7 × 10⁶ cells/mL in the G1 strain.
The nitrogenous compounds—13 amino acids, two biogenic amines, and ammonium chloride—were identified and quantified in the samples of base wine (BW) and wines inoculated with the two yeast strains halfway through the second fermentation in a closed bottle in three atmospheres (The results are provided in the Supplementary Materials Table S1). Quantitative and qualitative differences in the nitrogen compounds have been found between the base wine and the inoculated wines, when compared. Glycine and L-norleucine are only found in wine inoculated with strain N62. L-valine was identified in this wine and in the base wine and, finally, L-arginine was only identified in the wine inoculated with strain G1 and in the base wine.
PCA was conducted to objectively assess the analysis of nitrogen metabolism. This is a statistical treatment in which variance is maximized and dimensionality is reduced (Figure 1a). This has been constructed from the matrix of the quantification data of nitrogenous compounds in different conditions. The results indicate a clear differentiation of the wines according to the PC1 and PC2 axes, and 96.90% of the total variance is explained in the three wines tested. Figure 1b, using a PCA biplot with the values of PC1 and PC2 as axes, shows that the nitrogenous compounds L-proline, L-lysine, and L-aspartic acid stood out in the base wine, and that ammonium ion, L-norleucine, glycine, and L-alanine stood out in the wine with strain N62, while the amino acids L-ornithine and L-valine decreased significantly in the wine inoculated with strain G1.
Figure 2 presents a heat map of the quantification data of the normalized nitrogen compounds of the three different wines. This graph illustrates how the triplicates of each sample are more similar to each other than to the rest of the samples. The data that have been obtained are consistent with what was previously shown. In the wine with strain G1, a quantification peak is detected for the amino acid L-arginine. In the base wine, high quantification of the amino acids L-lysine, L-aspartic acid, and L-proline is observed. Finally, in the wine with strain N62, greater quantification is shown for the rest of the nitrogen compounds.
Figure 3 illustrates the nitrogenous compounds that were found in all the replicates of the three samples. These were subjected to one-way analysis of variance (ANOVA) using the homogeneity of variance test, with a q-value < 0.05 and a log fold change (LFC). Figure 3a compares the nitrogenous compounds of the base wine and the wine made with the G1 strain. All of them showed significant differences; ammonium chloride and L-arginine are the most synthesized nitrogen compounds in the wine inoculated with the G1 strain, and in the rest, there was a higher concentration in the base wine sample. These data suggest that the G1 strain has consumed most of the nitrogen compounds. Figure 3b compares the nitrogen compounds of the base wine and the wine made with the N62 strain; all of them showed significant differences except one. L-lysine and L-proline were detected with higher concentrations in the base wine, and the rest were synthesized in the wine with strain N62. In this case, these findings may indicate that the wine with the N62 strain produced most of the nitrogenous compounds. Figure 3c compares the nitrogen compounds in the wine made with strain G1 and the wine made with strain N62. All showed significant differences, except for two. All of them were found to have increased, with a higher concentration in the elaborated wine with strain N62, which could indicate that this wine produced more nitrogen compounds than the other.

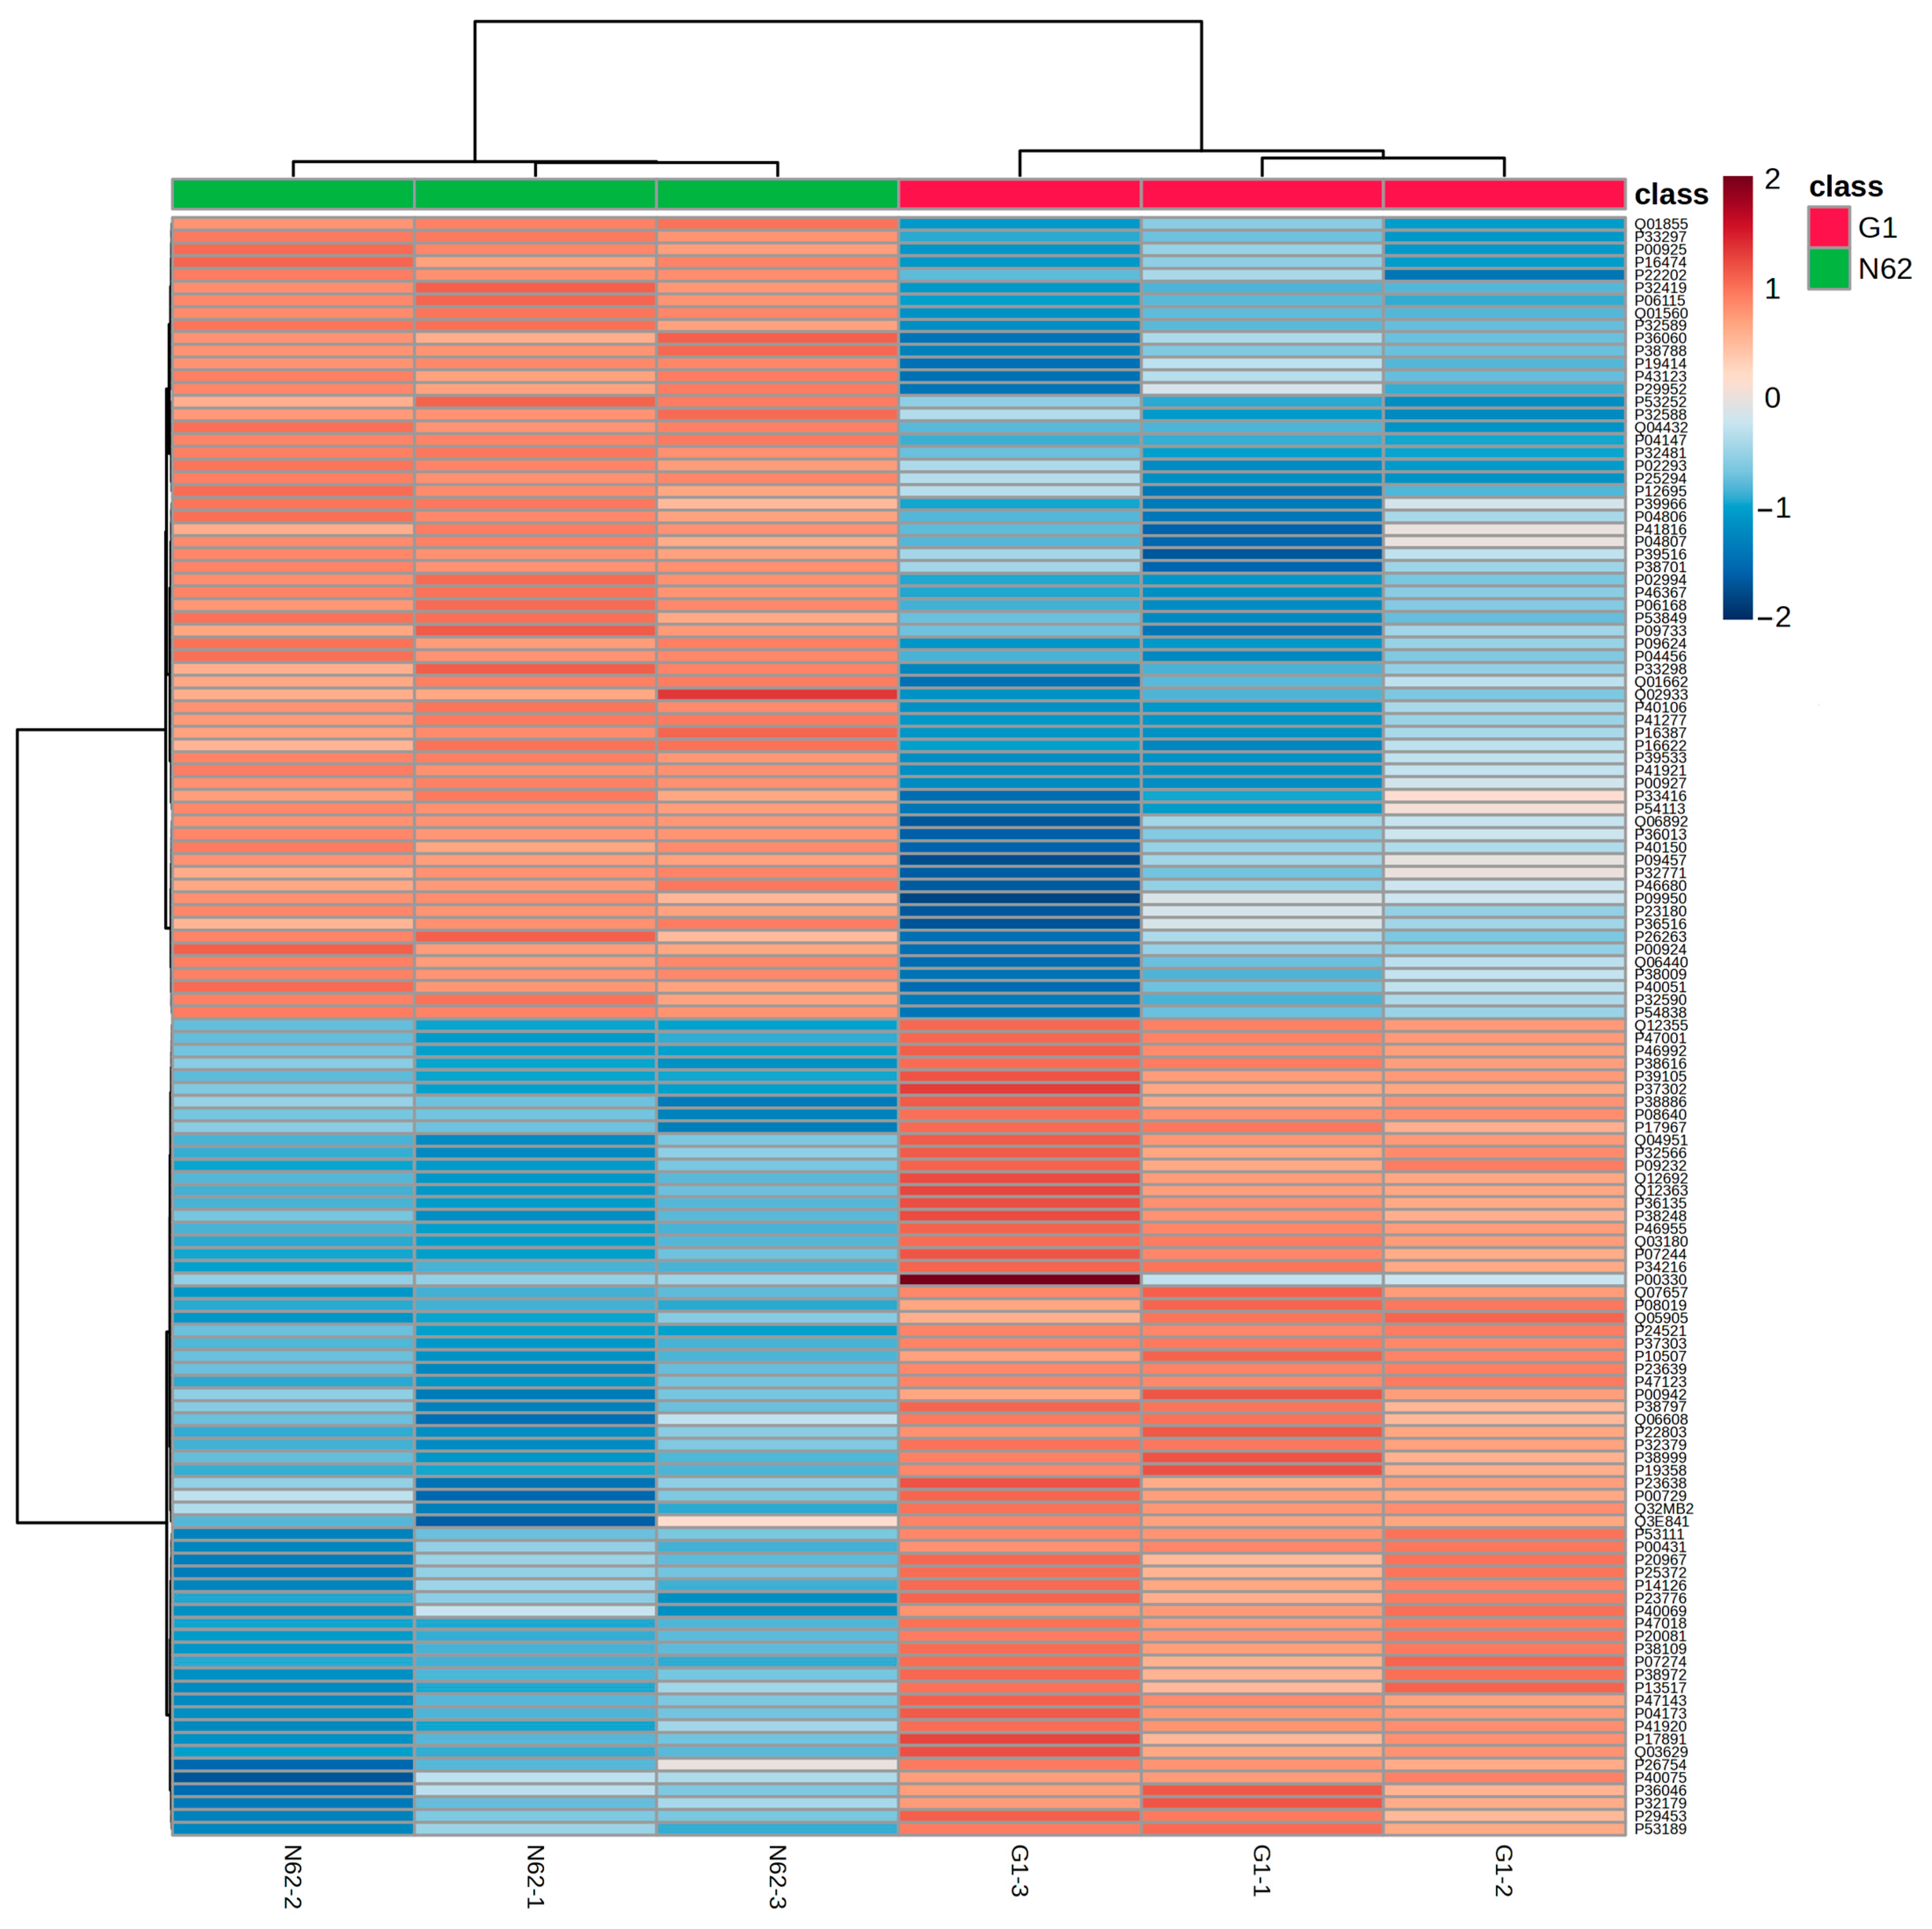
3.2. Comparison of the Proteomic Profiles of Two Yeast Strains at Three Bars of Pressure

A comparative proteomics study was conducted to examine and identify the protein profiles in two distinct strains of Saccharomyces cerevisiae flor yeast. The strains, designated as G1 and N62, were individually cultured in bottle conditions simulating secondary fermentation. The base wine used for this experiment was derived from the Pedro Ximénez grape variety from the Montilla-Moriles region. The research aimed to elucidate the proteomic differences between these two flor yeast strains in specific fermentation conditions.

3.2.1. Qualitative Proteomic Analysis

The proteomic analysis yielded a comprehensive dataset of 1053 distinct proteins (The results are provided in the Supplementary Materials Table S2). Among these, 921 proteins were consistently detected in at least half of the experimental replicates, indicating their reliability. Further examination revealed that 767 proteins were present in both yeast strains, demonstrating significant overlap in their proteomes. Interestingly, strain-specific proteins were also identified: 133 unique proteins were found exclusively in strain N62, while 21 proteins were detected only in strain G1. These findings highlight the proteomic differences between the two strains and suggest potential strain-specific adaptations and functions.

3.2.2. One-Way Analysis of Variance (ANOVA) of Proteins

Of the 767 proteins common to both strains, 574 proteins were found in 100% of all G1 and N62 replicates. In total, 127 proteins exceeded the statistical cut-off (q < 0.05) and showed statistical differences in the quantification values according to the one-way ANOVA and HSD Tukey tests. As a result of the statistical cut-off, 64 proteins were found with significant differences upwards for the G1 strain and 63 proteins were found with significant differences upwards for the N62 strain, as shown in Figure 4.
Some of the proteins that presented significant differences for the G1 strain were as follows: EXG1 is a glucanase that is responsible for maintaining the cell wall, integrating mannoproteins, and binding beta-glucan; LYS9 is part of the lysine biosynthetic pathway; NCA3 is involved in the organization of mitochondria; ERG8 intervenes in the ergosterol biosynthesis pathway; GLY1 catalyzes the cleavage of L-allo-threonine and L-threonine into glycine and acetaldehyde; and KGD1 is involved in the tricarboxylic acid (TCA) cycle.
Some of the 63 proteins with significant differences for strain N62 were as follows: ENO1 catalyzes the conversion of 2-phosphoglycerate to phosphoenolpyruvate; TEF2 delivers aminoacyl-tRNA to the A-site of ribosomes during protein biosynthesis; ILV5 is involved in the biosynthesis of branched-chain amino acids; MDH3 catalyzes the interconversion of malate and oxaloacetate and participates in the glyoxylate cycle; PDA1 catalyzes the direct oxidative decarboxylation of pyruvate to acetyl-CoA and CO2; PDC6 decarboxylates pyruvate to acetaldehyde and CO2, and also participates in the catabolism of amino acids; ACO2 catalyzes the reversible dehydration of (R)-homocitrate to cis-homoaconitate, a step in the alpha-aminoadipate pathway for lysine biosynthesis; ICP55 cleaves preprotein intermediates carrying N-ter amino acid residues important for the stabilization of the mitochondrial proteome; and the MRPL3 component of the mitochondrial ribosome involved in the translation of protein synthesis is encoded by the mitochondrial genome.

3.3. Interaction Between Proteins

Two protein–protein interaction analyses were carried out using the STRING v12.0 database (accessed on 27 January 2025). The first analysis was realized with proteins that showed significant quantitative differences for the G1 strain, together with specific proteins of this yeast, and the second, with proteins that showed significant differences for the N62 strain together with specific proteins of this yeast.
With the proteins upregulated and specific to the G1 strain, an Interaction Network Map (INM) could not be constructed for the “biological processes” option. Figure 5a exhibits that the most enriched molecular functions were threonine protease, the redox-active center, and the cell wall. Figure 5b shows an Interaction Network Map (43 edges; PPI enrichment p-value < 2.33 × 10⁻⁵). Related proteins were obtained with serine-type peptidase activity (green nodes), threonine protease activity (turquoise blue nodes), the redox-active center (ocher nodes), and another glycosidase (burgundy nodes). Some proteins are involved in the cell wall (violet nodes), isopeptide bond (dark gray nodes), and proteosome (light gray nodes), and have an undefined molecular function (grayish white nodes).
Figure 6a shows that the most significant biological processes were translation and cellular amide, peptide, and cellular nitrogen compound metabolic processes in strain N62. There is greater activity related to nitrogenous compounds in this strain than in G1. Also, Figure 6b displays an INM (1373 edges; PPI enrichment p-value < 1.0 × 10⁻¹⁶) presenting proteins associated with the organonitrogen compound metabolic process (blue nodes), cellular nitrogen compound metabolic process (green nodes), nitrogen compound metabolic process (yellow nodes), the citric acid (TCA) cycle (pink nodes), peptide metabolic process (red nodes), and undefined molecular function (grayish white nodes).

4. Discussion

The traditional method of making sparkling wine consists of a second fermentation in a closed bottle, which places the yeast in a harsh and hostile environment, with high ethanol concentrations and a lack of nitrogen sources, to which it has to adapt metabolically. The nitrogen fraction of wine consists mainly of amino acids. In this study, ammonium chloride, biogenic amines, and amino acids were identified and quantified (Table S1). The consumption and production of nitrogen compounds was different according to the strain; it is known that certain amino acids may be related to the maintenance of the redox potential of the cell [1,16]. The protein expression differences observed between the G1 and N62 yeast strains highlight distinct metabolic adaptations related to nitrogen utilization and resource allocation during fermentation. These differences are consistent with the established nitrogen metabolism regulation mechanisms in S. cerevisiae and shed light on strain-specific strategies for managing nitrogen [17,18,19,20].
In the case of S. cerevisiae G1, there is higher cell wall activity (Figure 6a,b), showing significant differences in several related proteins. The upregulation of EXG1 (exoglucanase), UTH1, YGP1, and CIS3 suggests enhanced cell wall remodeling, potentially to optimize the nutrient uptake efficiency in nitrogen-limited conditions [21]. This aligns with nitrogen stress responses, where vacuolar proteolysis increases to recycle nitrogen [19,21]. In addition, PRC1 is involved in phytochelatin synthesis and is a serine-type carboxypeptidase that degrades small peptides [22]. This protein, together with the vacuolar aminopeptidase, APE3 and vacuolar protease, PRB1, are related to each other, releasing peptides and the serine amino acid intracellularly [23]. In addition, significant differences have been found in lipid-related proteins. PLB1 hydrolyses the phospholipid [24] SCS2, which is related to the plasma membrane and phospholipid biosynthesis [25], and ERG8, which is involved in the ergosterol synthesis pathway [26], and according to the results of Gobert et al. [27], this biosynthesis favors nitrogen assimilation, as reflected in this strain (Figure 3a). The presence of LYS9 (lysine biosynthesis) and GLY1 (threonine cleavage) indicates prioritized nitrogen allocation to essential amino acid production [18,20]. NCA3’s role in mitochondrial organization and KGD1’s involvement in the TCA cycle highlight energy metabolism adjustments. In nitrogen limitations, mitochondrial proteome allocation often shifts to optimize ATP yield per unit of nitrogen. ERG8’s role in ergosterol biosynthesis may stabilize membranes during nitrogen stress, a response linked to TOR pathway modulation [28].
In S. cerevisiae N62, upregulated ENO1 (glycolysis) and MDH3 (glyoxylate cycle) suggest enhanced carbon flux toward anaplerotic pathways. This compensates for nitrogen scarcity by prioritizing acetyl-CoA production for biosynthesis, a strategy observed during carbon overflow metabolism [19]. TEF2 (the translation elongation factor) and ILV5 (branched-chain amino acid biosynthesis) indicate increased translational activity and nitrogen redistribution. Such responses are consistent with chromatin regulators like Ahc1p/Eaf3p, which globally upregulate nitrogen utilization pathways [17]. MRPL3 (the mitochondrial ribosome component) and ICP55 (mitochondrial proteome stabilization) reflect mitochondrial proteome restructuring under nitrogen stress, balancing energy demands with nitrogen availability. PDC6 and PDA1 upregulation highlights pyruvate metabolism redirection, potentially modulating carbon overflow dynamics to conserve nitrogen [29].
When a comparative analysis is performed, G1 prioritizes nitrogen conservation via arginine and lysine biosynthesis and cell wall maintenance, while N62 invests in translational machinery and alternative carbon utilization. These strategies mirror the proteome reallocations observed under nitrogen limitations. Differences in NCR-sensitive genes (e.g., ILV5 and LYS9) and TCA cycle proteins (KGD1 and ACO2) suggest the strain-specific modulation of the TOR and SPS sensing pathways. N62’s emphasis on glycolysis and amino acid transporters aligns with the nitrogen-efficient phenotypes suitable for biofuel production, while G1’s stress-responsive proteins (EXG1 and ERG8) may enhance robustness in nitrogen-poor environments.
Among the nitrogenous compounds studied in this work, only two biogenic amines were detected in the wines produced, namely putrescine and tyramine, the former being more abundant. Biogenic amines are produced via the decarboxylation of the corresponding amino acid precursors via yeast activity during alcoholic fermentation [10]. The precursors of putrescine (aliphatic biogenic amine) are the amino acids ornithine and arginine [30], and the precursor of tyramine (aromatic biogenic amine) is tyrosine [31]. The wines were made under the same conditions, with the same base wine, but with two different strains of S. cerevisiae, and the results showed that the wine made with strain N62 produced significantly higher concentrations of the two biogenic amines. Some of the reasons for this may be that this strain consumes L-arginine and has a higher decarboxylation capacity [32].
The tricarboxylic acid (TCA) cycle plays an important role in lipid synthesis, amino acid synthesis, and energy (ATP) production. It enables cell growth and is considered the metabolic backbone of the cell, and the glyoxylate cycle is considered an auxiliary pathway [33]. Several proteins with significant TCA-related differences were identified in strain N62. The proteins HXK1, HXK2, ENO1, and ENO2, which are responsible for the production of pyruvate, have been quantified with significant differences in this strain [34]. In particular, the two enolases form phosphoenolpyruvate, an intermediate in the tyrosine pathway [35], which also shows significant differences in this strain. In contrast, tyrosine can be catalyzed via the Ehrlich pathway to form α-ketoacids [36], as may occur in strain G1. Another way to synthesize pyruvate is through the conversion of the malate produced in TCA, with the protein responsible being MAE1 [37], which showed significant differences for strain N62.
L-leucine is an essential amino acid synthesized from pyruvate. As mentioned above, strain N62 is the yeast that would be producing more pyruvate, so this could explain the concentration of this amino acid found in this wine, as well as the significant differences with respect to the base wine and the wine inoculated with the other strain [38]. According to Gobert et al. [27], when there is a high nitrogen content in the base wine, a large percentage of L-leucine can be metabolized by the yeast, as the results have shown (Figure 3c) in strain G1. At the onset of fermentation, it would be incorporated significantly and could be used for protein synthesis [39]. L-alanine can be transformed from pyruvate and ammonia after the decarboxylation of aspartic acid [40]. The high availability of ammonium ion and the consumption of aspartic acid could explain the significantly different synthesis of this amino acid in the N62 strain. Valine is also generated from pyruvate via amination [41]. In strain G1, it was completely consumed for direct incorporation into proteins [42], but in wine inoculated with N62, quantitative differences were obtained with respect to the other strain and the base wine, which could be due to the fact that its biosynthetic pathway is very similar to that of alanine and leucine [41]. In addition, a protein, ILV5, was quantified with significant differences for this strain, which is involved in the L-valine synthesis pathway [43] and VAS1, a specific protein for strain N62 related to this amino acid [44] (Figure 7). The proteins that convert pyruvate to acetyl-CoA also showed significant differences; they are LAT1, LPD1, and PDA1 (see Figure 6b), all of which are positively regulated for the N62 strain. During this step, CO2 is generated, which can lead to increased oxaloacetate production [45]. This could also explain why the MDH3 protein, which is responsible for the interconversion of malate and oxaloacetate, also shows significant differences.
Glycine metabolism can contribute to the synthesis of protein [46]. This nitrogenous compound was only quantified in wine inoculated with strain N62. It can be formed from TCA [41], with one route of synthesis via the cleavage of threonine aldose, and another from glyoxylate by L-alanine glyoxylate aminotransferase [46]. In relation to this amino acid, the HEM1 protein, which catalyzes the synthesis of 5-aminolevulinate and CoA from succinyl-CoA and glycine, has been significantly quantified in this strain [47].
L-aspartic acid in G1 may be used as a nitrogen source. This nitrogenous compound is involved in the L-lysine synthesis pathway [33]. This last amino acid is usually one of the main sources of nitrogen at the beginning of fermentation [36], as it seems to occur in both strains, being formed from 2-oxoglutarate and acetyl-CoA. However, significant differences were found between the wines inoculated with both strains; N62 had a lower concentration, which could be due to the fact that in this strain, the proteins ACO1 and ACO2, which are important for TCA and could be involved in L-lysine synthesis [48],were positively regulated, whereas in G1, only one protein related to the L-lysine biosynthetic pathway, LYS9, was quantified with significant differences [49].
L-Glutamic acid is significantly consumed by G1; as shown in Figure 3a, it is part of TCA, and this compound could be used for arginine biosynthesis [42], producing succinic acid [50], which is related to a protein with significant differences with respect to TCA, in this strain. KGD1 (or OGDHC) is the rate-limiting enzyme within the TCA cycle, converting 2-oxoglutarate to succinyl-CoA, reducing NAD+ to NADH + H+, and producing CO2 [51]. OGDHC consists of three subunits: E1, 2-oxoglutarate dehydrogenase (OGDH), the E2 subunit dihydrolipoxylysine succinyltransferase (DLST), and E3, D-2-hydroxyglutarate pyruvate transhydrogenase (DLD) [52]. In the wine inoculated with N62, a significantly higher concentration of glutamic acid was found. This compound is formed from L-glutamate, and GLT1 has been identified as the specific protein of this strain responsible for its synthesis [53]. In addition, this nitrogenous compound is involved in the production of ornithine, as occurring in this wine, and in the formation of gamma-aminobutyric acid [33]. Alternatively, by transaminating this acid with succinic acid, it can also produce aspartic acid [38]. Another way to obtain a higher concentration of gamma-aminobutyric acid would be to convert the glutamate in wine when the yeast releases decarboxylases [54]. Both possibilities would explain the concentration of this amino acid in this wine.
L-arginine is one of the most important amino acids in wine [38,55]. In strain N62, it is completely consumed, so it could be used as an important nitrogen source, which would explain why a large amount of ammonium chloride is used for the synthesis of other nitrogenous compounds. On the other hand, strain G1 synthesized L-arginine significantly. CPA1 and CPA2 have been quantified as strain G1-specific proteins involved in the synthesis pathway of this nitrogenous compound [56], which could explain the results obtained (Figure 2 and Figure 7). In addition, L-ornithine can be converted to L-arginine [57], as may be the case in this strain, given the significant differences in these amino acids with respect to the base wine. In strain N62, however, the opposite seems to occur, with ornithine being produced from L-arginine [41]. L-proline is formed from the degradation of arginine or glutamic acid and is also consumed by both yeasts in the opposite direction to its synthesis, or for the synthesis of proteins containing this amino acid, whose importance in cell metabolism is high [58].
The addition of ammonium chloride, among other factors, usually decreases the time and increases the speed of fermentation [59]; in the wine inoculated with strain N62, there was a significant increase compared to in the wine of the other strain, coinciding with a shorter fermentation time and higher speed, because strain N62 took 27 days to reach three bars of pressure and G1 took 52 days. Ammonium is one of the preferred sources of nitrogen for yeasts, but in both yeasts, it is not being taken up, because none of the permeases responsible for its uptake (MEP1, MEP2, and MEP3) were identified [60]. It is possible that under the stress conditions of the second fermentation in the bottle for the production of sparkling wine, and at this point in the sampling, the mechanism called nitrogen catabolism repression (NCR) is not significantly activated.
As mentioned above, the concentration of amino acids is higher in the wine inoculated with strain N62. There also seems to be higher activity of TCA-related proteins of this yeast and of mitochondria-related proteins. Among the proteins with significant differences, upregulated together with the specific proteins, 45 different proteins involved in mitochondria were identified, whereas in strain G1, only 9 different proteins were identified.

5. Conclusions

The study reveals distinct nitrogen metabolism strategies in two flor Saccharomyces cerevisiae strains, G1 and N62, during a second fermentation in a bottle in sparkling wine production. Strain G1 prioritizes nitrogen conservation through L-arginine and L-lysine biosynthesis and cell wall remodeling, optimizing nutrient uptake in nitrogen-limited conditions. In contrast, strain N62 demonstrates enhanced translational activity, mitochondrial proteome restructuring, and alternative carbon utilization pathways, facilitating faster fermentation (27 days vs. 52 days for G1). Proteomic analysis identified significant differences in 127 proteins, highlighting strain-specific adaptations. Strain N62 produced higher concentrations of biogenic amines (putrescine and tyramine), likely due to its greater decarboxylation capacity. The wines inoculated with N62 exhibited a broader spectrum of nitrogen compounds and higher activity in the tricarboxylic acid (TCA) cycle, supporting rapid fermentation dynamics. Principal Component Analysis (PCA) confirmed clear differentiation in the nitrogen compound profiles between the base wine and the wines inoculated with each strain. These results highlight the complexity of nitrogen regulation in yeast and the influence of yeast strain selection on nitrogen metabolism and fermentation efficiency in sparkling wine production. The study provides valuable insights into optimizing yeast performance to improve wine quality while preserving regional characteristics, particularly for wines produced via the traditional method using native yeast strains. Achieving optimal quality remains a challenge for winemakers, as it depends on many factors, including yeast selection. The use of indigenous yeasts offers opportunities for innovation, as they can provide unique aromatic profiles while preserving the identity of a terroir [61]. The ability of strain N62 to ferment rapidly and grow faster while conserving nitrogen represents an efficient adaptation that could be valuable for industrial applications, particularly in nitrogen-limited environments.

Supplementary Materials

The following supporting information can be downloaded at: https://www.mdpi.com/article/10.3390/app15105579/s1, Table S1: Nitrogen compounds; Table S2: Identified and quantified proteins.

Author Contributions

Conceptualization, J.C.G.-G., J.C.M., J.M. and T.G.-M.; methodology, J.C.G.-G., J.C.-P., I.M.S.-D., M.T.A.-J. and J.M.; software, J.C.G.-G. and M.E.G.-G.; validation, J.C.M. and T.G.-M.; formal analysis, J.C.G.-G., M.E.G.-G., J.C.-P. and I.M.S.-D.; investigation, J.C.G.-G., J.C.M., J.M. and T.G.-M.; resources, J.C.M., J.M. and T.G-M; data curation, J.C.G.-G. and M.E.G.-G.; writing—original draft preparation, J.C.G.-G.; writing—review and editing, J.C.M. and T.G.-M.; visualization, J.C.M. and I.M.S.-D.; supervision, J.C.M. and T.G.-M.; project administration, J.C.M., I.M.S.-D. and T.G.-M.; funding acquisition, J.C.M., J.M. and T.G.-M. All authors have read and agreed to the published version of the manuscript.

Funding

This research was funded by the “Consejería de Economía, Conocimiento, Empresas y Universidad”, Programa Operativo FEDER de Andalucía 2014–2020, Ref. 1380480-R (T.G.-M.). It has also been co-financed by the Spanish Ministry of Science, Innovation and Universities (MICIU/EU FEDER), Ref. PID 2021-127766OB-I00 (J.C.M.).

Institutional Review Board Statement

Not applicable.

Informed Consent Statement

Not applicable.

Data Availability Statement

The data are available in the Supplementary Materials.

Acknowledgments

We would like to thank the proteomics staff of the Central Research Support Service (SCAI) of the University of Córdoba for their help with the proteomic analysis. We would also like to thank the company Pérez Barquero for supplying the base wine.

Conflicts of Interest

The authors declare no conflicts of interest.

References

  1. González-Jiménez, M.D.C.; Mauricio, J.C.; Moreno-García, J.; Puig-Pujol, A.; Moreno, J.; García-Martínez, T. Differential response of the proteins involved in amino acid metabolism in two Saccharomyces cerevisiae strains during the second fermentation in a sealed bottle. Appl. Sci. 2021, 11, 12165. [Google Scholar] [CrossRef]
  2. Martínez-Rodríguez, A.J.; Carrascosa, A.V.; Martín-Álvarez, P.J.; Moreno-Arribas, V.; Polo, M.C. Influence of the yeast strain on the changes of the amino acids, peptides and proteins during sparkling wine production by the traditional method. J. Ind. Microbiol. Biotechnol. 2002, 29, 314–322. [Google Scholar] [CrossRef]
  3. Prokes, K.; Baron, M.; Mlcek, J.; Jurikova, T.; Adamkova, A.; Ercisli, S.; Sochor, J. The influence of traditional and immobilized yeast on the amino-acid content of sparkling wine. Fermentation 2022, 8, 36. [Google Scholar] [CrossRef]
  4. Condé, B.C.; Bouchard, E.; Culbert, J.A.; Wilkinson, K.L.; Fuentes, S.; Howell, K.S. Soluble protein and amino acid content affects the foam quality of sparkling wine. J. Agric. Food Chem. 2017, 65, 9110–9119. [Google Scholar] [CrossRef]
  5. Sun, N.; Zhao, L.; Liu, A.; Su, L.; Shi, K.; Zhao, H.; Liu, S. Role of amino acids in flavor profiles and foam characteristics of sparkling wines during aging. J. Food Compos. Anal. 2024, 126, 105903. [Google Scholar] [CrossRef]
  6. Sartor, S.; Burin, V.M.; Caliari, V.; Bordignon-Luiz, M.T. Profiling free amino acids in sparkling wines during over-lees aging and evaluation of sensory properties. LWT-Food Sci. Technol. 2021, 140, 110847. [Google Scholar] [CrossRef]
  7. Romano, P.; Braschi, G.; Siesto, G.; Patrignani, F.; Lanciotti, R. Role of yeasts on the sensory component of wines. Foods 2022, 11, 1921. [Google Scholar] [CrossRef]
  8. Espinase Nandorfy, D.; Watson, F.; Likos, D.; Siebert, T.; Bindon, K.; Kassara, S.; Shellie, R.; Keast, R.; Francis, I.L. Influence of amino acids, and their interaction with volatiles and polyphenols, on the sensory properties of red wine. Aust. J. Grape Wine Res. 2022, 28, 621–637. [Google Scholar] [CrossRef]
  9. Charnock, H.M.; Pickering, G.J.; Kemp, B.S. The Maillard reaction in traditional method sparkling wine. Front. Microbiol. 2022, 13, 979866. [Google Scholar] [CrossRef]
  10. Restuccia, D.; Loizzo, M.R.; Spizzirri, U.G. Accumulation of biogenic amines in wine: Role of alcoholic and malolactic fermentation. Fermentation 2018, 4, 6. [Google Scholar] [CrossRef]
  11. Raymond Eder, M.L.; Rosa, A.L. Non-conventional grape varieties and yeast starters for first and second fermentation in sparkling wine production using the traditional method. Fermentation 2021, 7, 321. [Google Scholar] [CrossRef]
  12. Basile, T.; Debiase, G.; Mazzone, F.; Scarano, L.; Marsico, A.D.; Cardone, M.F. New sparkling wines from traditional grape varieties and native yeasts: Focusing on wine identity to address the industry’s crisis. Beverages 2025, 11, 25. [Google Scholar] [CrossRef]
  13. Martí-Raga, M.; Marullo, P.; Beltran, G.; Mas, A. Nitrogen modulation of yeast fitness and viability during sparkling wine production. Food Microbiol. 2016, 54, 106–114. [Google Scholar] [CrossRef]
  14. García-García, J.C.; García-Martínez, T.; Román-Camacho, J.J.; Moreno, J.; Mauricio, J.C. Comparative proteomics of two flor yeasts in sparkling wine fermentation: First approach. Foods 2025, 14, 282. [Google Scholar] [CrossRef]
  15. Gómez-Alonso, S.; Hermosín-Gutiérrez, I.; García-Romero, E. Simultaneous HPLC analysis of biogenic amines, amino acids, and ammonium ion as aminoenone derivatives in wine and beer samples. J. Agric. Food Chem. 2007, 55, 608–613. [Google Scholar] [CrossRef]
  16. Valero, E.; Millán, C.; Ortega, J.M.; Mauricio, J.C. Concentration of amino acids in wine after the end of fermentation by Saccharomyces cerevisiae strains. J. Sci. Food Agric. 2003, 83, 830–835. [Google Scholar] [CrossRef]
  17. Magasanik, B.; Kaiser, C.A. Nitrogen regulation in Saccharomyces cerevisiae. Gene 2002, 290, 1–18. [Google Scholar] [CrossRef]
  18. Chen, Y.; Zeng, W.; Ma, W.; Ma, W.; Zhou, J. Chromatin regulators Ahc1p and Eaf3p positively influence nitrogen metabolism in Saccharomyces cerevisiae. Front. Microbiol. 2022, 13, 883934. [Google Scholar] [CrossRef]
  19. Kumar, R.; Lahtvee, P.J. Proteome overabundance enables respiration but limitation onsets carbon overflow. BioRxiv 2020. [Google Scholar] [CrossRef]
  20. Zhang, W.; Du, G.; Zhou, J.; Chen, J. Regulation of sensing, transportation, and catabolism of nitrogen sources in Saccharomyces cerevisiae. Microbiol. Mol. Biol. Rev. 2018, 82, 10–1128. [Google Scholar] [CrossRef]
  21. Kolkman, A.; Daran-Lapujade, P.; Fullaondo, A.; Olsthoorn, M.M.; Pronk, J.T.; Slijper, M.; Heck, A.J. Proteome analysis of yeast response to various nutrient limitations. Mol. Syst. Biol. 2006, 2, 2006–2026. [Google Scholar] [CrossRef]
  22. Burchacka, E.; Pięta, P.; Łupicka-Słowik, A. Recent advances in fungal serine protease inhibitors. Biomed. Pharmacother. 2022, 146, 112523. [Google Scholar] [CrossRef] [PubMed]
  23. Tian, E.; Shen, X.; Xiao, M.; Zhu, Z.; Yang, Y.; Yan, X.; Wang, P.; Zou, G.; Zhou, Z. An engineered Pichia pastoris platform for the biosynthesis of silk-based nanomaterials with therapeutic potential. Int. J. Biol. Macromol. 2024, 269, 131954. [Google Scholar] [CrossRef]
  24. Ramachandran, G.; Chidambaram, R.; Nachiappan, V. FSH1 encodes lysophospholipase activity in Saccharomyces cerevisiae. Biotechnol. Lett. 2021, 43, 279–286. [Google Scholar] [CrossRef] [PubMed]
  25. Hoh, K.L.; Mu, B.; See, T.; Ng, A.Y.E.; Ng, A.Q.E.; Zhang, D. VAP-mediated membrane-tethering mechanisms implicate ER-PM contact function in pH homeostasis. Cell Rep. 2024, 43, 114592. [Google Scholar] [CrossRef] [PubMed]
  26. Luqueño-Bocardo, O.I.; Pardo, J.P.; Guerra-Sánchez, G.; González, J.; Matus-Ortega, G.; Romero-Aguilar, L. The isoprenoids as biofuel source. Tip Rev. Espec. Cienc. Quím.-Biol. 2021, 24, 1–11. [Google Scholar]
  27. Gobert, A.; Tourdot-Maréchal, R.; Sparrow, C.; Morge, C.; Alexandre, H. Influence of nitrogen status in wine alcoholic fermentation. Food Microbiol. 2019, 83, 71–85. [Google Scholar] [CrossRef]
  28. Jordá, T.; Puig, S. Regulation of ergosterol biosynthesis in Saccharomyces cerevisiae. Genes 2020, 11, 795. [Google Scholar] [CrossRef]
  29. Vidal, E.E.; de Billerbeck, G.M.; Simões, D.A.; Schuler, A.; François, J.M.; de Morais, M.A., Jr. Influence of nitrogen supply on the production of higher alcohols/esters and expression of flavour-related genes in cachaça fermentation. Food Chem. 2013, 138, 701–708. [Google Scholar] [CrossRef]
  30. Esposito, F.; Montuori, P.; Schettino, M.; Velotto, S.; Stasi, T.; Romano, R.; Cirillo, T. Level of biogenic amines in red and white wines, dietary exposure, and histamine-mediated symptoms upon wine ingestion. Molecules 2019, 24, 3629. [Google Scholar] [CrossRef]
  31. Moreira, L.; Milheiro, J.; Filipe-Ribeiro, L.; Cosme, F.; Nunes, F.M. Exploring factors influencing the levels of biogenic amines in wine and microbiological strategies for controlling their occurrence in winemaking. Food Res. Int. 2024, 190, 114558. [Google Scholar] [CrossRef] [PubMed]
  32. Visciano, P.; Schirone, M. Update on biogenic amines in fermented and non-fermented beverages. Foods 2022, 11, 353. [Google Scholar] [CrossRef]
  33. Yang, P.; Liu, W.; Chen, Y.; Gong, A.D. Engineering the glyoxylate cycle for chemical bioproduction. Front. Bioeng. Biotechnol. 2022, 10, 1066651. [Google Scholar] [CrossRef]
  34. De Iseppi, A.; Rocca, G.; Marangon, M.; Corich, V.; Arrigoni, G.; Porcellato, D.; Curioni, A. Characterization and identification of yeast peptides released during model wine fermentation and lees contact. J. Agric. Food Chem. 2024, 72, 24749–24761. [Google Scholar] [CrossRef]
  35. Guo, X.; Wu, X.; Ma, H.; Liu, H.; Luo, Y. Yeast: A platform for the production of L-tyrosine derivatives. Yeast 2023, 40, 214–230. [Google Scholar] [CrossRef]
  36. Garrigós, V.; Picazo, C.; Matallana, E.; Aranda, A. Activation of the yeast retrograde response pathway by adaptive laboratory evolution with S-(2-aminoethyl)-L-cysteine reduces ethanol and increases glycerol during winemaking. Microb. Cell Fact. 2024, 23, 231. [Google Scholar] [CrossRef] [PubMed]
  37. Vion, C.; Yeramian, N.; Hranilovic, A.; Masneuf-Pomarède, I.; Marullo, P. Influence of yeasts on wine acidity: New insights into Saccharomyces cerevisiae. OENO One 2024, 58. [Google Scholar] [CrossRef]
  38. Scutarașu, E.C.; Luchian, C.E.; Cioroiu, I.B.; Trincă, L.C.; Cotea, V.V. Increasing amino acids content of white wines with enzymes treatments. Agronomy 2022, 12, 1406. [Google Scholar] [CrossRef]
  39. Labuschagne, P.W.J.; Divol, B. Thiamine: A key nutrient for yeasts during wine alcoholic fermentation. Appl. Microbiol. Biotechnol. 2021, 105, 953–973. [Google Scholar] [CrossRef]
  40. Mandl, K.; Silhavy-Richter, K.; Korntheuer, K.; Prinz, M.; Patzl-Fischerleitner, E.; Eder, R. Influence of different yeasts on the amino acid pattern of rosé wine. In BIO Web of Conferences; EDP Sciences: Sofia, Bulgaria, 2017; Volume 9, p. 02014. [Google Scholar]
  41. Lu, Y.; Qin, Y.; Sun, Y.; Joseph, C.L.; Bisson, L.F.; Song, Y.; Liu, Y. Insight into the growth and metabolic characteristics of indigenous commercial S. cerevisiae NX11424 at high and low levels of yeast assimilable nitrogen based on metabolomic approach. Food Microbiol. 2024, 124, 104593. [Google Scholar] [CrossRef]
  42. Crépin, L.; Truong, N.M.; Bloem, A.; Sanchez, I.; Dequin, S.; Camarasa, C. Management of multiple nitrogen sources during wine fermentation by Saccharomyces cerevisiae. Appl. Environ. Microbiol. 2017, 83, e02617-16. [Google Scholar] [CrossRef] [PubMed]
  43. Songdech, P.; Butkinaree, C.; Yingchutrakul, Y.; Promdonkoy, P.; Runguphan, W.; Soontorngun, N. Increased production of isobutanol from xylose through metabolic engineering of Saccharomyces cerevisiae overexpressing transcription factor Znf1 and exogenous genes. FEMS Yeast Res. 2024, 24, foae006. [Google Scholar] [CrossRef] [PubMed]
  44. Chandler, M.; Stanley, G.A.; Rogers, P.; Chambers, P. A genomic approach to defining the ethanol stress response in the yeast Saccharomyces cerevisiae. Ann Microbiol. 2004, 54, 427–454. [Google Scholar]
  45. Jansen, M.L.A.; Van De Graaf, M.J.; Verwaal, R.U.S. Dicarboxylic Acid Production. Process. Patent No. 9,353,387, 31 May 2016. [Google Scholar]
  46. Ogawa, M.; Moreno-García, J.; Joseph, L.C.; Mauricio, J.C.; Moreno, J.; García-Martínez, T. Metabolic changes by wine flor-yeasts with gluconic acid as the sole carbon source. Metabolites 2021, 11, 150. [Google Scholar] [CrossRef]
  47. Huang, G.; Ren, H.; Wang, A.; Wan, X.; Wu, Z.; Zhong, X. iTRAQ-based proteomic analysis reveals the molecule mechanism of reducing higher alcohols in Chinese rice wine by nitrogen compensation. Ann. Microbiol. 2021, 71, 1–13. [Google Scholar] [CrossRef]
  48. Li, J.; Liu, B.; Feng, X.; Zhang, M.; Ding, T.; Zhao, Y.; Wang, C. Comparative proteome and volatile metabolome analysis of Aspergillus oryzae 3.042 and Aspergillus sojae 3.495 during koji fermentation. Food Res. Int. 2023, 165, 112527. [Google Scholar] [CrossRef]
  49. Li, M.; Deng, M.; Chen, Y.; Fan, H.; Huang, Y.; Huang, Y.; Wan, G.; Fu, G. Exploring the stress mechanism of tannic acid on Saccharomyces cerevisiae based on transcriptomics. Food Biosc. 2023, 56, 103365. [Google Scholar] [CrossRef]
  50. Torres-Guardado, R.; Rozès, N.; Esteve-Zarzoso, B.; Reguant, C.; Bordons, A. Succinic acid production by wine yeasts and the influence of GABA and glutamic acid. Int. Microbiol. 2024, 27, 505–512. [Google Scholar] [CrossRef]
  51. Bailey, P.S.; Ortmann, B.M.; Martinelli, A.W.; Houghton, J.W.; Costa, A.S.; Burr, S.P.; Antrobus, R.; Frezza, C.; Nathan, J.A. ABHD11 maintains 2-oxoglutarate metabolism by preserving functional lipoylation of the 2-oxoglutarate dehydrogenase complex. Nat. Commun. 2020, 11, 4046. [Google Scholar] [CrossRef]
  52. Zhong, Y.; Gao, Y.; Zhou, D.; Ma, X.; Chen, H.; Xu, Y.; Yang, W.; Yu, X. Structural basis for the activity and regulation of human α-ketoglutarate dehydrogenase revealed by Cryo-EM. Biochem. Biophys. Res. Commun. 2022, 602, 120–126. [Google Scholar] [CrossRef]
  53. Brambilla, M. Rewiring yeast nitrogen and mRNA metabolism for eliciting industrially relevant phenotypes. In The Saccharomyces cerevisiae Glutamate Synthase (Glt1) and the Poly (A) Binding Protein (Pab1) as Case Studies; Tesi di Dottorato, Università Degli Studi di Milano-Bicocca: Milan, Italy, 2018. [Google Scholar]
  54. Gong, J.; Huang, J.; Xiao, G.; You, Y.; Yuan, H.; Chen, F.; Liu, S.; Mao, J.; Li, B. Determination of γ-aminobutyric acid in Chinese rice wines and its evolution during fermentation. J. Inst. Brew. 2017, 123, 417–422. [Google Scholar] [CrossRef]
  55. Pérez-Magariño, S.; Ortega-Heras, M.; Martínez-Lapuente, L.; Guadalupe, Z.; Ayestarán, B. Multivariate analysis for the differentiation of sparkling wines elaborated from autochthonous Spanish grape varieties: Volatile compounds, amino acids and biogenic amines. Eur. Food Res. Technol. 2013, 236, 827–841. [Google Scholar] [CrossRef]
  56. Minebois, R.; Lairón-Peris, M.; Barrio, E.; Pérez-Torrado, R.; Querol, A. Metabolic differences between a wild and a wine strain of Saccharomyces cerevisiae during fermentation unveiled by multi-omic analysis. Environ. Microbiol. 2021, 23, 3059–3076. [Google Scholar] [CrossRef]
  57. Deng, H.; Ji, L.; Han, X.; Wu, T.; Han, B.; Li, C.; Zhan, J.; Huang, W.; You, Y. Research progress on the application of different controlling strategies to minimizing ethyl carbamate in grape wine. Compr. Rev. Food Sci. Food Saf. 2023, 22, 1495–1516. [Google Scholar] [CrossRef] [PubMed]
  58. Dong, Z.; Yang, S.; Zhang, Z.; Tang, C.; Kan, Y.; Yao, L. Prolyl aminopeptidases: Reclassification, properties, production and industrial applications. Process Biochem. 2022, 118, 121–132. [Google Scholar] [CrossRef]
  59. Martínez-Moreno, R.; Quirós, M.; Morales, P.; Gonzalez, R. New insights into the advantages of ammonium as a winemaking nutrient. Int. J. Food Microbiol. 2014, 177, 128–135. [Google Scholar] [CrossRef]
  60. Lleixà, J.; Martín, V.; Giorello, F.; Portillo, M.C.; Carrau, F.; Beltran, G.; Mas, A. Analysis of the NCR mechanisms in Hanseniaspora vineae and Saccharomyces cerevisiae during winemaking. Front. Genet. 2019, 9, 747. [Google Scholar] [CrossRef]
  61. Luchian, C.E.; Grosaru, D.; Scutarasu, E.C.; Colibaba, L.C.; Scutarasu, A.; Cotea, V.V. Advancing sparkling wine in the 21st century: From traditional methods to modern innovations and market trends. Fermentation 2025, 11, 174. [Google Scholar] [CrossRef]
Figure 1. (a) Principal Component Analysis carried out from the data matrix of the nitrogenous compounds quantified in the base wine BW (blue), wine with strain N62 (green), and wine with strain G1 (red). (b) Principal Component Analysis biplot (PCA-biplot) showing the most characteristic nitrogenous compounds among the three wines tested.
Applsci 15 05579 g001
Figure 2. Heat map visualization of the quantification data of the normalized nitrogen compounds of the three different wines: base wine BW (blue), wine with strain N62 (green), and wine with strain G1 (red).
Applsci 15 05579 g002
Figure 3. Bar plot of nitrogen compounds with significant differences at q < 0.05. * means q < 0.05; ** means q < 0.01; *** means q < 0.001; and **** means q < 0.0001. Nitrogenous compounds are biogenic amines (green) and amino acids and ammonium ion (blue). (a) Fold change between the wine with the G1 strain and the base wine (BW). (b) Fold change between the wine with strain N62 and the base wine (BW). (c) Fold change between the wine with strain G1 and the wine with strain N62.
Applsci 15 05579 g003
Figure 4. Heat map representing quantification of proteins with significant differences at q-value < 0.05. Wine with strain G1 (red) and wine with strain N62 (green). The code column on the right represents the accession number of the proteins (Uniprot database).
Applsci 15 05579 g004
Figure 5. (a) Bubble plot of the enrichment terms of the analysis of the set proteins upregulated and specific proteins in strain G1 using the “molecular function” term from the Gene Ontology database. The size of the bubbles represents the number of proteins that correspond to each of the pathways. The color gradient refers to the significance of each path (FDR < 0.05). (b) Map of protein–protein interaction network (INM) between the most expressed protein and specific protein in strain G1, built with STRING 12.0 and high confidence, with an FDR value < 0.05. Proteins are shown as nodes and the interactions between them as edges. Nodes of the same color correspond to the same molecular function according to the Gene Ontology database.
Applsci 15 05579 g005
Figure 6. (a) Bubble plot of the enrichment terms of the analysis of the set proteins upregulated and specific proteins in strain N62 using the “Biological process” term from the Gene Ontology database. (b) INM between the most expressed protein and specific protein in strain N62, built with STRING 12.0 and high confidence, with an FDR value < 0.05.
Applsci 15 05579 g006
Figure 7. The most relevant proteins and amino acids with significant differences involved in nitrogen metabolism at three bars of pressure. The color in the protein names represents a greater quantity in strain N62 (green) and G1 (red). PEP (phosphoenolpyruvate), Alfa-KG (Alfa-Ketoglutarate), OAA (oxaloacetate), and GABA (gamma-amino-n-butyric acid).
Applsci 15 05579 g007
Disclaimer/Publisher’s Note: The statements, opinions and data contained in all publications are solely those of the individual author(s) and contributor(s) and not of MDPI and/or the editor(s). MDPI and/or the editor(s) disclaim responsibility for any injury to people or property resulting from any ideas, methods, instructions or products referred to in the content.

