The Synergistic Effects of the Particle Elongation Index and Flat Index on Aggregate Strength and Dilatancy: A Discrete Element Method Study


Abstract
1. Introduction
2. Discrete Element Modeling
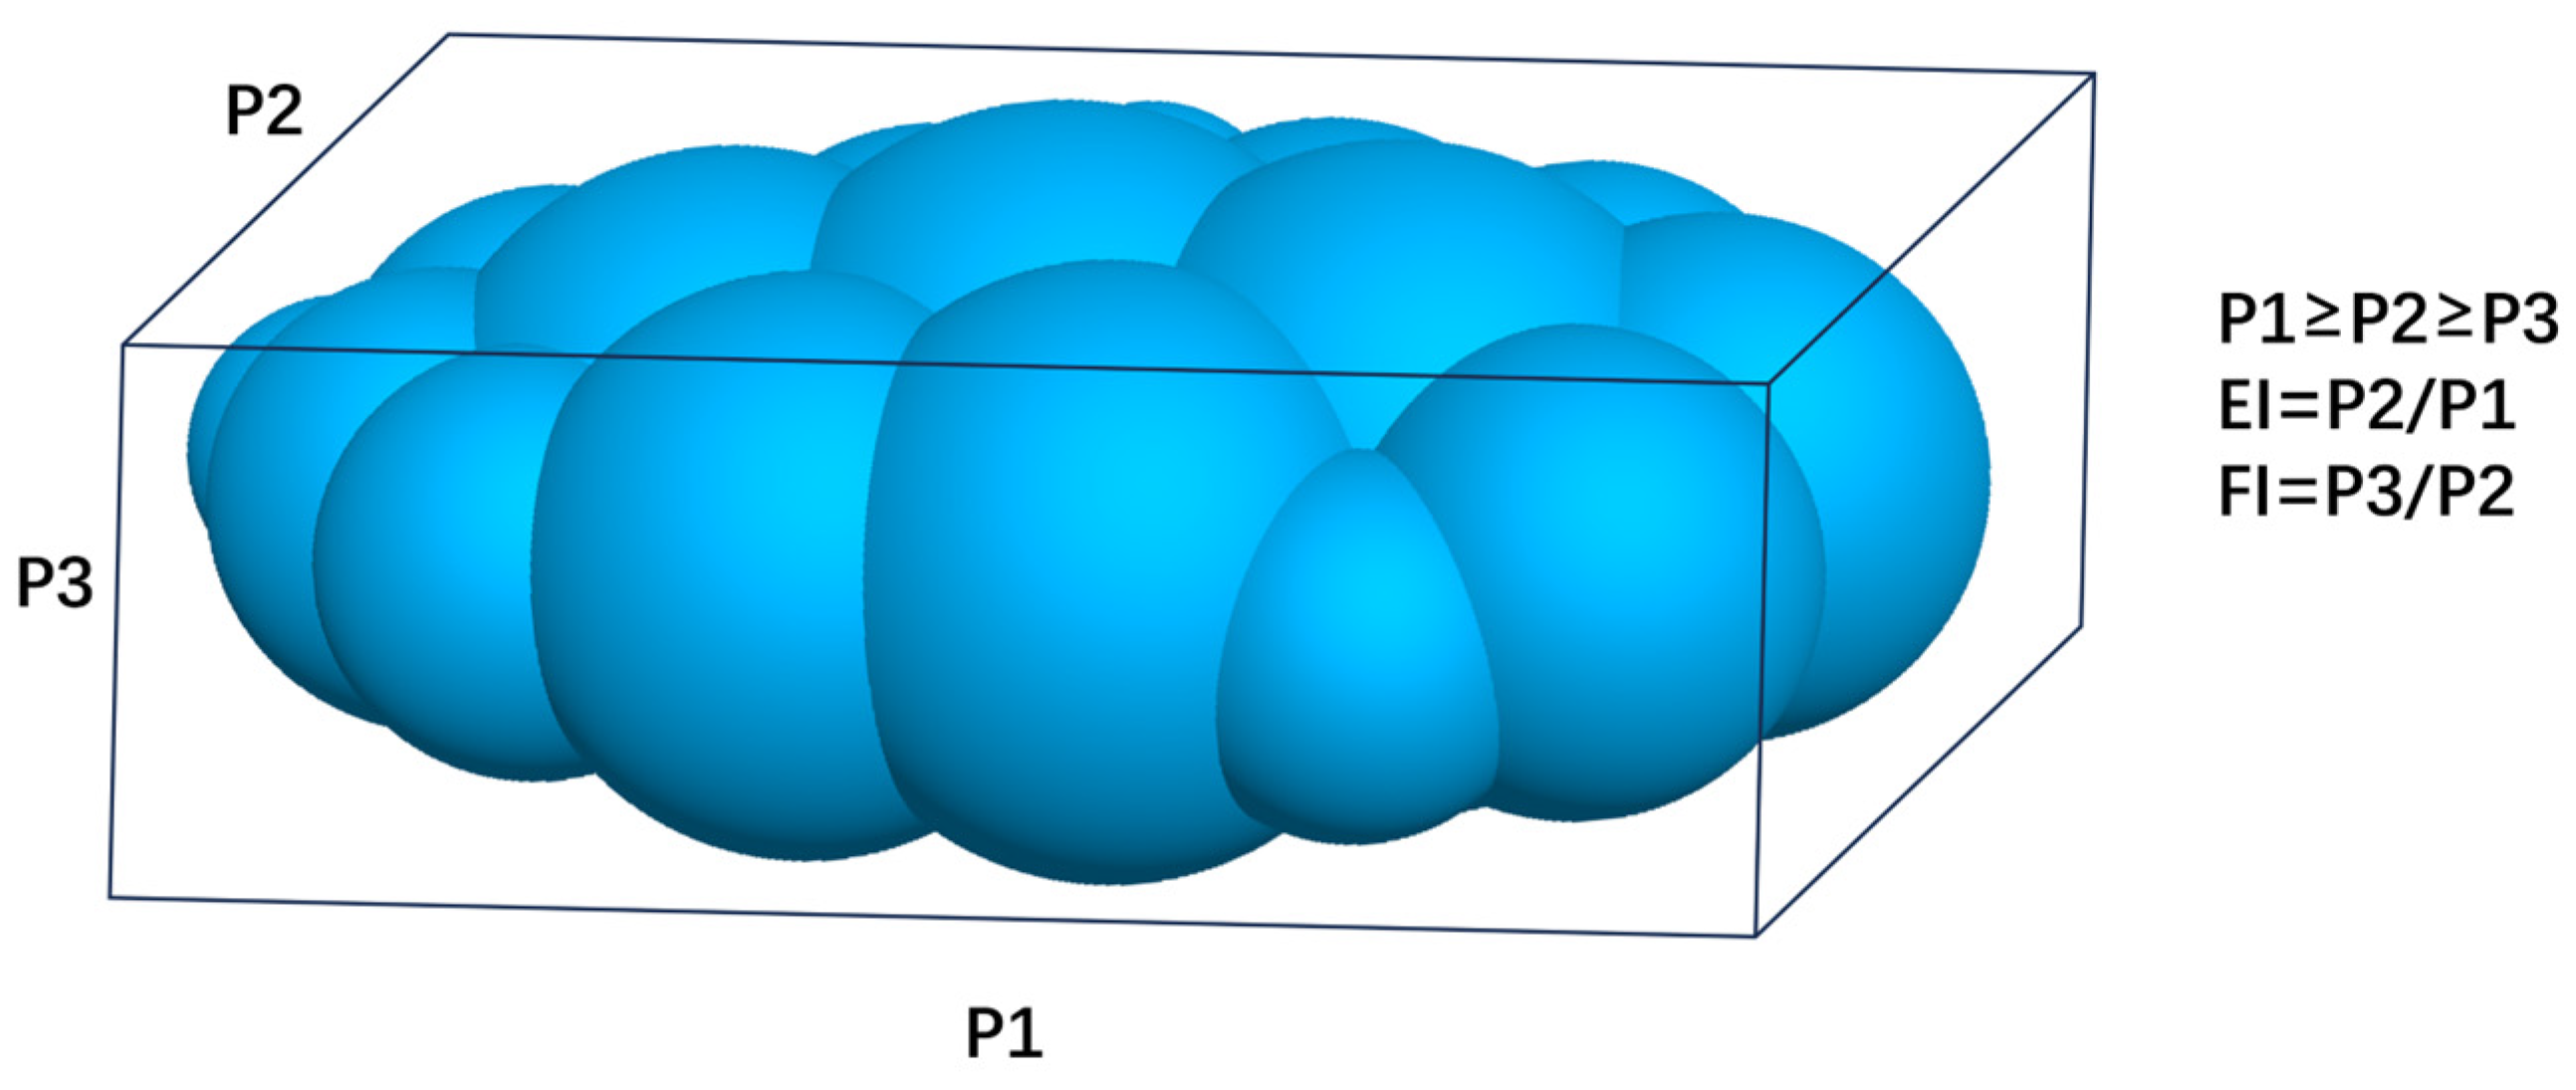
2.1. Single-Particle Model
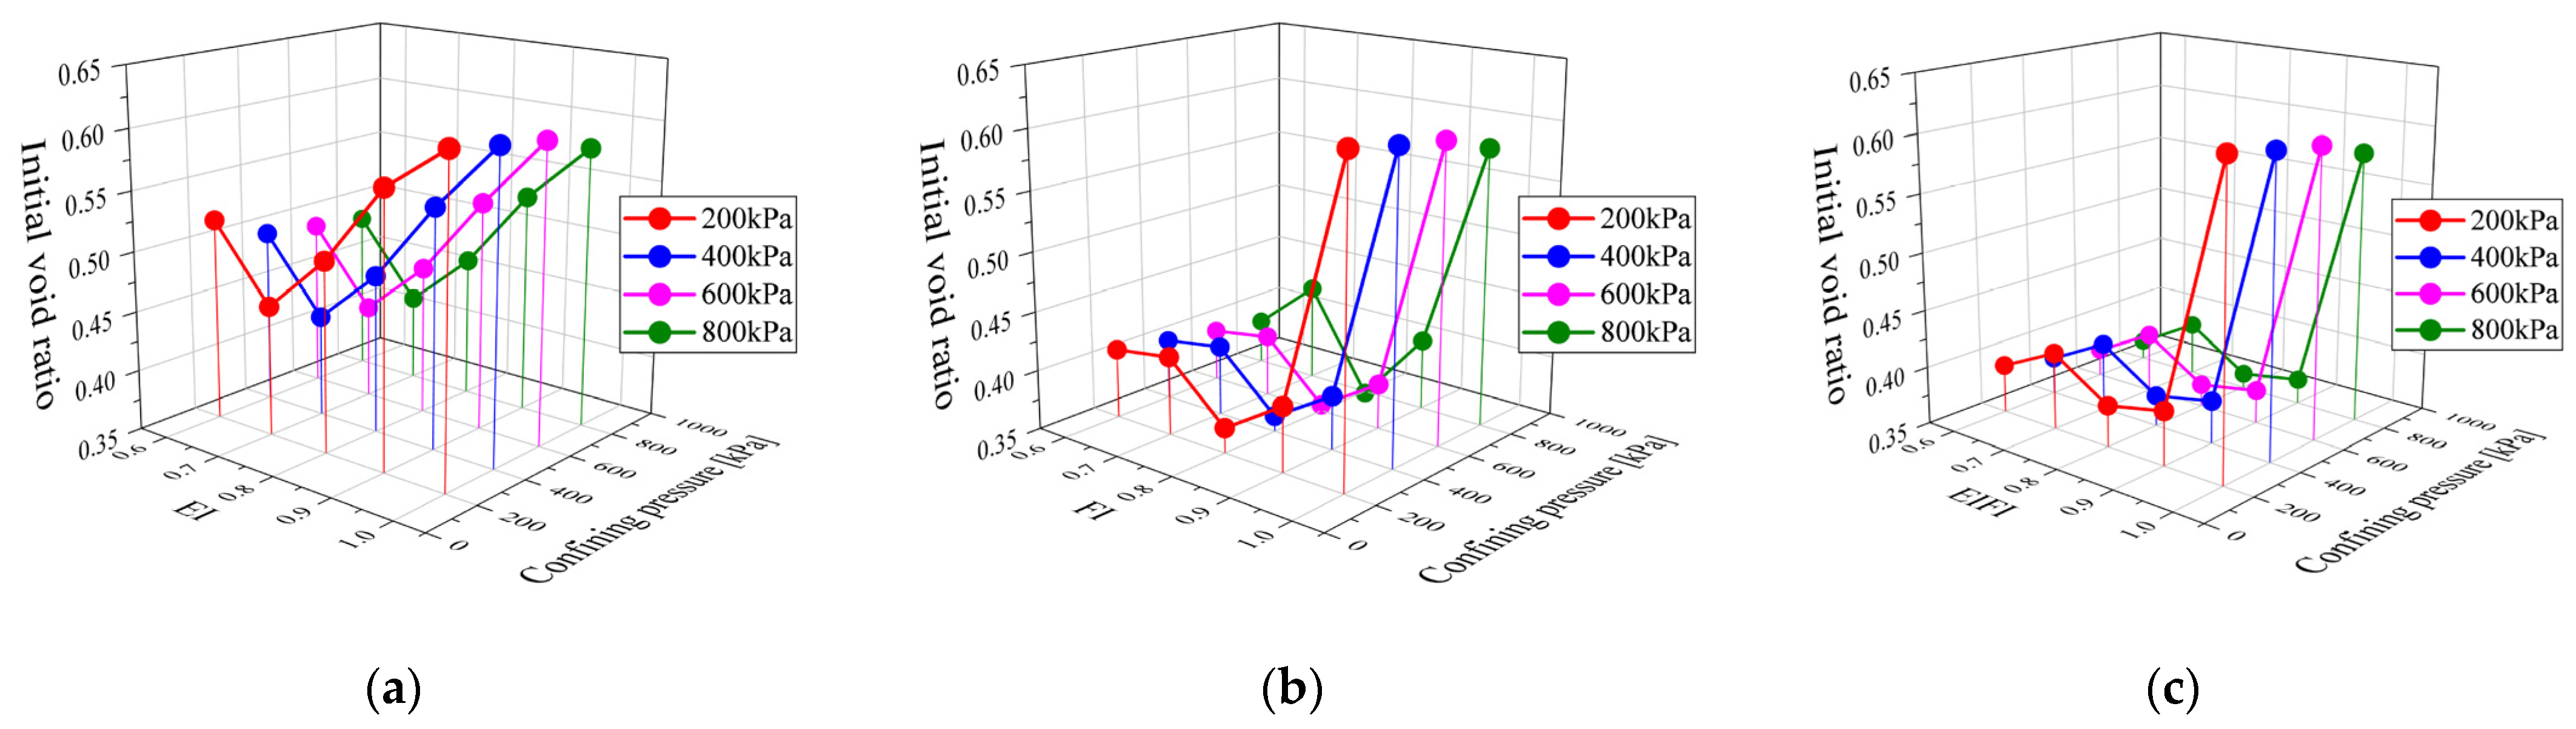
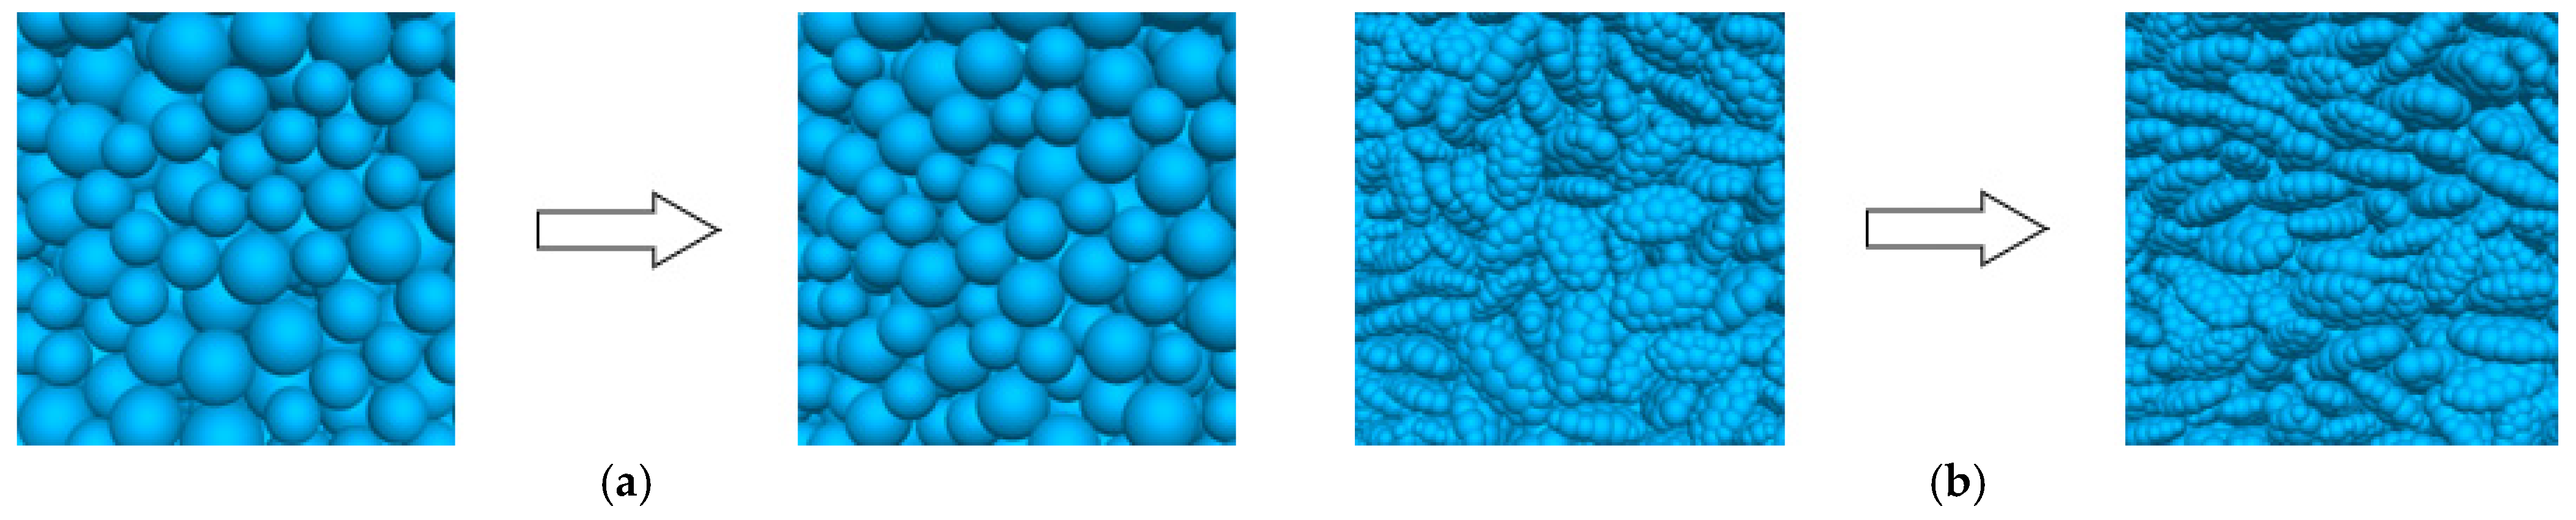
2.2. Generation of the Particle Aggregate
3. Results
3.1. Macro Behavior Analysis
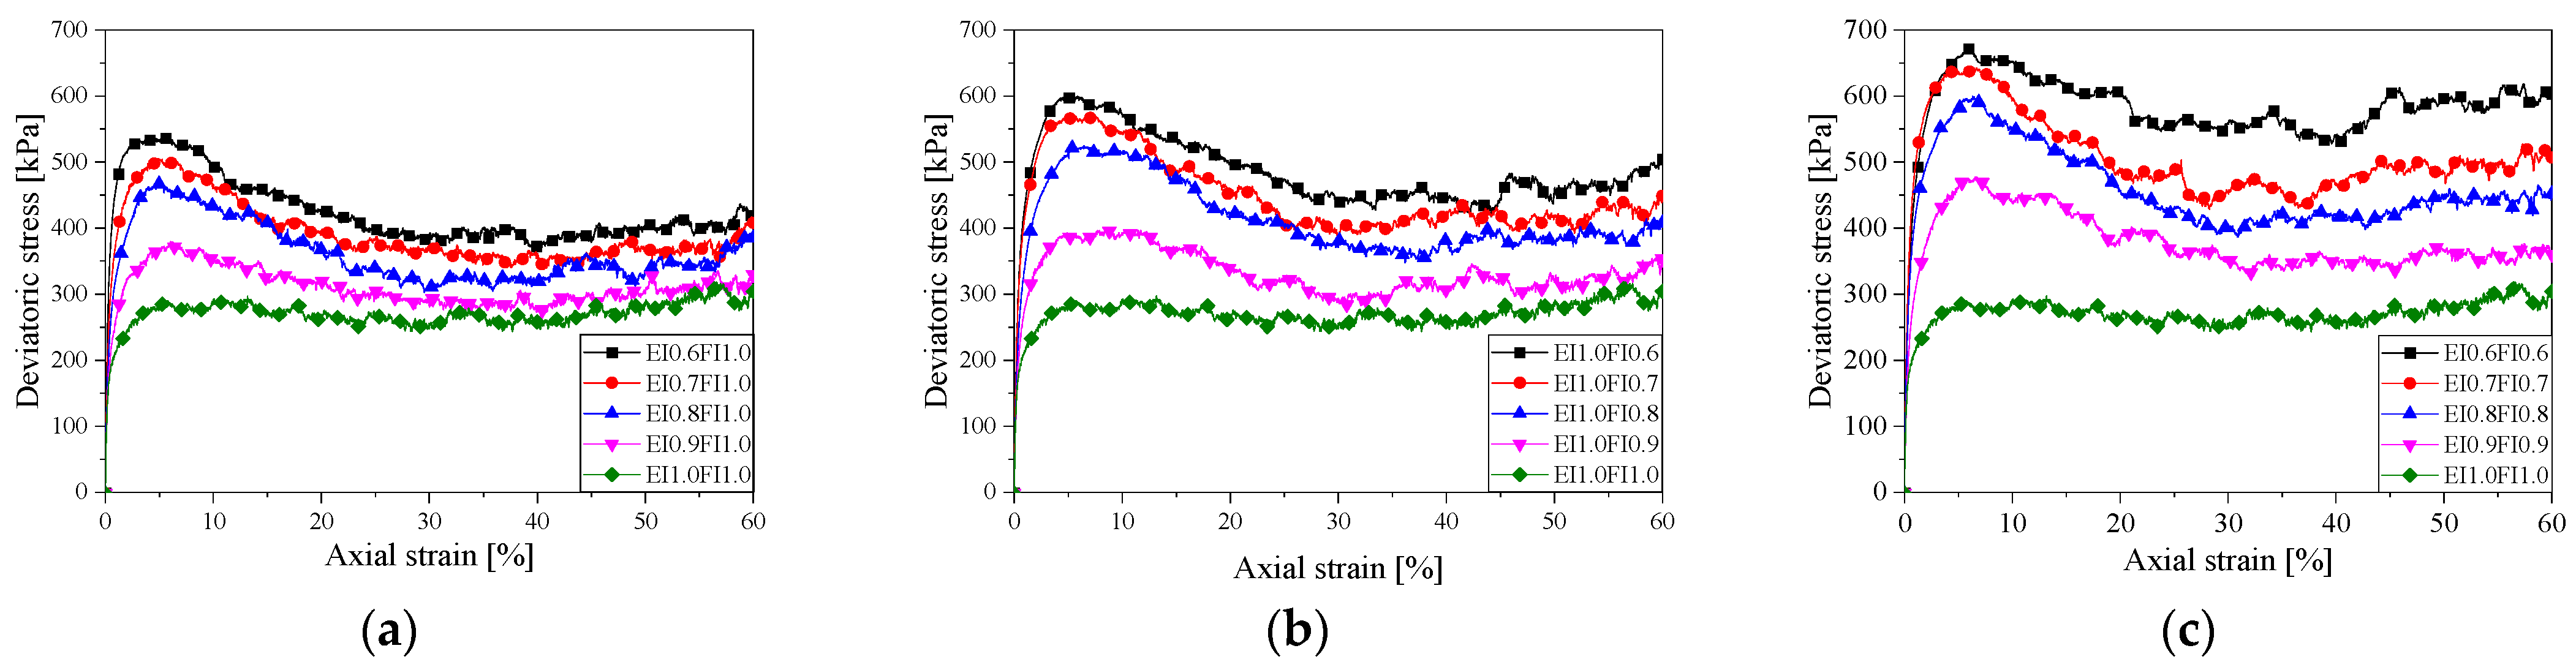
3.1.1. Deviatoric Stress
3.1.2. Internal Friction Angle
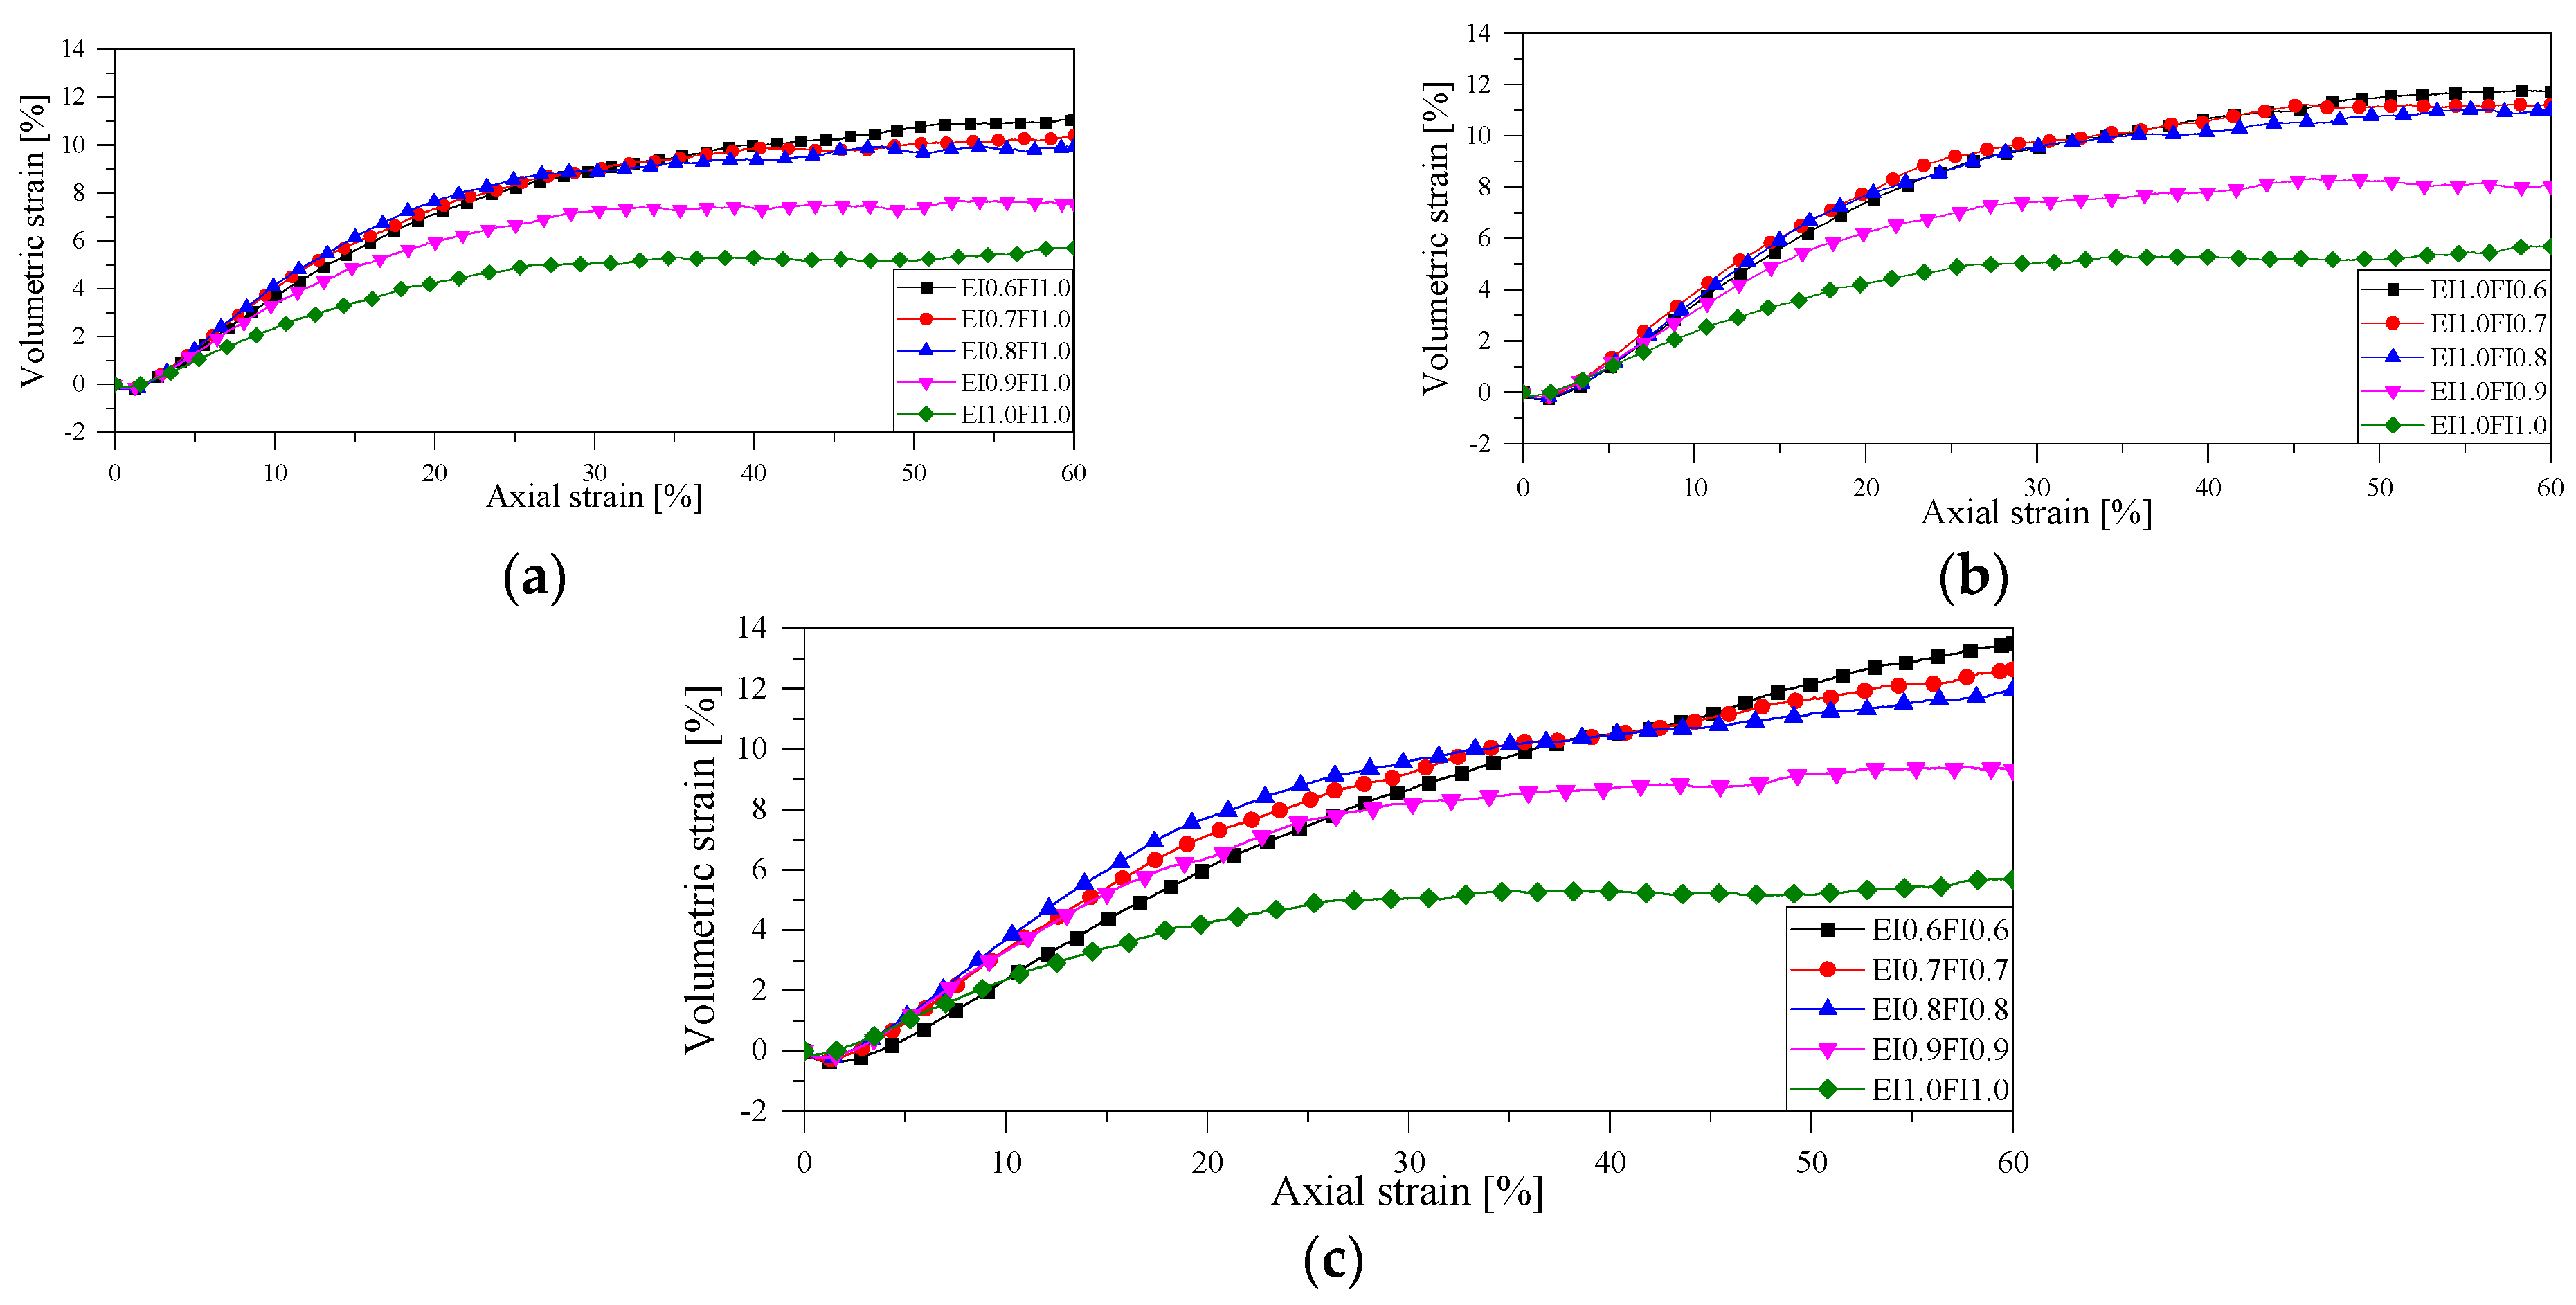
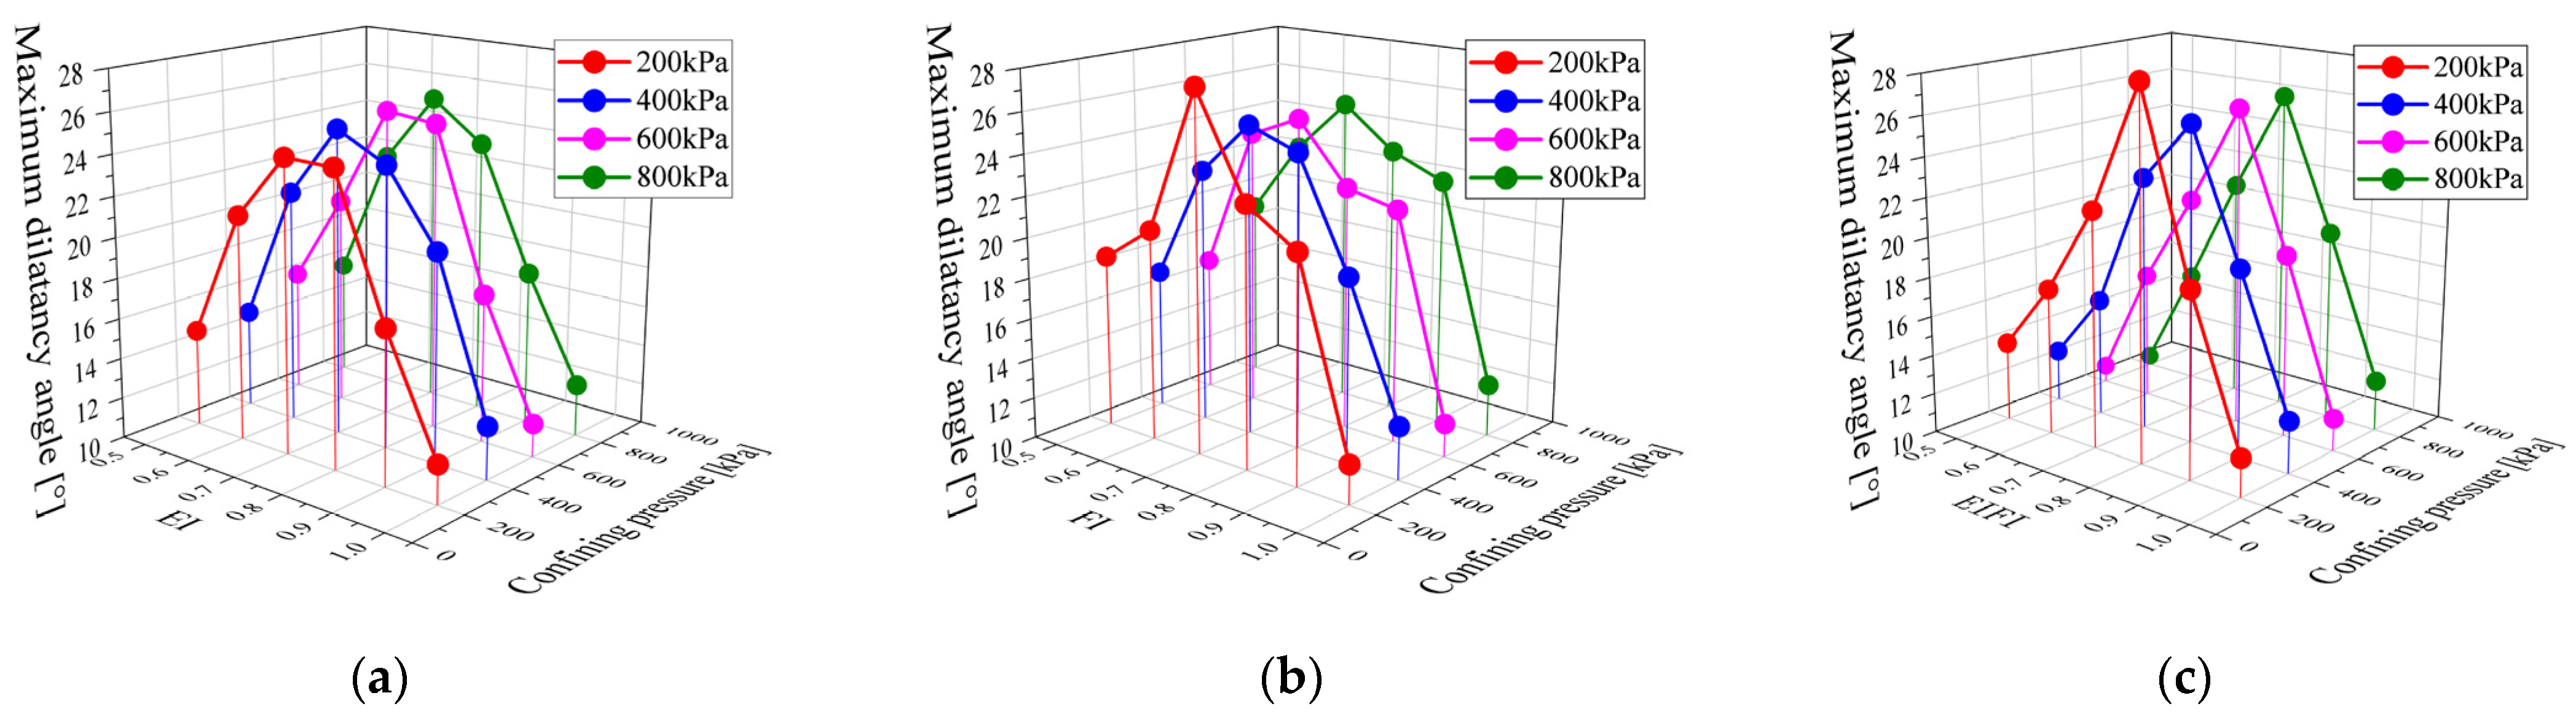
3.1.3. Volumetric Strain and Dilatancy
3.2. Micro Behavior Analysis
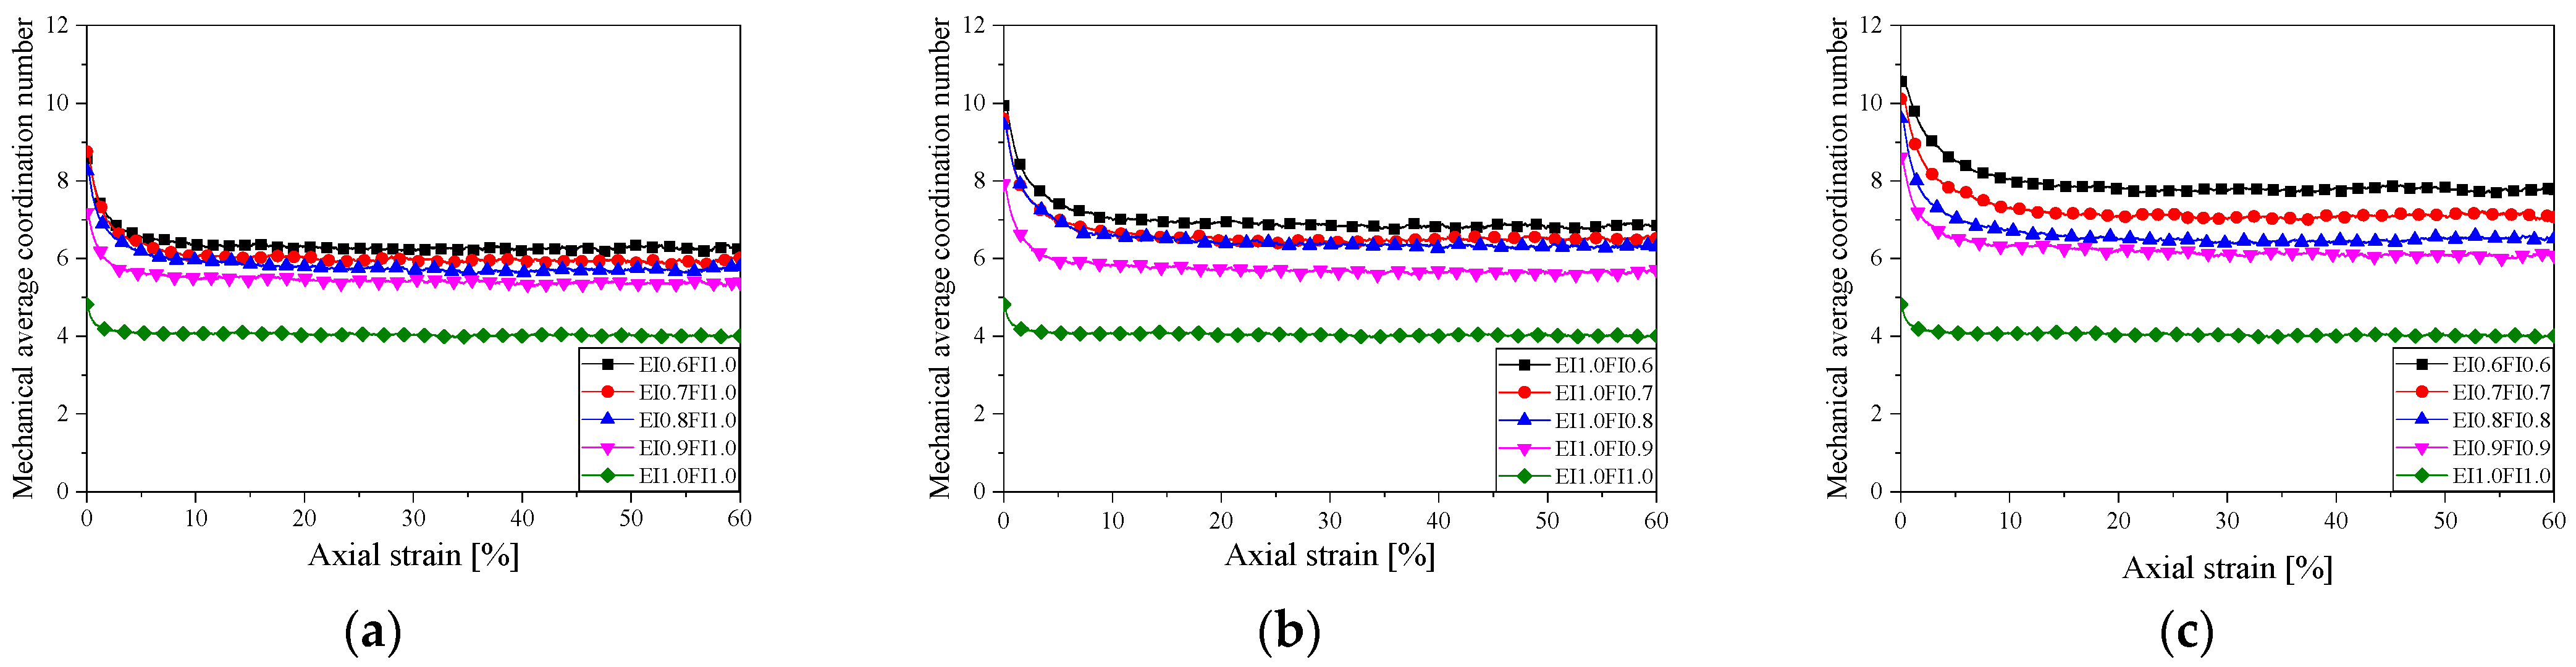
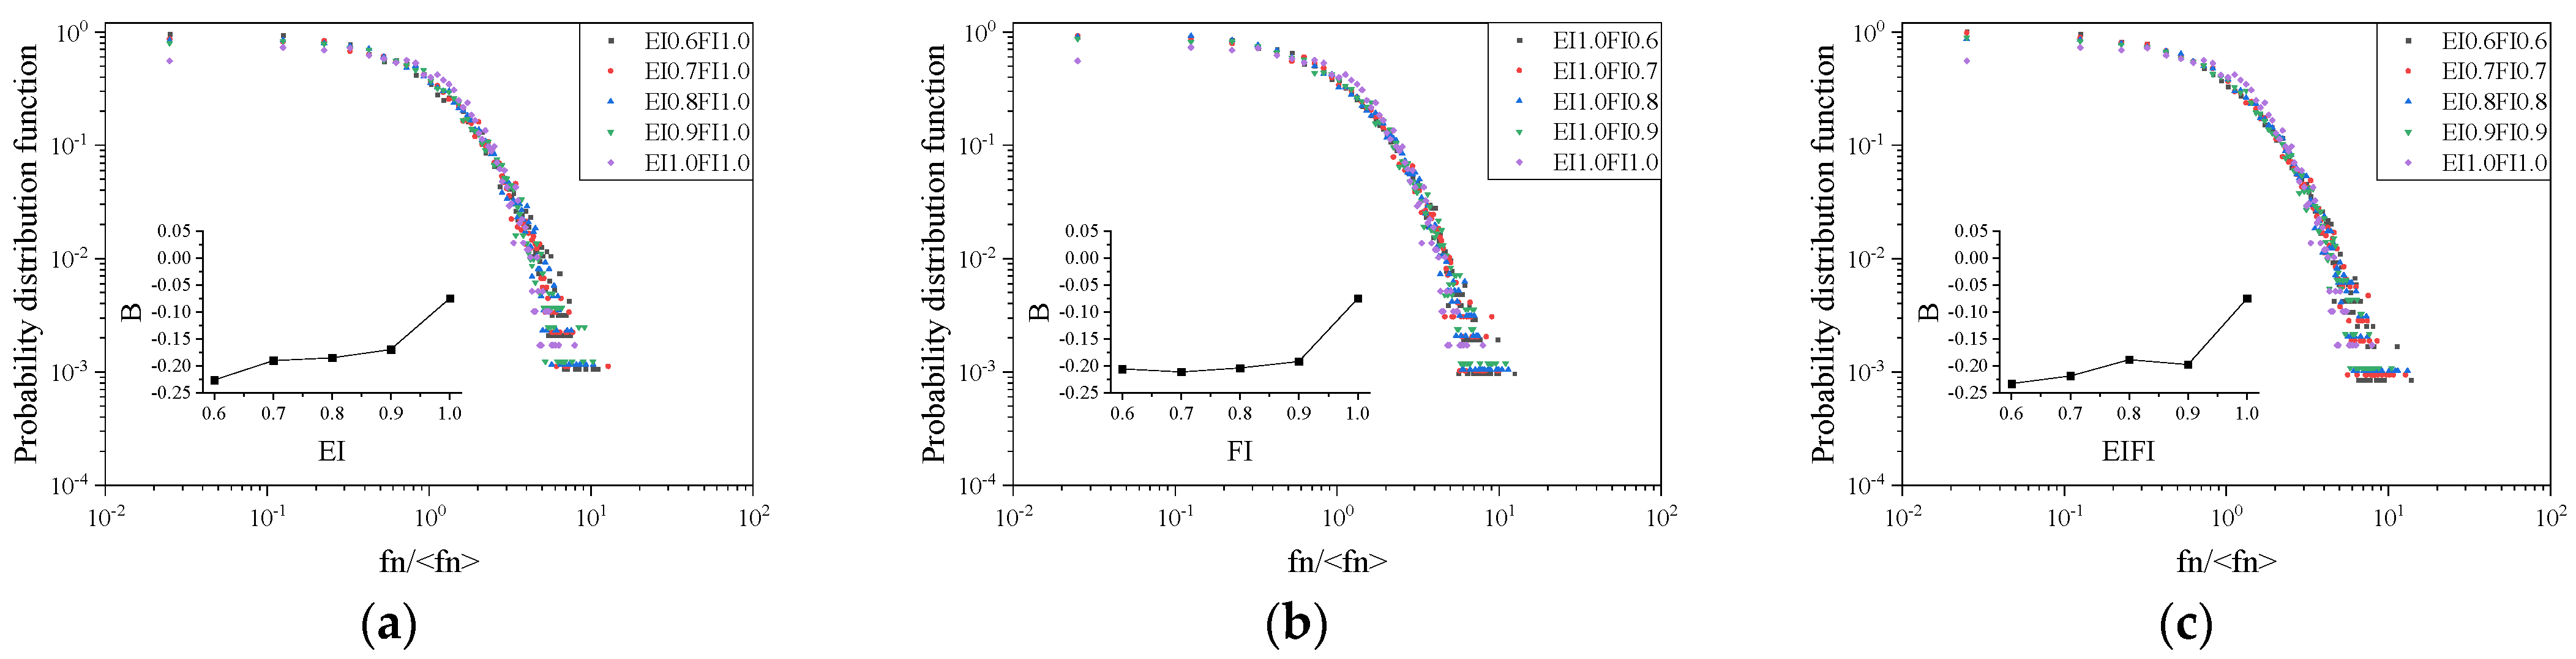
3.2.1. Contact Network Characteristics
- Coordination number
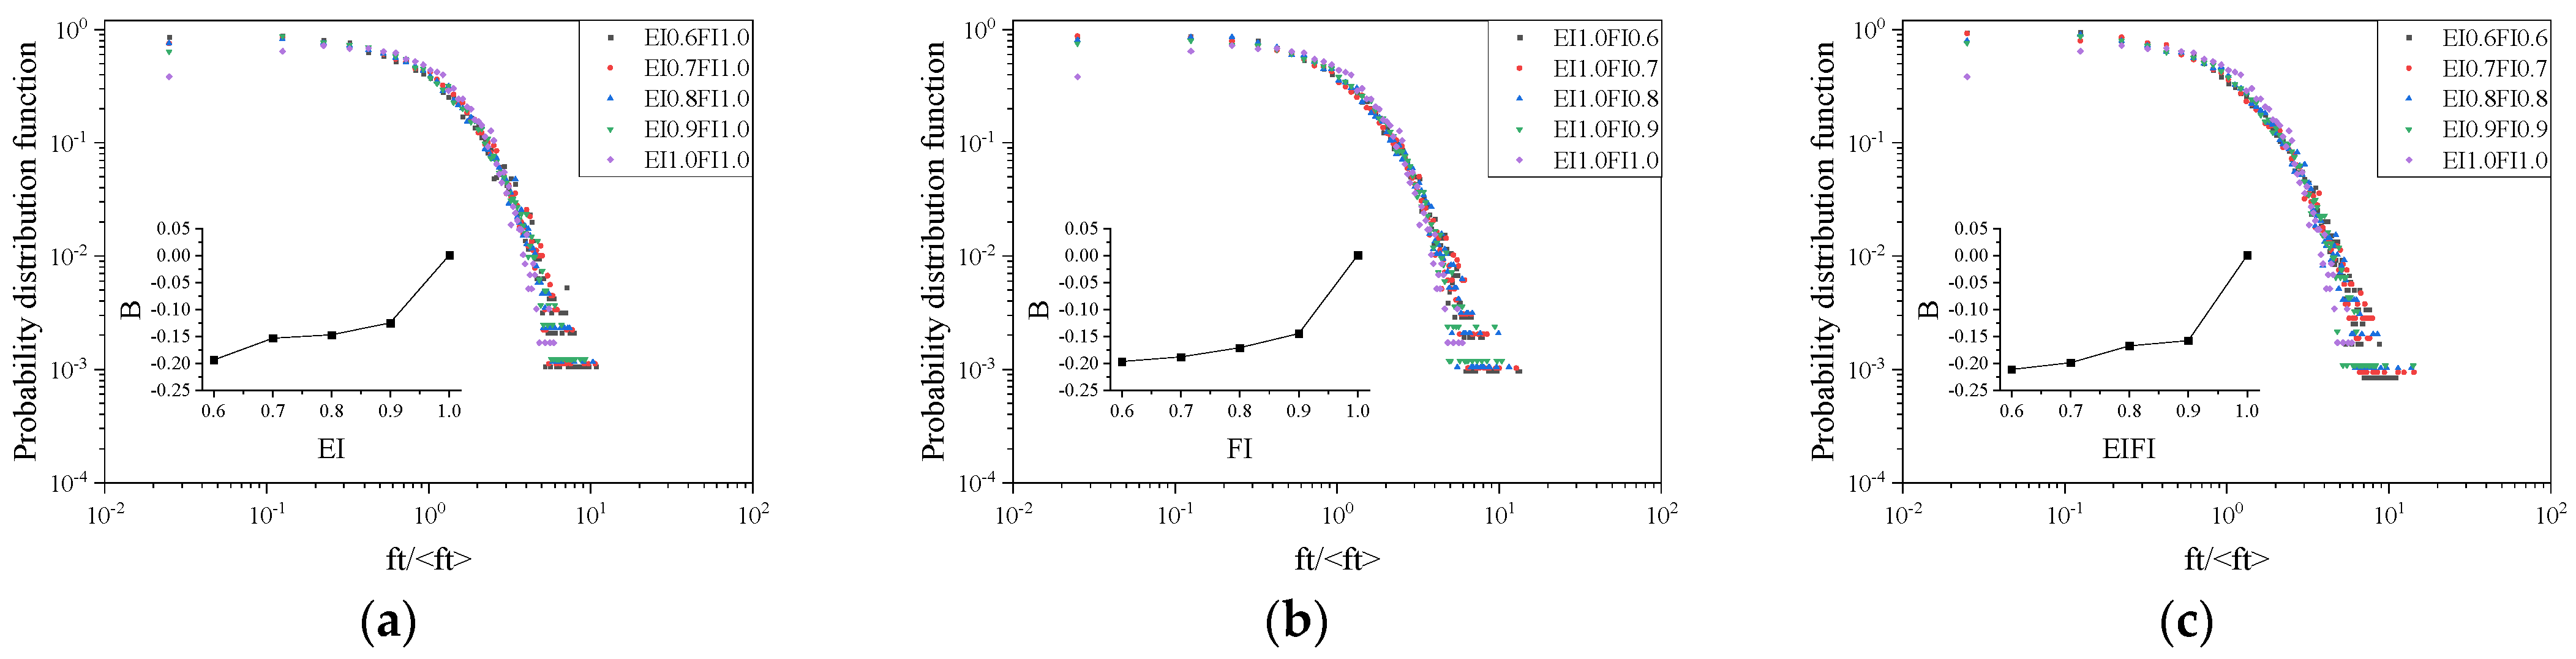
- Probability density
- Normal and tangential contact forces
- 2.
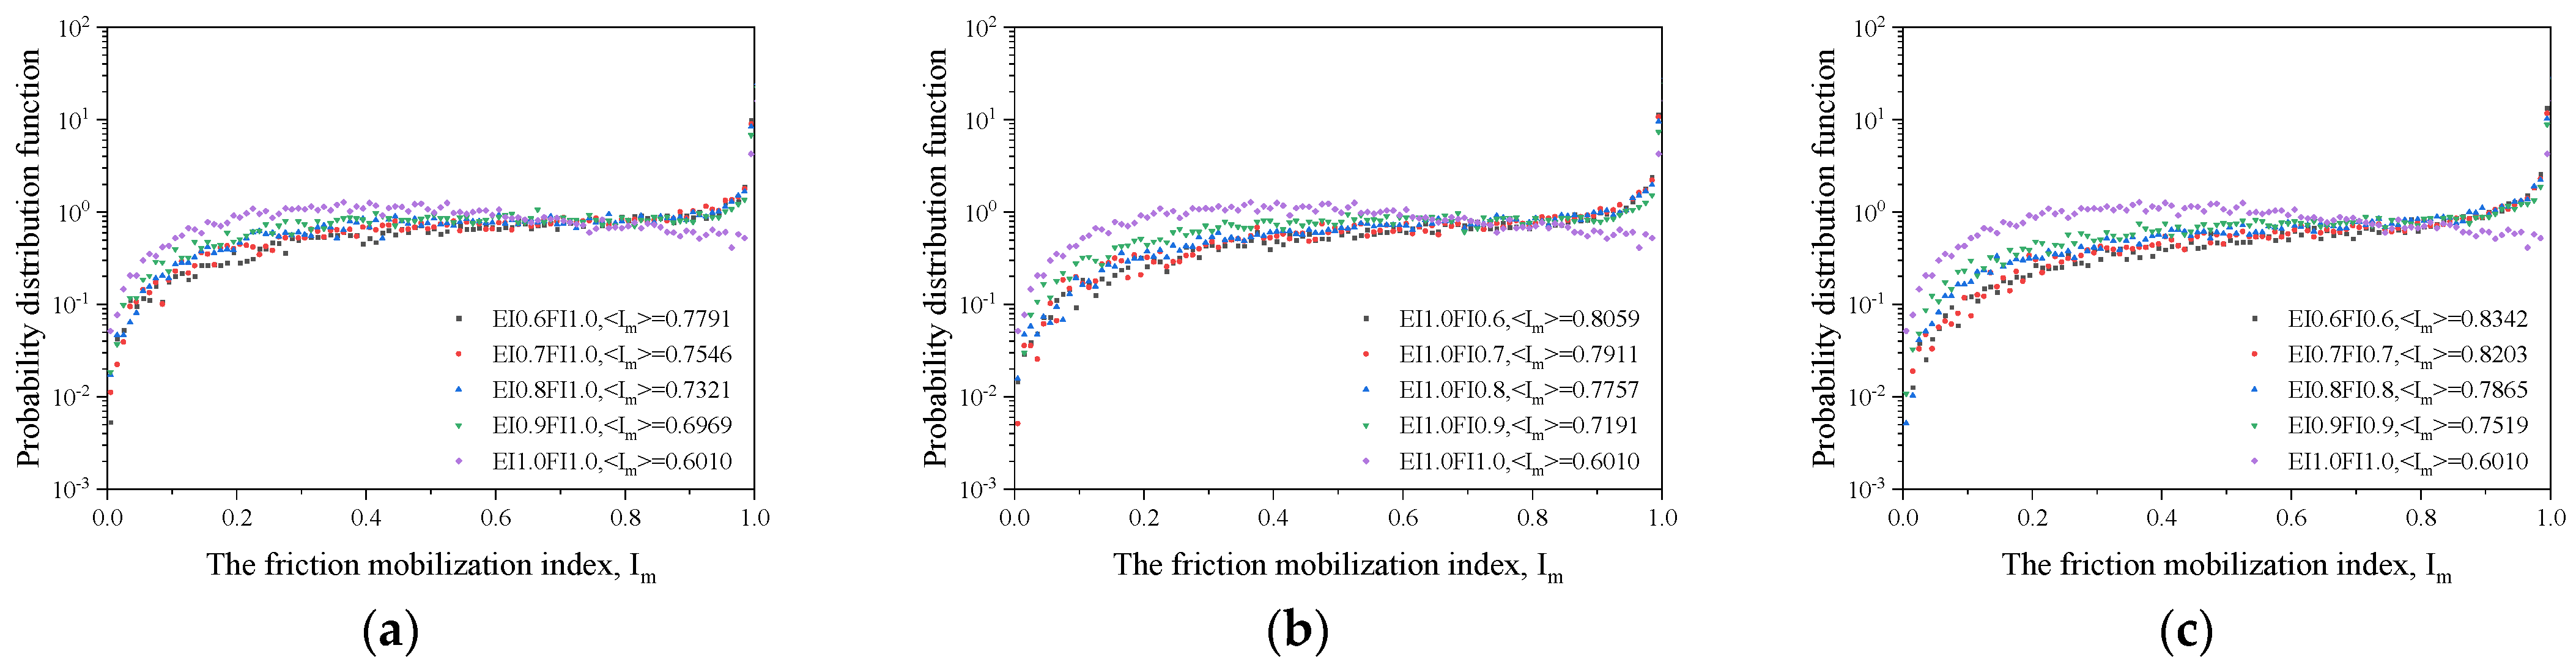
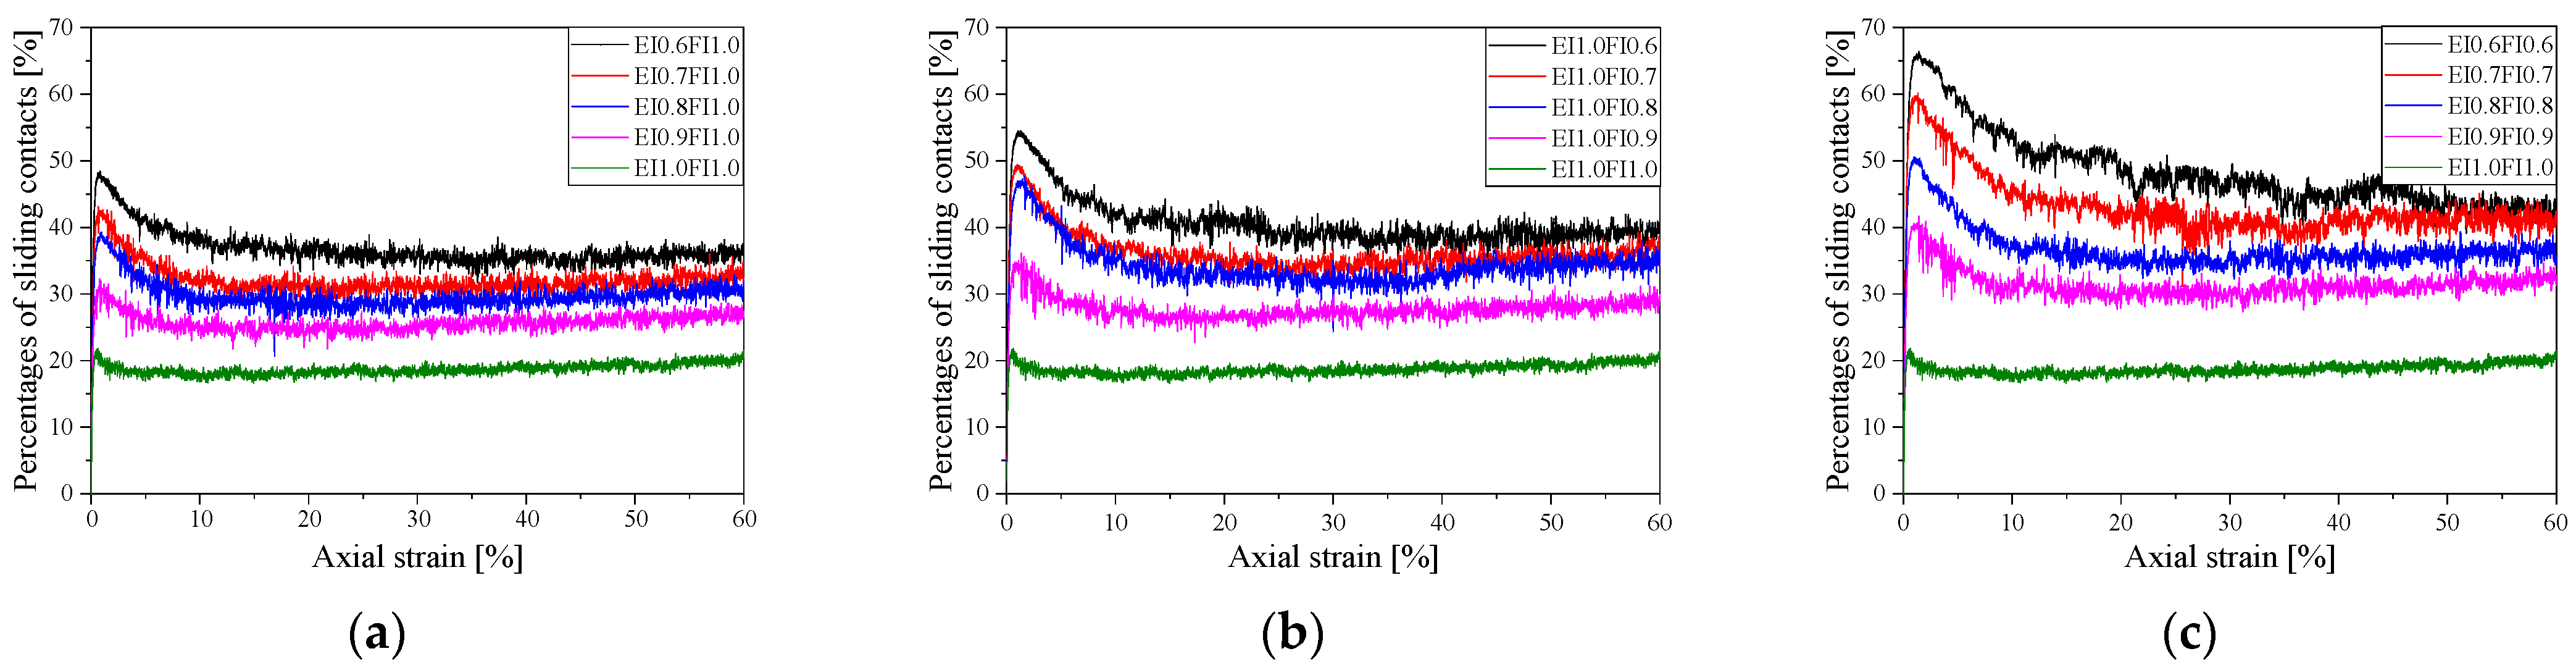
- Mobilized contacts
- Strong contacts
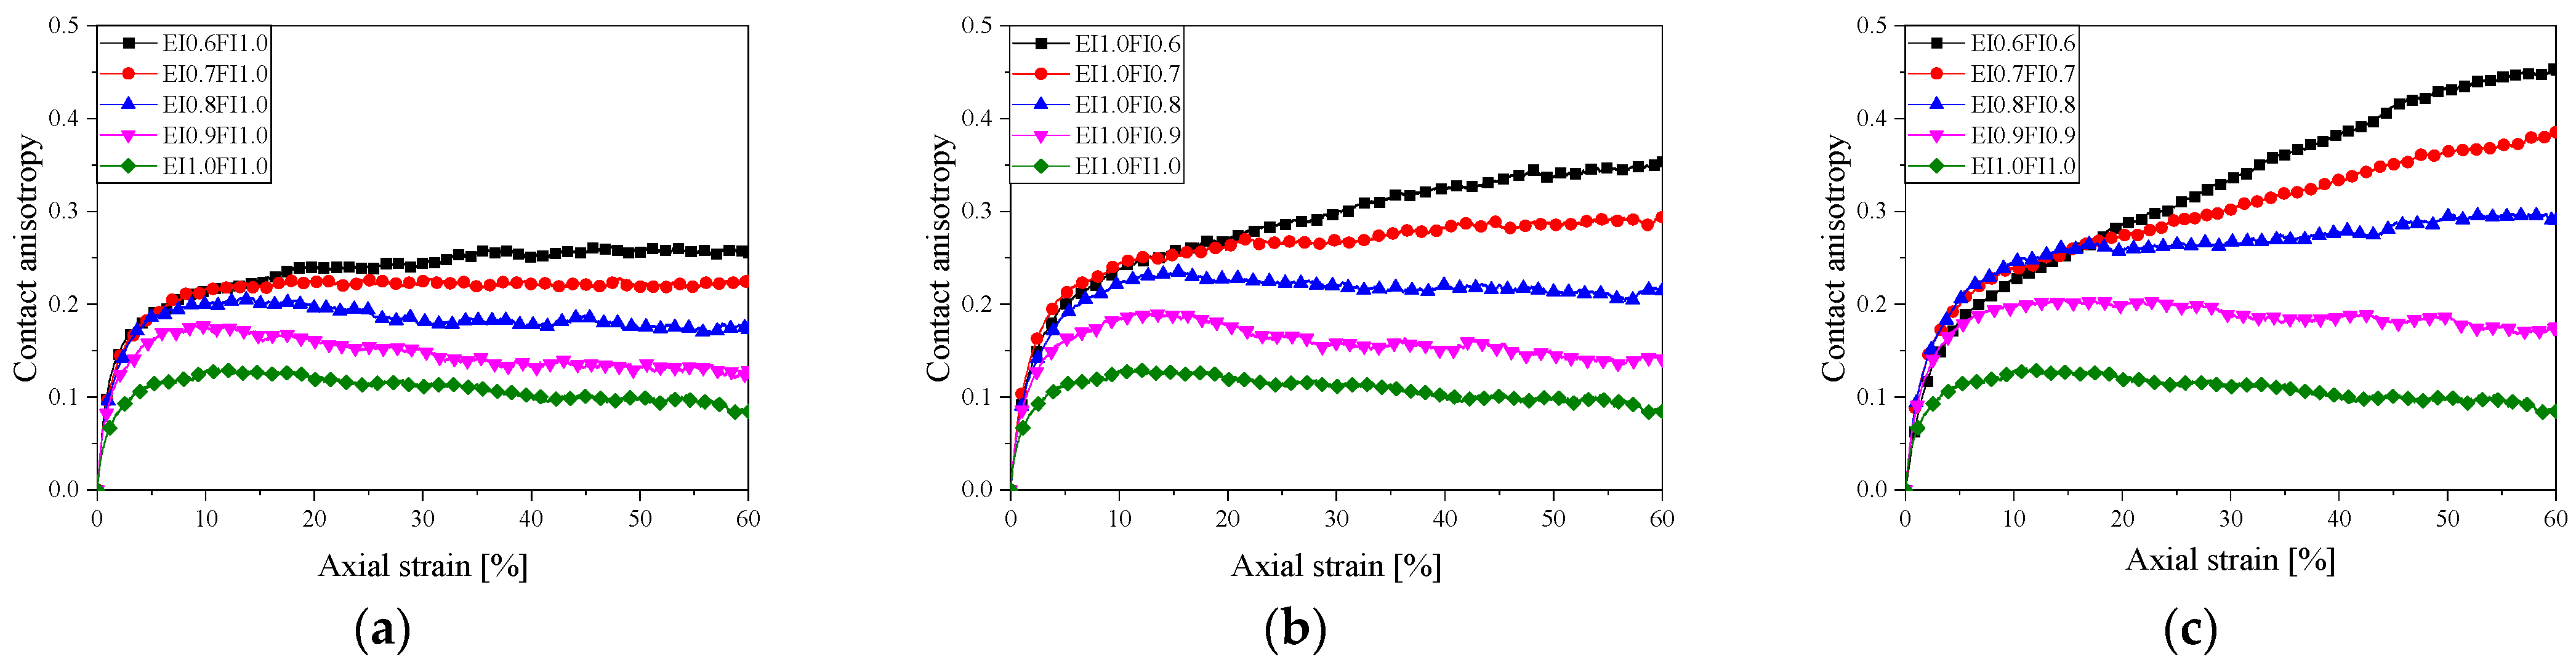
3.2.2. Fabric Anisotropy
4. Conclusions
Author Contributions
Funding
Institutional Review Board Statement
Informed Consent Statement
Data Availability Statement
Conflicts of Interest
Abbreviations
| EI | Elongation Index |
| FI | Flat Index |
| DEM | Discrete Element Method |
| PFC3D | Particle Flow Code |
References
- Chakraborty, A.; Sawant, V.A. Response of embankment on liquefiable soil to sequential ground motions considering mitigation measures. Soil Dyn. Earthq. Eng. 2024, 176, 108278. [Google Scholar] [CrossRef]
- Qiu, W.; LI, Y.L.; Wen, L.F.; Wang, L.; Xu, Z.G. Experimental study on the longitudinal evolution of the overtopping breaching of concrete-face sand-gravel dams. Bull. Eng. Geol. Environ. 2023, 82, 102. [Google Scholar] [CrossRef]
- Zhou, T.; Wei, Y.J.; Jie, Y.X.; Zhang, Y.Y. Prediction intervals for concrete face sandy gravel dam settlement using Kalman filter-based kernel extreme learning machine. Measurement 2024, 236, 115094. [Google Scholar] [CrossRef]
- Wang, C.H.; Liu, S.T.; Liu, L.Q.; Chen, F.; Zhou, X.L. Deformation properties improvement of cement stabilized gravel using rubber: Laboratory and field study. Constr. Build. Mater. 2023, 393, 131975. [Google Scholar] [CrossRef]
- Gao, W.; Iqbal, J.; Hu, R.L. Investigation of geomechanical characterization and size effect of soil-rock mixture: A case study. Bull. Eng. Geol. Environ. 2021, 80, 6263–6274. [Google Scholar] [CrossRef]
- Lu, Y.; Tan, Y.; Li, X.; Liu, C.N. Methodology for Simulation of Irregularly Shaped Gravel Grains and Its Application to DEM Modeling. J. Comput. Civil Eng. 2017, 31, 04017023. [Google Scholar] [CrossRef]
- Wang, S.Y.; Chen, G.X.; Zhang, L.K.; Yuan, J. Triaxial Discrete Element Simulation of Soil–Rock Mixture with Different Rock Particle Shapes under Rigid and Flexible Loading Modes. Int. J. Geomech. 2021, 21, 1532–3641. [Google Scholar] [CrossRef]
- Lv, J.X.; Sun, X.Y.; Wang, H.L.; Wei, L.; Lan, R.Y.; He, T.Q.; Su, W.S. 3D characteristic indicator analysis and comprehensive evaluation of manufactured sand particles used in high-performance concrete. J. Asian Archit. Build 2024, 97, 110671. [Google Scholar] [CrossRef]
- Hu, Y.Y.; Lu, Y. Study on soil-rock slope instability at mesoscopic scale using discrete element method. Comput. Geotech. 2023, 157, 105268. [Google Scholar] [CrossRef]
- Zhang, H.Y.; Xu, W.J.; Yu, Y.Z. Triaxial tests of soil–rock mixtures with different rock block distributions. Soils Found. 2016, 56, 44–56. [Google Scholar] [CrossRef]
- Mahinroosta, R.; Oshtaghi, V. The effect of particle shape on the deformation and stress reduction of a gravel soil due to wetting. Sci. Rep. 2021, 11, 16583. [Google Scholar] [CrossRef] [PubMed]
- Pen, L.M.L.; Powrie, W.; Zervos, A.; Ahmed, S.; Aingaran, S. Dependence of shape on particle size for a crushed rock railway ballast. Granular Matter. 2013, 15, 849–861. [Google Scholar] [CrossRef]
- Cundall, P.A.; Strack, O.D.L. A discrete numerical model for granular assemblies. Géotechnique 1979, 29, 47–65. [Google Scholar] [CrossRef]
- Han, Z.H.; Zhang, L.Q.; Zhou, J. Numerical Investigation of Mineral Grain Shape Effects on Strength and Fracture Behaviors of Rock Material. Appl. Sci. 2019, 9, 2855. [Google Scholar] [CrossRef]
- Zhou, Z.; Li, Z.X.; Zhang, J.Z.; Li, X.; Yang, H. DEM investigation on sandy soil behaviors under the influence of particle shape. Powder Technol. 2024, 441, 119835. [Google Scholar] [CrossRef]
- Wang, Y.; Nie, J.Y.; Zhao, S.W.; Wang, H. A coupled FEM-DEM study on mechanical behaviors of granular soils considering particle breakage. Comput. Geotech. 2023, 160, 105529. [Google Scholar] [CrossRef]
- Zhang, T.; Zhang, C.; Zou, J.Q.; Wang, B.S.; Song, F.N.; Yang, W.H. DEM exploration of the effect of particle shape on particle breakage in granular assemblies. Comput. Geotech. 2020, 122, 103542. [Google Scholar] [CrossRef]
- Hofmann, H.; Babadagli, T.; Zang, A.; Yoon, J.S.; Zimmermann, G. A grain based modeling study of mineralogical factors affecting strength, elastic behavior and micro fracture development during compression tests in granites. Eng. Fract. Mech. 2015, 147, 261–275. [Google Scholar] [CrossRef]
- Wang, Z.H.; Yang, S.L.; Li, L.H.; Tang, Y.S.; Xu, G.L. A 3D Voronoi clump based model for simulating failure behavior of brittle rock. Eng. Fract. Mech. 2021, 248, 107720. [Google Scholar] [CrossRef]
- Thornton, C. Numerical simulations of deviatoric shear deformation of granular media. Géotechnique 2000, 50, 43–53. [Google Scholar] [CrossRef]
- Hosn, R.A.; Sibille, L.; Benahmed, N.; Chareyre, B. Discrete numerical modeling of loose soil with spherical particles and interparticle rolling friction. Granular Matter. 2017, 19, 4. [Google Scholar] [CrossRef]
- Benmebarek, M.A.; Movahedi, R.M. Effect of Rolling Resistance Model Parameters on 3D DEM Modeling of Coarse Sand Direct Shear Test. Materials 2023, 16, 2077. [Google Scholar] [CrossRef] [PubMed]
- Aman, M.; Narasimha, M.; Raja, B. GPU based discrete element modeling for convex polyhedral shape particles: Development and validation. Powder Technol. 2025, 449, 120407. [Google Scholar]
- Sun, J.Z.; Zou, L.; Govender, N.; Martinez-Estévez, I.; Crespo, A.J.C.; Sun, Z.; Dominguez, J.M. A resolved SPH-DEM coupling method for analysing the interaction of polyhedral granular materials with fluid. Comput. Geotech. 2017, 90, 96–112. [Google Scholar] [CrossRef]
- Cui, S.W.; Tan, Y.; Lu, Y. Algorithm for generation of 3D polyhedrons for simulation of rock particles by DEM and its application to tunneling in boulder-soil matrix. Tunn. Undergr. Space Technol. 2020, 106, 103588. [Google Scholar] [CrossRef]
- Zhang, S.H.; Zhao, L.H.; Wang, X.; Huang, D.L. Quantifying the effects of elongation and flatness on the shear behavior of realistic 3D rock aggregates based on DEM modeling. Adv. Powder Technol. 2021, 32, 1318–1332. [Google Scholar] [CrossRef]
- Zuo, L.; Lourenco, S.D.N.; Baudet, B.A. Experimental insight into the particle morphology changes associated with landslide movement. Landslides 2019, 16, 787–798. [Google Scholar] [CrossRef]
- Blott, J.S.; Pye, K. Particle shape: A review and new methods of characterization and classification. Sedimentology 2008, 55, 31–63. [Google Scholar] [CrossRef]
- Gong, J.; Liu, J. Effect of aspect ratio on triaxial compression of multi-sphere ellipsoid assemblies simulated using a discrete element method. Particuology 2016, 32, 49–62. [Google Scholar] [CrossRef]
- Liu, Y.; Liu, X.; Hu, W. Competition mechanism between dilation and interlocking in granular soils: DEM simulation and constitutive modeling. Acta Geotech. 2022, 18, 149–169. [Google Scholar] [CrossRef]
- Fang, C.F.; Gong, J.; Jia, M.T.; Nie, Z.; Li, B.; Mohammed, A. Investigating the effects of elongation and flatness on the shear be-haviour of breakable granular materials via the DEM. Granular Matter. 2022, 24, 78. [Google Scholar] [CrossRef]
- Nie, Z.H.; Fang, C.F.; Gong, J.; Yin, Z.Y. Exploring the effect of particle shape caused by erosion on the shear behaviour of granular materials via the DEM. Int. J. Solids Struct. 2020, 202, 1–11. [Google Scholar] [CrossRef]
- Nie, Z.H.; Fang, C.F.; Gong, J.; Wang, J.F. DEM study on the effect of roundness on the shear behaviour of granular materials. Comput. Geotech. 2020, 121, 103457. [Google Scholar] [CrossRef]
- Azéma, E.; Farhang, R. Force chains and contact network topology in sheared packings of elongated particles. Phys. Rev. E. 2012, 85, 031303. [Google Scholar] [CrossRef]
- Nie, J.Y.; Cao, Z.J.; Li, D.Q.; Cui, Y.F. 3D DEM insights into the effect of particle overall regularity on macro and micro mechanical behaviours of dense sands. Comput. Geotech. 2021, 132, 103965. [Google Scholar] [CrossRef]
- Satake, M. Fabric tensor in granular materials. In Proceedings of the IUTAM Conference on Deformation and Failure of Granular Materials, Delft, The Netherlands, 31 August–3 September 1982; pp. 63–68. [Google Scholar]


| Group I EI-FI synergistic change |  EI0.6FI0.6 |  EI0.7FI0.7 |  EI0.8FI0.8 |  EI0.9FI0.9 |  EI1.0FI1.0 |
| Group II FI constant (EI gradient variation) |  EI0.6FI1.0 |  EI0.7FI1.0 |  EI0.8FI1.0 |  EI0.9FI1.0 |  EI1.0FI1.0 |
| Group III EI constant (FI gradient variation) |  EI1.0FI0.6 |  EI1.0FI0.7 |  EI1.0FI0.8 |  EI1.0FI0.9 |  EI1.0FI1.0 |
| Parameter | Value |
|---|---|
| Particle density, [] | 2600 |
| Particle–particle friction coefficient, μ | 0.5 |
| Wall–particle friction coefficient, μw | 0 |
| Damping coefficient, [N/(m/s)] | 0.7 |
| Particle–wall contact modulus [] | |
| Particle–particle contact modulus [] | |
| 1.0 |
Disclaimer/Publisher’s Note: The statements, opinions and data contained in all publications are solely those of the individual author(s) and contributor(s) and not of MDPI and/or the editor(s). MDPI and/or the editor(s) disclaim responsibility for any injury to people or property resulting from any ideas, methods, instructions or products referred to in the content. |
© 2025 by the authors. Licensee MDPI, Basel, Switzerland. This article is an open access article distributed under the terms and conditions of the Creative Commons Attribution (CC BY) license (https://creativecommons.org/licenses/by/4.0/).
Share and Cite
Liu, Y.; Cao, Z.; Mao, H. The Synergistic Effects of the Particle Elongation Index and Flat Index on Aggregate Strength and Dilatancy: A Discrete Element Method Study. Appl. Sci. 2025, 15, 5567. https://doi.org/10.3390/app15105567
Liu Y, Cao Z, Mao H. The Synergistic Effects of the Particle Elongation Index and Flat Index on Aggregate Strength and Dilatancy: A Discrete Element Method Study. Applied Sciences. 2025; 15(10):5567. https://doi.org/10.3390/app15105567
Chicago/Turabian StyleLiu, Yiming, Zhangshuaihang Cao, and Haijun Mao. 2025. "The Synergistic Effects of the Particle Elongation Index and Flat Index on Aggregate Strength and Dilatancy: A Discrete Element Method Study" Applied Sciences 15, no. 10: 5567. https://doi.org/10.3390/app15105567
APA StyleLiu, Y., Cao, Z., & Mao, H. (2025). The Synergistic Effects of the Particle Elongation Index and Flat Index on Aggregate Strength and Dilatancy: A Discrete Element Method Study. Applied Sciences, 15(10), 5567. https://doi.org/10.3390/app15105567