Article

Empowering Optimal Operations with Renewable Energy Solutions for Grid Connected Merredin WA Mining Sector

1
School of Engineering, Edith Cowan University, 270 Joondalup Drive, Joondalup, WA 6027, Australia
2
School of Electrical Engineering, Computing and Mathematical Sciences, Curtin University, Perth, WA 6102, Australia
*
Author to whom correspondence should be addressed.
Appl. Sci. 2025, 15(10), 5516; https://doi.org/10.3390/app15105516
Submission received: 24 March 2025 / Revised: 9 May 2025 / Accepted: 9 May 2025 / Published: 14 May 2025
(This article belongs to the Special Issue Design, Optimization and Control Strategy of Smart Grids)

Abstract

:
Mining sectors require a continuous and reliable power supply; however, reliance on traditional grid utilities results in high costs and disruptions and increases extreme carbon emission. The Merredin WA sector seeks to resolve critical energy challenges affecting mining operations in Western Australia. Thus, this research proposes an optimal solar PV system with battery storage and backup generation for the mining sector to ensure a stable and cost-effective power supply that reduces harmful environmental effect. A hybrid data-driven long short-term memory (LSTM)-classical optimization framework is designed here, thereby optimizing PV-battery storage operational cost savings and energy usage. The optimization results indicate that approximately 57% of load demand can be fulfilled by the proposed optimal PV system with future cost savings of USD $8627.53 per annum. The optimization method also resulted in the lowest computation time of 1.153 s and highest accuracy 99.247% when compared with other existing algorithms. Furthermore, the integration of renewable energy (RE) technologies within mining operations substantially reduces carbon emissions by 67%, thus contributing to broader global sustainability purposes. The study presents a sustainable and economically viable energy solution for mining operations, setting a precedent for RE adoption in remote and energy-intensive industries.

1. Introduction

The Merredin region of Western Australia holds strategic importance due to its significant mining operations, which contribute to regional employment and economic development. However, the high energy demands of mining sectors present a major challenge requiring a stable and continuous power supply in remote areas where grid connectivity can become limited and unreliable [1,2].
Hydrogen-based hybrid energy system was proposed in [3] considering Pakistan’s Bannu district. The applied method was able to decrease the total net present cost (NPC) and cost of energy (COE) by 21.7% and 19.8%, correspondingly. It further recommended to study on the global applicability. In [4], hydrogen-based solar-powered energy system was studied for Balochistan, Pakistan region. The implemented optimal framework reduced COE and NPC by 26.9% and 3.0% respectively that recommended to study on other rural areas for future research. The technical and financial feasibility of PV-wind-hydrogen system installed in Cooma, Australia was analyzed in [5]. The authors concluded that around 9.2% efficiency can be found from the hybrid system whereas hydrogen subsystem was expensive compared to other sources. It further recommended to investigated on other Australia regions.
Traditionally, Western Australia’s mining sectors have relied on grid electricity systems for large-scale operations, where this has considerable limitations. Firstly, due to voltage fluctuations, supply shortages, and network failures, grid power in remote areas such as Merredin can be inconsistent, leading to operational disruptions. Secondly, the high cost of purchasing electricity from the grid places a significant financial burden on mining companies, particularly given the energy-intensive nature of their activities [6]. Moreover, reliance on conventional energy sources, such as fossil fuels, contributes to substantial carbon emissions, which conflict with growing environmental and sustainability concerns in the industry.
The Merredin WA Solar Project aims to address these challenges by providing a clean, reliable, and cost-effective alternative energy sources for the region. At the core of this initiative is the development of a solar photovoltaic (PV) system designed to harness the region’s abundant solar energy resources [6]. Merredin receives exceptionally high leveled solar radiation, making it an ideal location for large-scale solar power generation. With this, the study seeks to integrate advanced battery storage technology to ensure continuous power availability in the region, including during nighttime hours and periods of low sunlight. This hybrid system enhances energy reliability and minimizes dependence on the conventional power grid [7,8]. Since energy security is a key operation in mining industries, the Merredin WA Solar Project can reduce the mining sector’s vulnerability to grid power disruptions [9,10]. This self-sufficiency of energy also provides long-term economic benefits by insulating mining companies from fluctuations in electricity prices and potential cost increases associated with fossil fuel-based power generation [11,12].
However, using data pre-processing subsequent to data collection to obtain the optimal solutions regarding cost savings remains a challenging objective. The collected data from remote and harsh environments indicate that mining sectors are susceptible to system instability that may result in blackouts. Therefore, recent studies in mining energy systems [13,14,15,16] highlighted data analytics of mining industries and suggested pre-processing to achieve a global optimization result. The authors recommended to apply machine learning algorithms for data processing and obtain the optimal solution in mining industry.
Similarly for mining operations, the Merredin WA mining sector can serve as a model for other industries and regions, demonstrating the feasibility and advantages of renewable energy solutions for energy-intensive operations [17,18]. The project’s scalability and replicability can make it a significant case study in the broader transition towards sustainable energy sources, particularly in areas where conventional grid electricity is unreliable or prohibitively expensive [19,20]. However, no research is still found based on the authors knowledge about Merredin WA mining operations. Therefore, this research aims to present a reliable, cost-effective, and environmentally sustainable energy solution for Merredin WA mining sector. A hybrid data-driven long LSTM-classical optimization framework is designed, that optimizes PV-battery storage operational cost savings and energy usage. As the mining industry seeks to reduce operational costs and its harmful environmental impact, this initiative stands as a pioneering effort for the integration of RE technologies.
The research paper is arranged as follows: Section 2 and Section 3 detailed about the methodology and it’s produced results respectively. The conclusion is drawn in Section 4.

2. Methodology and Materials

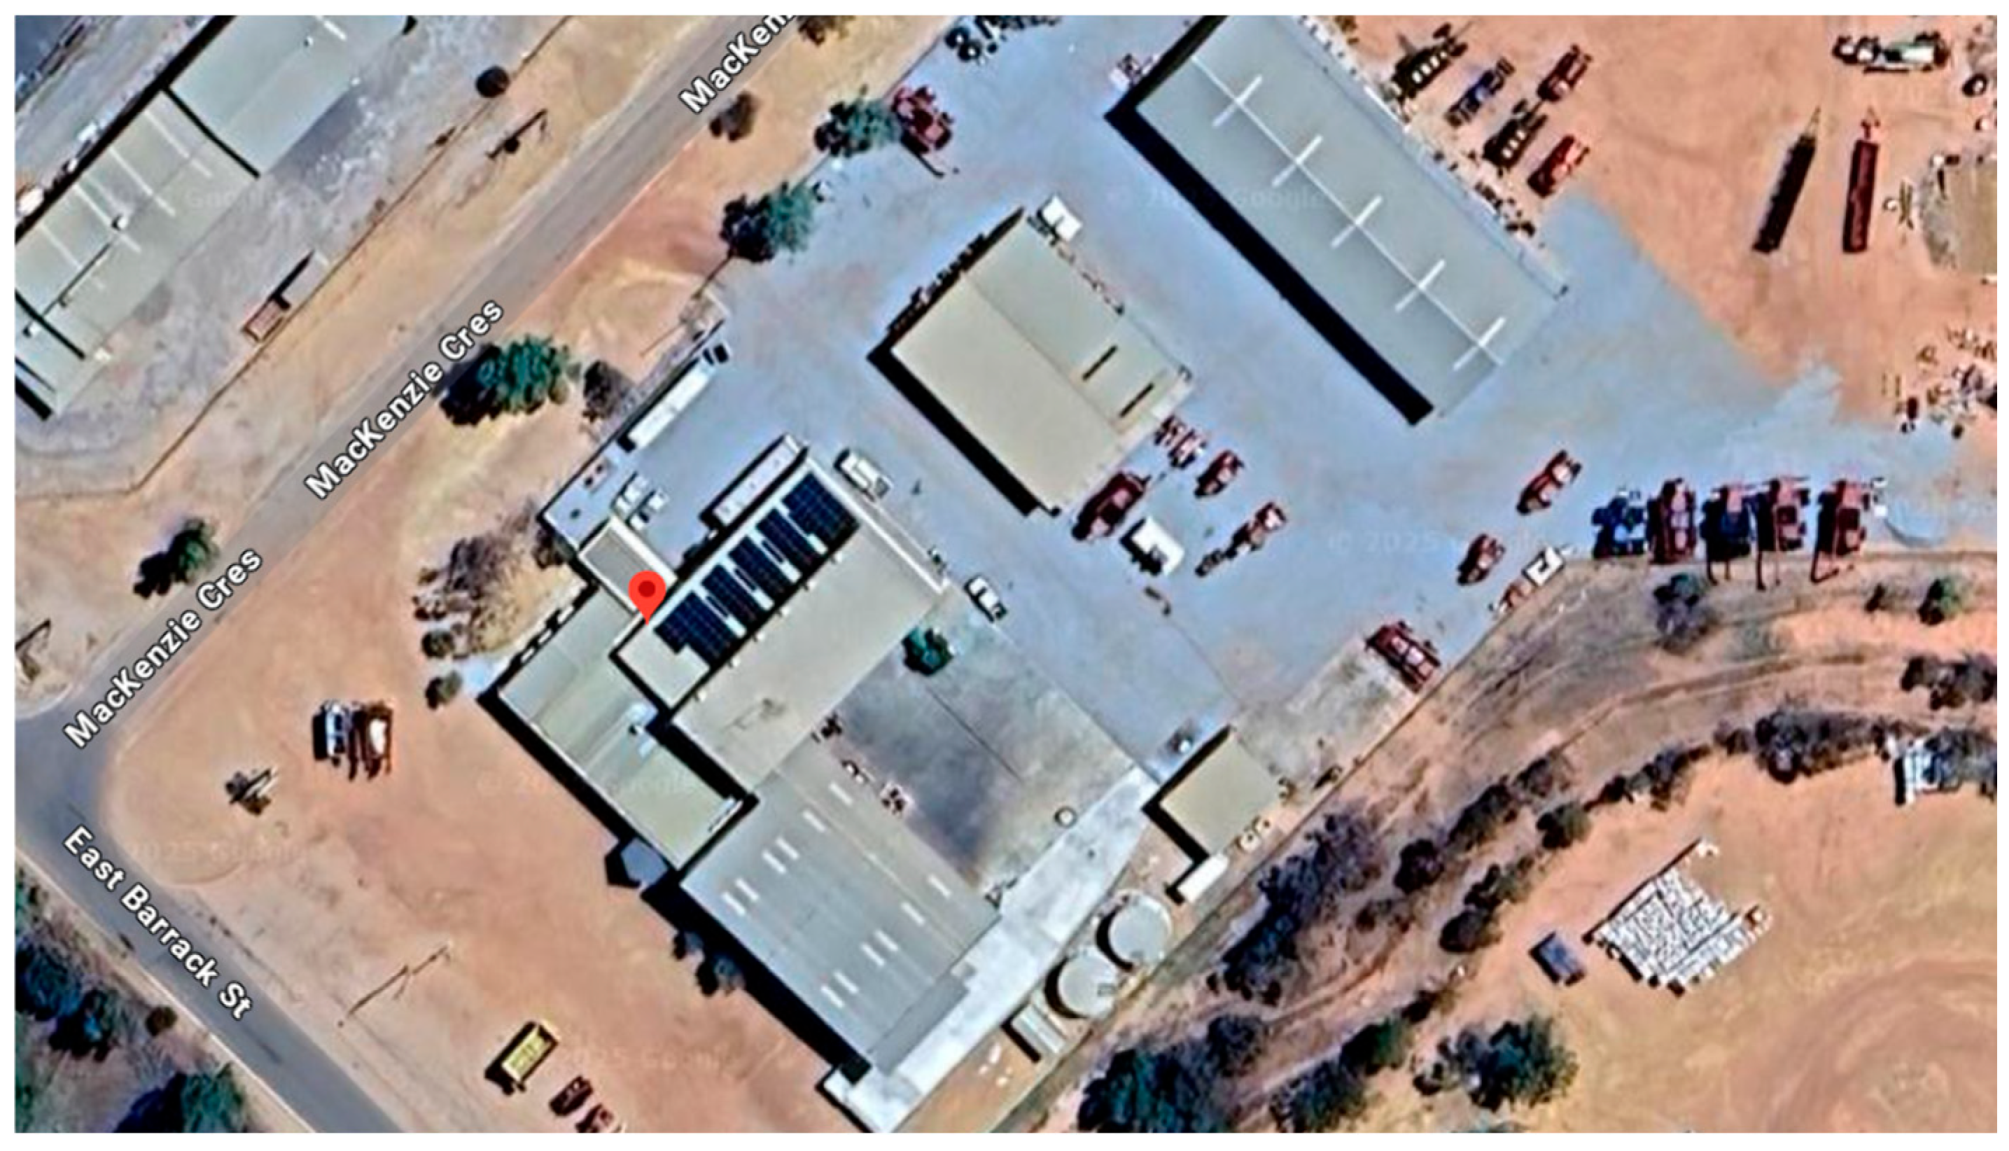
2.1. Site Feasibility

For real-time application, site inspection of the Merredin WA Power Grid System was initially performed to determine the optimal location for solar panel installation, considering factors such as global horizontal irradiance (GHI), land availability, and proximity to mining infrastructure. This inspection assessed current energy consumption, grid dependency, and electricity costs for mining activities [2]. The study confirmed that Meredin’s high solar radiation levels render it an ideal location for a large-scale solar PV power project [21]. The findings indicated an average solar radiation level of 5.51 kWh/m²/day, confirming the site’s potential for efficient solar energy generation [3]. Further, the assessment indicated that the project posed minimal environmental risks while offering significant sustainability benefits by reducing carbon emissions [22].

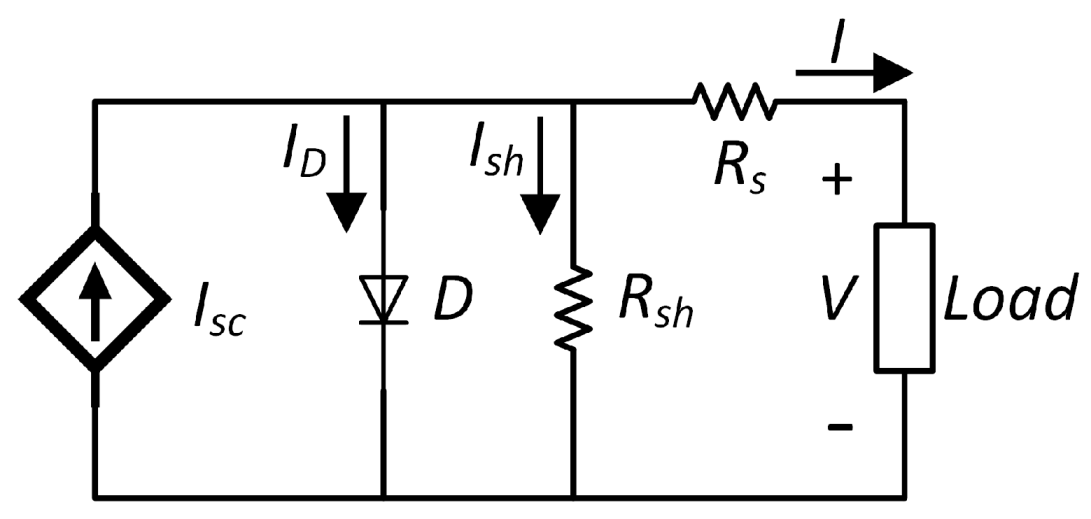
2.2. Solar PV Modeling

PV panels regulate power output through series or parallel-coupled solar cells. Two main PV cell models exist: double-diode and single-diode. The high precision requirements of power electronics applications necessitate accurate PV module modeling. This consists of a current source ( I S C ) in ampere, diode (D), series ( R S ) and shunt ( R s h ) resistors in ohm. As shown in Figure 1, Kirchhoff’s Current Law (KCL) provides the following expression for the output current ( I P V ) in ampere [23],
I P V = n p I L I D V D R s h    
Equation (2) provides the calculation for the diode current ( I D ):
I D = n p I O S e x p q ( V + I R s n s A K T 1
In Equation (2), I O S , q ,   V ,   R S , n S , A ,   k ,   and T ,   represent reverse saturation current in ampere, electron charge in coulomb, output voltage in volt, cell current in ampere, series resistance in ohm, number of series-connected cells, ideality factor, Boltzmann constant, and cell temperature in Kelvin respectively. With this, light-generated current ( I L ) and reverse saturation current ( I O S ) in ampere are affected by solar irradiance and atmospheric temperature in Kelvin which are further determined using Equation (3) and Equation (4) correspondingly.
I L = ψ ψ s h [ I L r e f + μ I s c T T r e f   ]
I O S = D f T 3 e x p q E A K T
Here, ψ and   ψ s h represent the existing and reference irradiances respectively; μ is coefficient efficiency of temperature ( 0.004   K 1 ); I L r e f , T , T r e f   ,   D f and E are light-current in ampere at reference conditions, present temperature in Kelvin, reference temperature in Kelvin, diode diffusion factor, and bandgap energy correspondingly [24].

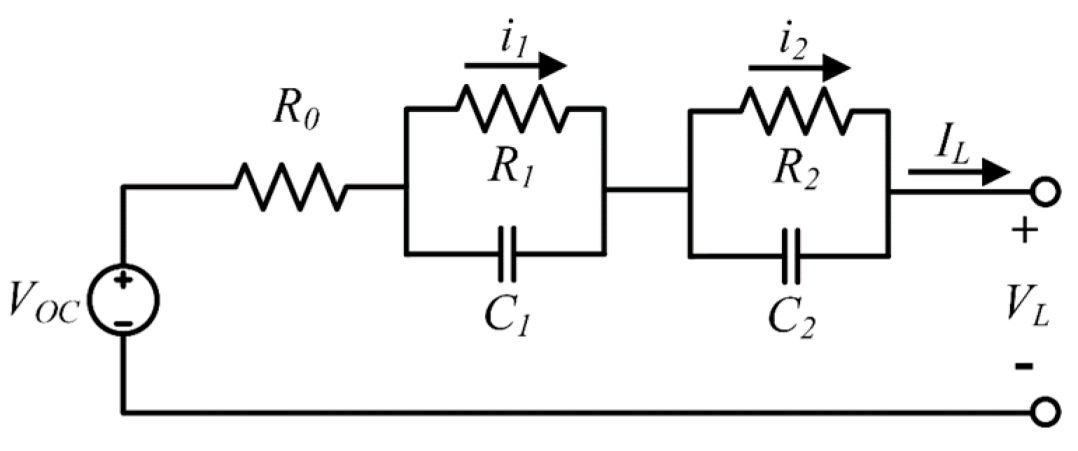
2.3. Battery Energy Storage System (BESS)

Battery systems ensure energy availability during low sunlight periods (e.g., nighttime or cloudy days). Lithium-ion battery storage has been selected due to its high energy density, long lifecycle, and cost-effectiveness. Battery models are mainly classified into two types: electrochemical models and Equivalent Circuit Models (ECM). Whilst electrochemical models analyze internal chemical reactions for high accuracy, they are complex. ECMs, in contrast, focus on external characteristics, avoiding internal reaction details. This study applied the Thevenin ECM (Figure 2), where V L is the terminal voltage and V O C is the open-circuit voltage (OCV) in volt, where their relationship is given by [25],
V L = V O C I L × R O I L I 1 C 1 d t I L I 2 C 2 d t
Where, I 1   =   V 1 / R 1 and I 2 = V 2 / R 2 in ampere. Additionally, BESS improves Self-Consumption Rate (SCR) and Self-Sufficiency Rate (SSR), which are crucial for Behind-the-Meter (BtM) systems. SCR measures the portion of PV production consumed locally, while SSR represents the fraction of building consumption covered by PV energy [26],
SCR = { n = 1 t D P V n + n = 1 t B C H n } / n = 1 t P n
SSR = { n = 1 t D P V n + n = 1 t B D S n } / n = 1 t C n
where, n = Year, t = System lifetime, D P V n = Annual direct PV consumption (kWh), B C H n = Annual BESS energy charge (kWh), P n = Annual PV production (kWh), B D S n   = Annual BESS discharge (kWh) and C n = Annual energy consumption (kWh).

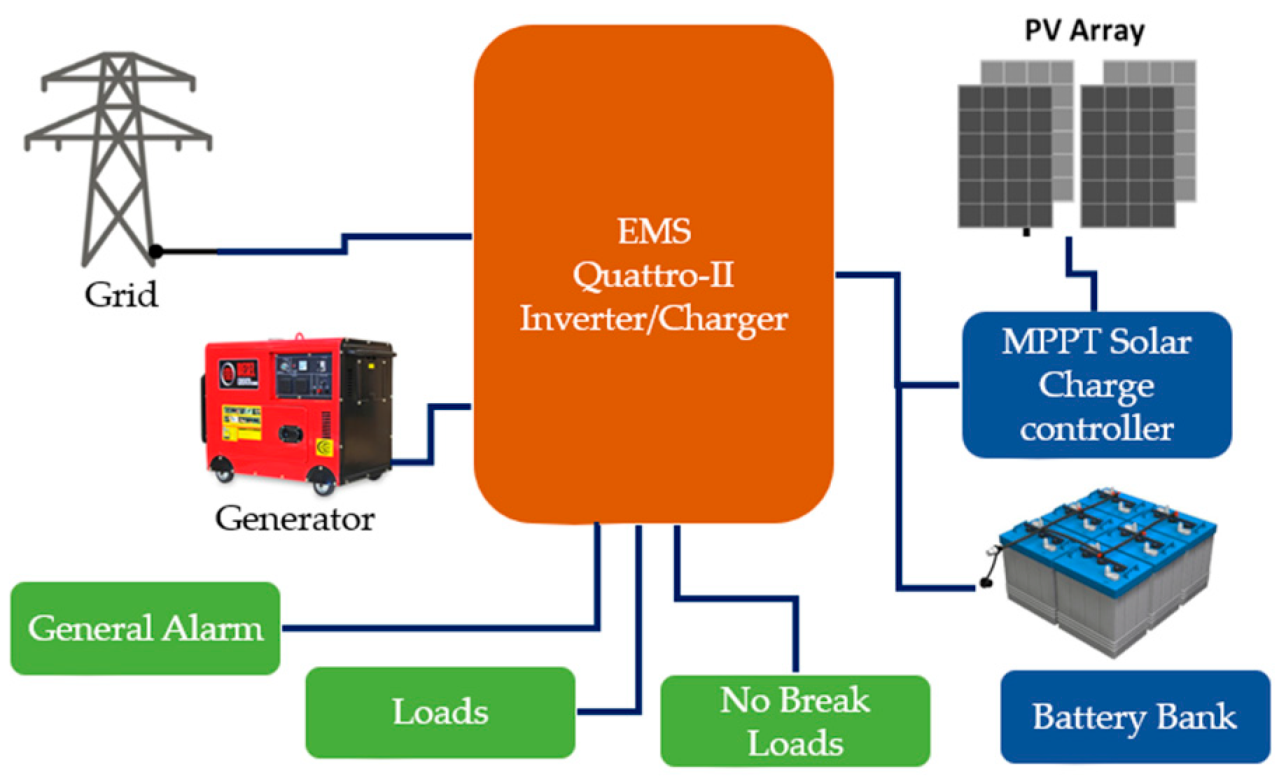
2.4. Implementation Plan

The PV system design of the Merredin site is showed in Figure 3 where a 33-kW system has been recommended after analyzing the mining site’s load profile [27]. The location is -31.480950136511282, 118.29490272442759 measured by Google map. High-performance monocrystalline panels, each with a power output of 400–450 W, are selected to maximize efficiency in varying weather conditions. Table 1 illustrates the properties of the solar panels. A single-axis tracking system can be integrated to enhance energy output by 17–25% while adjusting the panels’ tilt according to the sun’s position [28,29,30]. Installation of the solar PV system and battery storage system are meticulously planned and executed in a phased manner to minimize disruption to ongoing mining activities. A diesel generator is also included as a fail-safe mechanism, automatically activating when battery charge levels drop below a critical threshold or energy demand exceeds the solar and battery system’s capacity. A detailed system block diagram illustrating the setup is provided in Figure 4.

2.5. Data Collection and Performance Monitoring

2.5.1. Performance Monitoring

A 27.7 kW inverter is deployed to convert solar-generated DC power into AC for mining operations. An energy management system (EMS) is integrated to monitor energy production and consumption in real-time, optimizing the use of stored energy during peak demand periods. Additionally, real-time monitoring sensors are installed to track energy generation, battery charge/discharge cycles, generator usage, and fuel consumption. The collected data is analyzed to optimize system performance using smart energy management system and identify areas for improvement. The analysis is performed with the assumption3% p.a. escalation in power cost [31] and 0.8% p.a. degradation [32] in panel efficiency.

2.5.2. Environmental Impact Monitoring
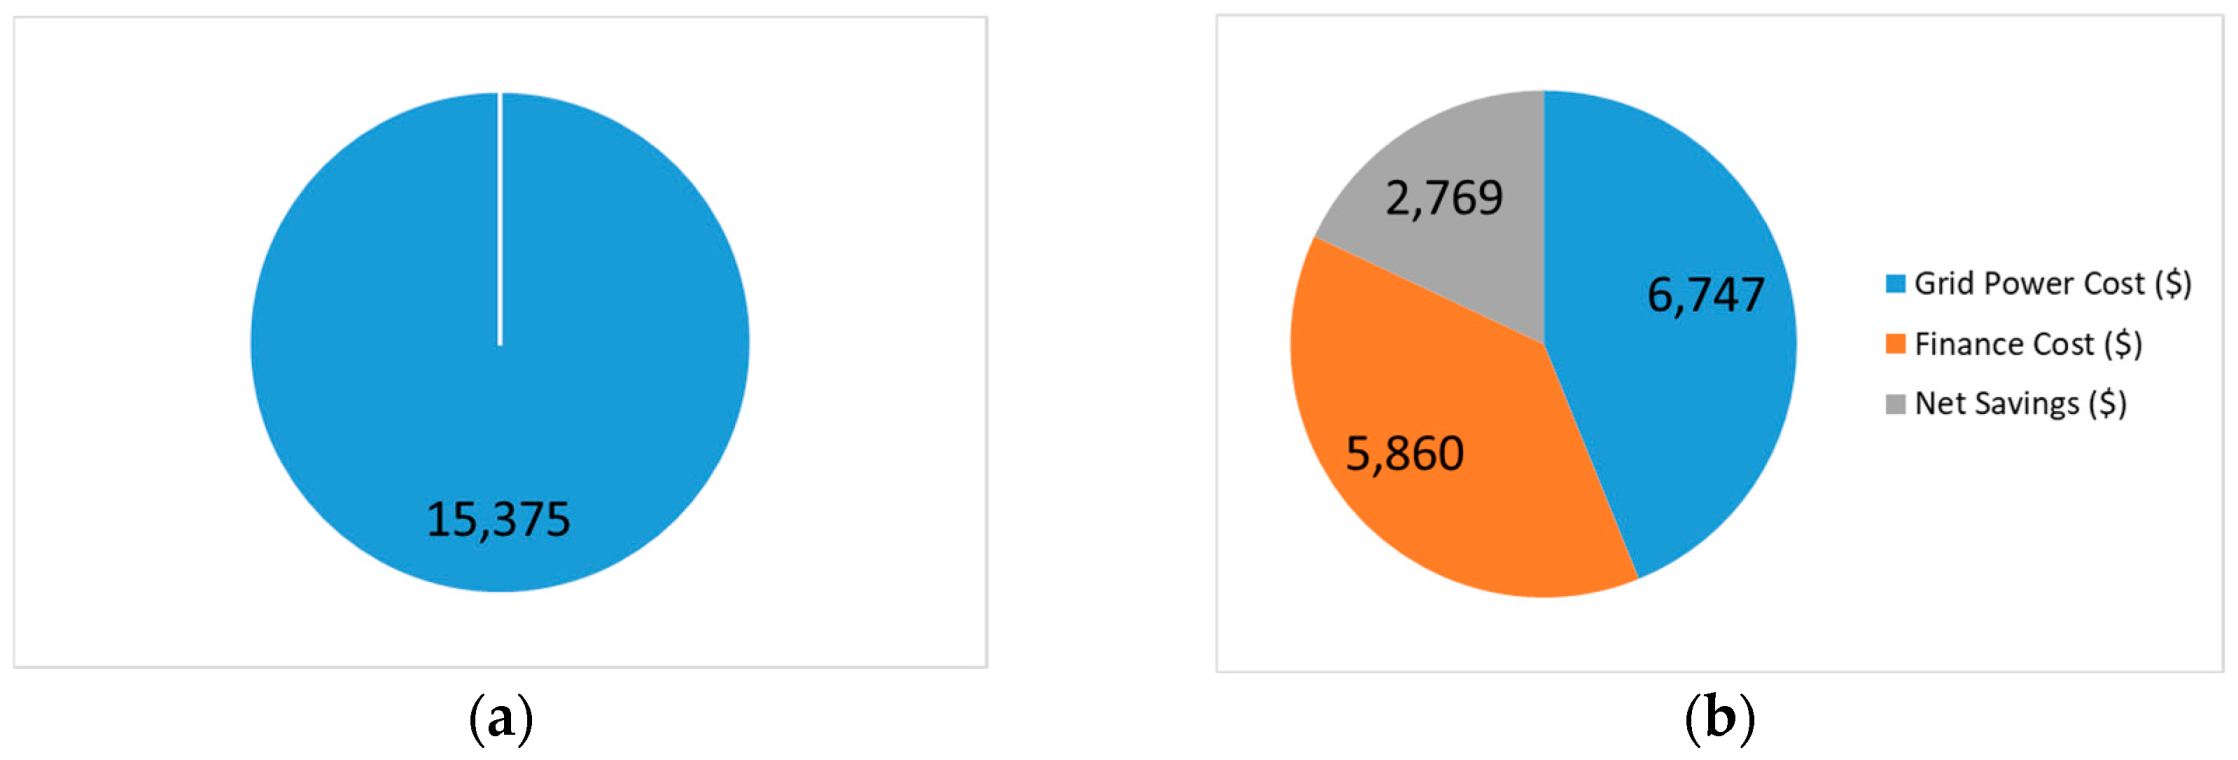
Greenhouse gas (GHG) emissions and fuel consumption data are recorded to quantify the project’s sustainability benefits. The designed system can significantly reduce the reliance on fossil fuels, lowering carbon emissions ( E C a r b o n ) in percentage and enhancing environmental conservation using Equations (8) and (9) [33,34].
m i n   E C a r b o n = i = 1 n C b a s e t C c u r t C b a s e t × 100 % ;
s . t .   C t = i = 1 n F i × E F i
Here, n is number of years, C b a s e and C c u r , F i and E F i 2.69 are carbon emissions in the baseline year and current year, fuel consumption and emission factor respectively.

2.6. Cost Savings

To maximize cost savings, classical optimization model in CPLEX solver software environment is applied in this research. The optimization method minimizes the grid-operational cost ( C o p t ) by Equation (10) and calculates maximum cost savings ( S c o s t ) using Equation (11),
m i n   C o p t t = i = 1 t C g r i d i × P g r i d i i = 1 t C F i T i × P e x p o r t i
s . t .   P P V t + P b a t t + P g r i d t P l o a d t = 0 S c o s t t = i = 1 t ( C i n t i C opt i
Here, P g r i d t , P e x p o r t t , P l o a d t indicate power imported from grid, exported to grid and load power at time t respectively. With this, C g r i d t , C F i T t and C i n t t symbolize for grid tariff, feed-in-tariff and grid’s initial cost before optimization correspondingly. The data information regarding the projection are collected from reference [35].

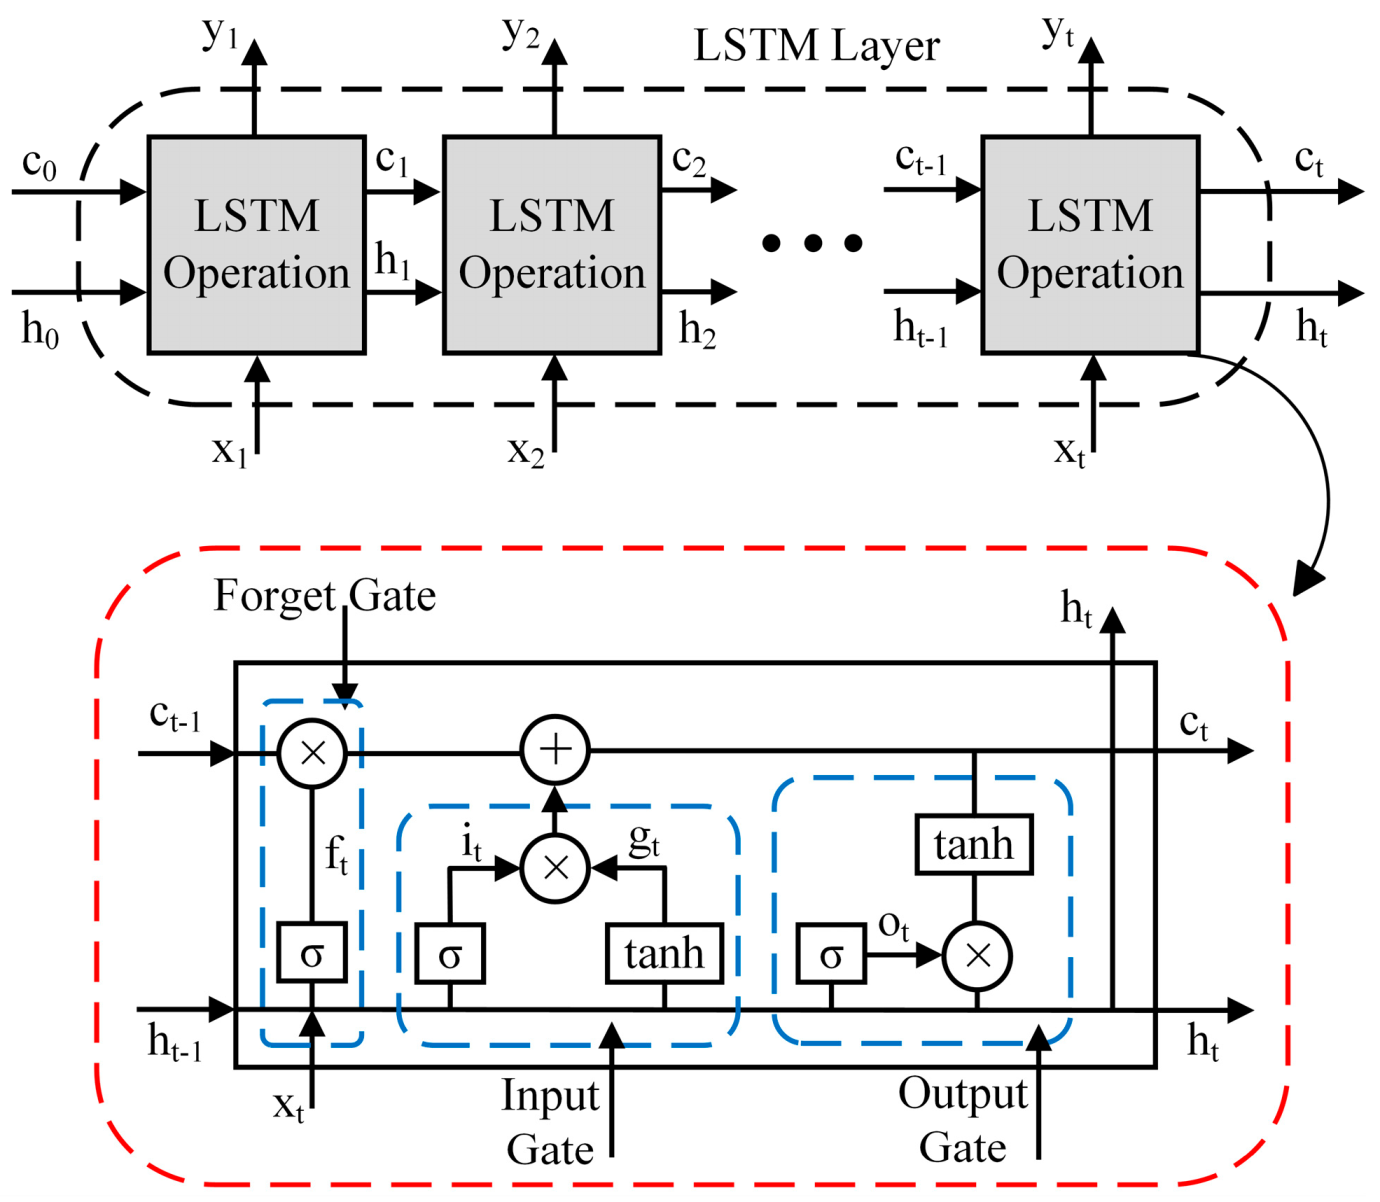
2.7. Optimization Method

The proposed data-driven optimization method is designed with data processing and data optimization functions, as follows:

2.7.1. Data Processing

The data processing is performed by designing an LSTM model corresponding to data sequence ( x ) and time step ( t ). The LSTM algorithm is chosen due to its memory cell architecture that retains information over longer sequences and avoid issues such as vanishing gradients, making it ideal for capturing long-term dependencies in highly dynamic and nonlinear datasets. With this, the sampling frequency of LSTM input data is specified ten second over one year. From Figure 5, data analysis is performed using the LSTM parameters of operation block: memory cell c , and hidden cell h , input gate ( i t ), forget gate ( f t ), input node ( g t ), and output gate ( o t ). Output response o t is calculated by Equations (12) to (16) at time t [36].
f t = σ w f x x t + w f h h t 1 + b f
i t = σ w i x x t + w i h h t 1 + b i
g t = τ w g x x t + w g h h t 1 + b g
c t = c t 1 f t + g t i t
h t = τ ( c t ) o t
Here, w and b are weighted vectors and bias of the particular gates, ⊙ presents elementwise/dot multiplication; σ and τ are sigmoid and tangent activation functions respectively.

2.7.2. Data Optimization

Data processed by the abovementioned LSTM model is employed to design the optimization model. In this research, the classical optimization method is implemented using CPLEX solver to achieve a global solution from the designed optimization model, using Equations (17) to (18). The time step is specified ten second over one year. The approached mixed-integer nonlinear programming optimization method is presented in Figure 6. This results to minimize cost and carbon emission values using Equations (1) to (16) considering decision variables grid power consumption and carbon emission of the present year; and associated parameters load power, initial grid cost, operational cost, grid tariff, feed-in-tariff, fuel consumption, emission factor and so others. Accordingly, the optimal cost savings and carbon emission are obtained. The optimization formula is presented in Algorithm 1. Additionally, the accuracy of the results is determined using mean absolute percentage error (MAPE) metric using Equation (19),
m i n i = 1 t C g r i d i × P g r i d i i = 1 t C F i T i × P e x p o r t i i = 1 n C b a s e i C c u r i C b a s e i × 100 %
s . t . P P V t + P b a t t + P g r i d t P l o a d t = 0 S c o s t t = i = 1 t ( C i n t i C opt i   C t = i = 1 n F i × E F i
A c c u r a c y = 100 % M A P E ;   M A P E = 1 n i = 1 n A i P i A i
Here, n is number of iterations, A i and P i are actual and predicted values of the datasets respectively.
Figure 6. Proposed optimization framework.
Applsci 15 05516 g006
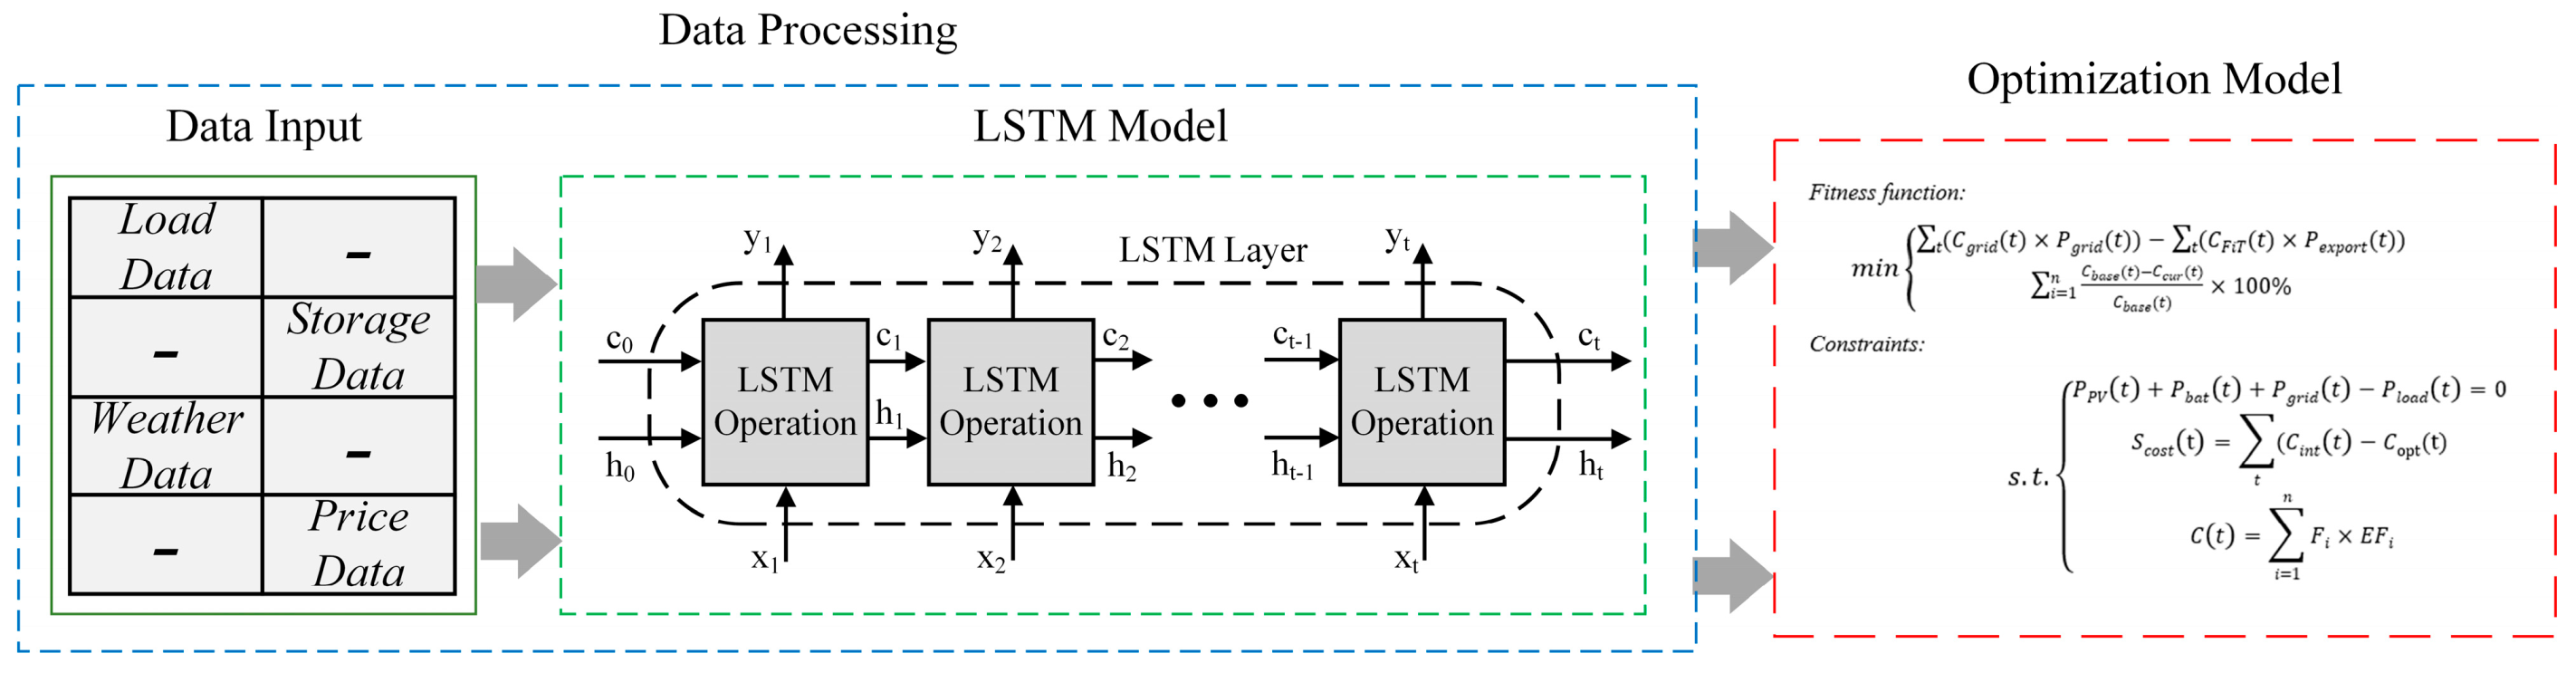
Algorithm 1: Optimization Formula
Input: Merredin WA Power Grid information
Output: Cost savings optimal results and carbon emission reduction
  Begin optimization method:
  Start analysis and checking parameters
  Analyze performance
Data Processing
LSTM model:
   f t = σ w f x x t + w f h h t 1 + b f
   i t = σ w i x x t + w i h h t 1 + b i
   g t = τ w g x x t + w g h h t 1 + b g
   c t = c t 1 f t + g t i t
   h t = τ ( c t ) o t
Optimization Model
Fitness function:
   m i n i = 1 t C g r i d i × P g r i d i i = 1 t C F i T i × P e x p o r t i                   i = 1 n C b a s e i C c u r i C b a s e i × 100 %  
Constraints:
       s . t . P P V t + P b a t t + P g r i d t P l o a d t = 0 S c o s t t = i = 1 t ( C i n t i C opt i   C t = i = 1 n F i × E F i
Optimization complete
  if
  Constraints are satisfied
then
  Update parameters from the optimization models
   Calculate   C o p t t and E C a r b o n %
if constraints   suit the optimization problem
then
      return C o p t t and E C a r b o n %
    end if
  end if

3. Results and Discussion

Below are the results produced from the proposed research with regard to energy independence, cost savings, environmental sustainability, system performance and resilience, energy consumption reduction, future savings estimations, cash flow and investment analysis, as well as long-term cost projection analysis:

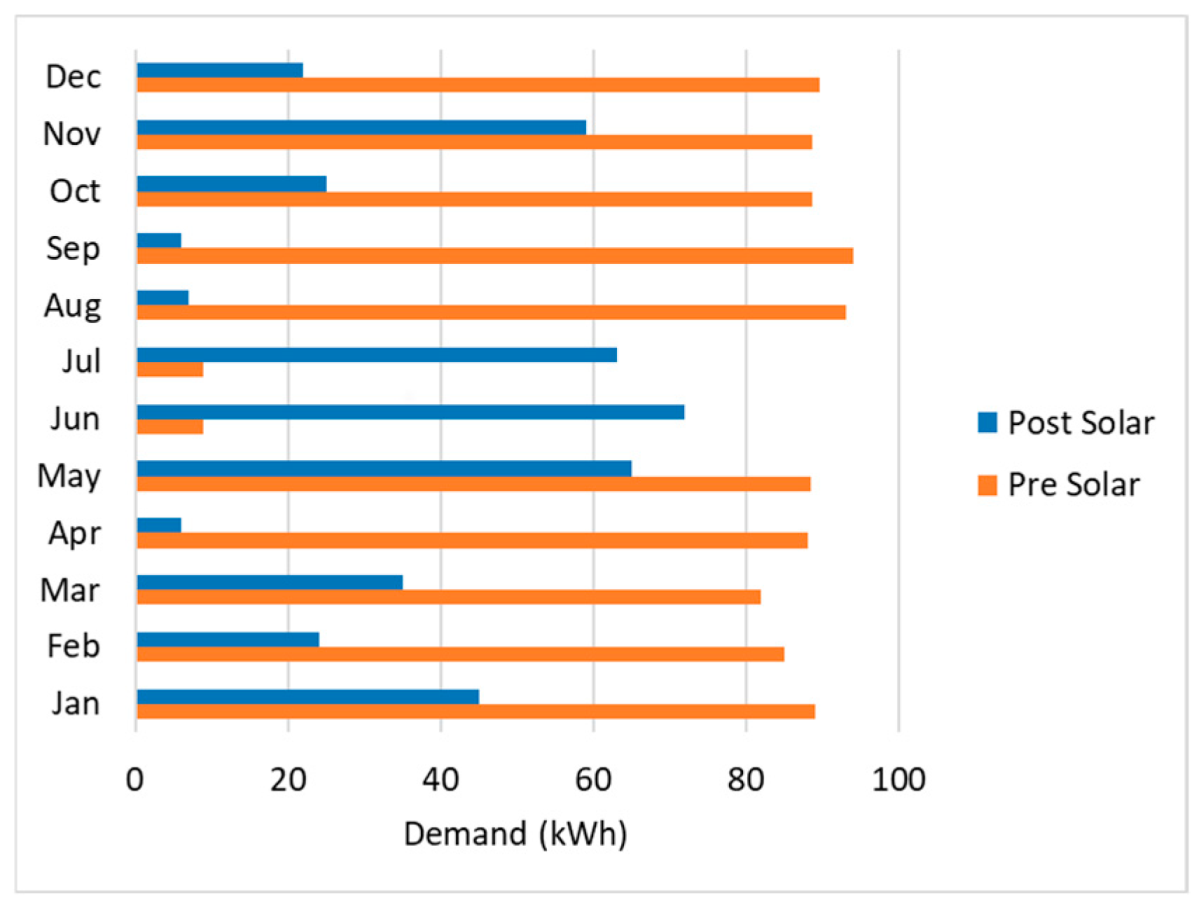
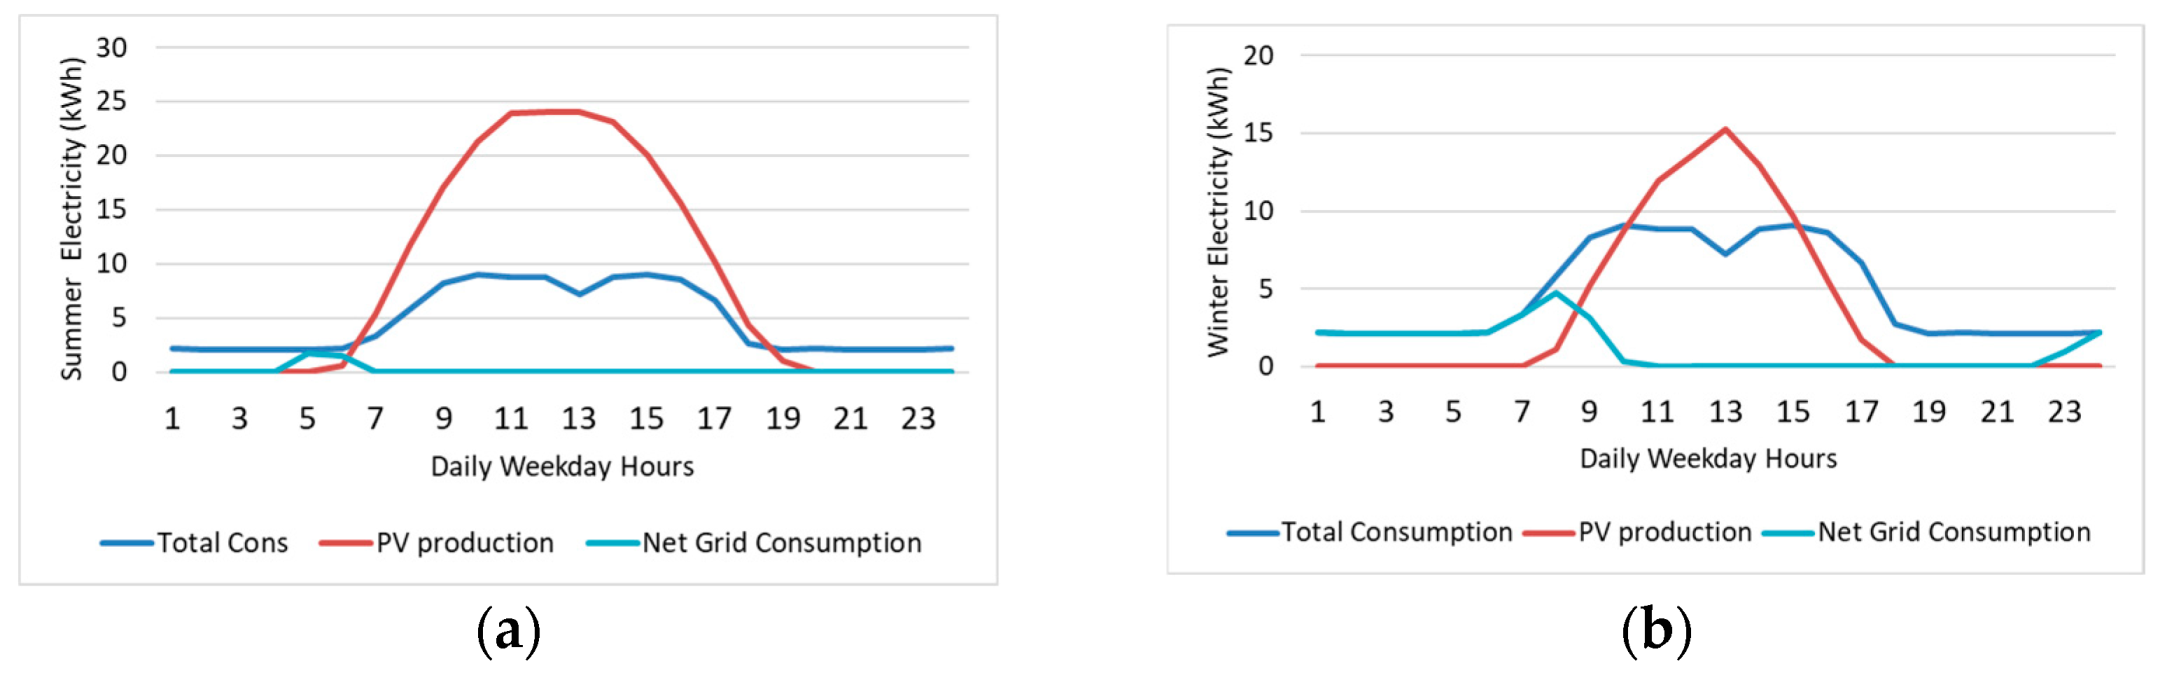
3.1. Energy Independence

The optimal installation of a 33-kW solar PV array, coupled with lithium-ion battery storage, enabled the site to generate and store its own energy. Since the primary objective of this research is to reduce the mining site’s dependence on grid power, the designed system is able to meet a significant portion of the site’s energy demands using EMS during daylight hours and to provide stored energy during non-solar periods, such as at nighttime. Accordingly, Table 2 shows the system’s energy consumption split where the solar PV system generated approximately 31,132 kWh annually, significantly reducing reliance on grid electricity. Here, peak grid power consumption dropped by 87%, indicating the productivity of the PV-battery hybrid system in meeting site demand. Further, Figure 7 and Figure 8 present the customer’s weekly consumption profile and maximum demand respectively. This shows that the demand from the grid side can be reduced significantly following the solar project installation system.

3.2. Cost Reduction

Reducing energy costs is another key objective for the mining operation. Prior to implementing the solar hybrid system as illustrated in Figure 9a, the site incurred annual electricity costs of approximately USD $15,375.39 due to high energy consumption and fluctuating grid electricity prices. However, from Table 3, the proposed hybrid LSTM-classical optimization method presents the system’s cost savings approximately USD $2769 with least computation time 1.153 s and high accuracy 99.247% when compared with existing other algorithms. The results are derived from rigorous simulations ensuring fair comparison. The details of the applied existing algorithms are given in Appendix A. Further, Figure 9 shows the distributed grid power cost, finance cost and net savings before and after the optimization method. Subsequent to the applied optimization, the grid power cost is reduced from USD $15,375 to USD $6747. Accordingly, after implementing the optimal solar PV and battery system, annual electricity costs are reduced by 57%.

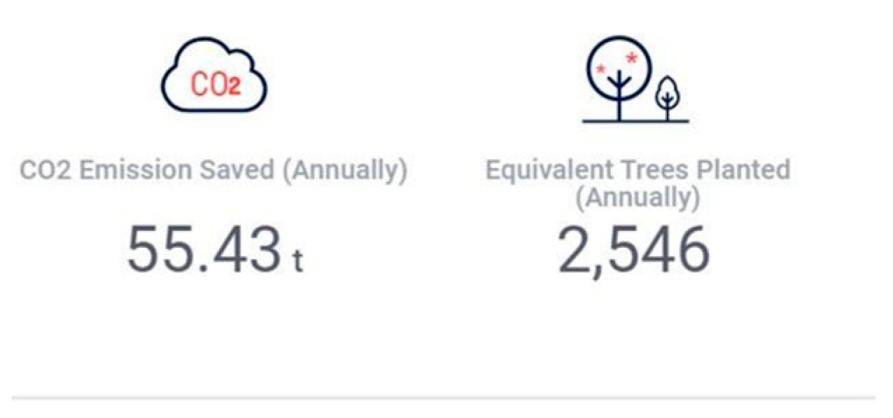
3.3. Environmental Sustainability

An additional goal of this research is to reduce the environmental impact of mining operations by lowering carbon emissions and the reliance on fossil fuels. Transitioning from conventional grid power (primarily generated from coal and gas) to solar energy significantly decreased the site’s carbon footprint. Figure 10 provides an overview of the project’s carbon emissions. The key results are as follows:
  • The project achieved a 67% reduction in carbon emissions, primarily due to the shift from fossil fuel-based electricity to solar power.
  • Although diesel-powered, the backup generator, was used sparingly, further minimizing greenhouse gas emissions.
  • By utilizing RE for the majority of its power needs, the mining site positioned itself as a leader in environmental responsibility within industry.

3.4. System Performance and Resilience

The integration of a solar PV-battery storage hybrid system, along with a backup generator created a resilient energy system that adapts to concerns in power demand and solar unavailability. The EMS plays a crucial role in optimizing the energy distribution system. Further, Figure 11 illustrates the typical summer and winter weekdays grid consumption pattern, where net grid consumption, as proposed in this study, is reduced significantly in all seasons. The lithium-ion battery system performed as expected, providing consistent energy storage and discharge during peak demand periods and at nighttime. The advanced thermal management system-maintained healthy battery performance despite the high temperatures of Merredin WA site. Overall, the proposed approach outperformed initial projections, particularly in reducing grid dependence and ensuring operational continuity.

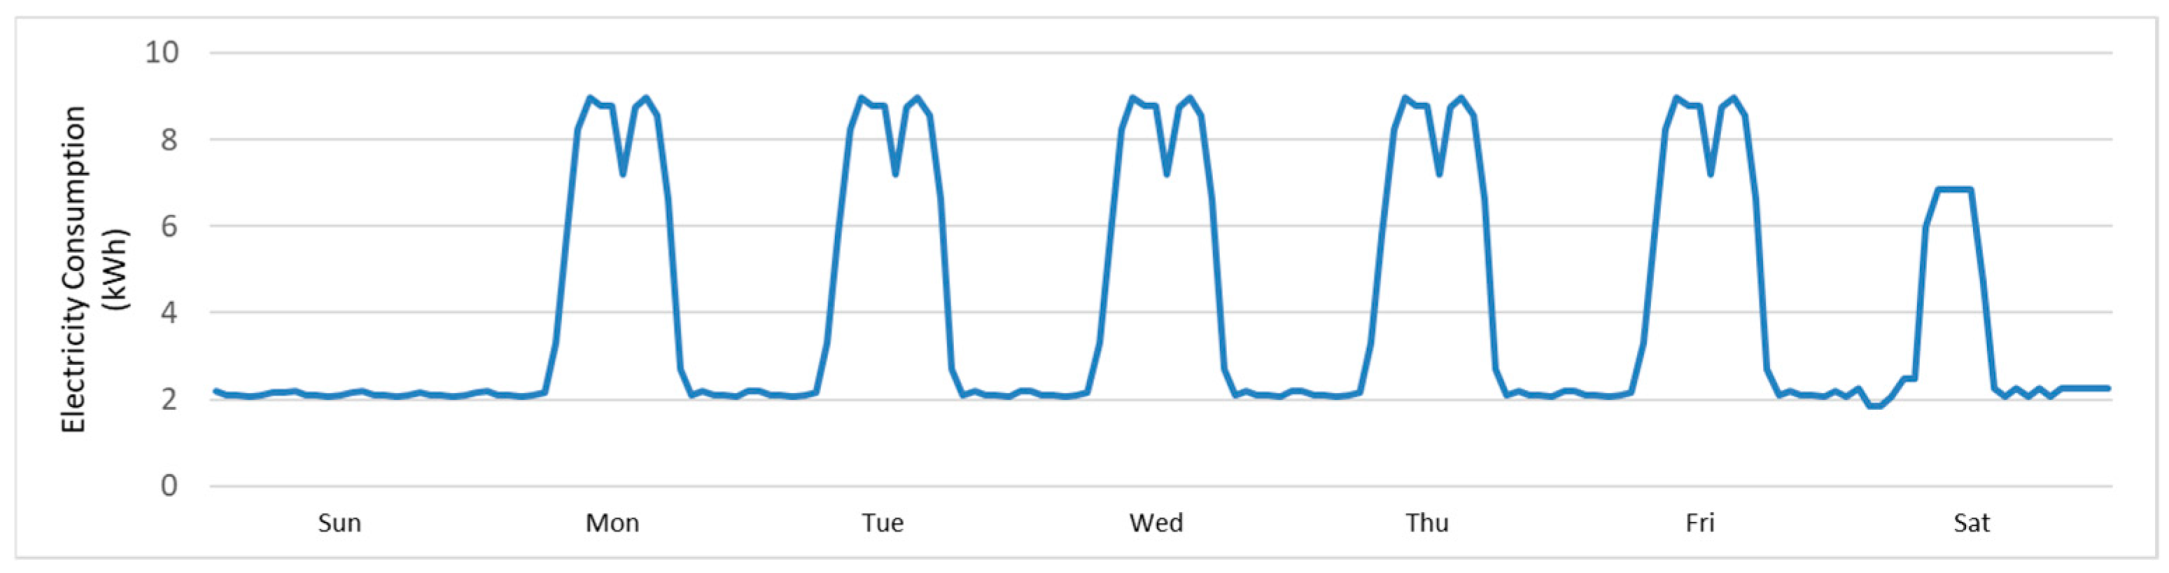
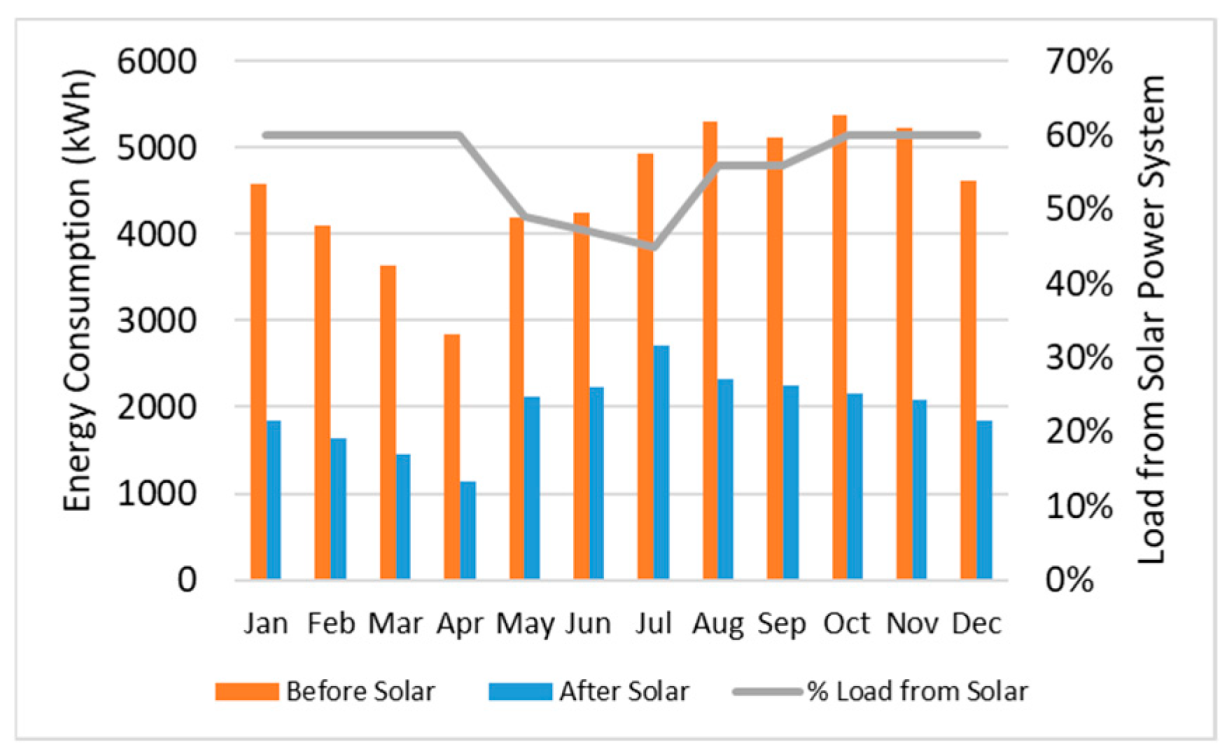
3.5. Energy Consumption Analysis

A breakdown of the site’s monthly energy consumption has been conducted, taking into account, electricity consumption from the grid before and after solar integration and load usage. The detailed analysis of Figure 12 provides a clearer picture of how solar power impacts overall electricity costs. The monthly energy consumption data reveals the proportion of electricity supplied by solar power versus grid electricity. Analysis of yearly trends indicates that energy consumption from grid before and after solar projection are 54, 196 kWh and 23,781.1 kWh respectively. It signifies that 57% of the site’s total energy demand can be fulfilled using solar power system. The remaining 43% must still be sourced from the grid. This breakdown demonstrates the substantial impact of solar power on reducing reliance on grid electricity while acknowledging that some level of grid support is still necessary.

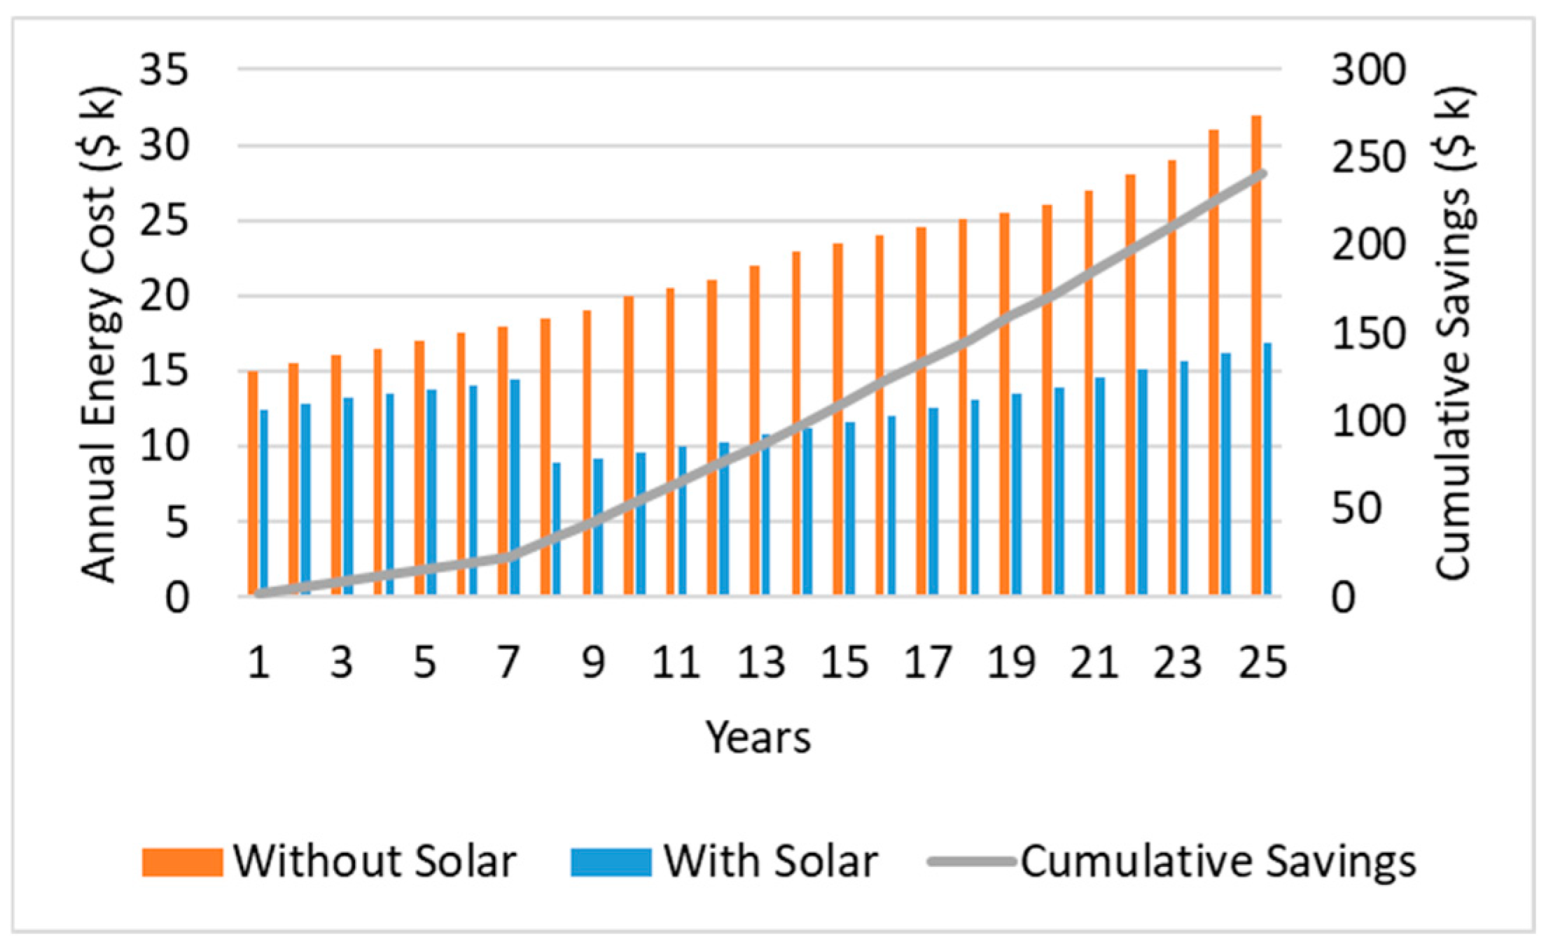
3.6. Future Savings Estimations

A detailed electricity solar projections analysis has been performed to assess how energy costs would be changed after implementing the solar system. The results for future solar savings projections are presented in Table 4. The solar energy projections for the site indicate that with this system in place, the total estimated annual savings on electricity costs would be $8628.73. This financial benefit further strengthens the case for renewable energy integration, highlighting its long-term cost-effectiveness.

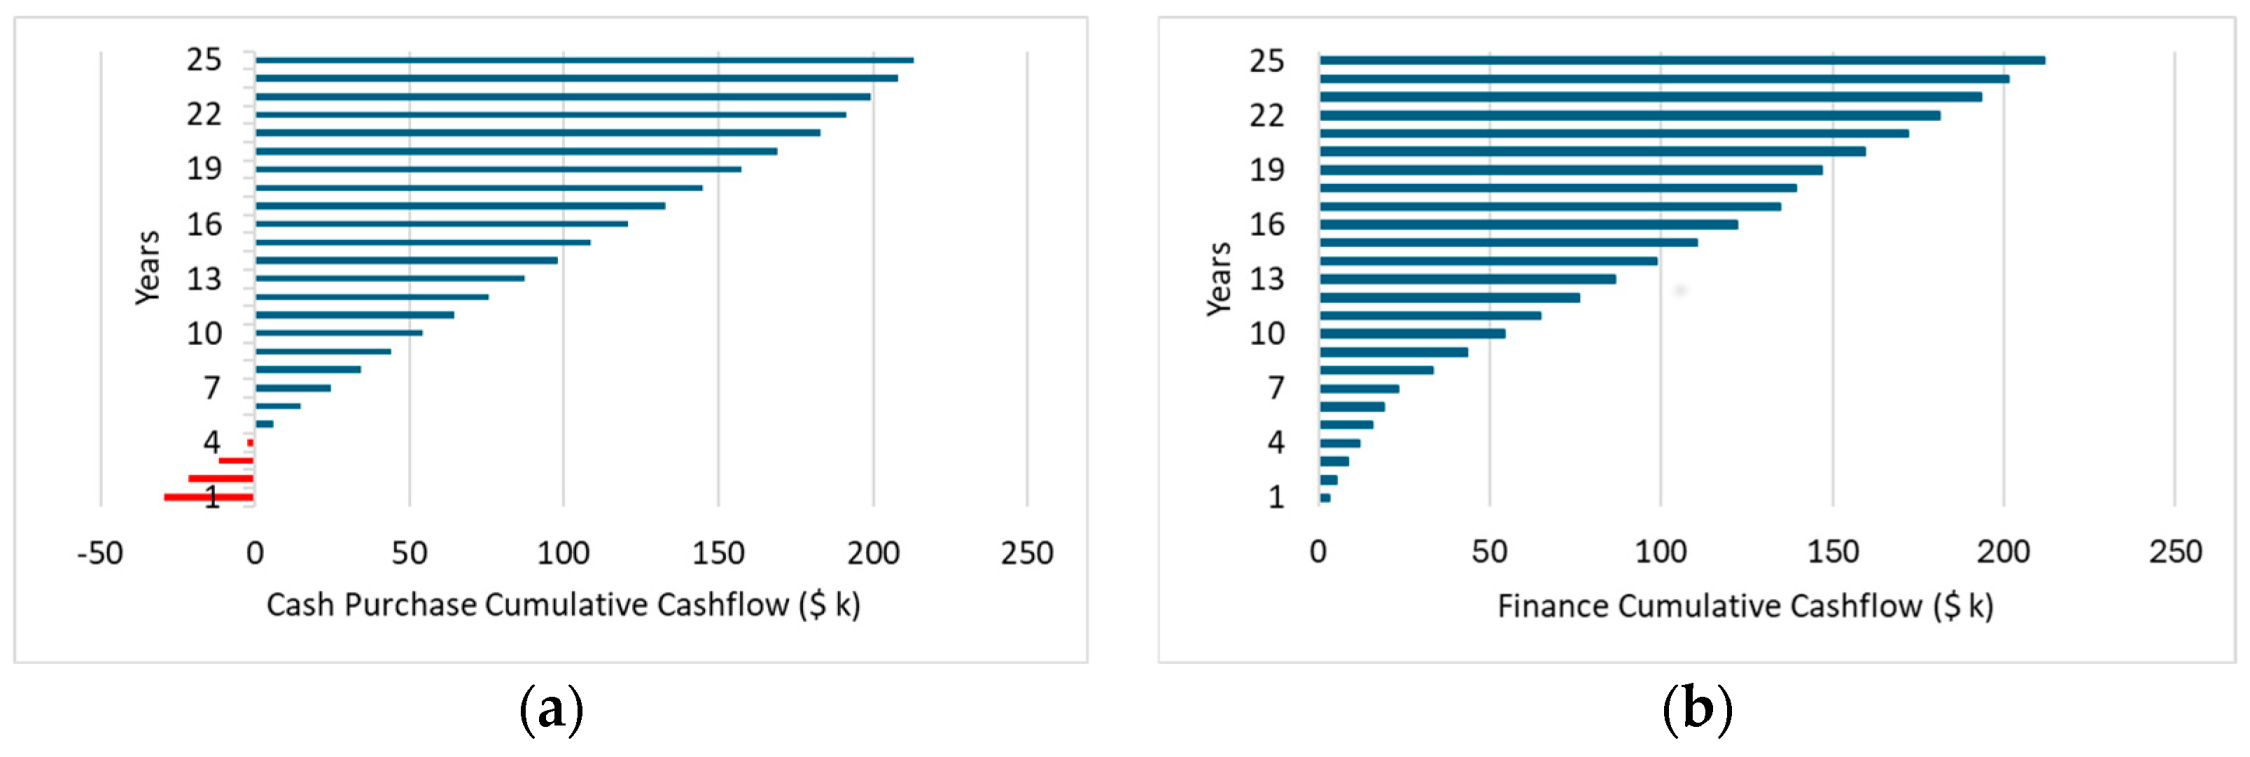
3.7. Cash Flow and Investment Analysis

A detailed cash flow analysis has been conducted to compare different purchasing models for implementing the solar system. This includes both cash purchase and financing options, allowing decision-makers to evaluate the financial feasibility of the project under different investment strategies. The cumulative cash flow projections for each approach: cash purchase and finance are outlined in Figure 13a and Figure 13b correspondingly, demonstrating long-term financial benefits and payback periods. For a cash purchase model, the return on investment (ROI) has been calculated based on electricity cost savings over time. The analysis indicates that the system will achieve payback in approximately 3.5 years as presented in the red color, after which the site will continue to benefit from free solar-generated electricity. Accordingly, the cash purchase and finance can be increased approximately up to US $209 k and US $213 k over the 25 years respectively.

3.8. Long-Term Cost Projection

A 25-year cost projection has been generated to compare the financial impact of using solar power versus relying solely on grid electricity. The future energy projections indicate sustained cost reductions and an increasing reliance on solar power. The cumulative cash flow analysis and cost projection over 25 years demonstrate long-term financial benefits, reinforcing the project’s economic viability. The ability to fulfill 57% of the site’s electricity needs through solar energy highlights the potential for further expansion. With technological advancements in battery storage and solar efficiency, future projects may achieve even higher levels of grid independence and cost savings. The results are summarized in Figure 14. In a finance term, approximately $23,470 can be saved, with projections to reach USD $241,600 over 25 years.

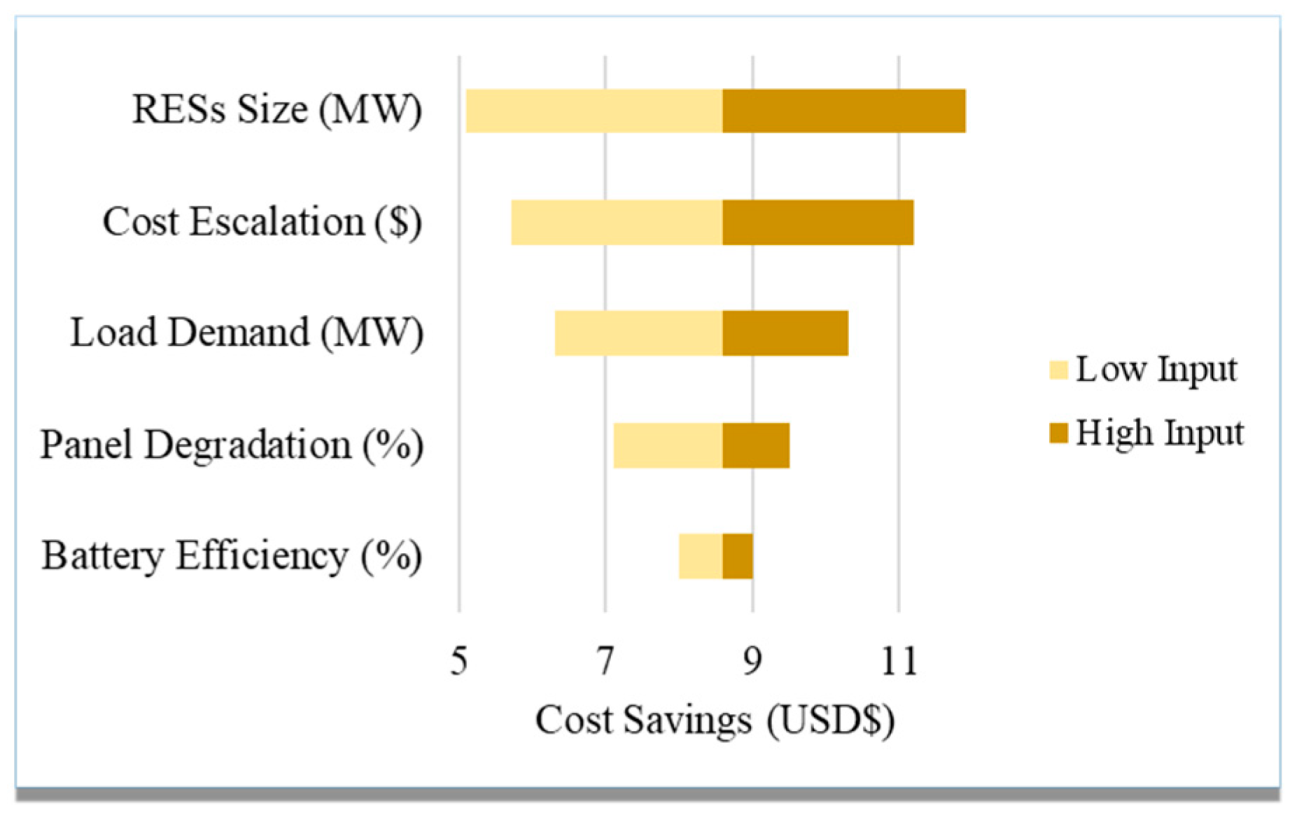
3.9. Sensitivity Analysis

A sensitivity analysis of the Merredin WA mining sector considering different parameters such as RE sources (RESs) size, annual cost escalation, load demand, solar panel degradation and battery efficiency are measured. As illustrated in Figure 15, cost savings of the studied mining site is significantly affected by the considered parameters. It indicates that cost savings can be changed from USD $5.41 to USD $11.92 when varied the relevant factors.

4. Conclusions

This research investigates the grid connected Merredin WA mining sector that has demonstrated the effectiveness of integrating solar PV systems with battery storage to address the energy challenges faced by mining operations in Western Australia. By leveraging advanced RE technologies, this research delivered a reliable, cost-effective, and environmentally sustainable solution, significantly reducing reliance on conventional grid power. This study initially selected the site Merredin WA, planned and designed system using PV and BESS model and optimized energy solution. It considered cost savings, cash flow and long-term cost projection analysis. The hybrid data-driven LSTM-classical optimization method is applied to determine cost savings value and compared with the existing algorithms. Accordingly, the energy consumption from grid system can be reduced in both summer and winter weekdays that shows yearly 54,196 kWh to 23,781.1 kWh when implemented the proposed solar projection system. Hence, around 57% load demand can be fulfilled by the proposed PV project using the optimization method that saves annually approximately USD $8627.53 for future projection. With this, the cash purchase and finance can be improved up to USD $209 k and USD $213 k over the 25 years correspondingly. The applied optimization method resulted least computation time 1.153 s and high accuracy 99.247% when compared with existing other algorithms. The proposed research is further capable of reducing carbon emissions by 67% to meet net zero carbon emission target.
Beyond the mining industry, the Merredin WA Solar Project serves as a model for other sectors and regions. Therefore, for future research, the grid stability considering higher penetration of RESs, and AI-driven hybrid control systems will be investigated to enhance system efficiency.

Author Contributions

Conceptualization, M.O.Q. and R.K.; methodology, M.O.Q.; software, M.O.Q. and R.K.; validation, M.O.Q. and R.K.; formal analysis, M.O.Q., R.K. and M.A.; investigation, M.O.Q.; data curation, M.O.Q. and R.K.; writing—original draft preparation, M.O.Q.; writing—review and editing, M.A., S.L. and U.A.; visualization, M.A.; supervision, S.L. and U.A.; project administration, S.L.; funding acquisition, M.O.Q. All authors have read and agreed to the published version of the manuscript.

Funding

This research was supported by Edith Cowan University, Australia and the APC was funded by Applied Sciences, MDPI.

Institutional Review Board Statement

Not applicable.

Informed Consent Statement

Not applicable.

Data Availability Statement

Data available on request.

Conflicts of Interest

The authors declare no conflicts of interest.

Appendix A

Parameters applied in the optimization algorithms of Table 3 are presented in Table A1.
Table A1. Parameters of optimization algorithms compared in Table 3.
MethodsParameters
LSTMLayers: 2
Neurons: 69
Training Epochs: 107
Learning Rate: 0.0014
Dropout Rate: 0.3
Batch Size: 41
Optimization Method: Adam optimizer
TFLayers: 2
Neurons: 76
Training Epochs: 125
Learning Rate: 0.0013
Dropout Rate: 0.17
Batch Size: 49
Model Size: 128
Feed-forward Network Size: 512
RLLayers: 2
Neurons: 79
Training Epochs: 137
Learning Rate: 0.0019
Batch Size: 51
Entropy Coefficient: 0.015
GAPopulation size: 170
Number of Iterations: 125
Selection method: Tournament
Crossover rate: 0.71
Mutation rate: 0.0085
TSTabu list size: 30
Number of iterations: 155
Aspiration criteria: Fitness Threshold
Neighborhood size: 65
Stopping criteria: 155 (iterations)
PSOSwarm size: 45
Inertia weight: 0.83
Cognitive Coefficient: 2.31
Social Coefficient: 2.19
Velocity Limits: 7
Maximum iterations: 160
GWONumber of wolves: 70
Encircling behavior (Decreasing A Parameter): [1.93, 0]
Wolves’ movement (Increasing C Parameter): [0, 2.17]
Maximum iterations: 130
ACONumber of ants: 95
Pheromone evaporation rate: 0.31
Pheromone deposit amount: 2.75
Exploration vs exploitation: 5
Importance of pheromone: 3
Maximum iterations: 155
BAPopulation size: 80
Initial loudness: 0.63
Initial pulse rate: 1
Frequency range: [0, 1]
Velocity: 5
Maximum iterations: 140

References

  1. Tan, V.; Deng, R.; Egan, R. Solar photovoltaic waste and resource potential projections in Australia, 2022–2050. Resour. Conserv. Recycl. 2024, 202, 107316. [Google Scholar] [CrossRef]
  2. Linden, S. Electricity Generation Licence; Merredin Project Company Pty Ltd: Subiaco, Australia, 2021; pp. 1–44. [Google Scholar]
  3. Khan, S.A.; Tao, Z.; Agyekum, E.B.; Fahad, S.; Tahir, M.; Salman, M. Sustainable rural electrification: Energy-economic feasibility analysis of autonomous hydrogen-based hybrid energy system. Int. J. Hydrogen Energy 2024, 9, 1–14. [Google Scholar] [CrossRef]
  4. Khan, T.; Waseem, M.; Tahir, M.; Liu, S.; Yu, M. Autonomous hydrogen-based solar-powered energy system for rural electrification in Balochistan, Pakistan: An energy-economic feasibility analysis. Energy Convers. Manag. 2022, 271, 116284. [Google Scholar] [CrossRef]
  5. Shakya, B.D.; Aye, L.; Musgrave, P. Technical feasibility and financial analysis of hybrid wind–photovoltaic system with hydrogen storage for Cooma. Int. J. Hydrogen Energy 2005, 30, 9–20. [Google Scholar] [CrossRef]
  6. Beasy, K.; Lodewyckx, S.; Gale, F. An Analysis of Emerging Renewable Hydrogen Policy through an Energy Democracy Lens: The Case of Australia. Sustainability 2024, 16, 2226. [Google Scholar] [CrossRef]
  7. Burton, J.; Kemp, D.; Barnes, R.; Parmenter, J. Mapping critical minerals projects and their intersection with Indigenous peoples’ land rights in Australia. Energy Res. Soc. Sci. 2024, 113, 103556. [Google Scholar] [CrossRef]
  8. Department of Primary Industries and Regional Development. Climate Change in the Merredin Area, Western Australia. Available online: https://www.agric.wa.gov.au/climate-change/climate-change-merredin-area-western-australia (accessed on 11 September 2024).
  9. Ralph, N.; Hancock, L. Energy security, transnational politics, and renewable electricity exports in Australia and Southeast Asia. Energy Res. Soc. Sci. 2019, 49, 233–240. [Google Scholar] [CrossRef]
  10. Hossain, E.; Zawad, M.; Rakibul Islam, K.H.; Akash, M.Q. Design a Novel Controller for Stability Analysis of Microgrid by Managing Controllable Load using Load Shaving and Load Shifting Techniques; and Optimizing Cost Analysis for Energy Storage System. Int. J. Renew. Energy Res. 2016, 6, 772–786. [Google Scholar] [CrossRef]
  11. Worlanyo, A.S.; Jiangfeng, L. Evaluating the environmental and economic impact of mining for post-mined land restoration and land-use: A review. J. Environ. Manag. 2021, 279, 1–16. [Google Scholar] [CrossRef]
  12. Strazzabosco, A.; Gruenhagen, J.H.; Cox, S. A review of renewable energy practices in the Australian mining industry. Renew. Energy 2022, 187, 135–143. [Google Scholar] [CrossRef]
  13. Velasquez, N.; Anani, A.; Munoz-Gama, J.; Pascual, R. Towards the Application of Process Mining in the Mining Industry—An LHD Maintenance Process Optimization Case Study. Sustainability 2023, 15, 7974. [Google Scholar] [CrossRef]
  14. Corrigan, C.C.; Ikonnikova, S.A. A review of the use of AI in the mining industry: Insights and ethical considerations for multi-objective optimization. Extr. Ind. Soc. 2024, 17, 101440. [Google Scholar] [CrossRef]
  15. Brzychczy, E.; Gackowiec, P.; Liebetrau, M. Data Analytic Approaches for Mining Process Improvement—Machinery Utilization Use Case. Resources 2020, 9, 17. [Google Scholar] [CrossRef]
  16. Bhimaraju, A.; Mahesh, A.; Nirbheram, J.S. Feasibility study of solar photovoltaic/grid-connected hybrid renewable energy system with pumped storage hydropower system using abandoned open cast coal mine: A case study in India. J. Energy Storage 2023, 72, 108206. [Google Scholar] [CrossRef]
  17. Brueckner, M.; Durey, A.; Mayes, R.; Pforr, C. The mining boom and Western Australia’s changing landscape: Towards sustainability or business as usual? Rural Soc. 2013, 22, 111–124. [Google Scholar] [CrossRef]
  18. Riedemann, J.; Reyes, E.; Sarasiri, N.; Pena, R.; Andrade, I. Renewable Source-Based Water Pumping Electrification in Mines: Current technologies and future trends. IEEE Electrif. Mag. 2024, 12, 38–44. [Google Scholar] [CrossRef]
  19. Pouresmaieli, M.; Ataei, M.; Nouri Qarahasanlou, A.; Barabadi, A. Integration of renewable energy and sustainable development with strategic planning in the mining industry. Results Eng. 2023, 20, 101412. [Google Scholar] [CrossRef]
  20. Laslett, D.; Carter, C.; Creagh, C.; Jennings, P. A large-scale renewable electricity supply system by 2030: Solar, wind, energy efficiency, storage and inertia for the South West Interconnected System (SWIS) in Western Australia. Renew. Energy 2017, 113, 713–731. [Google Scholar] [CrossRef]
  21. Huang, H.; Ata, S.; Rougieux, F.; Kay, M. Decarbonising mining of Australia’s critical mineral deposits: Opportunities for sustainable mining through solar photovoltaics and wind energy integration. J. Clean. Prod. 2024, 455, 142300. [Google Scholar] [CrossRef]
  22. Mariutti, E. The Limits of the Current Consensus Regarding the Carbon Footprint of Photovoltaic Modules Manufactured in China: A Review and Case Study. Energies 2025, 18, 1178. [Google Scholar] [CrossRef]
  23. Qays, O.; Buswig, Y.; Basri, H.; Hossain, L.; Abu-siada, A.; Rahman, M.M.; Muyeen, S.M. An Intelligent Controlling Method for Battery Lifetime Increment Using State of Charge Estimation in PV-Battery Hybrid System. Appl. Sci. 2020, 10, 8799. [Google Scholar] [CrossRef]
  24. Chander, S.; Purohit, A.; Sharma, A.; Arvind; Nehra, S.P.; Dhaka, M.S. A study on photovoltaic parameters of mono-crystalline silicon solar cell with cell temperature. Energy Rep. 2015, 1, 104–109. [Google Scholar] [CrossRef]
  25. Ohirul Qays, M.; Buswig, Y.; Hossain, M.L.; Abu-Siada, A. Active Charge Balancing Strategy Using the State of Charge Estimation Technique for a PV-Battery Hybrid System. Energies 2020, 13, 3434. [Google Scholar] [CrossRef]
  26. Chatzigeorgiou, N.G.; Theocharides, S.; Makrides, G.; Georghiou, G.E. A review on battery energy storage systems: Applications, developments, and research trends of hybrid installations in the end-user sector. J. Energy Storage 2024, 86, 111192. [Google Scholar] [CrossRef]
  27. Hutton & Northey Merredin on Google Maps. Available online: https://www.google.com/maps/ (accessed on 31 October 2024).
  28. Sørensen, B. The Energy Conversion Processes. In Renewable Energy; Academic Press: Cambridge, MA, USA, 2011; pp. 337–531. [Google Scholar]
  29. Ansari, S.; Ayob, A.; Lipu, M.S.H.; Saad, M.H.M.; Hussain, A. A Review of Monitoring Technologies for Solar PV Systems Using Data Processing Modules and Transmission Protocols: Progress, Challenges and Prospects. Sustainability 2021, 13, 8120. [Google Scholar] [CrossRef]
  30. ENF Solar Panel Directory. Available online: https://www.enfsolar.com/pv/panel-datasheet/crystalline/48172 (accessed on 2 November 2024).
  31. Evoenergy. BIS Oxford Economics Australia: Electricityrelated Labour Escalation Forecasts to 2028/29; 11; BIS Oxford Economics Pty Limited: Sydney, Australia, 2023; pp. 1–40. [Google Scholar]
  32. Honnurvali, M.S.; Gupta, N.; Goh, K.; Umar, T.; Kabbani, A.; Nazeema, N. Case study of PV output power degradation rates in Oman. IET Renew. Power Gener. 2018, 13, 352–360. [Google Scholar] [CrossRef]
  33. Zhao, Q.; Huang, S.; Wang, T.; Yu, Y.; Wang, Y.; Li, Y.; Gao, W. The Influencing Factors and Future Development of Energy Consumption and Carbon Emissions in Urban Households: A Review of China’s Experience. Appl. Sci. 2025, 15, 2961. [Google Scholar] [CrossRef]
  34. Jiménez García, C.; Porres de la Haza, M.J.; Coll Aliaga, E.; Lerma-Arce, V.; Lorenzo-Sáez, E. Methodology for Measuring Mobility Emissions with High Spatial Resolution: Case Study in Valencia, Spain. Appl. Sci. 2025, 15, 669. [Google Scholar] [CrossRef]
  35. Early Townsite of Merredin. Available online: https://catalogue.data.wa.gov.au/dataset/early-townsite-of-merredin (accessed on 2 November 2024).
  36. Qays, M.O.; Ahmad, I.; Habibi, D.; Masoum, M.A.S. Forecasting data-driven system strength level for inverter-based resources-integrated weak grid systems using multi-objective machine learning algorithms. Electr. Power Syst. Res. 2024, 238, 111112. [Google Scholar] [CrossRef]
Figure 1. Single-Diode Model of a PV Cell.
Applsci 15 05516 g001
Figure 2. Battery Model Using Thevenin Equivalent Circuit.
Applsci 15 05516 g002
Figure 3. Overview of Solar Design Merredin WA [27].
Applsci 15 05516 g003
Figure 4. Components and interconnections of the system in block diagram.
Applsci 15 05516 g004
Figure 5. Schematic diagram of LSTM layer and the operation block.
Applsci 15 05516 g005
Figure 7. Customer’s energy consumption patterns over a week.
Applsci 15 05516 g007
Figure 8. Yearly maximum demand.
Applsci 15 05516 g008
Figure 9. Projected cost savings of the system (a) Without optimization (b) With optimization.
Applsci 15 05516 g009
Figure 10. Project’s carbon emission profile over time.
Applsci 15 05516 g010
Figure 11. Weekdays profile of grid consumption at (a) Summer and (b) Winter.
Applsci 15 05516 g011
Figure 12. Energy Mix Contribution—Energy consumption before and after the installed solar power system in kWh, load conducted using solar power system in %.
Applsci 15 05516 g012
Figure 13. Future Cost Consumption Projection (a) Cash purchase cumulative cashflow (b) finance cumulative cashflow.
Applsci 15 05516 g013
Figure 14. Long-term cost projection.
Applsci 15 05516 g014
Figure 15. Sensitivity analysis of the Merredin WA mining sector.
Applsci 15 05516 g015
Table 1. Solar Panel Properties [30].
Module TypeSRP-425-BMZ-HVSRP-430-BMZ-HVSRP-435-BMZ-HVSRP-440-BMZ-HV
STCSTCSTCSTC
P m a x at STC 425430435440
V O C 52.152.252.452.6
I S C 10.3110.4010.4710.53
V max 43.843.944.144.3
I m a x 9.719.809.879.93
Efficiency (μm)19.4619.6919.9120.14
Tolerance Power(0, +4.99)
System Voltage (max)1500 VDC
Series Fuse Rating (max)20 A
Table 2. Breakdown of energy sources within the system.
Energy-Consumption Split
TotalSolarGrid
kWh35,69431,1324561
%100%87%13%
Table 3. Optimal cost savings.
Optimization MethodCost (USD$)Computation Time (s)Cost Reduction (%)Accuracy (%)
LSTM-Classical27691.15357.0399.247
TF27331.16456.2199.015
RL26811.16955.6798.832
GA26431.17255.2898.541
TS25911.18154.7198.043
PSO25831.97254.2197.682
GWO25472.01453.8997.429
ACO25222.02953.3197.156
BA24992.04852.9595.025
TF = Transformer, RL = Reinforcement learning, GA = Genetic Algorithm, TS = Tabu Search, PSO = Particle Swarm Optimization, GWO = Grey Wolf Optimizer, ACO = Ant colony optimization, BA = Bat Algorithm.
Table 4. Future savings estimations.
Solar ProjectionsValue (kWh)Cost from Grid ($)
System Suggested33 kW-
33 kW solar system annual energy production (CEC Average)31,132-
Conservative annual estimate at site due to PV system orientation54,240-
Usage estimates based on a 5.5-day week with some standing power usage
Peak Usage substituted by Solar27,3737765.87
Off-Peak Usage substituted by Solar3041862.86
Potential excess solar production feed in23,825-
Total Savings54,2408627.53
Disclaimer/Publisher’s Note: The statements, opinions and data contained in all publications are solely those of the individual author(s) and contributor(s) and not of MDPI and/or the editor(s). MDPI and/or the editor(s) disclaim responsibility for any injury to people or property resulting from any ideas, methods, instructions or products referred to in the content.

