Article

Interfacial Shear Properties of Red Clay and Polyurethane with Different Densities

School of Architecture and Transportation Engineering, Guilin University of Electronic Science and Technology, Guilin 541004, China
*
Author to whom correspondence should be addressed.
Appl. Sci. 2025, 15(10), 5501; https://doi.org/10.3390/app15105501
Submission received: 8 March 2025 / Revised: 7 May 2025 / Accepted: 10 May 2025 / Published: 14 May 2025
(This article belongs to the Section Civil Engineering)

Abstract

:
Polyurethane reinforced slopes have been widely used in practical engineering, for the stability of the composite structure, the interfacial shear performance between polyurethane and soil plays a crucial role. This paper through the indoor interfacial shear test, study the relationship between shear displacement and shear stress at the polyurethane-red clay interface under the different polyurethane densities. At the same time, based on the bilinear finite element cohesive model, using ABAQUS finite element software to establish a numerical model of polyurethane-red clay composite specimens to simulate the indoor shear test process, and to study the shear stress and shear strength changes at the interface between polyurethane and red clay; verify the feasibility of the numerical model by comparative analysis. The test results show: The incorporation of polyurethane has a significant promoting effect on the interfacial shear strength, there is a linear positive correlation between the interfacial shear strength and the density of polyurethane; The shear strengths of the composites with densities of 0.2 g/cm3, 0.5 g/cm3, and 0.8 g/cm3 are 1.53 times, 1.60 times, and 2.24 times that of pure red clay respectively, the optimal polyurethane density is between 0.5 g/cm3–0.8 g/cm3; The bilinear finite element model can effectively simulate indoor shear tests, and the average error of the simulated shear strength result is within 9.4%, which provides an effective method for understanding the interfacial shear performance of the composite body.

1. Introduction

Red clay, a soil type characterized by complex physical and mechanical properties, exhibits distinctive features including high plastic and liquid limits, elevated moisture content, significant void ratio, strong dispersibility, and low compressibility. This special soil is widely distributed in regions such as Guangxi and the Yunnan-Guizhou Plateau in China [1]. Consequently, it is highly sensitive to changes in moisture content. When moisture levels are excessively high, the soil becomes muddy, and when too low, it is prone to cracking. These conditions increase the likelihood of landslides, collapses, and other issues [2], potentially leading to casualties and property damage. Therefore, reinforcement measures are essential to improve the performance of red clay slopes and mitigate their negative effects on surrounding structures. Currently employed reinforcement methods primarily include external engineering stabilization techniques such as retaining walls and concrete slabs [3,4,5]. These approaches establish physical barriers to mitigate rainwater scouring and surface movements, thereby controlling soil erosion on slopes while ensuring safety and stability. However, such methods frequently induce ecological disturbances by disrupting local ecosystems, suppressing vegetation growth, while their durability and structural integrity remain susceptible to environmental variations. Alternative strategies involve internal soil improvement through additives like cement, lime, fibers, and biopolymers [6,7,8,9,10,11,12]. These additives effectively enhance red clay’s mechanical properties, permeability resistance, and erosion mitigation capabilities, making them applicable to slope stabilization and vegetation engineering. Nevertheless, despite achieving partial improvement in soil mechanics, these techniques exhibit inherent limitations. For instance, excessive lime content may reduce soil’s peak strength [6] and compromise pore structure integrity [7]. However, these methods are often costly, and cementitious materials require a long curing period, resulting in slow construction speeds. These methods are not suitable for urban development, where rapid execution is necessary. In recent years, polymer organic materials have gained considerable attention. Several studies have shown that using these materials to improve soil can enhance the structural stability and erosion resistance of red clay slopes. Therefore, polymer organic materials have a good prospect in red clay slope engineering.
Polyurethane is a polymer with dual properties of metal and rubber, specifically toughness and elasticity. It exhibits characteristics such as self-expanding properties, rapid gelation, high strength, corrosion resistance, and excellent impermeability. Due to its environmental safety and non-polluting nature, polyurethane is widely used in anti-seepage, repair, and foundation projects, such as roadbeds and underground pipelines [13,14,15,16,17]. To further assess the stability and safety of engineering structures repaired with polyurethane grouting, both domestic and international scholars have conducted extensive studies on its bonding performance with other matrix materials. Liu [14] employed polyurethane to solidify sand slopes and, through strength and permeability tests, concluded that polyurethane significantly enhanced the cohesion of sand and soil, improved cohesion between sand particles, and increased the erosion resistance of slopes. Furthermore, polyurethane improved the water retention properties of soil, creating a favorable environment for vegetation growth. Xu [18] used polyurethane prepolymers to enhance asphalt, demonstrating that polyurethane prepolymers effectively improved asphalt performance, especially at low temperatures. Tao [19] used polyurethane to solidify calcareous sand, investigating its impact on the strength and stiffness of the improved soil through triaxial tests. The results indicated that polyurethane effectively enhanced the mechanical properties of calcareous sand and suggested optimal polyurethane dosages for different grades of calcareous sand. Li and Fang [20,21] investigated the effects of interfacial moisture content, polyurethane density, and concrete strength on the interfacial shear properties between polyurethane and concrete through scanning electron microscopy (SEM) and direct shear tests. Fan [22] found that an appropriate amount of polyurethane in modified concrete improved the elastic modulus, compressive strength, and flexural strength. Regarding the interfacial shear characteristics between polyurethane and other engineering structural materials, Li [23] studied the interfacial shear behavior between polyurethane and expansive soil, proposing the concepts of equivalent internal friction angle and equivalent cohesive force at the interface. Wang and Bai [24,25] investigated the shear behavior at the polyurethane-sand interface. Lin [26] examined the factors influencing the shear strength at the polyurethane-soil interface and the polyurethane-steel plate interface. In current domestic and international studies on polyurethane-stabilized red clay, Kim [27] demonstrated that the incorporation of polyurethane enhances the compressive strength of red clay through comparative analyses of its mechanical properties—including compressive strength, shrinkage behavior, and resistance to water erosion—before and after polyurethane treatment. Tan [28,29] examined the mechanism and effects of polyurethane on red clay solidification through a series of experiments, finding that polyurethane improved the strength, stiffness, and toughness of red clay, reduced the damping ratio, and prevented excessive settlement in red clay roadbeds.
In summary, polyurethane materials have demonstrated considerable potential in geotechnical applications such as foundation treatment and slope reinforcement. Due to the diversity and complexity of polyurethane materials, the stabilization mechanisms and effects of different polyurethane types on soil exhibit significant variations. However, research on polyurethane-stabilized red clay remains relatively scarce, particularly regarding the interfacial shear characteristics of polyurethane-soil composites. Furthermore, existing studies have predominantly focused on comparing the strength and mechanical properties of red clay before and after polyurethane incorporation, while investigations into the influence of polyurethane density variations remain insufficient. Based on this foundation, this study conducted laboratory direct shear tests to investigate the effects of polyurethane density variations and normal stress levels on the interfacial shear characteristics of composite matrices. A finite element model of the composite system was subsequently developed, incorporating the influences of polyurethane density and normal stress based on experimental findings, and validated through comparative analysis with empirical test data.

2. Materials and Methods

2.1. Materials

The soil sample for experimental research was collected from a karst soil cave located on a highway in Guilin city. The original soil was retrieved, naturally air-dried, and then crushed. After passing through a 2 mm sieve, the basic physical parameters of the soil were determined according to the “Standard for Soil Test Methods” [30], and the results are presented in Table 1.
The polyurethane material used in the experiment is a commercially available two-component nonaqueous reactive polyurethane. The polyurethane consists of Component A (isocyanates, polyisocyanates) mixed with Component B (polyol, foaming agent, additive) in a 1:1 ratio, with fundamental physical parameters detailed in Table 2.

2.2. Preparation of Test Pieces

The sample preparation mold consists of an upper hollow cylindrical iron shell, an iron cover, and a ring cutter for sampling (61.8 mm diameter, 20 mm height), with sampling conducted using a static pressure method. The specific sample preparation procedure is as follows: An appropriate amount of red clay and polyurethane is taken. Based on preliminary experimental results, the dry density of the red clay is set at 1.75 g/cm3, the moisture content at 22%, and the polyurethane densities (density-to-volume ratio) at 0.2 g/cm3, 0.5 g/cm3, and 0.8 g/cm3. The inner wall of the cutting ring is coated with Vaseline for easier demolding. A porous stone and filter paper are placed horizontally at the bottom of the mold. Red clay is then poured into the mold, and static pressure is applied to form the red clay into a round cake-shaped sample with a height of 10 mm and a diameter of 61.8 mm. After removing the porous stone and filter paper, Vaseline is applied again. Polyurethane components A and B are thoroughly mixed and poured into the cutting ring. The iron cover is immediately attached, and static pressure is applied using a jack to prevent polyurethane from overflowing the ring. Depending on the polyurethane density, the static pressure time ranges from 5 to 25 min. Once the polyurethane is fully cured and formed, the sample is removed, resulting in a polyurethane-red clay composite sample with an upper 10 mm layer of polyurethane and a lower 10 mm layer of red clay, as shown in Figure 1.

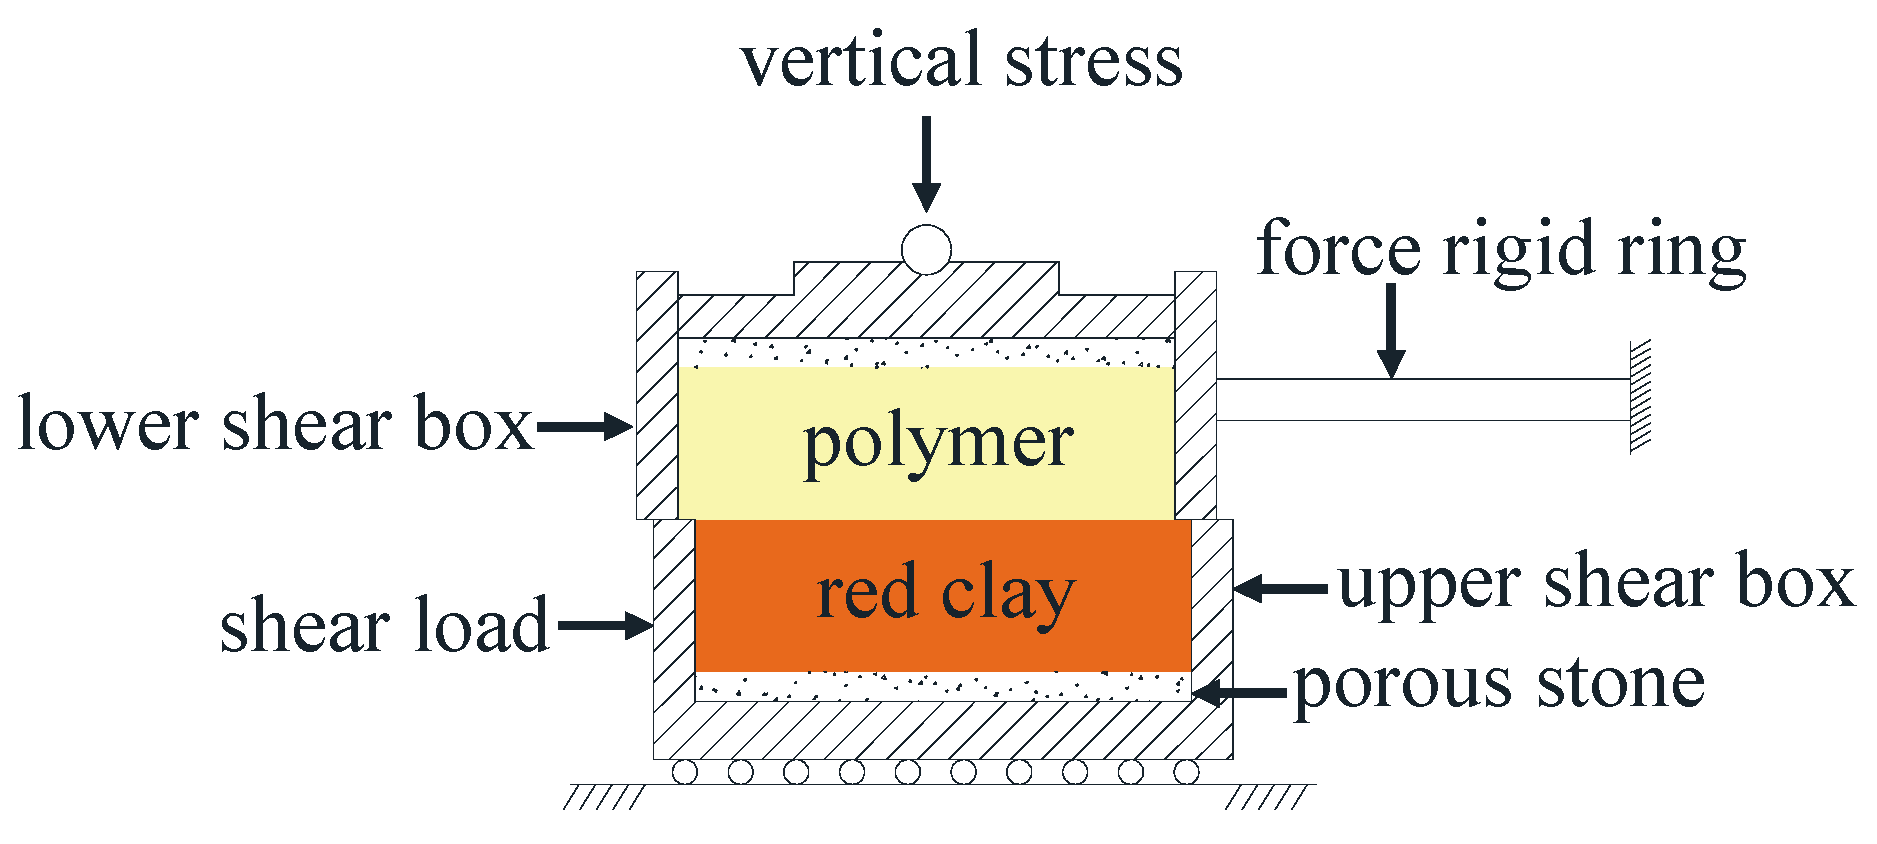
2.3. Experimental Method

The tests were conducted using a ASTM D3080 ZJ-type four-cell strain-stress controlled direct shear apparatus (manufactured by Nanjing Soil Instrument Factory), key components include: (1) Upper shear box (fixed), (2) Lower shear box (movable), (3) Pneumatic normal stress actuator, (4) Displacement-controlled motor, and (5) Data acquisition system. The direct shear test apparatus is schematically illustrated in Figure 2. The red clay was placed in the lower shear box, while the polyurethane material was placed in the upper shear box. During the cutting process, the upper shear box remained fixed, and the lower shear box moved in the cutting direction. The shear rate was set to 0.8 mm/min, and the normal stresses applied were 100, 200, 300, and 400 kPa. Shear load was applied to the specimen until failure. At the end of the test, the data were processed to obtain the shear displacement-shear stress curve and the shear strength-normal stress curve.

3. Results and Discussion

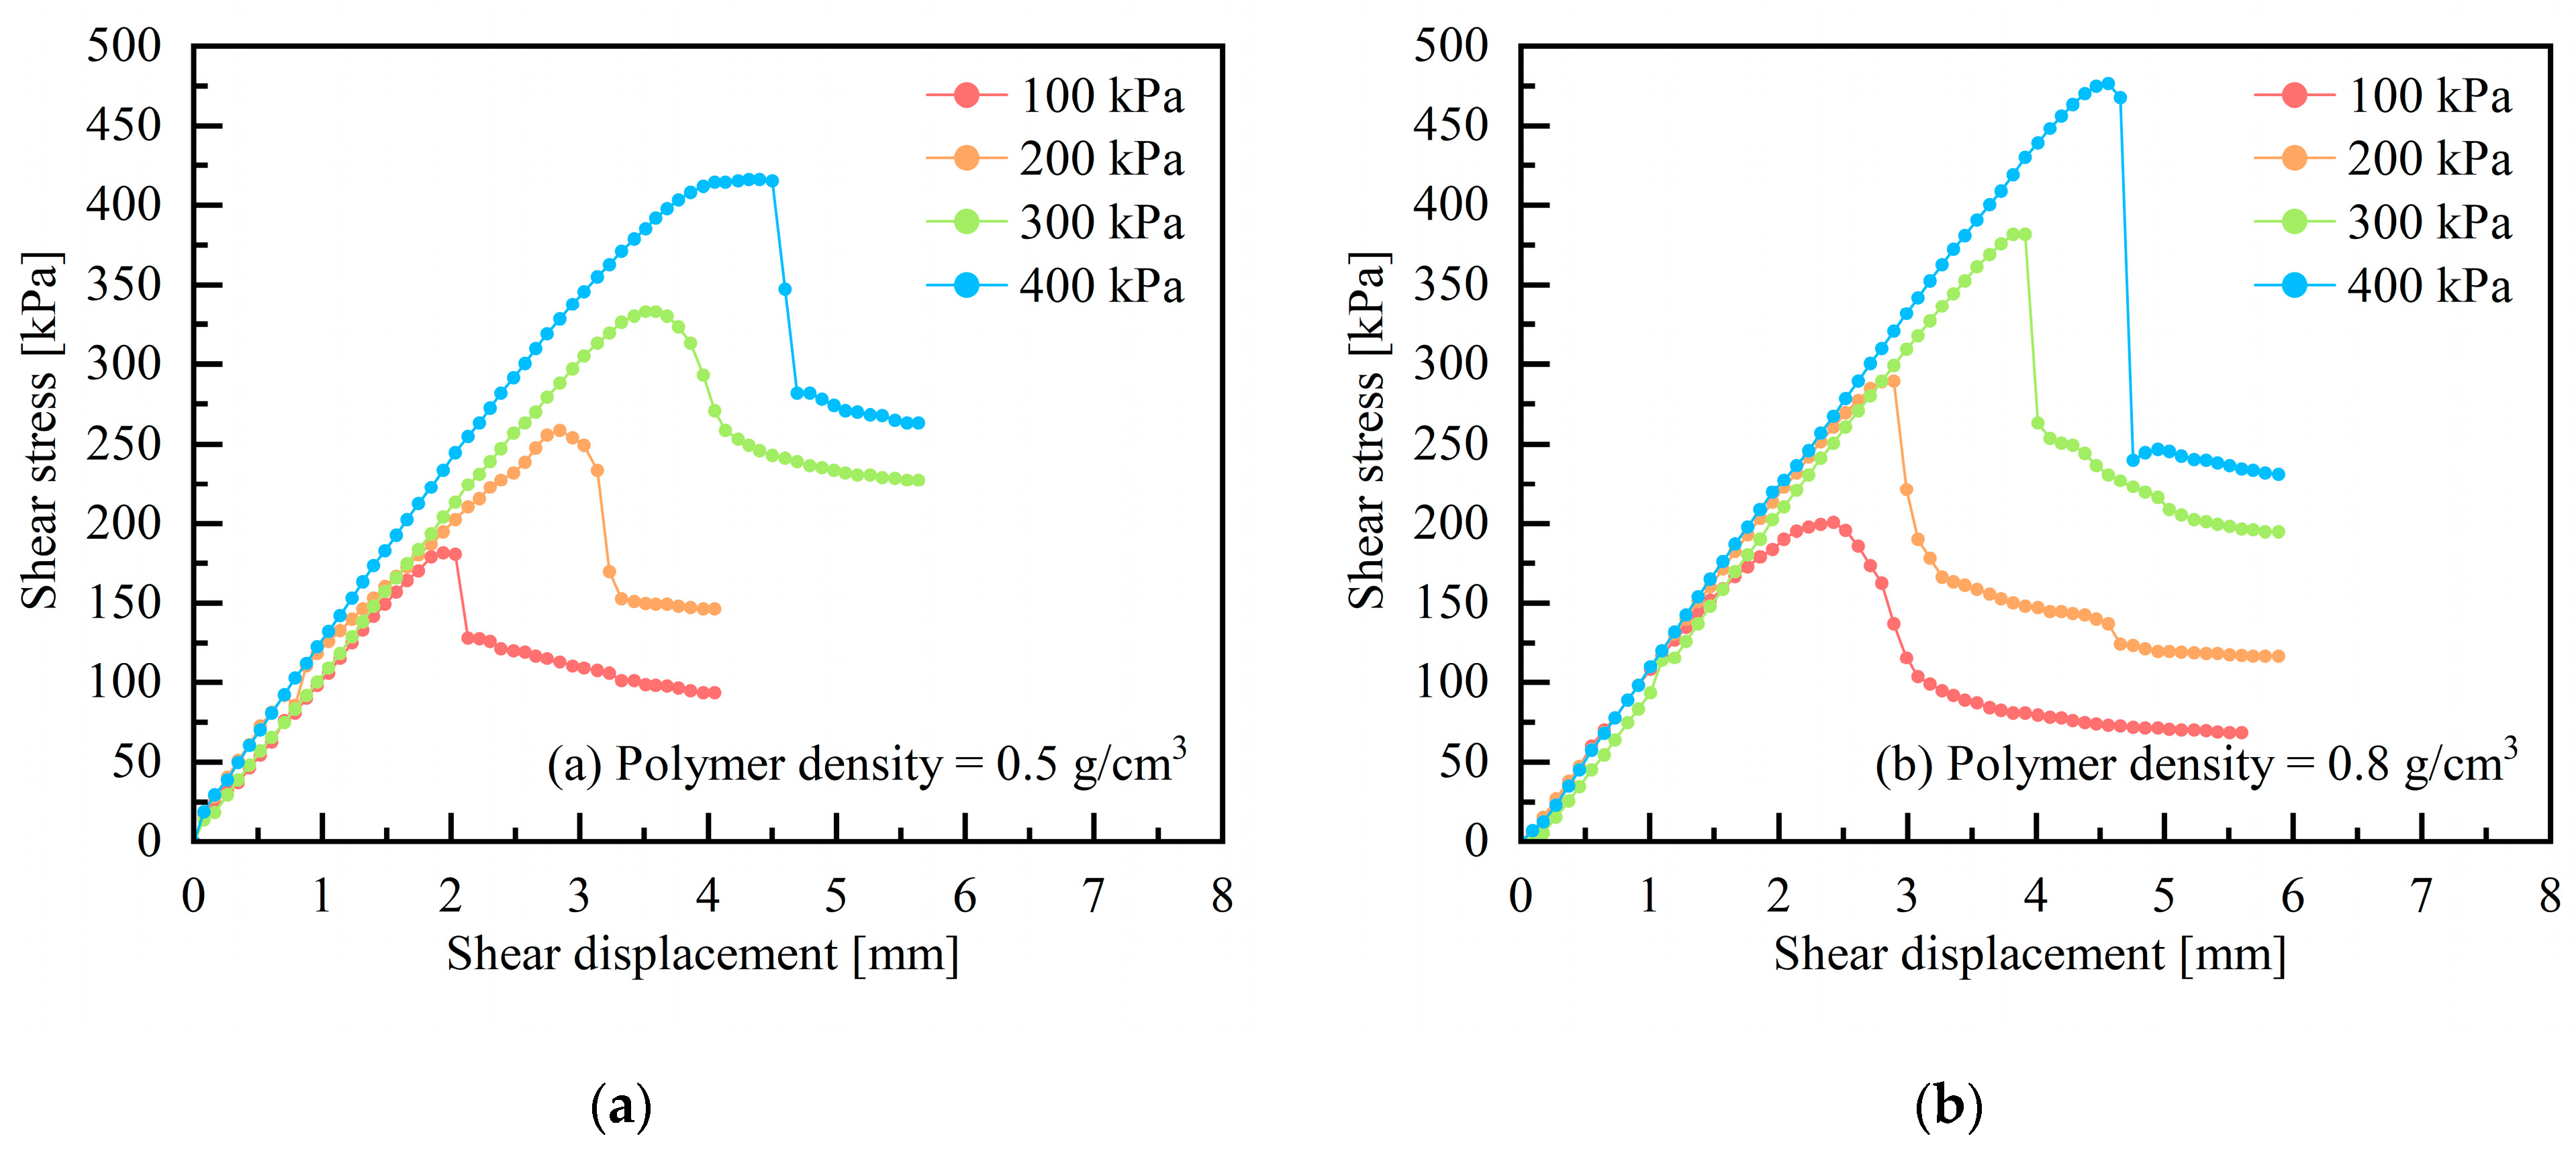
3.1. Effect of Polyurethane Density on Shear Stress-Shear Displacement Curve

Figure 3 illustrate the shear stress-strain curves of the composite interface at different polyurethane densities under normal stresses of 300 kPa and 400 kPa, respectively. As shown in the figures, the addition of polyurethane significantly influences the shape of the shear stress-strain curve of red clay, transforming the curve from shear hardening to shear softening. The shear stress-shear displacement curve after the addition of polyurethane exhibits distinct stages: a rising stage, a falling stage, and a gentle stage. These correspond to the stress rise stage, interface failure stage, and residual stress stage during the specimen testing process. The same phenomenon was also observed in polyurethane-modified sandy soil experiments [13,19,31], which indicates that the addition of polyurethane enhances the ductility of red clay to a certain degree [32]. This behavior is attributed to the infiltration of polyurethane, which fills the gaps between the red clay particles, adheres to them, and wraps around them. Additionally, polyurethane and red clay form hydrogen bonds, generating favorable interactions [33]. As the polyurethane density increases, the maximum shear stress of the interface also increases, although there is no significant change in the horizontal displacement during composite failure. When comparing the shear stress-shear displacement curves of composites with polyurethane densities of 0.5 g/cm3 and 0.8 g/cm3, it is observed that, after reaching the maximum shear stress, the stress drop is more pronounced in the composite with a polyurethane density of 0.8 g/cm3. The final residual stress of this composite is lower than that of the composite with a polyurethane density of 0.5 g/cm3. This indicates that a higher polyurethane density is not always better; the optimal density lies between 0.5 g/cm3 and 0.8 g/cm3, which was similarly corroborated by Study [24].
Furthermore, as shown in Figure 3a, when the polyurethane density is 0.2 g/cm3 or 0.5 g/cm3, the shear stress of the composite specimen decreases gradually after failure. However, when the polyurethane density reaches 0.8 g/cm3, the shear stress decreases sharply, this observation aligns with results from polyurethane-fiber and zeolite modified soils [34,35], This is due to the increased density of polyurethane, where the shear softening behavior of PU becomes more pronounced [36], ultimately leading to polymer fracture under such conditions [23]. These findings further confirm the existence of an optimal density range for PU. Excessive density induces a drastic reduction in composite shear strength, with this phenomenon becoming increasingly evident under elevated normal stress levels, extending the effective density range to 0.2 g/cm3–0.8 g/cm3, as illustrated in Figure 3b.
Considering the peak of the curve as the shear strength of the polyurethane-red clay interface, the relationship between shear strength and polyurethane density is shown in Figure 4. From the graph, it can be concluded that the incorporation of polyurethane significantly improves shear strength. Under the same normal stress conditions, as the polyurethane density increases, the shear strength also increases, the experimental results exhibit similar patterns to those reported by Bai and Li [31,37]. When the normal stress is less than 400 kPa, the change in shear strength is nearly linear with respect to polyurethane density, with the largest increase observed between 0.2 g/cm3 and 0.5 g/cm3.This behavior can be attributed to higher-density polyurethane more effectively filling the interparticle voids in red clay. The bonding strength between polyurethane and red clay is directly proportional to polyurethane density, enabling the formation of a denser “organic skeleton structure” integrated with soil particles, thereby enhancing structural stability [28].

3.2. Effect of Normal Stress on Shear-Shear Displacement Curve

Figure 5 show the shear stress-strain curves of the composite interface under different normal stresses at polyurethane densities of 0.5 g/cm3 and 0.8 g/cm3. The graphs reveal that, under a constant polyurethane density, the shear stress-shear displacement curve follows a similar trend as the normal stress increases, both exhibiting shear softening characteristics. As the normal stress increases, the horizontal displacement at shear failure, peak shear stress, and residual stress all gradually increase. Additionally, the slope of the stress rise stage also becomes steeper, Similar patterns were also observed in the experimental studies by Li and Bai on polyurethane-stabilized expansive soils and sandy soils [23,25].
The peak value of the curve is considered the shear strength of the polyurethane-red clay interface. Figure 6 illustrates that, at polyurethane densities of 0.2 g/cm3, 0.5 g/cm3, and 0.8 g/cm3, as the normal stress increases from 100 kPa to 400 kPa, the shear strength of the interface increases by 133%, 142%, and 171%, respectively. Linear fitting was performed on the relationship between the interfacial shear strength of the composite and normal stress using the Mohr-Coulomb law. The coefficients of determination (R2) for polyurethane densities of 0.2 g/cm3, 0.5 g/cm3, and 0.8 g/cm3 were 0.9253, 0.9996, and 0.9998, respectively, indicating excellent fitting results. This demonstrates that, for a given polyurethane density, the shear strength of the interface increases significantly with normal stress.

4. Model Validation

Current research by domestic and international scholars has extensively employed numerical simulation methods to investigate the mechanical performance of polyurethane-filled matrices. Xu and Fang [38,39] developed finite element models to analyze the mechanical responses of polyurethane-rehabilitated underground pipelines under varying operational conditions. Li et al. explored the mechanical properties of polyurethane-modified concrete through ABAQUS 3D finite element models [21,40,41,42,43]. Li [44] simulated the shear failure process of polyurethane-expansive soil composites using finite element modeling. These studies collectively validated the strong agreement between finite element method calculations and experimental results. To further investigate the interfacial shear characteristics of the polyurethane-red clay composite matrix, an ABAQUS simulation was conducted on direct shear tests of composite specimens with varying polyurethane densities and normal stresses. The simulations utilized ABAQUS/CAE 2022 (Dassault Systèmes) for computational analysis.

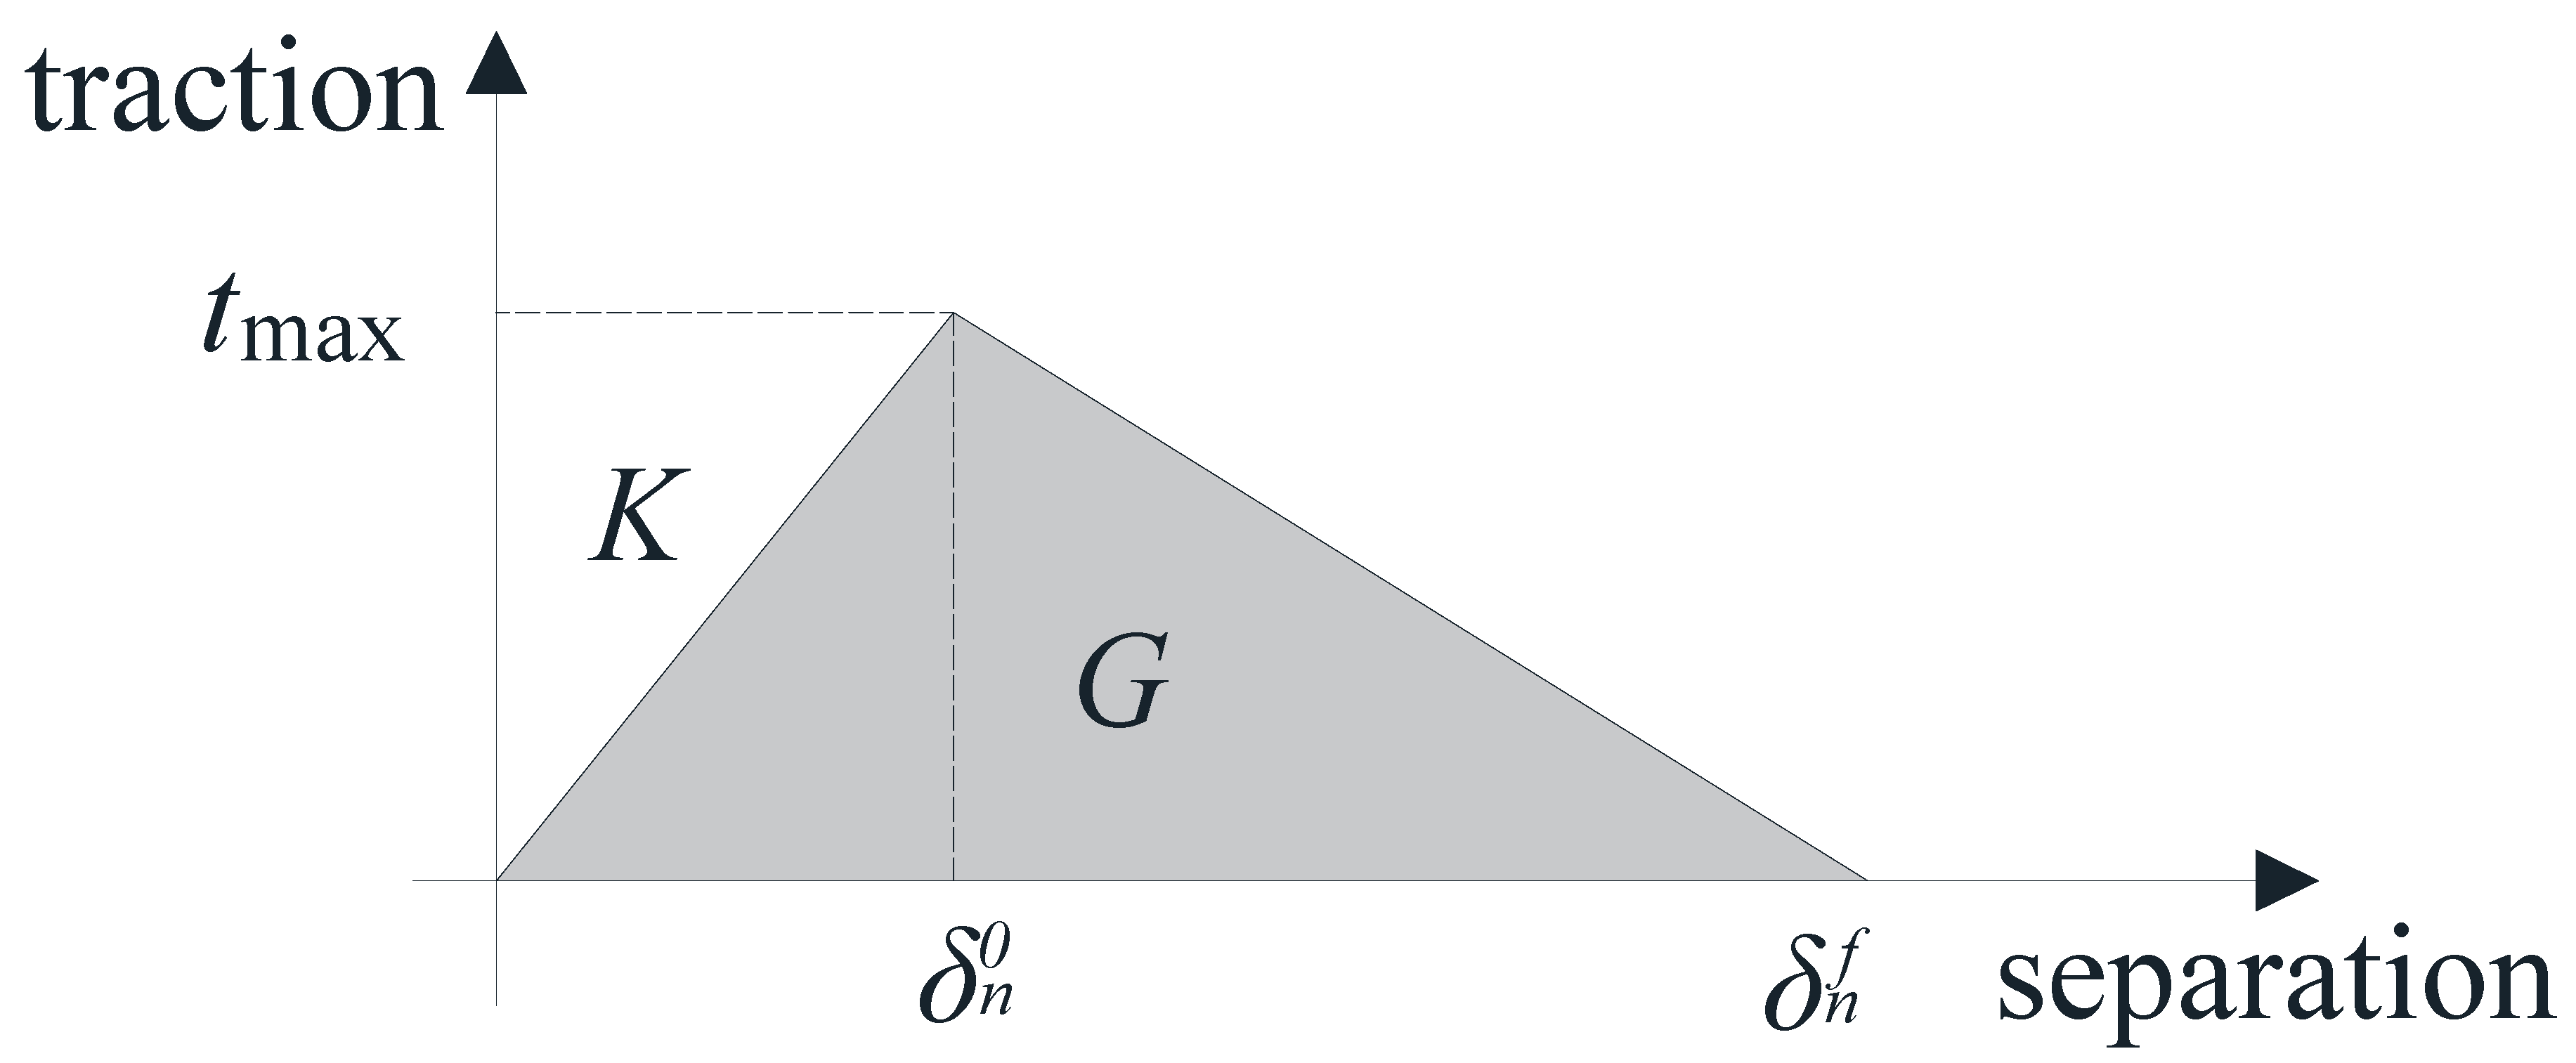
4.1. Definition of Material Parameters

The two-component polyurethane material is modeled using a linear elastic isotropic model, simplifying the polyurethane as a homogeneous material. By applying the strain energy equivalence principle, this simplification enables the model to accurately reflect the structural response of the original complex system without requiring computationally intensive analyses; The bilinear cohesive strength model simulating the interface between polyurethane and red clay must ensure stable coupling between polyurethane and red clay. Complex constitutive models can easily lead to convergence issues; therefore, a linear elastic model is chosen to simulate the polyurethane material, studies [21,40,43,44] have adopted this constitutive model for simulation experiments. The material parameters are listed in Table 3, where the elastic modulus of polyurethane at varying densities was derived from Equation (1) [37].
E = 456.81 ρ 1.77 ,
where ρ represents the polyurethane density.
The stress-strain relationship of red clay is based on the Mohr-Coulomb model built in ABAQUS [45], an extension of the classical Mohr-Coulomb yield rule. The Mohr-Coulomb yield function is adopted, incorporating isotropic hardening and softening of cohesion. The linear elastic model is based on the generalized Hooke’s law, with the constitutive equation as follows:
σ = D el ε el ,
In this equation: σ is the stress component vector; D el is the elastic matrix; ε el is the strain component vector.
The yield strength of the Mohr-Coulomb model is defined as:
τ = c σ tan φ ,
where τ is the shear strength, c is the soil cohesion, σ is the normal stress, and φ is the internal friction angle, which falls within the range of [0, 90°]. The parameter values are shown in Table 4.
From the Mohr circle, the following relationship can be derived:
τ = s cos φ ,
σ = σ m + s sin φ ,
Substituting τ and σ into Equation (3), the Mohr-Coulomb criterion can be expressed as:
s + σ m sin φ c cos φ = 0 ,
Here, s = σ 1 σ 2 2 is half the difference between the major and minor principal stresses, while σ m = σ 1 + σ 2 2 is the average value of the major and minor principal stresses. The Mohr-Coulomb yield criterion assumes that failure is independent of the intermediate principal stress. While failure in typical geotechnical materials is often influenced by the intermediate principal stress, this effect is relatively small, making the Mohr-Coulomb criterion sufficiently accurate for most applications.
Interface failure between polyurethane and red clay is modeled as type II delamination cracking, which is analyzed using the cohesive damage model [46]. The concept of a cohesive zone was first proposed by Barenblatt [47] and Dugdale [48], and represents a simplified elastic-plastic model that uses damage variables and damage evolution criteria to model the interface constitutive relationships. In ABAQUS, two types of cohesive zone unit models exist. This study uses cohesive elements to model the interface between polyurethane and red clay, neglecting delamination behavior at the bonding point. The contact interface is set as a complete contact, with cohesive elements for modeling, the cohesive zone model was employed in studies [21,44]. The constitutive model of the cohesive force unit adopts a bilinear traction-separation law, which is described by the following Figure 7:
t = t n t s t t = K n n K n s K n t K n s K s s K s t K n t K s t K t t δ n δ s δ t = K δ ,
Here, t is the nominal interface stress, δ is the interface displacement, and K is the stiffness matrix of the contact interface. The subscripts n, s and t correspond to the normal, first shear, and second shear displacement components, respectively.
In the bilinear cohesive zone model, the cohesive element’s initial failure criterion represents the material’s initial damage failure, while the damage evolution criterion governs crack propagation. According to the design of the direct shear test, the interface normal is subjected only to compressive stress, and shear force is applied in a single direction on the interface plane. Thus, the damage strength is controlled by the shear strength. When the stress reaches its maximum value, the interface’s bearing capacity decreases, initiating damage. Therefore, the maximum nominal stress criterion is used to determine interface damage, as shown in Equation (8):
max σ n σ n max , σ s σ s max , σ t σ t max = 1 ,
where σ n , σ s   σ t and represent the nominal stress in the normal, first shear, and second shear directions, respectively, and σ n max , σ s max and σ t max are the peak nominal stresses in these directions. Since the composite specimen is axisymmetric, the interface strength in each shear direction is assumed to be equivalent. For simplicity, the model assumes homogeneity of interface strength, i.e., σ n = σ s = σ t .
During the interface damage evolution stage, the displacement corresponding to the shear strength represents the initial separation displacement of the interface damage. The displacement at complete interface failure corresponds to the complete failure separation displacement. The energy consumed during the failure process is associated with the interfacial shear failure energy, which corresponds to the slope of the elastic stage in the shear stress-displacement curve, the peak stress, and the area under the curve. These parameters are derived from the stress-displacement curve of the test results, as shown in Table 5.

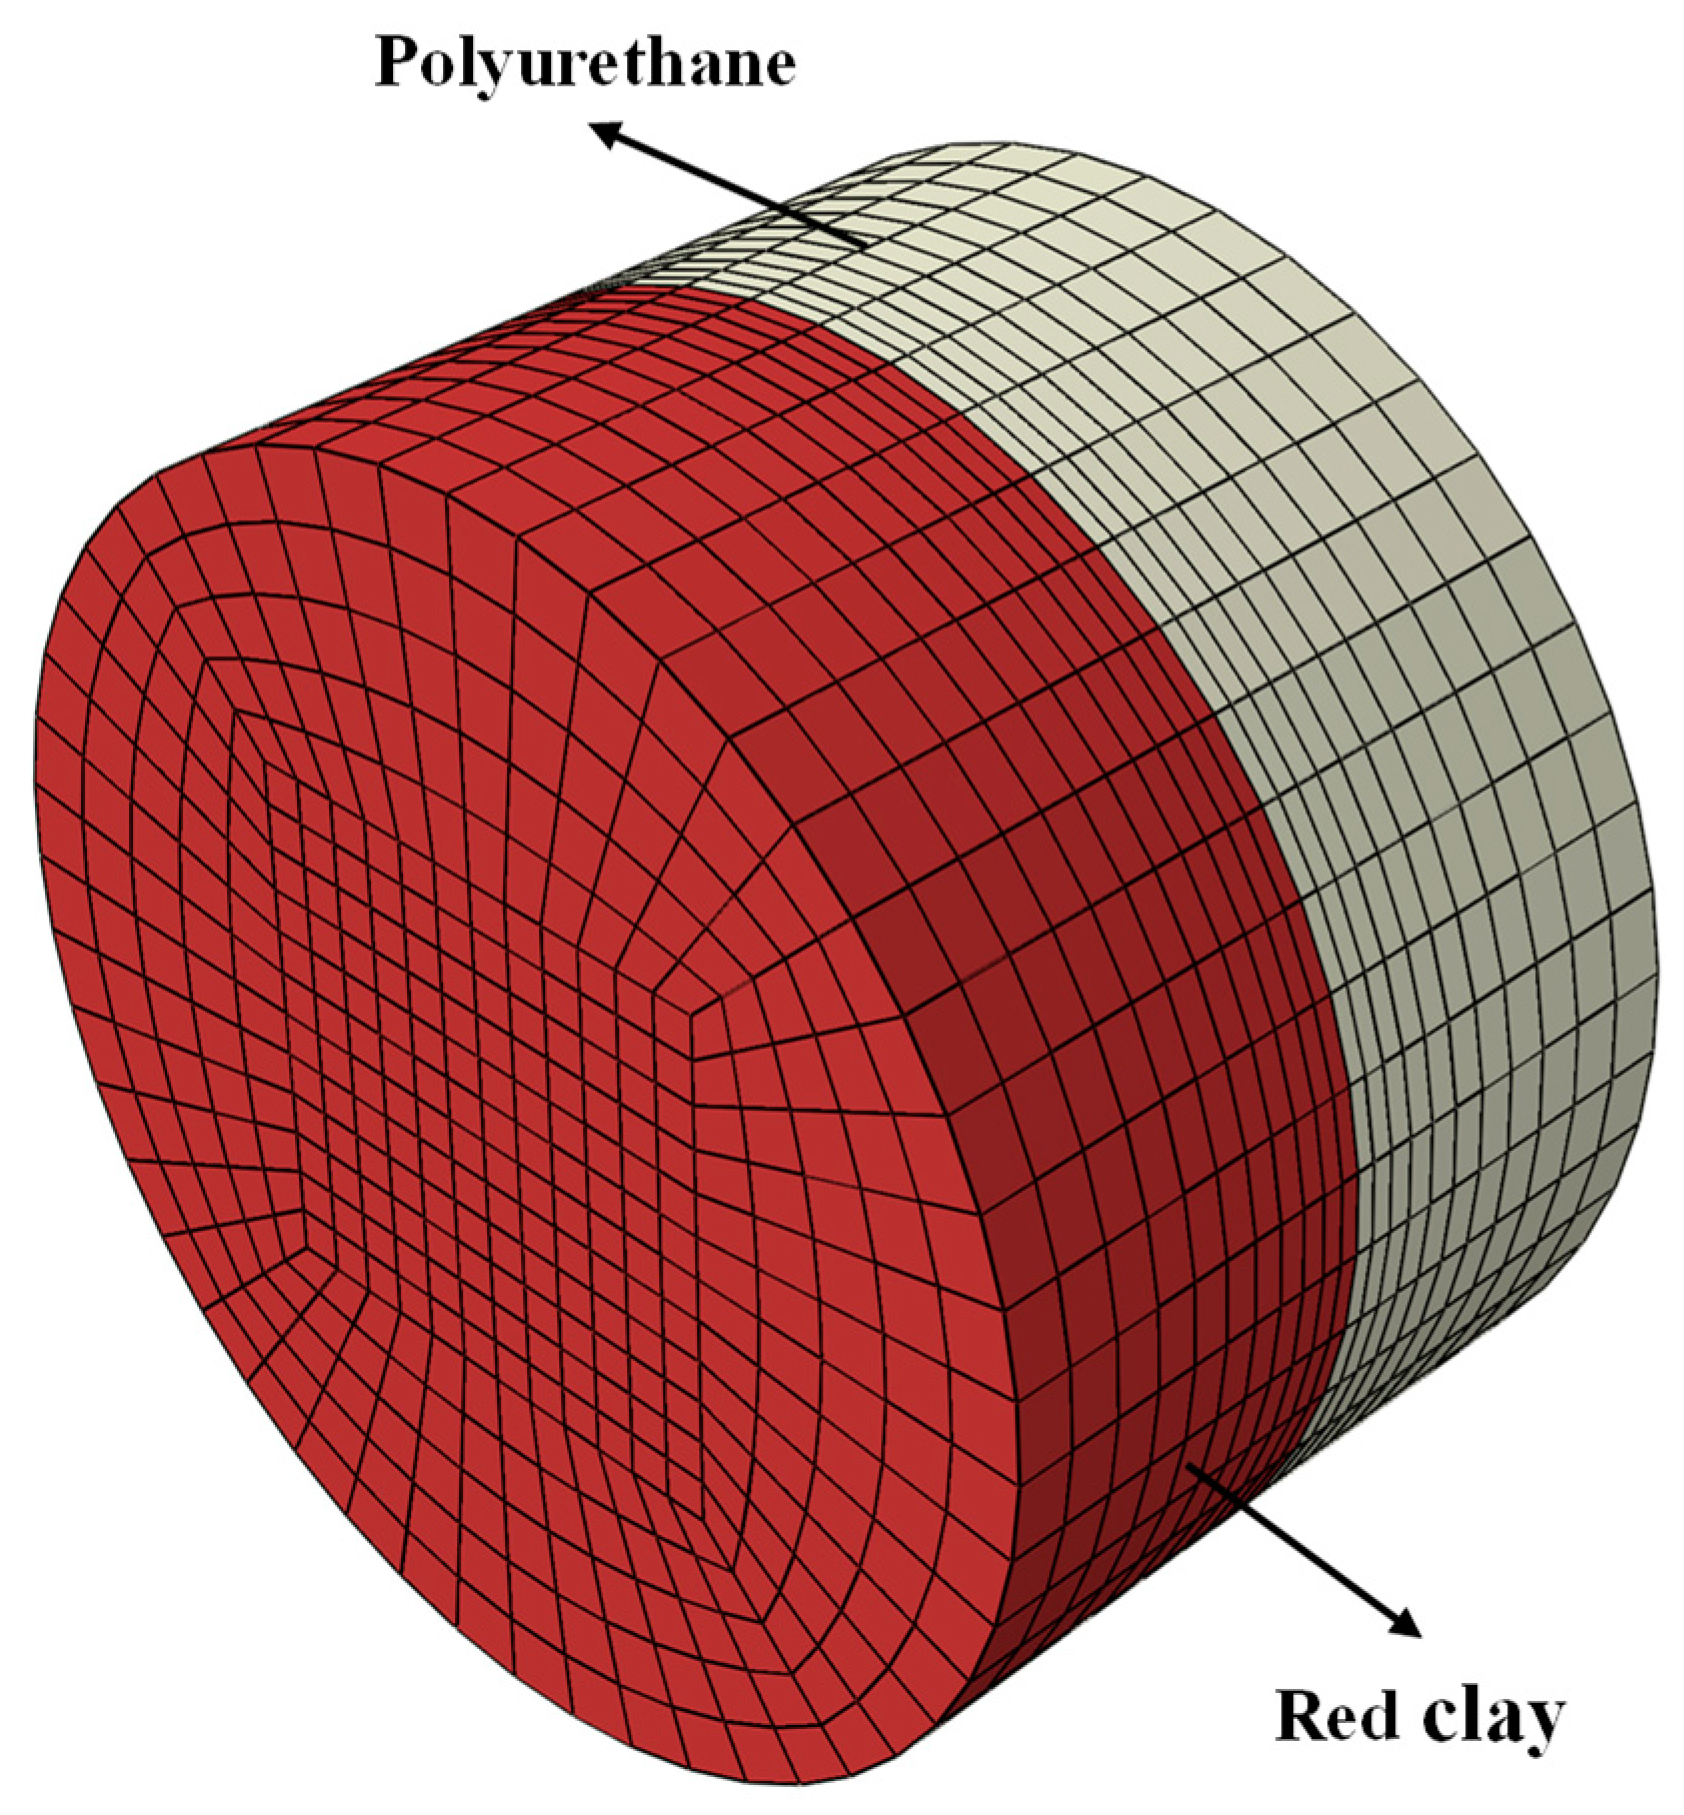
4.2. Finite Element Module Method

A three-dimensional finite element model is developed with dimensions consistent with the test sample. The model has a diameter of 61.8 mm and a height of 20 mm, with the upper and lower portions representing polyurethane and red clay, respectively. Zero-thickness cohesive elements are inserted at the interface to simulate the bonding between polyurethane and red clay. To accurately simulate interface damage, the finite element model is meshed using an O-shaped segmentation technique, with refinement at the interface damage location. The model consists of a total of 8832 elements. Polyurethane and red clay are modeled using linear hexahedral elements (C3D8R), while the cohesive elements are represented by COH3D8. The finite element mesh of the sample is shown in Figure 8 and Figure 9.
To ensure model accuracy and realism, the boundary conditions are set based on the actual working conditions of the composite direct shear test. A reference point RP-1 is placed at the left end of the upper polyurethane section and coupled to the upper polyurethane surface. Fixed constraints are applied at reference point RP-1 to restrict displacement in all directions. Vertical displacement is restricted on the upper surface of the polyurethane, and surface loads are applied in accordance with the test conditions, while vertical displacement on the lower surface of the red clay is also constrained. A reference point RP-2 is placed at the right end of the red clay, at the lower end of the specimen, and coupled to the lower surface of the polyurethane. A displacement load is applied along the x-direction at reference point RP-2, with reaction force data also being output. The finite element simulation is solved using the explicit solver Abaqus/Explicit, and the composite direct shear test process is modeled using quasi-static explicit analysis. The boundary conditions are shown in the Figure 10.

4.3. Analysis of Finite Element Simulation Results of Stress-Displacement Curve

Taking a normal stress of 300 kPa as an example, Figure 11a–c show the comparison between the shear stress–shear displacement simulation curves and experimental data for the composite interface at polyurethane densities of 0.2 g/cm3, 0.5 g/cm3, and 0.8 g/cm3, respectively. The figures indicate that the overall trend of the simulation curves closely matches the experimental results, effectively reflecting the interface damage evolution at each stage. The best fitting occurs when the shear displacement is less than 2.5 mm. After the shear displacement exceeds 2.5 mm and reaches the maximum shear stress, the fitting improves as polyurethane density increases. In the descending and flattening stages of the curve, where the interface undergoes damage softening, the simulation results align well with the experimental data, accurately representing the actual softening process.

4.4. Analysis of Finite Element Simulation Results of Shear Strength

Figure 12 presents a comparison between the simulation results for shear strength and experimental data under different polyurethane densities and normal stresses. The figure shows that while there is some error between the simulation and test results, it falls within an acceptable range. Specifically, the composite sample with a polyurethane density of 0.5 g/cm3 exhibits the smallest shear strength error, with a difference ranging from 1 kPa to 28 kPa and an error of less than 8%. The composite sample with a polyurethane density of 0.8 g/cm3 has the largest shear strength error, with a difference between 1 kPa and 66 kPa and a maximum error of 25%. For the composite sample with a polyurethane density of 0.2 g/cm3, the shear strength difference ranges from 10 kPa to 39 kPa, with a maximum error of 17%. However, when the polyurethane density is low, the polyurethane’s elastic modulus is small, resulting in weak bonding strength between the polyurethane and soil, making it prone to structural failure under normal stress. Conversely, when the polyurethane density is too high, the single mechanical model of polyurethane, as a polymer elastomer, fails to accurately describe its stress-strain relationship, leading to bias when using the elastic modulus alone. This comparison suggests that the bilinear cohesive force model is a feasible approach for simulating the interfacial shear behavior of polyurethane-red clay composite specimens.

5. Conclusions

This study investigates the influence of polyurethane density and normal stress on the interfacial shear characteristics of red clay through direct shear tests and further validates the findings using the Abaqus bilinear cohesive force model. The findings of this study offer valuable insights into the interfacial shear characteristics of polyurethane-red clay composites. Based on the results and discussions, the main conclusions are as follows:
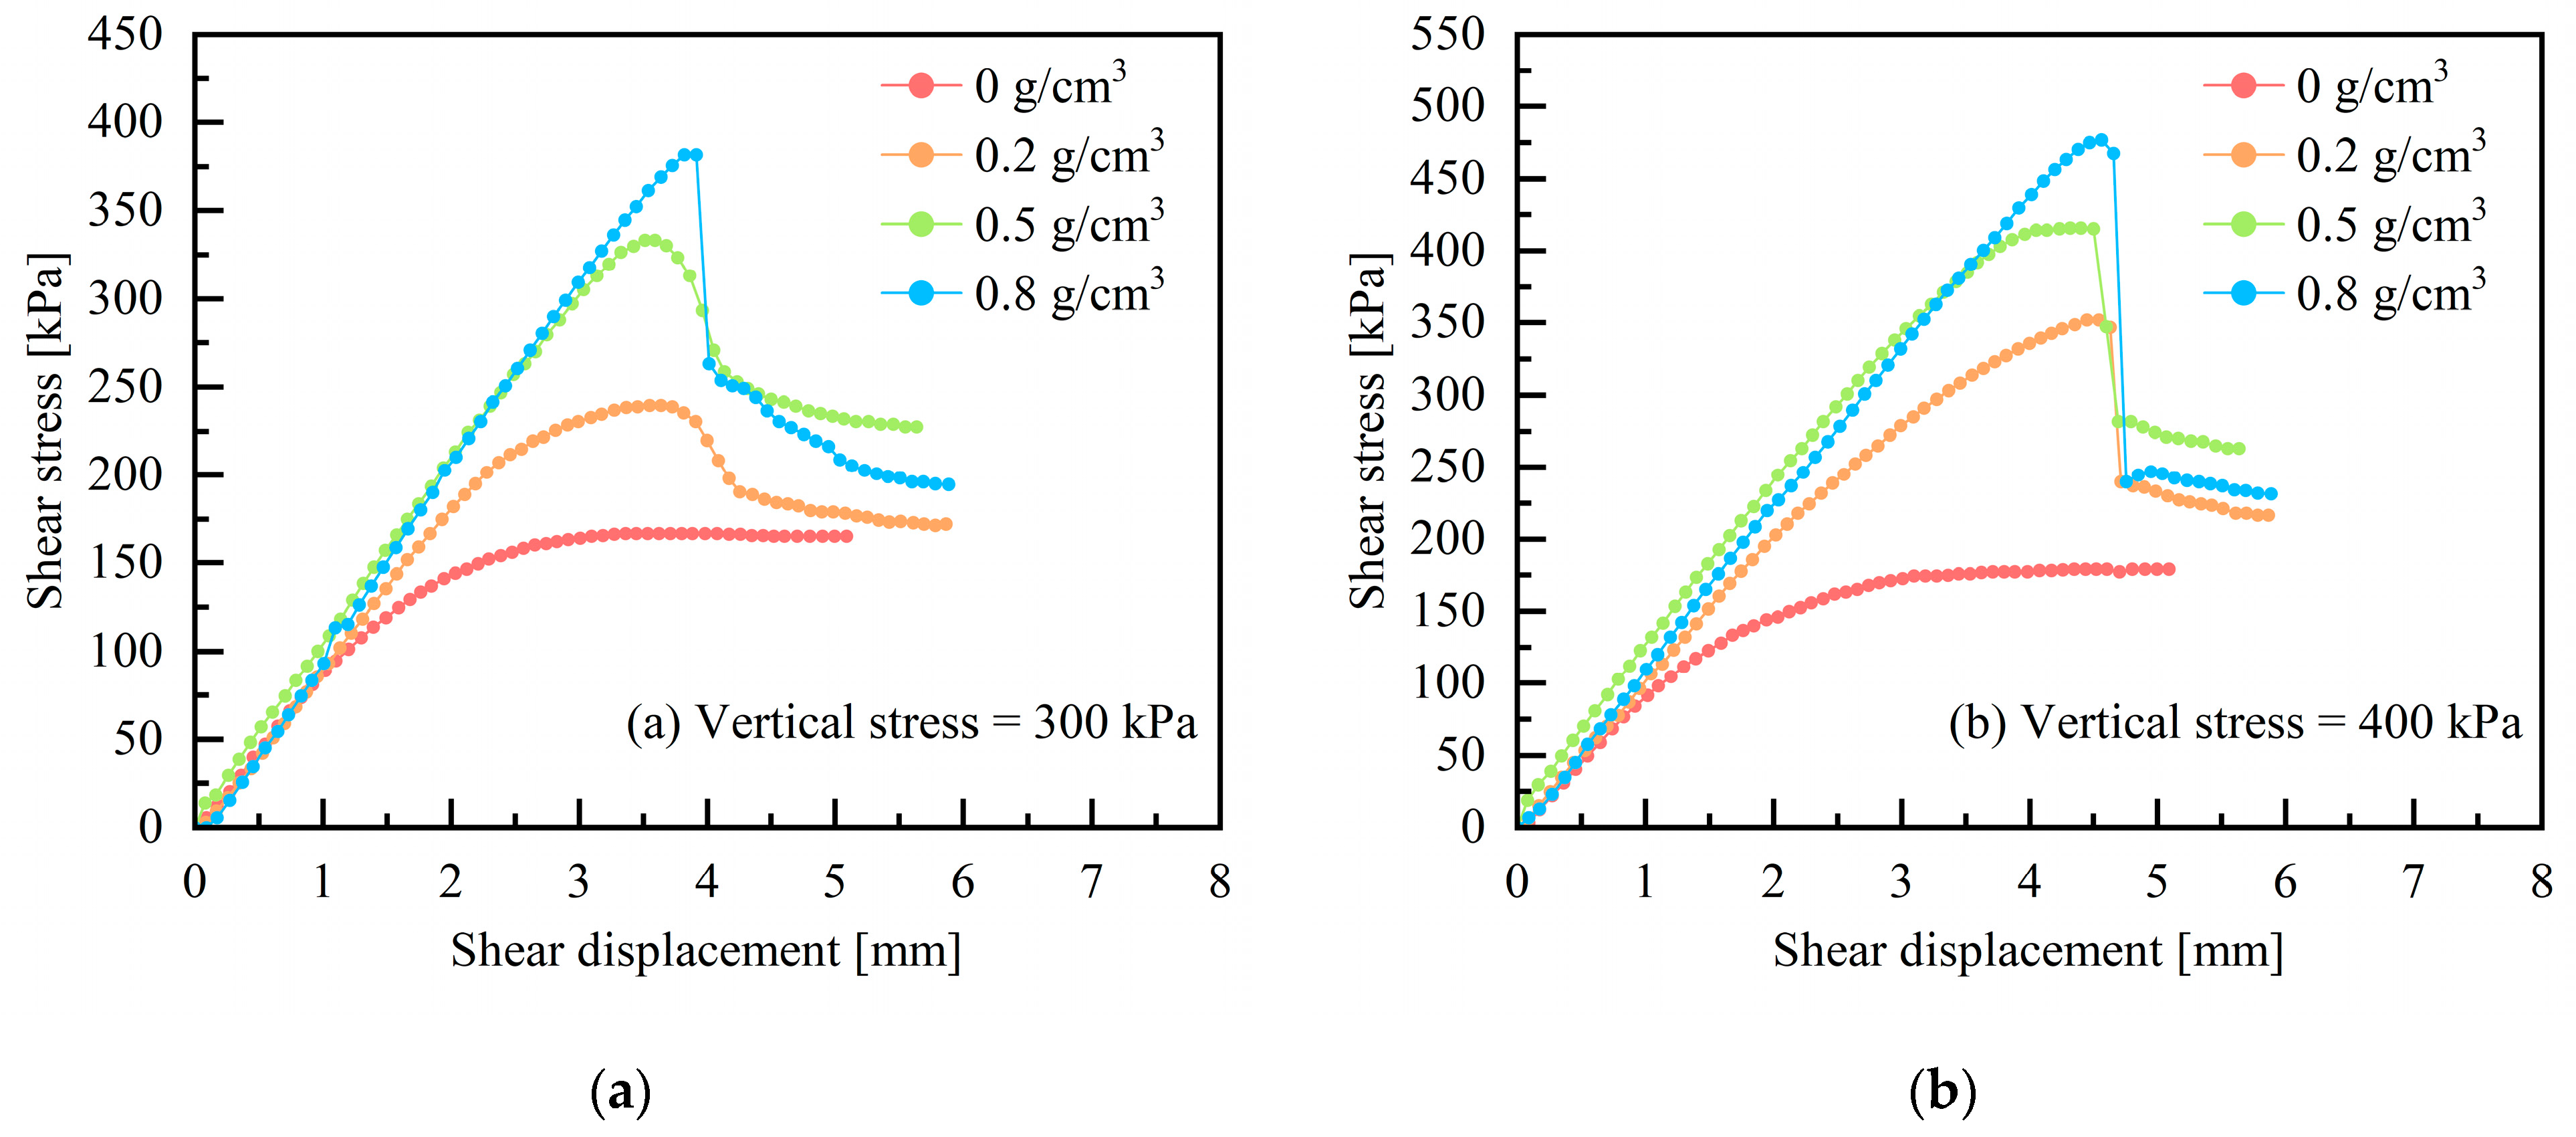
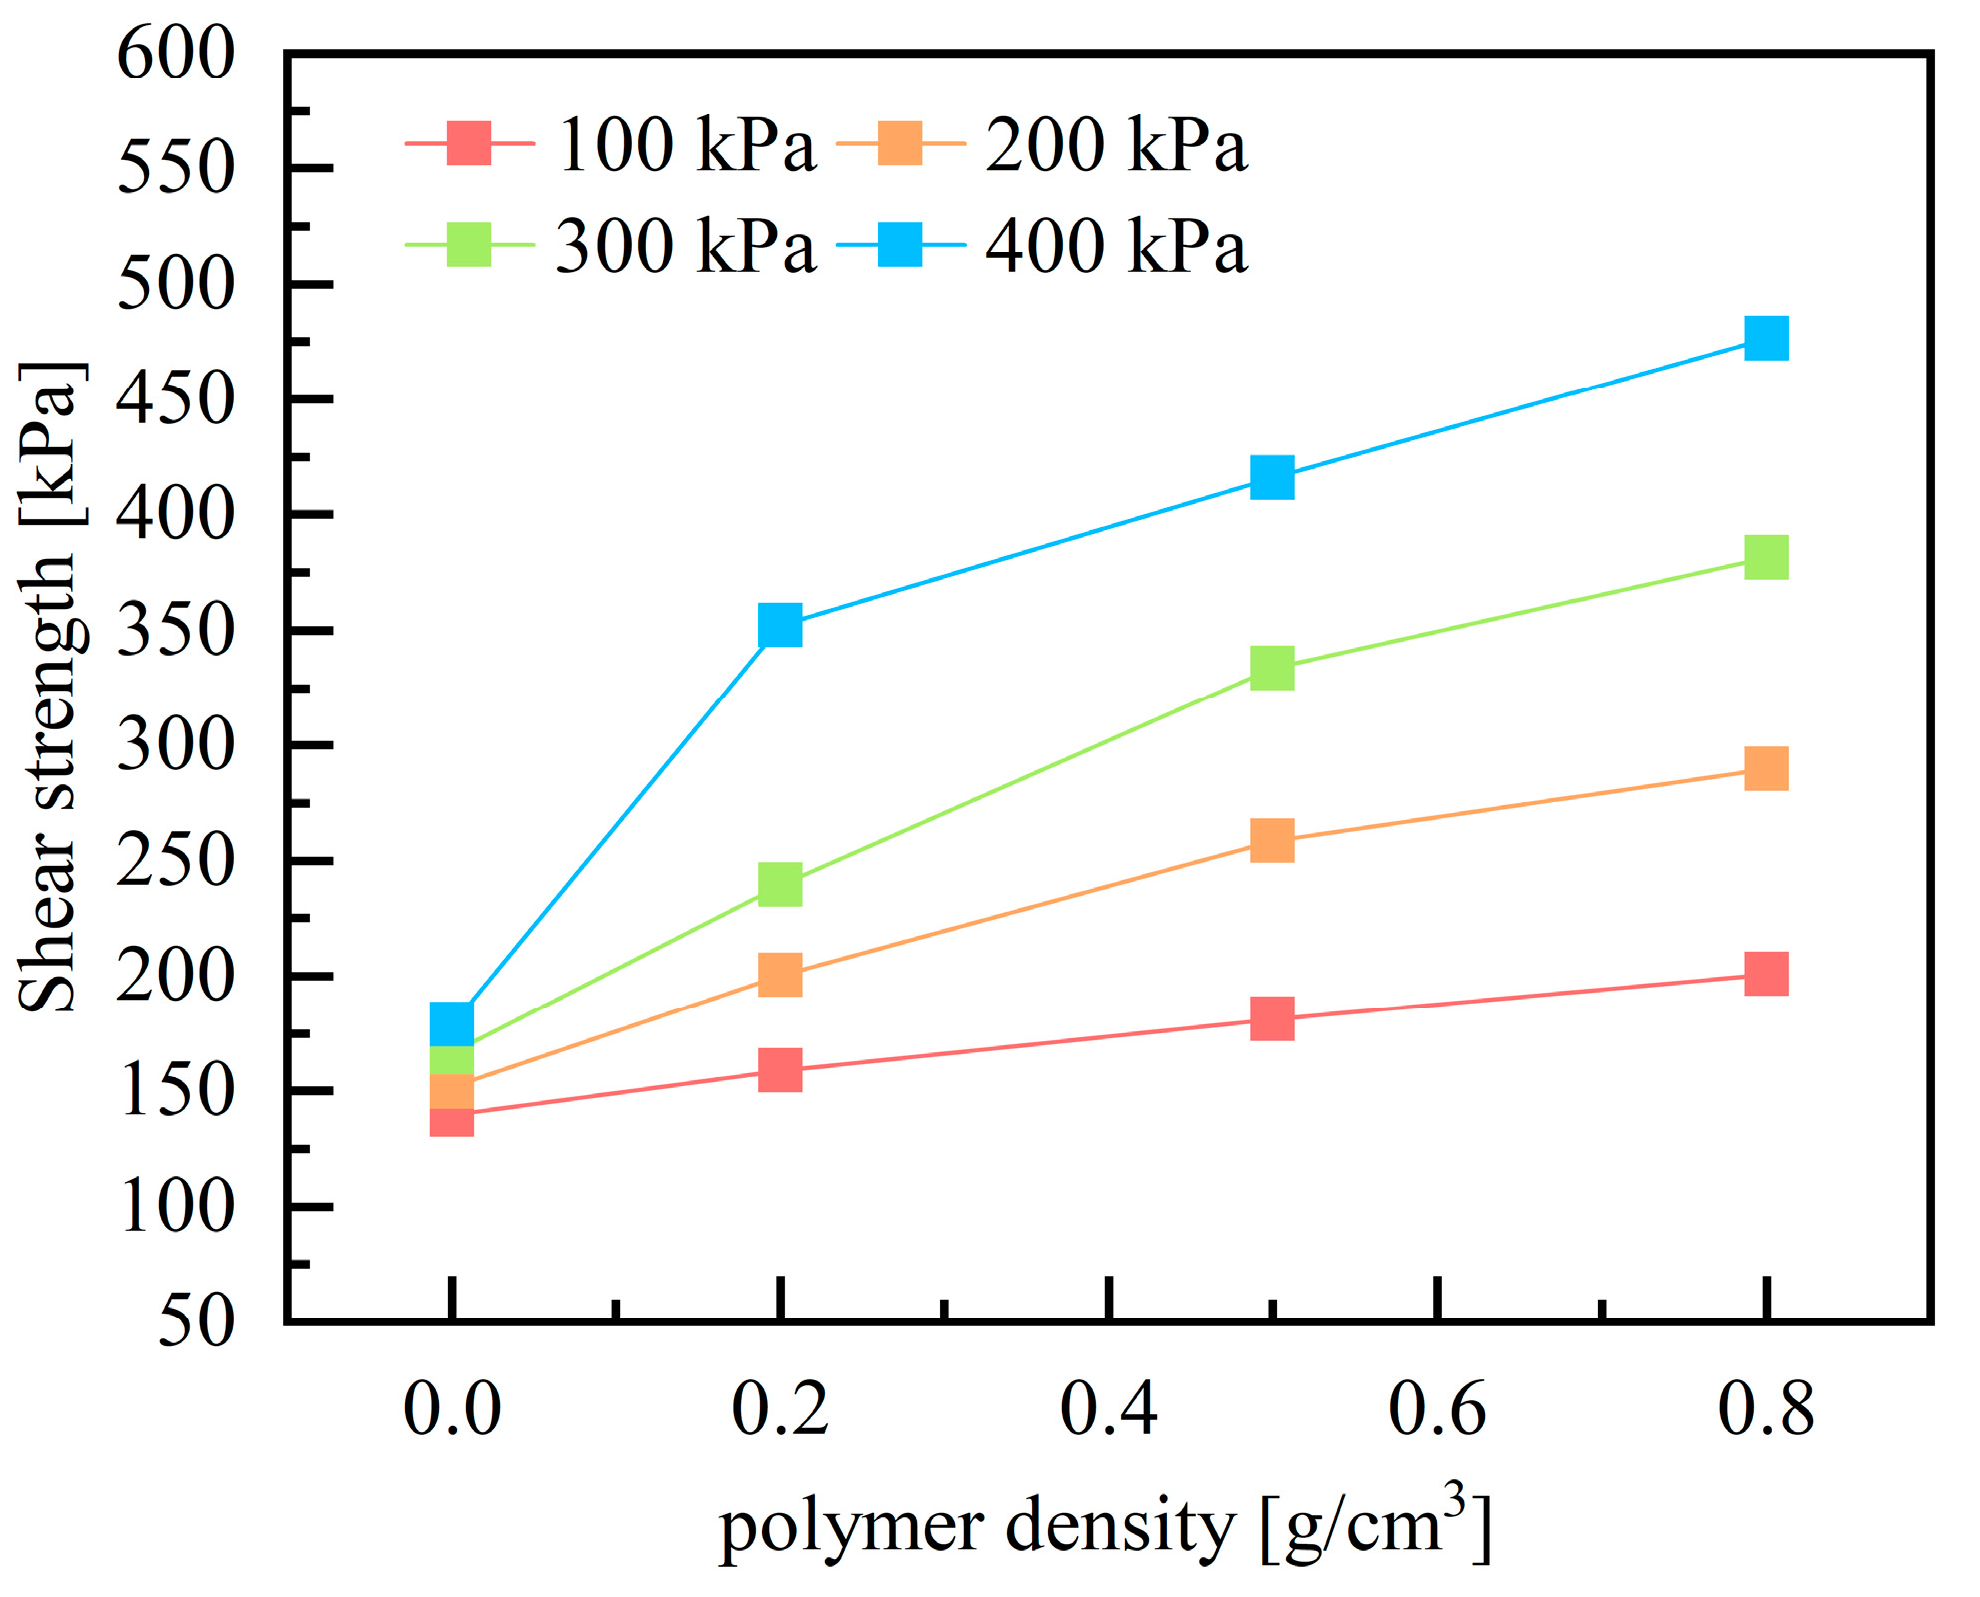
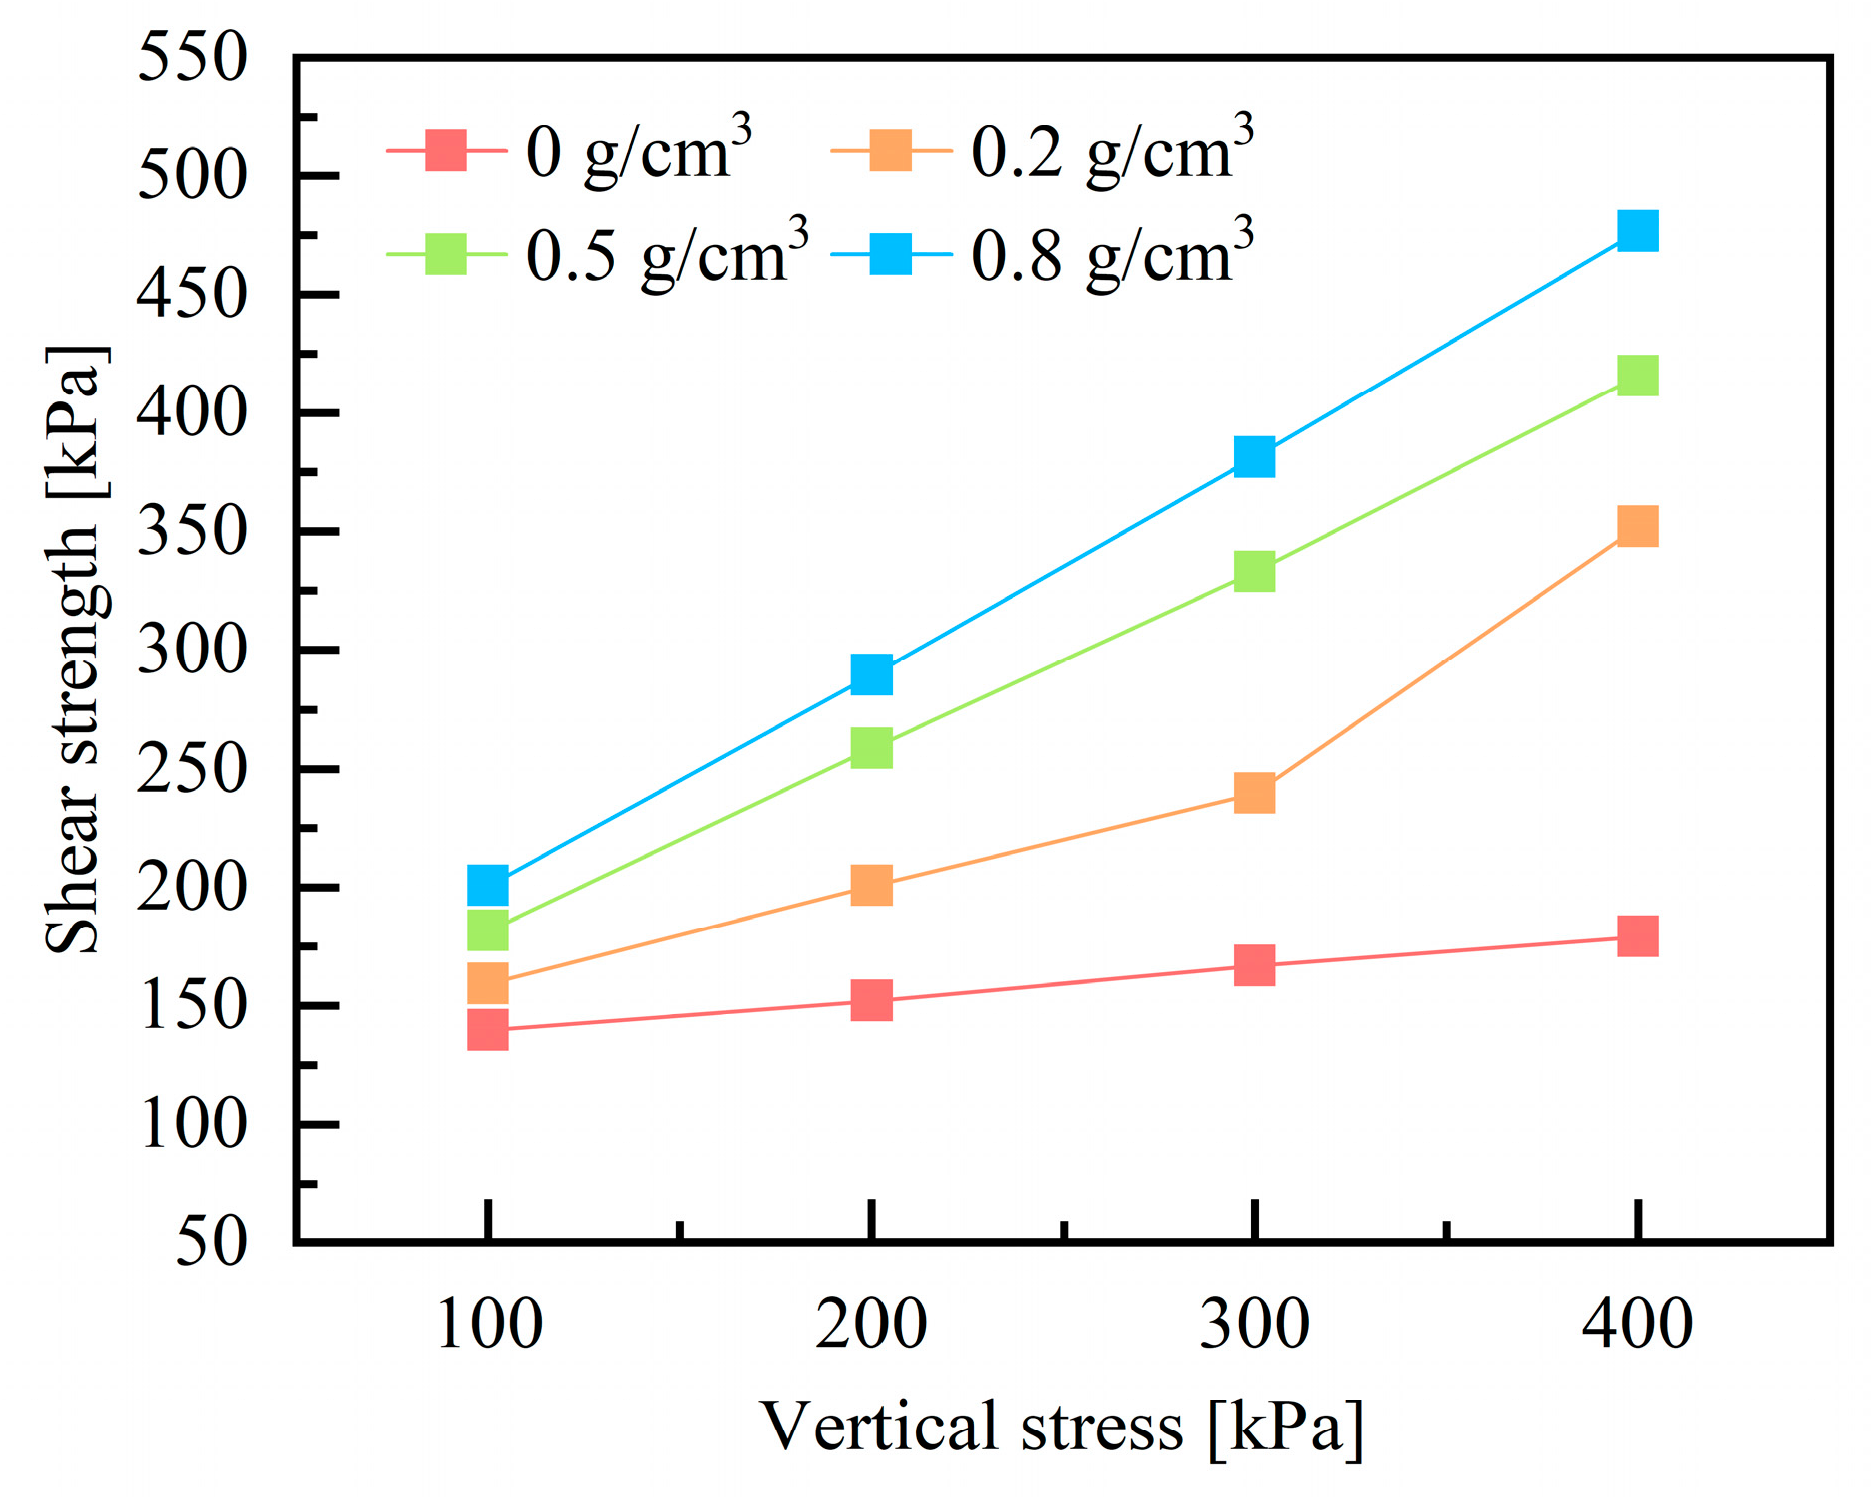
  • The incorporation of polyurethane induces a transition in the shear stress-displacement curve of red clay from strain-hardening to strain-softening behavior. As the polyurethane density increases, the shear softening characteristics of polyurethane become more pronounced, though excessive density triggers abrupt interfacial softening. The shear strength exhibits a linear positive relationship with the density of polyurethane. Considering the changes in interfacial strength and ductility after the polyurethane infiltrates the red clay, the density of polyurethane can be controlled between 0.5 g/cm3 to 0.8 g/cm3, which provides critical guidance for determining the appropriate polyurethane content in red clay slope reinforcement projects.
  • Normal stress has a significant impact on both the shear stress-strain curve and shear strength of polyurethane-red clay composites. As normal stress increases, the horizontal displacement at shear failure, peak shear stress, and residual stress all gradually increase, and the slope of the stress-rise stage also becomes steeper. Additionally, the interfacial shear strength increases linearly with normal stress.
  • Simulation of direct shear tests using the ABAQUS cohesive element finite element model effectively captures the mechanical properties of the polyurethane-red clay interface. The simulation results align well with the experimental shear stress-displacement curve; For the simulation and modeling of shear strength values, the fitting results are better when the density of polyurethane is 0.5 g/cm3. However, there are certain errors when the density is 0.2 g/cm3 and 0.8 g/cm3, although these errors remain within an acceptable range.

6. Outlook

  • The current finite element modeling approach treats the polyurethane material as an idealized linear-elastic isotropic constitutive model, which introduces notable limitations—particularly in accurately predicting the shear strength of high-density polyurethane composites. To address this, future work will adopt a hyperelastic-viscoelastic constitutive model that better captures the polyurethane’s deformation behavior.
  • This study elucidates the intrinsic relationship between polyurethane density and interfacial shear behavior in red clay, establishing a theoretical benchmark for optimizing field slope stabilization strategies. Future work will extend these findings to practical engineering applications through integrated assessment of construction feasibility, long-term durability, and environmental compatibility.
  • Subsequent studies will adopt the methodology established by Kraśkiewicz [49] for the linear relationship between polyurethane foam density and compressive stiffness, systematically compare the density-dependent mechanical behavior of polyurethane -red clay interfaces with other elastomer-soil systems, and validate the generalizability of this work’s conclusions. Correlation matrices and sensitivity analysis will be employed to quantify the interactions among polyurethane density, stiffness, environmental factors, and interfacial shear strength.

Author Contributions

Conceptualization, X.Z. and F.C.; methodology, X.Z. and F.C.; software, X.Z.; validation, X.Z., F.C. and Q.L.; formal analysis, X.Z.; investigation, X.Z.; resources, X.Z.; data curation, X.Z., F.C. and Q.L.; writing—original draft preparation, X.Z. and F.C.; writing—review and editing, X.Z. and F.C.; visualization, X.Z. and F.C.; supervision, X.Z. and F.C.; funding acquisition, X.Z. and F.C. All authors have read and agreed to the published version of the manuscript.

Funding

Guangxi Key Research and Development Program: GKAB24010037; National Natural Science Foundation of China: 42467020.

Institutional Review Board Statement

Not applicable.

Informed Consent Statement

Not applicable.

Data Availability Statement

Data are contained within the article.

Acknowledgments

The authors thank Shengju Building Materials Limited Company for providing the polyurethane materials used in this study.

Conflicts of Interest

The authors declare no conflict of interest.

References

  1. Zeng, L.; Yu, H.C.; Gao, Q.F.; Liu, J.; Liu, Z. Evolution of Tensile Properties of Compacted Red Clay Under Wet and Dry Cycles. KSCE J. Civ. Eng. 2022, 26, 606–618. [Google Scholar] [CrossRef]
  2. Ma, H.; Duan, Z.; Zhang, T.; Xu, S.; Lv, M. Micro-constructive Damage Model of Dry-Wet Cyclic Red Clay Based on Weibull Distribution. J. Test. Eval. 2024, 52, 1095–1108. [Google Scholar] [CrossRef]
  3. Li, H.; Chen, H.; Li, X.; Zhang, F. Design and construction application of concrete canvas for slope protection. Powder Technol. 2019, 334, 937–946. [Google Scholar] [CrossRef]
  4. Su, H.; Wu, D.; Lu, Y.; Peng, X.; Wang, X.; Chen, W.; Wang, S. Experimental and numerical study on stability performance of new ecological slope protection using bolt-hinge anchored block. Ecol. Eng. 2021, 172, 106409. [Google Scholar] [CrossRef]
  5. Han, L.; Long, J.; Song, Y. Study on bearing capacity characteristics and reinforcement measures of fill foundation in karst mountain area. Build. Struct. 2023, 53, 2326–2331. [Google Scholar]
  6. Chen, L.; Chen, X.; Wang, H.; Huang, X.; Song, Y. Mechanical Properties and Microstructure of Lime-Treated Red Clay. KSCE J. Civ. Eng. 2021, 25, 70–77. [Google Scholar] [CrossRef]
  7. Ma, H.; Pei, C.; Li, S.; Xu, S. Performance Evaluation and Modification Mechanism of Red Clay Treated with Lignosulfonate. Int. J. Civ. Eng. 2024, 22, 1961–1976. [Google Scholar] [CrossRef]
  8. Vilhena, R.M.; Mascarenha, M.M.d.A.; Angelim, R.R.; Simões, T.d.R.; Oliveira, R.B.d.; Luz, M.P.d. Evaluation of Lime-Treated Lateritic Soil for Reservoir Shoreline Stabilization. Water 2020, 12, 3141. [Google Scholar] [CrossRef]
  9. Liu, Z.Y.; Chen, K.S. Research on Road Characteristics and the Microscopic Mechanism of Lime–Phosphogypsum-Stabilized Red Clay. Appl. Sci. 2023, 13, 8057. [Google Scholar] [CrossRef]
  10. Wang, L.; Weng, Z.; Qiang, L. Improving the Mechanical Properties of Red Clay Using Xanthan Gum Biopolymer. Int. J. Polym. Sci. 2021, 2021, 1535772. [Google Scholar] [CrossRef]
  11. Vydehi, K.V.; Moghal, A.A.B. Effect of Biopolymeric Stabilization on the Strength and Compressibility Characteristics of Cohesive Soil. J. Mater. Civ. Eng. 2021, 34, 04021428. [Google Scholar] [CrossRef]
  12. Hamza, M.; Nie, Z.H.; Aziz, M. Geotechnical behavior of high-plastic clays treated with biopolymer: Macro-micro-study. Environ. Earth Sci. 2023, 82, 91. [Google Scholar] [CrossRef]
  13. Liu, J.; Chen, Z.; Kanungo, D.P.; Song, Z.; Bai, Y.; Wang, Y.; Li, D.; Qian, W. Topsoil reinforcement of sandy slope for preventing erosion using water-based polyurethane soil stabilizer. Eng. Geol. 2019, 252, 125–135. [Google Scholar] [CrossRef]
  14. Fang, H.Y.; Su, Y.J.; Du, X.M. xperimental and Numerical Investigation on Repairing Effect of Polymer Grouting for Settlement of High-Speed Railway Unballasted Track. Appl. Sci. Basel 2019, 9, 4496. [Google Scholar] [CrossRef]
  15. Xu, J.G.; Chen, Z.H.; Wang, R. Mechanical Characteristic Analysis of Buried Drainage Pipes After Polymer Grouting Trenchless Rehabilitation. Adv. Civ. Eng. 2021, 6, 679412. [Google Scholar] [CrossRef]
  16. Li, B.; Wang, F.M.; Fang, H.Y. Experimental and numerical study on polymer grouting pretreatment technology in void and corroded concrete pipes. Tunn. Undergr. Space Technol. 2021, 113, 103842. [Google Scholar] [CrossRef]
  17. Li, S.; Niu, Y.; Wang, B.; Gao, Y.; Zhu, Y. Research on Mechanical Response of Polymer Grouting Repair for Longitudinal Cracks in Reconstructed and Expanded Expressway Pavement. Math. Probl. Eng. 2022, 2022, 5760674. [Google Scholar] [CrossRef]
  18. Xu, C.; Zhang, Z.; Zhao, F.; Liu, F.; Wang, J. Improving the performance of RET modified asphalt with the addition of polyurethane prepolymer (PUP). Constr. Build. Mater. 2019, 206, 560–575. [Google Scholar] [CrossRef]
  19. Tao, G.; Yuan, J.; Chen, Q.; Peng, W.; Yu, R.; Basack, S. Chemical stabilization of calcareous sand by polyurethane foam adhesive. Constr. Build. Mater. 2021, 295, 123609. [Google Scholar] [CrossRef]
  20. Fang, H.; Su, Z.; Li, X.; Wang, F.; Fu, Y. Interfacial bond performance between self-expansion polymer and concrete. Constr. Build. Mater. 2021, 270, 121459. [Google Scholar] [CrossRef]
  21. Li, X.; Wang, M.; Zheng, D.; Fang, H.; Wang, F.; Wan, J. Study on the failure mechanism between polyurethane grouting material and concrete considering the effect of moisture by digital image correlation. J. Build. Eng. 2023, 67, 105948. [Google Scholar] [CrossRef]
  22. Fan, G.; Sha, F.; Yang, J.; Ji, X.; Lin, F.; Feng, C. Research on working performance of waterborne aliphatic polyurethane modified concrete. J. Build. Eng. 2022, 51, 104262. [Google Scholar] [CrossRef]
  23. Li, M.; Fang, H.; Du, M.; Zhang, C.; Su, Z.; Wang, F. The behavior of polymer-bentonite interface under shear stress. Constr. Build. Mater. 2020, 248, 118680. [Google Scholar] [CrossRef]
  24. Wang, Y.; Wan, Y.; Liu, Q.; Guo, C.; Shi, M. Interfacial Shear Properties of Non-water Reacted Polymer and Geomaterials. J. Build. Mater. 2021, 24, 115–120. [Google Scholar]
  25. Bai, Y.; Liu, J.; Song, Z.; Zhang, C.; He, C.; Deng, Y. Experimental study on strength and deformation characteristics of polymers treated sand. Acta Mater. Compos. Sin. 2024, 41, 4272–4286. [Google Scholar]
  26. Lin, P.; Guo, P.; Guo, C.; Chen, L.; Wang, F. Experimental study on interfacial shear properties of steel plate, polymer and soil. Chin. J. Geotech. Eng. 2023, 45, 85–93. [Google Scholar]
  27. Kim, J.; Choi, H.; Rye, H.-M.; Yoon, K.-B.; Lee, D.-E. A Study on the Red Clay Binder Stabilized with a Polymer Aqueous Solution. Polymers 2021, 13, 54. [Google Scholar] [CrossRef]
  28. Tan, P.; Wang, F.; Guo, C.; Liu, J.; Lei, Q.; Liu, Z. Performance evaluation and stabilization mechanism of red clay treated with polyurethane. Chemosphere 2023, 340, 139864. [Google Scholar] [CrossRef]
  29. Tan, P.; Wang, F.; Guo, C.; Liu, J. Cyclic stress–strain characteristics of red clay treated with permeable water-soluble polyurethane. Transp. Geotech. 2023, 42, 101072. [Google Scholar] [CrossRef]
  30. GB/T 50123-2019; Ministry of Housing and Urban-Rural Development. Standard for Soil Test Method; China Planning Press: Beijing, China, 2019.
  31. Bai, Y.; Liu, J.; Cui, Y. Mechanical behavior of polymer stabilized sand under different temperatures. Constr. Build. Mater. 2021, 290, 123237. [Google Scholar] [CrossRef]
  32. Liu, W.; Ouyang, G.; Luo, X. Moisture content, pore-water pressure and wetting front in granite residual soil during collapsing erosion with varying slope angle. Geomorphology 2020, 362, 107210. [Google Scholar] [CrossRef]
  33. Lee, K.; Her, J.; Kwon, S. Red clay composites reinforced with polymeric binders. Constr. Build. Mater. 2008, 22, 2292–2298. [Google Scholar] [CrossRef]
  34. Liu, J.; Wang, Y.; Kanungo, D.P. Study on the Brittleness Characteristics of Sand Reinforced with Polypropylene Fiber and Polyurethane Organic Polymer. Fibers Polym. 2019, 20, 620–632. [Google Scholar] [CrossRef]
  35. ShahriarKian, M.; Kabiri, S.; Bayat, M. Utilization of Zeolite to Improve the Behavior of Cement-Stabilized Soil. Int. J. Geosynth. Ground Eng. 2021, 7, 35. [Google Scholar] [CrossRef]
  36. Wang, Y.; Li, B.; Chen, C.; Fang, H.; Du, X.; Wang, N.; Zhai, K.; Di, D.; Du, M. Shear behavior of a two-component non-water reactive foamed polyurethane (TNFPU) grouting material under different stress levels. Constr. Build. Mater. 2024, 411, 134429. [Google Scholar] [CrossRef]
  37. Li, X.; Wan, J.; Zheng, D.; Fang, H.; Wang, F.; Hu, S. Compressive mechanical properties of self-expanding grouting materials with different densities. Constr. Build. Mater. 2022, 332, 127308. [Google Scholar] [CrossRef]
  38. Xu, J.; Hu, H.; Zhong, Y.; Wang, R.; Wang, B. Numerical Analysis on Underground Pipe Settlement and Vacancy Repairing with Polymer Injection. Chin. J. Undergr. Space Eng. 2017, 13, 1165–1172. [Google Scholar]
  39. Fang, H.; Li, B.; Wang, F. The mechanical behaviour of drainage pipeline under traffic load before and after polymer grouting trenchless repairing. Tunn. Undergr. Space Technol. 2018, 74, 185–194. [Google Scholar] [CrossRef]
  40. Goushis, R.; Mini, K.M. Finite element analysis of polymeric and cementitious materials to secure cracks in concrete. Mater. Today Proc. 2022, 49, 1599–1606. [Google Scholar] [CrossRef]
  41. Haruna, S.I.; Ibrahim, Y.E.; Han, Z.; Farouk, A.I.B. Flexural Response of Concrete Specimen Retrofitted with PU Grout Material: Experimental and Numerical Modeling. Polymers 2023, 15, 4114. [Google Scholar] [CrossRef]
  42. Hála, P.; Perrot, A.; Vacková, B. Experimental and numerical study on ballistic resistance of polyurethane-coated thin HPFRC plate. Mater. Today Proc. 2023, 93, 607–613. [Google Scholar] [CrossRef]
  43. Garbowski, T.; Pawlak, T.G.; Szymczak-Graczyk, A. Efficient Load-Bearing Capacity Assessment of a Degraded Concrete Manhole Using Sectional Homogenization. Materials 2024, 17, 5883. [Google Scholar] [CrossRef] [PubMed]
  44. Li, M.; Xue, B.; Fang, H. Variable angle shear test and finite element simulation of polyurethane—bentonite composite structure. Structures 2023, 48, 1722–1729. [Google Scholar] [CrossRef]
  45. Zhu, X.; Wang, J. Introduction to partly soil models in ABAQUS Software and their application to the geotechnical engineering. Rock Soil Mech. 2004, 2, 144–148. [Google Scholar]
  46. Barbero, E.J. Finite Element Analysis of Composite Materials using Abaqus®; CRC Press: Boca Raton, FL, USA, 2023. [Google Scholar]
  47. Barenblatt, G.; Cherepanov, G. On the equilibrium and propagation of cracks in an ainisotropic medium. J. Appl. Math. Mech. 1961, 25, 61–74. [Google Scholar] [CrossRef]
  48. Dugdale, D. Yielding of steel sheets containing slits. J. Mech. Phys. Solids 1960, 8, 100–104. [Google Scholar] [CrossRef]
  49. Kraśkiewicz, C.; Anysz, H.; Zbiciak, A.; Płudowska-Zagrajek, M.; abouni-Zawadzka, A.A. Artificial neural networks as a tool for selecting the parameters of prototypical under sleeper pads produced from recycled rubber granulate. J. Clean. Prod. 2023, 405, 136975. [Google Scholar] [CrossRef]
Figure 1. Polyurethane-red clay composite sample.
Applsci 15 05501 g001
Figure 2. Schematic diagram of direct shear test.
Applsci 15 05501 g002
Figure 3. Shear Stress Shear Displacement Curve of Composite Interface under Different Polyurethane Density: (a) normal stresses of 300 kPa; (b) normal stresses of 400 kPa.
Applsci 15 05501 g003
Figure 4. Relationship between shear strength and density of polyurethane.
Applsci 15 05501 g004
Figure 5. The shear stress-shear displacement curves of the composite interface under different normal stresses: (a) polymer density of 0.5 g/cm3; (b) polymer density of 0.8 g/cm3.
Applsci 15 05501 g005
Figure 6. The relationship between shear strength and vertical stress.
Applsci 15 05501 g006
Figure 7. Bilinear traction separation response constitutive model.
Applsci 15 05501 g007
Figure 8. Finite element mesh division of specimen.
Applsci 15 05501 g008
Figure 9. Zero-thickness cohesive element meshing.
Applsci 15 05501 g009
Figure 10. Setting of simulated working conditions for direct shear test.
Applsci 15 05501 g010
Figure 11. The stress-displacement curve test results of different density composite specimens are compared with the finite element simulation results: (a) polymer density of 0.2 g/cm3; (b) polymer density of 0.5 g/cm3; (c) polymer density of 0.8 g/cm3.
Applsci 15 05501 g011
Figure 12. Comparison chart of shear strength test values and numerical simulation values of composite specimens with different densities under different normal stresses.
Applsci 15 05501 g012
Table 1. Basic physical parameters of test soil samples.
Proportion
[g/cm3]
Liquid Limit
[%]
Plastic Limit
[%]
Plasticity Index
[%]
Optimum Water Content
[%]
Maximum Dry Density
[%]
2.6350.524.825.7191.75
Table 2. Basic physical parameters of polyurethane.
AppearanceSpecific Gravity [g/cm3]Viscosity [mPa·s]Hydroxyl Value [mgKOH/g]Storage Temperature [°C]
Light yellow to brownish-yellow transparent liquid1.10–1.15300–450300–40010–25
Table 3. Material Parameters of Polyurethane.
Density [g/cm3]Elastic Modulus [MPa]Poisson’s Ratio
0.2128.50.2
0.5292.40.2
0.8487.30.2
Table 4. Material parameters of red clay.
Density [g/cm3]Elastic Modulus
[kPa]
Poisson RatioAngle of Internal Friction
[°]
Angle of Dilatancy
[°]
Plastic Strain
[kPa]
1.751980.3514.350.10.1
Table 5. Cohesive unit parameters of interface between red clay and polyurethane with different densities.
Density
[g/cm3]
Normal Stress
[kPa]
Shearing Rigidity
[N/mm3]
Shearing Strength
[kPa]
Shearing Displacement
[mm]
Shear Damage Energy
[N/mm]
0.210078.0193.22.722.62
20079.4241.53.093.72
30092.9239.83.554.26
40087.9352.14.547.88
0.5100996181.61.941.76
20099.3258.62.843.68
300105.6333.43.595.98
400111.5416.04.328.99
0.810095.0200.82.422.43
200106.9289.82.894.20
300112.3381.73.827.29
400109.9476.74.5610.88
Disclaimer/Publisher’s Note: The statements, opinions and data contained in all publications are solely those of the individual author(s) and contributor(s) and not of MDPI and/or the editor(s). MDPI and/or the editor(s) disclaim responsibility for any injury to people or property resulting from any ideas, methods, instructions or products referred to in the content.

