Article

Impacts of Thermal Maturity on the Carbon Isotopes of Hopane Compounds in Lacustrine Shale During Compaction Pyrolysis Experiments

1
Hubei Key Laboratory of Petroleum Geochemistry and Environment, Yangtze University, Wuhan 430100, China
2
College of Resources and Environment, Yangtze University, Wuhan 430100, China
3
College of Resources, China University of Geosciences, Wuhan 430070, China
*
Author to whom correspondence should be addressed.
Appl. Sci. 2025, 15(10), 5469; https://doi.org/10.3390/app15105469
Submission received: 9 April 2025 / Revised: 11 May 2025 / Accepted: 12 May 2025 / Published: 13 May 2025
(This article belongs to the Special Issue Technologies and Methods for Exploitation of Geological Resources)

Abstract

:
The carbon isotopic behavior of hopane compounds during thermal maturation remains ambiguous due to limitations in current detection techniques. In this study, a low-maturity lacustrine shale sample was pyrolyzed in a hydrous semi-open pyrolysis system. The hopane compounds from the artificially matured samples (Ro = 0.72–1.28%) have been separated and enriched for the test of their carbon isotopes (δ13C). The results show that thermal maturity can somewhat affect the carbon isotopes of monomeric hopane compounds, with a maximum difference value over 21‰. However, thermal maturity has different effects on the δ13C values for different monomeric hopane compounds. For example, the carbon isotopic values of 22S-homohopane at different thermal stages can vary up to 21‰, while only 3‰ for C29βα. In addition, the carbon isotopes of different monomeric hopane compounds show distinct evolution trends. For C29αβ and C29 Ts, their carbon isotopes first become slightly heavier and then become lighter, reaching the lightest value at 350 °C. When the pyrolysis temperature continues to increase, the δ13C values become heavier and finally become lighter. However, the δ13C values of Ts, Tm, 22S-homohopane, and 22R-homohopane show a completely reversed trend. They initially become slightly lighter and then become heavier, reaching the maximum value at 350 °C. When the pyrolysis temperature continues to increase, the δ13C values become lighter and finally become heavier. Meanwhile, the carbon isotopes of C29βα, C30αβ, C30βα, and non-hopane gammacerane almost remain constant at different thermal stages. When the carbon isotopes of hopane compounds are used in the studies of oil–source correlation, it is prudent to consider the effects of thermal maturity on these values.

1. Introduction

Biomarkers play an irreplaceable role in elucidating the composition of petroleum sources, depositional environments, and thermal evolution [1,2,3,4]. However, since sedimentary organic matter comprises a mixture of various biological precursors, relying solely on the chemical structure and composition of biomarkers can introduce ambiguity in source identification and depositional environment research. The stable carbon isotopes of biomarker compounds contain rich biological, geological, and geochemical information. By examining the carbon isotopic composition of organic compounds and the mechanisms of carbon isotope fractionation, complex geochemical processes can be elucidated. Hopane compounds are mainly from bacterial sources. They are commonly found pentacyclic triterpenoids in geological formations and are the most widely used biomarkers. Typically, hopane compounds are utilized for oil–oil correlation [5], oil–source correlation [6], source–source correlation [7], and assessments of organic matter maturity [8,9]. Moreover, hopane compounds have been extensively studied in environmental geochemistry (especially in lacustrine environment) [10,11,12,13,14,15,16,17,18,19], biogeochemistry [20], and marine geochemistry [21,22], demonstrating their substantial potential for application. Although carbon isotope studies of hopane monomeric hydrocarbons remain limited due to complex sample pretreatment requirements, advancements in chromatography–isotope ratio mass spectrometry (GC-IRMS) have enabled exploration of the carbon isotope characteristics of monomeric hopane hydrocarbons, revealing valuable insights into source composition and depositional environments. For instance, the carbon isotopes of C29 hopane and C30 hopane from lacustrine source rocks in the Permian Lucaogou Formation in Junggar Basin reflect the variations in their biogenic source and sedimentary environments [23,24]. Additionally, the hopane compositions and their monomer carbon isotopes in peat samples from Guangdong suggest that there may be diverse microorganisms with varying carbon isotope compositions of patchouli-like precursors [6].
Previous studies have indicated that thermal maturity significantly affects the carbon isotope values of hopanes, which can be utilized for oil–source correlation [5,9]. Compared to other biomarkers, the variation of carbon isotope values during petroleum generation can be significantly larger, reaching up to 40‰ or more. For example, the carbon isotope values of hopane monomers in lacustrine source rocks range from −68.7‰ to −32‰ in the Songliao Basin [25]. It remains unclear whether this substantial variation results from thermal evolution or from the distinct composition of their biogenic precursors. The evolution of carbon isotopes in hopane compounds during thermal maturity is an area that has seen limited investigation. In order to overcome the constraints of other influencing factors such as biogenetic derivation and sedimentary environment, thermal simulation experiments are usually used to exclude the influence of other factors and are closer to geological conditions. However, due to the limitations of detection for chromatography–isotope ratio mass spectrometry (GC-IRMS), most studies conducted direct measurements without adequate sample enrichment [25,26,27]. Consequently, these studies primarily focused on the carbon isotope variations in a limited number of hopane compounds that are highly abundant, such as C30 hopane [28,29]. However, the carbon isotopes of these compounds can be affected by the presence of numerous n-alkanes. So far, Lu et al. [30] presented a small-scale column chromatography method for separating hopanes in crude oil or rock extracts using neutral alumina as a solid phase adsorbent and a Pasteur pipette as a separation device. Mixed reagents of hexane and petroleum ether (V:V = 8:2) were used to elute the oil samples. The experimental result has shown that the Total Ion Chromatography (TIC) of hopanes was consistent with the distribution characteristics of the m/z 191 mass chromatogram, and the isolated hopanes could meet the detection requirements of isotope ratio mass spectrometry. This method effectively facilitates the separation, enrichment, and purification of the complete series of hydrocarbon compounds from crude oil or rock extracts.
As the development of testing technologies for the carbon isotopes of monomeric hopane hydrocarbons and thermal simulation experiments, the evolution of the chemical and isotopic compositions of hopane compounds during thermal maturity can be more effectively studied. In this study, a low maturity lacustrine shale sample from Paleogene Kongdian Formation in Bohai Bay Basin was pyrolyzed in semi-open systems that are more similar to geological conditions [31]. The vitrinite reflectance (Ro) of the artificially matured samples range from 0.72% to 1.28%. The hopane compounds were separated from saturated hydrocarbons, and their carbon isotopes were determined. The study aims to explore the change of carbon isotope of monomer hopane in lacustrine shale during thermal maturation. This will provide reliable evidence for comparing the carbon isotopes of hopane compounds in samples of differing thermal maturity levels and promote the application of carbon isotopes of hopanes.

2. Samples and Experiments

2.1. Samples

The lacustrine shale samples used for the compaction pyrolysis experiment were collected from Ek2 Kongdian Formation in Cangdong Sag, Bohai Bay Basin. The total organic carbon (TOC) content of the sample is 4.38%. The Tmax value of this sample is 444 °C, and the hydrogen index (HI) value is 819 mg/g TOC. A low value of Ro (0.31%) indicates a low mature stage for this sample. The basic geochemical information of the shale sample is shown in Table 1.

2.2. Experiments

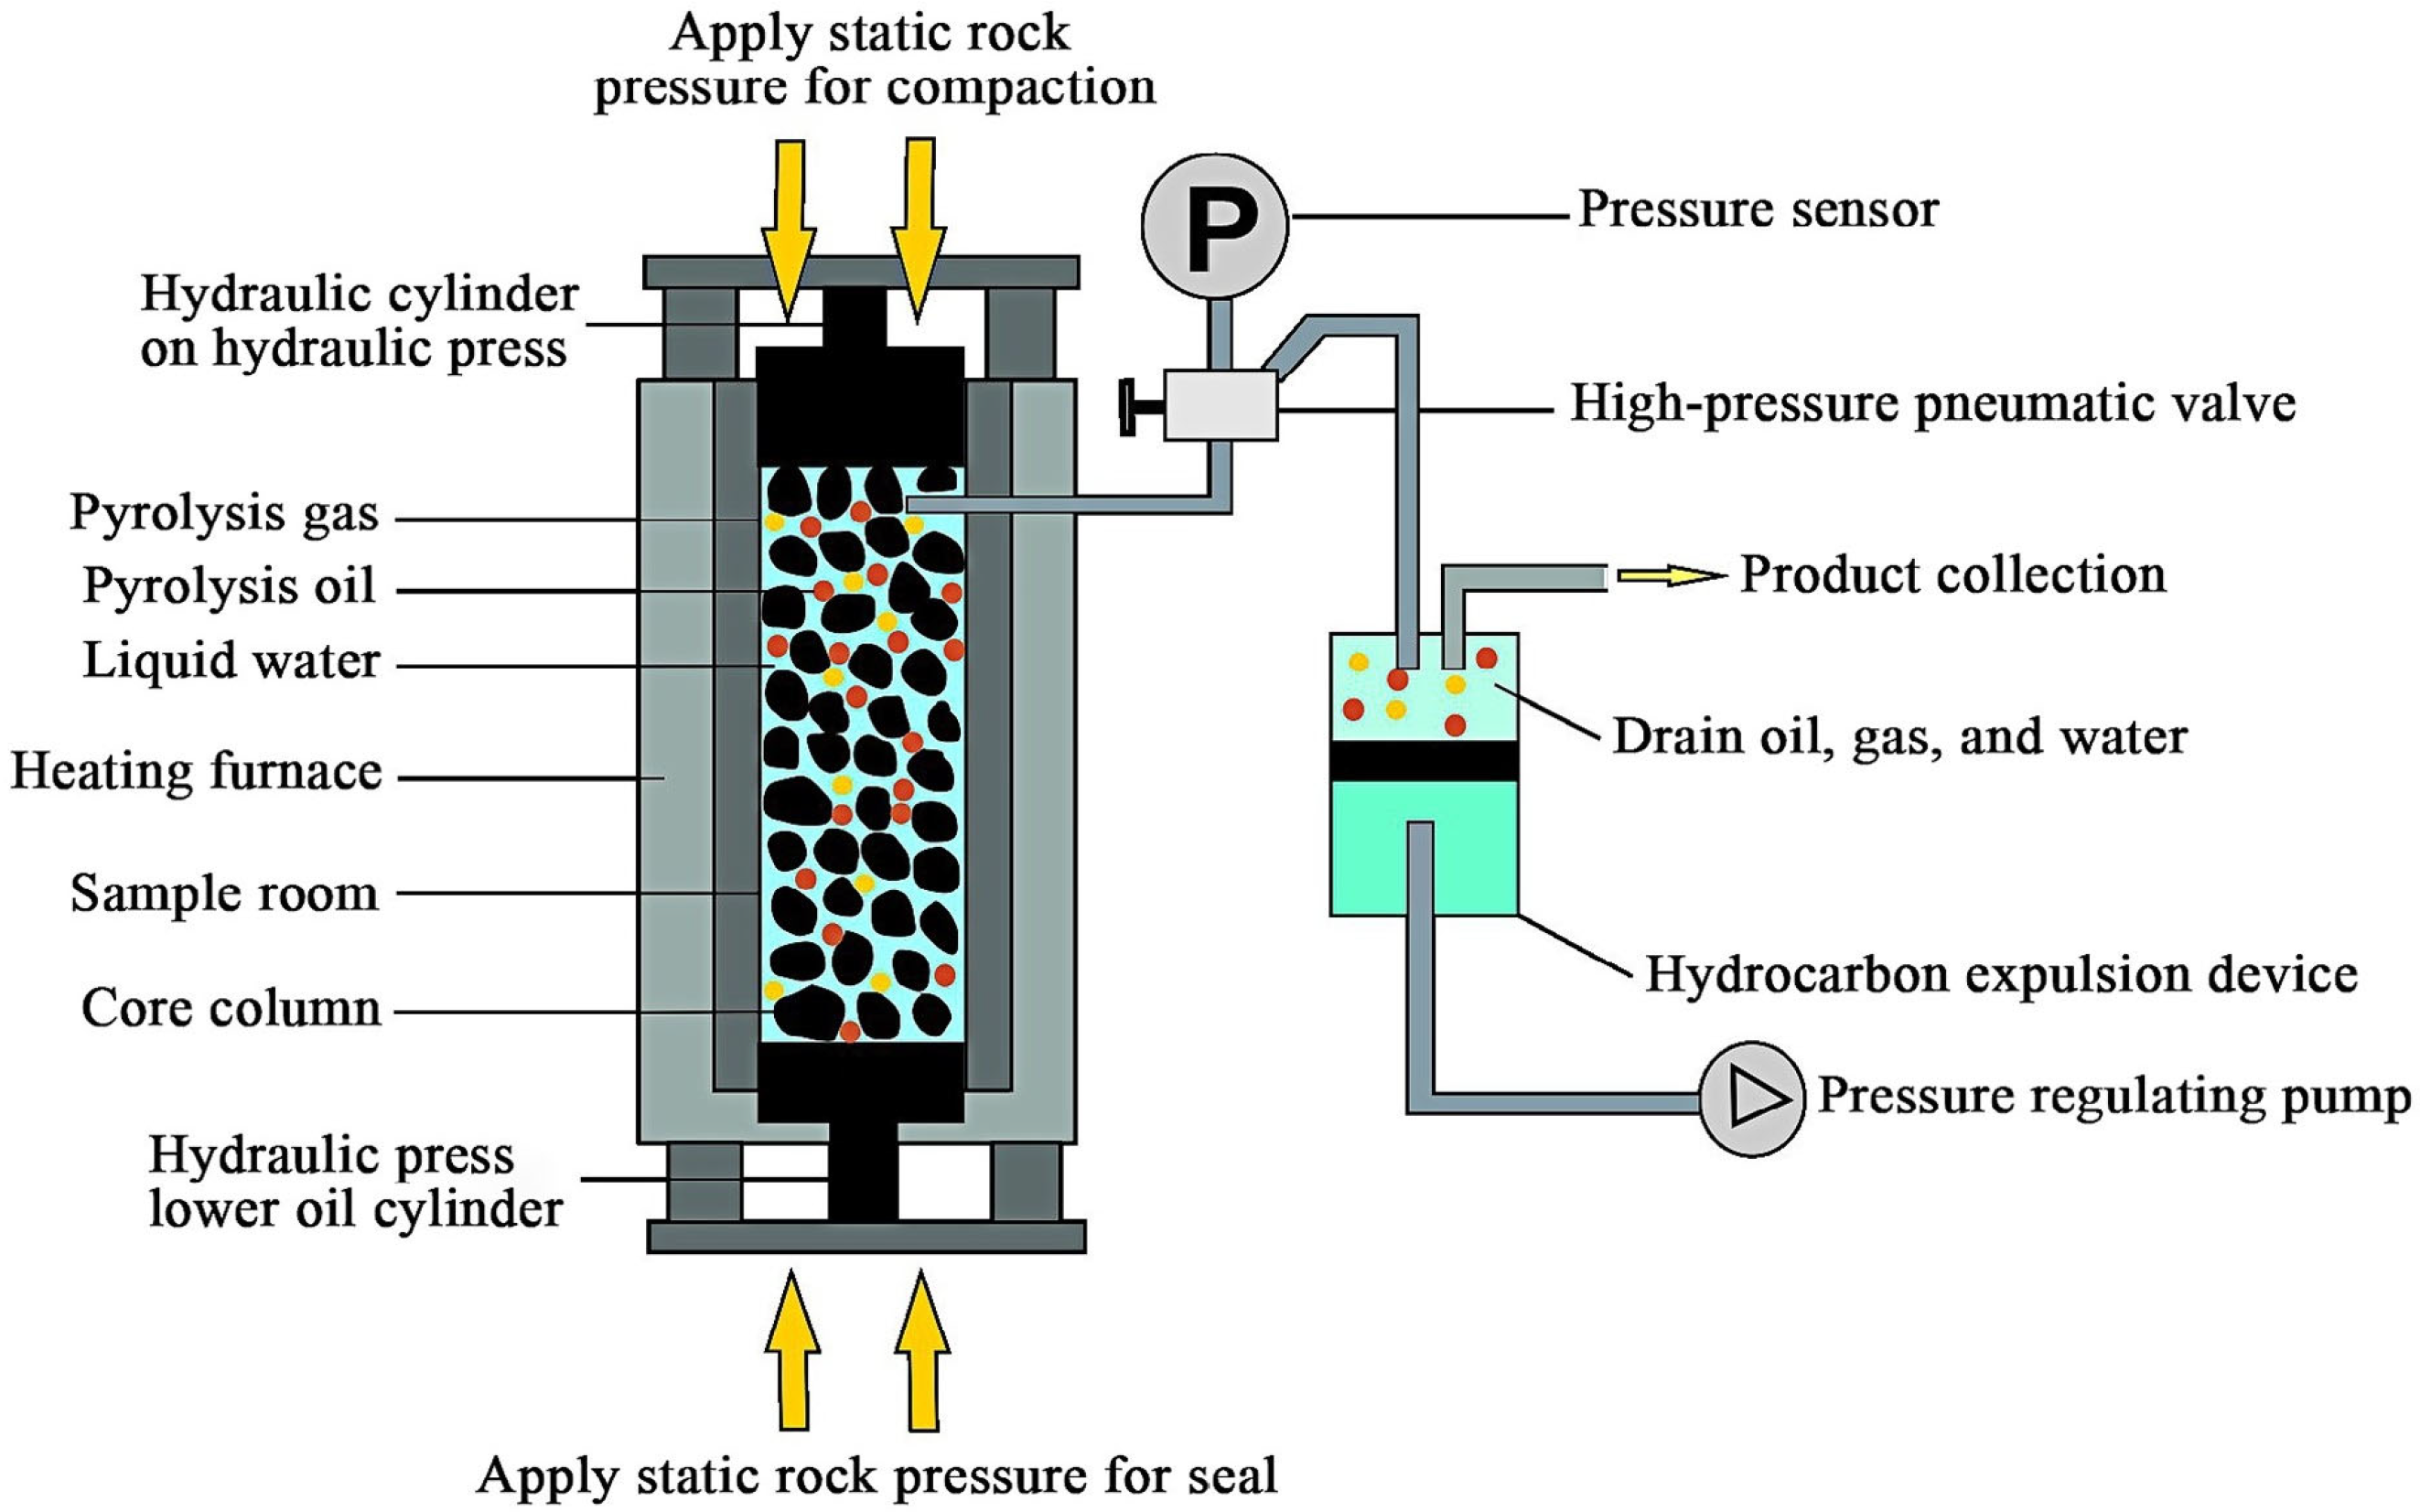
2.2.1. Compaction Pyrolysis Experiment

The pyrolysis experiments were conducted on a high-temperature and high-pressure semi-closed hydrous pyrolysis system and can simulate various factors that influence the petroleum generation process, including temperature, overlying lithostatic pressure, fluid pressure, mineral composition, and formation of water. The schematic diagram of the device structure is shown in Figure 1. It can control the episodic hydrocarbon expulsion and the generation, discharge, and retention processes of oil and gas [32,33,34]. Therefore, this device can simulate the actual underground hydrocarbon generation and expulsion process. The experimental procedures for pyrolysis experiments in the high-temperature and high-pressure semi-closed hydrous pyrolysis system have been well described in previous studies [35,36]. Here, we give a brief description as follows: Firstly, the shale sample was subdivided into seven equal portions, each weighing approximately 20 g. The samples were then compressed into a dedicated sample compartment under a pressure of at least 5 MPa. The entire sample compartment was subsequently loaded into the reaction vessel. The pyrolysis experiment was conducted at temperatures of 300 °C, 325 °C, 345 °C, 350 °C, 365 °C, 375 °C, and 385 °C, respectively. The heating procedure involved first increasing the temperature from room temperature to 150 °C in 30 min, then elevating it to the preset temperature at a heating rate of 60 °C/h and maintaining this temperature for 24 h. During the experiment, the fluid pressure was controlled by a back-pressure valve and maintained lower than 30 MPa. Once the pressure exceeds the preset value, the petroleum and water will automatically be expelled into the product collector. When the temperature of the oven drops to 120 °C after pyrolysis, the hydrocarbon expulsion valve will opened. Then, high-pressure fluid will be discharged into the product collector, which was first vacuumized before the pyrolysis experiments. After that, the oven is opened, and the residual samples are removed. Finally, the samples are crushed into 80–100 mesh size and divided into three parts: one for Soxhlet extraction, one for vitrinite reflectance measurement, and the third for geochemical tests.
Figure 1. Schematic diagram of simulation experimental devices for semi open systems (modified after He et al. [37]).
Applsci 15 05469 g001

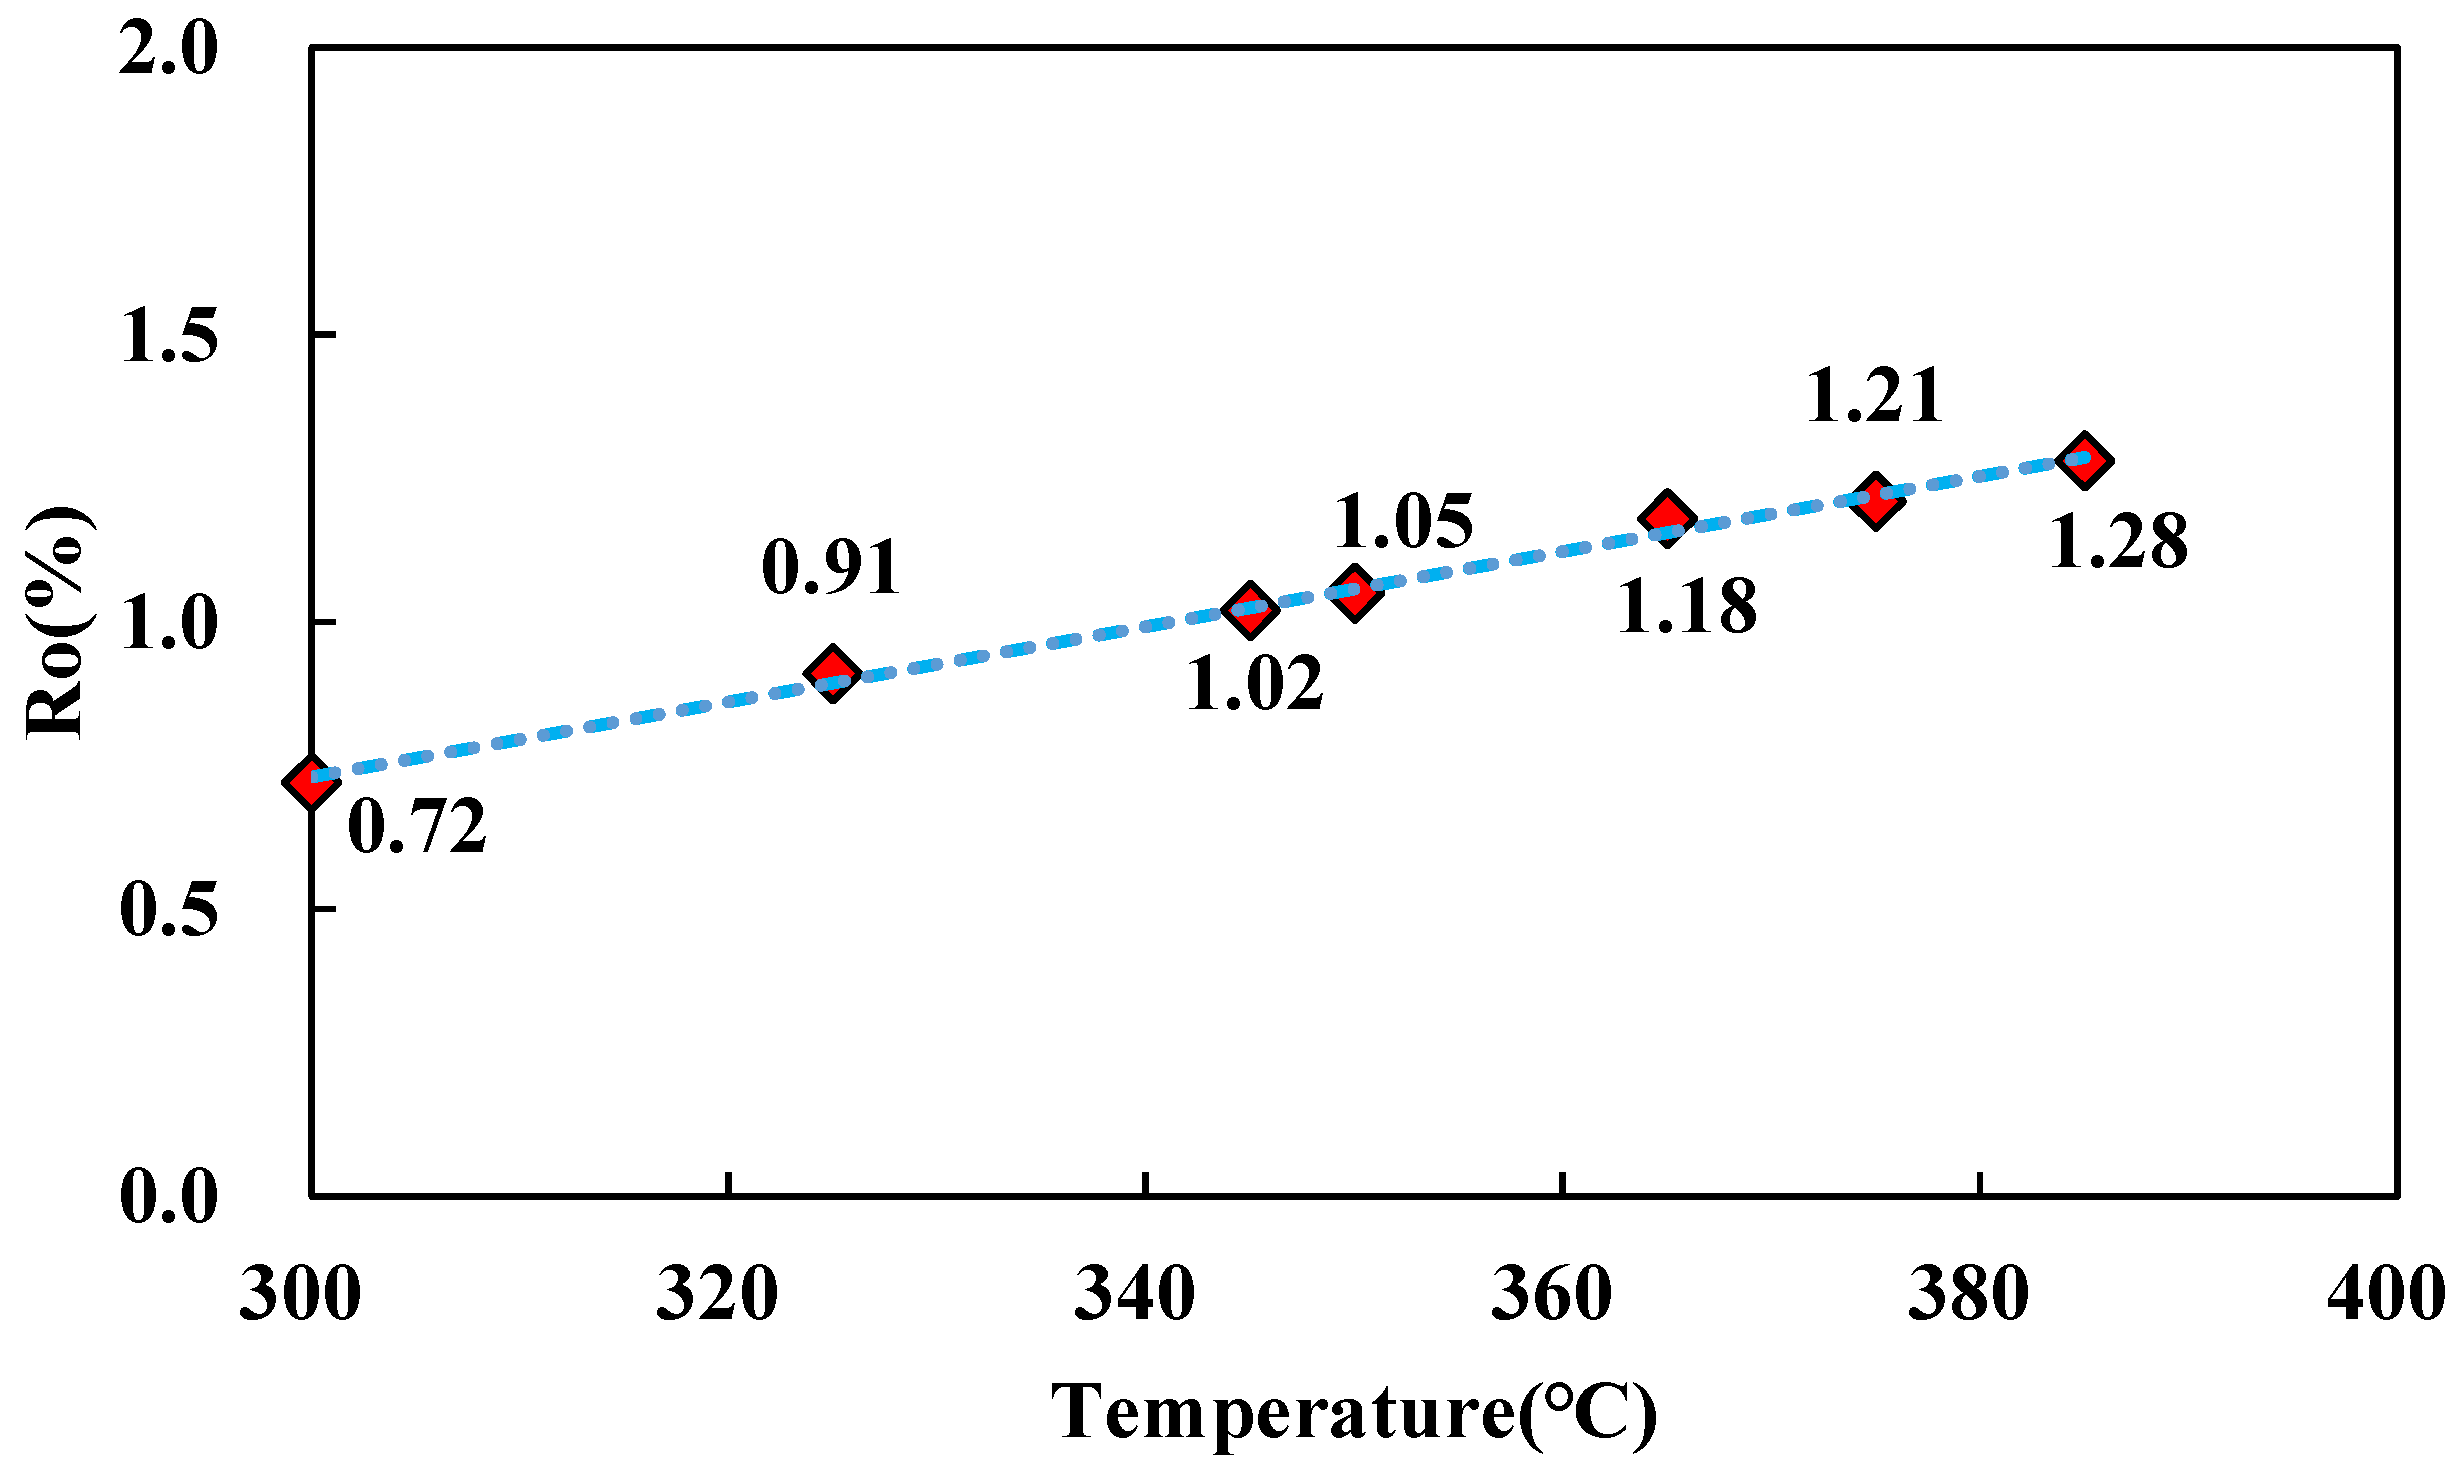
2.2.2. Vitrinite Reflectance

Vitrinite reflectance (Ro) experiments were conducted using a German Zeiss Axio Scope A1/J&M Msp 200 digital maceral analysis system (Carl Zeiss AG, Oberkochen, Germany). The shale samples, approximately 2 cm in length and width, were consolidated with epoxy resin to form light sheet, which was polished on a Buehler automatic grinding and polishing machine (Buehler, Lake Bluff, IL, USA) to achieve a smooth surface for microscopic examination. Measurements were performed under random oil immersion conditions with a 25× objective at 546 nm monochromatic light. Gadolinium gallium garnet, with an oil immersion reflectance of 1.72%, served as the standard material. No fewer than 30 points were measured for each sample. The mathematical average of these discrete results, assuming a normal distribution, represented the value of Ro, which was used to calibrate the thermal maturity stage of each experimental temperature point.

2.2.3. Soxhlet Extraction and Hopane Separation

Approximately 10 g of residual sample was pulverized into powder smaller than 120 mesh and extracted in a Soxhlet extractor using a mixture of dichloromethane and methanol (V:V = 93:7) for 72 h. The extracts were then used to isolate hopane compounds. The specific experimental methods for hopane separation are described in the study [30]. The separation procedure is as follows: (1) 50 mg soluble extracts were combined with 1 mL dichloromethane and 20 mL petroleum ether in the container. The mixture was left undisturbed for 12 h to precipitate out the bitumen. (2) After filtering out the asphaltene, 20 mL filtrate was obtained and concentrated to 1 mL via nitrogen purging. (3) The chromatographic column (the column length is 180 mm) was prepared. The 1 mL filtrate was transferred into the dry chromatographic column filled with 5 g of 100–200 um neutral alumina to allow for full adsorption. (4) The straight chain alkanes were eluted with a 1.5 mL mixed reagent (V hexane:V petroleum ether = 8:2), followed by hopane collection using 2 mL of the same solvent (1 mL/min flow rate). (5) The chromatography steps (3) and (4) were repeated to enhance hopanes’ purity. (6) Enriched hopanes were concentrated to 100 µL under a mild N2 flow for subsequent analysis using GC-MS and GC-IRMS.

2.2.4. GC-MS and GC-IRMS Analysis

GC-MS analyses were conducted using an American Agilent 7890A gas chromatograph (Agilent Technologies, Inc., Santa Clara, CA, USA) interfaced with an HP 5975 mass selective detector. A 30 m × 0.25 mm fused silica capillary column coated with HP-5MS (film thickness 0.25 μm) served as the separation medium, with helium as carrier gas flowing at a rate of 1.0 mL/min. The heating procedure was as follows: an initial isothermal hold at 50 °C for 1 min was followed by a rapid ramp-up to 100 °C at a rate of 20 °C/min. This was then followed by a slower increase to 315 °C at 3 °C/min, with a final hold of 31.83 min. The American Agilent 5975C mass spectrometer (Agilent Technologies, Inc., Santa Clara, CA, USA) operated in both full scan and selective ion monitoring (SIM) modes at a voltage of 70 eV.
GC-IRMS analyses were determined by German Isoprime GV chromatography–isotope ratio mass spectrometry (Isoprime Ltd., Cheadle Hulme, UK), and the separation column was HP-5MS (60 m × 0.32 mm, film thickness 0.25 μm). The chromatographic heating procedure was the initial temperature of 50 °C, held for 1 min, then increased to 310 °C at a heating rate of 3 °C/min and held for 20 min. The carrier gas was 99.999% helium. The carbon isotopic compositions are reported in normal δ13C notation (per mil) relative to the PDB standard [38]. Each sample was analyzed at least twice; the standard deviation for each compound was less than 0.3‰, and the average of three runs was accepted as the final result of the sample.

3. Results and Discussion

3.1. Pyrolysis Experiment Hydrocarbon Yield

The hydrocarbon yields in the pyrolysis experiment are shown in Figure 2. As the pyrolysis temperature increases, the total oil yield and total hydrocarbon yield first increase and then decrease, whereas the hydrocarbon gas yield shows a continuous rise. At the lowest pyrolysis temperature (T = 300 °C). The value of Ro is 0.72% (Figure 3). The total oil yield is 332.88 mg/g TOC, whereas the hydrocarbon gas yield remains minimal. When the experimental temperature increased to 350 °C (Ro = 1.05%), the total oil yield peaked at 561.73 mg/g TOC, after which the oil yield declined; the total hydrocarbon yield also peaked at 564.43 mg/g TOC. Prior to reaching the peak oil generation, the yields of total hydrocarbons, hydrocarbon gas, and total oil continuously increase with rising Ro. Following the peak, the total oil yield gradually decreases, while the hydrocarbon gas yield continuously increases. This indicates that the shale is primarily in the stage of thermal catalytic hydrocarbon generation when the temperature is below 350 °C (Ro = 1.05%).

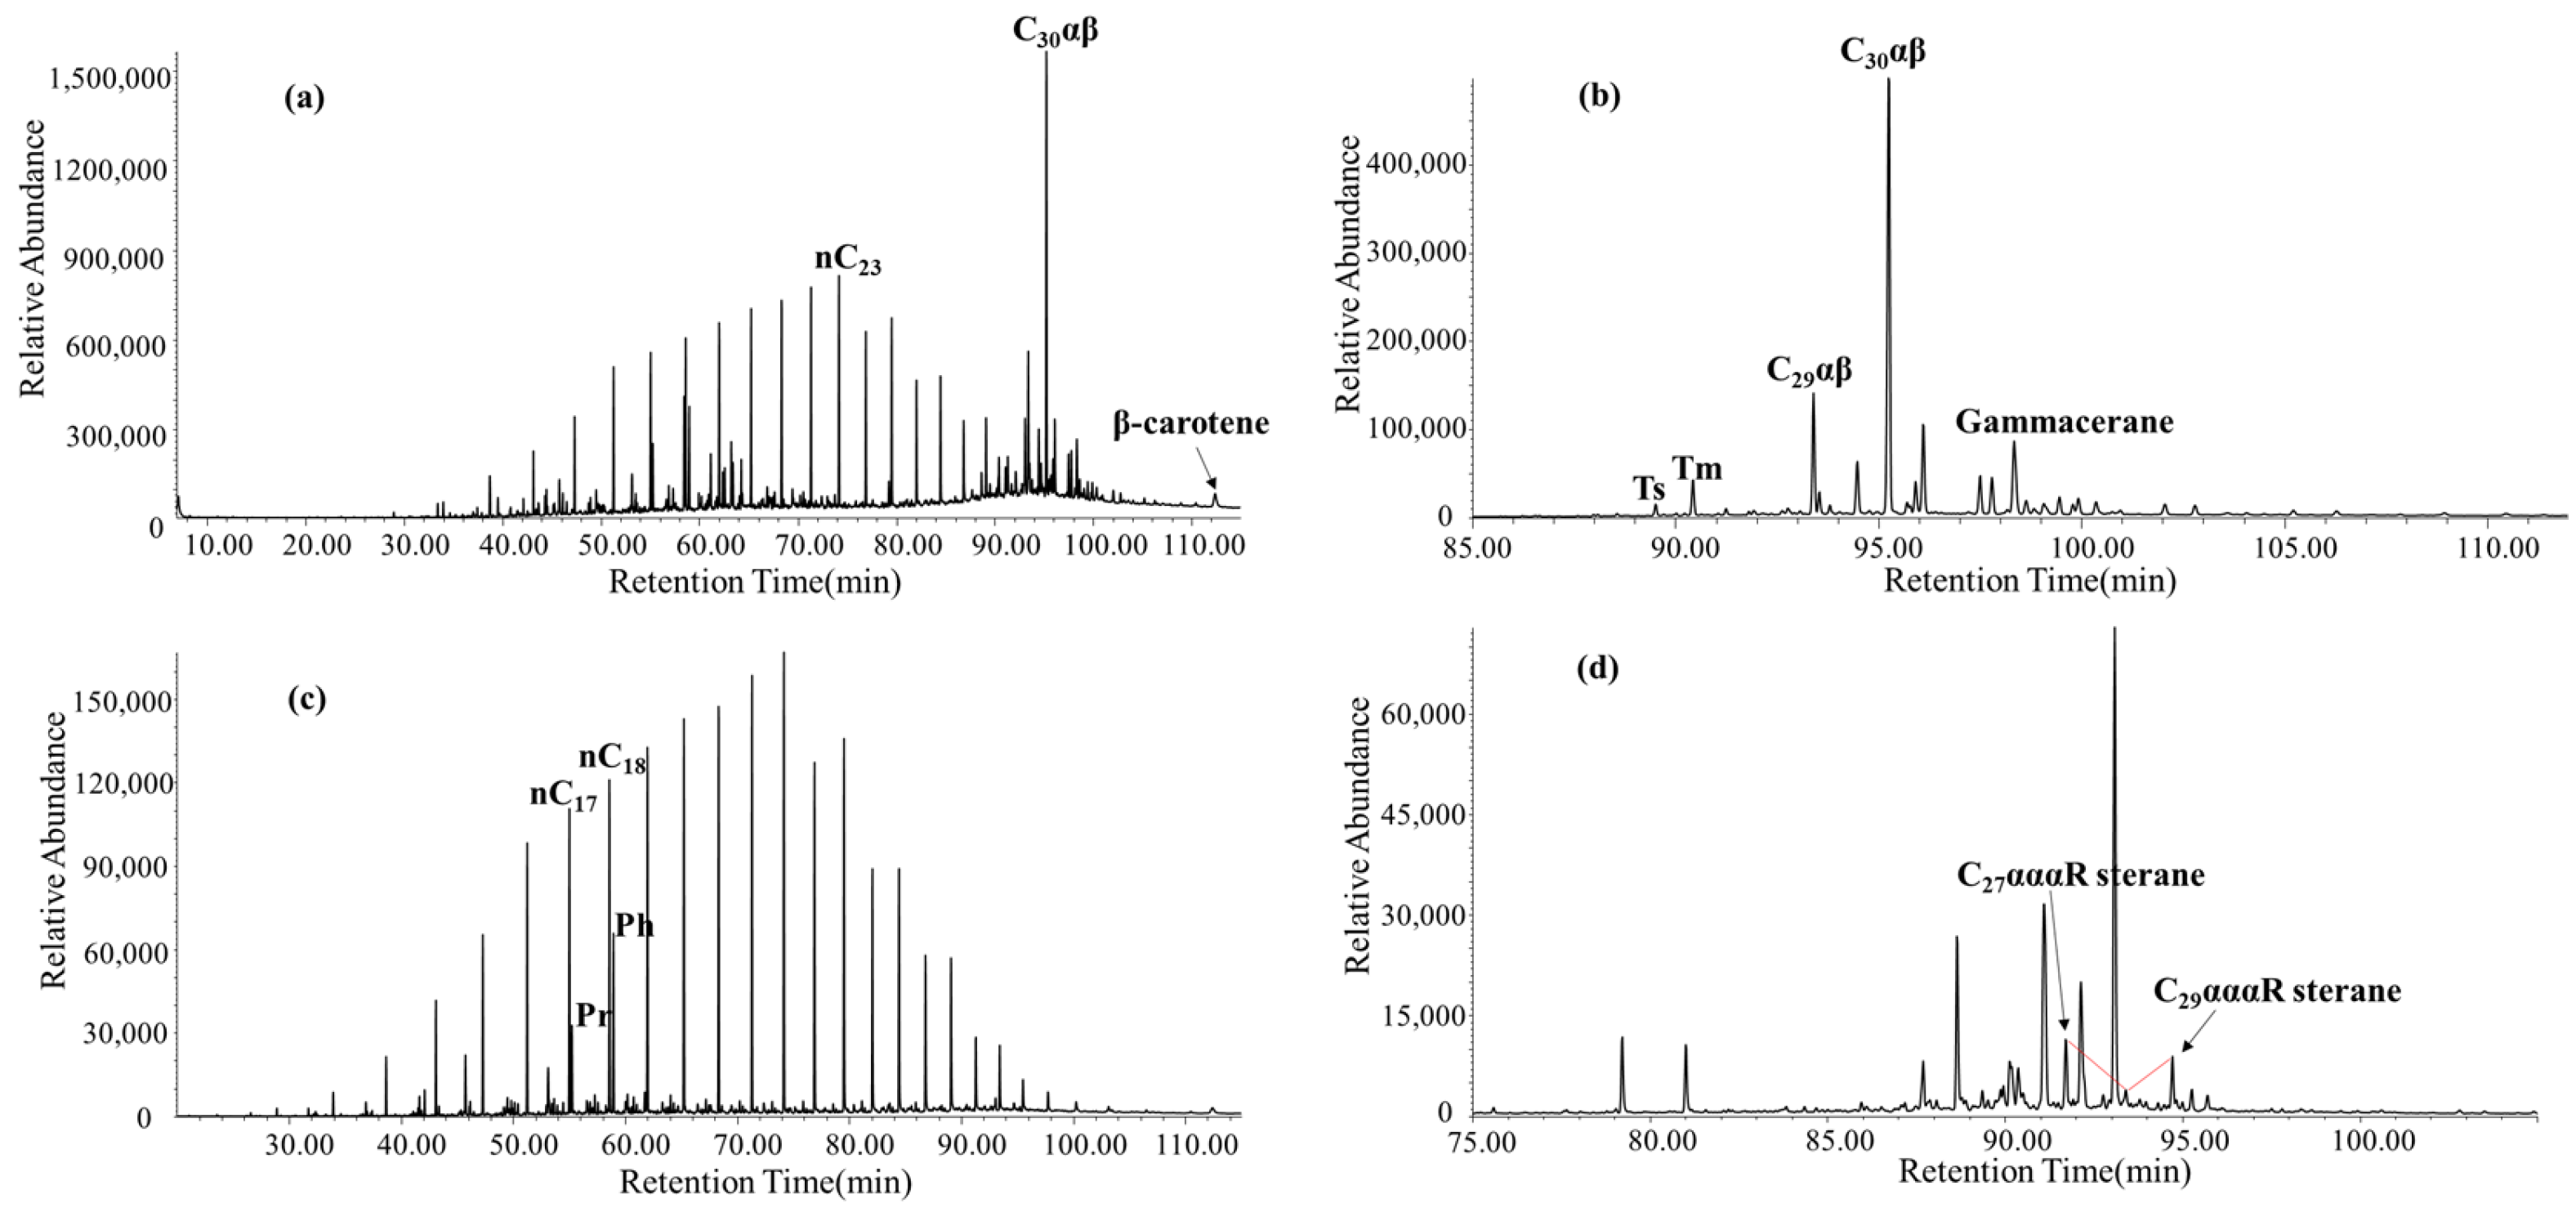
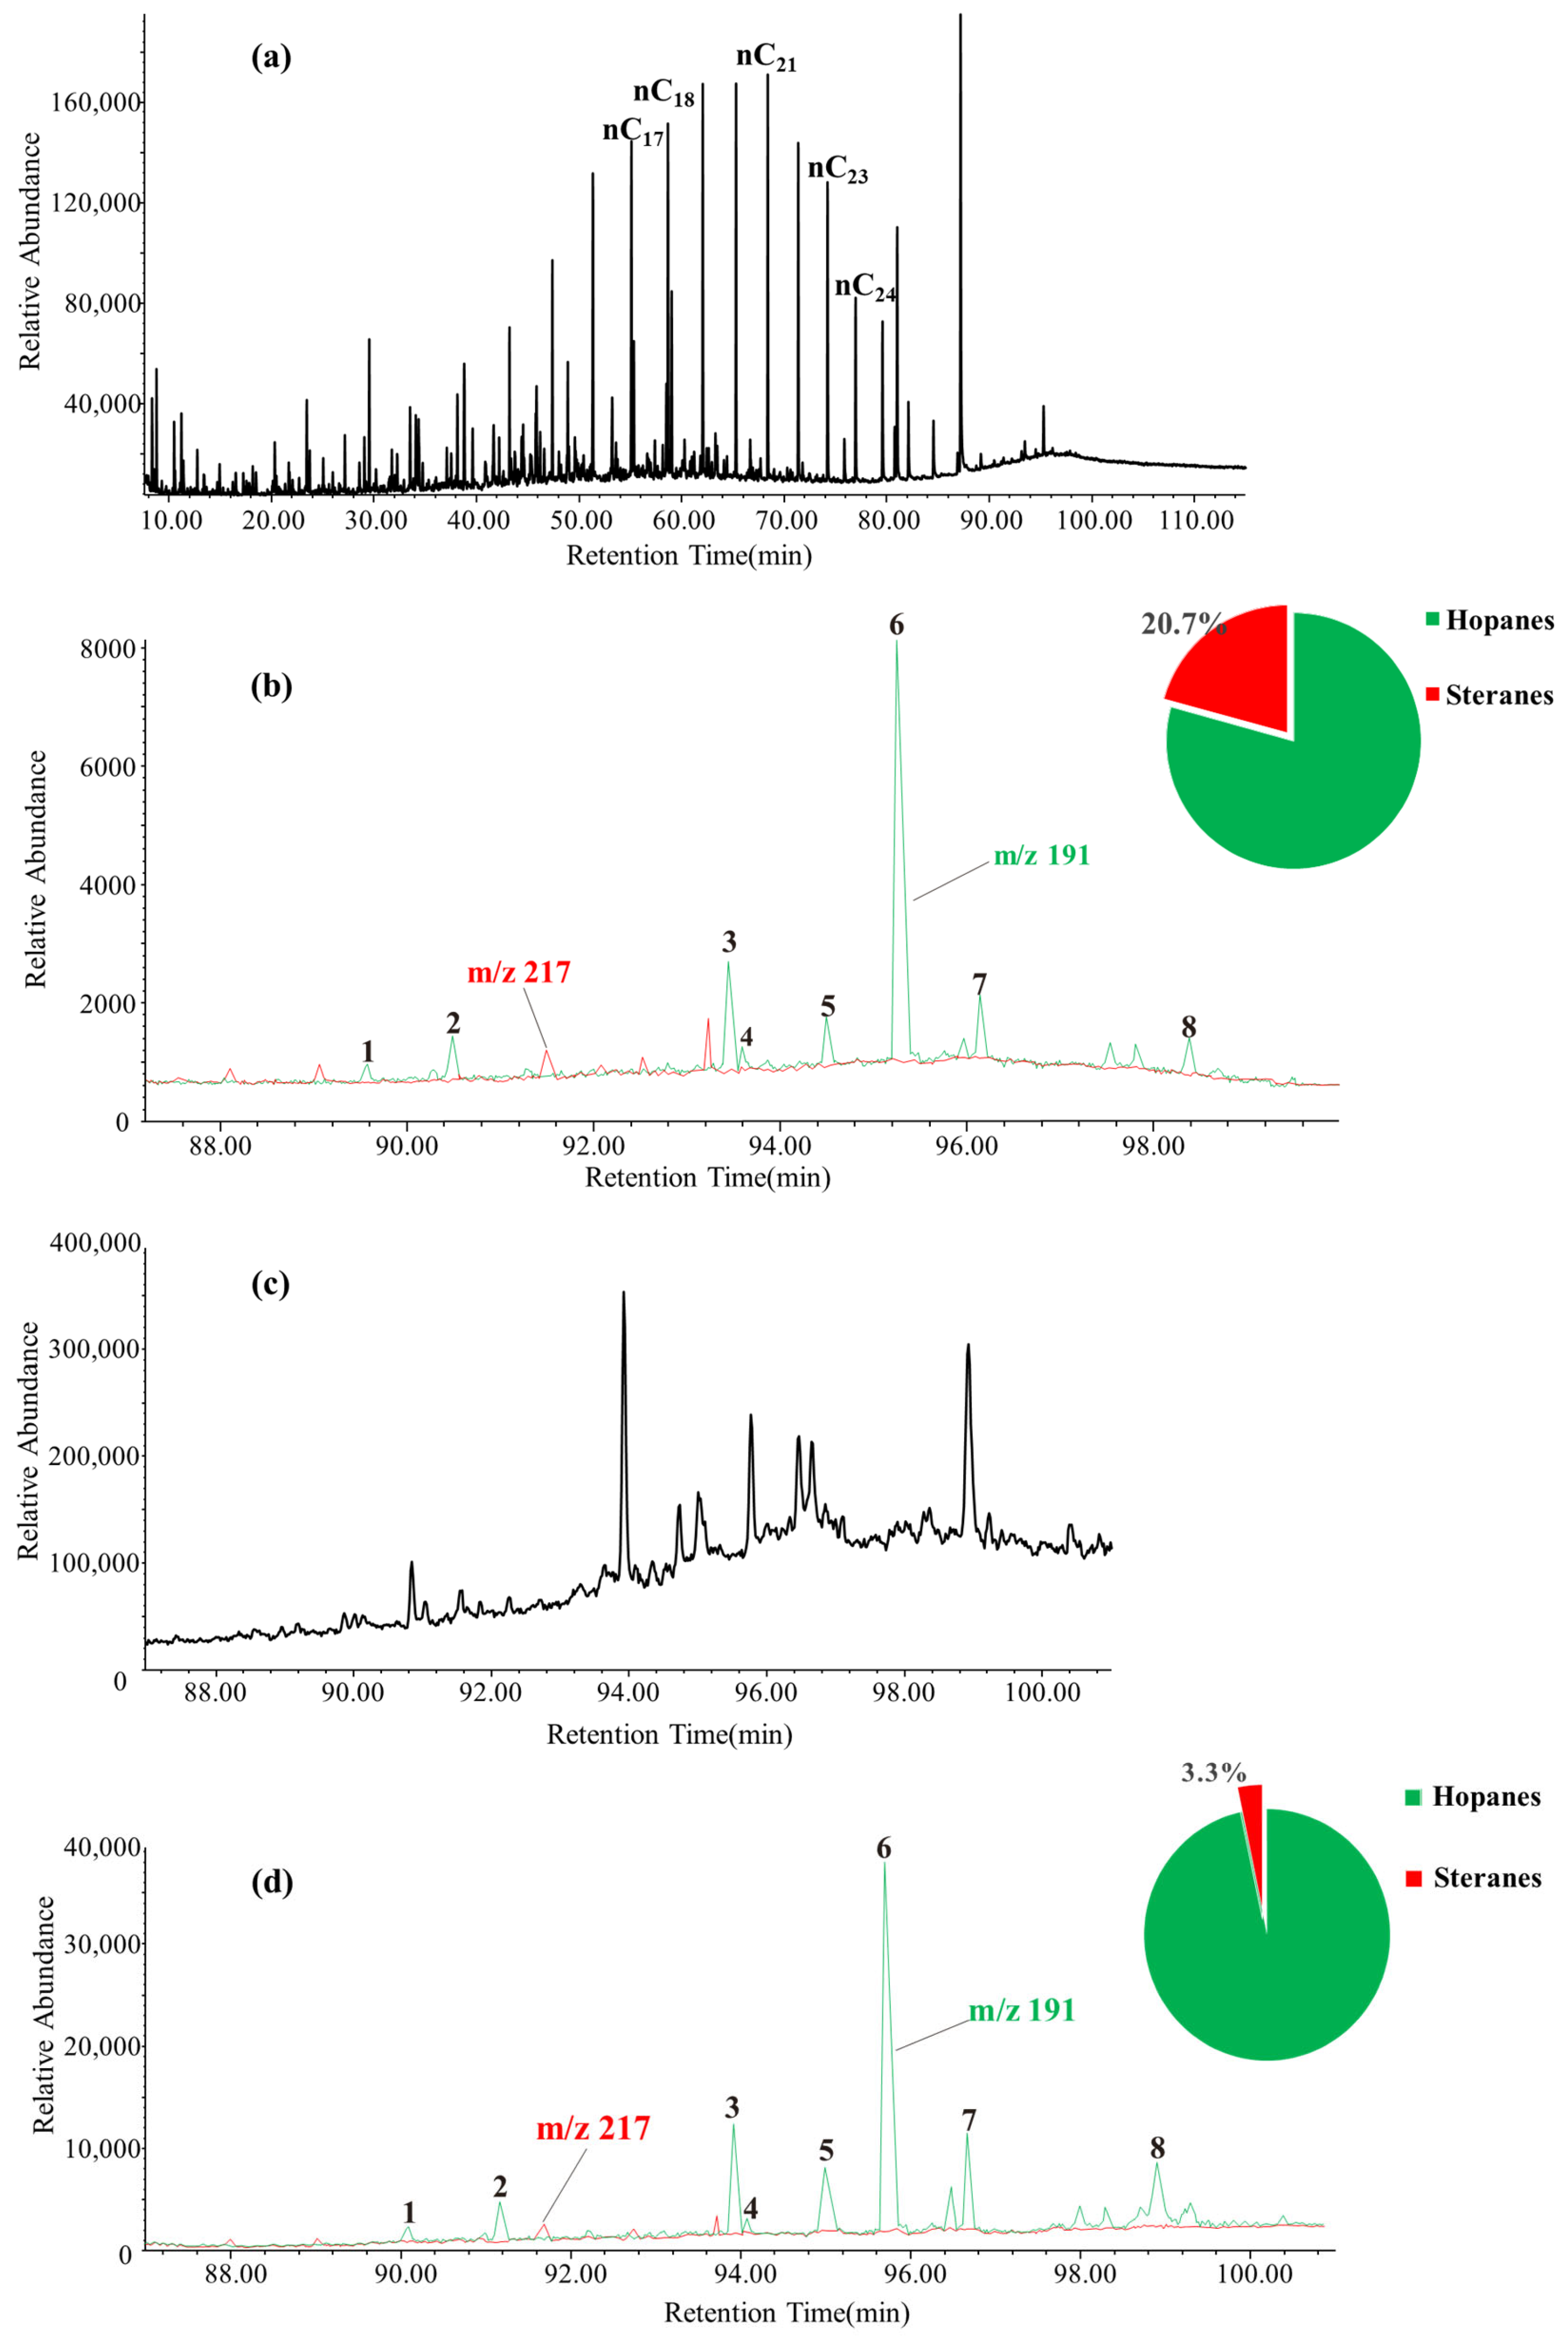
3.2. Composition Characteristics of Biomarkers

The Pr/Ph ratio of lacustrine shale in the Ek2 Kongdian Formation is 0.53. The content of β-carotene is rich, and the distribution of the hopane series is relatively complete. The content of C30 hopane is the highest, while the contents of C32–C35 hopanes are extremely low. The Ts/Tm value is 0.30, C29 Ts/C29αβ is 0.17, C29αβ/C30αβ is 0.24, and 22R-C31/C30 hopane is 0.08, indicating a typical strongly reduced lacustrine sedimentary environment. The gammacerane/C30 hopane ratio is 0.22, while the gammacerane/C31 hopane ratio is 1.27. C27αααR, C28αααR, and C29αααR steranes exhibit a nearly V-shaped distribution, with a C27/C29 sterane ratio of 1.20. The steranes/hopanes ratio is 0.25, indicating a significant contribution from bacteria (Figure 4).

3.3. Hopane Isotope

3.3.1. Reliability of Experimental Results

In order to explore the impact of thermal maturity on the carbon isotopes of monomeric hopane hydrocarbons, this study utilized a small-scale neutral alumina column chromatography method to separate and enrich hopane compounds in the lacustrine shale of the Ek2 Kongdian Formation, with the aim of studying the carbon isotope characteristics of hopanes in these samples. GC-MS analysis of the hopane fractions, both before and after enrichment, was employed to assess the reliability of the enrichment process. The results indicate that the separation and enrichment process effectively preserved the m/z 191 spectral characteristics of hopanes in the original oil sample. The relative content of steranes can be reduced significantly from the original 20.7% to 3.3%. Although steranes cannot be entirely eliminated from the isolated hopanes in this study, their content is sufficiently reduced to minimize interference from sterane co-elution peaks (Figure 5). The isolated hopanes could meet the detection requirements of isotope ratio mass spectrometry.

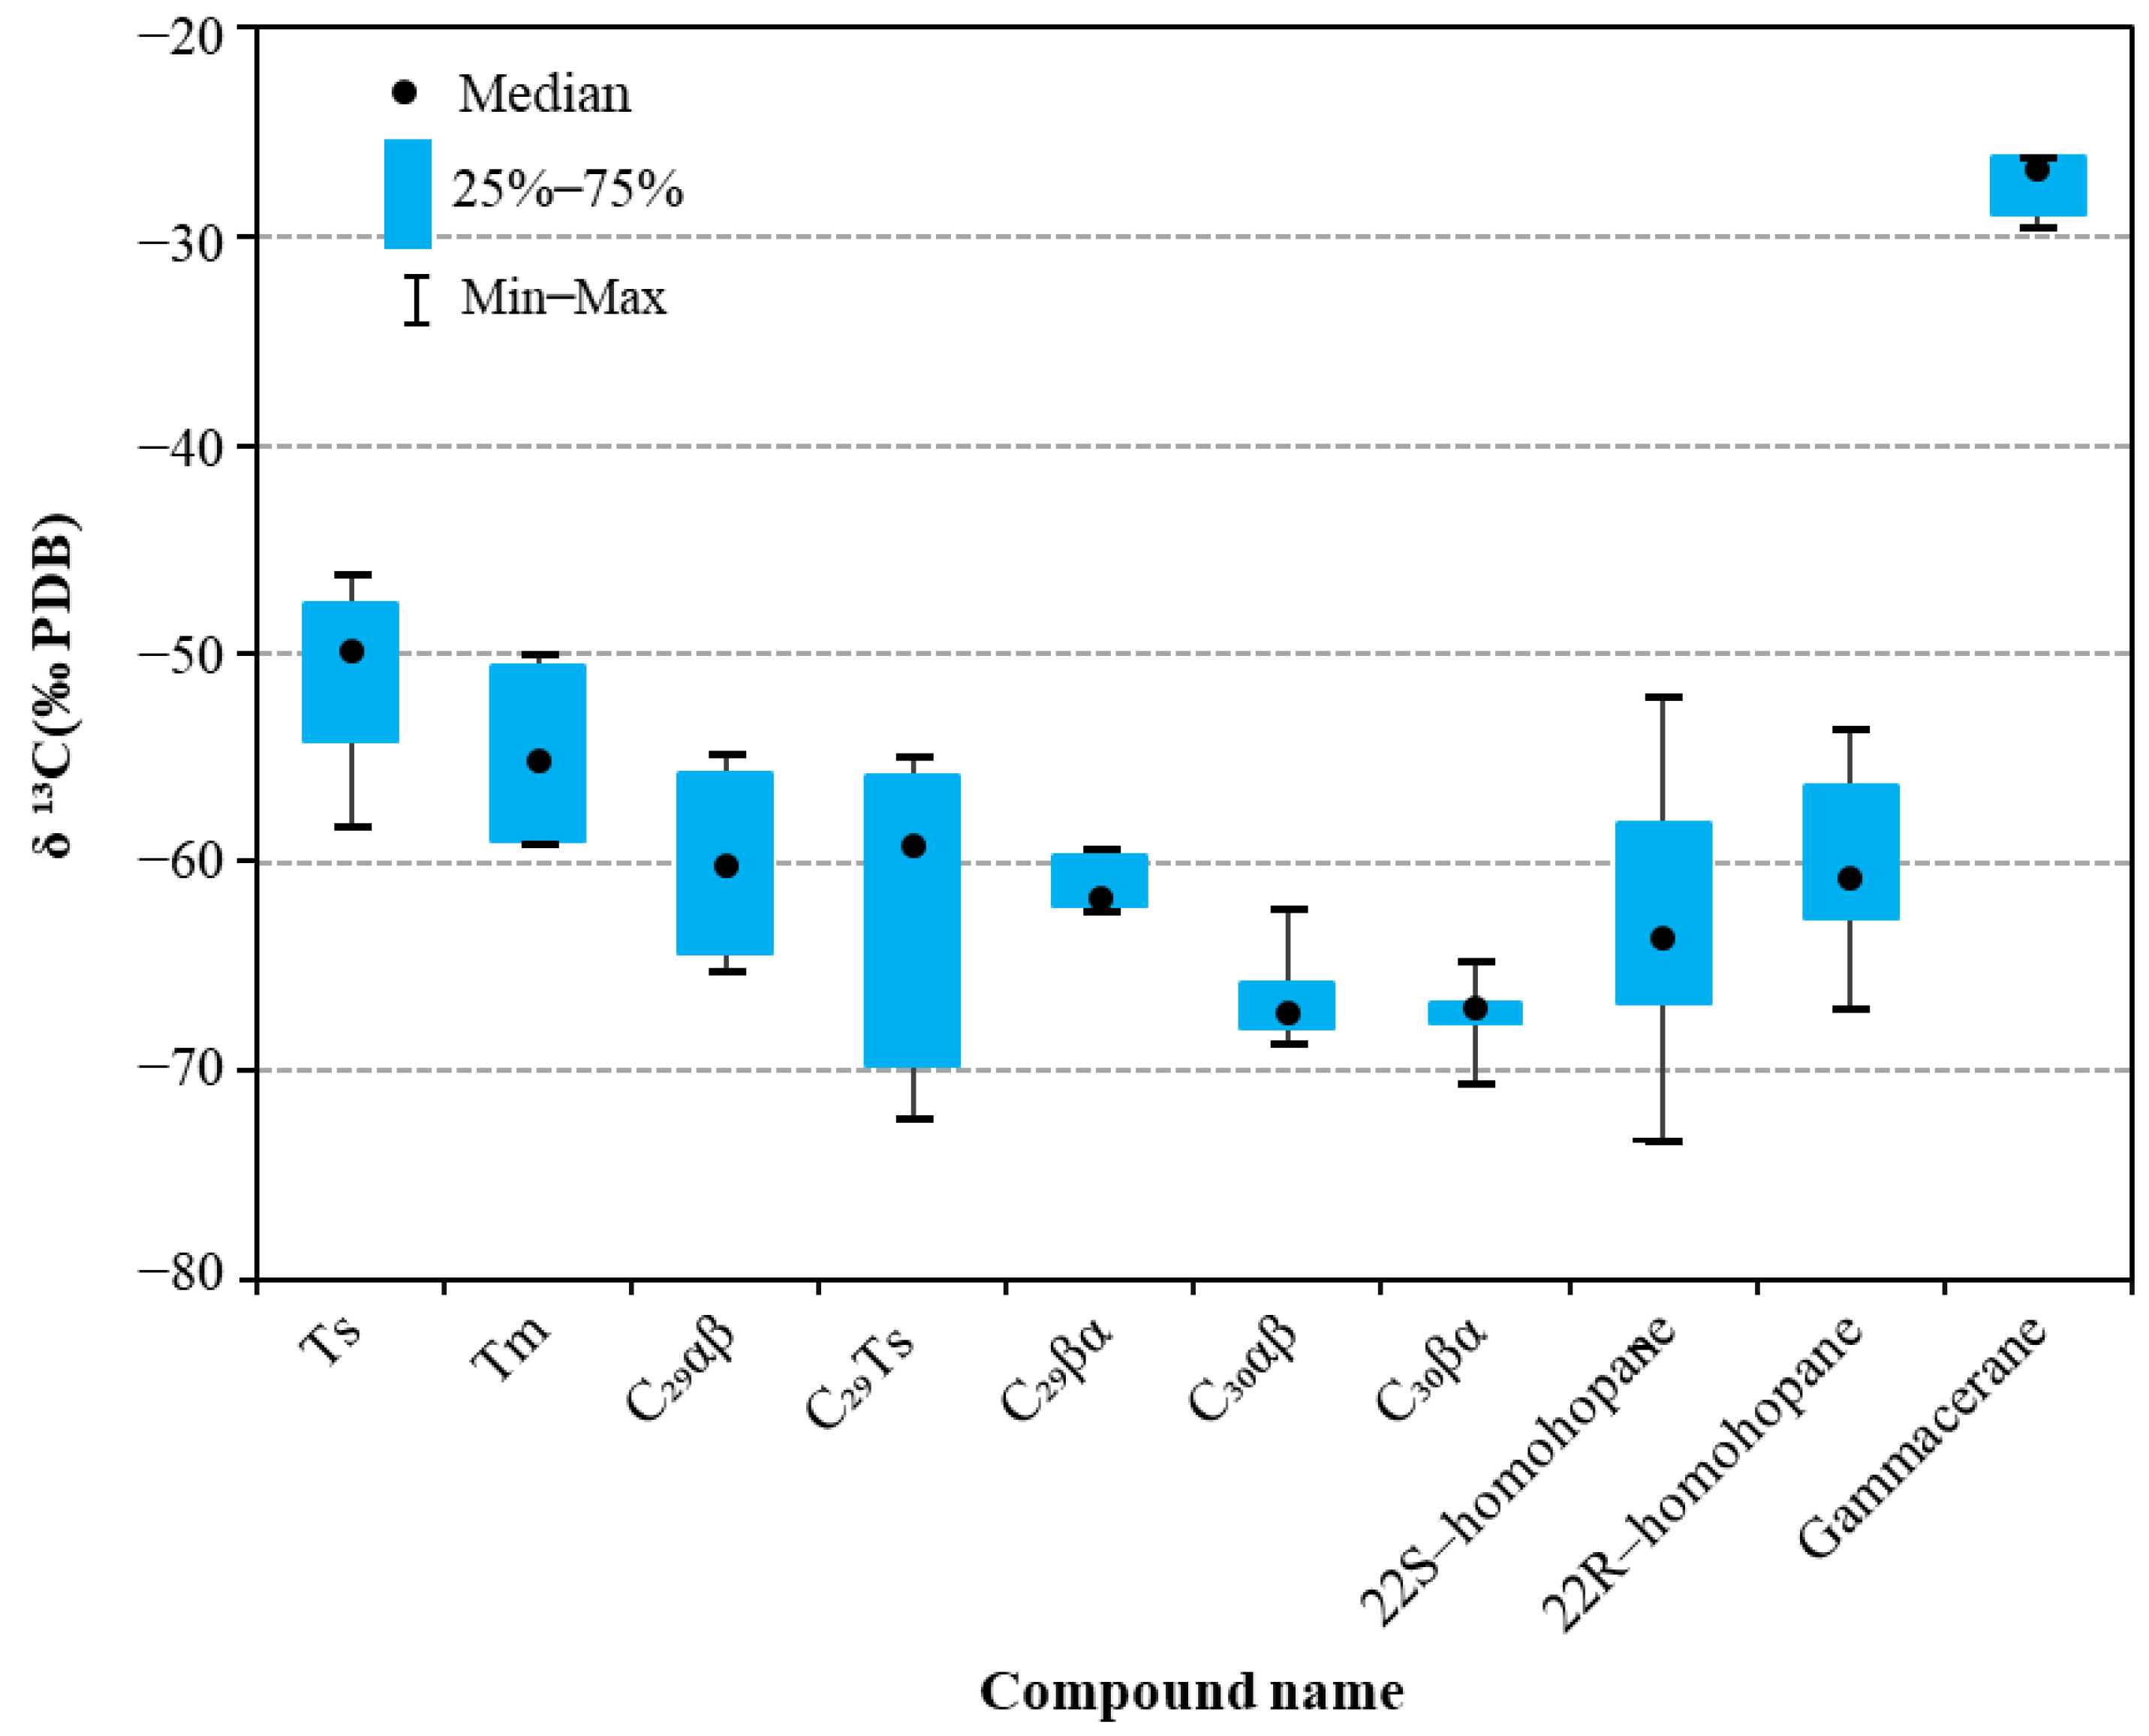
3.3.2. Overall Variation Range of Carbon Isotopes of Hopane Monomers

The carbon isotopes of monomeric hopane hydrocarbons at different pyrolysis temperatures are shown in Table 2. Overall (Figure 6), at various pyrolytic temperature stages, the δ13C values of monomeric hopane hydrocarbons in the residual oil of the Ek2 Kongdian Formation are generally lighter, and the carbon isotopes of these monomeric hopane hydrocarbons range from −46.22‰ to −73.31‰, which are significantly lighter than the δ13C values of hopane compounds found in several other major domestic and international hydrocarbon source rocks. For comparison, the δ13C values of the monomeric hopane hydrocarbons from the Permian Lucaogou Formation in the Santanghu Basin, Northwest China, range from −33‰ to −52‰ [24], while those from the Nenjiang Formation, Songliao Basin, are predominantly between −32‰ and −50‰ [25]. In the Green River Formation of the Uinta Basin, the δ13C values span from −29‰~−59‰ [5], and the values from the Eocene Messel Shale range from −35‰ to −65‰ [39]. These findings highlight the distinct isotopic characteristics of the monomeric hopane hydrocarbons in the study area. It is indicated that the δ13C values of the monomeric hopane hydrocarbons exhibit distinct multi-source characteristics across different geological formations. Generally, the δ13C values first become lighter and then heavier with the increasing carbon number in hopanes. Specifically, the carbon isotopes of C29Ts and C30βα are the lightest, while those of non-hopane gammacerane are the heaviest. The δ13C values for C29 Ts range from −54.93‰ to −72.24‰, and for C30βα from −64.75‰ to −70.54‰. In contrast, the δ13C values for gammacerane are the highest and exhibit less variation, ranging from −29.53‰ to −26.16‰, with fluctuations generally within 3‰.
The carbon isotopes of monomeric hopane hydrocarbons are influenced by several factors, including secondary action, bacterial processes, and the mixtures formed by primary producers [40]. It has been suggested that hopane with a light carbon isotope originates from methanotrophic bacteria. In the reduction zone of paleosedimentary environment, methanotrophic bacteria reduce acetic acid and carbon dioxide to methane enriched in 12C, which is used as a carbon source by methane autotrophic bacteria to synthesize hopane with a very light carbon isotope composition [39]. Judging by the extremely light carbon isotope of the sample, it may be related to the intense temperature stratification in the water body during the extremely hot climate conditions of that time and the shallow redox interface [41], with highly active bacterial action occurring in the bottom water body.
However, gammacerane exhibits a heavier carbon isotope value, exceeding −25‰ compared to the carbon isotopes of hopane compounds. It is considered that gammacerane is derived from tetrahymenol produced by certain protozoa and photosynthetic bacteria [42], with tetrahymenol itself derived from tetraethylene glycol, which originates from bacteriophages residing at the redox interface. It seems that the carbon isotope composition of gammacerane appears to be primarily influenced by that of its biological precursors and is less affected by the transformation of methanogens and other bacteria in the sediments post-deposition. This could be interpreted as evidence that gammacerane is related to the carbon isotopes of bacterial-feeding organisms such as bacteriophages [43].

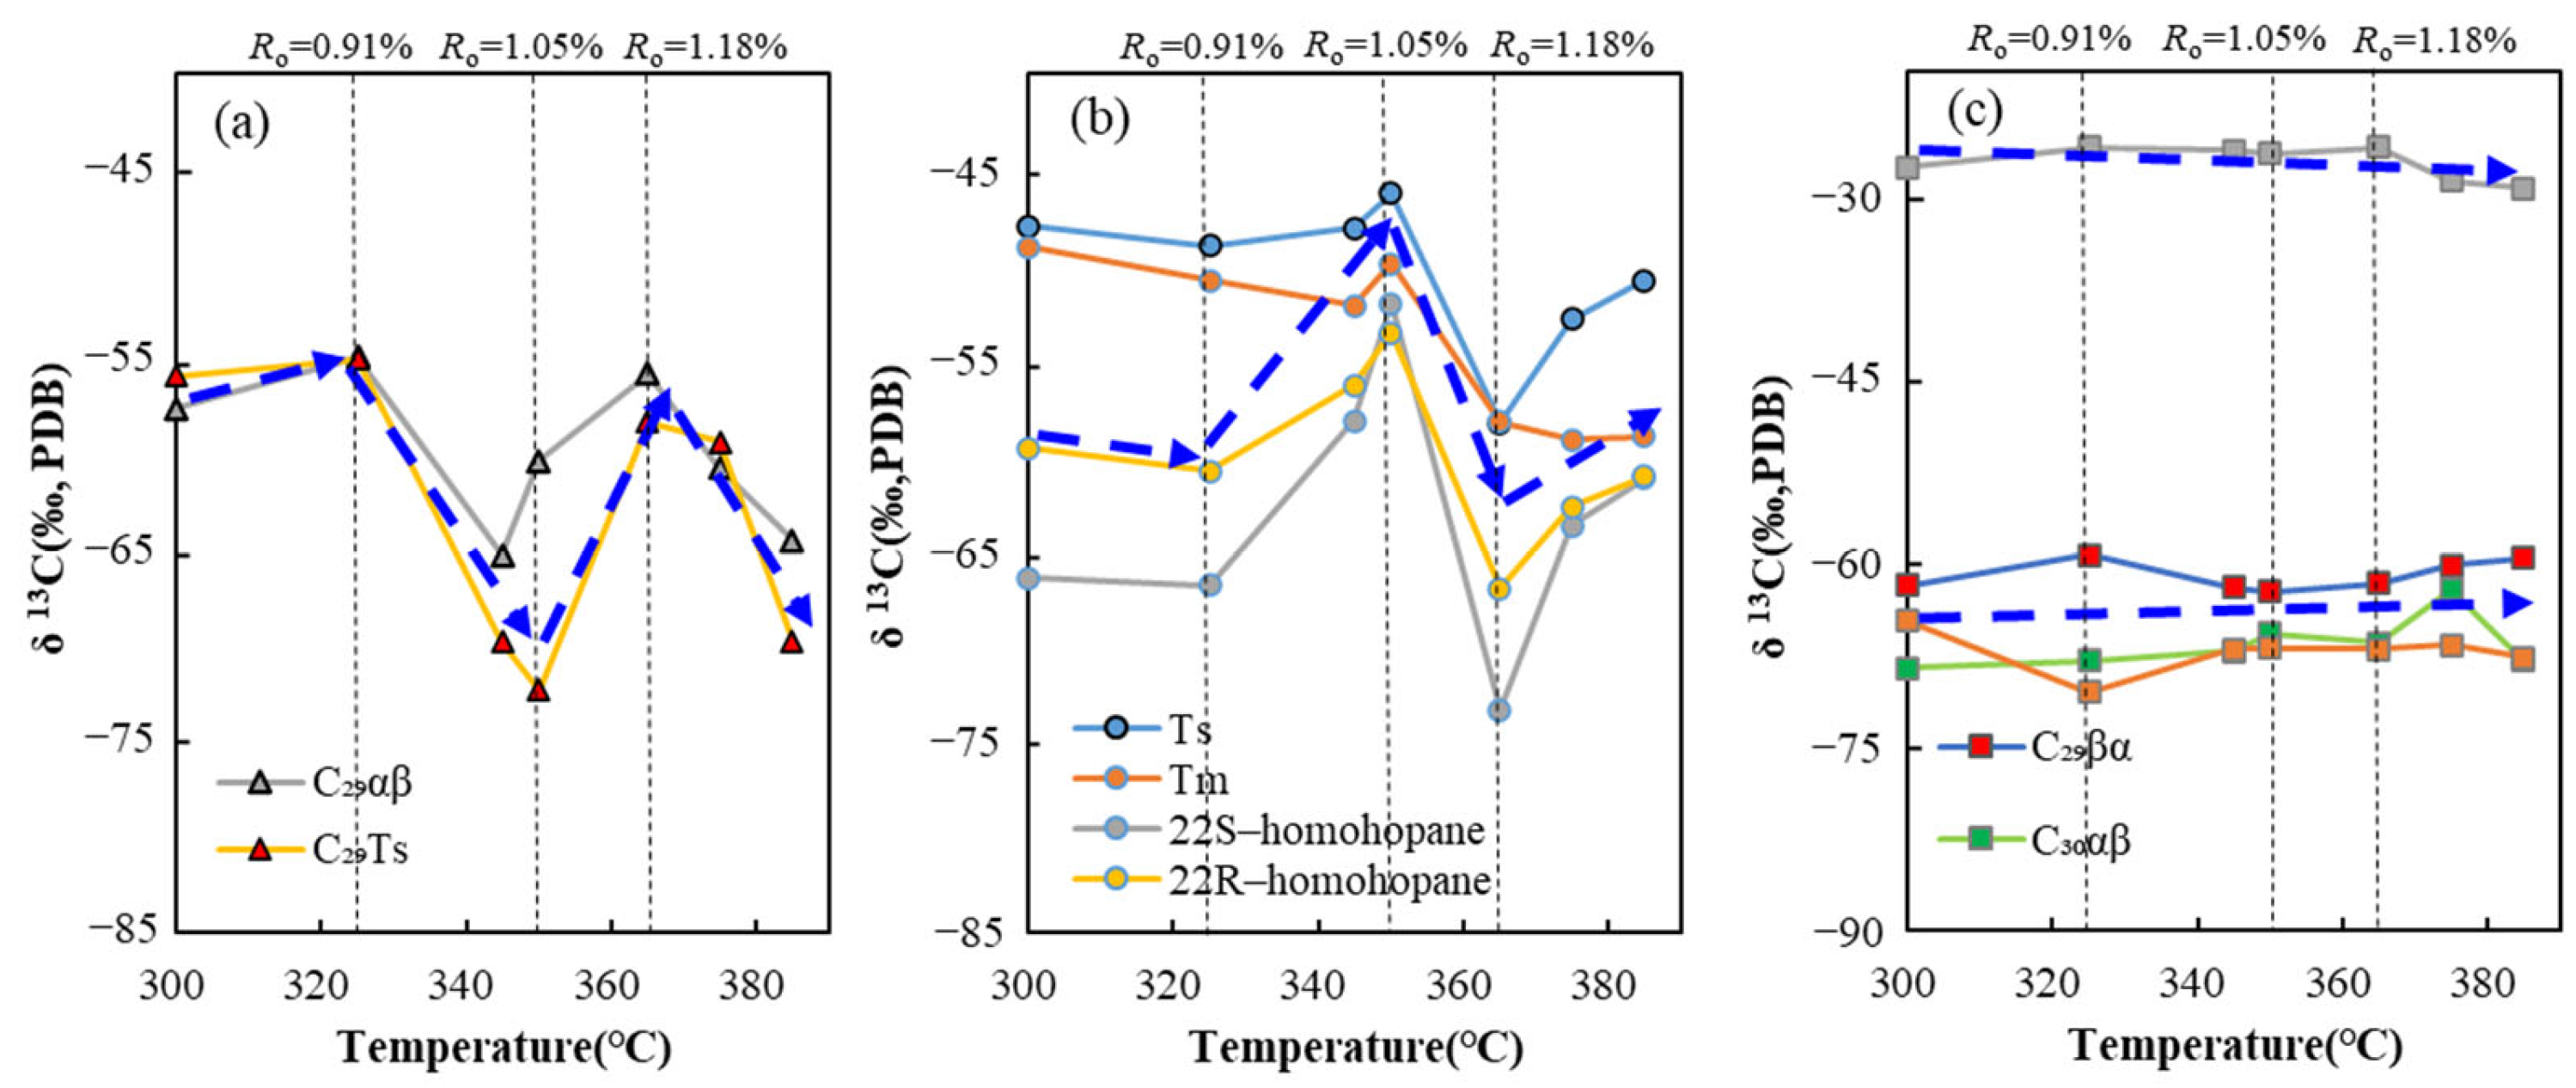
3.3.3. Variation in Hopane Composition and Carbon Isotopes of Their Monomers with Temperature

The composition of hopane compounds and their monomer carbon isotopes are closely related to temperature, which has a significant influence on the carbon isotope composition of monomeric hopane hydrocarbons. It can be seen from the relationship between stable carbon isotope composition of a series of hopane compounds and temperature (Figure 7) that temperature has different effects on carbon isotopes of different hopane series compounds, and its variation law with temperature can be obviously divided into three categories. In the first category, overall, the carbon isotopes of monomeric hopane hydrocarbons exhibit noticeable fluctuations with the increasing pyrolysis temperature. The primary compounds in this category are C29αβ and C29 Ts. Before 350 °C, the carbon isotopes of these compounds became slightly heavier and then lighter with the increase in pyrolysis temperature, reaching the lightest value around 350 °C, then becoming heavier around 350~365 °C, and finally, when the temperature was greater than 365 °C, the carbon isotopes became heavier. The overall range of change can be as much as 17.31‰. It is hypothesized that the significant fluctuations in carbon isotopes for these compounds may result from thermal fractionation during diagenesis and epigenesis. In the second category, on the whole the carbon isotopes of monomeric hopane hydrocarbons also exhibit noticeable fluctuations with increasing temperature. The primary compounds include Ts, Tm, 22S-homohopane, and 22R-homohopane. Before 350 °C, with the increase in temperature, the carbon isotopes of these compounds first became slightly lighter, then became heavier, reaching the maximum value at about 350 °C, then became lighter at about 350~365 °C, and finally gradually became heavier when the temperature was higher than 365 °C with the continuous increase in temperature, and the overall change range could reach 21.31‰. Our results preliminarily indicate consistency with previously reported studies that the isotopic fractionations of C29αβ, 22S-homohopane and 22R-homohopane are quite evident [24,25]. For the third category, the carbon isotopes of C29βα, C30αβ, C30βα, and non-hopane gammacerane almost keep subtle changes at different thermal stages. The relationship between the carbon isotopes of these compounds and the maturity is not clearly defined, indicating that the overall changes in carbon isotopes are within 6‰, with gammacerane showing changes within 3.3‰ as maturity increases.
It is generally believed that relative to biological precursors, the carbon isotope of kerogen, which has undergone diagenesis and thermal maturation, will not change significantly [44], while the carbon isotope composition of the monomeric compound depends on the carbon source utilized by the precursor organism and the carbon isotope fractionation effect during their biosynthesis and assimilation. Isoalkanes originating from different sources exhibit distinct carbon isotope compositions [8]. The variance in carbon isotope values among different hopane compounds in this sample, coupled with their varying responses to temperature, suggests that it is a potential explanation that these hopanes likely have distinct biological sources and exhibit different thermal response characteristics. However, the specific mechanisms require further validation.

3.3.4. Relationship Between Carbon Isotopes of Monomeric Hopane Hydrocarbons and Hydrocarbon Generation

The hydrocarbon generation process, specifically the process of transforming organic matter into hydrocarbon compounds, is a crucial stage in oil and gas formation. The variation in carbon isotopes of monomeric hopane hydrocarbons can provide valuable insights into this process. During hydrocarbon generation, organic matter has undergone a series of biochemical and thermochemical changes, which will lead to the fractionation of carbon isotopes. Notably, there is a strong correlation between the carbon isotopes of monomeric hopane hydrocarbons and the hydrocarbon generation process. Generally speaking, the carbon isotopes of monomeric hopane hydrocarbons undergo a significant change around the peak of oil generation (T = 350 °C, Ro = 1.05%). With the increase in maturity, the carbon isotopes of the hopane compounds such as C29αβ and C29Ts become lighter and then heavier when they approach the peak of oil generation. At the peak of oil generation, the carbon isotopes of the hopane compounds such as Ts, Tm, 22S-homohopane, and 22R-homohopane are heaviest and subsequently become lighter. Previous studies have pointed out that thermal effects significantly influence the formation of rearranged hopanes in source rocks. Zhang et al. [45] pointed out that the formation of rearranged hopanes primarily involves its precursor substances during low mature stage and both the pre-existing hopanes and rearranged hopanes in the source rock undergo thermal cracking during the maturation stage. Tocque et al. [46] conducted a study on the carbon isotopic analysis of kerogen pyrolysis, finding that the experimental products exhibited progressively heavier carbon isotopes with increasing thermal alteration. The authors attribute this phenomenon to special, unknown precursors present in immature kerogen. The entire process becomes complex due to the superposition of primary and secondary isotope fractionation. However, previous studies have proposed that during the thermal evolution of organic matter, the cleavage of chemical bonds may exhibit isotope-specific selectivity [5]. These studies indicate that with the increase in thermal evolution level of organic matter, 12C-12C bonds break preferentially, causing the carbon isotopes of biomarkers to become heavier. As the temperature rises further, kerogen is cracked, potentially causing a thermodynamic fractionation effect. This may lead to the redistribution of light and heavy isotope molecules between compounds or phases in the system, resulting in the difference in isotope composition in each compound, so that the δ13C value becomes lighter. The noticeable fluctuation of carbon isotopes of hopane compounds may be related to the cracking and mutual transformation of preceding compounds during the hydrocarbon generation.
In general, there are differences in the carbon isotope compositions of monomeric hopane hydrocarbons from various sources. However, it is important to note that while the observed trends in our data seem to imply a strong relationship between thermal maturity and the carbon isotopes of monomeric hopane hydrocarbons, this conclusion should be regarded as preliminary.

3.4. Geological Significances

According to early studies, the δ13C values of monomeric hopane hydrocarbons can indicate depositional environments and biological sources. The experimental data of this study showed that thermal maturity significantly affects the carbon isotope values of hopane hydrocarbons, and different hopane hydrocarbons respond inconsistently to thermal maturity. The impact of thermal maturity should not be ignored when comparing oil sources and inferring the source of organic matter. Sun et al. [19] reported the δ13C values of hopane hydrocarbons from lacustrine deposits of the Lucaogou Formation in the Junggar Basin, with the δ13C values as low as −63‰, indicating active aerobic CH4 oxidation in the overlying water column. This reveals the dynamic methane cycling recorded by the Lucaogou Formation, with increasing CH4 emissions contributing to the termination of the late Paleozoic Ice Age and subsequent climate warming. Li et al. [47] measured the δ13C values of hopane compounds for the mudstones and oil shales in Member Qing-1 of the Songliao Basin. The distribution scope of the δ13C values of hopane compounds is −40.18‰~−58.9‰, which is characterized by medium-layer water bacteria and addicted methane bacteria. By combining these findings with the carbon isotope features of other biomarker compounds, it was concluded that the majority of hydrocarbon sources in FuYang oil reservoirs originated from Member Qing-1 source rocks of the Songliao Basin. However, the conclusion provides a solid theoretical foundation and supplementary for studying the specific structural changes in hopane hydrocarbons at different evolutionary stages. Further research, including additional sample analyses and more comprehensive isotopic studies, is required to fully elucidate the relative contributions of thermal maturity and other factors and to establish a more definitive understanding of their effects on the carbon isotopes of monomeric hopane hydrocarbons.

4. Conclusions

Based on the semi-open pyrolysis experiments, the δ13C values of monomeric hopane hydrocarbons during thermal evolution were analyzed. The results show that thermal maturity can somewhat affect the δ13C value of monomeric hopane hydrocarbons, with amplitude variations reaching up to 21‰. However, the effects of thermal maturity on the δ13C values of various hopane monomers are different. For the δ13C of C29αβ and C29 Ts, they first become slightly heavier and then become lighter with increasing thermal maturity, reaching the lightest value around 350 °C (Ro = 1.05%). After 350 °C, the δ13C values become heavier, around 350–365 °C (1.05% < Ro < 1.18%), and finally become lighter when the temperature is greater than 365 °C (Ro > 1.18%). For the δ13C of Ts, Tm, 22S-homohopane, and 22R-homohopane, they exhibit an opposite trend, initially becoming slightly lighter and then becoming heavier, reaching the maximum value at 350 °C (Ro = 1.05%); then they becomes lighter and finally heavier with the increasing temperature. Meanwhile, the δ13C values of C29βα, C30αβ, C30βα, and non-hopane gammacerane remain almost constant with increasing thermal maturity. Therefore, it is essential to consider not only their precursors but also the effects of thermal maturity when these parameters are used for the study of oil–source correlation. In addition, the change of carbon isotopes of monomeric hopane hydrocarbons is closely related to the hydrocarbon generation process, with a notable inflection point occurring near the peak of oil generation. The substantial variation in carbon isotopes of monomeric hopane hydrocarbons may be attributed to the generation and cracking of hopane compounds during the early stages of hydrocarbon generation.

Author Contributions

Conceptualization, Y.L., X.W. and Z.W.; Methodology, L.L., Y.L., X.W. and Z.C.; Investigation, H.C., G.Y. and Z.G.; Resources, Y.X.; Writing—original draft, L.L.; Writing—review & editing, L.L.; Visualization, Z.L.; Supervision, Z.W.; Funding acquisition, Y.L. and X.W. All authors have read and agreed to the published version of the manuscript.

Funding

This study was supported by the National Natural Science Foundation of China (Grant No. 42272175; 42203058; 42472175) and by the Natural Science Foundation of Hubei Province (Grant No. 2025AFA106).

Institutional Review Board Statement

Not applicable.

Informed Consent Statement

Not applicable.

Data Availability Statement

The original contributions presented in this study are included in the article. Further inquiries can be directed to the corresponding author.

Acknowledgments

The authors acknowledge anonymous reviewers for their assistance.

Conflicts of Interest

The authors declare no conflicts of interest.

References

  1. Briggs, D.E.; Summons, R.E. Ancient biomolecules: Their origins, fossilization, and role in revealing the history of life. BioEssays 2014, 36, 482–490. [Google Scholar] [CrossRef] [PubMed]
  2. Tissot, B.P.; Pelet, R.; Roucache, J. Alkanes as geochemical fossils indicators of geological environments. In Advances in Organic Geochemistry 1975; Campos, R., Goni, J., Eds.; Enadimsa: Jakarta, Indonesia, 1977; pp. 117–154. [Google Scholar]
  3. Peters, K.E.; Walters, C.C.; Moldowan, J.M. The Biomarker Guide, Biomarkers and Isotopes in Petroleum Exploration and Earth History; Cambridge University Press: Cambridge, UK, 2005. [Google Scholar]
  4. Peters, K.E.; Moldowan, J.M. Effects of source, thermal maturity, and biodegradation on the distribution and isomerization of homohopanes in petroleum. Org. Geochem. 1991, 17, 47–61. [Google Scholar] [CrossRef]
  5. Bjorøy, M. Variation in stable carbon isotope ratios of individual hydrocarbons as a function of artificial maturity. Org. Geochem. 1992, 19, 89–105. [Google Scholar] [CrossRef]
  6. Shi, J.Y.; Xiang, M.J.; Zhou, Y.P. Study on carbon isotopic ratio of individual compound in hopanes. Acta Sedimentol. Sin. 2000, 2, 310–313. [Google Scholar]
  7. Oba, Y.; Naraoka, H. Carbon and hydrogen isotopic fractionation of low molecular weight organic compounds during ultraviolet degradation. Org. Geochem. 2008, 5, 501–509. [Google Scholar] [CrossRef]
  8. Lu, H.; Chai, P.X.; Sun, Y.G.; Peng, P.A. Study on stable carbon isotopic compositions of n-alkanes and isoprenoids for crude oils from Well Lunnan 14, Tarim Basin. Acta Sedimentol. Sin. 2002, 3, 477–481. [Google Scholar]
  9. Clayton, C.J.; Bjorøy, M. Effect of maturity on 13C/12C ratios of individual compounds in North Sea oils. Org. Geochem. 1994, 21, 737–750. [Google Scholar] [CrossRef]
  10. Breck, D.W. Zeolite molecular sieves: Structure, chemistry and use: Interscience-Wiley, New York. Anal. Chim. Acta 1975, 75, 493. [Google Scholar]
  11. Xie, S.C.; Nott, C.J.; Avsejs, L.A.; Volders, F.; Maddy, D.; Chambers, F.M.; Gledhill, A.R.; Carter, J.F.; Evershed, R.P. Palaeoclimate records in compound-specific δD values of a lipid biomarkers in ombrotrophic peat. Org. Geochem. 2000, 31, 1053–1057. [Google Scholar] [CrossRef]
  12. Huang, Y.S.; Street-Perrott, F.A.; Perrott, R.A.; Metzger, P.; Eglinton, G. Glacial-interglacial environment changes inferred from molecular and compound-specific δ13C analyses of sediments from Sacred Lake, Mt. Kenya. Geochim. Cosmochim. Acta 1999, 63, 1383–1404. [Google Scholar] [CrossRef]
  13. Eglinton, G.; Hamilton, R.J. Leaf epicuticular waxes. Science 1967, 156, 1322–1335. [Google Scholar] [CrossRef] [PubMed]
  14. Rielley, G.; Collier, R.J.; Jones, D.M.; Eglinton, G. The biogeochemistry of Ellesmere Lake, UK: Source correlation of leaf wax inputs to the sedimentary lipid record. Org. Geochem. 1991, 17, 901–912. [Google Scholar] [CrossRef]
  15. Yamada, K.; Ishiwatari, R. Carbon isotopic compositions of long-chain n-alkanes in the Japan Sea sediments: Implication for paleoenvironmental changes over the past 85 kyr. Org. Geochem. 1990, 30, 367–377. [Google Scholar] [CrossRef]
  16. Kiepper, A.P.; Casilli, A.; Azevedo, D.A. Depositional paleoenvironment of Brazilian crude oils from unusual biomarkers revealed using comprehensive two dimensional gas chromatography coupled to time of flight mass spectrometry. Org. Geochem. 2014, 70, 62–75. [Google Scholar] [CrossRef]
  17. Zhang, Y.D.; Sun, Y.G.; Chen, J.P. Geochemical evidence of lake environments favorable for the formation of excellent source rocks: A case study from the third member of the Eocene Shahejie Formation in the Qikou Sag, Bohai Bay Basin, eastern China. Mar. Pet. Geol. 2022, 136, 105435. [Google Scholar] [CrossRef]
  18. Volkman, J.K.; Zhang, Z.; Xie, X.; Qin, J.; Borjigin, T. Biomarker evidence for Botryococcus and a methane cycle in the Eocene Huadian oil shale, NE China. Org. Geochem. 2015, 78, 121–134. [Google Scholar] [CrossRef]
  19. Sun, F.N.; Hu, W.X.; Cao, J.; Wang, X.L.; Zhang, Z.R.; Ramezani, J.; Shen, S.Z. Sustained and intensified lacustrine methane cycling during Early Permian climate warming. Nat. Commun. 2022, 13, 4856. [Google Scholar] [CrossRef]
  20. Duan, Y.; Ma, L.H. Several problems concerned with stable carbon isotopic geochemistry of biomarker compounds. Adv. Earth Sci. 1996, 11, 356–361. [Google Scholar]
  21. Guo, Z.; Yang, Z.; Lin, T.; Li, J. Compound-specific carbon isotope compositions of individual n-alkanes in the East China Sea mud areas. Q. Sci. 2006, 3, 384–390. [Google Scholar]
  22. Hofreiter, M.; Collins, M.; Stewart, J.R. Ancient biomolecules in quaternary palaeoecology. Q. Sci. Rev. 2012, 33, 1–13. [Google Scholar] [CrossRef]
  23. Xie, X.M.; Borjigin, T.; Zhang, Q.Z.; Zhang, Z.R.; Qin, J.Z.; Bian, L.Z.; Volkman, J.K. Intact microbial fossils in the Permian Lucaogou Formation oil shale, Junggar Basin, NW China. Int. J. Coal Geol. 2015, 146, 166–178. [Google Scholar] [CrossRef]
  24. Liu, B.; Bechtel, A.; Sachsenhofer, R.F.; Gross, D.; Gratzer, R.; Chen, X. Depositional environment of oil shale within the second member of Permian Lucaogou Formation in the Santanghu Basin, Northwest China. Int. J. Coal Geol. 2017, 175, 10–25. [Google Scholar] [CrossRef]
  25. Wang, L.; Song, Z.G.; Cao, X.Z.; Li, Y. Compound specific carbon isotope study on the hydrocarbon biomarkers in la-custrine source rocks from Songliao Basin. Org. Geochem. 2015, 87, 68–77. [Google Scholar] [CrossRef]
  26. Li, E.T.; Jin, J.; Chen, J.; Wang, M.; Mi, J.L.; Gao, X.W. Study on biomarkers and carbon isotopic compositions of monomer hydrocarbons in asphaltene pyrolysis products from biodegraded heavy oil. Geochimica 2019, 3, 284–292. [Google Scholar]
  27. Zhao, M.J.; Huang, D.P.; Zhang, S.C. An on-line carbon isotope study of hydrocarbon monomers in crude oils from Tarim Basin. Pet. Explor. Dev. 1994, 3, 52–59. [Google Scholar]
  28. Grice, K.; Audino, M.; Boreham, C.J.; Alexander, R.; Kagi, R.I. Distributions and stable carbon isotopic compositions of biomarkers in torbanites from different palaeogeographical locations. Org. Geochem. 2001, 32, 1195–1210. [Google Scholar] [CrossRef]
  29. Ding, W.J.; Hou, D.J.; Li, L.; Jiang, L.; Zhang, Z.M.; Jiang, Y.H.; George, S.C. Reconstructing the palaeoecology of a middle Permian alkaline lake using molecular fossils, case study of the Lucaogou Formation in the Junggar Basin, NW China. Org. Geochem. 2024, 193, 104791. [Google Scholar] [CrossRef]
  30. Lu, Z.D.; Chen, Z.L.; Liu, Y.; Xu, Y.H.; Wen, Z.G.; Ding, K.L.; Tian, Y.J. A small-scale neutral alumina column chromatography method for carbon isotope determination of hopanes in crude oils or rock extracts. J. Chromatogr. A 2023, 1689, 463729. [Google Scholar] [CrossRef]
  31. Bao, J.; Liu, Y.; Fan, Y.P.; Xu, Y.H.; Ding, K.L.; Wen, Z.G.; Li, Y.; Gao, Y.; Zhang, C.Y.; Li, L. Influence of thermal maturity on carbazole distributions in coal source rocks during compaction pyrolysis experiments. Sci. Rep. 2024, 14, 6848. [Google Scholar] [CrossRef]
  32. Zheng, L.J.; Heng, S.; Qin, J.Z.; Ma, Z.L. Formation water of near-critical properties and its effects on the processes of hydrocarbon generation and expulsion. Earth Sci. 2011, 36, 83–92. [Google Scholar]
  33. Zhao, H.; Ma, Z.L.; Zheng, L.J.; Tan, J.Q.; Li, Q.; Wang, Z.H.; Ning, C.X. Geochemical characteristics of hydrocarbon products under thermal simulation of temperature and pressure co-control in finite space. Nat. Gas. Geosci. 2020, 31, 73–83. [Google Scholar]
  34. Li, Z.M.; Zheng, L.J.; Ma, Z.L.; Xu, E.S.; Yu, X.L.; Jin, G.X.; Mu, X.S. Simulation of source rock for hydrocarbon generation and expulsion in finite space and its significance. Pet. Geol. Exp. 2011, 33, 447–451+459. [Google Scholar]
  35. Zheng, L.J.; Guan, D.F.; Guo, X.W.; Ma, Z.L. Key geological conditions affecting pyrolysis experiments of marine source rocks for hydrocarbon generation. Earth Sci. 2015, 40, 909–917. [Google Scholar]
  36. Ma, Z.L.; Zheng, L.J.; Li, Z.M. The thermocompression simulation experiment of source rock hydrocarbon generation and expulsion in formation porosity. Acta Sedimentol. Sin. 2012, 30, 955–963. [Google Scholar]
  37. He, C.; Zheng, L.J.; Wang, Q.; Ma, Z.L.; Ma, J.F. Experimental development and application of source rock thermal simulation for hydrocarbon generation and expulsion. Pet. Geol. Exp. 2021, 43, 862–870. [Google Scholar]
  38. Craig, H. Isotopic standards for carbon and oxygen and correction factors for mass-spectrometric analysis of carbon dioxide, Geochim. Cosmochim. Acta 1957, 12, 133–149. [Google Scholar] [CrossRef]
  39. Freeman, K.H.; Hayes, J.M.; Trendel, J.M.; Albrecht, P. Evidence from carbon isotope measurements for diverse origins of sedimentary hydrocarbons. Nature 1990, 343, 254–256. [Google Scholar] [CrossRef]
  40. Peters, K.E.; Moldowan, J.M.; Schoell, M. Petroleum isotopic and biomarker composition related to source rock organic matter and depositional environment. Org. Geochem. 1986, 10, 17–27. [Google Scholar] [CrossRef]
  41. Tan, X.F.; Wang, J.; Lei, L.D.; Kuang, H.; Gao, H.C.; Wang, W.Q. Material differentiation and its response to the “PETM” events in continental fault lake during the early Paleogene period: A case study of Kongdian Formation in Jiyang Depression. Earth Sci. 2016, 41, 1893–1908. [Google Scholar]
  42. Hayes, J.M.; Freeman, K.H.; Popp, B.N.; Christopher, H.H. Compound-specific isotopic analyses: A novel tool for reconstruction of ancient biogeochemical processes. Org. Geochem. 1990, 16, 1115–1128. [Google Scholar] [CrossRef]
  43. Huang, L.; Chernyak, S.M.; Batterman, S.A. PAHs (polycyclic aromatic hydrocarbons), nitro-PAHs, and hopane andterane biomarkers in sediments of southern Lake Michigan, USA. Sci. Total Environ. 2014, 487, 173–186. [Google Scholar] [CrossRef] [PubMed]
  44. Wang, W.C.; Xu, Y.C.; Manfred, S.; Eckhard, F.; Wolfgang, S. The Geochemical Characteristics of Carbon and Hydrogen Isotopes of Kerogens of Various Maturity and Depositional Environments. Acta Sedimentol. Sin. 1997, 15, 133–137. [Google Scholar]
  45. Zhang, M.; Li, J.; Chen, Z.L. Thermal Effect on the Distribution of Rearranged Hopanes in Hydrocarbon Source Rocks. Acta Sedimentol. Sin. 2018, 36, 1033–1039. [Google Scholar] [CrossRef]
  46. Tocqué, E.; Behar, F.; Budzinski, H.; Lorant, F. Carbon isotopic balance of kerogen pyrolysis effluents in a closed system. Org. Geochem. 2005, 36, 893–905. [Google Scholar] [CrossRef]
  47. Li, Z.G.; Sun, J.; Fang, W.; Xu, C.L.; Huang, C.Y. Characteristics of the carbon isotopes of the biomarkers in member qing-1 mudstones in songliao basin. Pet. Geol. Oilfield Dev. Daqing 2012, 31, 19–23. [Google Scholar]
Figure 2. Variation in hydrocarbon yield with temperature during the pyrolysis experiment.
Applsci 15 05469 g002
Figure 3. The trend of Ro values as pyrolysis temperature increases.
Applsci 15 05469 g003
Figure 4. Biomarkers of saturated hydrocarbon extracted from the lacustrine shale of Ek2 Kongdian Formation in Cangdong Sag. (a) Total ion chromatogram (TIC) of the saturated hydrocarbon fractions of the shale sample. (b) m/z 191 mass chromatograms showing the distribution of hopanes. (c) m/z 85 mass chromatograms showing the distribution of n-alkanes. (d) m/z 217 mass chromatograms showing the distribution of steranes.
Applsci 15 05469 g004
Figure 5. Separation of hopane compounds in residual oil at pyrolysis temperature of 300 °C by column chromatography. (a) The GC-MS TIC of residual oil. (b) m/z 191, m/z 217 mass spectrometry of residual oil. (c) The GC-MS TIC of hopane after separation of residual oil. (d) m/z 191, m/z 217 mass spectrometry of hopane after separation of residual oil: 1. Ts; 2. Tm; 3. C29αβ; 4. C29Ts; 5. C29βα; 6. C30αβ; 7. C30βα; 8. gammacerane.
Applsci 15 05469 g005
Figure 6. Variation range of carbon isotopes of monomeric hopane hydrocarbons in lacustrine shale during compaction pyrolysis experiments.
Applsci 15 05469 g006
Figure 7. Distribution characteristics of carbon isotopes of monomeric hopane hydrocarbons at different thermal maturity levels. (a) The first category. (b) The second category. (c) The third category.
Applsci 15 05469 g007
Table 1. Basic geochemical information of shale sample.
FormationDepth (m)TOC (%)S1 (mg/g)S2 (mg/g)Tmax (°C)HI (mg/g TOC)Ro (%)
Ek22090.5–2105.64.380.6735.884448190.31
Table 2. Carbon isotopes of monomeric hopane hydrocarbons at different pyrolysis temperatures.
Compound NameTemperature (°C)
300325345350365375385
Ts−47.95−48.98−48.05−46.22−58.24−52.83−50.79
Tm−49.06−50.81−52.12−49.94−58.20−59.15−58.98
C29αβ−57.47−54.82−65.19−60.21−55.69−60.63−64.41
C29 Ts−55.80−54.93−69.74−72.24−58.22−59.26−69.67
C29βα−61.82−59.37−62.04−62.37−61.70−60.25−59.65
C30αβ−68.63−67.97−67.26−65.81−66.52−62.15−68.00
C30βα−64.75−70.54−67.08−67.00−67.02−66.70−67.70
22S-homohopane−66.38−66.77−58.16−52.00−73.31−63.65−61.18
22R-homohopane−59.59−60.78−56.29−53.56−66.95−62.65−61.06
Gammacerane−27.80−26.16−26.45−26.73−26.16−28.92−29.53
Disclaimer/Publisher’s Note: The statements, opinions and data contained in all publications are solely those of the individual author(s) and contributor(s) and not of MDPI and/or the editor(s). MDPI and/or the editor(s) disclaim responsibility for any injury to people or property resulting from any ideas, methods, instructions or products referred to in the content.

