Article

Gluten-Free Sourdough Based on Quinoa and Sorghum: Characterization and Applications in Breadmaking

Faculty of Food Science and Engineering, Dunarea de Jos University of Galati, 111 Domneasca Street, 800201 Galati, Romania
*
Author to whom correspondence should be addressed.
Appl. Sci. 2025, 15(10), 5468; https://doi.org/10.3390/app15105468
Submission received: 25 March 2025 / Revised: 2 May 2025 / Accepted: 12 May 2025 / Published: 13 May 2025

Abstract

:
Gluten-free flour blends, consisting of quinoa and sorghum flours, were used in the present study to prepare sourdough samples, which were characterized in terms of physical–chemical properties, the thermo-mechanical behavior of dough and bread making performance. The quinoa–sorghum flour blends (100:0, 75:25, 50:50) were fermented using two different starter cultures, consisting of Lacticaseibacillus rhamnosus, Levilactobacillus brevis and Lactiplantibacillus plantarum (SC1), and Lactobacillus acidophilus, Bifidobacterium lactis and Streptococcus thermophilus (SC2). After 20 h of fermentation at 30 °C, the acidity of the sourdoughs prepared with SC1 and SC2 was significantly higher in respect to the corresponding spontaneously fermented sample. The use of the starter culture for sourdough fermentation resulted in sourdoughs with higher glycerol and lactic acid contents, and lower ethanol and acetic acid. The empirical rheological measurements indicated that the behavior of the proteins and starch within the complex dough matrix, during mixing and heating, is influenced by both sorghum level and starter culture type. The use of the sourdough allowed the preparation of gluten-free breads with good texture and high contents of bioactive compounds. In conclusion, sourdough fermentation can be successfully used for boosting the quality of the gluten-free bread products.

1. Introduction

The gluten-free (GF) products were initially developed for the group of consumers who suffer from gluten-related diseases or disorders. In recent years, because of a better understanding of the relationship between the GF diet and health, a growing interest of healthy consumers in GF foods has attracted the attention of food scientists. Thus, extensive research has been carried out for the development of GF food products with properties similar to conventional gluten-containing products [1].
Wheat flour contains suitable amounts of gluten-forming proteins, namely gliadins and glutenins, which are responsible for dough’s viscosity and elasticity, respectively [2]. Because of the elastic and extensible properties of the wheat dough network, the gas produced by bakery yeast during fermentation is well retained, resulting in good texture and porosity of the bread loaves. Mimicking the viscoelastic properties of gluten is very challenging, and therefore, obtaining gluten-free dough with similar quality and structural properties is an extremely difficult task. GF bread products usually suffer from poor texture properties, reduced crumb porosity and fast staling [3].
Among the ingredients tested for replacing the wheat flour in the GF products, Wang et al. [4] discussed gluten-free flours obtained from cereals, pseudocereals, legumes or seeds, as well as various types of nuts and fruit-based ingredients or refined ingredients such as starch from cassava, potato or rice, proteins, fibers and emulsifiers. The most widely investigated gluten-free cereals are rice, maize, sorghum, millet and teff. In order to balance the nutritional profile of the GF products, pseudocereals like quinoa, buckwheat, amaranth or chia can be included in various GF formulations [5,6]. The use of pseudocereals with high nutritional and biological values in the daily diet can provide consumers with multiple health related benefits [7]. Since pseudocereals do not affect the technological functionality and quality of the complex food matrices, their use for obtaining GF products seems to be a necessity rather than a choice [6,8].
Among the pseudocereals used to obtain gluten-free products, quinoa is of particular interest, because of its high content of minerals, vitamins, fiber, fatty acids and proteins well-balanced in amino acids, which can further help balancing the overall protein of the food matrix [9,10]. Moreover, quinoa is a very good functional substitute for gluten, due to its rich content of soluble dietary fiber, higher than the one found in cereals, as well as due to its high content of pectic substances and xyloglucan [11]. Turkut et al. [12] showed that the loss of structure associated with the absence of gluten in the dough can be compensated by replacing buckwheat flour with increasing levels of quinoa flour. The dough viscosity increase with quinoa flour addition was assigned by Turkut et al. [12] to the higher soluble dietary fiber content of quinoa flour compared to buckwheat flour. Onyango et al. [13] showed that GF formulations that include up to 70% sorghum and different types of starch (corn, potatoes, rice or cassava) allow us to obtain high-quality bread products.
Lactic acid bacteria (LAB) used for sourdough fermentation emerged as a useful tool for obtaining high-quality gluten-free products [14,15]. Sourdough is a mixture consisting of flour and water, fermented with lactic acid bacteria, and eventually yeasts, and frequently used to obtain bakery products [16,17]. While yeasts are essential for biosynthesis and release of the flavor compounds, lactic acid bacteria are primarily responsible for acidification of the sourdough [18]. There are three different sourdough production processes, differentiated based on the type of inoculum used for fermentation: type 1—traditional fermentation ensured through backslopping the spontaneously fermented flour–water mixtures; type 2—by fermentation initiated using a starter culture; type 3—using the backslopping procedure, relying on a previous fermentation process initiated by starter culture addition [19]. Even though there is no official definition, Hansen [20] stated that sourdough should have a pH lower than 4.5 and a LAB content higher than 5 × 10⁵ CFU/g of dough.
The use of sourdough in breadmaking allows us to lower the glycemic index and improve the nutritional value of the bread by increasing the bioavailability of minerals and reducing the content of antinutrients [21,22]. Moreover, as a result of protein hydrolysis occurring during sourdough fermentation, different bioactive peptides and amino acids are released out of the native proteins [14]. Also, the use of sourdough was reported to improve texture, increase the overall acceptability of products and extend the shelf life of bakery products, due to the pH decrease which helps inhibit the microbial growth [14,22,23].
The aim of the study was to test the effect of lactic fermentation on the properties of the sourdough, dough and bread prepared with GF flour blends obtained by quinoa flour substitution by sorghum flour.

2. Materials and Methods

2.1. Materials

The quinoa (Bio Market, Floresti, Cluj, Romania) and sorghum (Grizly, Olomuc, Czech Republic) flours were used in the study. The sourdough, dough and bread samples were prepared using three different GF flours, prepared by mixing the quinoa and sorghum flour in the following ratios: 100:0 (Q100), 75:25 (Q75) and 50:50 (Q50).
The inoculum used for preparing the sourdoughs consisted of mixtures of lactic acid bacteria purchased from EDR Ingredients (Piatra Neamt, Romania): starter culture 1 (SC1) included Lacticaseibacillus rhamnosus (previously known as Lactobacillus rhamnosus), Levilactobacillus brevis (previously known as Lactobacillus brevis) and Lactiplantibacillus plantarum (previously known as Lactobacillus plantarum); and starter culture 2 (SC2) included Lactobacillus acidophilus, Bifidobacterium lactis and Streptococcus thermophilus.
All other ingredients used for preparing the GF breads, namely salt, sugar and compressed yeast, were procured from the local market (Galati, Romania).

2.2. Proximate Composition

Chemical composition of the flours was determined as follows. The moisture content of the flour, sourdough and bread samples was determined using the SR ISO 712:2005 method (SR ISO 712:2005 [24]), by drying the samples to constant weight over 90 min at a temperature of 130 ± 2 °C in the oven (DLab LDO-030E, DlabTech, Daihan Labtech Co., LTD, Namyangju-si, Republic of Korea). The total nitrogen content of quinoa and sorghum flours determined by the Kjeldahl method (Trade Raypa, R Espinar, SL, Barcelona, Spain; SR EN ISO 20483:2007, [24]), was multiplied by a conversion factor of 6.25 and 5.75 to determine the total protein contents of quinoa flour and sorghum flour, respectively [25]. The Soxhlet extraction (SER-148; VELP Scientifica, Usmate Velate (MB), Italy) with ether was applied to determine fat content of quinoa and sorghum flours [25]. The crude fiber content was determined according to Banu and Aprodu [25], using the Fibretherm Analyser (C. Gerhardt GmbH & Co. KG, Königswinter, Germany). The ash content was assessed through the SR ISO 2171/2002 method (SR ISO 2171/2002 [24]), which is based on the flour samples calcination in a furnace (LAC, spol. s.r.o., Rajhrad, Czech Republic) at a temperature of 725–750 °C, to ensure the complete combustion of the organic compounds.

2.3. Sourdough Preparation

The GF flour blends were hydrated with tap water to obtain a dough yield (mass of dough × 100/mass of GF flour) of 300. Each GF flour suspension was further inoculated with SC1 and SC2 to prepare the sourdoughs. The producer recommendations were followed to obtain an inoculum size of minimum 108 CFU/100 g dough. After inoculation, the beakers were covered with aluminum foils and sourdough fermentation was allowed to take place in a Nitech incubator (POL-EKO-Aparatura Sp., Wodzislaw, Poland) for 20 h at 30 °C. For each type of flour blend, a control sourdough sample (C) with no starter culture addition was prepared under similar fermentation conditions, such as to determine the activity of the epiphytic microflora of the GF flours.

2.4. Sourdough Characterization

The pH of the sourdough samples was measured using a digital pH meter (WTW, pH7110, InoLab, Weilheim, Germany). The total titratable acidity (TTA) values were determined using 0.1 N NaOH solution to neutralize the acidity of 10 g of sourdough sample (SR 90:2007, [24]).
The metabolic activity of the lactic acid bacteria was determined using the EnzytecTM kits from R-Biopharm (R-Biopharm AG, Darmstadt, Germany) to quantify the lactic acid, acetic acid, ethanol and glycerol released in the sourdough upon 20 h of fermentation at 30 °C. These biochemical analyses involved measuring the absorption of the NADPH at wavelength of 340 nm upon specific oxidoreductase activity. The producer recommendations were followed to determine the contents of the lactic acid, acetic acid, ethanol and glycerol (g/100 g d.w.).
In order to determine the total phenolic content and antioxidant activity of the sourdough samples, extracts were prepared by mixing 1 g of sample with 10 mL of acidified methanol solution (HCl:methanol:water, 1:80:10, v:v:v). The extraction was carried out for 2 h at 23 ± 1 °C, followed by centrifugation for 15 min 9690× g. The collected supernatant was used to assess the total phenolic content (TPC) using the Folin–Ciocalteu method, and the antioxidant activity was assessed as the scavenging activities against the ABTS●+ radical cations (ABTS-RSA) and against 2,2-diphenyl-1-picrylhydrazyl radicals (DPPH RSA), as detailed by Banu et al. [26]. The ABTS-RSA and DPPH-RSA results were expressed as µmols Trolox equivalents/g d.w. (µmols TE/ g d.w).

2.5. Lactic Acid Bacteria Enumeration

An amount of approx. 10 g from each sourdough sample was suspended in 90 mL of 0.2% peptone water and homogenized in a sterile bag (Nuovo Aptaca, Regione Monforte, Canelli, Italy) with a paddle shaker (Bagmixer 100 Minimix P 01102115, Interscience, Puycapel, France) for 2 min. Then, the samples were diluted in a 1:10 ratio of up to 10–7, and 1 mL from the last two dilutions was inoculated onto MRS (De Man, Rogosa and Sharpe) agar media supplemented with 2% CaCO3 (ISO 15214:1998, [27]). Further, a second media layer was poured on the first one in order to create anaerobic conditions. The colonies of lactic acid bacteria were counted and expressed as CFU·g−1 [28].

2.6. Thermo-Mechanical Properties of the Dough

The effect of sorghum flour addition on the thermo-mechanical behavior of the quinoa-based dough was studied using Mixolab device (Chopin Technology, Villeneuve La Garenne, France). For each type of GF flour blend, further thermo-mechanical tests were performed on the dough samples prepared with 20% sourdough addition. In all cases, the Chopin+ protocol modified to increase the dough weight from 75 to 90 g was used. Water absorption values were established in order to obtain maximum dough torque during mixing at 30 °C (C1) of 1.10 ± 0.05. The Mixolab curves registered using the Mixolab software (version 4.1.2.10) [29] were used to collect the following parameters: time (tC1) required to reach C1; dough consistency after 8 min of mixing at 30 °C (C8) and dough stability after 8 min (S8); amplitude (width of curve to C1) (A); dough stability (S); protein weakening (C2), time (tC2) and temperature (TC2) required to obtain C2; protein-weakening range (C1–C2); maximum consistency during heating and kneading, as the result of starch gelatinization (C3), as well as the time (tC3) and temperature (TC3) required to obtain C3; minimum consistency while dough is still heating and kneading after starch gelatinization (C4) and time (tC4) required to obtain C4; final consistency during dough cooling at 50 °C (C5); starch gelatinization range (C3–C2) and cooling setback (C5–C4).

2.7. Bread Preparation

GF doughs were obtained by mixing well the following ingredients in a laboratory mixer (Philips HR 7915, Shanghai, China): 100 g of GF flour, 20 g of sourdough, water to reach the water absorption capacity indicated by the Mixolab tests, 2 g NaCl, 4 g compressed baker’s yeast, 2 g sugar and 3 mL sunflower oil. The dough was divided in two pieces, molded, placed in baking trays (5 × 8 × 14 cm) and further proofed for 150 h at 30 °C (POL-EKO, Aparatura Sp.J., Wodzislaw Slaski, Poland). The GF bread samples were baked in a preheated over at 180 °C for 30 min in a preheated electric oven (Electrolux, Stockholm, Sweden). The GF bread samples were stored at room temperature for 60 min prior to the physico-chemical characterization.

2.8. Bread Characterization

The specific volume of the GF bread was determined using the SR 91:2007 method [24].
The crumb texture was assessed by Guss FTA penetrometer (Guss, Strand, South Africa). A probe with Ø of 7.9 mm was selected to penetrate the GF bread slices for 25 mm, using a speed of 5 mm/s. Three different firmness measurements were obtained from each GF bread sample, using a trigger threshold force of 1.96 N.
The color of the bread samples was determined using the Hunter Lab method. The device used for color measurement was the Chroma Meter CR-410 Konika Minolta. Before color measurements, calibration was performed using a white plate. The L* values were registered as a measure of the brightness/darkness, a* to capture the existence of the red-green shades and b* for the yellow-blue range.
The TPC, DPPH-RSA and TEAC were assessed on the methanolic extracts in agreement with the procedures described by Banu et al. [26].
The sensory acceptance test of the GF sourdough breads was performed by a consumer panel consisting of 7 women and 3 men aged between 25 and 51 years. In agreement with the decision by the Dunarea de Jos University Ethics Commission no. 13/19 March 2025, the written informed consent of each participant to the study was collected prior to running the sensory analysis. The sensory acceptance test was carried out in a room with proper environmental control, and the panelists were instructed regarding the use of the sensory attributes of the GF sourdough breads during a pretest session. Before tasting different GF sourdough bread samples, the panelists were advised to clean their palate with water. The five-point hedonic scale (1—“dislike extremely” to 5—“like extremely”) was used to rate the appearance of the crust and crumb, aroma, taste, texture and overall quality of the GF sourdough bread.

2.9. Statistical Analysis

The Minitab v19 (Minitab Inc., State College, PA, USA) software was used for statistical analysis of the experimental results. All measurements were performed at least in duplicate, and the results are presented as mean values together with standard deviation. In order to discriminate the significant differences between samples prepared with different flour blends or different starter cultures, the one-way ANOVA method, at 0.05 significance level, and post hoc analysis via Tukey test, at 95% confidence, were employed.

3. Results

3.1. Proximate Composition of the Gluten-Free Flours

The proximate composition of the quinoa and sorghum flours is presented in Table 1. Quinoa flour has significantly higher contents of proteins, fats and ash compared to sorghum (p < 0.05). The protein content of both investigated flours is lower compared to those reported by Martinez et al. [30] who found protein contents of 18.76 g/100 g d.w. and 12.94 g/100 g d.w. for the quinoa and sorghum flour, respectively. Quinoa is recognized as an excellent source of high-quality proteins which include all essential amino acids, whereas sorghum has low quality proteins, with lysine, tryptophan and threonine as limiting amino acids [30]. The two GF flours balance each other in terms of protein quality; therefore, the flour bends are very appealing not only because of the agronomic and low-cost properties, but also in terms of nutritional properties [30]. Our results regarding the lipids and ash content of the quinoa and sorghum flour are in good agreement with those reported by Martinez et al. [30] and Schoenlechner et al. [31].

3.2. Sourdough Properties

At the end of 20 h of sourdough fermentation at 30 °C, the number of lactic acid bacteria was evaluated to be between 1.45 ± 0.04 × 10⁸ for Q50 SC2 and 1.16 ± 0.04 × 10⁹ in the case of the Q75 SC1 sample. The increase in lactic acid bacteria concentration was 2–3 log CFU·g−1, regardless of the ratio between quinoa and sorghum flours. The bacteria from both starter cultures (SC1 and SC2) were able to adapt and grow in the GF flour-based media due to their capacity to degrade and metabolize the carbohydrates existing in the quinoa and sorghum flours. The highest bacterial counts were registered in the case of the G75 (Table 2), suggesting that, in lower quantities, the compounds from the sorghum flour stimulated the bacterial cell growth. Our results are in agreement with those of Rizzello et al. [32] who reported the density of lactic acid bacteria of 9.3–9.7 log CFU·g−1 for the quinoa sourdough. Similarly, Cizeikiene et al. [33] reported that after the fermentation of quinoa–water media inoculated with 0.2% from the overnight monoculture (which was at 1.3–2.7 × 10⁹ CFU/mL), the concentration of L. brevis increases to (8.05 ± 0.1) × 109 CFU/g while L. acidophilus reached (3.2 ± 0.1) × 1010 CFU/g, respectively [33]. Moreover, it was stated that the lactic acid bacteria can enhance their fitness by switching from fermentation to respiration metabolism, resulting in a consistent biomass yield and long-term survivability [34,35] under specific growth conditions, such as the presence of oxygen or specific growth-promoting factors.
Regarding the control sourdoughs (C), the growth of the native microbial flora from the flours used for preparing the spontaneously fermented samples was not supported on the MRS media (Table 2). Indeed, Vera et al. [36] compared different available cultivation media, including MRS, used for lactic acid bacteria enumeration and reported that the efficiency in providing quantitative information on the complex sourdough ecosystem is limited.
The metabolic profile of the sourdough samples was determined after 20 h of fermentation at 30 °C by measuring the pH and quantifying the TTA and the main metabolites produced by homo- and heterofermentative lactic acid bacteria. Analyzing the results presented in Table 3 one can observe that the use of starter culture for preparing the sourdough resulted in significantly higher values of the TTA compared to the corresponding spontaneously fermented samples (p < 0.05). In particular, for all tested GF flour blends, SC1 allowed us to obtain the highest TTA values, ranging from 9.74 to 11.57 mL NaOH 0.1N/10 g, and the lowest pH values in the 4.408–4.454 range (Table 3). Regardless of the starter culture used for fermentation, the increase in the addition of sorghum flour to quinoa four caused a significant increase in the TTA values (p < 0.05). These results might be explained by the stimulation of the growth and biochemical activity of the sourdough microflora with the changes occurring in the available nutrients when increasing the sorghum levels. Moreover, the presence of the phytic acid which presents a buffering capacity should also be factored in [37].
The contents of lactic acid, acetic acid and ethanol, which are the main end products released by the lactic acid bacteria in the sourdough during fermentation, were further quantified, and the results are presented in Table 3. In agreement with the observations of Banu et al. [38], lactic acid is the main metabolite found in the sourdough (Table 3), as the homofermentative lactic acid bacteria ensure the conversion of over 85% of hexoses into lactic acid, whereas in the case of the heterofermentative strains, the lactic acid biosynthesis accounts for 50% of the metabolized carbohydrates, in addition to the acetic acid, ethanol and CO2. In the case of the spontaneously fermented sourdough, the start and course of the fermentation highly depend on the microbial load of the flour, in addition to the availability of the nutrients. De Vuyst et al. [19] mentioned that the nonspecific autochthones bacteria, consisting of proteobacteria, staphylococci and complex mixtures of enterococci, lactococci and streptococci, are responsible for initiating the fermentation, causing the fast acidification of the sourdough. The significantly higher amounts of acetic acid found in the control sourdough samples with respect to the SC1 and SC2 fermented sourdoughs might also be due to the occurrence of acetic acid bacteria in the GF flour microbiota [19].
The diverse sourdough microbiota also includes yeasts, which are able to convert the mono- and disaccharides from flour into ethanol and CO2, generating important amounts of NAD+ cofactors and ATP [19]. The glycerol found in the sourdough is also the result of yeast-assisted fermentation and influences the bread dough behavior through the osmoprotectant role and involvement in CO2 retention [19,39]. Acetic acid is well known for antibacterial and antifungal activity, and moderate levels of acetic acid have an important contribution to the sour taste and the specific flavor of sourdough bread [34,40].
The use of the starter cultures to initiate sourdough fermentation created a more stressful environment for the microorganisms originating from the GF flours. The selected fermentation conditions ensured better adaptation and growth of the lactic acid bacteria from SC1 and SC2, resulting in important changes in the main metabolism products found in the sourdough (Table 3). SC1 consists of a mixture of two facultative heterofermentative lactic acid bacteria, namely Lacticaseibacillus rhamnosus and Lactiplantibacillus plantarum, and the obligately heterofermentative strain of Levilactobacillus brevis, which are able to both hexoses and pentoses. In addition to lactic acid, ethanol and acetic acid are produced from acetyl-P via the phosphoketolase pathway in the heterofermentative metabolism of hexoses and pentoses, respectively [34]. Glycerol might be as well used as a substrate for producing acetic acid.
SC2 includes a mixture of two homofermentative, microaerophilic lactic acid bacteria, namely Lactobacillus acidophilus and Streptococcus thermophilus and the heterofermentative Bifidobacterium lactis strain. In the case of the SC2 fermented sourdough samples, the homolactic metabolisms of both hexoses and pentoses resulted in highest amounts of lactic acid (p < 0.05), regardless of the GF flour blends. Lactic acid is the main product of homolactic metabolisms under both anaerobic and aerobic conditions [34]. Additionally, the respiration conditions may cause a shift in the metabolisms of homofermentative lactic acid bacteria towards additional major metabolites, such as acetate and acetoin [34]. No aeration was ensured during sourdough fermentation to support the lactic acid bacteria respiration over the entire incubation period. Therefore, in the case of Lactobacillus acidophilus and Streptococcus thermophilus, the lactic acid was the main end product of the homofermentative metabolism, of both hexoses and pentoses, via the Emden–Meyerhoff and pentose phosphate pathway, respectively. The presence of ethanol and acetic acid in the SC2-fermented sourdough samples is the result of the heterofermentative metabolism of carbohydrates via the phosphoketolase pathway by Bifidobacterium lactis and the presence of native microbial flora in the GF flours.
The TPC and antioxidant activity of the sourdough samples are summarized in Table 4. Regardless of the starter culture used for preparing the sourdough, the TPC decreased with the increase in the sorghum flour addition (p < 0.05). These results were expected considering that the TPC of quinoa and sorghum flours used in the experiment were 2.04 ± 0.02 and 1.08 ± 0.01 mg ferulic acid/g d.w., respectively. A similar decreasing trend was observed for the DPPH-RSA, which is mainly due to the phenolic compounds found in the samples [41]. On the other hand, the ABTS-RSA significantly increased (p < 0.05) with sorghum level (Table 4), suggesting the larger participation of the compounds originating from sorghum flour to the reduction mechanisms of the ABTS·+ by the electron transfer of an antioxidant. Both lipophilic and hydrophilic antioxidants are quantified through ABTS-RSA [41]. In the case of all tested GF flours, the use of the starter culture for initiating the sourdough fermentation favored the release of the TPC, resulting in significant improvement of the DPPH-RSA values (p < 0.05) compared to the corresponding spontaneously fermented samples (Table 4). The intense lactic fermentation might facilitate the extraction of different bioactive compounds from the GF flour. Moreover, the bioactive compounds biosynthesized by lactic acid bacteria during sourdough fermentation might contribute to the radicals scavenging protentional of the samples [26]. The highest values of DPPH-RSA were obtained in the case of the sourdough samples fermented with SC 1.

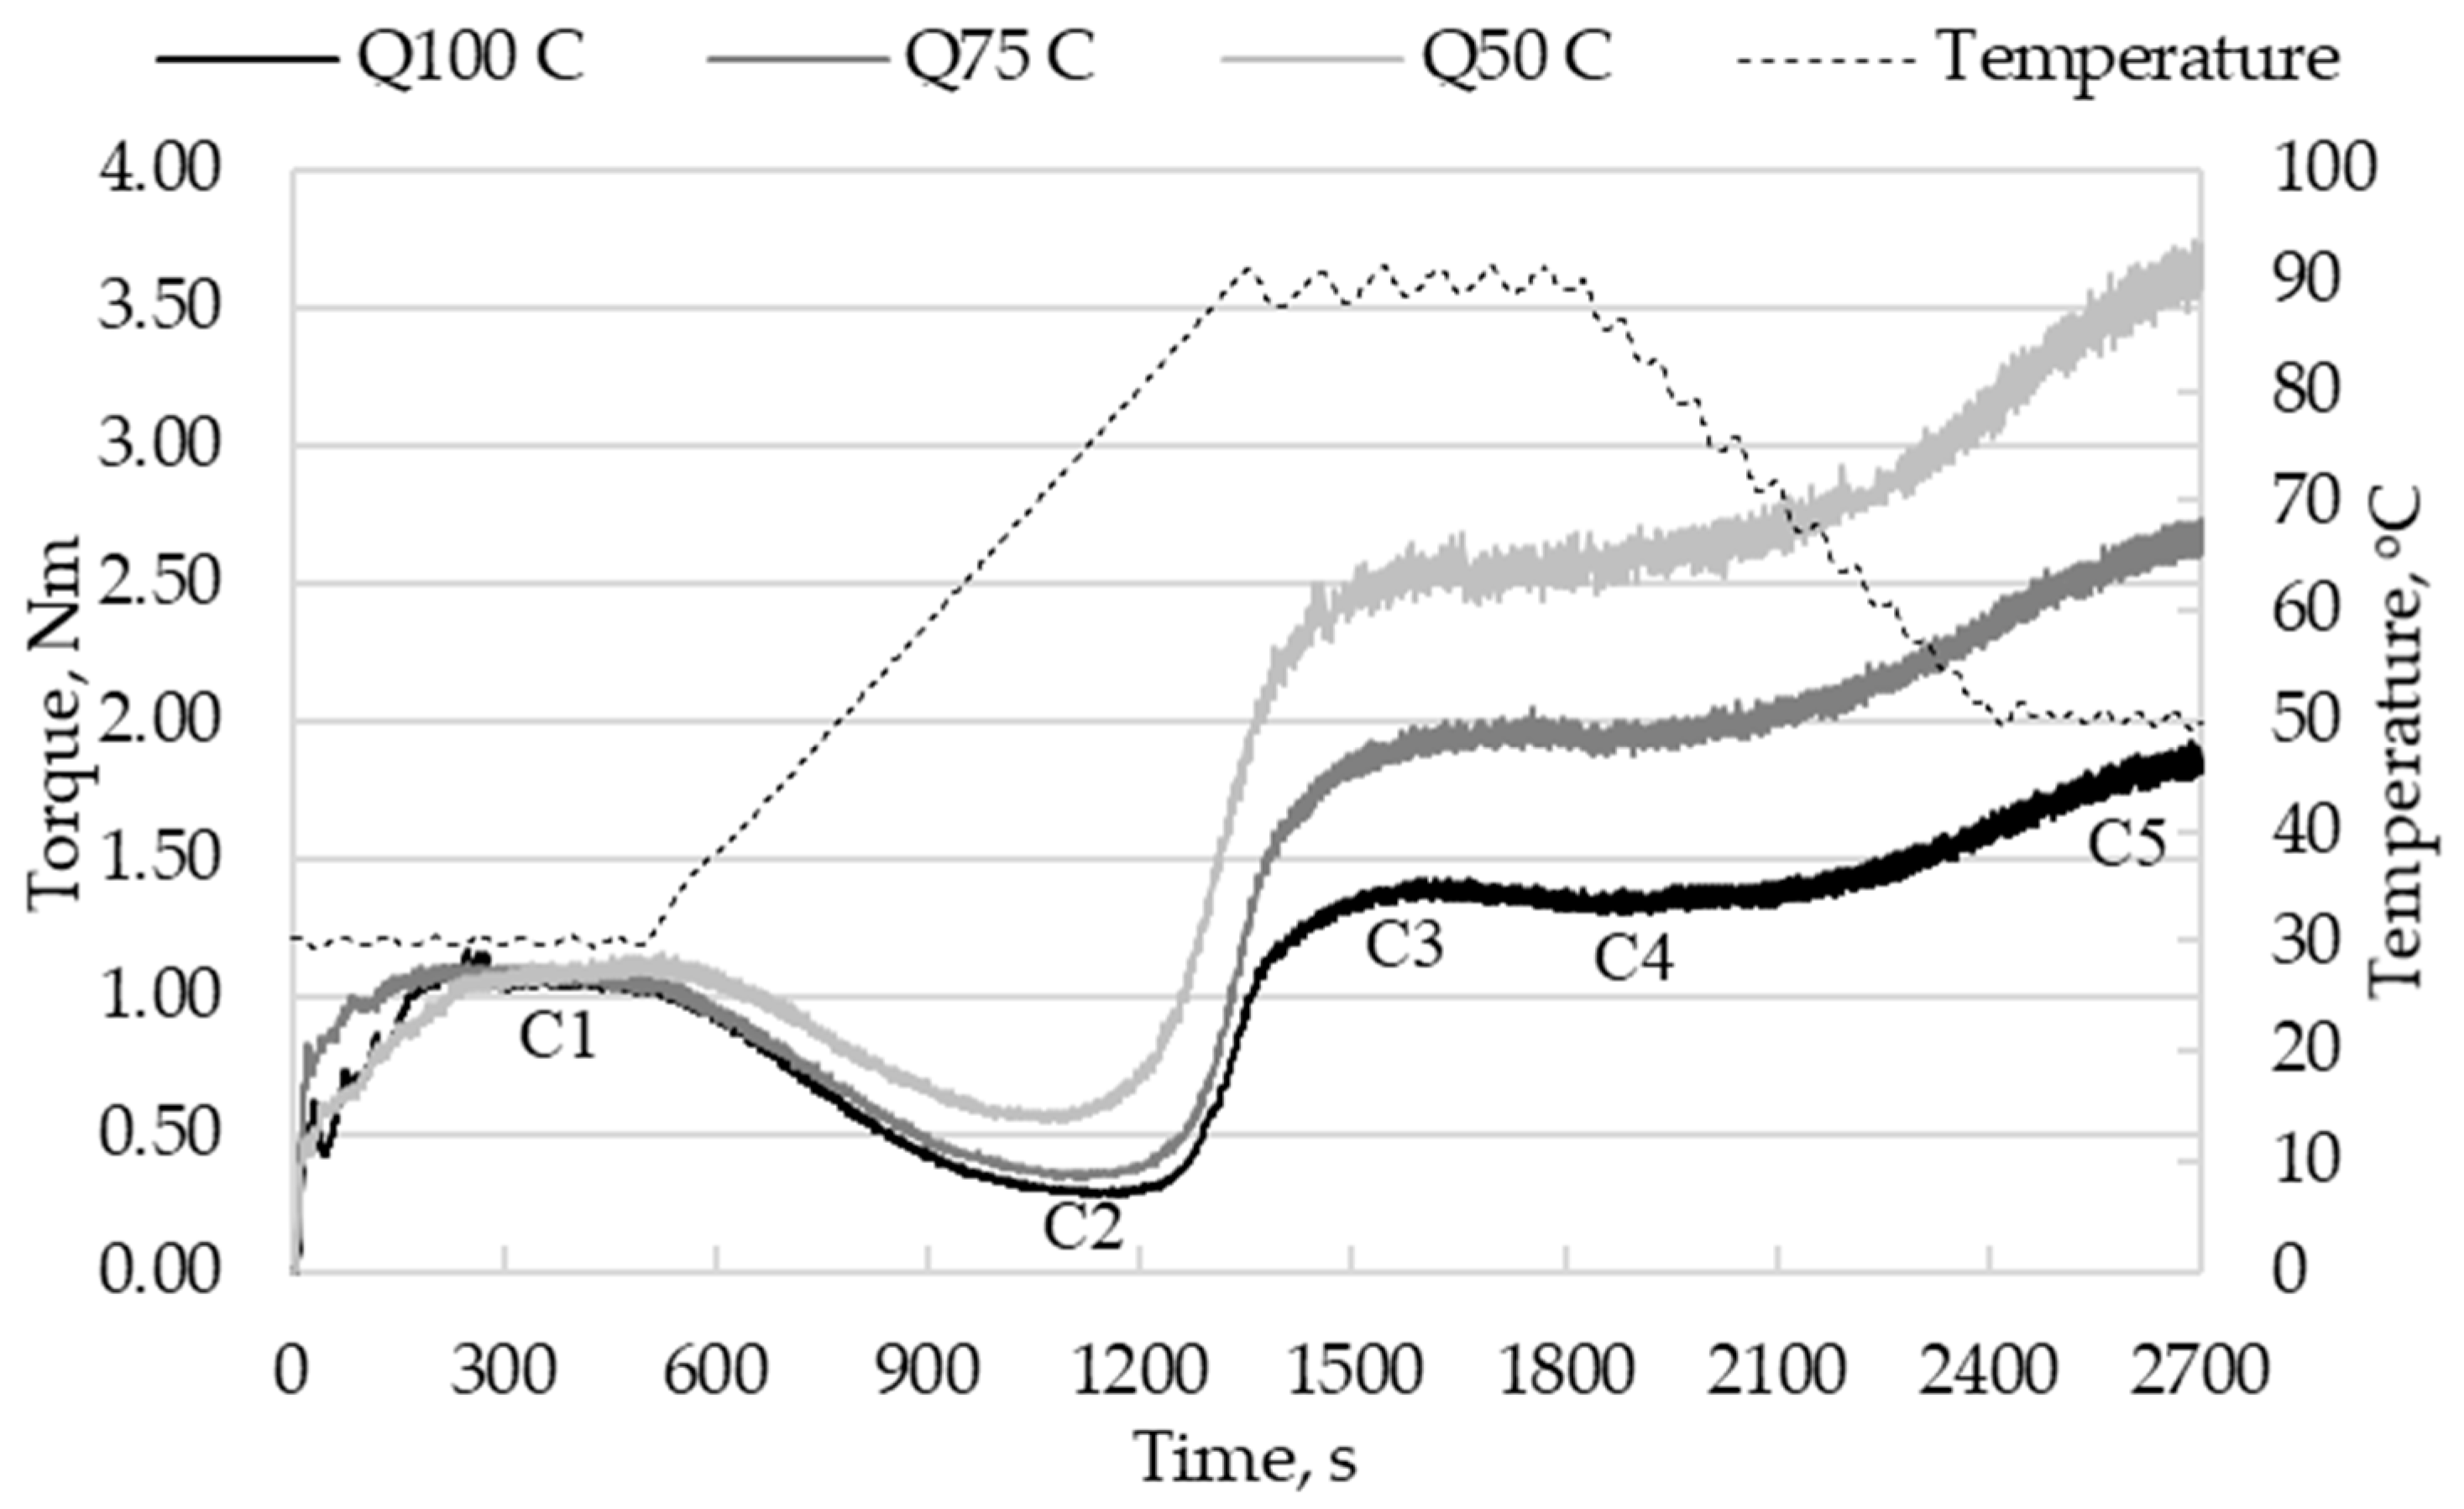
3.3. Thermo-Mechanical Behavior of the Gluten-Free Dough

3.3.1. Effect of Sorghum Flour Addition on Thermo-Mechanical Properties of Quinoa Flour

The Mixolab curves obtained when testing the effect of sorghum flour addition on the thermo-mechanical behavior of quinoa flour are presented in Figure 1. The particular Mixolab parameters that describe the curves are indicated in Table 5, Table 6, Table 7 and Table 8.
Maximum C1 consistency during mixing at 30 °C was obtained for the dough prepared with quinoa flour (Q100) at WA of 56.9%. The addition of increasing sorghum flour levels to the quinoa flour resulted in the decrease in WA required to obtain C1 of 1.10 ± 0.05 Nm to 52 and 51% for Q75 and Q50, respectively. Apostol et al. [42] reported similar behavior in the case of wheat flour substitution with sorghum flour, when WA changed from 52.8% to 54.7 and 52.7% with the addition of sorghum flour to 30 and 40%, respectively. It is known that proteins have an important role in the water absorption of the flour. Sorghum has a lower protein content (9.50 g/100 g d.w.) compared to quinoa (15.83 g/100 g d.w.) (Table 1). The sorghum proteins mainly consist of karfirine, cross-linked karfirine, albumins, globulins and glutelins [43], of which the karfirine fractions are highly hydrophobic [44]. On the other hand, quinoa contains chenopodine made of subunits of 49 and 57 kDa linked by disulfide bonds, with the 49 kDa subunit being the principal component [45].
Ognean [46] studied the effect of sorghum flour addition on wheat flour and noted that the increase in the addition level from 10 to 40% improved dough stability and increased development time. He mentioned that the particle size of sorghum flour played an important role in the dough’s behavior. In our study, the time required to obtain C1 significantly increased with sorghum flour addition (p < 0.05) (Table 5). A possible explanation for this increase can be the significantly higher fiber content (p < 0.05) of the sorghum flour (Table 1), as these compounds need more time to bind to the available water from the system [47]. Moreover, the content and functionality of proteins from sorghum flour are inferior to those from quinoa flour.
When compared to sorghum-based flour (Q100), dough stability did not change in the case of Q75 but significantly decreased in the case of the Q50 sample (p < 0.05). A reversed trend was observed for dough consistency and dough stability after 8 min of mixing at 30 °C. The C8 torque values registered for Q100 and Q75 were 0.05–0.06 Nm lower than that for C1, but no torque variation was noticed in the case of the dough with 50% sorghum flour. Dough stability at 8 min significantly increased from 5.9 to 7.1 min (p < 0.05) with the sorghum flour addition (Table 5).
The amplitude significantly increased from 0.042 Nm to 0.056 Nm (p < 0.05) (Table 5), suggesting an improvement in dough elasticity with the increase in sorghum flour addition from 0 to 50%. Apostol et al. [42] assigned the amplitude increase, when studying the effect of wheat flour substitution by 10–40% sorghum flour, to the higher content of lipids from sorghum flour compared to the wheat flour. In our study, the decrease in the lipid content in the GF flour blends, because of the lower lipid content of sorghum flour (3.38%) compared to the quinoa flour (6.58%) (Table 1), had a positive effect on the dough’s properties. The behavior observed in the case of our study can be explained by the changes in ratio between different types of compounds in the lipid composition of the flour blends. Nikolic et al. [48] reported that dough rheological behavior is influenced by the ratio between unsaturated and saturated lipids and by the content of free fatty acids, mono-, di- and triacylglycerols. The quinoa flour has 3.23% free lipids and only 0.28% bound lipids [49]. Out of the total lipids content, the free fatty acids represent 18.9%, polar lipids 25.2% and neutral lipids 55.9%, of which 73.7% are triglycerides, 20.5% diglycerides and 3.1% monoglycerides [50]. On the other hand, sorghum contains 2–4.1% bound lipids, and over 76% of the total fatty acids are unsaturated [51].
The increase in temperature from 30 to 55–62°C, combined with continuous mixing, causes important changes in the thermo-mechanical behavior of the dough. The 50% sorghum flour addition to quinoa flour resulted in a significant increase in C2 from 0.28 to 0.52 Nm (p < 0.05) (Table 6), suggesting higher dough resistance during mixing and heating. On the other hand, sorghum flour addition caused a significant reduction in the time needed to reach C2, from 18.85 to 16.87 min (p < 0.05), and an increase in the protein-weakening range (C1-C2), from 0.78 to 0.58 Nm (Table 6). The higher C2 values could be explained by the presence of a higher amount of fiber in the Q50 dough system originating from sorghum flour, but also by the changes occurring in the fiber composition. Vargas-Solorzano et al. [52] noted that the arabinoxylans from sorghum have an arabinose/xylose ratio of 0.9 and are strongly substituted with uronic acid, acetyl and feruloyl groups, which, according to Nandini and Salimath [53], leads to increased resistance of dough during the mechanical and thermal stress.
Further temperature increases, after reaching the C2 value, caused starch gelatinization. As a consequence, the GF doughs reached their maximum consistency at temperatures over 80 °C. The addition of increasing levels of sorghum flour resulted in a significant increase in the C3 value and the associated temperature (TC3) (p < 0.05), whereas the time needed to reach the maximum torque decreased significantly (p < 0.05) from 28.25 min in the case of Q100 to 25.25 min in the case of Q50 (Table 7). The starch gelatinization (C3-C2) increase was also observed in the case of the samples with a higher content of sorghum. The quinoa flour has a lower starch content compared to the sorghum flour. Moreover, the amylopectin of quinoa starch is mainly formed from short chains, which ensure lower temperature for peak gelatinization and slow retrogradation [54]. Li and Zhu [54] suggest that viscoamylographic properties are not only related to starch properties but also to its interactions with proteins, lipids, fiber and polyphenols during heating. Ahmed et al. [55] reported the peak starch gelatinization for quinoa flour (starch 68.67%, proteins 10.41%, lipids 6.43% and fiber 3.87%) after 7.4 min at 94.8 °C. On the other hand, Li and Zhu [54] compared seven samples of quinoa flours with various contents of starch (50.1–59.9%), proteins (11.7–14.6%), fibers (7.7–15%) and lipids (3.2–6.93%), and reported that the time needed for starch galvanization varied in the 12.5–17.5 min range, gelatinization temperature ranged from 73.4 °C to 79.3 °C and the peak gelatinization of starch ranged between 242 and 485 RVU.
Regarding the sorghum flour, Taylor et al. [56] indicate that the grain cultivation area can lead to large variations in terms of temperature of starch gelatinization, from 67–73°C (sorghum harvested in South Africa) to 71–81°C (sorghum harvested in India). In addition, we should also factor in that the thermal treatment applied to sorghum flour influences the gelatinization properties of the starch. As the temperature increases the starch, granules are prone to absorb the available water, resulting in a viscosity increase [57]. The peak viscosity and final viscosity after paste cooling may vary depending on the starch source and properties, explaining the increase in the C3 and C5 values through the substitution of quinoa flour with up to 50% sorghum flour (Table 7 and Table 8). Our results are in agreement with Schoenlechner et al. [31], who reported a lower value of the peak viscosity for quinoa flour compared to the sorghum flour, as well as the higher stability of paste during heating, higher final viscosity after paste cooling and lower setback.
A slight decrease in the torque values (from C3 to C4) was noticed while kneading the dough at a constant high temperature (Figure 1). This behavior is due to the amylase activity, which is favored in this phase of the Mixolab curve, as starch gelatinization is completed [58]. The results presented in Table 8 indicate that the addition of sorghum flour ensured a significantly faster (p < 0.05) torque decrease to C4 value, suggesting better susceptibility of gelatinized starch to hydrolysis by amylase [58]. Finally, the 50% sorghum flour addition to quinoa flour resulted in an increase in the C5 torque and cooling setback (C5–C4) (Table 8). Considering the significantly lower (C5–C4) values registered for Q100 and Q75, it can be assumed that these GF flours allow us to obtain baking products with a lower retrogradation rate in storage [59].

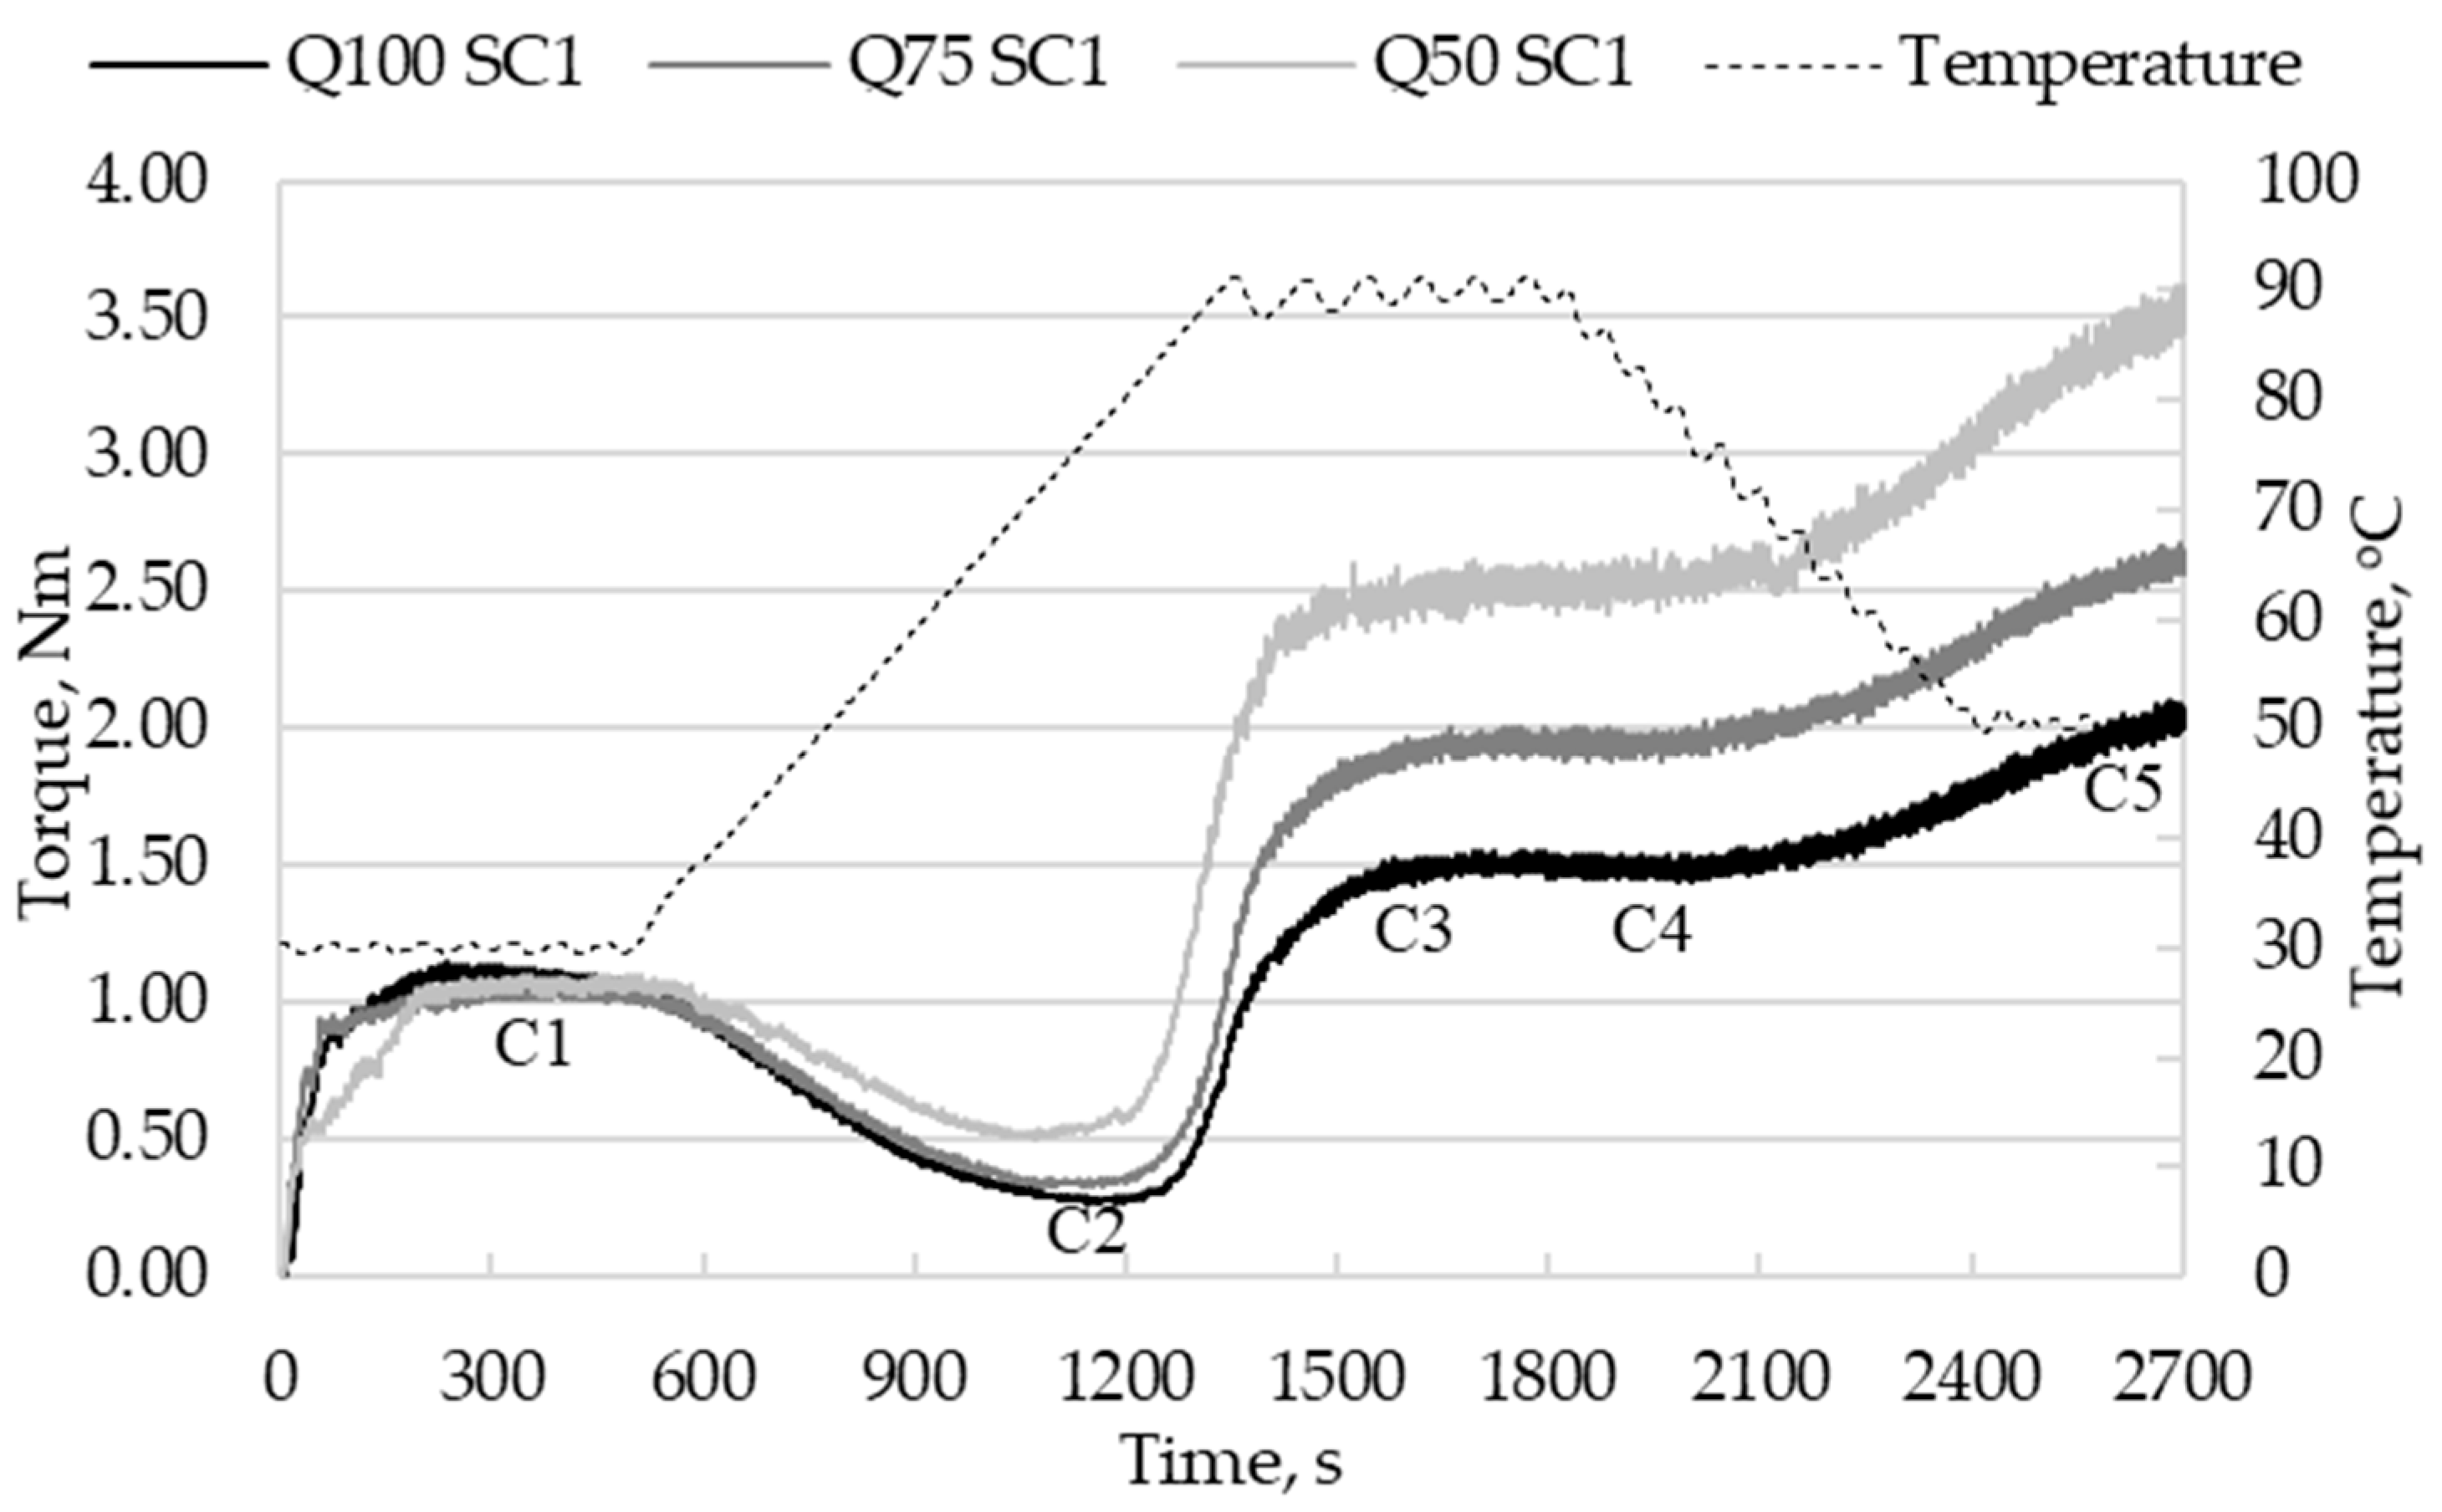
3.3.2. Effect of Sourdough Addition on Thermo-Mechanical Properties of Dough

The thermo-mechanical properties of dough prepared with various GF flour blends and supplemented with 20% sourdough are presented in Figure 2, Figure 3 and Figure 4. Analyzing the Mixolab parameters presented in Table 5, Table 6, Table 7 and Table 8, one can observe that the addition of sourdough to the GF dough samples caused important modifications to the thermo-mechanical properties including protein weakening, starch gelatinization and starch retrogradation. The WA values, decided when studying the effect of sorghum flour addition on the thermo-mechanical properties of quinoa flour, were selected for testing the influence of sourdough addition to the corresponding GF dough sample. Under these conditions, the C1 values registered for the sourdough-based samples were 1.10 ± 0.05 Nm, with an exception concerning the Q100 CS2 sample, in which case C1 was 1.16 Nm (Table 5). Dubat and Boinot [29] observed a slight increase in WA needed to obtain the C1 of 1.1 Nm in the case of the samples with sourdough addition, compared to the sample without sourdough addition.
The sourdough addition resulted in a decrease in Q100- and Q75-based dough stability (S) with respect to the samples with no sourdough addition. On the other hand, the stability increased in the case of the Q50-based samples supplemented with sourdough (Table 5), in agreement with the trend reported by Dubat and Boinot [29] regarding the stability of the wheat flour dough which increased upon sourdough. In addition, the S8 of the Q75- and Q50-based doughs increased significantly (p < 0.05) upon sourdough addition, with respect to the corresponding samples with no sourdough (Table 5). In the case of the whole quinoa flour doughs, the addition of the spontaneously and SC1 fermented sourdough resulted in no important modification, but a slight decrease in the S8 value was noticed for Q100 SC2 (Table 5).
The addition of sourdough resulted in the improvement of the elastic properties of the dough with the highest levels of sorghum flour. The amplitude of the Q100- and Q75-based dough improved significantly (p < 0.05) upon sourdough addition (Table 5). Li et al. [60] reported lower values for the δ angle parameter, which shows the viscoelastic properties of dough prepared with millet flour and sourdough fermented with different strains of lactic acid bacteria, compared to those obtained with yeasts. The authors assigned these results to the improvement of the elastic properties of the dough, which creates the premises to obtain high-quality baking products.
The sourdough addition resulted in no decrease in the minimum C2 torque, but the values were recorded at higher temperatures and after a longer mixing time with respect to the corresponding GF samples without sourdough addition. The only exception concerns the Q50 SC2 sample, in which case the C2 was registered at a significantly lower temperature (Table 6). The increase in the dough stability after 8 min, the delay in recording the C2 values and the TC2 increase in the case of the dough samples with a higher percentage of quinoa flour and sourdough might be due to the changes in the ratio between soluble and insoluble fibers. Rizzello et al. [32] investigated the sourdough from quinoa flour and reported an increase in the soluble fiber content simultaneously with a decrease of 35% of the insoluble fiber content, compared to the dough prepared from quinoa flour without sourdough.
On the other hand, higher (C1−C2) values were noticed for the dough samples with higher percentages of quinoa flour and sourdough (Table 6). This can be explained through the potential exopolysaccharide production, which ensures good proteolysis in the dough obtained using pseudocereals [61], with beneficial effects on the quality of bakery products. Valerio et al. [61] showed that even Lb plantarum, which does not produce exopolysaccharides on MRS-m, was able to biosynthesize and release exopolysaccharides in the sourdough from quinoa flour.
Dubat and Boinot [29] studied the effect of sourdough addition on the thermo-mechanical properties of wheat flour dough and noted that the main modification in the behavior of the dough appears during heating and cooling. In our study, except for the samples with higher levels of sorghum flour, the sourdough addition produced a delay in the C3 and C4 values (Table 6 and Table 7). Additionally, regardless of the sourdough, the C3 and C4 torque values increased with the amount of sorghum flour in the dough.
The retrogradation behavior of the starch was also mainly influenced by the level of sorghum flour, regardless of the sourdough addition. Thus, the C5 and (C5−C4) significantly increased (p < 0.05) with the sorghum flour addition (Table 8). The lowest (C5−C4) values of 0.51−0.54 Nm were registered for the Q100-based dough with sourdough addition. On the other hand, in the case of the sorghum-containing dough samples, the (C5−C4) values significantly increased (p < 0.05) with the sourdough addition (Table 8). Dubat and Boinot [29] reported an increase in the C4 and C5, from 1.68 to 2.27 Nm and from 2.51 to 3.45 Nm, respectively, while C3 varied within small limits, between 1.97 and 2.02 Nm, for wheat flour dough with sourdough addition. Similar results were obtained by Li et al. [60] on the millet dough properties prepared with different strains of lactic acid bacteria. Thus, authors reported higher C3, C4, C5 and (C5−C4) values of the millet dough fermented with lactic acid bacteria compared to the dough fermented with yeasts. Moreover, Li et al. [60] observed important variations in those parameters depending on lactic acid bacteria strains used for preparing the sourdough. Thus, sourdough fermented with Lb acidophilus had C3, C4 and C5 values much higher compared to the sourdough prepared with Lb rhamnosus and Lb plantarum, while (C5−C4) was much lower. On the other hand, Lb plantarum led to a dough with the highest (C5−C4) value and the lowest C4 value, whereas the C3 and C5 values were closer to Lb rhamnosus. Schoenlechner et al. [31] studied the baking properties of quinoa and sorghum flours supplemented with sourdough and noted that although viscoamylographic properties of quinoa flour are superior to the sorghum flour, both pseudocereals are suitable to increase the shelf life of the bread. Moreover, the authors observed that, although the sourdough sorghum bread had higher initial crumb firmness compared to quinoa bread, the crumb firmness of both bread samples doubled after 7 days. The high shelf life of sourdough breads can be explained by the presence of important concentrations of compounds with antimicrobial activity, such as phenolic compounds, formed during sourdough fermentation [62].

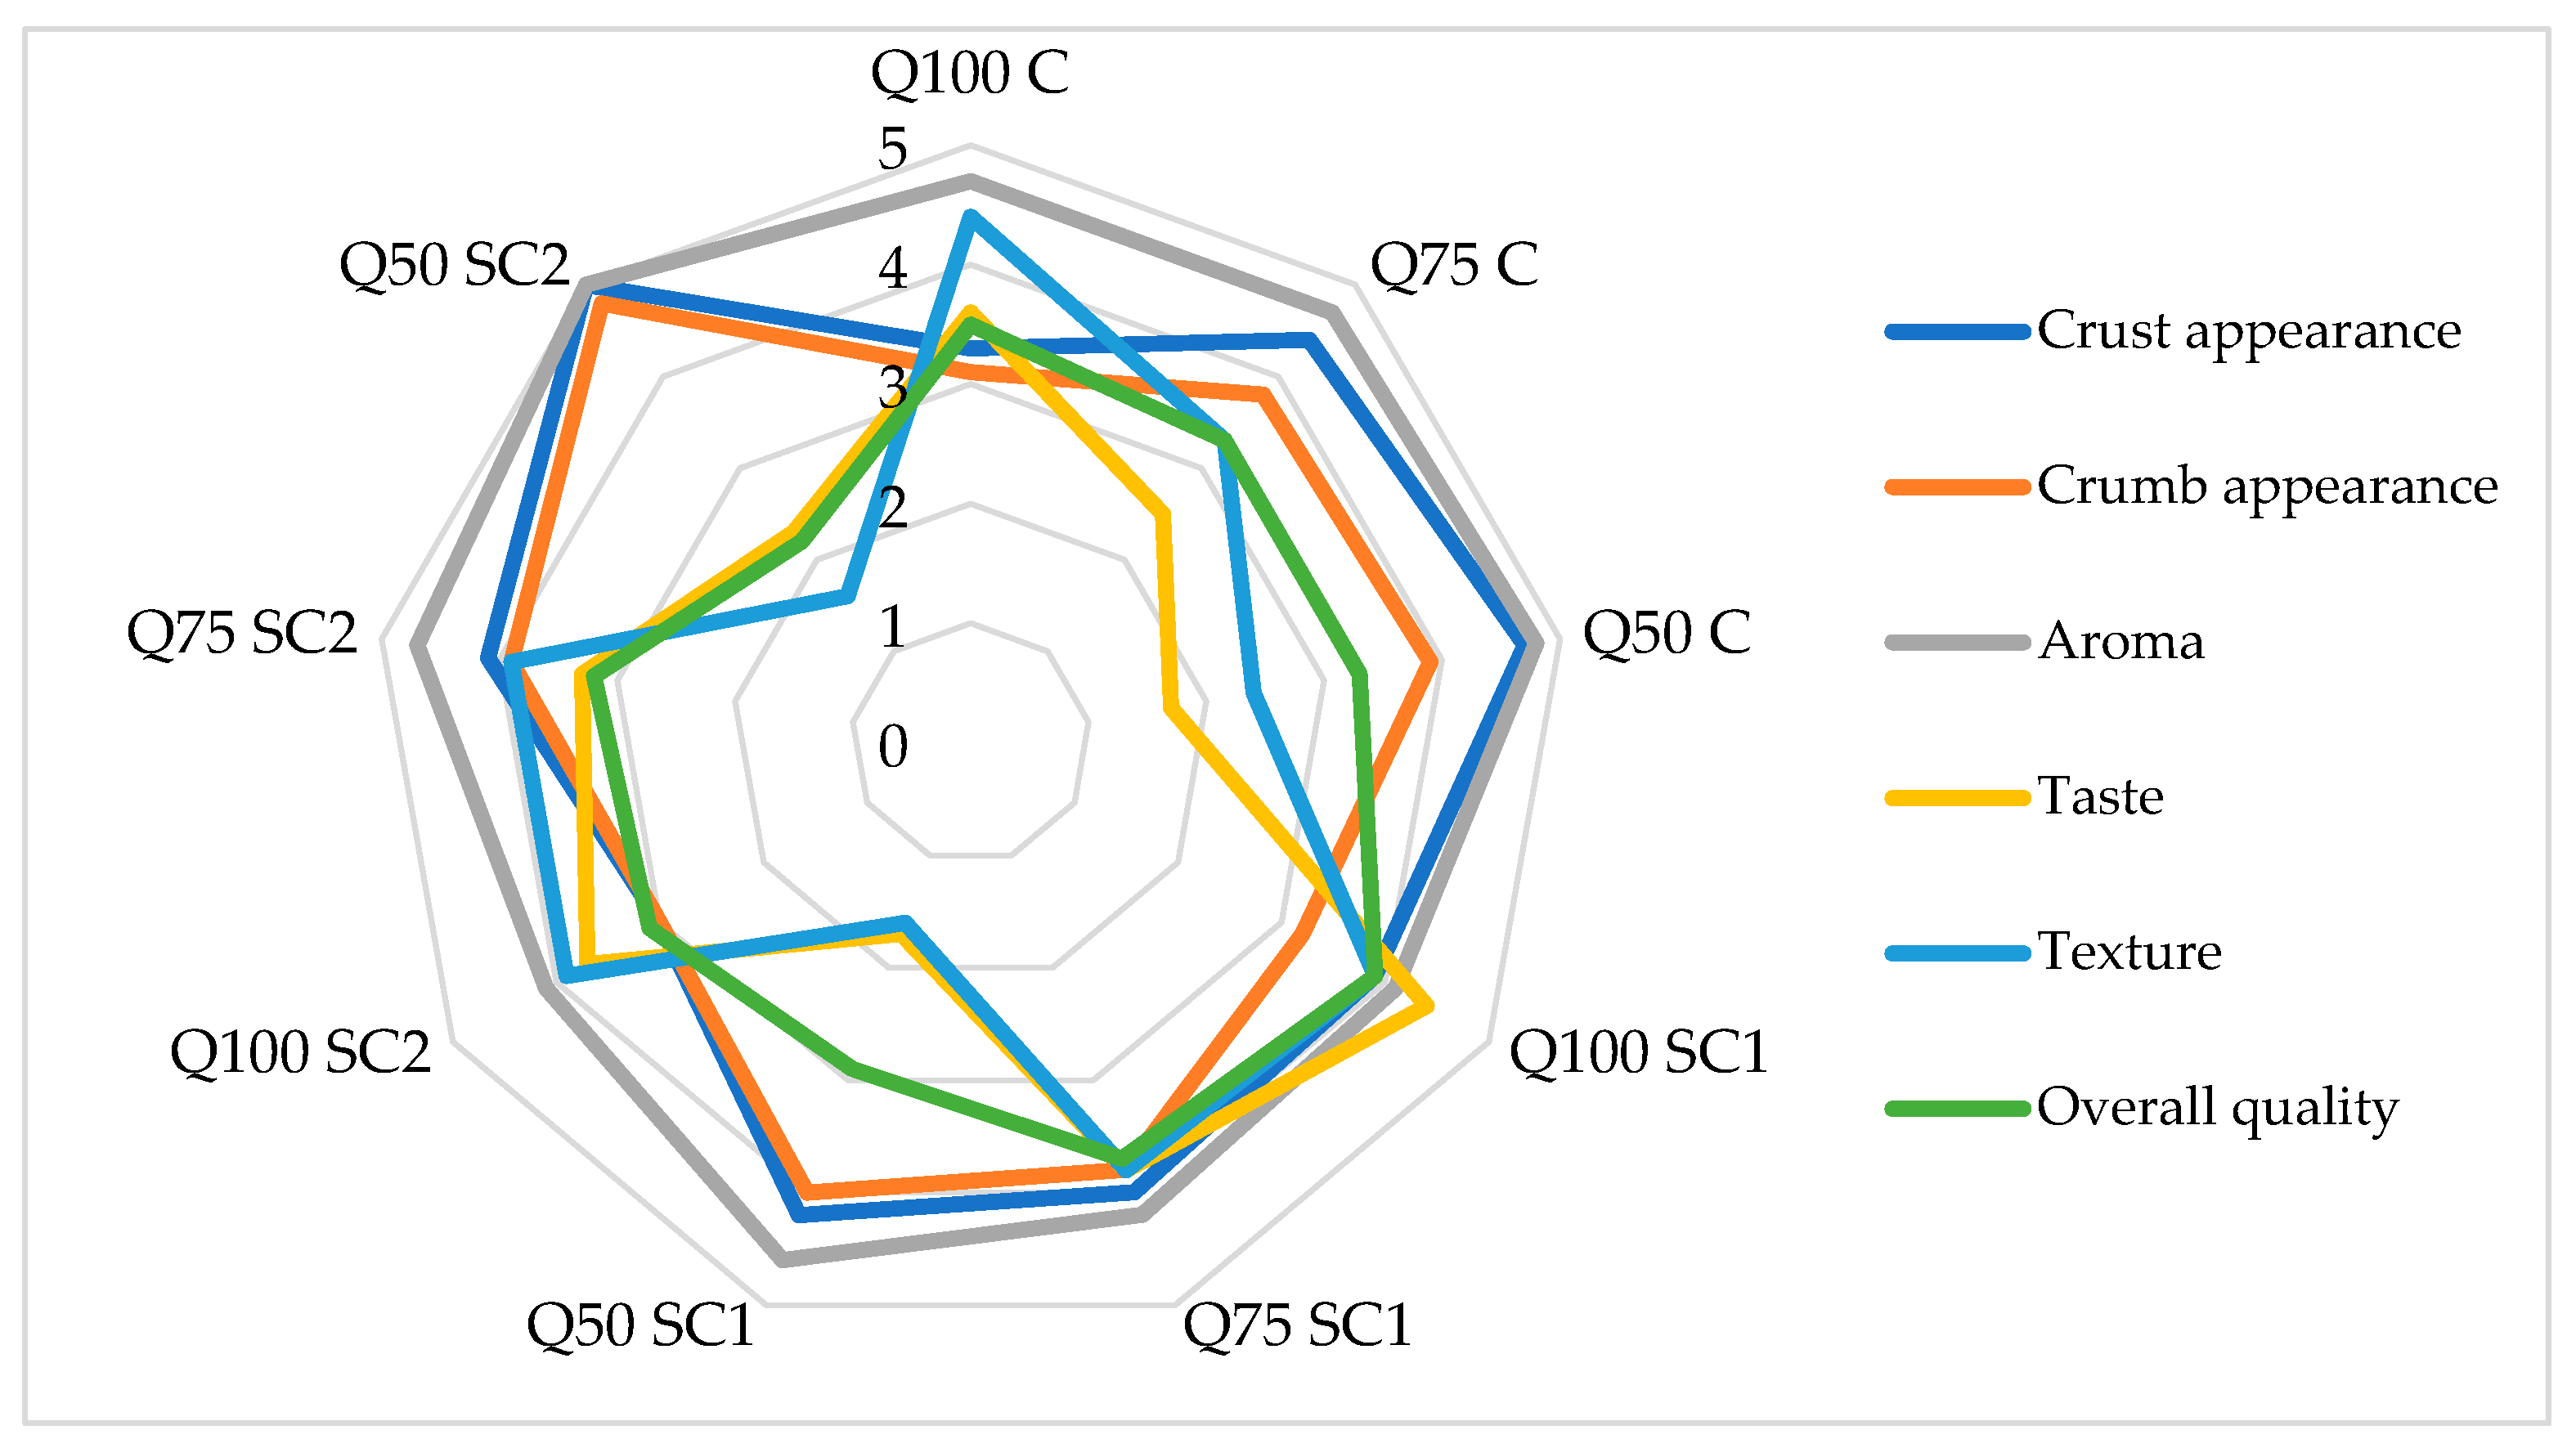
3.4. Bread Properties

Sourdough is a key ingredient used for preparing high-quality baked products with various types of flour. The sourdough based on blends of quinoa and sorghum flours was used for preparing GF sourdough bread samples, which were characterized in terms of moisture (Table 9), TPC, antioxidant activity (Table 4), specific volume, color and texture properties (Table 10).
The moisture of the bread crumb was measured after cooling the samples to room temperature (1st day) and after 48 h of storage (3rd day), while packed in polyethylene bags. In the 1st day, the crumb moisture ranged between 35.80 and 43.22 g/100g and decreased to 34.48−41.38 g/100g in the 3rd day (Table 9) because of the moisture migration to the crust [63]. All GF sourdough bread presented rather low moisture content and might, therefore, exhibit good stability over storage.
In agreement with the observations of Banu et al. [26], a slight decrease in the TPC and antioxidant activity of the GF bread was noticed compared to the corresponding sourdough samples (Table 4). Regardless of the starter culture used for preparing the sourdough, the highest TPC (p < 0.05) were measured for the Q75-based bread samples. The radical scavenging activity of the GF sourdough bread samples was not significantly influenced by the GF flour blend or the type of starter culture (Table 4). The only exception concerned the Q100 C and Q75 C bread samples, which exhibited the lowest ABTS-RSA of 165.79 µmols TE/g d.w. and DPPH-RSA of 241.10 µmols TE/g d.w., respectively.
Sorghum flour addition to quinoa flour had no significant influence on the specific volume of the sourdough bread (Table 10). As previously reported by Elgeti et al. [64], the dough prepared with quinoa flour has a good ability to retain the gas formed during fermentation. In addition to the proteins originating from flour or peptides released upon lactic acid bacteria action of the native proteins, other compounds like polar lipids from quinoa might participate in the stabilization of the gas in the dough network [41,64]. An improvement in the specific volume and crumb firmness has also been reported in the event of longer fermentation during which more gas is produced. In the case of the GF formulations including 100% and 75% quinoa flour, the lowest specific volumes of 97.1−100.0 cm3/g were obtained for the bread samples prepared with sourdough fermented with SC2 (Table 10). No significant differences in terms of specific volume were noted among the three different Q50-based bread samples. Except for the Q50 SC2 which presented the highest firmness of 32.79 N (p < 0.05), the texture of the GF sourdough bread samples was not significantly influenced by the amount of sorghum flour in the blend, or the type of starter culture used for initiating the fermentation (Table 10).
The increase in the sorghum level of the GF flour blends caused a significant increase in the L* values of the bread samples (p < 0.05). The positive values of the a* and b* parameters indicated the presence of red and yellow color in all investigated GF sourdough bread samples. The type of starter culture used for sourdough fermentation influenced in different manners the color properties of the GF bread. Except for the Q75-based bread, the intensity of the yellow shades of the bread increased (p < 0.05) with the use of starter culture for sourdough fermentation (Table 10). The presence of the red color in the sorghum-containing bread was not influenced by the starter culture used for sourdough fermentation.
The results of the sensory analysis of the GF sourdough bread are presented in Figure 5. Quinoa flour substitution with sorghum flour resulted in sourdough bread with significantly better odor and appearance of the crumb and crust. On the other hand, the GF sourdough bread with high levels of sorghum flour presented significantly lower scores for taste and texture (p < 0.05). The most pleasant taste was noticed in the case of the Q100 SC1 bread followed by Q75 SC1, which was characterized by a well-balanced combination of sweet and sour flavors. Regardless of the sourdough type, the Q50 bread presented a bitter taste and crumbly texture. Finally, the highest scores for overall quality were assigned to the Q100 SC1 and Q75 SC1 breads.

4. Conclusions

The quinoa–sorghum flour blends were used to prepare gluten-free sourdoughs through fermentation with two different mixed starter cultures, consisting of Lacticaseibacillus rhamnosus, Levilactobacillus brevis and Lactiplantibacillus plantarum, and Lactobacillus acidophilus, Bifidobacterium lactis and Streptococcus thermophilus. The sourdoughs fermented with a starter culture for sourdoughs presented higher glycerol and lactic acid contents and lower ethanol and acetic acid contents compared to the spontaneously fermented samples. The controlled sourdough fermentation ensured the increase in easily extractable phenolic compounds with radical scavenging activity. The empirical rheological measurements suggested that the proteins and starched behavior within the complex matrix of the gluten-free dough can be modulated through sourdough addition. The most important changes registered in the thermo-mechanical behavior of the gluten-free dough prepared with 20% sourdough were related to protein weakening, starch gelatinization and starch retrogradation. The gluten-free breads prepared with sourdough and fermented with a mixture of heterofermentative lactic acid bacteria presented the highest specific volumes, regardless of the sorghum level within the flour blend. Although higher levels of sorghum flour ensured a more pleasant aroma of the bread and a better appearance of the crumb and crust, the sensory analysis indicated that the quinoa flour-based gluten-free breads with no or low levels of sorghum flour and sourdough fermented with mixture of heterofermentative lactic acid bacteria were well accepted by the consumer. These results revealed that the sourdough can be successfully used for modulating the thermo-mechanical behavior of the gluten-free dough based on quinoa–sorghum flour blends and of the bread quality using the sourdough.

Author Contributions

Conceptualization, I.A. and I.B.; methodology, I.A., I.B. and L.G.-G.; software, I.A and I.B.; validation, I.V., L.G.-G. and I.A.; formal analysis, A.L.; investigation, A.L., I.V., I.B., L.G.-G. and I.A.; resources, I.A. and L.G.-G.; data curation, I.B. and L.G.-G.; writing—original draft preparation, A.L., I.V., I.B., L.G.-G. and I.A.; writing—review and editing, I.B., L.G.-G. and I.A.; visualization, L.G.-G.; supervision, A.L.; project administration, I.A.; funding acquisition, I.A. All authors have read and agreed to the published version of the manuscript.

Funding

This research received no external funding.

Institutional Review Board Statement

The study was conducted in accordance with the Declaration of Helsinki, and approved by the Ethics Committee of Dunarea de Jos University of Galati, Romania (protocol code 13, date of approval 19 March 2025).

Informed Consent Statement

Informed consent was obtained from all subjects involved in the study.

Data Availability Statement

The raw data supporting the conclusions of this article will be made available by the authors on request.

Acknowledgments

The Integrated Center for Research, Expertise and Technological Transfer in the Food Industry is acknowledged for providing technical support.

Conflicts of Interest

The authors declare no conflicts of interest.

References

  1. Matos, M.E.; Rosell, C.M. Understanding gluten-free dough for reaching breads with physical quality and nutritional balance. J. Sci. Food Agric. 2015, 95, 653–661. [Google Scholar] [CrossRef] [PubMed]
  2. Monteiro, J.S.; Farage, P.; Zandonadi, R.P.; Botelho, R.B.; de Oliveira, L.D.L.; Raposo, A.; Shakeel, F.; Alshehri, S.; Mahdi, W.A.; Araújo, W.M. A systematic review on gluten-free bread formulations using specific volume as a quality indicator. Foods 2021, 10, 614. [Google Scholar] [CrossRef] [PubMed]
  3. Demirkesen, I.; Kelkar, S.; Campanella, O.H.; Sumnu, G.; Sahin, S.; Okos, M. Characterization of structure of gluten-free breads by using X-ray microtomography. Food Hydrocoll. 2014, 36, 37–44. [Google Scholar] [CrossRef]
  4. Wang, K.; Lu, F.; Li, Z.; Zhao, L.; Han, C. Recent developments in gluten-free bread baking approaches: A review. Food Sci. Technol. 2017, 37 (Suppl. S1), 1–9. [Google Scholar] [CrossRef]
  5. Coronel, E.B.; Ixtaina, V.Y.; Capitani, M.I. Nutritional and Functional Characterization of Chia Expeller and Gluten-Free Flours as Ingredients for Premixes. Plant Foods Hum. Nutr. 2025, 80, 1–8. [Google Scholar]
  6. Khairuddin, M.A.N.; Lasekan, O. Gluten-free cereal products and beverages: A review of their health benefits in the last five years. Foods 2021, 10, 2523. [Google Scholar] [CrossRef]
  7. Boukid, F.; Folloni, S.; Sforza, S.; Vittadini, E.; Prandi, B. Current trends in ancient grains-based foodstuffs: Insights into nutritional aspects and technological applications. Compr. Rev. Food Sci. F. 2018, 17, 123–136. [Google Scholar] [CrossRef]
  8. Păucean, A.; Man, S.M.; Chiş, M.S.; Mureşan, V.; Pop, C.R.; Socaci, S.A.; Muresan, C.C.; Muste, S. Use of pseudocereals preferment made with aromatic yeast strains for enhancing wheat bread quality. Foods 2019, 8, 443. [Google Scholar] [CrossRef]
  9. Gewehr, M.F.; Pagno, C.H.; Danelli, D.; Melo, L.M.D.; Flôres, S.H.; Jong, E.V.D. Evaluation of the functionality of bread loaves prepared with quinoa flakes through biological tests. Braz. J. Pharm. Sci. 2016, 52, 337–346. [Google Scholar] [CrossRef]
  10. El-Sohaimy, S.A.; Shehata, M.G.; Mehany, T.; Zeitoun, M.A. Nutritional, physicochemical, and sensorial evaluation of flat bread supplemented with quinoa flour. Int. J. Food Sci. 2019, 2019, 4686727. [Google Scholar] [CrossRef]
  11. Lamothe, L.M.; Srichuwong, S.; Reuhs, B.L.; Hamaker, B.R. Quinoa (Chenopodium quinoa W.) and amaranth (Amaranthus caudatus L.) provide dietary fibres high in pectic substances and xyloglucans. Food Chem. 2015, 167, 490–496. [Google Scholar] [CrossRef]
  12. Turkut, G.M.; Cakmak, H.; Kumcuoglu, S.; Tavman, S. Effect of quinoa flour on gluten-free bread batter rheology and bread quality. J. Cereal Sci. 2016, 69, 174–181. [Google Scholar] [CrossRef]
  13. Onyango, C.; Mutungi, C.; Unbehend, G.; Lindhauer, M.G. Modification of gluten-free sorghum batter and bread using maize, potato, cassava or rice starch. LWT-Food Sci. Technol. 2011, 44, 681–686. [Google Scholar] [CrossRef]
  14. Campo, E.; Del Arco, L.; Urtasun, L.; Oria, R.; Ferrer-Mairal, A. Impact of sourdough on sensory properties and consumers’ preference of gluten-free breads enriched with teff flour. J. Cereal Sci. 2016, 67, 75–82. [Google Scholar] [CrossRef]
  15. Gobbetti, M.; Rizzello, C.G.; Di Cagno, R.; De Angelis, M. How the sourdough may affect the functional features of leavened baked goods. Food Microbiol. 2014, 37, 30–40. [Google Scholar] [CrossRef] [PubMed]
  16. Weckx, S.; Van Kerrebroeck, S.; De Vuyst, L. Omics approaches to understand sourdough fermentation processes. Int. J. Food Microbiol. 2019, 302, 90–102. [Google Scholar] [CrossRef]
  17. Zhang, G.; Tu, J.; Sadiq, F.A.; Zhang, W.; Wang, W. Prevalence, Genetic Diversity, and Technological Functions of the Lactobacillus sanfranciscensis in Sourdough: A Review. Compr. Rev. Food Sci. Food Saf. 2019, 18, 1209–1226. [Google Scholar] [CrossRef]
  18. Gänzle, M.; Ripari, V. Composition and function of sourdough microbiota: From ecological theory to bread quality. Int. J. Food Microbiol. 2016, 239, 19–25. [Google Scholar] [CrossRef]
  19. De Vuyst, L.; Comasio, A.; Kerrebroeck, S.V. Sourdough production: Fermentation strategies, microbial ecology, and use of non-flour ingredients. Crit. Rev. Food Sci. Nutr. 2023, 63, 2447–2479. [Google Scholar] [CrossRef]
  20. Hansen, A. Sourdough Bread; Taylor and Francis Group: Boca Raton, FL, USA, 2006. [Google Scholar]
  21. De Vuyst, L.; Vancanneyt, M. Biodiversity and identification of sourdough lactic acid bacteria. Food Microbiol. 2007, 24, 120–127. [Google Scholar] [CrossRef]
  22. Fernández-Peláez, J.; Paesani, C.; Gómez, M. Sourdough technology as a tool for the development of healthier grain-based products: An update. Agronomy 2020, 10, 1962. [Google Scholar] [CrossRef]
  23. Torrieri, E.; Pepe, O.; Ventorino, V.; Masi, P.; Cavella, S. Effect of sourdough at different concentrations on quality and shelf life of bread. LWT-Food Sci. Technol. 2014, 56, 508–516. [Google Scholar] [CrossRef]
  24. ASRO. Romanian Standards Catalog for Cereal and Milling Products Analysis; SR ISO 712:2005, SR 90:2007, SR 91:2007 and SR ISO 2171/2002 and SR EN ISO 20483:2007; ASRO: Bucharest, Romania, 2008. [Google Scholar]
  25. Banu, I.; Aprodu, I. Investigations on functional and thermo-mechanical properties of gluten free cereal and pseudocereal flours. Foods 2022, 11, 1857. [Google Scholar] [CrossRef] [PubMed]
  26. Banu, I.; Vasilean, I.; Aprodu, I. Effect of lactic fermentation on antioxidant capacity of rye sourdough and bread. Food Sci. Technol. Res. 2010, 16, 571–576. [Google Scholar] [CrossRef]
  27. ISO 15214:1998; Microbiology of Food and Animal Feeding Stuffs—Horizontal Method for the Enumeration of Mesophilic Lactic Acid Bacteria—Colony-Count Technique at 30 Degrees C. International Organization for Standardization: Genève, Switzerland, 1998.
  28. Savitri, M.; Kumar, V.; Kumari, A.; Angmo, K.; Bhalla, T.C. Isolation and characterization of lactic acid bacteria from traditional pickles of Himachal Pradesh, India. J. Food. Sci. Technol. 2017, 54, 1945–1952. [Google Scholar]
  29. Dubat, A.; Boinot, N. Mixolab Applications Handbook. Rheological and Enzymes Analyses; Chopin Technology: Villenueve, France, 2012; pp. 14–126. [Google Scholar]
  30. Martinez, O.D.M.; Toledo, R.C.L.; Queiroz, V.A.V.; Pirozi, M.R.; Martino, H.S.D.; de Barros, F.A.R. Mixed sorghum and quinoa flour improves protein quality and increases antioxidant capacity in vivo. LWT-Food Sci. Technol. 2020, 129, 109597. [Google Scholar] [CrossRef]
  31. Schoenlechner, R.; Bender, D.; D’Amico, S.; Kinner, M.; Tomoskozi, S.; Yamsaengsung, R. Dry Fractionation and Gluten-Free Sourdough Bread Baking from Quinoa and Sorghum. Foods 2023, 12, 3125. [Google Scholar] [CrossRef]
  32. Rizzello, C.G.; Lorusso, A.; Montemurro, M.; Gobbetti, M. Use of sourdough made with quinoa (Chenopodium quinoa) flour and autochthonous selected lactic acid bacteria for enhancing the nutritional, textural and sensory features of white bread. Food Microbiol. 2016, 56, 1–13. [Google Scholar] [CrossRef]
  33. Cizeikiene, D.; Gaide, I.; Basinskiene, L. Effect of lactic acid fermentation on quinoa characteristics and quality of quinoa-wheat composite bread. Foods 2021, 10, 171. [Google Scholar] [CrossRef]
  34. Gänzle, M.G. Lactic metabolism revisited: Metabolism of lactic acid bacteria in food fermentations and food spoilage. Curr. Opin. Food Sci. 2015, 2, 106–117. [Google Scholar] [CrossRef]
  35. Rezaïki, L.; Cesselin, B.; Yamamoto, Y.; Vido, K.; Van West, E.; Gaudu, P.; Gruss, A. Respiration metabolism reduces oxidative and acid stress to improve long-term survival of Lactococcus lactis. Mol. Microbiol. 2004, 53, 1331–1342. [Google Scholar] [CrossRef] [PubMed]
  36. Vera, A.; Rigobello, V.; Demarigny, Y. Comparative study of culture media used for sourdough lactobacilli. Food Microbiol. 2009, 26, 728–733. [Google Scholar] [CrossRef] [PubMed]
  37. Tanwar, R.; Panghal, A.; Chaudhary, G.; Kumari, A.; Chhikara, N. Nutritional, phytochemical and functional potential of sorghum: A review. Food Chem. Adv. 2023, 3, 100501. [Google Scholar] [CrossRef]
  38. Banu, I.; Vasilean, I.; Aprodu, I. Effect of select parameters of the sourdough rye fermentation on the activity of some mixed starter cultures. Food Biotechnol. 2011, 25, 275–291. [Google Scholar] [CrossRef]
  39. Aslankoohi, E.; Rezaei, M.N.; Vervoort, Y.; Courtin, C.M.; Verstrepen, K.J. Glycerol production by fermenting yeast cells is essential for optimal bread dough fermentation. PLoS ONE 2015, 10, 0119364. [Google Scholar] [CrossRef]
  40. Banu, I.; Aprodu, I. Studies concerning the use of Lactobacillus helveticus and Kluyveromyces marxianus for rye sourdough fermentation. Eur. Food Res. Technol. 2012, 234, 769–777. [Google Scholar] [CrossRef]
  41. Banu, I.; Aprodu, I. Assessing the performance of different grains in gluten-free bread applications. Appl. Sci. 2020, 10, 8772. [Google Scholar] [CrossRef]
  42. Apostol, L.; Belc, B.; Gaceu, L.; Oprea, O.B.; Popa, M.E. Sorghum Flour: A Valuable Ingredient for Bakery Industry? Appl. Sci. 2020, 10, 8597. [Google Scholar] [CrossRef]
  43. Hamaker, B.R.; Bugusu, B.A. Overview: Sorghum Proteins and Food Quality. In Proceedings of the Workshop on the Proteins of Sorghum and Millets: Enhancing Nutritional and Functional Properties for Africa, Pretoria, South Africa, 2–4 April 2003. [Google Scholar]
  44. Yousif, A.; Nhepera, D.; Johnson, S. Influence of sorghum flour addition on flat bread in vitro starch digestibility, antioxidant capacity and consumer acceptability. Food Chem. 2012, 134, 880–887. [Google Scholar] [CrossRef]
  45. Alonso-Miravalles, L.; O’Mahony, J.A. Composition, Protein Profile and Rheological Properties of Pseudocereal-Based Protein-Rich Ingredients. Foods 2018, 7, 73. [Google Scholar] [CrossRef]
  46. Ognean, C.-F. Technological and sensorial effects of sorghum addition at wheat bread. Agric. Food 2015, 3, 209–217. [Google Scholar]
  47. Torbica, A.; Hadnadev, M.; Dapcevic, T. Rheological, textural and sensory properties of gluten-free bread formulations based on rice and buckwheat flour. Food Hydrocol. 2010, 24, 626–632. [Google Scholar] [CrossRef]
  48. Nikolic, N.; Sakac, M.; Mastilovic, J. Effect of buckwheat flour addition to wheat flour on acylglycerols and fatty acids composition and rheology properties. LWT-Food Sci. Technol. 2011, 44, 650–655. [Google Scholar] [CrossRef]
  49. Collar, C.; Angioloni, A. Pseudocereals and teff in complex breadmaking matrices: Impact on lipid dynamics. J. Cereal Sci. 2014, 59, 145–154. [Google Scholar] [CrossRef]
  50. Przybylski, R.; Chauhan, G.S.; Eskin, N.A.M. Characterization of quinoa (Chenopodium quinoa) lipids. Food Chem. 1994, 51, 187–192. [Google Scholar] [CrossRef]
  51. Ragaee, S.; Abdel-Aal, E.-S.M.; Noaman, M. Antioxidant activity and nutrient composition of selected cereals for food use. Food Chem. 2006, 98, 32–38. [Google Scholar] [CrossRef]
  52. Vargas-Solorzano, J.W.; Carvalho, C.W.P.; Takeiti, C.Y.; Ascheri, J.L.R.; Queiroz, V.A.V. Physicochemical properties of expanded extrudates from colored sorghum genotypes. Food Res. Int. 2014, 55, 37–44. [Google Scholar] [CrossRef]
  53. Nandini, C.D.; Salimath, P.V. Structural features of arabinoxylans from sorghum having good rotimaking quality. Food Chem. 2001, 74, 417–422. [Google Scholar] [CrossRef]
  54. Li, G.; Zhu, F. Physicochemical properties of quinoa flour as affected by starch interactions. Food Chem. 2017, 221, 1560–1568. [Google Scholar] [CrossRef]
  55. Ahmed, J.; Thomas, L.; Ali Arfat, Y. Functional, rheological, microstructural and antioxidant properties of quinoa flour in dispersions as influenced by particle size. Food Res. Int. 2019, 116, 302–311. [Google Scholar] [CrossRef]
  56. Taylor, J.R.N.; Schober, T.J.; Bean, S.R. Novel food and non-food uses for sorghum and millets. J. Cereal Sci. 2006, 44, 252–271. [Google Scholar] [CrossRef]
  57. Marston, K.; Khouryieh, H.; Aramouni, F. Effect of heat treatment of sorghum flour on the functional properties of gluten-free bread and cake. LWT-Food Sci. Technol. 2016, 65, 637–644. [Google Scholar] [CrossRef]
  58. Aprodu, I.; Banu, I. Effect of starch and dairy proteins on the gluten free bread formulation based on quinoa. J. Food Meas. Charact. 2021, 15, 2264–2274. [Google Scholar] [CrossRef]
  59. Rodriguez-Sandoval, E.; Sandoval, G.; Cortes-Rodriguez, M. Effect of quinoa and potato flours on the thermomechanical and breadmaking properties of wheat flour. Braz. J. Chem. Eng. 2012, 29, 503–510. [Google Scholar] [CrossRef]
  60. Li, S.; Liu, S.; Wu, H.; Zhao, W.; Zhang, A.; Li, P.; Liu, J.; Yi, H. Insights into the starch and proteins molecular structure changes of foxtail millet sourdough: Effect of fermentation from grains of cereal to pre-meal. Int. J. Biol. Macromol. 2024, 272, 132729. [Google Scholar] [CrossRef]
  61. Valerio, F.; Bavaro, A.R.; Di Biase, M.; Lonigro, S.L.; Logrieco, A.F.; Lavermicocca, P. Effect of Amaranth and Quinoa Flours on Exopolysaccharide Production and Protein Profile of Liquid Sourdough Fermented by Weissella cibaria and Lactobacillus plantarum. Front. Microbiol. 2020, 11, 967. [Google Scholar] [CrossRef]
  62. Sekwati-Monang, B.; Valcheva, R.; Ganzle, M.G. Microbial ecology of sorghum sourdoughs: Effect of substrate supply and phenolic compounds on composition of fermentation microbiota. Int. J. Biol. Macromol. 2012, 159, 240–246. [Google Scholar] [CrossRef]
  63. Besbes, E.; Jury, V.; Monteau, J.Y.; Le Bail, A. Effect of baking conditions and storage with crust on the moisture profile, local textural properties and staling kinetics of pan bread. LWT-Food Sci. Technol. 2014, 58, 658–666. [Google Scholar] [CrossRef]
  64. Elgeti, D.; Nordlohne, S.D.; Föste, M.; Besl, M.; Linden, M.H.; Heinz, V.; Jekle, M.; Becker, T. Volume and texture improvement of gluten-free bread using quinoa white flour. J. Cereal Sci. 2014, 59, 41–47. [Google Scholar] [CrossRef]
Figure 1. Mixolab curves for samples with quinoa flour (Q100) and quinoa flour substituted with 25 (Q75) and 50% (Q50) sorghum flour.
Applsci 15 05468 g001
Figure 2. The Mixolab curves for the dough samples prepared with quinoa flour (Q100) and quinoa flour substituted with 25 (Q75) or 50% (Q50) sorghum flour and 20% spontaneously fermented sourdough (C).
Applsci 15 05468 g002
Figure 3. The Mixolab curves for the dough samples prepared with quinoa flour (Q100) and quinoa flour substituted with 25 (Q75) and 50% (Q50) sorghum flour and 20% sourdough fermented with a starter culture (SC1).
Applsci 15 05468 g003
Figure 4. The Mixolab curves for the dough samples prepared with quinoa flour (Q100) and quinoa flour substituted with 25 (Q75) and 50% (Q50) sorghum flour and 20% sourdough fermented with starter culture (SC2).
Applsci 15 05468 g004
Figure 5. The influence of quinoa flour substitution by sorghum flour and of starter culture used for sourdough fermentation on the sensory attributes of the gluten-free bread samples (Q100—quinoa flour, Q75—quinoa flour with 25% sorghum flour addition, Q50—quinoa flour with 50% sorghum flour addition; Q100 C, Q75 C and Q50 C—samples prepared with spontaneously fermented sourdoughs; Q100 SC1, Q75 SC1 and Q50 SC1—samples prepared with sourdoughs fermented with starter culture SC1; Q100 SC2, Q75 SC2 and Q50 SC2—samples prepared with sourdoughs fermented with starter culture SC2).
Applsci 15 05468 g005
Table 1. Proximate composition of quinoa and sorghum flours.
Quinoa FlourSorghum Flour
Moisture, g/100 g11.19 ± 0.08 b11.71 ± 0.04 a
Protein, g/100 g d.w.15.83 ± 0.09 a9.50 ± 0.04 b
Fats, g/100 g d.w.6.58 ± 0.13 a3.38 ± 0.05 b
Fibers, g/100 g d.w.6.18 ± 0.08 b7.19 ± 0.28 a
Ash, g/100 g d.w.2.29 ± 0.08 a1.89 ± 0.10 b
On a line, the average values accompanied by different lowercase letters (a, b) are significantly different (p < 0.05), based on the Tukey test.
Table 2. Concentrations of the lactic acid bacteria (CFU g−1) of the gluten-free sourdough samples prepared with quinoa flour alone (Q100) or substituted with 25% (Q75) or 50% (Q50) sorghum flour.
Starter CultureQ100Q75Q50
<10<10<10
SC1(7.75 ± 0.35) × 108 a,B(1.16 ± 0.04) × 109 a,A(8.80 ± 0.14) × 108 a,B
SC2(1.78 ± 0.07) × 108 b,B(2.51 ± 0.15) × 108 b,A(1.45 ± 0.04) × 108 b,B
In a line, the average values corresponding to samples prepared from different flour blends and the same starter culture, accompanied by different uppercase letters (A, B) are significantly different (p < 0.05), based on the Tukey test. In a column, the average values corresponding to samples fermented with different starter cultures accompanied by different lowercase letters (a, b) are significantly different (p < 0.05), based on the Tukey test.
Table 3. Chemical characteristics of the gluten-free sourdough samples prepared with quinoa flour alone (Q100) or substituted with 25% (Q75) or 50% (Q50) sorghum flour.
SamplepHTotal
Titratable Acidity
Lactic Acid, mg/100 g d.wAcetic Acid,
mg/100 g d.w
Glycerol, mg/100 g d.wEthanol, mg/100 g d.w
Q100 C5.898 ±
0.001 a,A
6.41 ±
0.02 c,C
1490.11 ±
38.31 b,C
103.24 ±
4.05 a,A
58.63 ±
1.65 b,B
64.62 ±
3.06 a,A
Q75 C5.750 ±
0.006 b,A
7.21 ±
0.02 b,C
2330.04 ±
106.28 a,C
114.25 ±
4.74 a,A
95.54 ±
3.01 a,C
52.87 ±
0.58 b,A
Q50 C5.756 ±
0.001 b,A
7.41 ±
0.02 a,C
1518.93 ±
26.21 b,C
114.60 ±
4.52 a,A
96.42 ±
3.15 a,B
51.24 ±
1.88 b,A
Q100 SC14.454 ±
0.001 a,C
9.74 ±
0.02 c,A
2544.93 ±
37.74 b,B
7.14 ±
0.04 c,C
70.74 ±
1.80 b,A
19.99 ±
1.02 a,B
Q75 SC14.439 ±
0.003 a,C
10.99 ±
0.08 b,A
3551.99 ±
26.01 a,B
31.75 ±
1.43 b,C
139.36 ±
1.13 a,A
18.53 ±
0.66 a,B
Q50 SC14.408 ±
0.006 b,C
11.57 ±
0.01 a,A
2494.96 ±
23.81 b,A
51.41 ±
2.59 a,C
132.97 ±
3.90 a,A
17.41 ±
0.57 a,B
Q100 SC24.507 ±
0.001 a,B
8.94 ±
0.03 c,B
3296.02 ±
51.16 b,A
20.13 ±
1.39 b,B
64.83 ±
2.73 c,A,B
11.51 ±
0.47 b,C
Q75 SC24.514 ±
0.006 a,B
9.23 ±
0.05 b,B
4103.61 ±
60.39 a,A
73.03 ±
2.87 a,B
111.85 ±
2.80 b,B
16.93 ±
0.85 a,B
Q50 SC24.510 ±
0.004 a,B
9.65 ±
0.03 a,B
2259.84 ±
11.98 c,B
73.32 ±
3.36 a,B
130.29 ±
3.13 a,A
16.28 ±
0.13 a,B
Q100 C, Q75 C and Q50 C—spontaneously fermented sourdoughs; Q100 SC1, Q75 SC1 and Q50 SC1—sourdoughs fermented with starter culture SC1; Q100 SC2, Q75 SC2 and Q50 SC2—sourdoughs fermented with starter culture SC2. For the same type of starter culture, the average values from a column corresponding to samples prepared from different flour blends, accompanied by different lowercase letters (a, b, c), are significantly different (p < 0.05), based on the Tukey test. For the same flour blend, the average values from a column corresponding to samples fermented with different starter cultures accompanied by different uppercase letters (A, B, C) are significantly different (p < 0.05), based on the Tukey test.
Table 4. Total phenolic content and radicals scavenging activity of DPPH (DPPH-RSA) and ABTS (ABTS-RSA) of the sourdough and bread samples prepared with quinoa flour alone (Q100) or substituted with 25% (Q75) or 50% (Q50) sorghum flour.
SamplesSourdoughBread
TPC, mg Ferulic acid/g d.w.DPPH-RSA,
µmols TE/g d.w.
ABTS-RSA,
µmols TE/g d.w.
TPC, mg Ferulic acid/g d.w.DPPH-RSA,
µmols TE/
g d.w.
ABTS-RSA,
µmols TE/g d.w.
Q100 C3.83 ± 0.00 a,C247.24 ± 4.47 a,C320.93 ± 9.07 b,A2.61 ± 0.05 b,B212.97 ± 9.69 a,B165.79 ± 8.18 b,B
Q75 C3.79 ± 0.03 a,C254.95 ± 1.08 a,B338.36 ± 17.55 b,B2.83 ± 0.01 a,A241.69 ± 11.75 a,B216.75 ± 0.00 a,A
Q50 C3.02 ± 0.06 b,C233.20 ± 2.12 b,B402.53 ± 12.93 a,A2.60 ± 0.02 b,B244.49 ± 8.95 a,B226.57 ± 10.11 a,A
Q100 SC14.77 ± 0.01 a,B273.89 ± 1.08 a,A306.28 ± 17.49 c,A2.94 ± 0.05 a,b,A246.50 ± 12.65 b,A,B216.46 ± 8.98 b,A
Q75 SC14.35 ± 0.05 b,B267.39 ± 2.13 b,A359.87 ± 6.49 b,A,B3.05 ± 0.09 a,A267.83 ± 10.79 a,bA,B252.15 ± 2.04 a,A
Q50 SC13.72 ± 0.04 c,A254.94 ± 1.04 c,A411.07 ± 4.21 a,A2.78 ± 0.01 b,A 312.37 ± 14.54 a,A250.74 ± 2.03 a,A
Q100 SC24.88 ± 0.02 a,A258.72 ± 2.11 a,B319.87 ± 6.43 b,A2.45 ± 0.02 c,B265.41 ± 10.17 a,A194.16 ± 8.89 b,A,B
Q75 SC24.53 ± 0.00 b,A267.62 ± 3.27 a,A422.13 ± 33.10 a,A2.87 ± 0.05 a,A301.40 ± 8.41 a,A230.84 ± 9.80 a,b,A
Q50 SC23.43 ± 0.01 c,B221.99 ± 4.29 b,B389.81 ± 10.89 a,A2.70 ± 0.03 b,A290.90 ± 8.65 a,A258.77 ± 12.10 a,A
Q100 C, Q75 C and Q50 C—spontaneously fermented sourdoughs; Q100 SC1, Q75 SC1 and Q50 SC1—sourdoughs fermented with starter culture SC1; Q100 SC2, Q75 SC2 and Q50 SC2—sourdoughs fermented with starter culture SC2. In a column, different superscript lowercase letters (a, b, c) were assigned to mean values to indicate significant differences (p < 0.05) among sourdough or bread samples prepared with different types of flour blends and the same starter culture, whereas different superscript uppercase letters (A, B, C) indicate significant differences (p < 0.05), among sourdough or bread samples prepared with the same flour blend and different starter cultures.
Table 5. The influence of the flour type and sourdough addition on the parameters of the Mixolab curves registered during mixing the gluten-free dough samples at 30 °C.
Dough SampleWA, %C1, NmtC1, minC8, NmA, NmS, minS8, min
Q10056.91.06 ± 0.01 b,C4.33 ± 0.04 c,D1.01 ± 0.02 b,B0.042 ± 0.003 b,B9.1 ± 0.02 a,A5.9 ± 0.02 c,A
Q7552.01.02 ± 0.01 c,B4.52 ± 0.03 b,B0.96 ± 0.01 c,B0.047 ± 0.003 b,C9.1 ± 0.02 a,A6.2 ± 0.02 b,D
Q5051.01.10 ± 0.01 a,B8.18 ± 0.05 a,A1.10 ± 0.02 a,A,B0.056 ± 0.002 a,B7.8 ± 0.03 b,B7.1 ± 0.02 a,C
Q100 C56.91.14 ± 0.02 a,A,B4.48 ± 0.03 b,C1.04 ± 0.02 b,A,B0.054 ± 0.003 c,A6.4 ± 0.02 c,D5.9 ± 0.02 c,A
Q75 C52.01.09 ± 0.02 b,A4.53 ± 0.04 b,B1.05 ± 0.01 b,A0.061 ± 0.002 b,A8.7 ± 0.02 b,C6.5 ± 0.02 b,B
Q50 C51.01.13 ± 0.01 a,A7.08 ± 0.03 a,C1.11 ± 0.02 a,A0.174 ± 0.002 a,A9.3 ± 0.03 a,A7.0 ± 0.02 a,D
Q100 SC156.91.11 ± 0.01 a,B4.87 ± 0.04 b,A1.06 ± 0.02 a,b,A0.039 ± 0.002 b,B7.5 ± 0.03 c,B5.9 ± 0.02 c,A
Q75 SC152.01.05 ± 0.01 b,B4.93 ± 0.04 b,A1.03 ± 0.02 b,A0.053 ± 0.002 a,B8.9 ± 0.02 b,B6.6 ± 0.02 b,A
Q50 SC151.01.08 ± 0.02 a,B8.08 ± 0.05 a,A1.07 ± 0.02 a,B0.041 ± 0.002 b,C9.3 ± 0.02 a,A8.2 ± 0.02 a,B
Q100 SC256.91.16 ± 0.02 a,A4.73 ± 0.04 c,B1.08 ± 0.02 a,A0.057 ± 0.002 a,A7.0 ± 0.02 c,C5.8 ± 0.02 c,B
Q75 SC252.01.11 ± 0.01 b,A4.98 ± 0.04 b,A1.05 ± 0.0 2a,A0.056 ± 0.002 a,B7.5 ± 0.02 b,D6.3 ± 0.02 b,C
Q50 SC251.01.08 ± 0.02 b,B7.68 ± 0.05 a,B1.07 ± 0.02 a,A,B0.043 ± 0.002 b,C9.3 ± 0.02 a,A8.7 ± 0.03 a,A
Q100—quinoa flour; Q75—quinoa flour with 25% sorghum flour addition; Q50—quinoa flour with 50% sorghum flour addition; Q100 C, Q75 C and Q50 C—samples prepared with spontaneously fermented sourdoughs; Q100 SC1, Q75 SC1 and Q50 SC1—samples prepared with sourdoughs fermented with starter culture SC1; Q100 SC2, Q75 SC2 and Q50 SC2—samples prepared with sourdoughs fermented with starter culture SC2. For the same type of starter culture, the average values from a column corresponding to samples prepared from different flour blends, accompanied by different lowercase letters (a, b, c) are significantly different (p < 0.05), based on the Tukey test. For the same flour blend, the average values from a column corresponding to samples fermented with different starter cultures accompanied by different uppercase letters (A, B, C, D) are significantly different (p < 0.05), based on the Tukey test.
Table 6. The influence of the flour type and sourdough addition on the parameters of the Mixolab curves registered during mixing and heating the gluten-free dough samples from 30 to 62 °C.
Dough SampleC2, NmtC2, minTC2, °CC1-C2, Nm
Q1000.28 ± 0.02 b,A18.85 ± 0.05 a,C58.4 ± 0.06 a,C0.78 ± 0.03 a,C
Q750.30 ± 0.02 b,B17.98 ± 0.04 b,C56.7 ± 0.06 b,C0.72 ± 0.03 b,B
Q500.52 ± 0.02 a,B16.87 ± 0.05 c,B57.2 ± 0.06 c,C0.58 ± 0.01 c,A
Q100 C0.29 ± 0.02 c,A18.92 ± 0.04 a,B,C59.8 ± 0.06 a,B0.84 ± 0.01 a,A,B
Q75 C0.35 ± 0.02 b,A18.62 ± 0.05 b,A59.3 ±0.06 b,A0.74 ± 0.03 b,B
Q50 C0.56 ± 0.02 a,A17.67 ± 0.04 c,A57.5 ± 0.06 c,B0.57 ± 0.01 c,A
Q100 SC10.28 ± 0.02 c,A19.32 ± 0.04 a,A61.5 ± 0.06 a,A0.83 ± 0.01 a,B
Q75 SC10.34 ± 0.02 b,A18.48 ± 0.04 b,B58.7 ± 0.06 b,B0.71 ± 0.01 b,B
Q50 SC10.52 ± 0.02 a,B17.70 ± 0.04 c,A57.6 ± 0.06 c,A0.57 ± 0.03 c,A
Q100 SC20.29 ± 0.02 c,A19.00 ± 0.04 a,B61.6 ± 0.06 a,A0.87 ± 0.00 a,A
Q75 SC20.35 ± 0.02 b,A18.43 ± 0.05 b,B59.3 ± 0.06 b,A0.76 ± 0.01 b,A
Q50 SC20.52 ± 0.02 a,A,B17.72 ± 0.04 c,A55.6 ± 0.06 c,D0.56 ± 0.04 c,A
Q100—quinoa flour; Q75—quinoa flour with 25% sorghum flour addition; Q50—quinoa flour with 50% sorghum flour addition; Q100 C, Q75 C and Q50 C—samples prepared with spontaneously fermented sourdoughs; Q100 SC1, Q75 SC1 and Q50 SC1—samples prepared with sourdoughs fermented with starter culture SC1; Q100 SC2, Q75 SC2 and Q50 SC2—samples prepared with sourdoughs fermented with starter culture SC2. For the same type of starter culture, the average values from a column corresponding to samples prepared from different flour blends, accompanied by different lowercase letters (a, b, c) are significantly different (p < 0.05), based on the Tukey test. For the same flour blend, the average values from a column corresponding to samples fermented with different starter cultures accompanied by different uppercase letters (A, B, C) are significantly different (p < 0.05), based on the Tukey test.
Table 7. The influence of the flour type and sourdough addition on the parameters of the Mixolab curves registered on the gluten-free dough samples during starch gelatinization.
Dough SampleC3, NmtC3, minTC3, °CC3-C2, Nm
Q1001.48 ± 0.02 c,B28.25 ± 0.04 a,A83.6 ± 0.06 b,A1.20 ± 0.04 c,A,B
Q751.87 ± 0.02 b,B27.53 ± 0.04 b,A84.2 ± 0.06 a,B1.56 ± 0.03 b,A
Q502.52 ± 0.02 a,B25.25 ± 0.04 c,C84.1 ± 0.06 a,C2.00 ± 0.00 a,B
Q100 C1.39 ± 0.01 c,C26.68 ± 0.05 b,D82.4 ± 0.06 c,C1.10 ± 0.03 c,C
Q75 C1.98 ± 0.01 b,A27.07 ± 0.05 a,B84.1 ± 0.06 b,B1.63 ± 0.03 b,A
Q50 C2.63 ± 0.03 a,A27.12 ± 0.05 a,A84.6 ± 0.06 a,B2.06 ± 0.01 a,A
Q100 SC11.47 ± 0.02 c,B27.15 ± 0.05 a,B83.1 ± 0.10 c,B1.19 ± 0.03 c,B
Q75 SC11.96 ± 0.02 b,A27.10 ± 0.05 a,B83.7 ± 0.06 b,C1.61 ± 0.01 b,A
Q50 SC12.57 ± 0.03 a,A27.13 ± 0.05 a,A84.8 ± 0.06 a,A2.06 ± 0.01 a,A
Q100 SC21.55 ± 0.02 c,A26.93 ± 0.04 b,C83.7 ± 0.06 c,A1.27 ± 0.01 c,A
Q75 SC21.94 ± 0.02 b,A27.12 ± 0.04 a,B84.4 ± 0.06 a,A1.60 ± 0.03 b,A
Q50 SC22.44 ± 0.02 a,C26.98 ± 0.04 b,B84.1 ± 0.04 b,C1.92 ± 0.01 a,C
Q100—quinoa flour; Q75—quinoa flour with 25% sorghum flour addition; Q50—quinoa flour with 50% sorghum flour addition; Q100 C, Q75 C and Q50 C—samples prepared with spontaneously fermented sourdoughs; Q100 SC1, Q75 SC1 and Q50 SC1—samples prepared with sourdoughs fermented with starter culture SC1; Q100 SC2, Q75 SC2 and Q50 SC2—samples prepared with sourdoughs fermented with starter culture SC2. For the same type of starter culture, the average values from a column corresponding to samples prepared from different flour blends, accompanied by different lowercase letters (a, b, c) are significantly different (p < 0.05), based on the Tukey test. For the same flour blend, the average values from a column corresponding to samples fermented with different starter cultures accompanied by different uppercase letters (A, B, C) are significantly different (p < 0.05), based on the Tukey test.
Table 8. The influence of the flour type and sourdough addition on the parameters of the Mixolab curves registered on the gluten-free dough samples during starch gelatinization and retrogradation.
Dough SampleC4, NmtC4, minC5, NmC5-C4, Nm
Q1001.43 ± 0.02 c,B33.52± 0.05 a,A1.98 ± 0.02 c,B0.55 ± 0.00 b,A
Q751.79 ± 0.02 b,C32.38 ± 0.05 b,A2.38 ± 0.02 b,C0.59 ± 0.00 b,D
Q502.48 ± 0.03 a,A26.62 ± 0.04 c,C3.70 ± 0.02 a,B 1.21 ± 0.05 a,A,B
Q100 C1.33 ± 0.02 c,C30.72 ± 0.04 a,C1.86 ± 0.02 c,C0.54 ± 0.02 c,A,B
Q75 C1.91 ± 0.02 b,A30.03 ± 0.04 c,C2.68 ± 0.02 b,A0.77 ± 0.01 b,A
Q50 C2.48 ± 0.03 a,A30.22 ± 0.04 b,A3.77 ± 0.03 a,A1.30 ± 0.05 a,A
Q100 SC11.53 ± 0.02 c,A29.98 ± 0.05 b,D2.04 ± 0.02 c,A0.51 ± 0.01 c,C
Q75 SC11.90 ± 0.02 b,A30.12 ± 0.04 a,C2.62 ± 0.02 b,B0.72 ± 0.00 b,C
Q50 SC12.42 ± 0.03 a,B30.20 ± 0.04 a,A3.66 ± 0.03 a,B1.24 ± 0.01 a,A
Q100 SC21.51 ± 0.02 c,A32.88 ± 0.05 a,B2.03 ± 0.02 c,A0.52 ± 0.01 c,B,C
Q75 SC21.84 ± 0.02 b,B30.22 ± 0.04 b,B2.57 ± 0.02 b,B0.73 ± 0.01 b,B
Q50 SC22.36 ± 0.02 a,B30.03 ± 0.04 c,B3.49 ± 0.03 a,C1.13 ± 0.01 a,B
Q100—quinoa flour; Q75—quinoa flour with 25% sorghum flour addition; Q50—quinoa flour with 50% sorghum flour addition; Q100 C, Q75 C and Q50 C—samples prepared with spontaneously fermented sourdoughs; Q100 SC1, Q75 SC1 and Q50 SC1—samples prepared with sourdoughs fermented with starter culture SC1; Q100 SC2, Q75 SC2 and Q50 SC2—samples prepared with sourdoughs fermented with starter culture SC2. For the same type of starter culture, the average values from a column corresponding to samples prepared from different flour blends, accompanied by different lowercase letters (a, b, c) are significantly different (p < 0.05), based on the Tukey test. For the same flour blend, the average values from a column corresponding to samples fermented with different starter cultures accompanied by different uppercase letters (A, B, C, D) are significantly different (p < 0.05), based on the Tukey test.
Table 9. The influence of quinoa flour substitution by sorghum flour and of starter culture used for sourdough fermentation on the crumb moisture in the first and third days of storage at room temperature.
Crumb Moisture (g/100 g) on 1st DayCrumb Moisture (g/100 g) on 3rd Day
Q100Q75Q50Q100Q75Q50
C43.22 ± 0.24 a,A38.93 ± 0.13 b,A36.30 ± 0.08 c,A41.38 ± 0.60 a,A37.77 ± 0.41 b,A35.18 ± 0.55 c,A
SC141.19 ± 0.04 a,B36.14 ± 0.05 b,B36.29 ± 0.05 b,A39.50 ± 0.36 a,A,B34.48 ± 0.06 b,B34.74 ± 0.30 b,A
SC241.58 ± 0.05 a,B37.60 ± 0.06 b,C35.80 ± 0.50 c,A39.81 ± 0.30 a,B35.98 ± 0.06 b,C34.76 ± 0.40 c,A
Q100—quinoa flour, Q75—quinoa flour with 25% sorghum flour addition, Q50—quinoa flour with 50% sorghum flour addition; Q100 C, Q75 C and Q50 C—samples prepared with spontaneously fermented sourdoughs; Q100 SC1, Q75 SC1 and Q50 SC1—samples prepared with sourdoughs fermented with starter culture SC1; Q100 SC2, Q75 SC2 and Q50 SC2—samples prepared with sourdoughs fermented with starter culture SC2. Different superscript lowercase letters were assigned to mean values to indicate significant differences among bread samples prepared with different types of flour blends and the same starter culture, whereas different superscript uppercase letters indicate significant differences among bread samples prepared with the same flour blend and different starter cultures.
Table 10. The influence of quinoa flour substitution by sorghum flour and of starter culture used for sourdough fermentation on the specific volume, color values (L*, a* and b*) and firmness of the gluten-free bread samples.
SampleSpecific Volume, cm3/gL*a*b*Firmness, N
Q100 C133.9 ± 6.3 a,A43.93 ± 0.30 c,B 3.41 ± 0.02 a,B 16.63 ± 0.10 a,B26.14 ± 1.40 a,A
Q75 C109.2 ± 6.4 a,A,B47.18 ± 0.26 b,A 3.25 ± 0.01 b,A 16.48 ± 0.11 a,A27.09 ± 0.93 a,A
Q50 C110.8 ± 6.5 a,A50.05 ± 0.37 a,A 2.79 ± 0.02 c,A15.76 ± 0.08 b,B29.11 ± 5.12 a,A
Q100 SC1124.4 ± 6.3 a,A45.14 ± 0.20 c,A3.31 ± 0.00 a,C 17.15 ± 0.09 a,A27.20 ± 1.53 a,A
Q75 SC1131.6 ± 6.6 a,A45.96 ± 0.09 b,B3.19 ± 0.01 a,A 16.29 ± 0.39 a,A25.37 ± 2.38 a,A
Q50 SC1110.3 ± 6.5 a,A47.42 ± 0.21 a,B 2.94 ± 0.10 b,A16.50 ± 0.01 a,A29.14 ± 7.17 a,A
Q100 SC297.1 ± 6.9 a,B43.07± 0.07 c,B3.96 ± 0.01 a,A17.31 ± 0.16 a,A23.19 ± 2.65 b,A
Q75 SC2100.0 ± 6.4 a,B46.61 ± 0.14 b,A,B 3.32 ± 0.30 a,b,A 16.45 ± 0.19 b,A25.20 ± 0.51 b,A
Q50 SC2117.0 ± 6.4 a,A49.36 ± 0.13 a,A2.92 ± 0.01 b,A 16.42 ± 0.07 b,A32.79 ± 3.34 a,A
Q100—quinoa flour; Q75—quinoa flour with 25% sorghum flour addition; Q50—quinoa flour with 50% sorghum flour addition; Q100 C, Q75 C and Q50 C—samples prepared with spontaneously fermented sourdoughs; Q100 SC1, Q75 SC1 and Q50 SC1—samples prepared with sourdoughs fermented with starter culture SC1; Q100 SC2, Q75 SC2 and Q50 SC2—samples prepared with sourdoughs fermented with starter culture SC2. In a column, different superscript lowercase letters were assigned to mean values to indicate significant differences among bread samples prepared with different types of flour blends and the same starter culture, whereas different superscript uppercase letters indicate significant differences among bread samples prepared with the same flour blend and different starter cultures.
Disclaimer/Publisher’s Note: The statements, opinions and data contained in all publications are solely those of the individual author(s) and contributor(s) and not of MDPI and/or the editor(s). MDPI and/or the editor(s) disclaim responsibility for any injury to people or property resulting from any ideas, methods, instructions or products referred to in the content.

