Article

Creep–Fatigue Behavior and Life Prediction of Medium-Si-Mo Ductile Iron

School of Mechanical Engineering, Beijing Institute of Technology, Beijing 100081, China
*
Author to whom correspondence should be addressed.
Appl. Sci. 2025, 15(10), 5406; https://doi.org/10.3390/app15105406
Submission received: 27 March 2025 / Revised: 1 May 2025 / Accepted: 2 May 2025 / Published: 12 May 2025
(This article belongs to the Special Issue Advances and Applications in Mechanical Fatigue and Life Assessment)

Abstract

:
Exhaust manifolds accumulate creep and fatigue damage under cyclic thermal loading, leading to localized failure. Understanding a material’s mechanical behavior is crucial for accurate life assessment. This study systematically investigated the low-cycle fatigue (LCF) and creep–fatigue interaction behaviors of medium-silicon molybdenum ductile iron. It was found that QTRSi4Mo exhibited cyclic hardening at room temperature and 400 °C, whereas it exhibited cyclic softening at 600 °C and 700 °C for low-cycle stress–strain responses. During creep–fatigue tests with hold time, variations in the strain amplitude did not alter the hysteresis loop shape or the hardening/softening characteristics of the material. They only induced a slight upward shift in the yield center. Additionally, stress relaxation primarily occurred in the initial phase of the hold period, so the hold duration had little effect on the final stress value. The investigation of creep–fatigue life models highlighted that accurately characterizing the damage induced by stress relaxation during the hold stage is critical for creep damage evaluation. The calculated creep damage results differed greatly from the experimental results of the time fraction model (TF). A combined approach using the strain energy density dissipation model (T-SEDE) and the Ostergren method demonstrated excellent predictive capability for creep–fatigue life.

1. Introduction

In recent years, the increasing demand for higher power output and fuel efficiency in internal combustion engines has led to more severe operating conditions for exhaust components. Repeated engine starts and shutdowns coupled with the exhaust manifold’s self-constraint induce plastic strain in the manifold, causing fatigue damage [1,2,3,4]. Furthermore, prolonged exposure to high temperatures results in creep relaxation, causing creep damage. The synergistic effect of these two damage mechanisms under harsh high-temperature operating conditions can easily lead to localized failure of the exhaust manifold. Therefore, to accurately assess the service life duration of exhaust components, a comprehensive understanding of the material’s mechanical behavior and lifetime characteristics is essential [5].
Nodular cast iron (also known as ductile cast iron) is the most widely used material in the design and manufacture of exhaust systems. In practice, extensive studies have been conducted on the low-cycle fatigue behavior and microscopic mechanisms of various types of ductile iron [6,7,8,9,10,11]. Wu Q. et al. [12] conducted low-cycle fatigue (LCF) tests on high-strength compacted graphite cast iron at multiple temperatures. Through systematic analysis of cyclic characteristics and comparative evaluation of extensive fatigue data, they developed a life prediction methodology for this material by integrating energy-based approaches with damage mechanism analysis. Collini L. et al. [13] elucidated the effect of notches on the fatigue life of ductile iron by analyzing the combined influence of the microstructure and stress triaxiality. Based on this mechanistic understanding, the author proposed a modified Manson–Coffin–Basquin equation incorporating triaxiality effects. Kim Y. J. et al. [14] focused on comparative analysis of low-cycle mechanical behavior and fatigue life at elevated temperatures with varying silicon molybdenum contents. Charkaluk E. et al. [15] suggested that the traditional Manson–Coffin criterion is insufficiently accurate for predicting non-isothermal thermal fatigue in silicon molybdenum ductile iron and proposed that the energy dissipation method is more suitable. However, their study raised the unresolved question of whether creep damage can be characterized by energy dissipation. It is evident that the majority of ductile cast iron research has primarily focused on investigating fatigue behavior and lifetime characteristics, while studies examining fatigue performance under combined creep–fatigue conditions remain relatively scarce.
This study focused on medium-silicon molybdenum ductile iron (QTRSi4Mo) as its research subject. QTRSi4Mo is a critical material for manufacturing exhaust components used in internal combustion engines. Its exceptional properties, including high strength, oxidation resistance, and growth resistance [16,17], enable exhaust manifolds to operate at temperatures exceeding 700 °C [18,19]. Compared to conventional ferritic ductile iron, it exhibits superior strength and deformation resistance. In this research, low-cycle fatigue (LCF) testing was performed on specimens of the target material across multiple temperature conditions, with comprehensive characterization and analysis of its fatigue behavior. On this basis, hold time was incorporated into the fatigue tests and combined with creep test data to investigate creep–fatigue interaction behavior. The existing literature has demonstrated the superiority of strain-based or energy-based approaches to fatigue life assessment [20]. Building on the energy methods, this study integrated the inelastic strain energy density dissipation method with the net tensile hysteresis energy method to characterize creep–fatigue damage, enabling the prediction of the material’s comprehensive lifetime under corresponding operating conditions. This research provides valuable support for the durable design and life prediction of exhaust components of internal combustion engines.

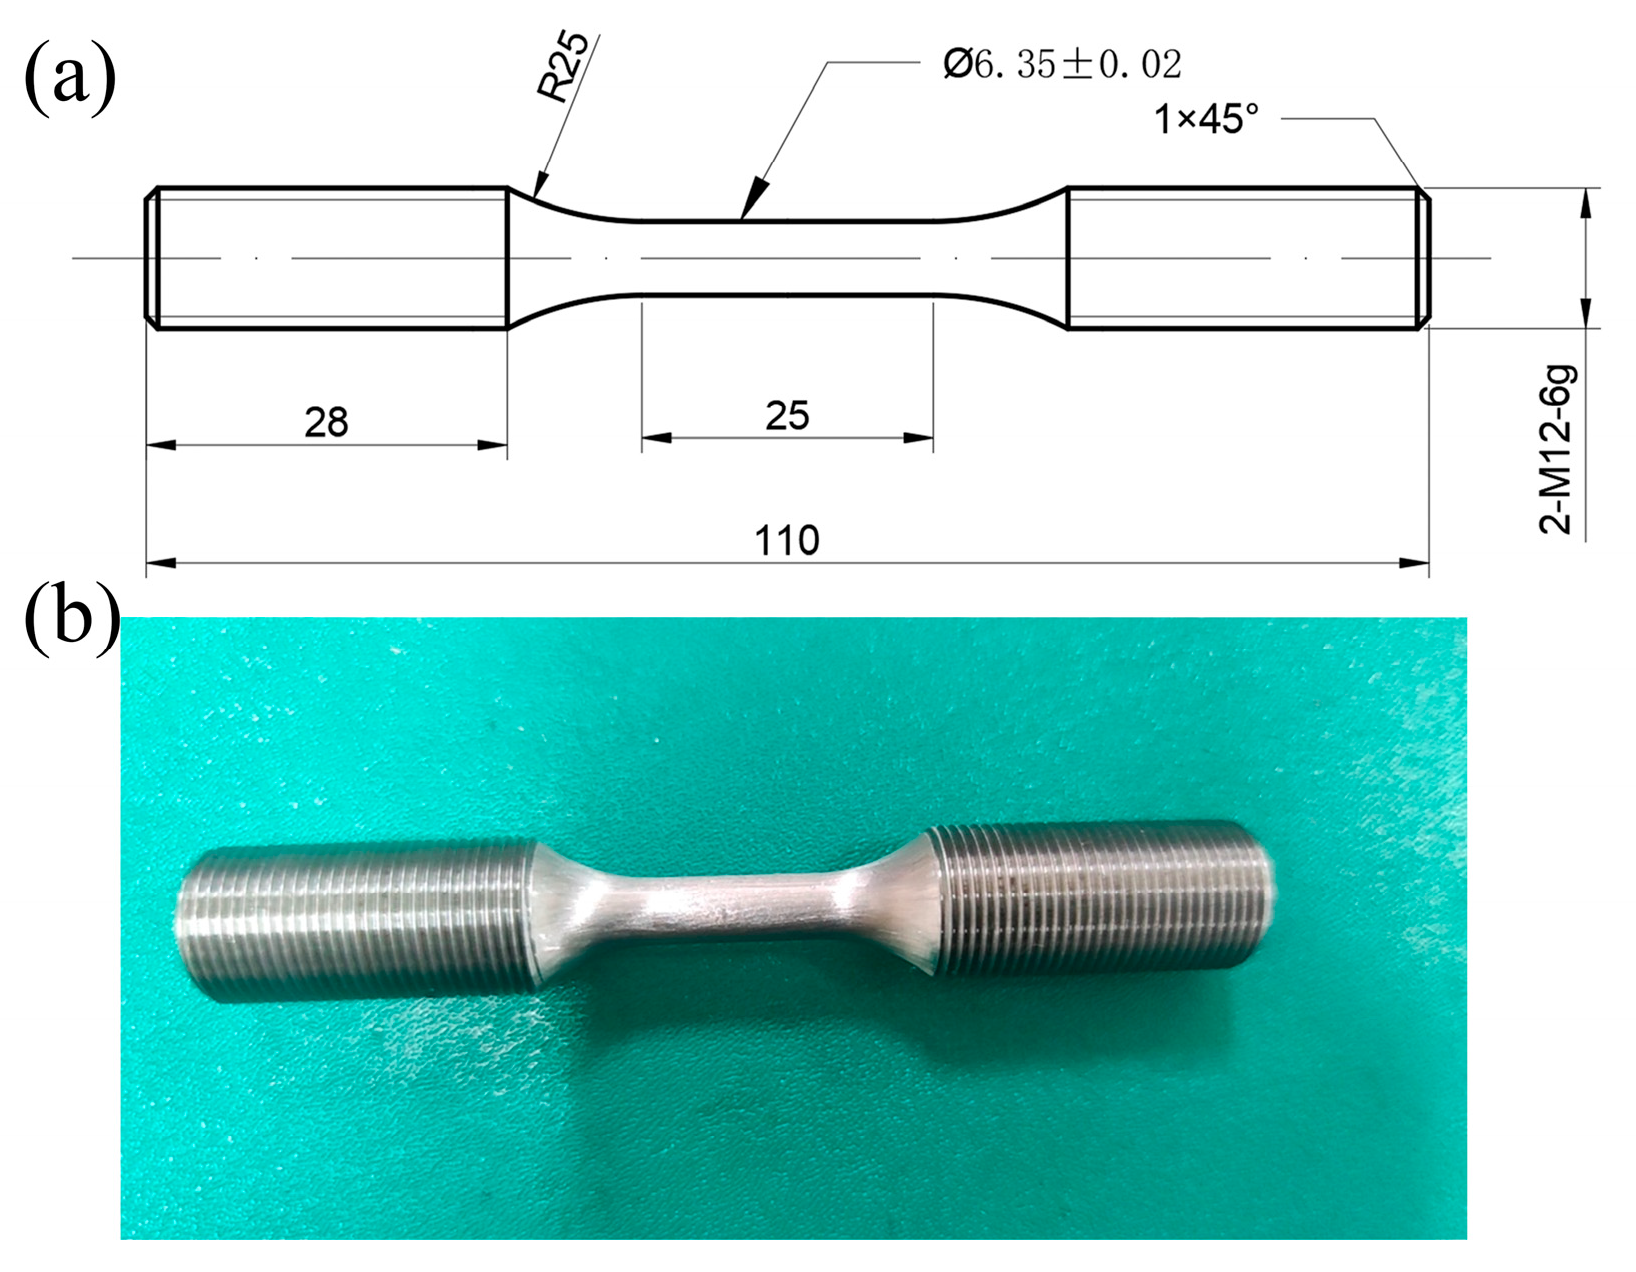
2. Experimental Materials and Methods

The chemical composition of the medium-silicon molybdenum ductile iron investigated in this study was determined using a spark optical emission spectrometer (LMX08), as detailed in Table 1.
The experiments were conducted following Chinese standard GB/T 15248-2008 [21], “The Test Method for Axial Constant-Amplitude Low-Cycle Fatigue of Metallic Materials,” using an MTS fatigue testing machine [22]. In the tests, the strain amplitudes ranged from 0.2% to 0.8% and were applied at room temperature (23 °C), 400 °C, 600 °C, and 700 °C. Strain control was applied using a triangular waveform, as shown in Figure 1a, with a strain ratio of −1. The dimensions and physical appearance of the test specimens are illustrated in Figure 2.
The specimens for the creep–fatigue interaction tests at high temperatures were the same as those used for the low-cycle fatigue tests. Axial tension–compression strain control was applied during loading with the waveform shown in Figure 1b. Due to the fact that creep effects in metallic materials are usually negligible at room temperature, we only conducted the interaction tests at 400 °C, 600 °C, and 700 °C.

3. Results and Analysis

3.1. Low-Cycle Fatigue Properties

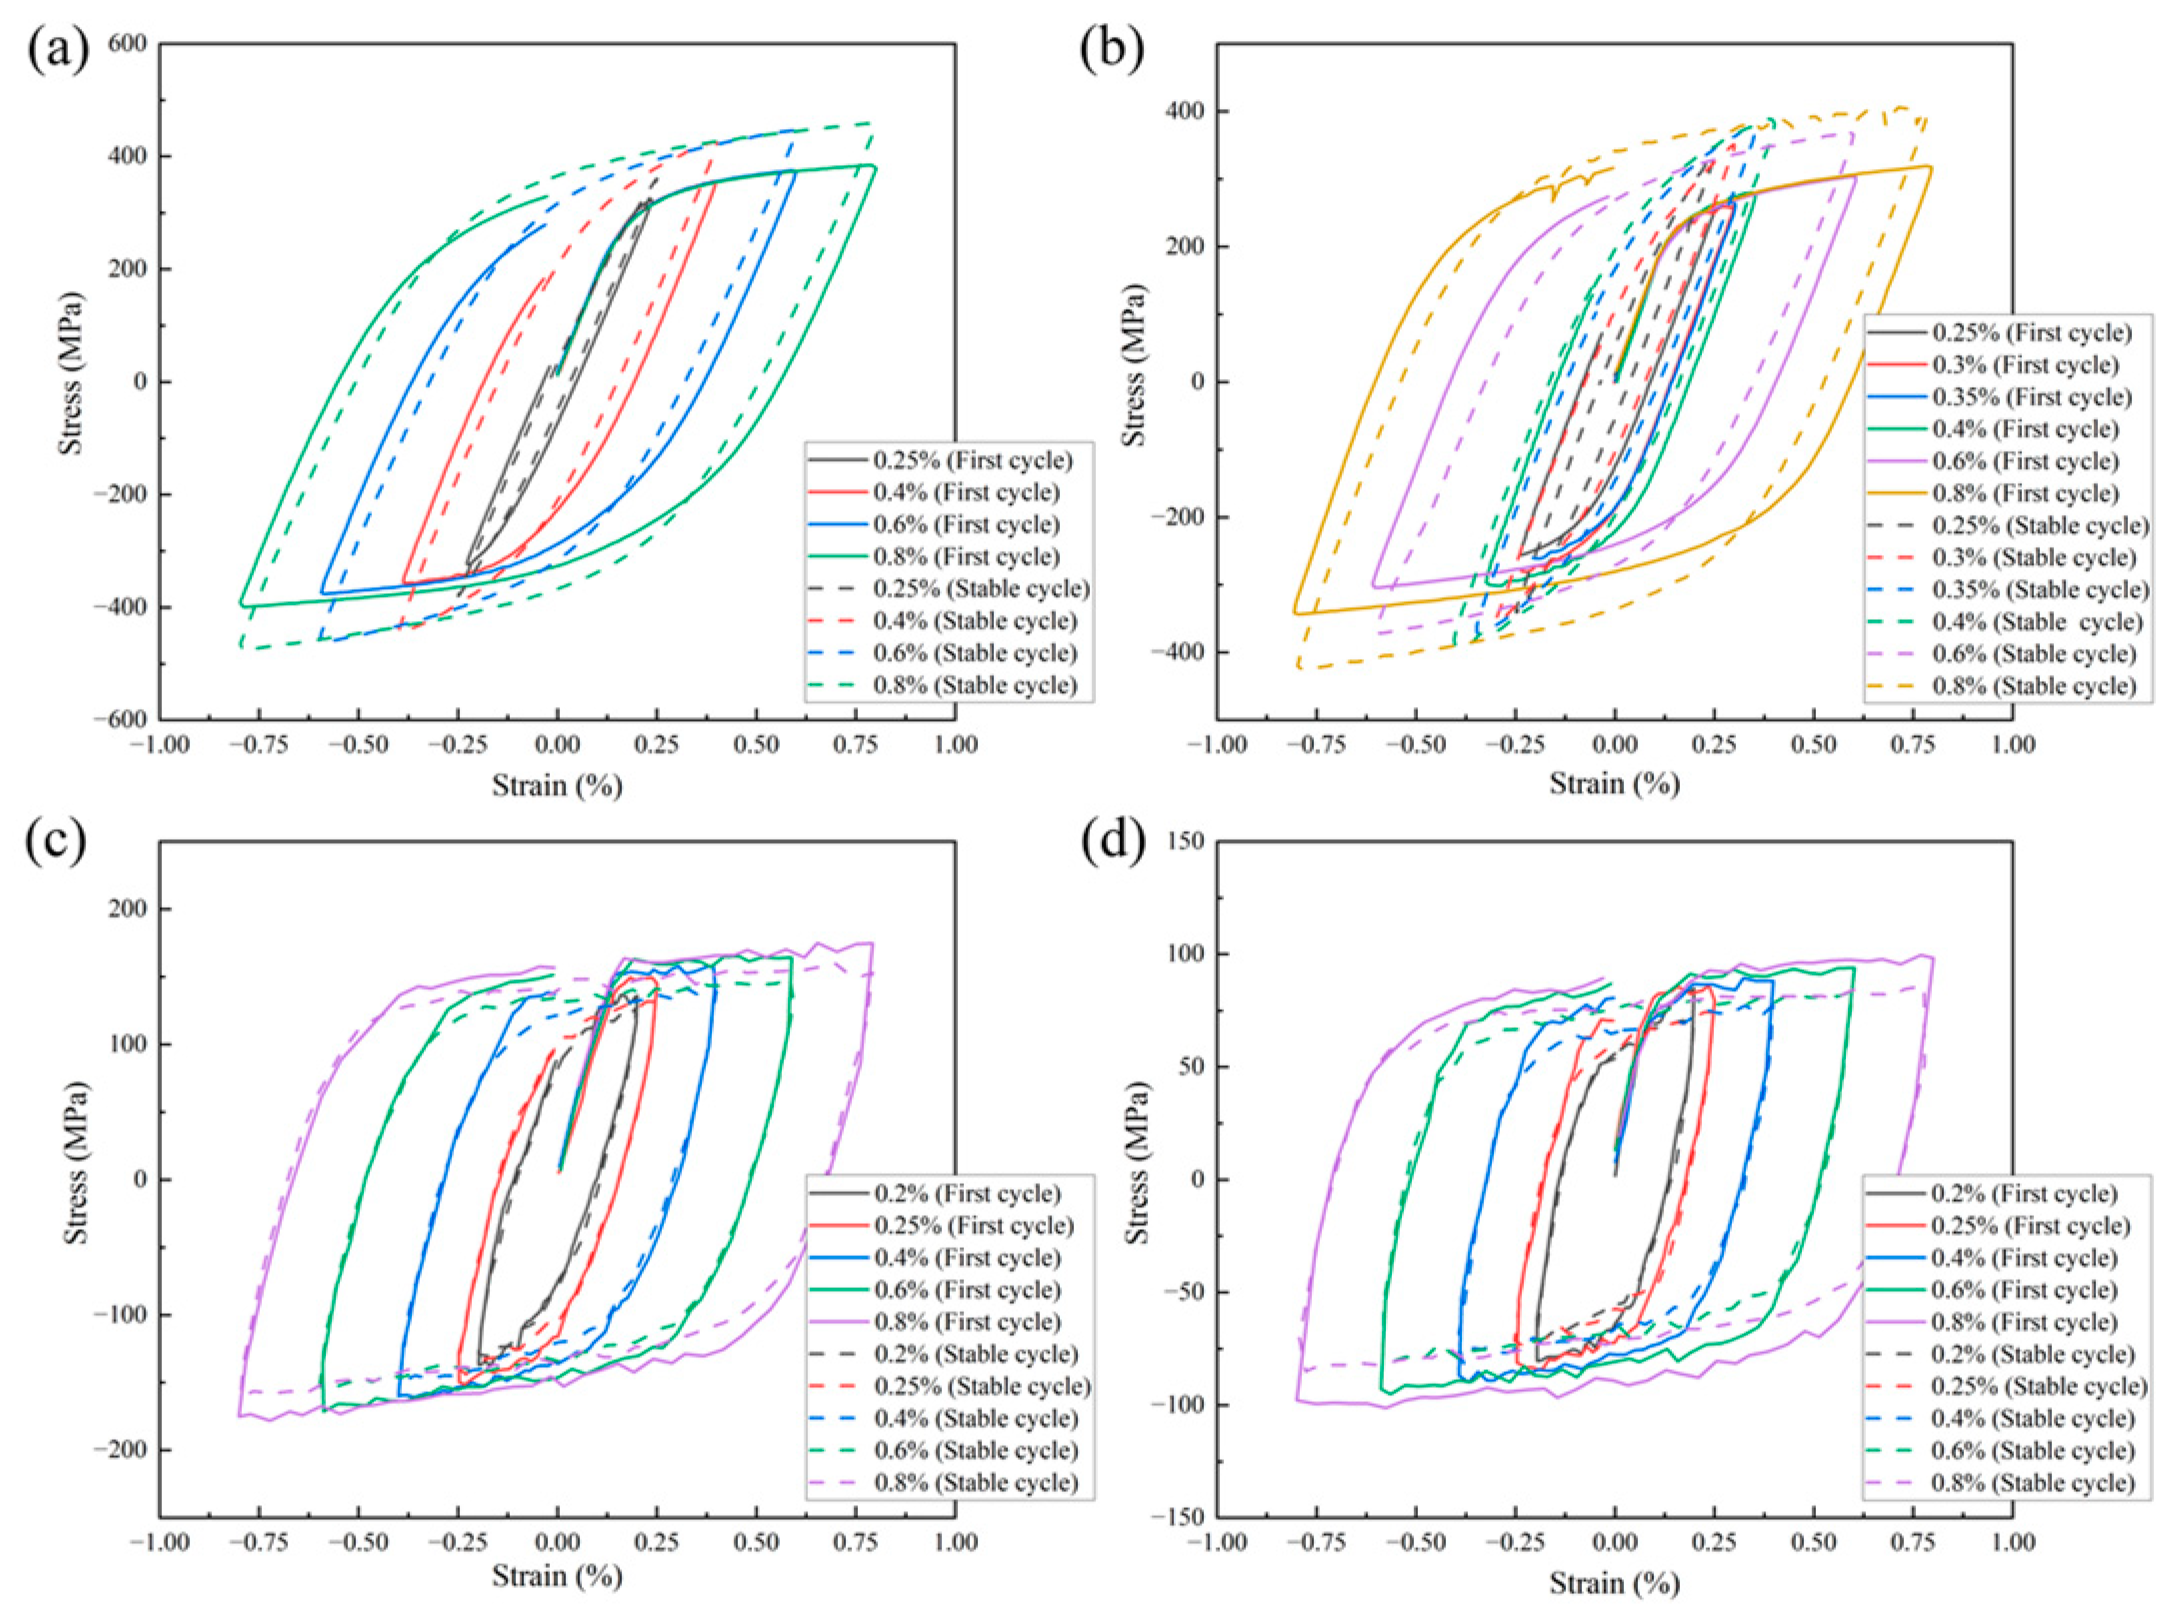
3.1.1. Stress–Strain Characteristics Under Cyclic Loading

Under constant strain amplitude loading, the accumulation of microscopic dislocations and plastic deformation within the material leads to changes in its plastic flow characteristics, which manifest macroscopically as cyclic softening and hardening phenomena [23]. During the cyclic softening and hardening process, if a stable hysteresis loop is not formed, the hysteresis loop at the half-life point is typically adopted in engineering as the nominal stable hysteresis loop for further analysis [24]. The first-cycle and nominal stable hysteresis loops of the ductile iron assessed in this study are shown in Figure 3 at various temperatures and under various strain loads (solid lines represent the first-cycle loops, and dashed lines represent the stable loops).
QTRSi4Mo exhibits cyclic hardening at low and medium temperatures but cyclic softening at high temperatures, based on a comparison between the first−cycle and stabilized hysteresis loops. The hysteresis loops at different temperatures and strain amplitudes generally display symmetry, which indicates similar material properties during tension and compression. Furthermore, the shapes of the hysteresis loops show that as the temperature increases, the nominal stabilized loops gradually become flatter and wider, with a decrease in the peak stress and an increase in the stress valley under the same strain amplitude. This suggests that elevated temperatures enhance this material’s plastic deformation capability, which is consistent with the softening and hardening characteristics of other similar grades of ductile iron [1].
The cyclic stress amplitude response curve of this material at a given temperature can be obtained by connecting the vertices of different hysteresis loops at the same temperature. According to Equation (1), this curve can be described mathematically as follows [25]:
ε a = ε e + ε p = σ a E + σ a K 1 n
In this equation, ε a represents the total strain amplitude, ε e denotes the elastic strain amplitude, ε p is the plastic strain amplitude, E is the elastic modulus, σ a is the stress amplitude, K is the cyclic strength coefficient (in MPa), and n′ is the strain hardening exponent.
In Table 2, the cyclic strength coefficient and strain hardening exponent values of the material are presented. They were calculated by fitting the cyclic stress–strain curve provided by Equation (1).

3.1.2. Characterization of Low−Cycle Life

The relationship between the total strain amplitude ( ε a ) and the low-cycle fatigue life (Nf) is generally described by the traditional Manson–Coffin equation [26].
ε a = ε e a + ε p a = σ f E 2 N f b + ε f 2 N f c
In this equation, ε f is the fatigue ductility coefficient, c is the fatigue ductility exponent, σ f denotes the fatigue strength coefficient, b is the fatigue strength exponent, ε p a is the plastic strain amplitude, and ε e a is the elastic strain amplitude.
In Figure 4a–d, we illustrate the relationships between elastic strain, plastic strain, total strain, and fatigue life for the ductile iron material assessed in this study. The parameters in Equation (2) were obtained by fitting the experimental data and are listed in Table 3.
Based on Figure 4a–d, the fatigue life of this material at low strain amplitudes is primarily influenced by elastic strain at room temperature and 400 °C. At these two temperatures, the elastic strain–life curve is mostly above the plastic strain–life curve. However, at 600 °C and 700 °C, due to the increased proportion of plastic strain in the total strain and enhanced plastic deformation, the intersection point of the elastic strain–life curve and the plastic strain–life curve shifts downward. Consequently, at high temperatures, plastic strain significantly influences the fatigue life at low strain amplitudes.

3.2. Creep–Fatigue Interaction Behavior

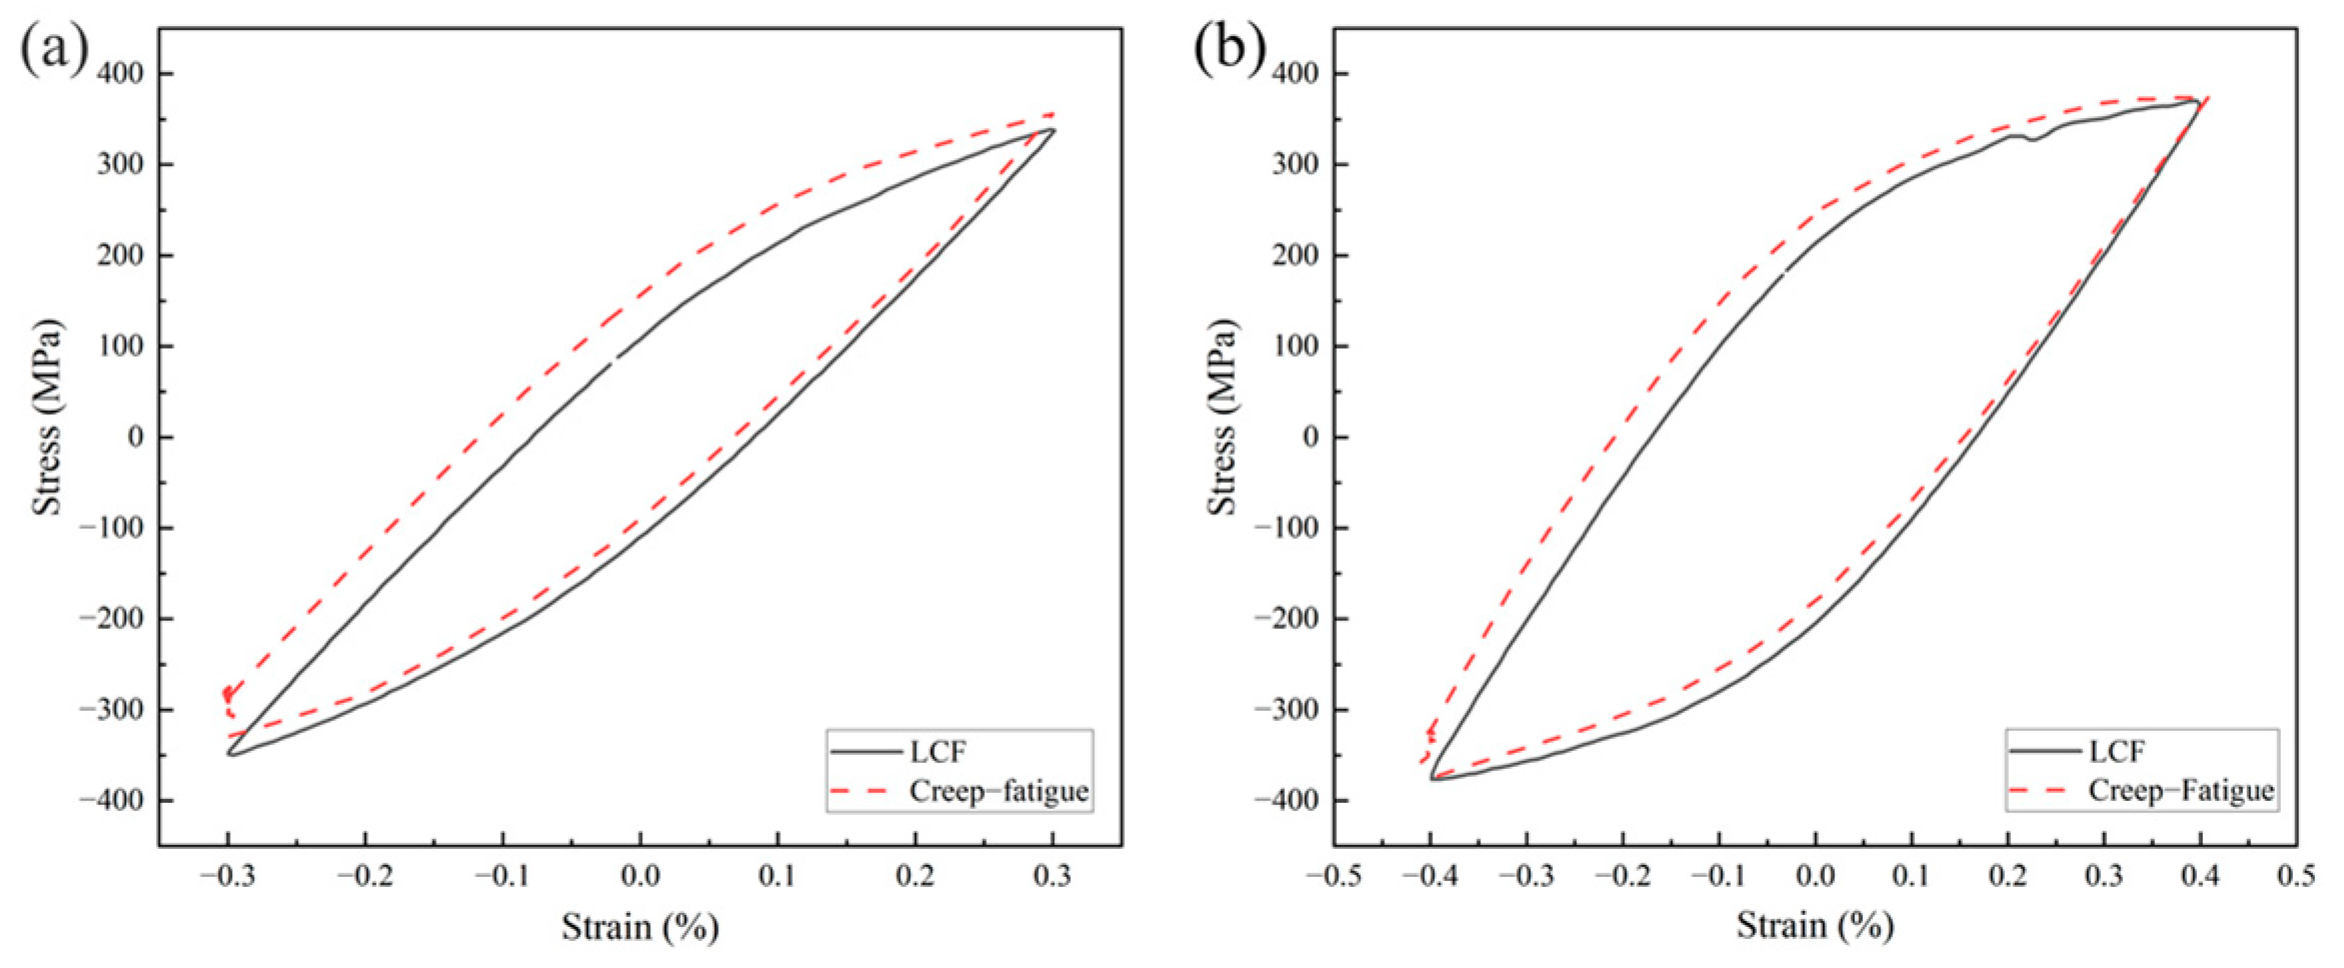
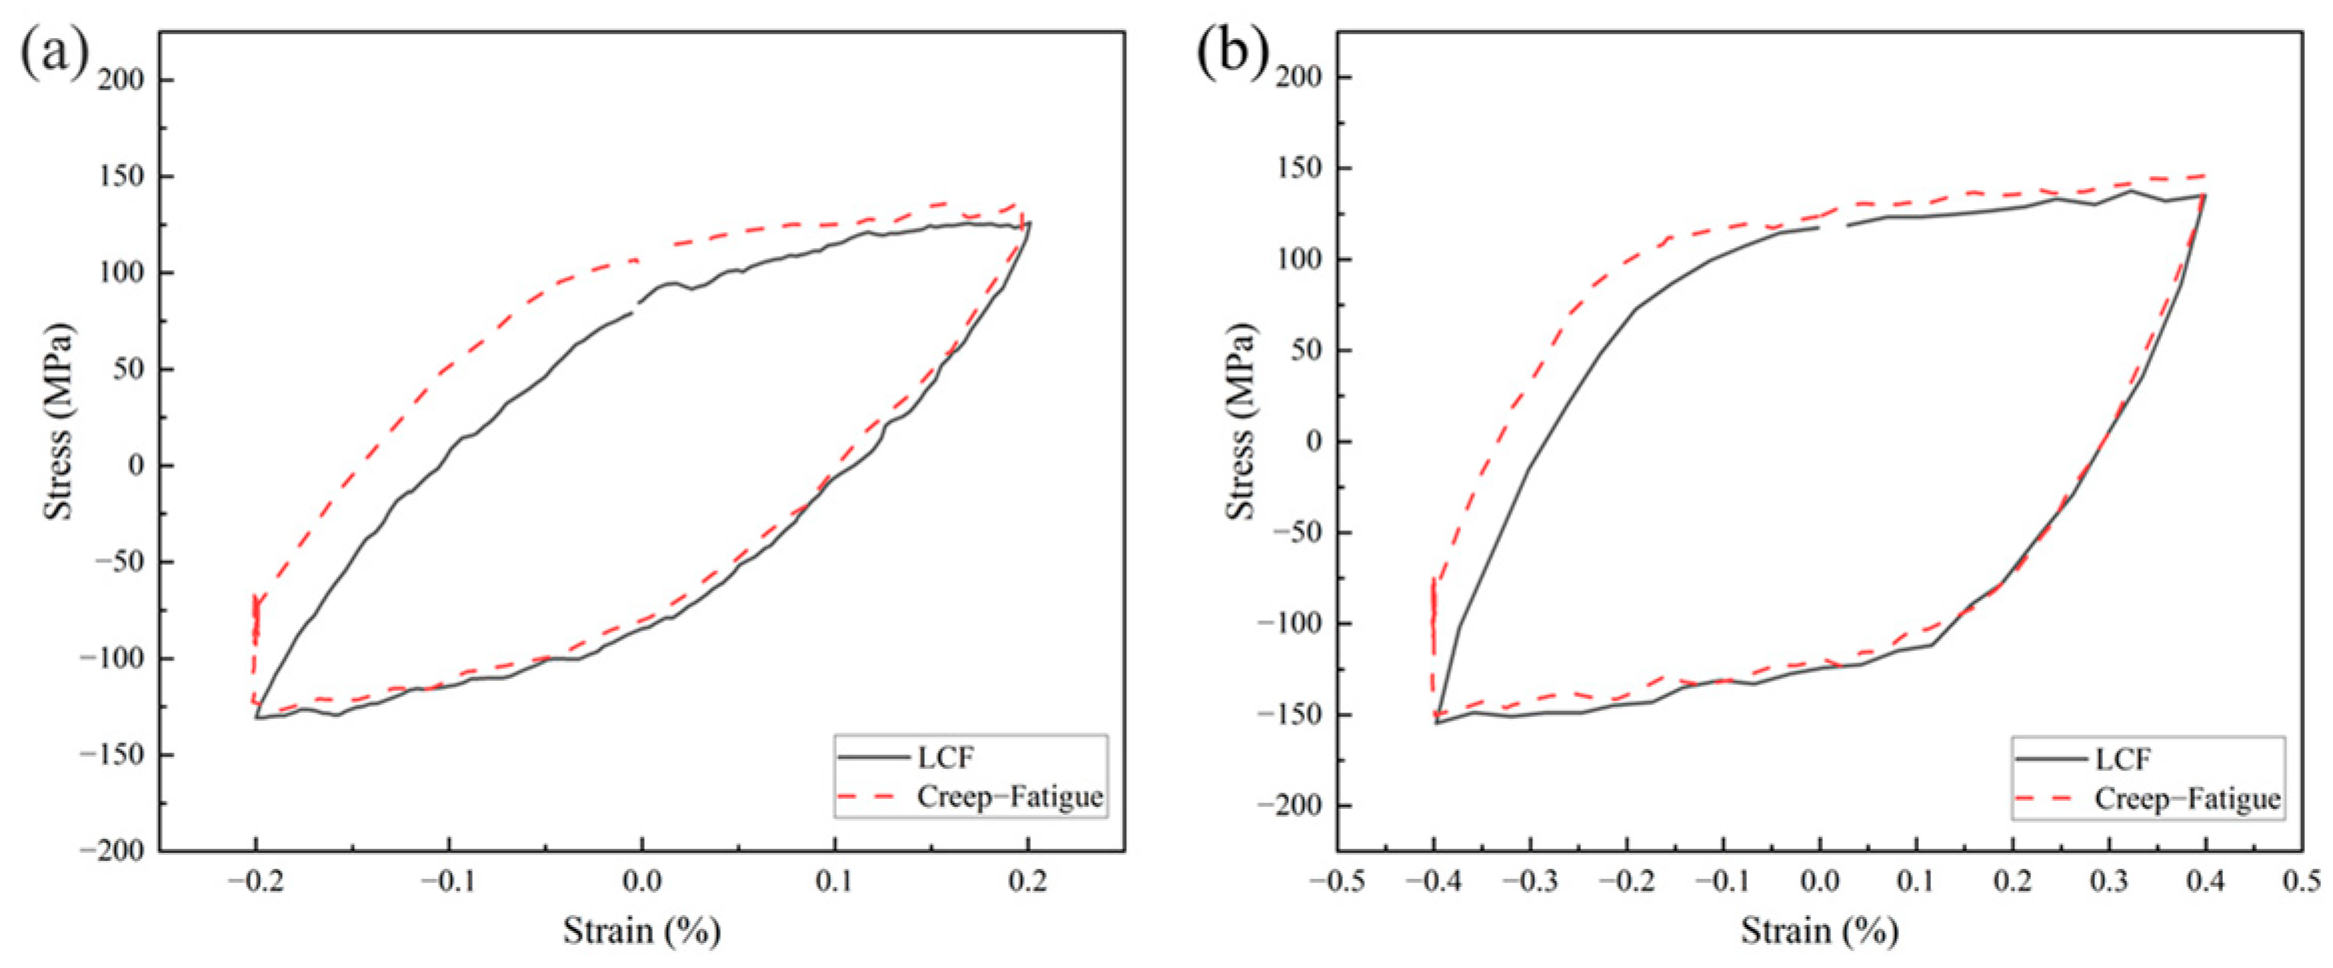
3.2.1. Stabilized Cyclic Response Characteristics Under Creep–Fatigue Interaction

Figure 5, Figure 6 and Figure 7 compare the nominal stabilized hysteresis loops under creep–fatigue interaction with the corresponding low-cycle fatigue hysteresis loops at various temperatures and strain amplitudes.
According to Figure 5, Figure 6 and Figure 7, the hysteresis loop yield radius and elastic modulus are essentially unchanged during the loading and unloading stages after applying a hold time. Additionally, the creep–fatigue hysteresis loops are slightly higher than the low-cycle fatigue hysteresis loops. This is because the presence of creep causes the stress–strain response to reach the yield faster during reverse loading compared to LCF. Under the same total strain during reverse loading, the creep–fatigue condition experiences more inelastic strain, resulting in higher peak stress. This phenomenon manifests as an upward shift in the yield center of the hysteresis loops [27].
Nominal stabilized hysteresis loops of the ductile iron under various creep–fatigue conditions are shown in Figure 8. To enhance clarity, different colors and line styles are used to distinguish between different conditions.
In Figure 8, it can be observed that changes in the strain amplitude do not significantly alter the overall shape of the hysteresis loops. The peak and valley stress values at small strain amplitudes generally fall near the stress values corresponding to larger strain amplitudes, indicating that creep–fatigue interaction does not substantially affect this material’s plastic constitutive relationship. Regarding the influence of the hold time, the duration has a minor effect on the shape of the hysteresis loops. The primary reason for this is that the stress relaxation during the initial stage of the hold period is greater than that during the other stage. Consequently, the additional stress relaxation from longer hold times is relatively small, resulting in a minimal impact on the loop shape. However, if the hold time were substantially increased beyond the current experimental conditions, the incremental stress relaxation would become more pronounced compared to the shorter hold times, leading to more noticeable changes in the hysteresis loop shape. Additionally, it is evident that the stress relaxation per unit time gradually decreases with a prolonged hold time, meaning that the influence of the hold time on the loop shape diminishes over time.

3.2.2. Investigation of Creep–Fatigue Life Prediction Models

Internationally, the linear damage summation (LDS) method is widely used to predict creep–fatigue life [28]. Based on this approach, fatigue and creep damage are calculated independently for each cycle, with material failure occurring once the cumulative damage reaches one. Typically, the half-life cycle is considered the representative steady-state cycle, and all stress and strain data are derived from this period. The creep–fatigue life can be predicted using Equation (3) in these conditions. Considering that damage estimation for low-cycle fatigue is relatively mature, this study focused on accurate assessment of creep damage to improve the predictive capability of the LDS theory under creep–fatigue conditions. Specifically, the fatigue damage per cycle was calculated as the reciprocal of the low-cycle fatigue test life (Nf0) for an identical strain range. Subsequently, the creep damage per cycle was evaluated using the time fraction (TF) method [29] and the strain energy density dissipation method [30,31].
N c - f = 1 d f + d c
In Equation (3), Nc-f is the creep–fatigue interaction life, df is the fatigue damage per cycle, and dc indicates the creep damage per cycle.
In the time fraction (TF) method, the creep damage per cycle is evaluated using Equation (4) [32,33].
d c = 0 t c 1 t R   d t
In this equation, tR indicates the creep rupture times corresponding to different stresses and tc is the creep time of a single cycle.
Under constant temperature conditions, the relationship between the creep rupture time (tR) and the applied stress ( σ ) is expressed by Equation (5) [34].
t R ( σ , T ) = k T F · σ α T F
In this equation, kTF and αTF are temperature- and material-dependent parameters that are obtained by fitting the creep stress values with corresponding rupture times. However, for strain-controlled fatigue tests with dwell periods, the stress during creep does not remain constant but undergoes relaxation while maintaining constant strain. This phenomenon, essentially caused by creep, represents an opposite effect compared to constant-stress creep. Previous researchers have conducted extensive studies on stress relaxation, leading to the Feltham equation, which is widely used in engineering applications [35].
σ = σ 0 · 1 B · ln ( b t + 1 )
In this equation, B and b are model parameters in the empirical stress relaxation formula. σ 0 represents the initial stress of relaxation, and t denotes the relaxation time from the beginning of the dwell period. During the stress relaxation phase, Equation (6) describes the stress reduction during the dwell time, which can be combined with Equation (5) to obtain the creep rupture times corresponding to different stress levels. By integrating Equations (4)–(6), a creep–fatigue life prediction ( N c f T F ) can be obtained using the TF method [34].
N c - f T F = 1 N f 0 + 0 t c 1 k T F · σ 0 B σ 0 · ln ( b t + 1 ) α T F d t 1
Building on the LDS theory, this study also adopted an alternative strain energy density dissipation model. This model, developed by Takahashi [30,31] through extensive experimental data analysis, represents a modification of the SEDE model [36]. This model proposes that creep damage can be neglected during the initial phase of stress relaxation in the dwell period, which has a high inelastic strain rate. Consequently, the creep damage per cycle is calculated using Equation (8). In this equation, the inelastic strain energy density dissipation rate ( w ˙ i n ) and the inelastic strain energy density ( w f w ˙ i n , T ) are related as shown in Equation (9).
d c T S E D E = 0 t e w ˙ i n min w f ( w ˙ i n , T ) , w f , c r i t ( T ) w ˙ i n w f , c r i t ( T ) d t
w f = B exp Q R T w ˙ i n n
In this context, w f , c r i t ( T ) is the critical inelastic strain energy density, which corresponds to the upper plateau of the inelastic strain energy density obtained from creep tests [37]. B and n are material-dependent parameters determined through fitting, R is the universal gas constant, and Q denotes the activation energy in the SEDE model [34]. At a constant temperature, the relationship between the inelastic strain energy density dissipation rate ( w ˙ i n ) and the inelastic strain energy density ( w f w ˙ i n , T ) in Equation (9) can be expressed as follows:
w f w ˙ i n , T = φ w ˙ i n n
Here, φ and n represent material- and temperature-dependent model parameters, respectively, that are determined by fitting creep results at various temperatures.
The inelastic strain energy density dissipation rate ( w ˙ i n ) during the stress relaxation phase under strain control can be expressed using Equation (11), and the creep inelastic strain energy during a single cycle is represented by the shaded area in Figure 9c.
w ˙ i n = σ ˙ E · σ
By differentiating the Feltham stress relaxation formula (Equation (6)) with respect to the creep dwell time (t), the stress relaxation rate can be obtained as follows [38]:
σ ˙ = σ 0 B b b t + 1
Therefore, by combining Equations (4), (8), and (10), the creep–fatigue damage expression at a constant temperature can be derived as follows:
N c f T S E D E = 1 N f 0 + 0 t d w ˙ i n min ( φ w ˙ i n n , w f , c r i t ( T ) ) w ˙ i n w f , c r i t ( T ) d t 1
where
w ˙ i n = σ 0 B b σ ( b t + 1 ) E
In this study, the creep damage parameters were determined by fitting φ and n in Equation (10) through a series of creep tests at various stress levels. The objective of this approach was to establish a relationship between the failure inelastic strain energy density and the instantaneous inelastic strain energy density dissipation rate. Specifically, for a given stress level ( σ ) in LCF tests, the values of w ˙ i n and w f can be obtained through the transformation from creep ductility ( ε f ) and the creep rupture time ( t R ), as expressed in the following equations [25]:
w ˙ i n = σ ln ( 1 + ε f ) t R
w f = σ ln ( 1 + ε f )
The results of creep tests for medium-silicon molybdenum ductile iron at various temperatures and stress levels are presented in Figure 10.
Based on the creep test results, the relationship curves ( w ˙ i n w f ) and corresponding parameter fitting results for medium-silicon molybdenum ductile iron at three different temperatures are presented in Figure 11.
As shown in Figure 11, for medium-silicon molybdenum ductile iron at 400 °C, 600 °C, and 700 °C, when w ˙ i n is below 0.02 MJ/m3/s, 0.015 MJ/m3/s, and 0.01 MJ/m3/s, respectively, w f increases with increasing w ˙ i n values. However, as w ˙ i n continues to rise, w f begins to stabilize or slightly decrease due to the reduced creep ductility of the material under high stress, as indicated by the dashed lines in Figure 11. Consequently, the critical inelastic strain energy density ( w f , c r i t ) values for medium-silicon molybdenum ductile iron were determined to be 79 MJ/m3, 24 MJ/m3, and 11.5 MJ/m3 at 400 °C, 600 °C, and 700 °C, respectively.
Since the Feltham empirical formula was employed to characterize the stress relaxation process in this study, it was necessary to determine the relevant parameters in this formula. The fitting results are shown in Figure 12, and the parameters obtained under various conditions are listed in Table 4.
Based on the aforementioned parameters, the life prediction results of creep–fatigue interaction tests using both the TF and T-SEDE models are presented in Figure 13a,b, respectively. The failure criterion was defined as the cumulative sum of fatigue damage and creep damage reaching one.
Regarding the TF model shown in Figure 13a, the predictions yielded relatively satisfactory results at 600 °C, with all data points falling within the 2× scatter band. However, the predictions were less accurate at other temperatures. Overall, the predictions across all temperatures tended to be conservative, with some data points at 700 °C approaching the 3× scatter band. Notably, for one condition (400 °C, 0.4%, and 60 s), the prediction exceeded the 10× scatter band. This discrepancy arose because the TF model considers creep to be solely dependent on stress and time, and according to Equation (5), life exhibits a power-law relationship with stress, meaning higher stress leads to a shorter life. In this study, this approach overestimated creep damage during the initial high-stress phase of the dwell period. Furthermore, even after stress relaxation stabilized during the prolonged dwell times, creep damage continued to accumulate. For stress relaxation that maintained relatively stable higher stress levels during the dwell period, the relatively high stable stress resulted in overestimated creep damage, leading to conservative predictions.
In contrast, the T-SEDE model presented in Figure 13b employs a strain energy density dissipation approach based on the relationship between material failure and energy. This model incorporates Takahashi’s concept of creep damage immunity at higher inelastic strain energy density dissipation rates, resulting in more accurate predictions compared to the TF model.
Previous LCF tests have established the relationship between fatigue life and strain using the Basquin–Manson–Coffin equation. While this equation offers simplicity and versatility, it calculates fatigue life solely based on strain as the life parameter, neglecting the influence of stress responses at elevated temperatures. To address this limitation, researchers have proposed alternative approaches that correlate the external energy put into a material with low-cycle fatigue life [39]. These energy-based methods are generally thought to better reveal the fundamental nature of low-cycle fatigue damage, offering a clearer picture of its physical significance and improved accuracy compared to the Manson–Coffin equation.
This study employed the net tensile hysteresis energy method (the Ostergren method [40]), which was developed based on the cumulative plastic strain energy approach [41]. In the Ostergren method, fatigue failure is primarily caused by tensile stress. The mathematical formulation of the Ostergren method is expressed as follows [40]:
N f = c Δ W t d
Δ W t = σ m a x Δ ε p
In this equation, c and d represent constant coefficients; Δ W t is the net tensile hysteresis energy; and the energy representations during low-cycle fatigue (LCF) and creep–fatigue hysteresis loop processes are illustrated by the shaded areas in Figure 9a,b, respectively. Specifically, Figure 9b demonstrates that the net tensile hysteresis energy in creep–fatigue processes is calculated based on the corresponding LCF condition. σ m a x is the cyclic stress peak, and Δ ε p represents the plastic strain range. For medium-silicon molybdenum ductile iron, the fitting results of parameters c and d using the Ostergren method are presented in Figure 14.
An analysis was conducted from an energy perspective. Ratio R1 was obtained by dividing the net tensile hysteresis energy by the creep inelastic strain energy in the creep–fatigue hysteresis loops at various strain amplitudes. The relationship between creep–fatigue life and R1 at different temperatures is presented in Figure 15. The results show that at all temperatures, R1 gradually increases with an increasing strain amplitude, while the creep–fatigue life decreases with an increasing R1. This indicates that the fatigue damage caused by an increasing strain amplitude plays an important role in creep–fatigue damage. However, as the strain amplitude increases, the curves show different trends at different temperatures. For example, at 400 °C, R1 increases from 7.84 to 9.70 and the life decreases by 1364 cycles. In contrast, at 700 °C, R1 increases from 10.38 to 17.32, but the life only decreases by 865 cycles. This demonstrates that as temperature increases, the influence of net tensile hysteresis energy damage on life caused by strain amplitude changes decreases. Correspondingly, it also indicates that the influence of creep inelastic strain energy on life increases. These findings are consistent with the actual situation, where creep effects become stronger at higher temperatures.
From the perspective of damage, by using the T-SEDE method to calculate the creep damage per half-cycle and employing the Ostergren method to determine the fatigue damage per half-cycle under LCF conditions, prediction results were obtained through the linear damage summation (LDS) approach, as shown in Figure 16.
As shown in Figure 16, the LDS damage accumulation approach combining the T-SEDE and Ostergren methods demonstrates satisfactory life prediction accuracy, with only two data points exceeding the 1.5× scatter band. This result confirms the effectiveness of this combined method for life prediction.

4. Conclusions

In this study, low-cycle fatigue tests and fatigue tests with dwell periods were used to investigate the stress–strain response behavior and life characteristics of medium-silicon molybdenum ductile iron. Combined with creep tests, the relationship between the instantaneous inelastic strain energy density dissipation rate and the inelastic strain energy density at different temperatures was established. Based on these findings, a creep–fatigue damage model was developed using the linear damage summation (LDS) method, which integrates the creep strain energy density dissipation approach with the Ostergren method. The main conclusions are as follows:
  • In low-cycle fatigue tests, medium-silicon molybdenum ductile iron exhibits cyclic hardening at room temperature and intermediate temperatures (400 °C), while significant cyclic softening occurs at elevated temperatures. Additionally, the hysteresis loops demonstrate nearly symmetric tension–compression behavior, and this material’s plastic deformation capability is enhanced with increasing temperatures.
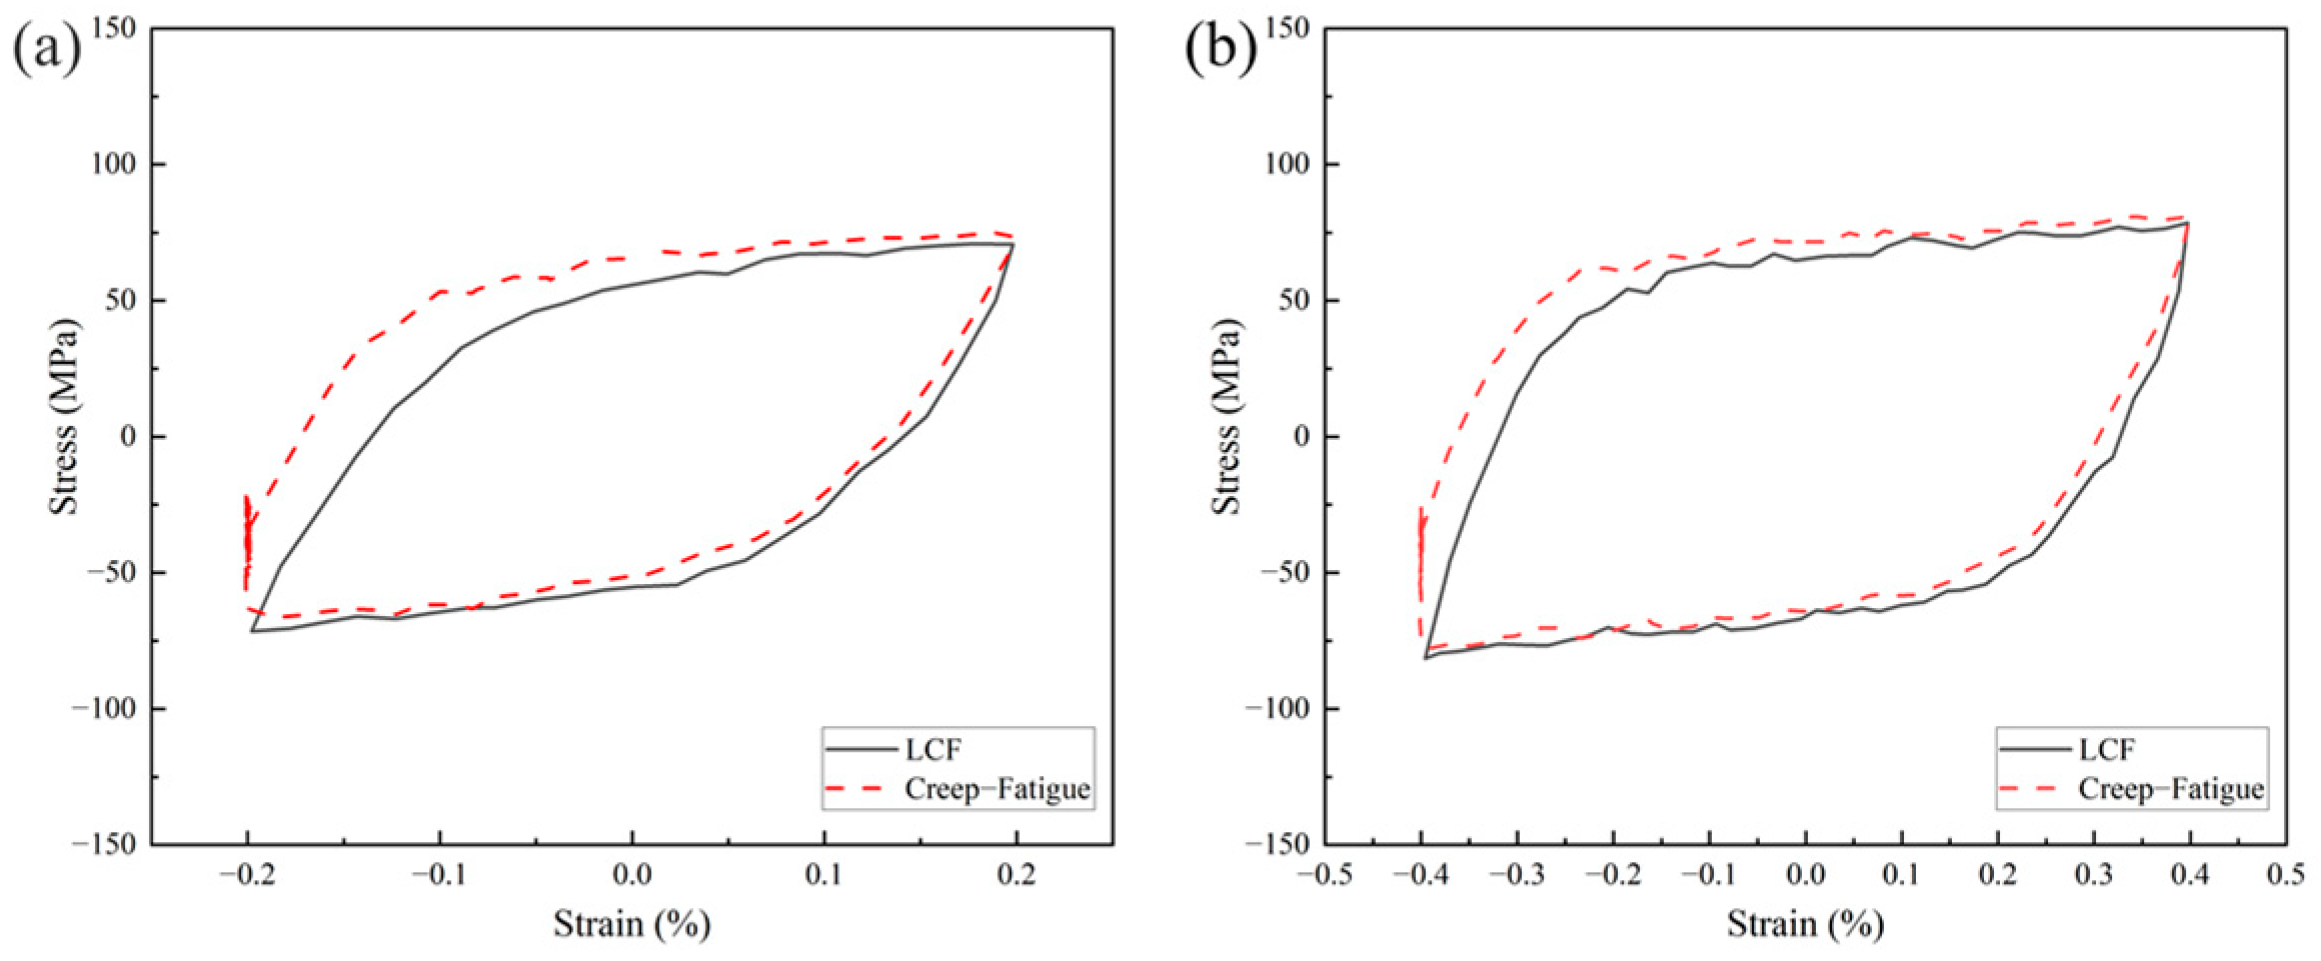
  • Under intermediate- and high-temperature conditions with dwell periods, the creep–fatigue cycles maintain the softening/hardening characteristics observed in LCF conditions. The stable cyclic yield radius and elastic modulus during loading–unloading phases remain essentially unchanged, indicating minimal alterations in the hysteresis loop shape. However, creep effects cause a slight upward shift in the yield center during a cyclic response.
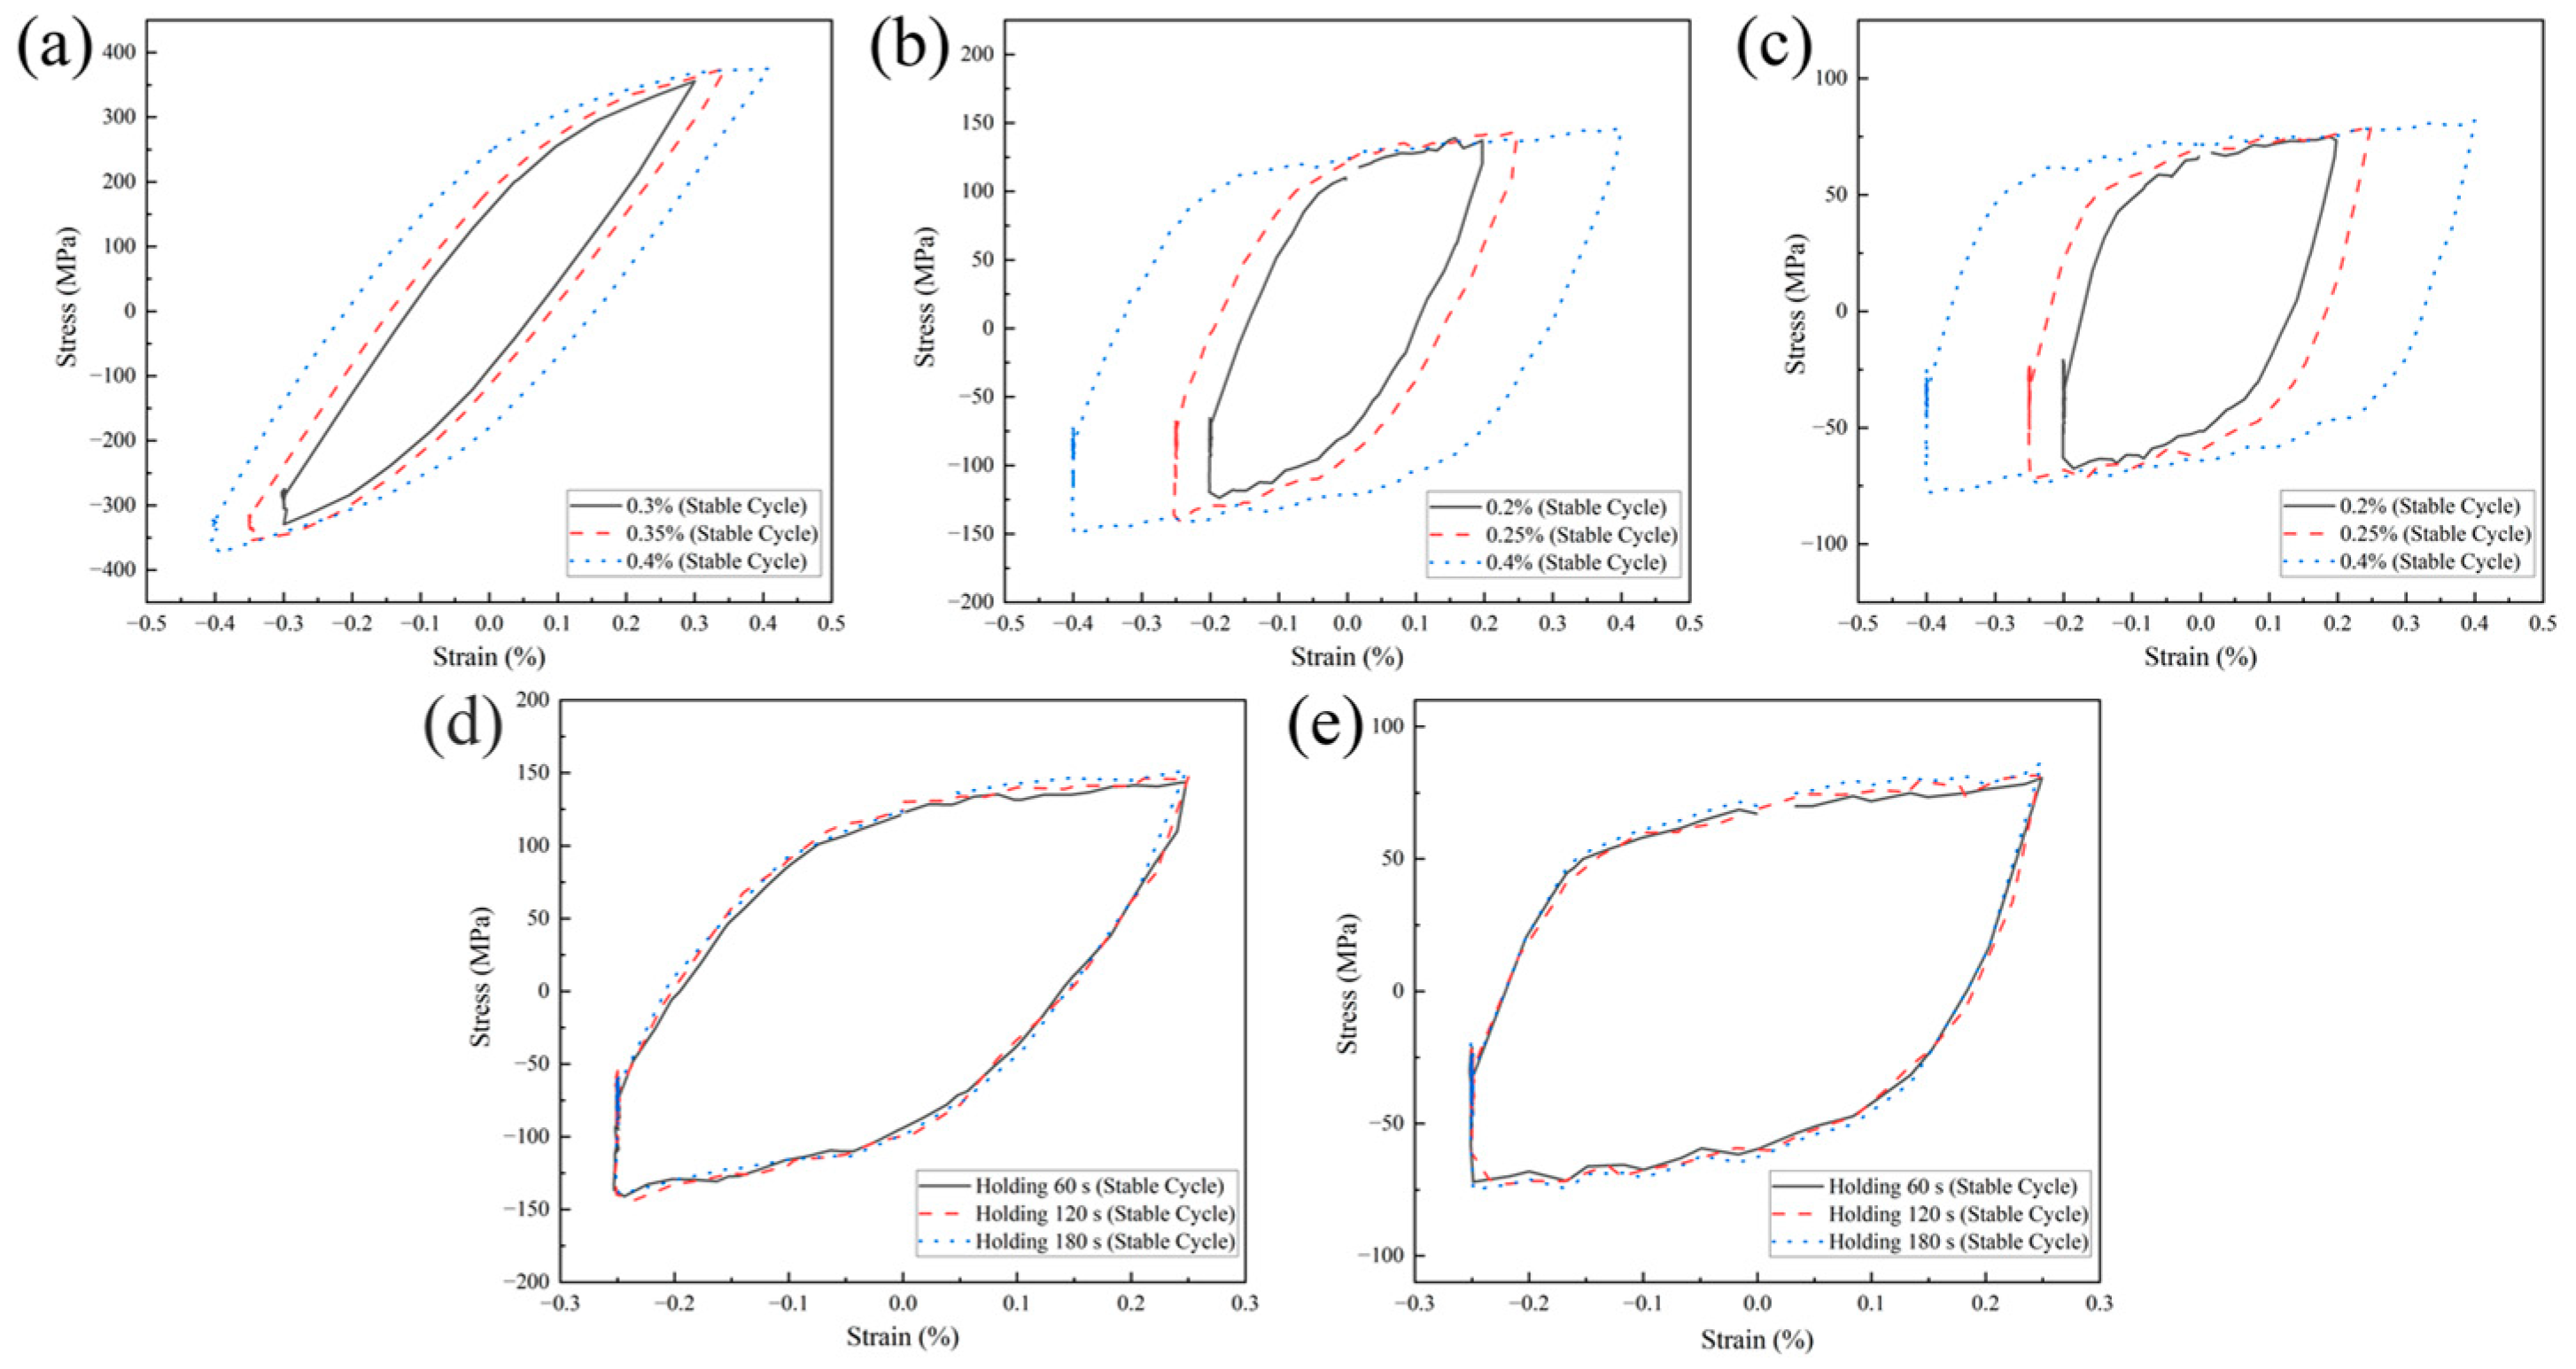
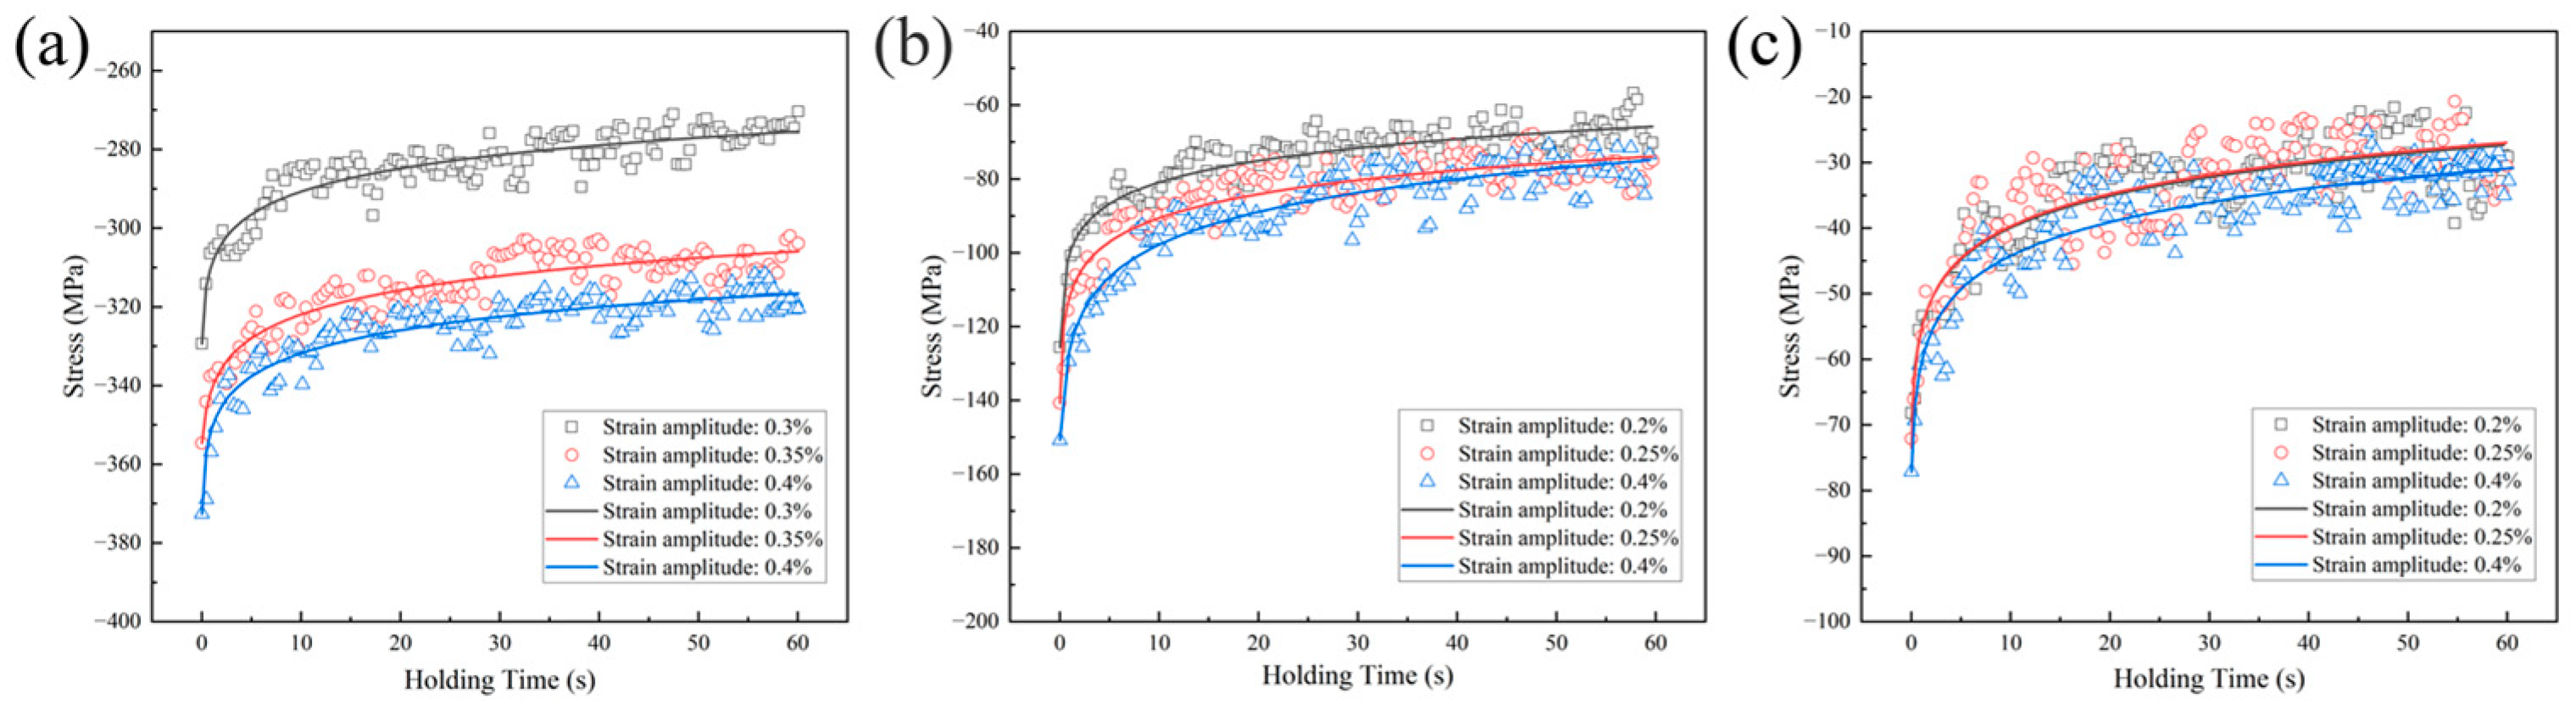
  • In creep–fatigue interaction cycles, strain amplitude variations do not significantly alter the overall shape of fatigue hysteresis loops but result in a more pronounced upward shift in the yield center at lower strain amplitudes compared to higher ones. At elevated temperatures, since stress relaxation primarily occurs during the initial dwell period, the stress values at the ends of the dwell times showed minimal differences across the three tested dwell periods.
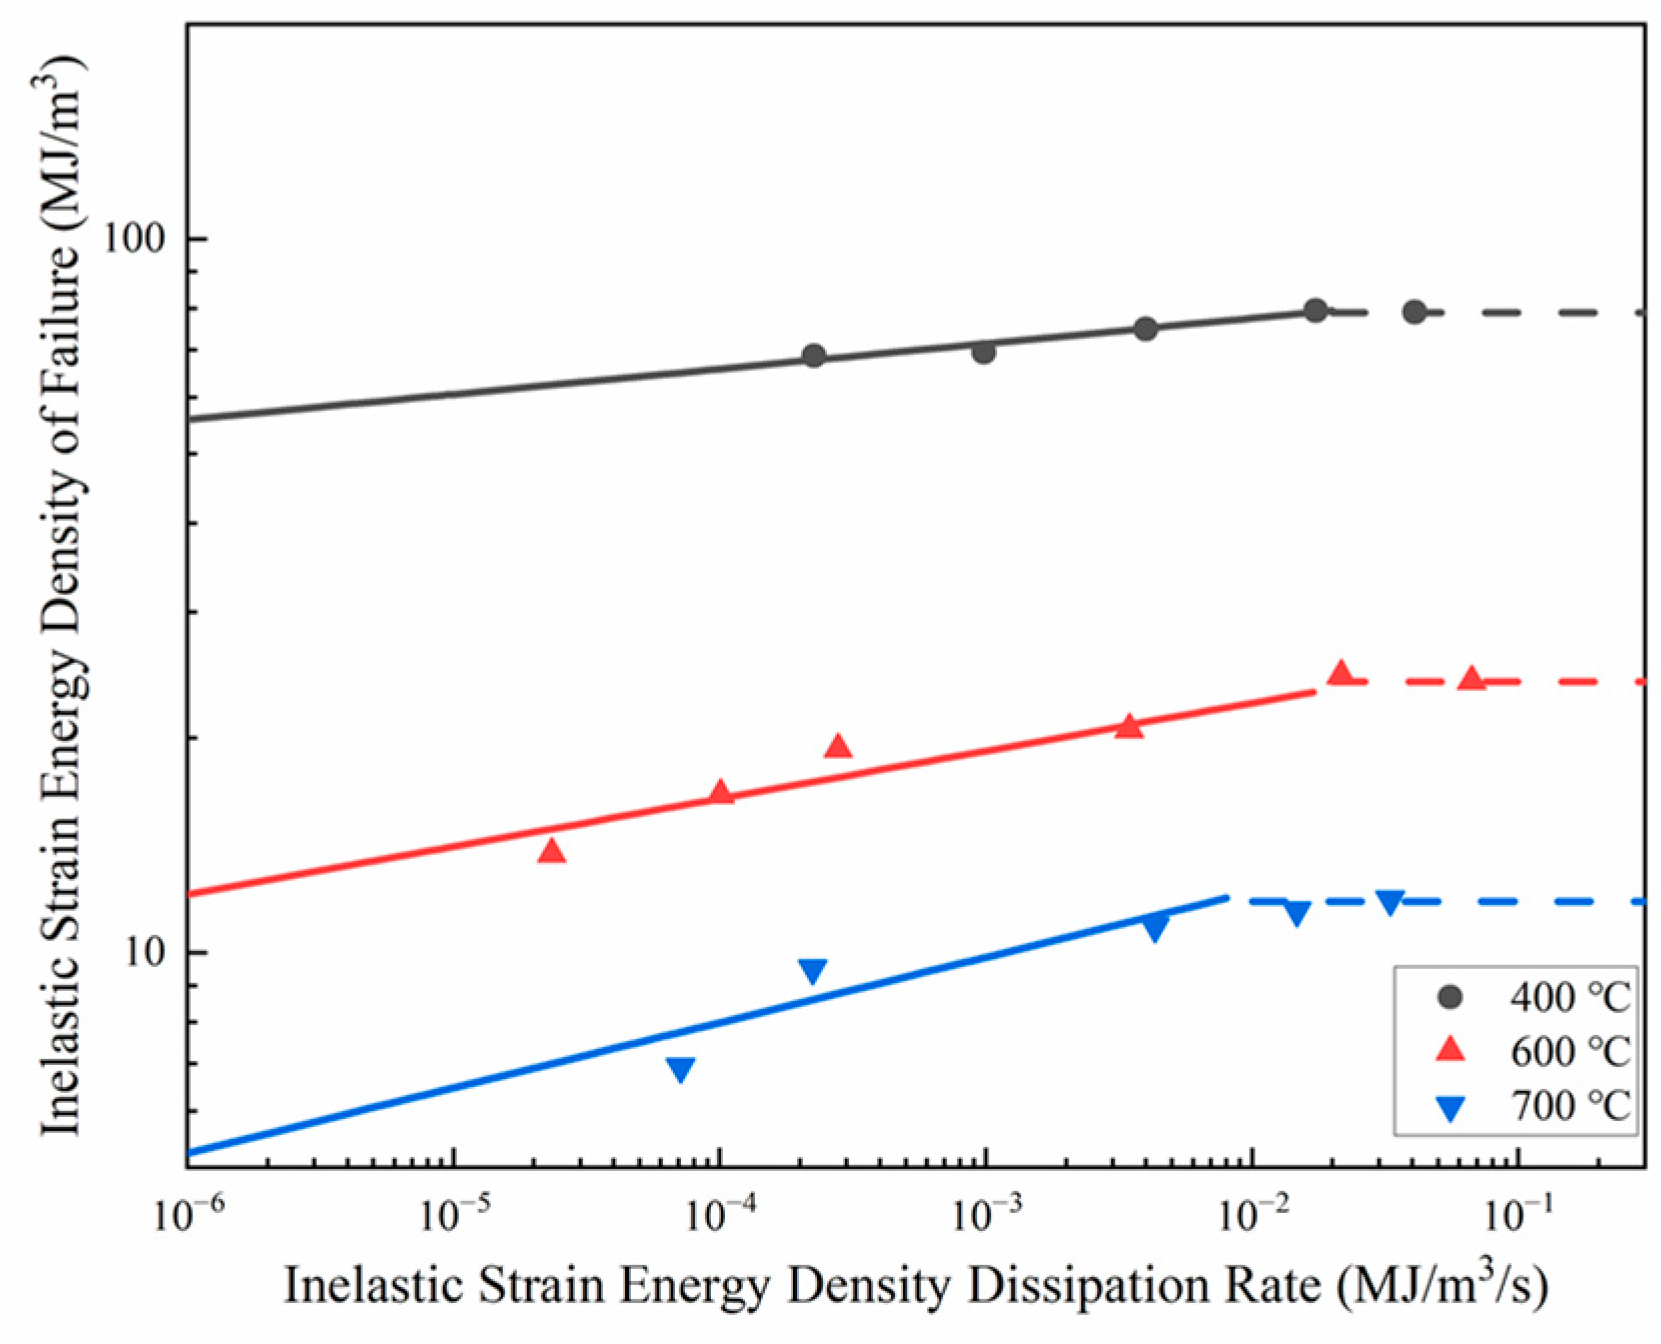
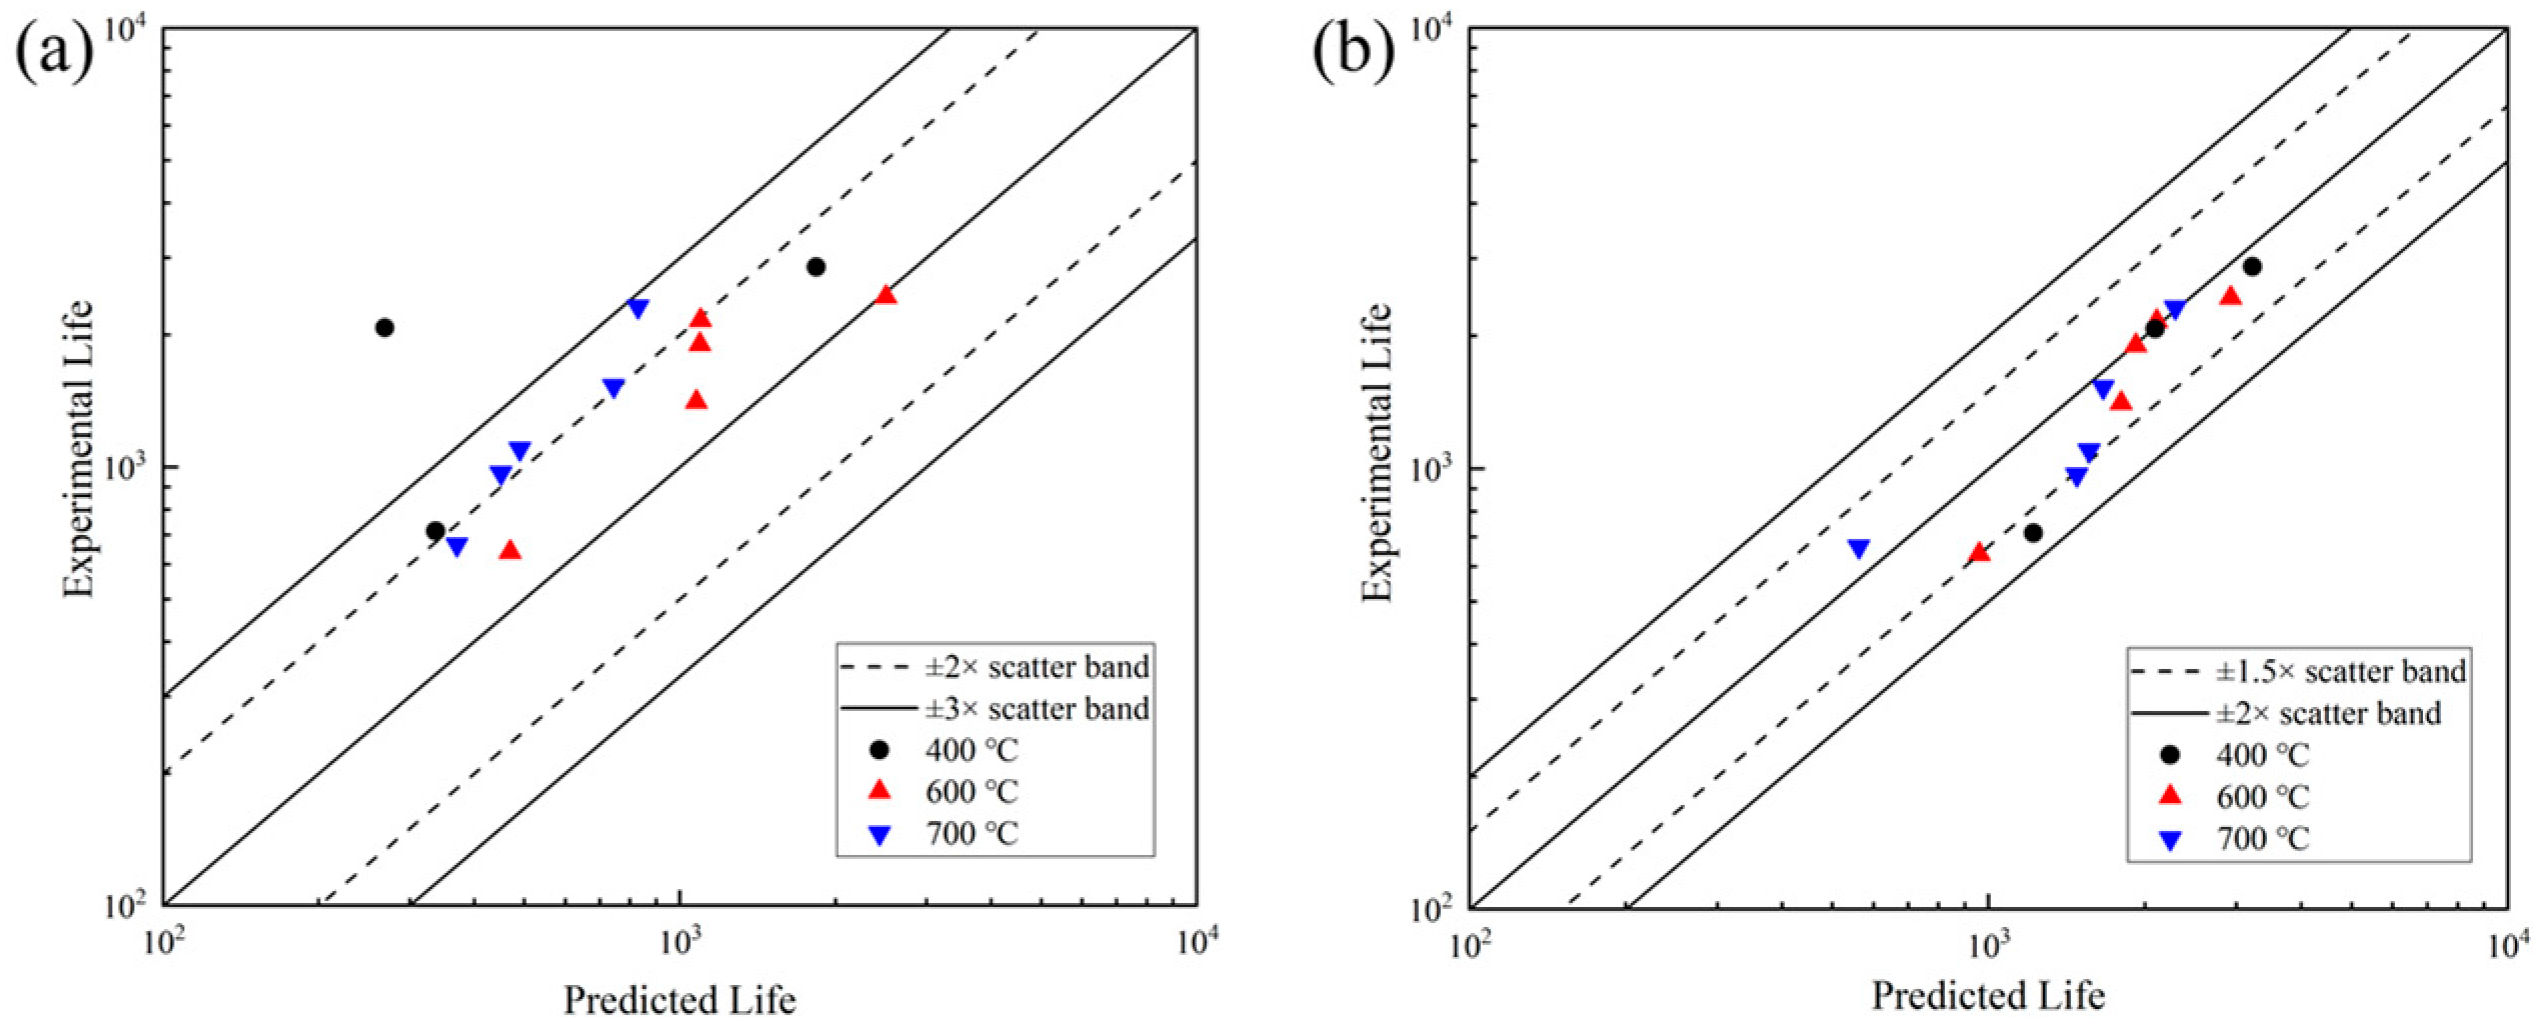
  • Accurate characterization of damage caused by stress relaxation during dwell periods is crucial for creep damage calculation. While the TF model showed discrepancies with the experimental results, the combined T-SEDE model and Ostergren method provided excellent creep–fatigue life predictions, with only 2 out of 13 data points falling outside the 1.5× scatter band.

Author Contributions

Conceptualization, M.L. and H.F.; methodology, M.L.; software, M.L.; validation, M.L. and P.R.; formal analysis, H.F.; investigation, M.L. and P.R.; resources, H.F. and P.R.; data curation, M.L.; writing—original draft preparation, M.L.; writing—review and editing, H.F.; visualization, P.R.; supervision, H.F.; project administration, H.F.; funding acquisition, H.F. and P.R. All authors have read and agreed to the published version of the manuscript.

Funding

This research was funded by the Vehicle Power Basic Research and Innovation Program of China (grant number 3030021222472) and the National Funded Postdoctoral Researcher Program (grant GZC20233400).

Institutional Review Board Statement

Not applicable.

Informed Consent Statement

Not applicable.

Data Availability Statement

Data are available upon reasonable request from the corresponding authors.

Conflicts of Interest

The authors declare no conflicts of interest.

References

  1. Wu, X.; Quan, G.; MacNeil, R.; Zhang, Z.; Sloss, C. Failure mechanisms and damage model of ductile cast iron under low-cycle fatigue conditions. Metall. Mater. Trans. A 2014, 45, 5085–5097. [Google Scholar] [CrossRef]
  2. Xiang, S.; Jonsson, S.; Hedström, P.; Zhu, B.; Odqvist, J. Influence of ferritic nitrocarburizing on the high-temperature corrosion-fatigue properties of the Si-Mo-Al cast iron SiMo1000. Int. J. Fatigue 2021, 143, 105984. [Google Scholar] [CrossRef]
  3. Szmytka, F.; Michaud, P.; Rémy, L.; Köster, A. Thermo-mechanical fatigue resistance characterization and materials ranking from heat-flux-controlled tests. Application to cast-irons for automotive exhaust part. Int. J. Fatigue 2013, 55, 136–146. [Google Scholar] [CrossRef]
  4. Ram, N.; Gautam, V. Prediction of effect of alloying elements on properties of ferritic grade Si-Mo ductile cast iron using regression analysis. Mater. Today: Proc. 2022, 62, 3855–3859. [Google Scholar] [CrossRef]
  5. Wu, X.; Zhang, Z. A mechanism-based approach from low cycle fatigue to thermomechanical fatigue life prediction. J. Eng. Gas Turbines Power 2016, 138, 072503. [Google Scholar] [CrossRef]
  6. Di Cocco, V.; Iacoviello, F.; Cavallini, M. Damaging micromechanisms characterization of a ferritic ductile cast iron. Eng. Fract. Mech. 2010, 77, 2016–2023. [Google Scholar] [CrossRef]
  7. Norman, V.; Skoglund, P.; Leidermark, D.; Moverare, J. Damage mechanisms in silicon-molybdenum cast irons subjected to thermo-mechanical fatigue. Int. J. Fatigue 2017, 99, 258–265. [Google Scholar] [CrossRef]
  8. Seifert, T.; Riedel, H. Mechanism-based thermomechanical fatigue life prediction of cast iron. Part I: Models. Int. J. Fatigue 2010, 32, 1358–1367. [Google Scholar] [CrossRef]
  9. Black, B.; Burger, G.; Logan, R.; Perrin, R.; Gundlach, R. Microstructure and dimensional stability in Si-Mo ductile irons for elevated temperature applications. SAE Trans. 2002, 111, 976–991. Available online: https://www.jstor.org/stable/44718728 (accessed on 11 March 2025).
  10. Bartošák, M.; Novotný, C.; Španiel, M.; Doubrava, K. Life assessment of SiMo 4.06 cast iron under LCF and TMF loading conditions. Mater. High Temp. 2019, 36, 285–295. [Google Scholar] [CrossRef]
  11. Lekakh, S.N.; Buchely, M.; O’Malley, R.; Godlewski, L.; Li, M. Thermo-cycling fatigue of SiMo ductile iron using a modified thermo-mechanical test. Int. J. Fatigue 2021, 148, 106218. [Google Scholar] [CrossRef]
  12. Wu, Q.; Tan, B.; Pang, J.; Shi, F.; Jiang, A.; Zou, C.; Zhang, Y.; Li, S.; Zhang, Y.; Li, X.; et al. Low-Cycle Fatigue Damage Mechanism and Life Prediction of High-Strength Compacted Graphite Cast Iron at Different Temperatures. Materials 2024, 17, 4266. [Google Scholar] [CrossRef]
  13. Collini, L.; Pirondi, A. Microstructural, multilevel simulation of notch effect in ferritic ductile cast iron under low cycle fatigue. Int. J. Fatigue 2022, 162, 106993. [Google Scholar] [CrossRef]
  14. Kim, Y.J.; Jang, H.; Oh, Y.J. High-temperature low-cycle fatigue property of heat-resistant ductile-cast irons. Metall. Mater. Trans. A 2009, 40, 2087–2097. [Google Scholar] [CrossRef]
  15. Charkaluk, E.; Constantinescu, A. An energetic approach in thermomechanical fatigue for silicon molybdenum cast iron. Mater. High Temp. 2000, 17, 373–380. [Google Scholar] [CrossRef]
  16. Pierce, D.; Haynes, A.; Hughes, J.; Graves, R.; Maziasz, P.; Muralidharan, G.; Shyam, A.; Wang, B.; England, R.; Daniel, C. High temperature materials for heavy duty diesel engines: Historical and future trends. Prog. Mater. Sci. 2019, 103, 109–179. [Google Scholar] [CrossRef]
  17. Ibrahim, M.M.; Nofal, A.; Mourad, M.M. Microstructure and Hot Oxidation Resistance of SiMo Ductile Cast Irons Containing Si-Mo-Al. Metall. Mater. Trans. B 2017, 48, 1149–1157. [Google Scholar] [CrossRef]
  18. Öberg, C.; Zhu, B.; Jonsson, S. Creep, strain and oxidation damage in the ferritic ductile cast iron SiMo51 at 700 °C. Mater. High Temp. 2020, 37, 178–195. [Google Scholar] [CrossRef]
  19. Yang, Y.; Cao, Z.; Lian, Z.; Yu, H. Thermal Fatigue Behavior and Cracking Characteristics of High Si-Mo Nodular Cast Iron for Exhaust Manifolds. J. Iron Steel Res. Int. 2013, 20, 52–57. [Google Scholar] [CrossRef]
  20. Ostash, O.P.; Panasyuk, V.V.; Andreiko, I.M.; Chepil’, R.V.; Kulyk, V.V.; Vira, V.V. Methods for the construction of the diagrams of fatigue crack-growth rate of materials. Mater. Sci. 2007, 43, 479–491. [Google Scholar] [CrossRef]
  21. GB/T 15248-2008; The Test Mehod for Axial Loading Constant-Amplitude Low-Cycle Fatigue of Metallic Materials. Standards Press of China: Beijing, China, 2008.
  22. Li, Z.; Han, J.; Li, W.; Pan, L. Low cycle fatigue behavior of Cr–Mo–V low alloy steel used for railway brake discs. Mater. Des. (1980–2015) 2014, 56, 146–157. [Google Scholar] [CrossRef]
  23. Okorokov, V.; Gorash, Y.; Mackenzie, D.; van Rijswick, R. New formulation of nonlinear kinematic hardening model, Part II: Cyclic hardening/softening and ratcheting. Int. J. Plast. 2019, 122, 244–267. [Google Scholar] [CrossRef]
  24. Guo, B.; Zhang, W.; Li, S.; Wang, X. High temperature low cycle fatigue and creep-fatigue behavior of a casting Al-9Si-CuMg alloy used for cylinder heads. Mater. Sci. Eng. A 2017, 700, 397–405. [Google Scholar] [CrossRef]
  25. Mikkola, E.; Marquis, G.; Lehto, P.; Remes, H.; Hänninen, H. Material characterization of high-frequency mechanical impact (HFMI)-treated high-strength steel. Mater. Des. 2016, 89, 205–214. [Google Scholar] [CrossRef]
  26. Sornette, D.; Magnin, T.; Brechet, Y. The physical origin of the Coffin-Manson law in low-cycle fatigue. Europhys. Lett. 1992, 20, 433. [Google Scholar] [CrossRef]
  27. Wang, R.; Zhu, X.; Zhang, X.; Tu, S.; Gong, J.; Zhang, C. A generalized strain energy density exhaustion model allowing for compressive hold effect. Int. J. Fatigue 2017, 104, 61–71. [Google Scholar] [CrossRef]
  28. Zhang, X.; Gong, J.; Xuan, F. A deep learning based life prediction method for components under creep, fatigue and creep-fatigue conditions. Int. J. Fatigue 2021, 148, 106236. [Google Scholar] [CrossRef]
  29. Douzian, G.; Muránsky, O.; Kruzic, J.J.; Wright, R.N.; Payten, W. Assessment of modelling methodologies for prediction of high-temperature creep-fatigue behaviour of Alloy 617. Int. J. Press. Vessel. Pip. 2020, 187, 104150. [Google Scholar] [CrossRef]
  30. Takahashi, Y.; Dogan, B.; Gandy, D. Systematic evaluation of creep-fatigue life prediction methods for various alloys. J. Press. Vessel Technol. 2013, 135, 061204. [Google Scholar] [CrossRef]
  31. Takahashi, Y. Effect of cyclic loading on subsequent creep behaviour and its implications in creep–fatigue life assessment. Mater. High Temp. 2015, 32, 492–501. [Google Scholar] [CrossRef]
  32. Robinson, E.L. Effect of temperature variation on the long-time rupture strength of steels. Trans. Am. Soc. Mech. Eng. 1952, 74, 777–780. [Google Scholar] [CrossRef]
  33. Kim, K.C.; Ma, Y.W.; Kong, B.O.; Kim, M.S.; Kang, S.T. Effect of strain rate on low cycle fatigue with hold time in 9Cr rotor steel. Mater. Res. Innov. 2013, 17, 332–336. [Google Scholar] [CrossRef]
  34. Wang, R.; Zhang, X.; Tu, S.; Zhu, S.; Zhang, C. A modified strain energy density exhaustion model for creep–fatigue life prediction. Int. J. Fatigue 2016, 90, 12–22. [Google Scholar] [CrossRef]
  35. Feltham, P. Stress relaxation in copper and alpha-brasses at low temperatures. J. Inst. Met. 1960, 89, 210–214. [Google Scholar]
  36. Payten, W.M.; Dean, D.W.; Snowden, K.U. A strain energy density method for the prediction of creep–fatigue damage in high temperature components. Mater. Sci. Eng. A 2010, 527, 1920–1925. [Google Scholar] [CrossRef]
  37. Gu, H.; Wang, R.; Kun, Z.; Wang, J.; Sun, L.; Li, K.; Liu, Y.; Zhang, X.; Tu, S. System-level creep-fatigue reliability evaluation by engineering damage mechanics incorporating cumulative damage-damage threshold interference. Int. J. Fatigue 2023, 176, 107768. [Google Scholar] [CrossRef]
  38. Mao, J.; Li, X.; Wang, D.; Zhong, F.; Luo, L.; Bao, S.; Ding, Z. Experimental study on creep-fatigue behaviors of chinese P92 steel with consideration of several important factors. Int. J. Fatigue 2021, 142, 105900. [Google Scholar] [CrossRef]
  39. Tchankov, D.S.; Vesselinov, K.V. Fatigue life prediction under random loading using total hysteresis energy. Int. J. Press. Vessel. Pip. 1998, 75, 955–960. [Google Scholar] [CrossRef]
  40. Ostergren, W.J. A damage function and associated failure equations for predicting hold time and frequency effects in elevated temperature, low cycle fatigue. J. Test. Eval. 1976, 4, 327–339. [Google Scholar] [CrossRef]
  41. Hong, S.G.; Yoon, S.; Lee, S.B. The effect of temperature on low-cycle fatigue behavior of prior cold worked 316L stainless steel. Int. J. Fatigue 2003, 25, 1293–1300. [Google Scholar] [CrossRef]
Figure 1. Load setup for low-cycle fatigue test and creep–fatigue interaction test. (a) Low-cycle fatigue test waveform and (b) creep–fatigue interaction test waveform.
Applsci 15 05406 g001
Figure 2. Low-cycle fatigue specimen. (a) Size diagram of fatigue specimen and (b) physical photo of fatigue specimen.
Applsci 15 05406 g002
Figure 3. A comparison of the first−cycle hysteresis loops with the nominal stabilized hysteresis loops at each temperature: (a) RT, (b) 400 °C, (c) 600 °C, and (d) 700 °C.
Applsci 15 05406 g003
Figure 4. The strain–life relationships of the ductile iron material at various temperatures: (a) RT, (b) 400 °C, (c) 600 °C, and (d) 700 °C.
Applsci 15 05406 g004
Figure 5. Comparison of creep–fatigue and LCF hysteresis loops at 400 °C under different strain amplitudes. (a) Strain amplitude of 0.3% and (b) strain amplitude of 0.4%.
Applsci 15 05406 g005
Figure 6. Comparison of creep–fatigue and LCF hysteresis loops at 600 °C under different strain amplitudes. (a) Strain amplitude of 0.2% and (b) strain amplitude of 0.4%.
Applsci 15 05406 g006
Figure 7. Comparison of creep–fatigue and LCF hysteresis loops at 700 °C under different strain amplitudes. (a) Strain amplitude of 0.2% and (b) strain amplitude of 0.4%.
Applsci 15 05406 g007
Figure 8. Stabilized hysteresis loops under various creep–fatigue conditions. (a) Stabilized hysteresis loops at 400 °C under various strain amplitudes, (b) stabilized hysteresis loops at 600 °C under various strain amplitudes, (c) stabilized hysteresis loops at 700 °C under various strain amplitudes, (d) stabilized hysteresis loops at 600 °C with various hold times, and (e) stabilized hysteresis loops at 700 °C with various hold times.
Applsci 15 05406 g008
Figure 9. The shaded area within the hysteresis loop represents the energy contributing to fatigue/creep damage during a single cycle. (a) The net tensile hysteresis energy in LCF processes, (b) the LCF net tensile hysteresis energy under creep–fatigue interaction, and (c) the inelastic strain energy during creep processes.
Applsci 15 05406 g009
Figure 10. Creep curves of medium-silicon molybdenum ductile iron at various temperatures: (a) 400 °C, (b) 600 °C, and (c) 700 °C.
Applsci 15 05406 g010
Figure 11. Relationship between instantaneous inelastic strain energy density dissipation rate and inelastic strain energy density for medium-silicon molybdenum ductile iron at various temperatures.
Applsci 15 05406 g011
Figure 12. Experimental data and curve fitting of stress relaxation at different temperatures: (a) 400 °C, (b) 600 °C, and (c) 700 °C.
Applsci 15 05406 g012
Figure 13. Life prediction results using the TF method and the T-SEDE method: (a) the TF model and (b) the T-SEDE model.
Applsci 15 05406 g013
Figure 14. Relationship between net tensile hysteresis energy and fatigue life for medium-silicon molybdenum ductile iron at various temperatures.
Applsci 15 05406 g014
Figure 15. The influence of the ratio (R1) of net tensile hysteresis energy to creep inelastic strain energy on creep–fatigue life.
Applsci 15 05406 g015
Figure 16. Life prediction results using the combined T-SEDE and Ostergren methods.
Applsci 15 05406 g016
Table 1. The chemical composition of the ductile iron (wt. %).
ElementCSiMnMoPSMgRe
Quantity3.184.430.350.630.060.0120.0380.031
Table 2. The coefficients of the cyclic stress–strain curves at various temperatures.
Temperature (°C)RT400600700
K (MPa)702.966570.588292.889154.947
n 0.0810.0660.1210.122
Table 3. Model parameters of medium-silicon molybdenum ductile iron at different temperatures.
Temperature (°C) σ f (MPa)b ε f c
RT664.95−0.0540.658−0.786
400540.36−0.0490.095−0.528
600299.00−0.1000.170−0.541
70099.45−0.0370.805−0.726
Table 4. Fitted parameters of stress relaxation at various temperatures obtained from experiments.
Temperature (°C)400 °C600 °C700 °C
B 0.0260.0260.023
b5.573.5711.90
Disclaimer/Publisher’s Note: The statements, opinions and data contained in all publications are solely those of the individual author(s) and contributor(s) and not of MDPI and/or the editor(s). MDPI and/or the editor(s) disclaim responsibility for any injury to people or property resulting from any ideas, methods, instructions or products referred to in the content.

