
Spatiotemporal Dynamics of Ecosystem Service Value and Its Linkages with Landscape Pattern Changes in Xiong’an New Area, China (2014–2022)

Abstract
1. Introduction
2. Study Area and Data Sources
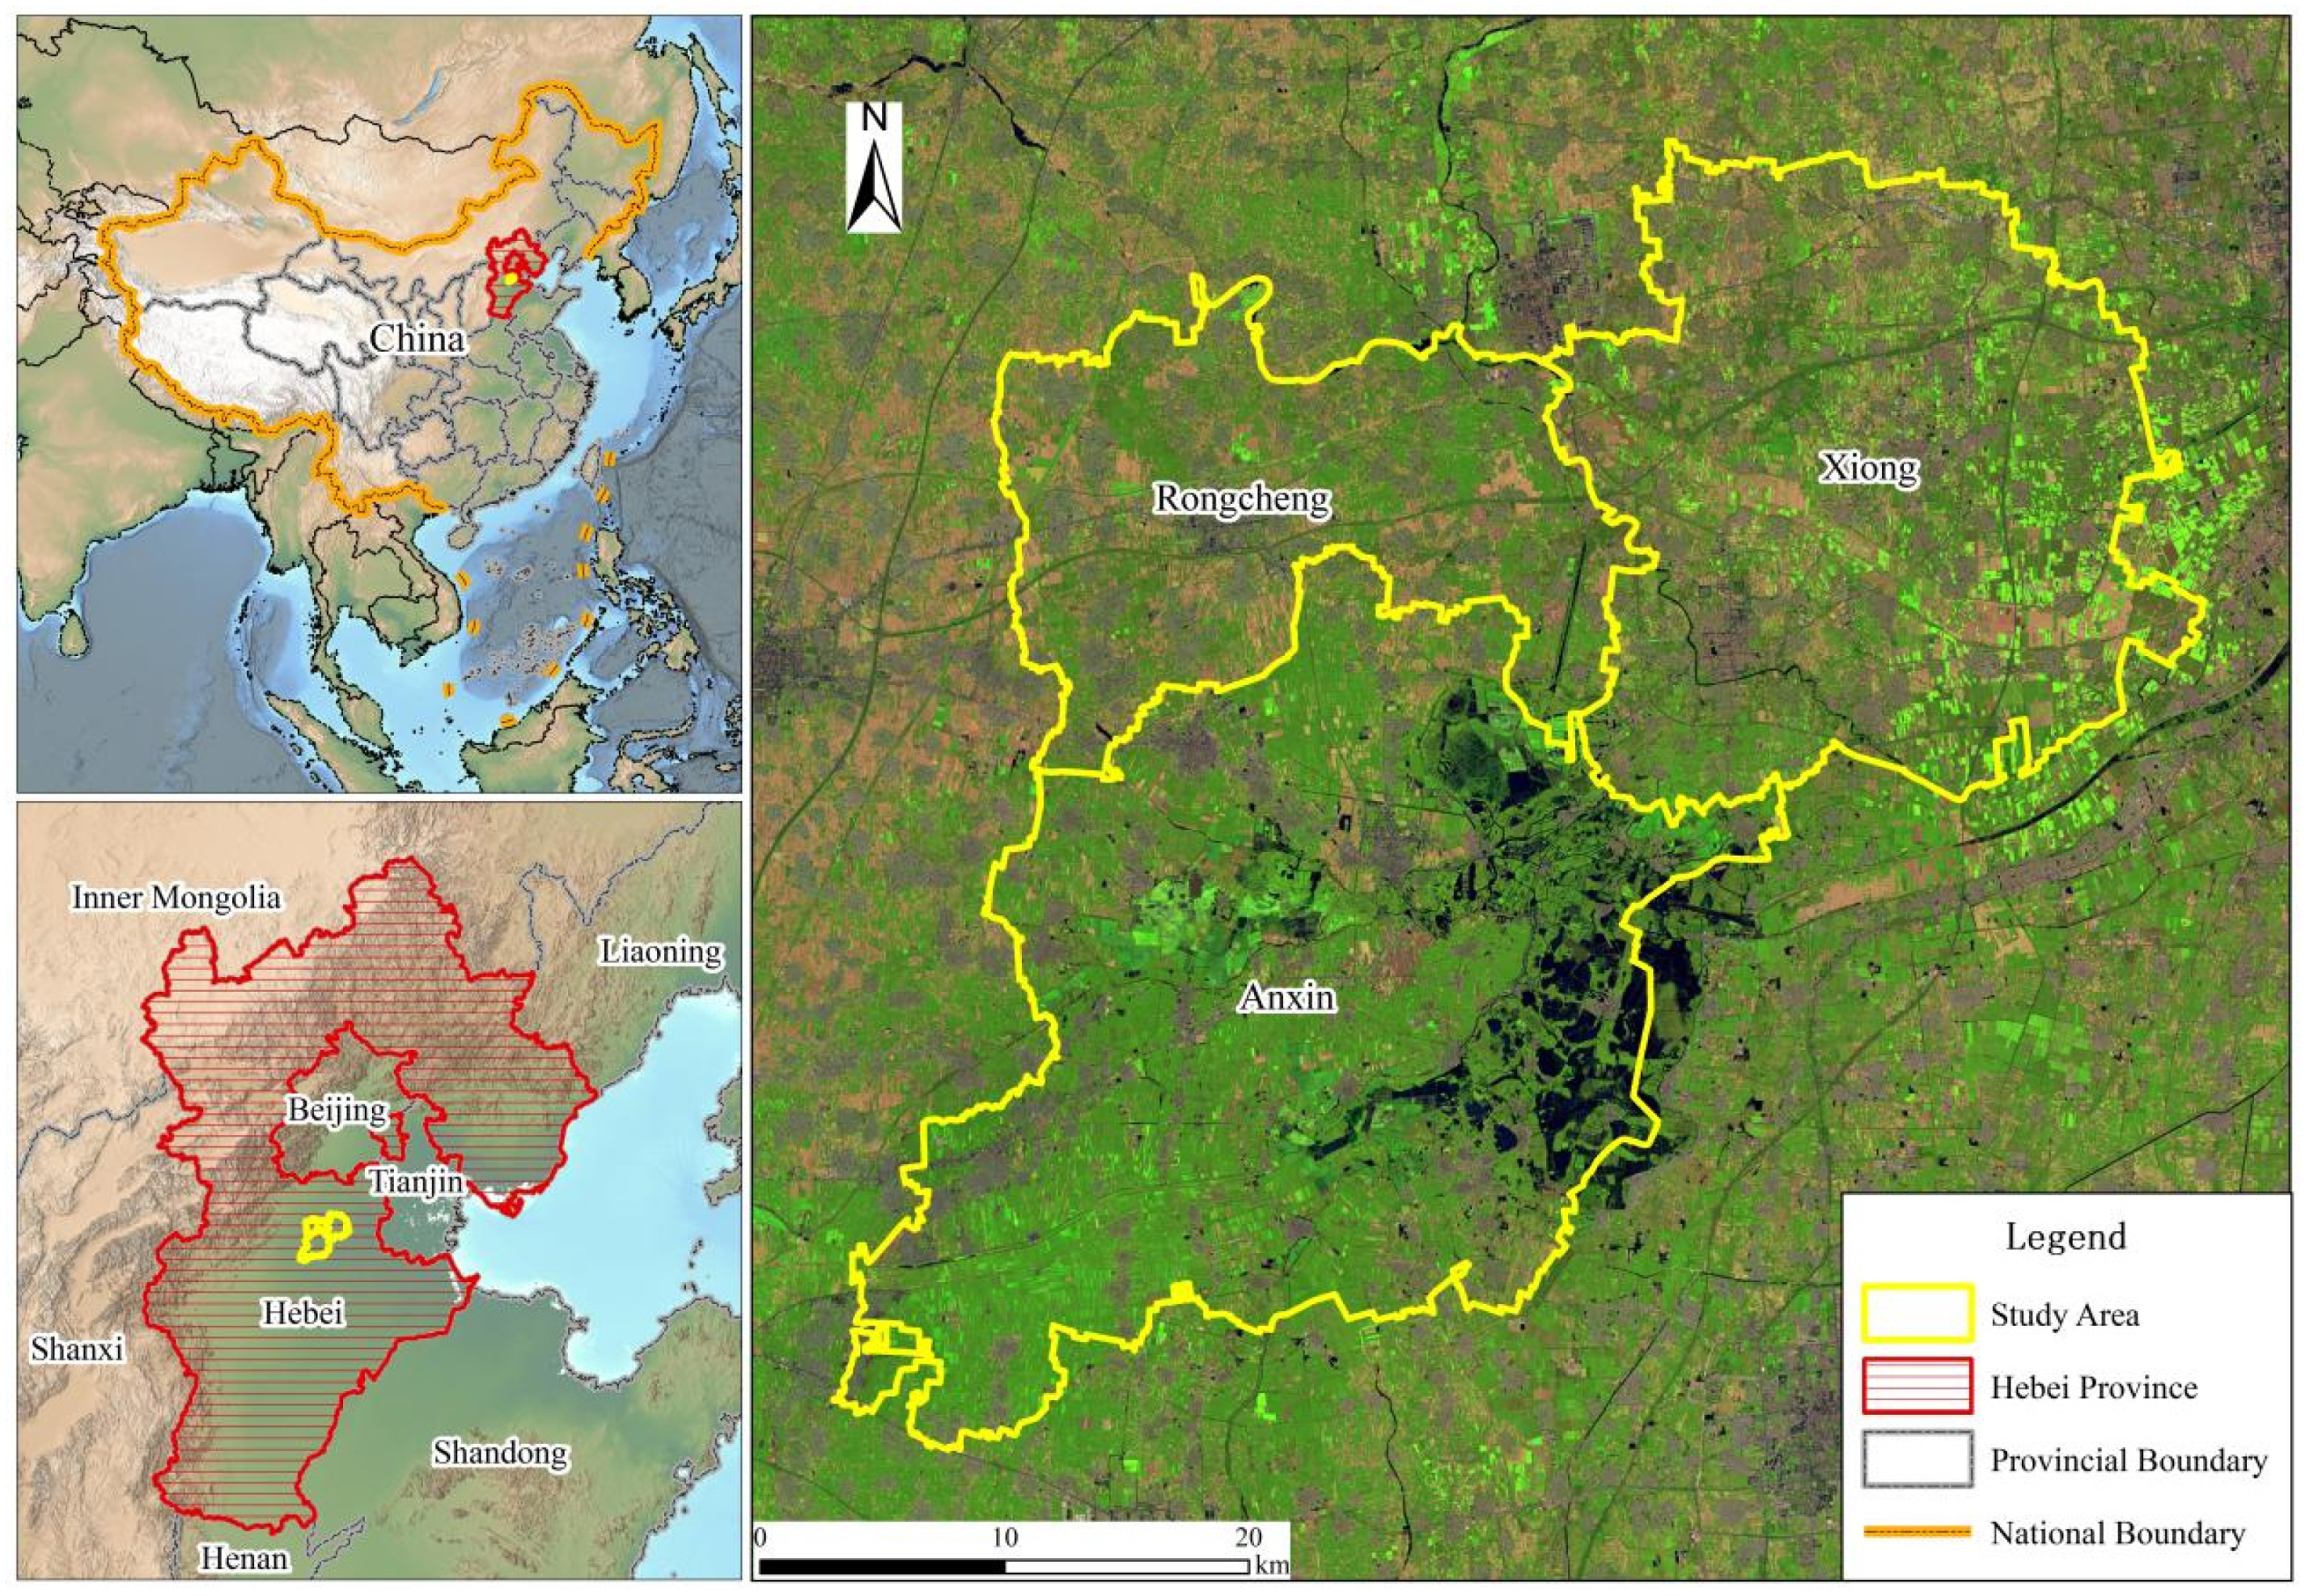
2.1. Study Area
2.2. Data Sources
3. Methods
3.1. Random Forest Classification Method
3.2. Land Use Dynamics
3.3. Land Use Degree
3.4. Landscape Pattern Index
3.5. Ecosystem Service Value
3.5.1. Equivalent Factor of Standard Unit
3.5.2. Adjustment Factors
3.5.3. The Equivalent of ESV
4. Results
4.1. Analysis of Land Use Dynamic Changes in Xiong’an
4.1.1. Land Use Classification
4.1.2. Analysis of Land Use Dynamics
- Single Land Use Dynamics
- (1)
- Grassland Changes. Grassland coverage exhibited a net increase (dynamic degree: 43.81%; annual rate: 5.48%) during 2014–2022, following an initial decline-then-recovery pattern. Remote sensing analysis revealed that this trend resulted from vegetation colonization on abandoned construction sites near the start-up area of Xiong’an in Rongcheng County, where the demolition of villages and the suspension of constructions created transitional grasslands (Figure 3).
- (2)
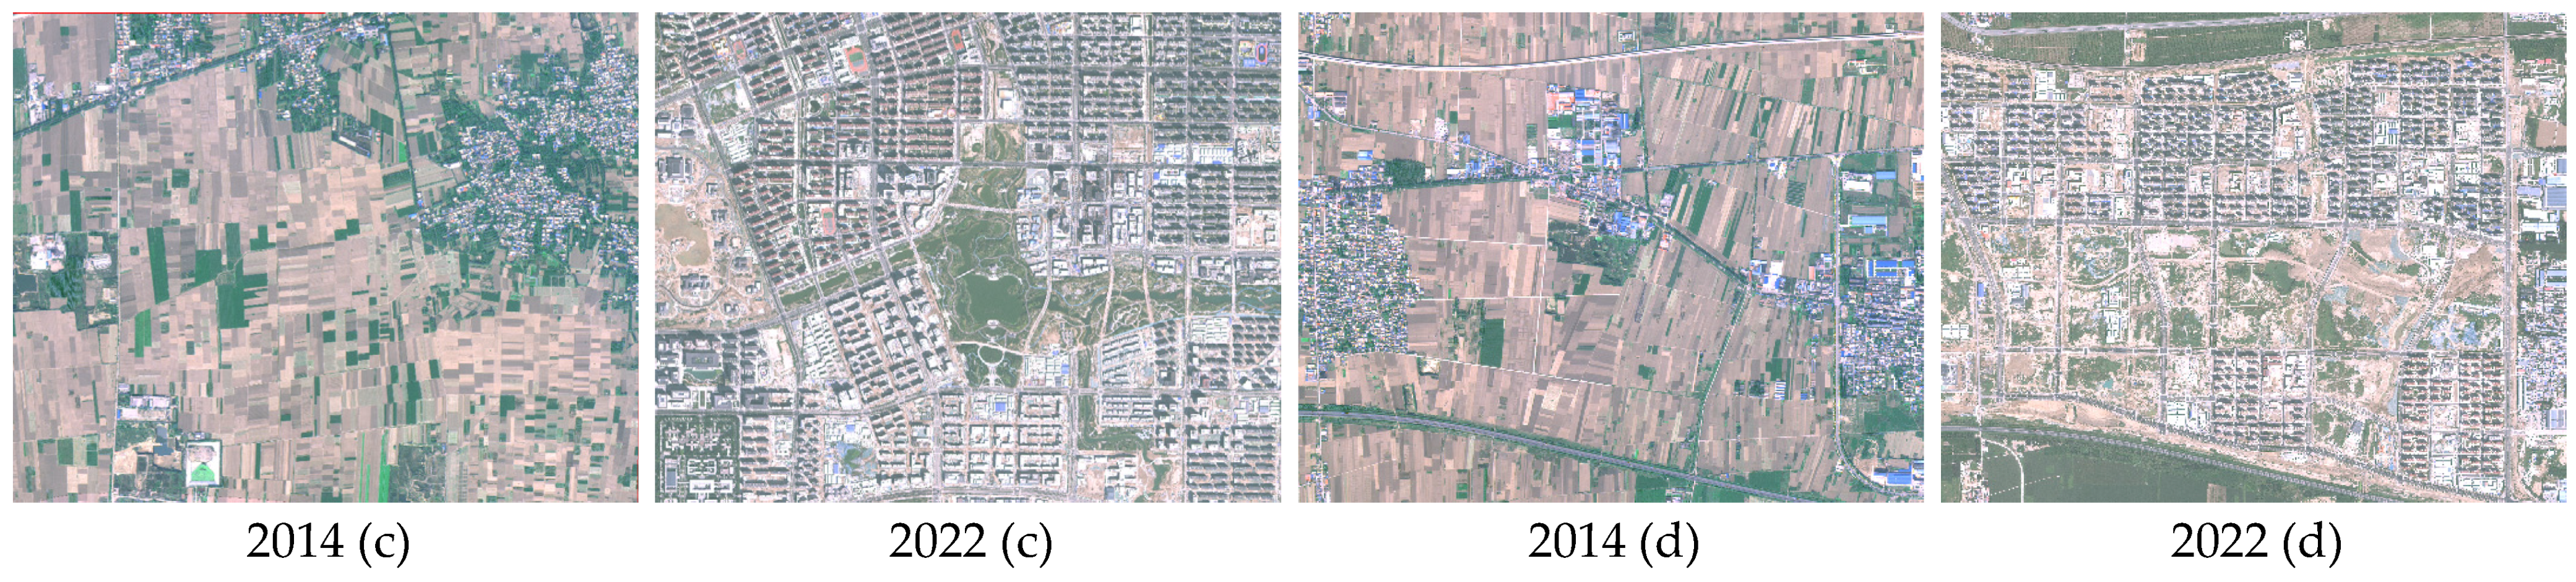
- Construction Land Changes. Construction land grew steadily (dynamic degree: 5.06%; annual rate: 0.63%), peaking during 2014–2016 due to village expansions in Rongcheng’s Zhang Town region (Figure 4). However, following the official establishment of Xiong’an New Area, the growth rate was moderated significantly due to two key factors: (i) stringent government land use regulations, implemented to ensure planned development, and (ii) pandemic-related disruptions to construction activities during the COVID-19 outbreak period. This dual regulatory and exogenous shock resulted in a notable deceleration of urban expansion compared to the pre-establishment phase.
- (3)
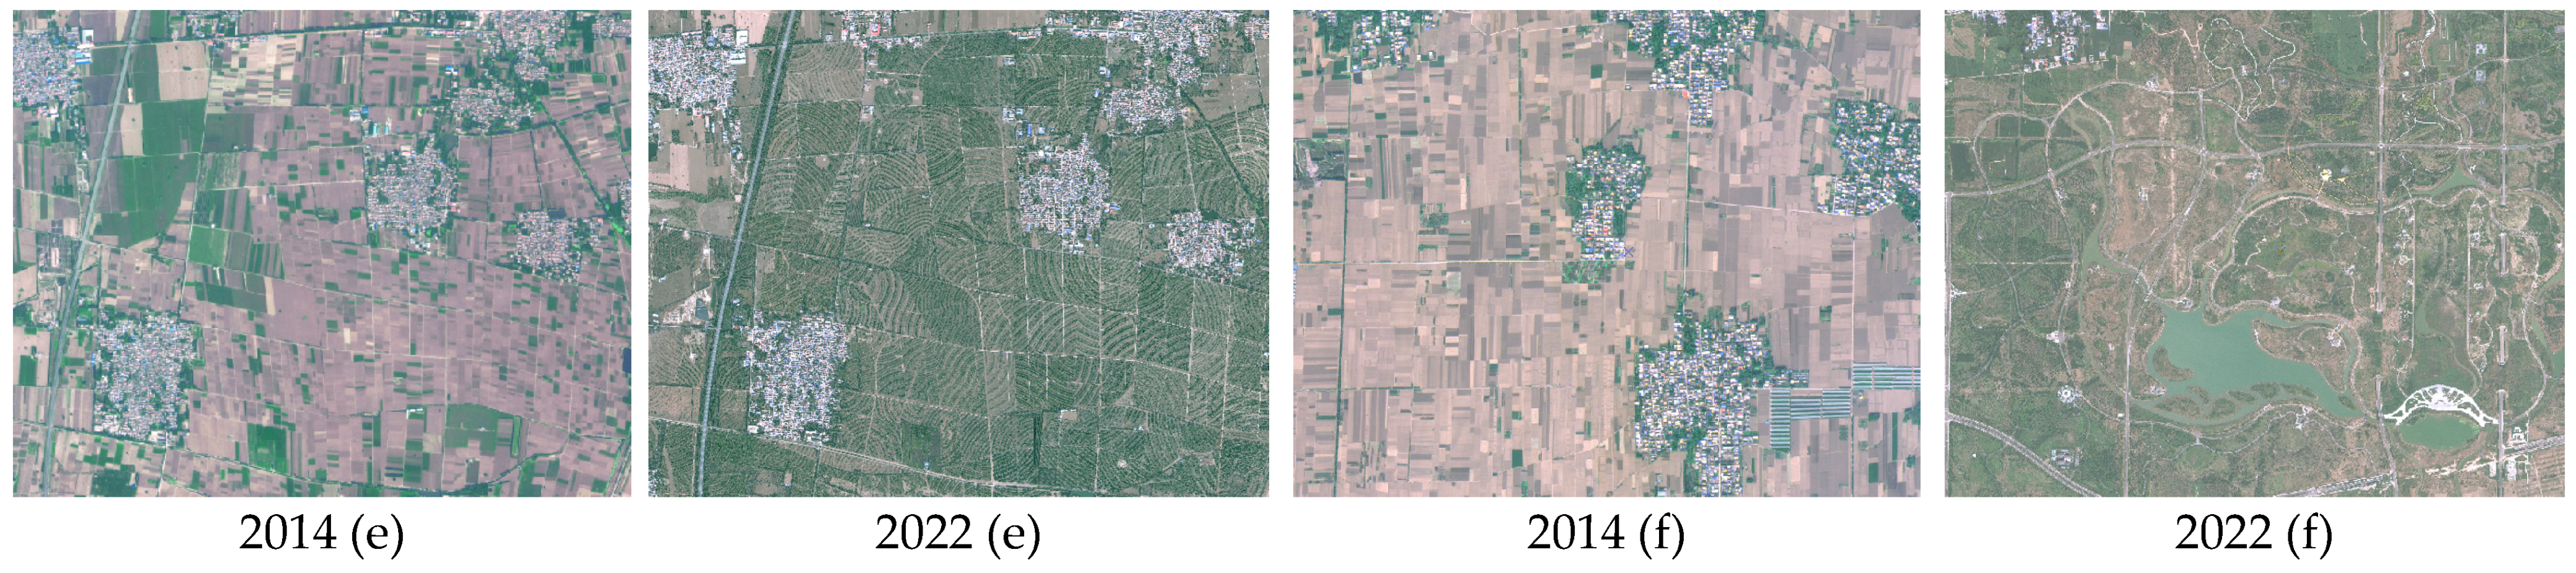
- Afforestation Changes. Forest cover changes revealed divergent trends: (i) broad-leaved forests saw a gradual increase (dynamic degree: 3.38%; annual rate: 0.42%), and coniferous forests saw dramatic expansion (dynamic degree: 189.84%; annual rate: 23.73%, particularly during 2016–2019). The “Millennium Forest” project, launched in 2017, achieved remarkable results. By 2022, it had successfully afforested an area of 30,000 hectares with 23+ million trees, elevating forest coverage from 11% to 32% (Figure 5).
- (4)
- Cultivated Land Changes. Cultivated land demonstrated a consistent decline (dynamic degree: −7.51%; annual rate: −0.94%), with accelerated losses post-2016. This transformation primarily supported two development priorities: (i) urban expansion around the start-up area in Rongcheng County (Figure 4) and (ii) ecological afforestation initiatives in Xiong County (Figure 5). Approximately 30% of converted farmland transitioned to coniferous forests, aligning with Xiong’an’s eco-city planning objectives.
- (5)
- Water Body and Wetland Changes. Water bodies fluctuated seasonally (dynamic degree: −4.49%; annual rate: −0.56%), with precipitation and image acquisition timing significantly influencing measurements. Wetlands expanded markedly (dynamic degree: 18.22%; annual rate: 2.28%), especially around Anxin County’s Yangdiko Village, where climate-driven rainfall increases facilitated substantial areal growth during 2016–2019.
- 2.
- Comprehensive Land Use Dynamics
- (1)
- Initial phase (2014–2016): exhibited relatively modest land use changes, reflecting baseline development conditions prior to major policy interventions.
- (2)
- Accelerated phase (2016–2019): marked by the most substantial transformations, directly coinciding with the formal establishment of Xiong’an New Area and its subsequent initial development surge.
- (3)
- Moderated phase (2019–2022): showed a gradual deceleration in land use dynamics, attributable to external constraints including the COVID-19 pandemic’s impacts on construction activities.
4.1.3. Analysis of Land Use Degree Changes
4.2. Analysis of Landscape Pattern Changes in Xiong’an
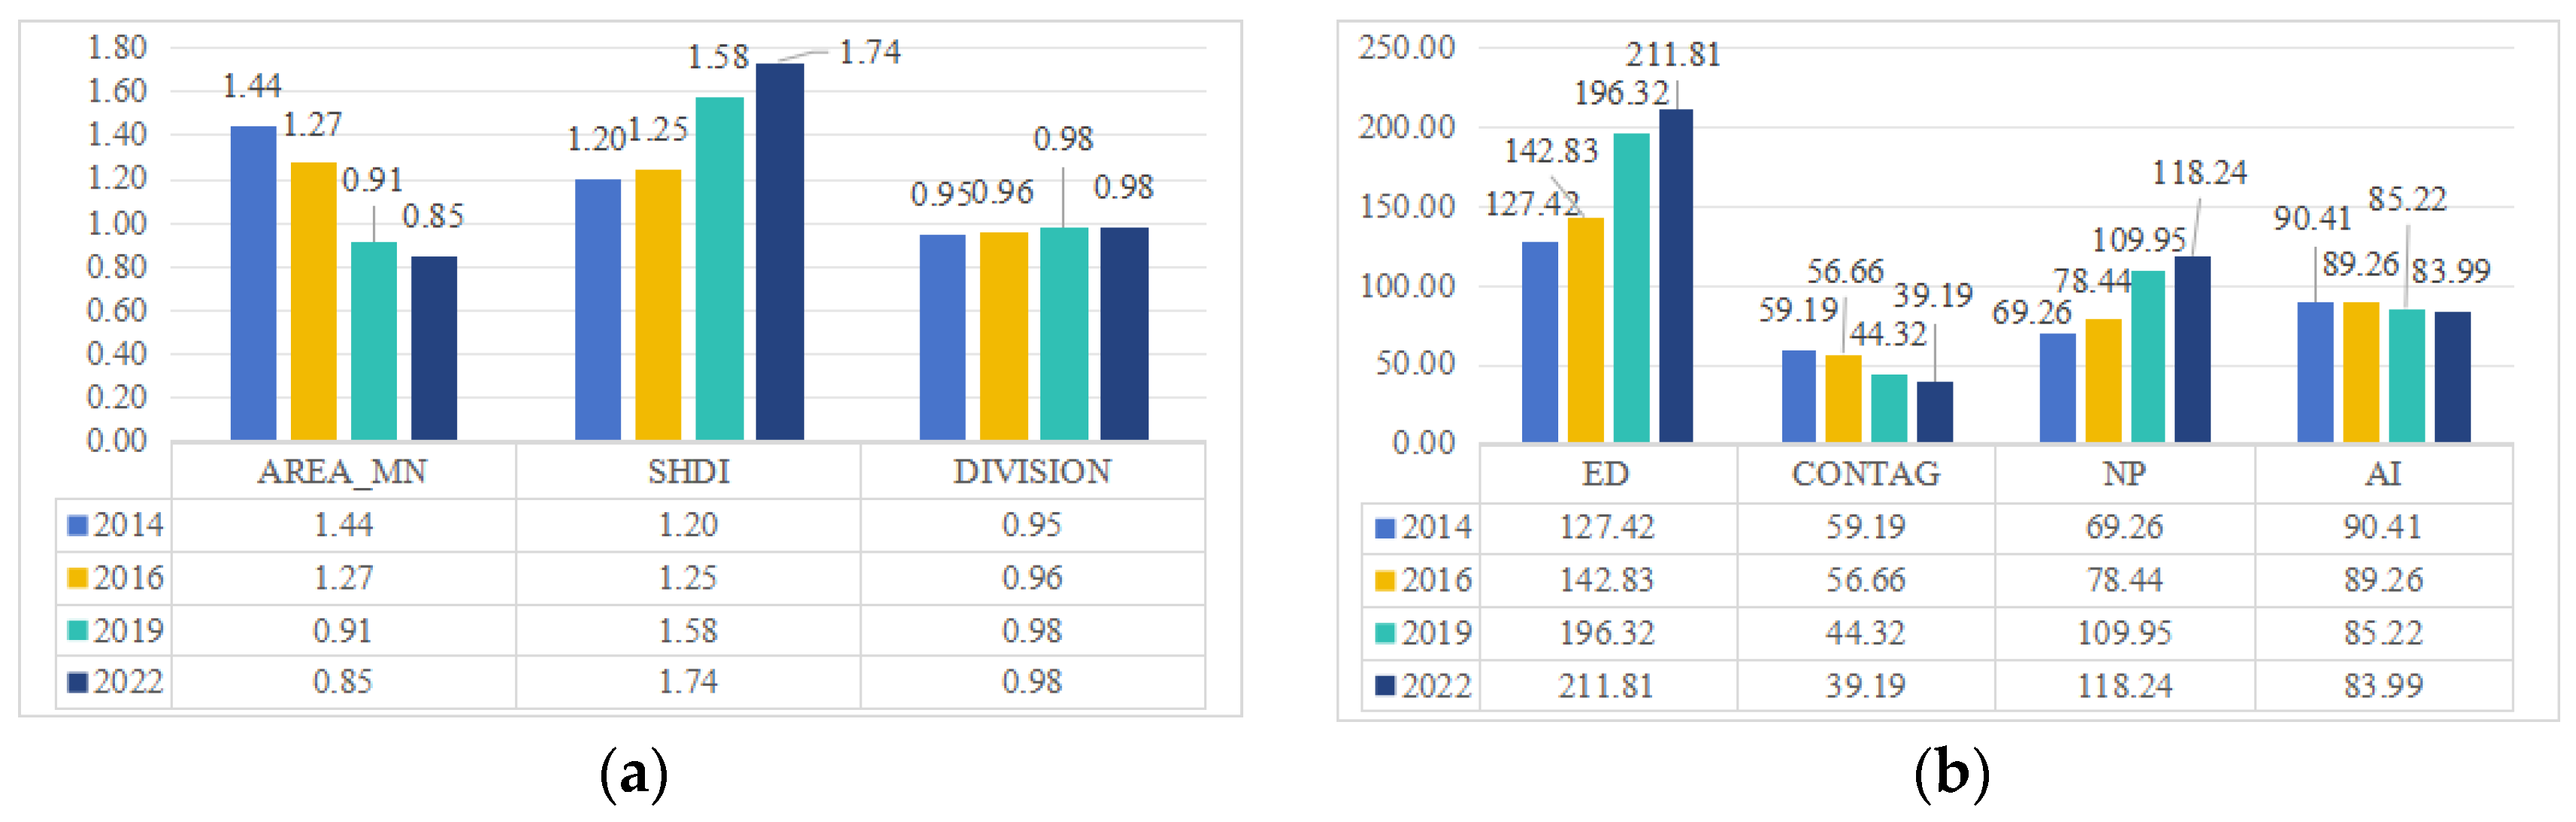
- The NP in Xiong’an showed a marked increase, while the AREA_MN significantly decreased, indicating enhanced landscape fragmentation and finer patch compositions. Combined with SLUDD analysis, these patterns reveal frequent land use conversions, fragmented originally contiguous patches into smaller, more heterogeneous spatial units. Quantitatively, the AREA_MN declined from 1.44 ha to 0.85 ha, while the NP increased from 69.26 pcs/ha to 118.24 pcs/ha, demonstrating growing spatial heterogeneity per unit area.
- The ED, reflecting patch shape complexity, increased by 66.23% (from 127.42 to 211.81 m/ha) during 2014–2022. This pronounced growth indicated that intensified anthropogenic activities altered patch geometries substantially, strengthening ecological interactions between adjacent patch types through more convoluted boundaries.
- The AI showed an overall decreasing trend, while the DIVISION showed a slightly increasing trend, signaling progressive dispersal of landscape patches. These complementary metrics indicate deteriorating spatial cohesion, where formerly aggregated patches became increasingly fragmented, compromising landscape structural integrity.
- The SHDI is sensitive to the non-equilibrium distribution of landscape patches. Between 2014 and 2022, the SHDI increased by 45%, signifying a more balanced proportion of different landscape types. This shift was accompanied by a weakening of the dominant role of cultivated land, with portions of it being converted into other patch types. The CONTAG further supported this conclusion. With a 33.79% decrease, the CONTAG indicated a decline in the connectivity of dominant patches, consistent with the ongoing subdivision of large patches into small ones.
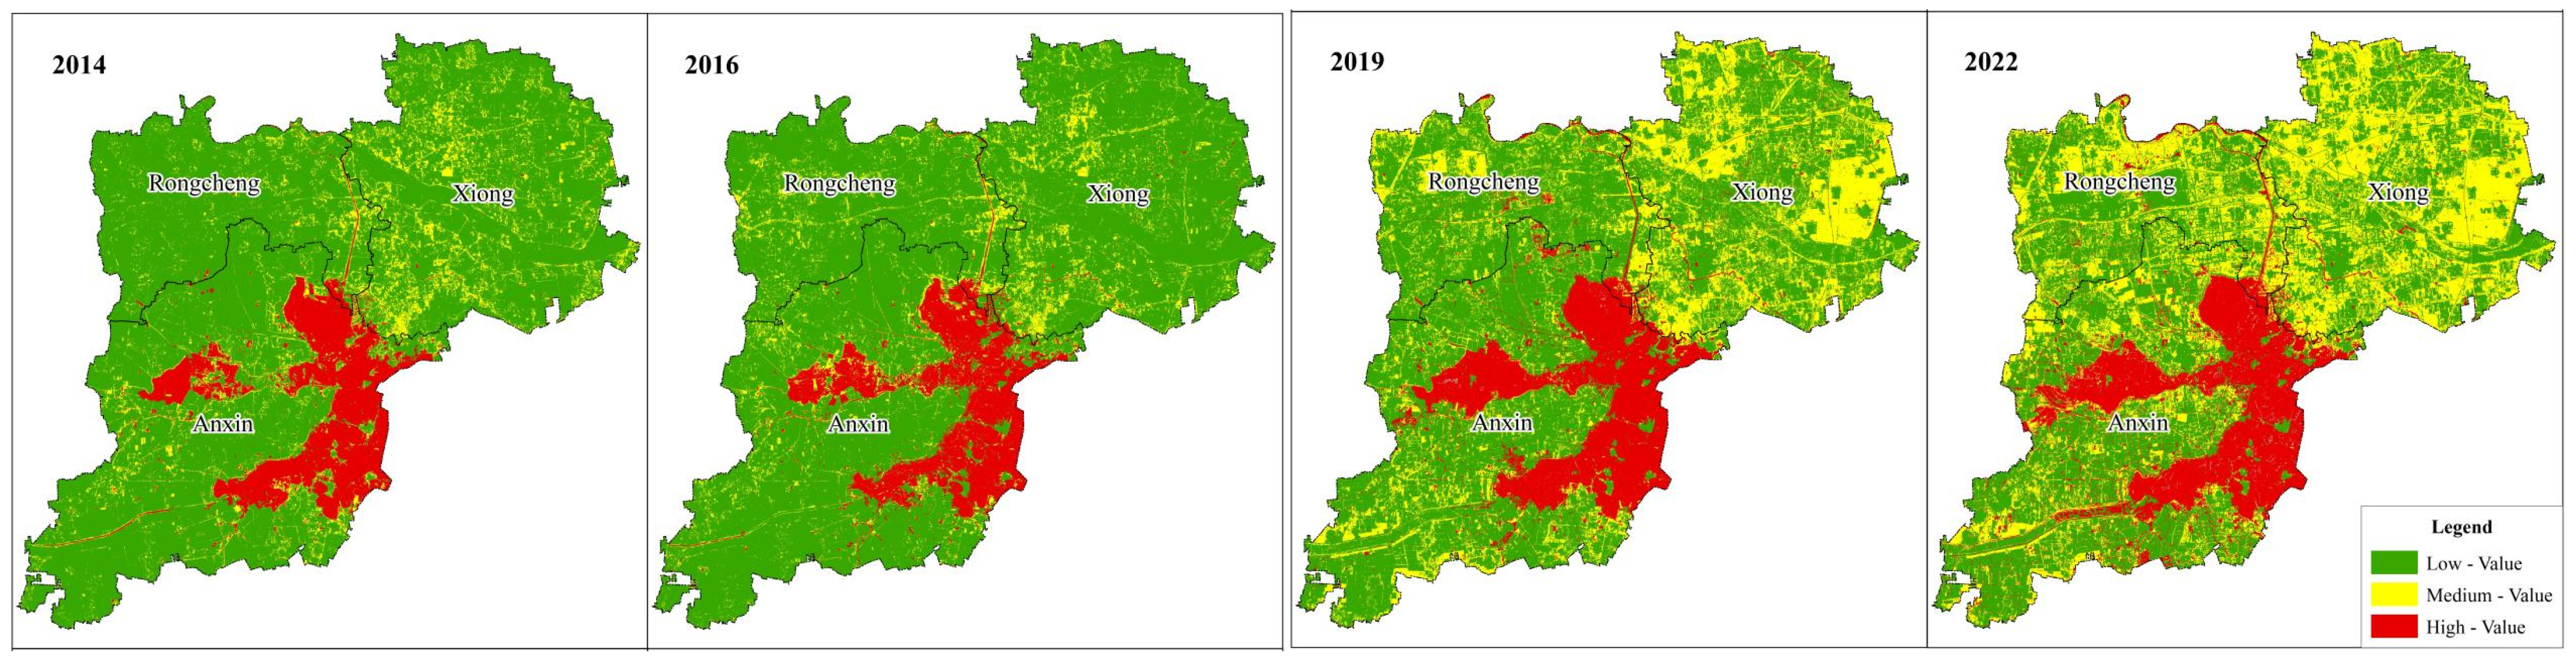
4.3. Analysis of ESV in Xiong’an
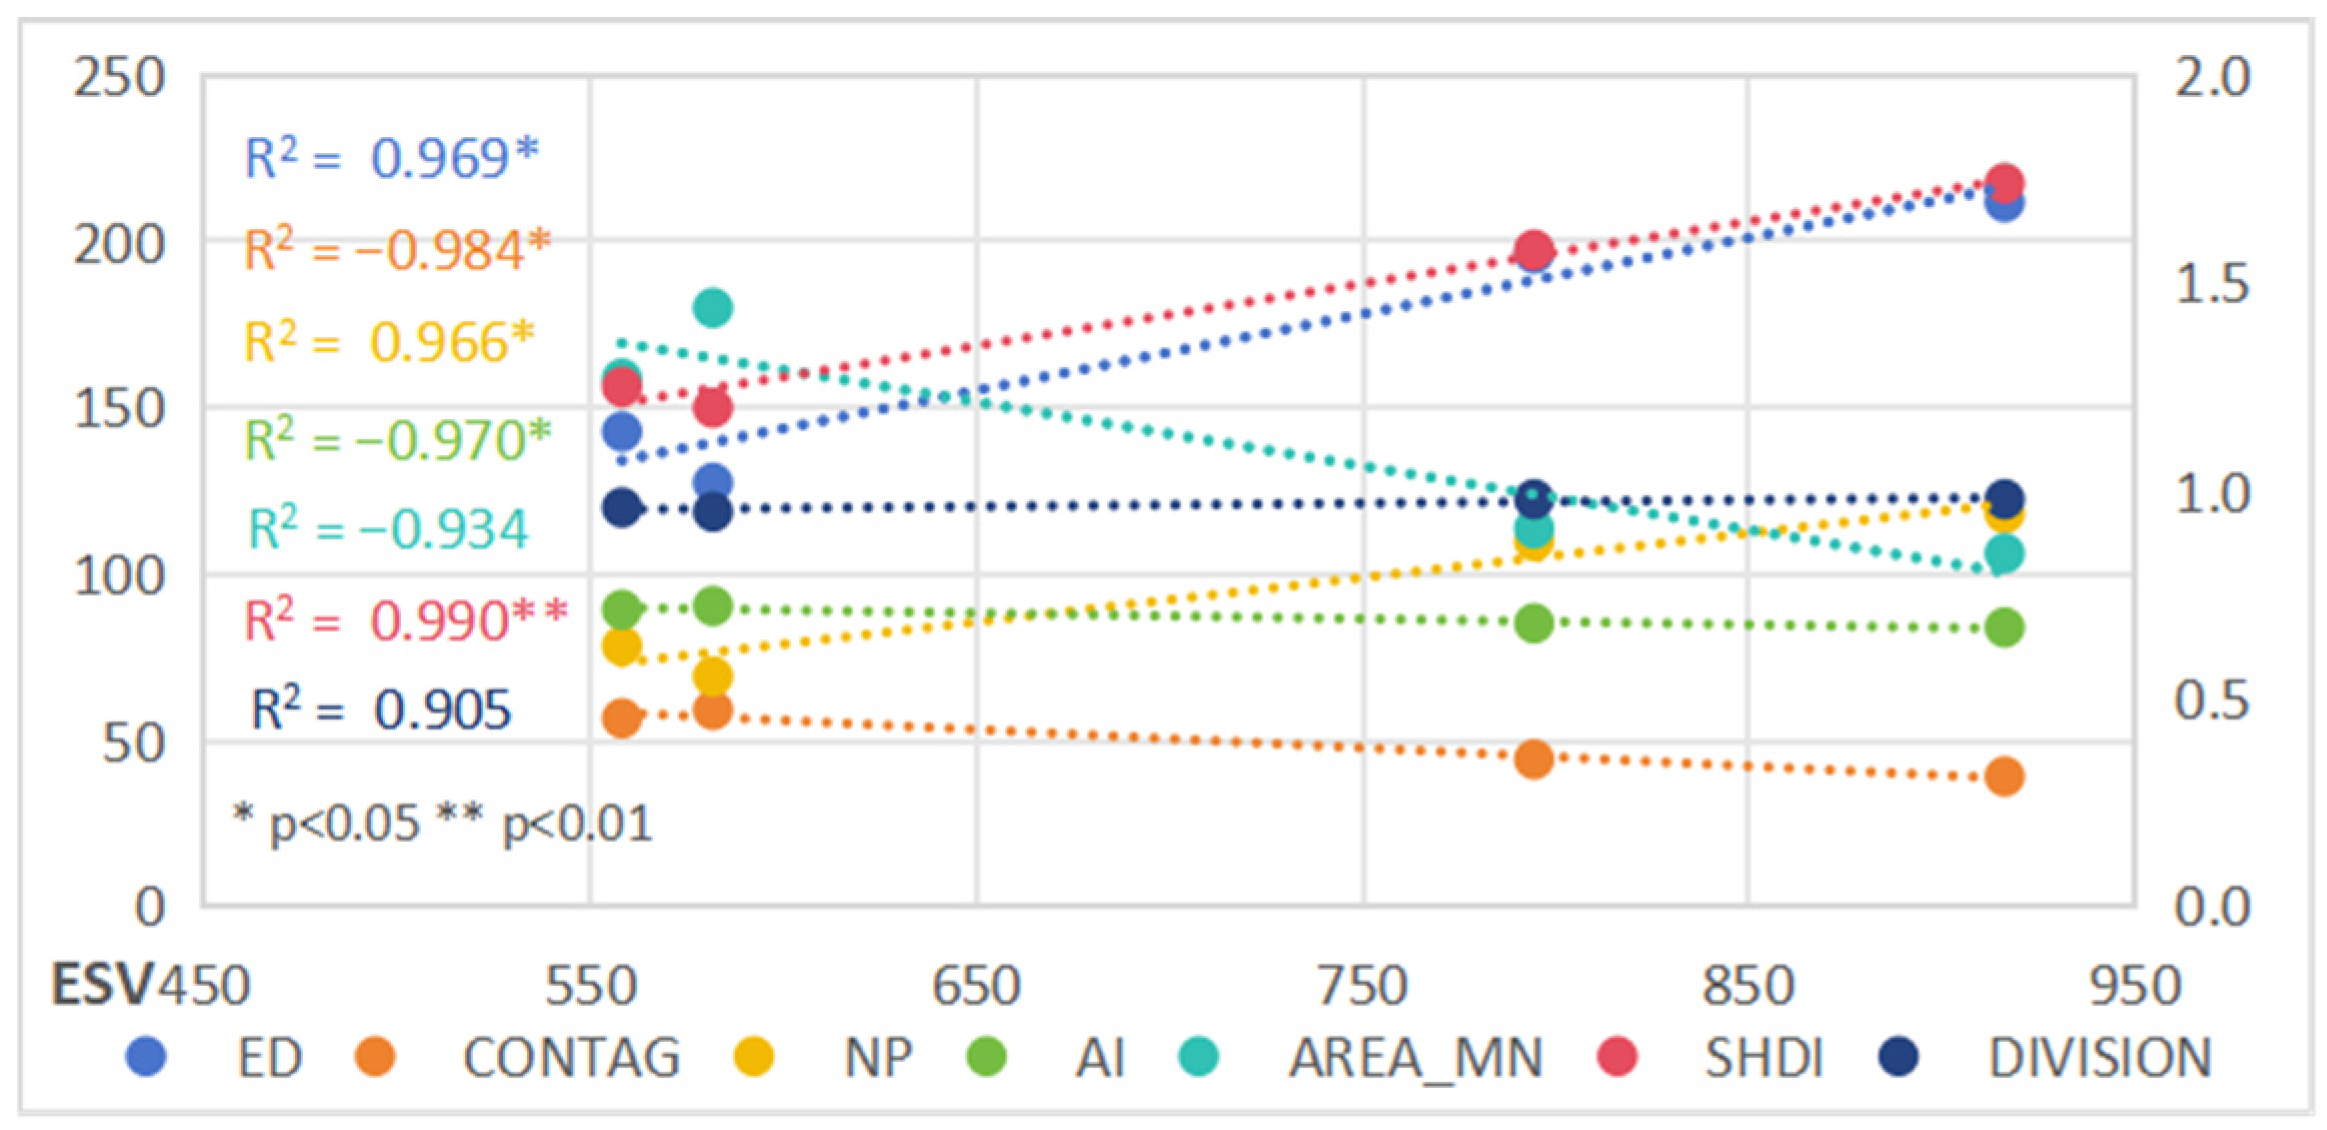
4.4. Correlation Analysis Between ESV and Landscape Pattern Indices
5. Discussion
5.1. Changes in ESV and Landscape Pattern of Xiong’an
5.2. Impacts of Landscape Pattern Changes on the Ecosystem in Xiong’an
5.3. Suggestions for the Zoned Protection and Development of ESV in Xiong’an
- The high-ESV areas in Xiong’an are predominantly concentrated in and around Baiyangdian. As an ecological protection red-line zone centered on Baiyangdian, this region demonstrates exceptional capabilities in water retention, soil conservation, and biodiversity preservation [73]. The ecological fragility of this area makes it the cornerstone of regional ecological security, necessitating the implementation of the most rigorous environmental protection measures [74]. Enhanced protection of aquatic and wetland ecosystems should be prioritized, along with comprehensive watershed management. Only ecologically beneficial human activities that preserve and potentially enhance wetland ecosystem functions should be permitted, including sediment removal, water quality assessment, aquatic vegetation restoration, and water purification initiatives [75].
- The medium-ESV zones in Xiong’an are primarily situated in Xiongxian County, where forest and grassland ecosystems prevail. Sustained efforts should focus on optimizing forest ecosystem architecture, enhancing woodland ecological functions, and reinforcing conservation measures [76]. Through the “Project of Millennium Forest”, targeted ecological management should be implemented to maintain and improve ecosystem services, including forest landscape enhancement, therapeutic forestry projects, trail system development, cultural landscape restoration, and irrigation infrastructure improvement [77].
- The low-ESV regions in Xiong’an are chiefly distributed across Rongcheng County, characterized by agricultural and urban land uses. For cultivated areas, Xiong’an should develop phased implementation strategies to systematically transform all permanent basic farmland into contiguous high-standard farmland, adhering to principles of spatial consolidation [78]. For urbanized areas, Xiong’an should facilitate synergistic development across primary, secondary, and tertiary sectors by attracting advanced agricultural technologies and enterprises relocating from Beijing. Building upon the region’s resource endowments and agricultural foundations, the New Area should nurture competitive local enterprises [79], with particular emphasis on developing specialty industries including premium vegetable production, authentic Chinese herbal medicine cultivation, and lotus leaf tea processing [80].
- Landscape pattern indices serve as a robust quantitative framework for assessing ecological impacts in Xiong’an. Through systematic monitoring and policy integration, these indices enable dynamic optimization of territorial spatial planning to achieve ecologically prioritized development, thereby circumventing the conventional “develop-first, remediate-later” urbanization paradigm. The implementation of an index threshold system facilitates a closed-loop governance cycle encompassing monitoring, evaluation, and policy response. Elevated SHDI values suggest landscape heterogeneity degradation, necessitating immediate land use restructuring [81]; declining CONTAG values mandate the incorporation of ecological corridors to enhance connectivity among fragmented green spaces and wetland patches; and sustained increases in ED require establishing protective buffers around construction zones to mitigate anthropogenic impacts on core ecological areas [82].
6. Conclusions
- Changes in land development patterns and reductions in intensity improve the ecological environment. The land use dynamics in Xiong’an exhibited a phased growth pattern characterized by “slow–fast–slow” progression, accompanied by a consistent annual decline in land resource development intensity. Following Xiong’an’s establishment, substantial expansions were observed in grassland, wetland, coniferous forest, and construction land areas, contrasting with a persistent reduction in cultivated land. These transformations have collectively enhanced the regional ecological environment, facilitating the preliminary formation of the “one lake, three belts, nine patches, and multiple corridors” ecological spatial framework.
- The establishment of Xiong’an New Area has significantly contributed to population decentralization from Beijing and industrial agglomeration. From 2014 to 2022, Xiong’an experienced a population increase of 190,000 (+17%) and a GDP growth of CNY 13 billion (+60%), with the tertiary sector expanding notably by CNY 13.5 billion (+278%) [51,83]. The influx of new residents and industries has accelerated urban construction, altered land use patterns, and, consequently, impacted ESV and landscape configuration.
- ESV has been significantly improved. From 2014 to 2022, Xiong’an experienced a consistent upward trajectory in ESV, with a cumulative increase of CNY 33.46 billion (57.51% of total growth) and an average annual growth of CNY 4.183 billion. These results demonstrate marked improvements in both ecological structure and environmental quality.
- Landscape index analysis revealed positive correlations between ESV and the ED, NP, SHDI, and DIVISION indices, whereas negative correlations emerged with the CONTAG, AI, and AREA_MN indices. These findings indicate that increasing landscape fragmentation corresponds with elevated ESV in Xiong’an.
- In providing enlightenment for improving the rigor of ESV evaluation, this study employs the equivalent factor method to conduct ESV calculation. While this approach estimates value based on fixed coefficients, the results inherently carry certain margins of error. Subsequent research will refine the ESV calculation methodology by enhancing uncertainty analysis and adopting a tripartite framework—‘dynamic monitoring, local calibration, and policy simulation’—to improve the scientific rigor of ESV assessment.
Author Contributions
Funding
Institutional Review Board Statement
Informed Consent Statement
Data Availability Statement
Conflicts of Interest
References
- OuYang, Z.; Wang, X.; Miao, H. A primary study on Chinese terrestrial ecosystem services and their ecological-economic values. Acta Ecol. Sin. 1999, 19, 607–613. [Google Scholar]
- Millennium Ecosystem Assessment (MEA). Ecosystems and Human Well-Being: Synthesis; Island Press: Washington, DC, USA, 2005. [Google Scholar]
- Costanza, R.; d’Arge, R.; de Groot, R.; Farber, S.; Grasso, M.; Hannon, B.; Limburg, K.; Naeem, S.; O’Neill, R.V.; Paruelo, J. The value of the world’s ecosystem services and natural capital. Nature 1997, 387, 253–260. [Google Scholar] [CrossRef]
- Xie, G.; Lu, C.; Leng, Y. Ecological assets valuation of the Tibetan Plateau. J. Nat. Resour. 2003, 18, 189–196. [Google Scholar]
- Xie, G.; Zhang, C.; Zhen, L.; Zhang, L. Dynamic changes in the value of China’s ecosystem services. Ecosyst. Serv. 2017, 26, 146–154. [Google Scholar] [CrossRef]
- Qian, J.; Wang, E.; Zhang, Y. Land use/cover changes and ecological assets evaluation in the west Lake in Hangzhou. J. Northwest For. Univ. 2011, 26, 208–212. [Google Scholar]
- Ma, J.; Chang, X.; Xing, Y. Dynamic change analysis of vegetation coverage and landscape pattern in Harbin City based on Landsat TM/OLI images. For. Eng. 2023, 33, 65–73. [Google Scholar]
- Zhao, Y.; Zeng, C. Analysis of spatial-temporal evolution and factors that influences ecological service values in Wuhan urban agglomeration, China. Acta Ecol. Sin. 2019, 39, 1426–1440. [Google Scholar]
- He, Y.; Wang, W.; Chen, Y. Assessing spatio-temporal patterns and driving force of ecosystem service value in the main urban area of Guangzhou. Sci. Rep. 2021, 11, 3027. [Google Scholar] [CrossRef]
- Xie, L.; Bai, Y.; Che, L. Construction of ecological zone based on value-risk ecological function area in the upper Yellow River. J. Nat. Resour. 2021, 36, 196–207. [Google Scholar] [CrossRef]
- Ouyang, X.; Zhu, X.; He, Q. Incorporating ecosystem services with ecosystem health for ecological risk assessment: Case study in Changsha-Zhuzhour-Xiangtan urban agglomeration, China. Acta Eoologjca Sin. 2020, 40, 5478–5489. [Google Scholar]
- Su, C.; Fu, B. Discussion on links among landscape pattern, ecological precess, and ecosystem services. Chin. J. Nat. 2012, 34, 277–283. [Google Scholar]
- Wei, H.; Xue, D.; Huang, J.; Liu, M.; Li, L. Identification of coupling relationship between ecosystem services and urbanization for supporting ecological management: A case study on areas along the Yellow River of Henan Province. Remote Sens. 2022, 14, 2277. [Google Scholar] [CrossRef]
- Šebelíková, L.; Csicsek, G.; Kirmer, A.; Vítovcová, K.; Ortmann-Ajkai, A.; Prach, K.; Ehounková, K. Spontaneous revegetation versus forestry reclamation—Vegetation development in coal mining spoil heaps across Central Europe. Land Degrad. Dev. 2018, 30, 3. [Google Scholar] [CrossRef]
- Kolar, V.; Tichánek, F.; Tropek, R. Evidence-based sestoration of freshwater biodiversity after mining: Experience from central European spoil heaps. J. Appl. Ecol. 2021, 58, 1921–1932. [Google Scholar] [CrossRef]
- Dong, X.B.; Wang, X.W.; Wei, H.J.; Fu, B.J.; Wang, J.J.; Uriarte-Ruiz, M. Trade-offs between local farmers’ demand for ecosystem services and ecological restoration of the Loess Plateau, China. Ecosyst. Serv. 2021, 49, 101295. [Google Scholar] [CrossRef]
- Ran, P.; Hu, S.; Frazier, A.E.; Yang, S.; Song, X.; Qu, S. The dynamic relationships between landscape structure and ecosystem services: An empirical analysis from the Wuhan Metropolitan Area, China. J. Environ. Manag. 2023, 325, 116575. [Google Scholar] [CrossRef]
- Haines-Young, R.; Chopping, M. Quantifying landscape structure: A review of landscape indices and their application to forested landscapes. Prog. Phys. Geogr. 1996, 20, 418–445. [Google Scholar] [CrossRef]
- Liu, M.; Wei, H.; Dong, X.; Wang, X.-C.; Zhao, B.; Zhang, Y. Integrating land use, ecosystem service, and human well-being: A systematic review. Sustainability 2022, 14, 6926. [Google Scholar] [CrossRef]
- Yu, C.; Li, L.; Wei, H. Coupling landscape connectedness, ecosystem service value, and resident welfare in Xining City, Western China. Systems 2023, 11, 512. [Google Scholar] [CrossRef]
- Zhang, X.; Li, H.; Xia, H.; Tian, G.; Yin, Y.; Lei, Y.; Kim, G. The ecosystem services value change and its Driving forces responding to spatio-temporal process of landscape pattern in the co-urbanized rrea. Land 2021, 10, 1043. [Google Scholar] [CrossRef]
- Duarte, G.T.; Santos, P.M.; Cornelissen, T.G.; Ribeiro, M.C.; Paglia, A.P. The effects of landscape patterns on ecosystem services: Meta-analyses of landscape services. Landsc. Ecol. 2018, 33, 1247–1257. [Google Scholar] [CrossRef]
- Feng, J.; Guo, L.; Li, X. Temporal and Spatial Variations of Land Uses and Their Influences on Ecosystem Service Function Values in Hanzhong City. Res. Soil Water Conserv. 2020, 27, 275–282. [Google Scholar]
- Qin, Y.L.; Shi, P.; He, W.H.; Huo, C.P.; Li, P.; Li, Z.B.; Yang, S.T.; Feng, Z.H. Influence of urbanization on landscape pattern and ecosystem service value in Xi’an City. Acta Ecol. Sin. 2020, 40, 8239–8250. [Google Scholar]
- Mcdonnell, M.J.; Pickett, S.T.A. Ecosystem structure and function along urban–rural gradients: An unexploited opportunity for ecology. Ecology 1990, 71, 1232–1237. [Google Scholar] [CrossRef]
- Kremer, P.; Hamstead, Z.A.; Mcphearson, T. The value of urban ecosystem services in New York City: A spatially explicit multicriteria analysis of landscape scale valuation scenarios. Environ. Sci. Policy 2016, 62, 57–68. [Google Scholar] [CrossRef]
- Wang, H.; Zhang, M.; Wang, C.; Wang, K.; Wang, C.; Li, Y.; Bai, X.; Zhou, Y. Spatial and temporal changes of landscape patterns and their effects on ecosystem services in the Huaihe River Basin, China. Land 2022, 11, 513. [Google Scholar] [CrossRef]
- Zhao, J.; Liu, S.; Wang, Z.; Gao, H.; Feng, S.; Wei, B.; Hou, Z.; Xiao, F.; Jing, L.; Liao, X. The impact of land Use and landscape pattern on ecosystem services in the Dongting Lake Region, China. Remote Sens. 2023, 15, 2228. [Google Scholar] [CrossRef]
- Ma, G.; Xiao, J.; Li, Q.; Zhang, L.X.; An, B.; Sun, G.J.; Cheng, H.; Tang, J.; Li, H. Impact of the evolution of Plateau Lake landscape pattern on ecosystem service value in the Pearl River basin: A case study of Yilong Lake Basin in Yunnan Province, China. Acta Geophys. 2023, 71, 1391–1407. [Google Scholar] [CrossRef]
- Yun, J.; Liu, H.; Xu, Z.; Cao, X.; Ma, L.; Wen, L.; Zhuo, Y.; Wang, L. Assessing changes in the landscape pattern of wetlands and its impact on the value of wetland ecosystem services in the Yellow River Basin, Inner Mongolia. Sustainability 2022, 14, 6328. [Google Scholar] [CrossRef]
- Meng, L.; Dong, J. LUCC and ecosystem service value assessment for wetlands: A case study in Nansi Lake, China. Water 2019, 11, 1597. [Google Scholar] [CrossRef]
- Liu, J.; Chen, S.; Xia, T.; Wang, Q. Analysis on changes of wetland landscape in Yellow River Delta and influences on ecosystem services. Adv. Mar. Sci. 2008, 26, 417–477. [Google Scholar]
- Cai, G.; Lin, Y.; Zhang, F.; Zhang, S.; Wen, L.; Li, B. Response of ecosystem service value to landscape pattern changes under low-carbon scenario: A case study of Fujian coastal areas. Land 2022, 11, 2333. [Google Scholar] [CrossRef]
- Hebei Provincial People’s Government. Hebei Xiong’an New Area Planning Outline. 2018. Available online: https://www.xiongan.gov.cn/2018-04/21/c_129855813.htm (accessed on 23 May 2022).
- Yang, M.; Gong, J.; Zhao, Y.; Wang, H.; Zhao, C.; Yang, Q.; Yin, Y.; Wang, Y.; Tian, B. Landscape Pattern Evolution Processes of Wetlands and Their Driving Factors in the Xiong’an New Area of China. Int. J. Environ. Res. Public Health 2021, 18, 4403. [Google Scholar] [CrossRef] [PubMed]
- Wang, Z.; Cao, J. Assessing and Predicting the Impact of Multi-Scenario Land Use Changes on the Ecosystem Service Value: A Case Study in the Upstream of Xiong’an New Area, China. Sustainability 2021, 13, 704. [Google Scholar] [CrossRef]
- Wang, Z.; Cao, J.; Zhu, C.; Yang, H. The Impact of Land Use Change on Ecosystem Service Value in the Upstream of Xiong’an New Area. Sustainability 2020, 12, 5707. [Google Scholar] [CrossRef]
- Wang, Y.; Song, L.; Han, Z.; Liao, Y.; Xu, H.; Zhai, J.; Zhu, R. Climate-related risks in the construction of Xiongan New Area, China. Theor. Appl. Clim. 2020, 141, 1301–1311. [Google Scholar] [CrossRef]
- Xia, Y.; Li, H.; Wang, B.; Ma, Z.; Guo, X.; Zhao, K.; Zhao, C. Characterization of shallow groundwater circulation based on chemical kinetics: A case study of Xiong’an New Area, China. Water 2022, 14, 1880. [Google Scholar] [CrossRef]
- Liu, H.; Han, B. Geo-environment suitability evaluation for urban construction in Rongcheng District of Xiong’an New Area, China. Appl. Sci. 2023, 13, 9981. [Google Scholar] [CrossRef]
- Rodriguez-Galiano, V.F.; Ghimire, B.; Rogan, J.; Chica-Olmo, M.; Rigol-Sanchez, J.P. An assessment of the effectiveness of a random forest classifier for land-cover classification. J. Photogramm. Remote Sens. 2012, 67, 93–104. [Google Scholar] [CrossRef]
- Liu, J.; Kuang, W.; Zhang, Z.; Xu, X.; Qin, Y.; Ning, J.; Zhou, W.; Zhang, S.; Li, R.; Yan, C.; et al. Spatiotemporal characteristics, patterns, and causes of land-use changes in China since the late 1980s. J. Geogr. Sci. 2014, 24, 195–210. [Google Scholar] [CrossRef]
- Yue, H.; Liu, Y. Study on the evolution and land use of the Yellow River estuary coastline based on RS and GIS. Surv. Mapp. Eng. 2018, 27, 13–19. [Google Scholar]
- Zhuang, D.; Liu, J. Research on regional differentiation model of land use degree in China. J. Nat. Resour. 1997, 12, 105–111. [Google Scholar]
- Yu, Y.; Yang, F.; Zhou, H. Evaluation of ecological and environmental effects of land use change based on county scale. Jiangsu Agric. Sci. 2017, 45, 242–246. [Google Scholar]
- Lu, L.; Guo, L.; Zhao, S.T. Land use and land cover change on slope in Qiandongnan prefecture of Southwest China. J. Mt. Sci. 2014, 11, 762–773. [Google Scholar] [CrossRef]
- Hou, B.; Wei, C.; Liu, X.; Meng, Y.; Li, X. Assessing forest landscape stability through automatic identification of landscape pattern evolution in Shanxi Province of China. Remote Sens. 2023, 15, 545. [Google Scholar] [CrossRef]
- Li, Y.; Geng, H. Evolution of land use landscape patterns in Karst watersheds of Guizhou Plateau and its ecological security evaluation. Land 2022, 11, 2225. [Google Scholar] [CrossRef]
- Chen, D.; Zhang, F.; Jim, C.Y.; Bahtebay, J. Spatio-temporal evolution of landscape patterns in an oasis city. Environ. Sci. Pollut. Res. 2022, 30, 3872–3886. [Google Scholar] [CrossRef]
- Xie, G.; Zhen, L.; Lu, C.-X.; Xiao, Y.; Chen, C. Expert knowledge based valuation method of ecosystem services in China. J. Nat. Resour. 2008, 23, 911–919. [Google Scholar]
- National Bureau of Statistics of China. China County Statistical Yearbook 2022; China Statistics Press: Beijing, China, 2023. [Google Scholar]
- National Bureau of Statistics of China. China Agricultural Products Cost-Benefit Summary, 2021; China Statistics Press: Beijing, China, 2022. [Google Scholar]
- Xie, G.; Zhang, C.; Zhang, L.; Chen, W.; Li, S. Improvement of the evaluation method for ecosystem service value based on per unit area. J. Nat. Resour. 2015, 30, 1243–1254. [Google Scholar]
- Li, X.; Zhu, Y.; Zhao, L.; Tian, J.; Li, J. Ecosystem services value change in Qinglong County from dynamically adjusted value coefficients. Chin. J. Eco-Agric. 2015, 23, 373–381. [Google Scholar]
- Ji, Z.; Wei, H.; Xue, D.; Liu, M.; Cai, E.; Chen, W.; Feng, X.; Li, J.; Lu, J.; Guo, Y. Trade-off and projecting effects of land use change on ecosystem services under different policies scenarios: A case study in central China. Int. J. Environ. Res. Public Health 2021, 18, 3552. [Google Scholar] [CrossRef] [PubMed]
- Cao, X.; Liu, Z.; Li, S. Identification of key areas of ecological protection and restoration based on the pattern of ecological security: A case of Songyuan City, Jilin province. China Environ. Sci. 2022, 42, 2779–2787. [Google Scholar]
- Wu, J.; Li, Y. Variation of landscape pattern and its influences on ecosystem service in value in three gorges reservoir area (Chongqing Section). J. Ecol. Rural Environ. 2018, 34, 308–317. [Google Scholar]
- Long, H.; Liu, Y.; Hou, X.; Li, T.; Li, Y. Effects of land use transitions due to rapid urbanization on ecosystem services: Implications for urban planning in the new developing area of China. Habitat Int. 2014, 44, 536–544. [Google Scholar] [CrossRef]
- Wu, C.; Chen, B.; Huang, X.; Dennis Wei, Y.H. Effect of land-use change and optimization on the ecosystem service values of Jiangsu province, China. Ecol. Indic. 2020, 117, 106507. [Google Scholar] [CrossRef]
- Guo, P.; Zhang, F.; Wang, H. The response of ecosystem service value to land use change in the middle and lower Yellow River: A case study of the Henan section. Ecol. Indic. 2022, 140, 109019. [Google Scholar] [CrossRef]
- Wang, L.; Zhang, Z.; Li, G.; Ma, F.; Chen, L. Landscape pattern change in Beijing fringe area and its impact on the ecosystem services: A case study in Niulanshan-Mapo town. Acta Ecol. Sin. 2018, 38, 750–759. [Google Scholar]
- Cheng, L.; Li, F.; Deng, H.-F. Dynamics of land use and its ecosystem services in China’s megacities. Acta Ecol. Sin. 2011, 31, 6194–6203. [Google Scholar]
- National Development and Reform Commission. Notice on Raising the Minimum Purchase Price of Wheat in 2014 (Fagai Dian [2013] No. 205); National Development and Reform Commission: Beijing, China, 2013. [Google Scholar]
- National Bureau of Statistics of China. Hebei Statistical Yearbook, 2023; China Statistics Press: Beijing, China, 2024. [Google Scholar]
- Gan, W. Dynamic Analysis of Landscape Pattern and Evaluation of Ecological Elasticity in Shenzhen City. Master’s Thesis, Central South University of Forestry and Technology, Changsha, China, 2021. [Google Scholar]
- Wu, J. Shanghai Urban Growth Pattern and Dynamic of Landscape Pattern. Master’s Thesis, East China Normal University, Shanghai, China, 2015. [Google Scholar]
- Yu, Y.; Li, M.; Han, X.; Liu, H. Study on the response of ecosystem service value to the evolution of landscape pattern in border areas—Taking Yanbian Korean autonomous prefecture as an Example. Res. Soil Water Conserv. 2021, 28, 315–322. [Google Scholar]
- Zhang, M.Y.; Wang, K.L.; Liu, H.Y.; Chen, H.S.; Zhang, C.H.; Yue, Y.M. Responses of ecosystem service values to landscape pattern change in typical Karst area of northwest Guangxi, China. Chin. J. Appl. Ecol. 2010, 21, 1174–1179. [Google Scholar]
- Cen, X.; Wu, C.; Xing, X.; Fang, M.; Garang, Z.; Wu, Y. Coupling intensive land use and landscape ecological security for urban sustainability: An integrated socioeconomic data and spatial metrics analysis in Hangzhou City. Sustainability 2015, 7, 1459–1482. [Google Scholar] [CrossRef]
- Liu, L.; Jiang, K.; Hu, Z. Response characteristics of ecosystem services values in territorial space development of Xiong’an New Area. Acta Geogr. Sin. 2022, 42, 2098–2111. [Google Scholar]
- Gao, X.; Liu, Z.; Li, C. Land use function transformation in the Xiong’an New Area based on ecological production-living spaces and associated eco-environment effects. Acta Ecol. Sin. 2020, 40, 7113–7122. [Google Scholar]
- Guan, Y.; Chen, Y.; PN, X. Cross-sensitivity analysis of ecological services based on land use transition: A case study of Xiong’an New Area. Ecol. Econ. 2021, 37, 153–160. [Google Scholar]
- Wang, K.; Li, H.; Wu, A. An analysis of the Evolution of Baiyangdian Wetlands in Hebei Province with Artificial Recharge. J. Acta Geosci. Sin. 2018, 39, 549–558. [Google Scholar]
- Sun, C. Exploring the path of high-quality development of urban areas: Reflections on the construction of Xiongan Hengshui Cooperative Area. J. Hengshui Univ. 2019, 26, 82–86. [Google Scholar]
- Cheng, X.; Wang, X.; Gong, Y.; Gong, Y.; Guo, K. Thinking on the implementation path of ecological space use regulation in Xiongan New Area. China Land. 2024, 12–15. [Google Scholar]
- Ma, Y. Experience and inspiration of urban forest construction in Xiong’ an New Area. For. Ecol. 2019, 23–25. [Google Scholar]
- Yang, J.; Wu, Y.; Li, S.; Yuan, J.; Guo, C.; Yang, X.; Shi, Z.; Xie, S.; Luo, H.; Zhang, C. Coupling and coordination assessment of “three-life space” and optimization of ecological security pattern in Xiongan New Area. J. Eco-Environ. 2024, 33, 1816–1826. [Google Scholar]
- Gao, X.; Cao, Y. Current situation, problems and countermeasures of ecological environment construction in Xiongan New Area. Environ. Prot. 2019, 52, 49–52. [Google Scholar]
- Guan, Z.; Tian, X.; Kong, Y. Research on the realization path of ecological value in Xiongan New Area based on blockchain technology. J. Hebei Univ. Econ. Bus. 2019, 40, 77–86. [Google Scholar]
- Rong, Y.; Yan, Y.; Shang, X.; Wang, J.; Wang, C.; Zhao, C.; Zheg, L. Ecological security framework and control countermeasures in Xiongan New Area. China Environ. Manag. 2022, 14, 76–81+55. [Google Scholar]
- Ning, L.; Liu, L.; Li, C. Research on Dynamic Changes of Landscape Pattern in the Middle Reaches of Huaihe River Basin from 2000 to 2020. J. Henan Univ. Sci. Technol. (Nat. Sci. Ed.) 2025, 53, 61–69. [Google Scholar]
- Xu, H.; Xie, J.; Li, X. Spatial-temporal Changes and Emergency Escape Function of Urban Green Space Landscape Pattern in Beijing from 2005 to 2020. Chin. J. Ecol. 2024, 43, 2247–2256. [Google Scholar]
- National Bureau of Statistics of China. China County Statistical Yearbook 2014; China Statistics Press: Beijing, China, 2015. [Google Scholar]


| Data Type | Spatial Resolution | Expiration Date | Data Source |
|---|---|---|---|
| Landsat Images | 30 m | 2014, 2016, 2019, 2022 | www.usgs.gov (accessed on 6 May 2023) |
| High-Resolution Images | 1 m | 2014, 2016, 2019, 2022 | Land Satellite Remote Sensing Application Center, China |
| Net Primary Productivity | 500 m | 2000–2020 | NASA |
| Soil Conservation | 250 m | 2020 | www.gis5g.com (accessed on 6 May 2023) |
| Precipitation | - | 1990–2020 | Meteorological Station in Baoding |
| Grain Output and Prices | - | 2020, 2021 | Government Statistical Report |
| Unused Land | Ecological Land | Agricultural Land | Urban Settlement Land | |
|---|---|---|---|---|
| Land Use Type | Unused Land, Snow and Ice | Coniferous Forest, Broad-leaved Forest, Grassland, Wetland, Water body | Cultivated Land | Construction Land |
| Grade | 1 | 2 | 3 | 4 |
| Name | Unit | Value Range | Name | Unit | Value Range |
|---|---|---|---|---|---|
| Patch Density (PD) | pcs/100 ha | (0, +∞) | Shannon’s Diversity Index (SHDI) | - | [0, +∞) |
| Edge Density (ED) | m/ha | (0, +∞) | |||
| Division Index (DIVISION) | % | (0, 100] | Aggregation Index (AI) | % | (0, 100] |
| Mean Area (AREA_MN) | ha | (0, +∞) | Contagion Index (CONTAG) | % | (0, 100] |
| Type of Ecosystem | Supply Service | Regulating Service | Support Service | Cultural Service | |||||||
|---|---|---|---|---|---|---|---|---|---|---|---|
| Food Production | Raw Material Production | Water Resource Supply | Climate Regulation | Gas Regulation | Environment Purification | Horologic Regulation | Soil Conservation | Maintenance of Nutrient Cycles | Maintenance of Biodiversity | Provision of Esthetic Landscapes | |
| Grassland | 1.06 | 1.57 | 0.11 | 5.51 | 14.56 | 4.81 | 1.33 | 0.04 | 0.52 | 6.10 | 2.69 |
| Cultivated Land | 3.88 | 1.83 | 0.01 | 3.06 | 1.64 | 0.46 | 0.15 | 0.03 | 0.55 | 0.59 | 0.27 |
| Construction Land | 0.00 | 0.00 | 0.00 | 0.00 | 0.00 | 0.00 | 0.00 | 0.00 | 0.00 | 0.00 | 0.00 |
| Broad-leaved Forest | 1.32 | 3.01 | 0.19 | 9.90 | 29.66 | 8.81 | 2.70 | 0.08 | 0.91 | 11.00 | 4.84 |
| Wetland | 2.33 | 2.28 | 1.48 | 8.67 | 16.43 | 16.43 | 13.81 | 0.07 | 0.82 | 35.91 | 21.58 |
| Water Body | 3.65 | 1.05 | 4.73 | 3.51 | 10.45 | 25.33 | 58.28 | 0.03 | 0.32 | 11.64 | 8.62 |
| Coniferous Forest | 1.00 | 2.37 | 0.15 | 7.76 | 23.14 | 6.80 | 1.90 | 0.06 | 0.73 | 8.58 | 3.74 |
| Types | 2014–2016 | 2016–2019 | 2019–2022 | 2014–2022 |
|---|---|---|---|---|
| Grassland | 30.98% | −17.69% | 164.24% | 43.81% |
| Cultivated Land | −2.79% | −11.62% | −11.68% | −7.51% |
| Construction Land | 12.70% | 1.06% | 2.85% | 5.06% |
| Broad-leaved Forest | −5.96% | 6.42% | 6.99% | 3.38% |
| Wetland | 5.82% | 37.22% | 1.34% | 18.22% |
| Water Body | −7.03% | −17.09% | 17.65% | −4.49% |
| Coniferous Forest | 5.24% | 324.57% | 12.15% | 189.84% |
| Period | 2014–2016 | 2016–2019 | 2019–2022 | 2014–2022 |
|---|---|---|---|---|
| Dynamic Degree | 2.63% | 7.88% | 4.48% | 4.96% |
| Land Use Degree | 2014 | 2016 | 2019 | 2022 |
| 226.36 | 216.80 | 195.93 | 178.92 | |
| Rate of Change | 2014–2016 | 2016–2019 | 2019–2022 | 2014–2022 |
| −4.22% | −9.63% | −8.68% | −20.95% |
| Land Use Type | ESV of 2014 (108 Yuan/a) | ESV of 2016 (108 Yuan/a) | ESV of 2019 (108 Yuan/a) | ESV of 2022 (108 Yuan/a) |
|---|---|---|---|---|
| Grassland | 4.48 | 7.25 | 3.40 | 20.17 |
| Cultivated Land | 159.98 | 151.04 | 98.38 | 63.91 |
| Construction Land | 0.00 | 0.00 | 0.00 | 0.00 |
| Broad-leaved Forest | 117.18 | 103.20 | 123.08 | 148.88 |
| Wetland | 135.85 | 151.65 | 320.97 | 333.85 |
| Water Body | 148.57 | 127.69 | 62.23 | 95.18 |
| Coniferous Forest | 15.72 | 17.36 | 186.44 | 254.40 |
| Total | 581.77 | 558.20 | 794.50 | 916.40 |
Disclaimer/Publisher’s Note: The statements, opinions and data contained in all publications are solely those of the individual author(s) and contributor(s) and not of MDPI and/or the editor(s). MDPI and/or the editor(s) disclaim responsibility for any injury to people or property resulting from any ideas, methods, instructions or products referred to in the content. |
© 2025 by the authors. Licensee MDPI, Basel, Switzerland. This article is an open access article distributed under the terms and conditions of the Creative Commons Attribution (CC BY) license (https://creativecommons.org/licenses/by/4.0/).
Share and Cite
Ji, X.; Chen, D.; Li, G.; Guo, J.; Liu, J.; Tong, J.; Sun, X.; Du, X.; Zhang, W. Spatiotemporal Dynamics of Ecosystem Service Value and Its Linkages with Landscape Pattern Changes in Xiong’an New Area, China (2014–2022). Appl. Sci. 2025, 15, 5399. https://doi.org/10.3390/app15105399
Ji X, Chen D, Li G, Guo J, Liu J, Tong J, Sun X, Du X, Zhang W. Spatiotemporal Dynamics of Ecosystem Service Value and Its Linkages with Landscape Pattern Changes in Xiong’an New Area, China (2014–2022). Applied Sciences. 2025; 15(10):5399. https://doi.org/10.3390/app15105399
Chicago/Turabian StyleJi, Xinyang, Dong Chen, Guangwei Li, Jingkai Guo, Jiafeng Liu, Jing Tong, Xiyong Sun, Xiaomin Du, and Wenkai Zhang. 2025. "Spatiotemporal Dynamics of Ecosystem Service Value and Its Linkages with Landscape Pattern Changes in Xiong’an New Area, China (2014–2022)" Applied Sciences 15, no. 10: 5399. https://doi.org/10.3390/app15105399
APA StyleJi, X., Chen, D., Li, G., Guo, J., Liu, J., Tong, J., Sun, X., Du, X., & Zhang, W. (2025). Spatiotemporal Dynamics of Ecosystem Service Value and Its Linkages with Landscape Pattern Changes in Xiong’an New Area, China (2014–2022). Applied Sciences, 15(10), 5399. https://doi.org/10.3390/app15105399