Article

The Effects of Plyometric Training on Lower Limb Joint Mobility, Explosive Strength, Advanced Layup Success Rate, and Sports Injury Rate Among College Male Basketball Players

1
Center for General Education, National Taiwan College of Performing Arts, Taipei 11464, Taiwan
2
Office of Physical Education, Tamkang University, No. 151, Ying-Zhuan Rd., Tamshui, New Taipei City 251301, Taiwan
*
Author to whom correspondence should be addressed.
Appl. Sci. 2025, 15(10), 5356; https://doi.org/10.3390/app15105356
Submission received: 2 April 2025 / Revised: 6 May 2025 / Accepted: 9 May 2025 / Published: 11 May 2025

Abstract

:
The purpose of this study was to investigate the benefits of a 12-week plyometric training program intervention on lower limb joint mobility, explosive strength, advanced layup success rates, and injury rates. The study recruited 15 collegiate male basketball players as participants. They underwent basketball training five times per week, each lasting two hours, and additionally received plyometric training twice a week. The study utilized image processing software (ImageJ, version 1.54f, National Institutes of Health, Bethesda, MD, USA) to measure the lower limb joint mobility during the take-off phase of a layup and employed a force plate to assess the explosive strength of the lower limbs during the jump. Furthermore, the study examined the success rate and injury rate of advanced layups—including crossover layups, spin layups, and straight-line layups—as well as the sports injury rate. The results demonstrated that plyometric training significantly enhanced the hip, knee, and ankle joint mobility as well as lower limb explosive strength, with a strong positive correlation between these variables. Furthermore, plyometric training improved joint mobility and lower limb explosive strength. The success rate of advanced layups increased from 50% to 72%, while the sports injury rate decreased from 18% to 8%. In conclusion, plyometric training significantly improved participants’ lower limb joint mobility and explosive strength, which in turn enhanced advanced layup performance and reduced the sports injury rate. Although this study provided preliminary evidence supporting the effectiveness of plyometric training, further research is needed to examine its long-term effects and other influencing factors.

1. Introduction

In competitive basketball, layups served as a crucial scoring method, with the technical demands becoming increasingly complex as the level of competition rose. Advanced layup techniques require athletes to possess exceptional lower limb explosive strength, coordination, and stability, all of which are closely related to the range of motion in lower limb joints and biomechanical parameters [1]. Recent studies demonstrated that plyometric training significantly enhanced lower limb muscle explosive strength and movement control, particularly improving performance in jumping and acceleration movements [2]. However, application-oriented research on advanced layup techniques in basketball remained scarce, and the underlying mechanisms still required further exploration.
Plyometric training was widely recognized as an effective method for enhancing muscular explosiveness. Its core mechanism was based on the stretch–shortening cycles (SSCs), which improved neuromuscular adaptation through rapid muscle stretching and contraction [3]. Moreover, the effects of this training on muscle injury risk [4] and the rehabilitation process had yet to reach a consensus. Existing research indicated that enhancing athletes’ technical stability and joint control abilities effectively reduced the risk of injuries [5]. Therefore, combining plyometric training with injury prevention strategies could provide athletes with more comprehensive protection.
The range of motion in lower limb joints was critical for movement efficiency and technical performance in basketball, especially during high-intensity actions like rapid direction changes and landing from jumps. Studies revealed that restricted joint range of motion could lead to movement compensations, thereby increasing joint load and elevating the risk of injuries [6]. Additionally, biomechanical parameters, such as ground reaction force, joint angles, and muscle activity patterns, directly reflected the effectiveness of training and the details of technical performance [7]. Improving these parameters contributed to optimizing movement techniques, reducing movement errors and injury risks. Meanwhile, sports injuries, particularly lower limb joint injuries (such as knee ligament damage), had become common issues faced by collegiate basketball players [8]. Excessive training or incorrect movement patterns could increase the risk of injuries [9]. Therefore, designing training programs that balance the enhancement of athletic performance and injury prevention became particularly important. Therefore, further exploration of the mechanisms, applicability, and potential limitations of plyometric training not only contributed to the refinement of sports science theories but also provided coaches, athletes, and rehabilitation specialists with more precise guidelines. The necessity of this research lays in addressing gaps in the existing literature, clarifying points of contention, and providing a solid scientific foundation for future applications and practices.
Based on the aforementioned research motivations and questions, the purpose of this study was to examine the effects of plyometric training on lower limb joint mobility and explosiveness during jumping for a layup. Secondly, this study assessed the effects of plyometric training on the advanced layup performance of male collegiate basketball players. Finally, it analyzed the impact of this training on sports injury rates. To achieve the research objectives mentioned above, this study formulated the following research questions: How did plyometric training impact the range of motion in the lower limb joints and the explosive strength of the lower limbs during take-off for layups? Can plyometric training significantly enhance athletes’ advanced layup success rate? Did plyometric training effectively reduce the incidence of sports injuries? Based on the research questions, this study hypothesized that plyometric training would improve the range of motion in the lower limb joints and the explosive strength of the lower limbs during jump take-off for layups. Plyometric training can significantly improve the advanced layup success rate of basketball players and reduce the incidence of sports injuries.

2. Materials and Methods

2.1. Research Design

This study adopted a one-group pretest–posttest design, which was a type of quasi-experimental research design [10]. Participants underwent a 12-week plyometric training program conducted twice weekly (fixed on Mondays and Thursdays) [11]. The training intensity ranged between 70 and 85% of maximum effort. The regimen included circuit-based exercises such as squat jumps, box jumps, and single-leg hops. Each session lasted 60 min, comprising 10 min of warm-up, 40 min of main training, and a 10 min stretching routine.
The study variables included lower limb joint range mobility, defined by the maximum range of motion in the hip, knee, and ankle joints. Lower limb explosive strength was measured through parameters such as take-off time, ground reaction force, rate of force development, hang time, and jump height. Advanced layup success rate encompassed three types: crossover layups, spin layups, and left-hand and right-hand layups. Additionally, sports injury rate (SIR) was quantified as the number of injuries per 1000 training hours.
Data collection methods involved measuring participants’ lower limb joint mobility and explosive strength. Additionally, the success rate of advanced layups and the occurrence of sports injuries were recorded.

2.2. Participants

This study recruited 15 male college basketball players as participants, meeting the required sample size [12]. To ensure the representativeness of the sample, this study utilized the quantile–quantile plot (Q-Q Plot) for normality testing [13], as shown in Figure 1. The results showed that the pre-test means and standard deviations of the participants’ background variables all exhibited a linear normal distribution, including age (21.4 ± 1.29 years), height (180 ± 8.70 cm), weight (78.2 ± 7.68 kg), body mass index (24.1 ± 1.78 kg/m2), skeletal muscle mass (37.9 ± 4.75 kg), and body fat mass (13.3 ± 3.79 kg). Additionally, all values fell within the 95% confidence interval (CI) range [14].
All participants voluntarily joined the study and signed informed consent forms before the research commenced to ensure that the study adhered to academic ethical standards. To ensure the representativeness of the sample and the reproducibility of the study, the inclusion criteria consisted of adult males aged 20 years or older who were in good health, without severe sports injuries or chronic diseases. Additionally, participants were required to have at least two years of formal basketball training and competitive experience to meet the research requirements. The exclusion criteria included injuries that could impair athletic performance, such as recent severe sprains, fractures, or muscle tears, as well as the use of medications that could affect sports performance. Psychological factors that might influence athletic ability, such as severe stress or anxiety disorders, were also considered. Additionally, participants who were unable to complete the required training and testing or failed to comply with the research guidelines were excluded.

Intervention Measures

The participants in this study undergo two hours of basketball training per day (Monday to Friday), including technical training and team practice games. This study employed a progressive training program (PTP) as an intervention measure. The training team consisted of basketball coaches, strength training coaches, and sports protection specialists. Based on the relevant literature [15,16,17,18,19,20] and the expertise of the research team members, a customized PTP was developed to meet the specific demands of basketball and align with the physical and skill attributes of the study participants. Because the participants already possessed a fundamental level of strength, the PTP intervention lasted for 12 weeks, aligning with the physiological adaptation cycles observed in trained individuals [21,22,23]. Additionally, the participants’ background variables exhibited normal distribution, and the PTP incorporated diverse movement types while rationally distributing training intensity, effectively minimizing physiological deviations.
PTP twice a week for 12 weeks [24]. Each training session lasted for a total of 60 min [25], consisting of 10 min of warm-up (dynamic stretching and low-intensity aerobic exercises), 40 min of main training (circuit training), and a 10 min stretching session (static stretching and relaxation). The circuit training was designed with each movement being performed for 40 s, followed by 20 s of rest, completing three cycles. A 2 min rest period was provided between cycles [26]. The training intensity was set to moderate to high levels (70–85% of maximum effort), with intensity being controlled based on heart rate monitoring or perceived exertion (RPE scale) [27]. The training content included movements such as squat jumps, box jumps, single-leg hops, lateral bounds, split jumps, and broad jumps. Warm-ups and stretching were conducted before and after each session to reduce injury risks and enhance training effectiveness. Dynamic warm-ups and static stretching were performed before and after training to ensure exercise safety. The specific details of the intervention measures, including content, intensity, and repetitions, are outlined in Table 1.

2.3. Research Tools and Assessments

2.3.1. The Range of Motion in the Lower Limb Joints During Layups Take-Off

This study utilized high-resolution video recording equipment (Model: Sony Alpha 7R IV, resolution: 3840 × 2160 pixels (4K), frame rate: 100 Hz) to capture athletes’ layup take-off movements. The camera was positioned at the athlete’s side, 5 m away, at a height of 1.2 m, and angled at 90 degrees to the ground to ensure the complete capture of the layup take-off movement [28]. During the recording process, an LED synchronization signal was used to align the timeline of the video camera with the force plate (PASCO PS-3230) to ensure data consistency [29]. During the image analysis phase, key frame images were extracted from the lowest posture before jumping, and image processing and analysis were performed using ImageJ software (Version: 1.53t). ImageJ is an open-source image processing software developed by the National Institutes of Health (NIH) [30]. The study utilized its angle measurement tool to measure the flexion angles of the hip, knee, and ankle joints (sagittal plane) and calculated their ranges of motion. The reliability and validity of the ImageJ software, according to Suzuki et al., were evaluated in a study. The research found that ImageJ’s measurement of stretch distance and movement angles exhibited high test-retest reliability [31].

2.3.2. Assessment of Lower Limb Explosive Performance During Layup Take-Offs with PASCO PS-3230 Force Plate

This study used the PASCO PS-3230 wireless dual-axis force plate (manufactured in Roseville, CA, USA) to evaluate the explosive strength of the lower limbs during take-off for a layup. The equipment was a high-precision voltage-sensing force plate equipped with four force sensors, each with a measurement range of ±1100N and a maximum vertical resultant force capacity of 4400N [32]. Each force sensor was equipped with an overload protection capacity of 1700N, with a total vertical overload protection capacity of up to 6600N, ensuring the stability and safety of the equipment during high-intensity tests. The force plate’s sampling frequency was set to 1000 Hz, generating 1000 measurements per second to capture the subtle kinetic variations at the moment of take-off during a layup. The reliability and validity of the PASCO PS-3230 wireless dual-axis force plate, according to Sands et al., were evaluated in a study. The research found that the PASCO PS-3230 force plate effectively detected ground reaction forces during take-off and demonstrated excellent performance characteristics, confirming its strong reliability and validity [33].
The participants simulated basketball layup movements on a basketball court with a solid flooring surface, stepping on a force plate to perform jump tests. The tests were repeated multiple times to ensure data accuracy. This study utilized the device to measure the following parameters: take-off time, ground reaction force (GRF), rate of force development (RFD), hang time, and jump height. To ensure data accuracy, the force plate was calibrated before each test and synchronized with the timeline of the video recording equipment to integrate kinetic data.

2.3.3. Measurement of Advanced Layup Performance and Success Rate

Starting from a distance of 6.75 m at a 45-degree angle on both the left and right sides of the three-point line, advanced layup techniques (including crossover layups, spin layups, and left-hand and right-hand layups) were performed with dribbling. Ten basketballs were placed at the starting point. After each completed layup, players immediately ran back to the starting point. A total of ten layups were performed to calculate the success rate (layup shots made were counted as the success rate). Success rate (%) = number of layup shots made/total attempts [34].

2.3.4. Calculation and Evaluation of Sports Injury Rate During Basketball and Plyometric Training

This study investigated the sports injury rate (SIR) of participants in basketball training and practice games in the three months prior to the start of the experiment, using it as pre-test data. Participants underwent basketball training five times per week, with each session lasting two hours, totaling 120 h. Additionally, they engaged in a plyometric training program (PTP) twice per week, with each session lasting one hour, accumulating 24 h of training. The total training duration amounted to 144 h. The calculation formula for the sports injury rate (SIR) is as follows: sports injury rate (SIR) = [number of sports injuries occurring within a specific period/total training time (hours)] × 1000. This metric is typically expressed as the number of injuries per 1000 h of training [35] and is used to evaluate the safety and risk control effectiveness of training programs.

2.4. Control Variable

This study publicly recruited male university basketball players in Taiwan, ensuring the normal distribution of participants’ background variables, including age, height, weight, body mass index (BMI), skeletal muscle mass (SMM), and body fat mass (BFM). Additionally, control measures were implemented for diet, recovery, and training environment to minimize potential confounding factors.

2.4.1. Dietary Control

During the experimental period, the research team provided standardized menu posters and verbal dietary guidance to ensure that participants consumed similar nutritional components.

2.4.2. Recovery Control

Participants were required to maintain consistent sleep duration and quality and to record their daily sleep hours. Additionally, after each training session, they followed a standardized recovery protocol—including stretching, massage, and ice application—to promote muscle recovery and reduce injury risk.

2.4.3. Training Environment

The basketball training and plyometric training were conducted under consistent environmental conditions. A dedicated supervisor monitored the sessions to ensure that the execution of training content and intensity aligned with the research design.

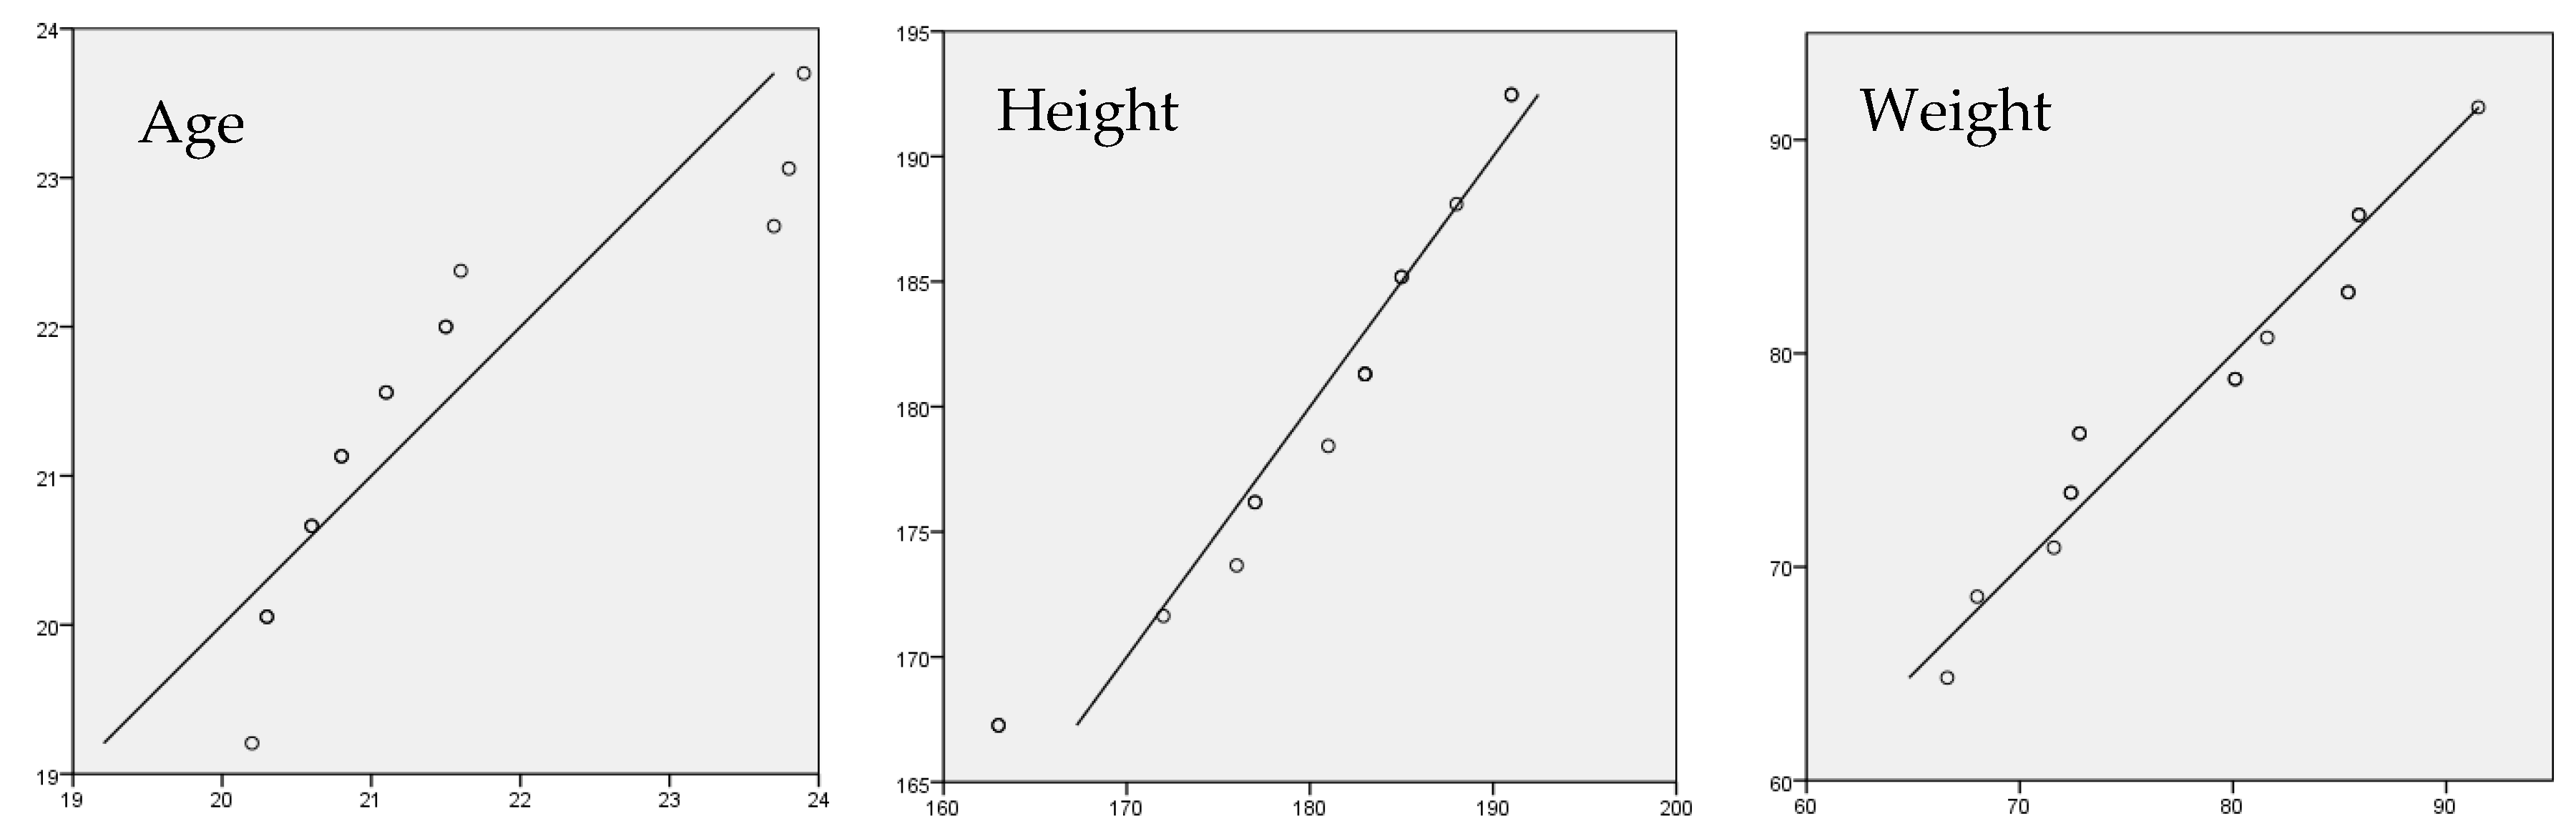
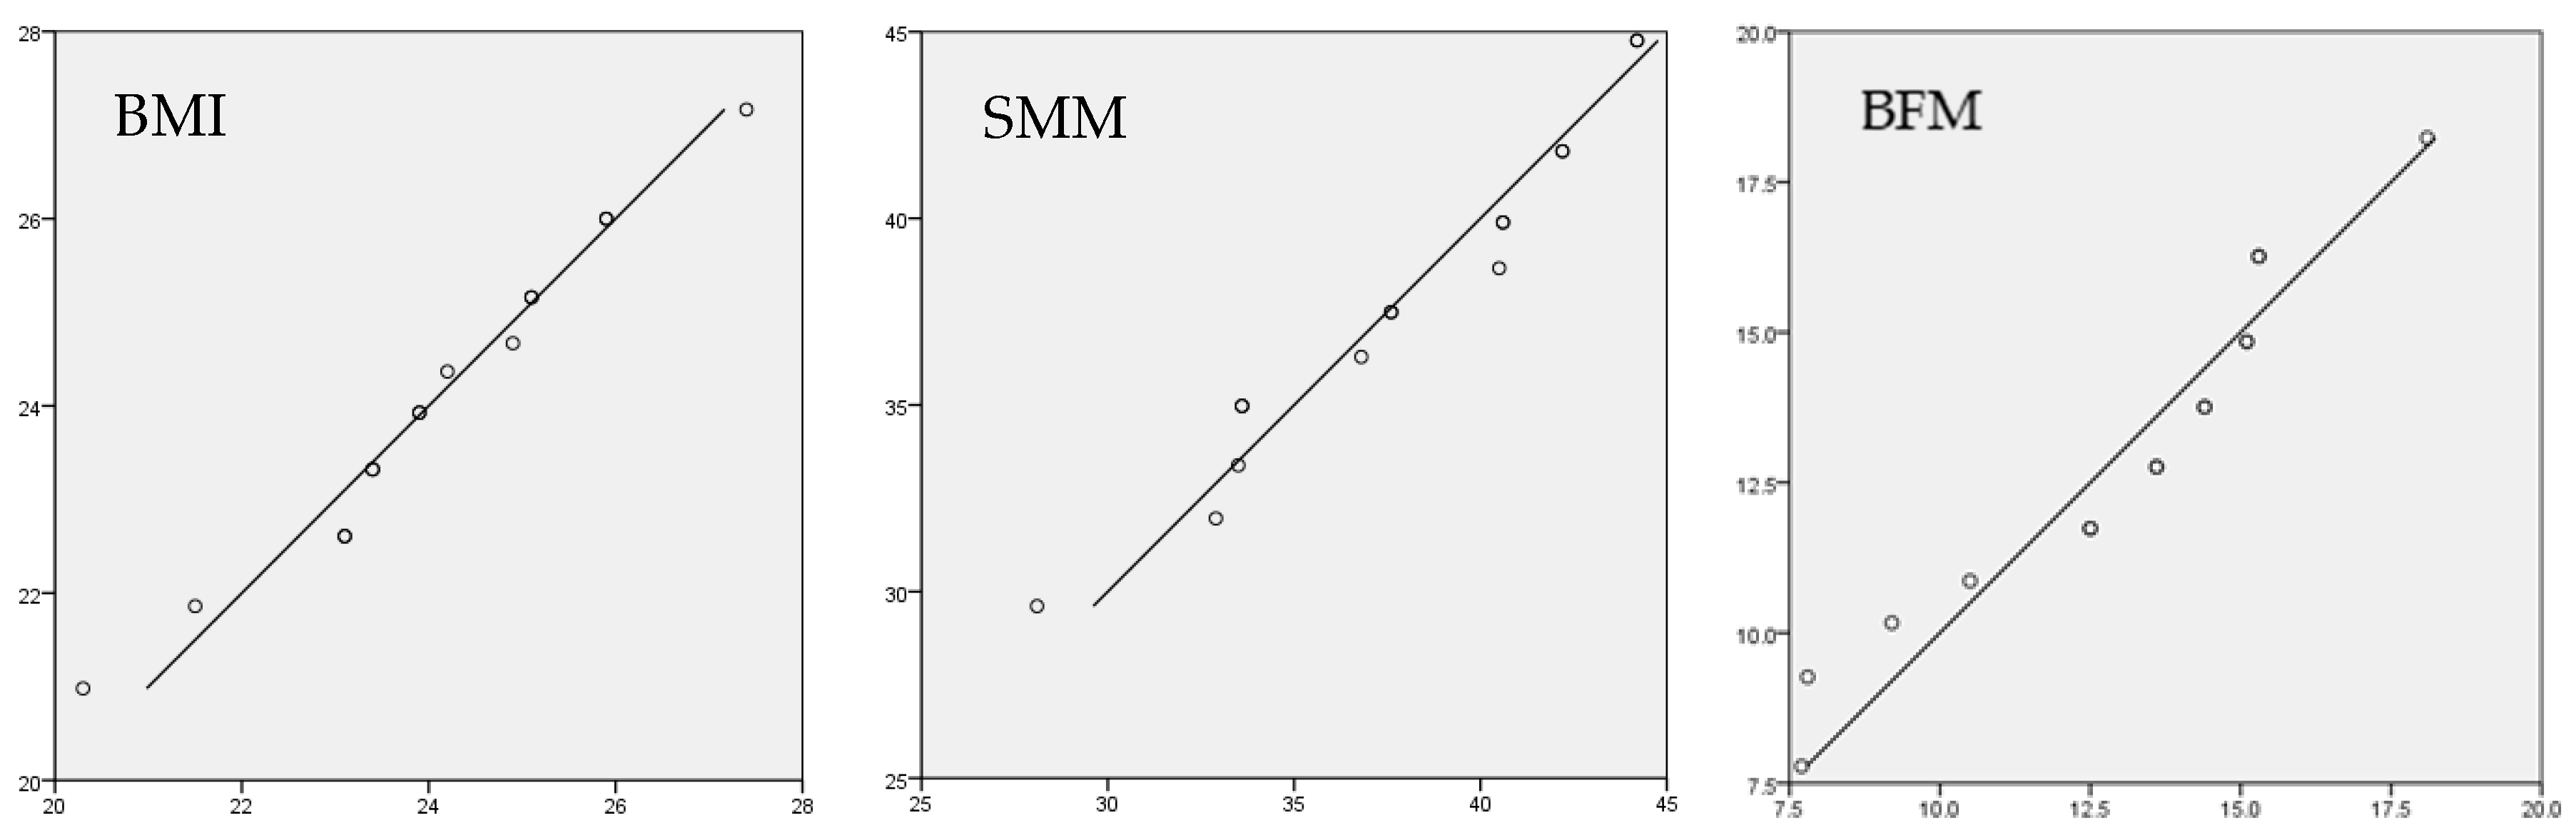
2.5. Statistical Analysis

This study conducted statistical analysis using ImageJ 28.0 software (IBM®, Armonk, NY, USA). First, the Q-Q plot was used to examine the normal distribution of participants’ background variables—including age, height, weight, BMI, SMM, and BFM. For the main research variables, including lower limb joint flexion angles (hip joint, knee joint, ankle joint), lower limb explosive strength (take-off time, ground reaction force, force rate, hang time, and jump height), advanced layup success rate, and sports injury rate—an analysis of covariance (ANCOVA) test and effect size calculations were performed. The partial eta squared (η2) value was obtained to represent the proportion of variance explained by the variables, with the significance level set at p < 0.05. Additionally, partial eta squared (η2) was calculated to measure the effect size, with η2 > 0.14 indicating a large effect size [36]. Furthermore, Pearson correlation coefficients were used to analyze the relationships among lower limb joint range of motion, lower limb explosive strength parameters, and advanced layup success rate. A multiple linear regression model was then constructed with advanced layup success rate as the dependent variable and lower limb joint range of motion and lower limb explosive strength as independent variables to explore the predictive effects on advanced layup success rate. Finally, a paired sample t-test was conducted to analyze the difference in sports injury rates between the pre-test and post-test measurements.

3. Results

3.1. Range of Motion in the Lower Limb Joints During Take-Off for Layups

Based on the results of the analysis of covariates (ANCOVA) and effect size, all parameters showed significant differences between the pre-test and post-test (F-value, p < 0.05). Specifically, the effect size (η2) for all parameters ranged from 0.88 to 0.89, indicating large effect sizes, as shown in Table 2.
The experimental results showed that after 12 weeks of PTP, the participants exhibited improved hip, knee, and ankle joint angles in the squatting posture before take-off when performing a layup, compared with the pre-test. The experimental results revealed that the angles of hip joint flexion, knee joint flexion, and ankle joint flexion in the lower limbs during layups were reduced in the participants. This suggests that the lower limbs were able to generate stronger elastic kinetic energy. The study confirmed that plyometric training programs can improve lower limb joint range of motion during layup take-off.

3.2. Explosive Strength of the Lower Limbs During Take-Off for Layups

The results of the analysis of covariates (ANCOVA) and effect size showed that all parameters exhibited significant differences between the pre-test and post-test (F-value, p < 0.05). Additionally, the effect size (η2) ranged from 0.67 to 0.95, indicating medium to large effect sizes, as shown in Table 3.
Specifically, after 12 weeks of PTP, participants showed significant improvements in various parameters of lower limb explosive strength during layup take-off. After training, the participants showed a 28.4% reduction in average take-off time, an 11.9% increase in ground reaction force, a 13% improvement in rate of force development, a 20% extension in hang time, and a 27.27% increase in jump height. These findings highlight the significant enhancements in lower limb explosive strength achieved through the plyometric training program. These data indicate that plyometric training effectively enhances the rapid stretch–shortening response of muscles, optimizing lower limb explosive strength during take-off. This study confirmed that plyometric training improved lower limb explosive strength for layups.

3.3. Layup Success Rate

After undergoing 12 weeks of PTP, the participants’ post-test averages for left-hand and right-hand crossover layups, left and right spin layups, as well as straight-line layups with both hands were significantly higher than those in the pre-test. Through the analysis of covariates (ANCOVA) and effect size, the results showed that all advanced layup techniques exhibited significant differences between the pre-test and post-test (F-value, p < 0.05). Moreover, the η2 values for effect size ranged between 0.25 and 0.94, indicating large effect sizes, as shown in Table 4. Specifically, participants showed significant improvements in the success rates of crossover layups, spin layups, and straight-line layups, which were closely related to the plyometric training’s impact on lower limb explosiveness and joint mobility. These findings indicated that plyometric training effectively improved athletes’ performance in complex technical movements, particularly in situations requiring rapid direction changes, high-intensity jumps, and precise shooting. By improving neuromuscular coordination and kinetic chain functionality, plyometric training significantly increased the success rates of advanced layup techniques. This study confirmed that plyometric training significantly improved basketball players’ advanced layup success rate.

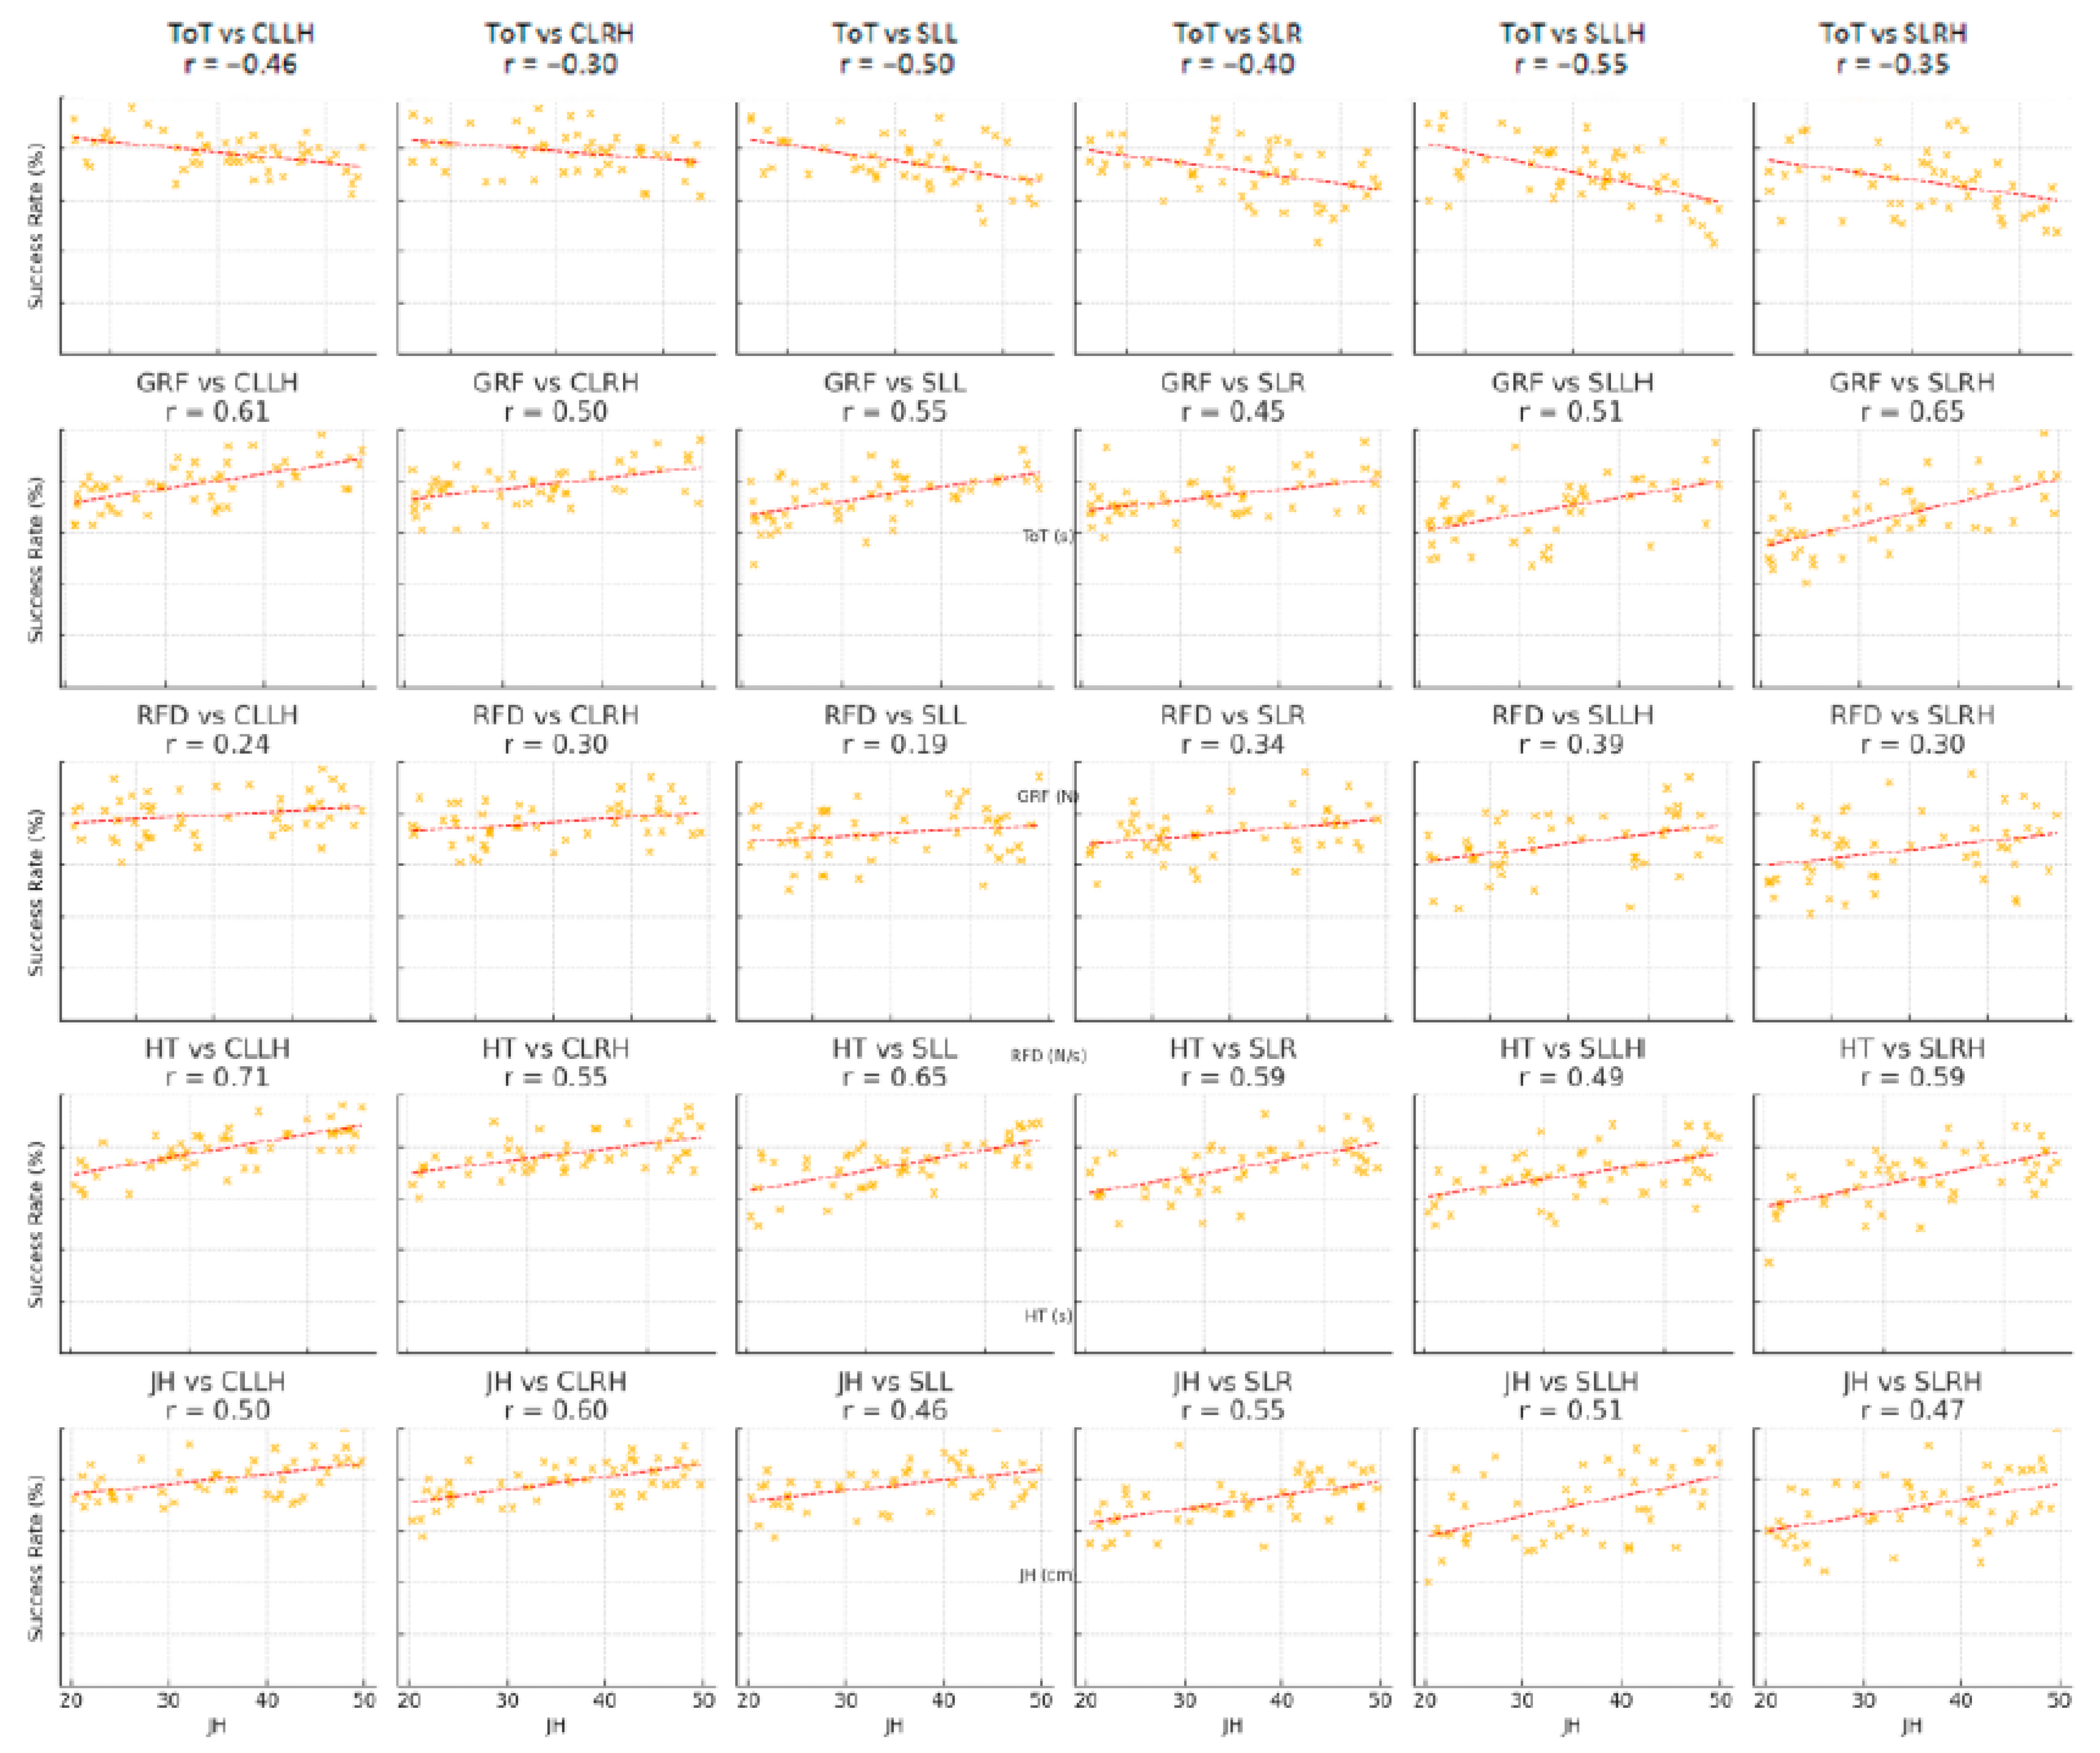
3.4. Pearson Correlation Coefficient Analysis

This section standardized the raw data into Z-scores for lower limb joint mobility (including hip joint, knee joint, and ankle joint), lower limb explosiveness (including jump time, ground reaction force, rate of force development, hang time, and jump height), and advanced layup success rates (including left-hand and right-hand crossover layups, left spin and right spin layups, and left-hand and right-hand straight-line layups). A Pearson correlation coefficient analysis was conducted to explore their relationships, with the results being presented in Figure 2. The analysis revealed that, except for jump time, which showed a low correlation with advanced layup success rates, all other parameters of lower limb joint mobility and lower limb explosiveness demonstrated a moderate to high positive correlation with advanced layup success rates. When performing a layup, the lower the angle of the lower limb joints, the higher the resulting rate of force development, thereby enhancing the success rate of advanced layup techniques. These results demonstrated that lower limb joint mobility and lower limb explosiveness significantly influenced the improvement of advanced layup success rates. However, their impact was not absolute and might be further modulated by other factors, such as technical stability and neuromuscular coordination. The findings of this study validated the significant correlations between lower limb joint mobility, lower limb explosiveness, and advanced layup success rates. Furthermore, the results provided empirical support for the application of plyometric training in improving the technical performance of basketball players.

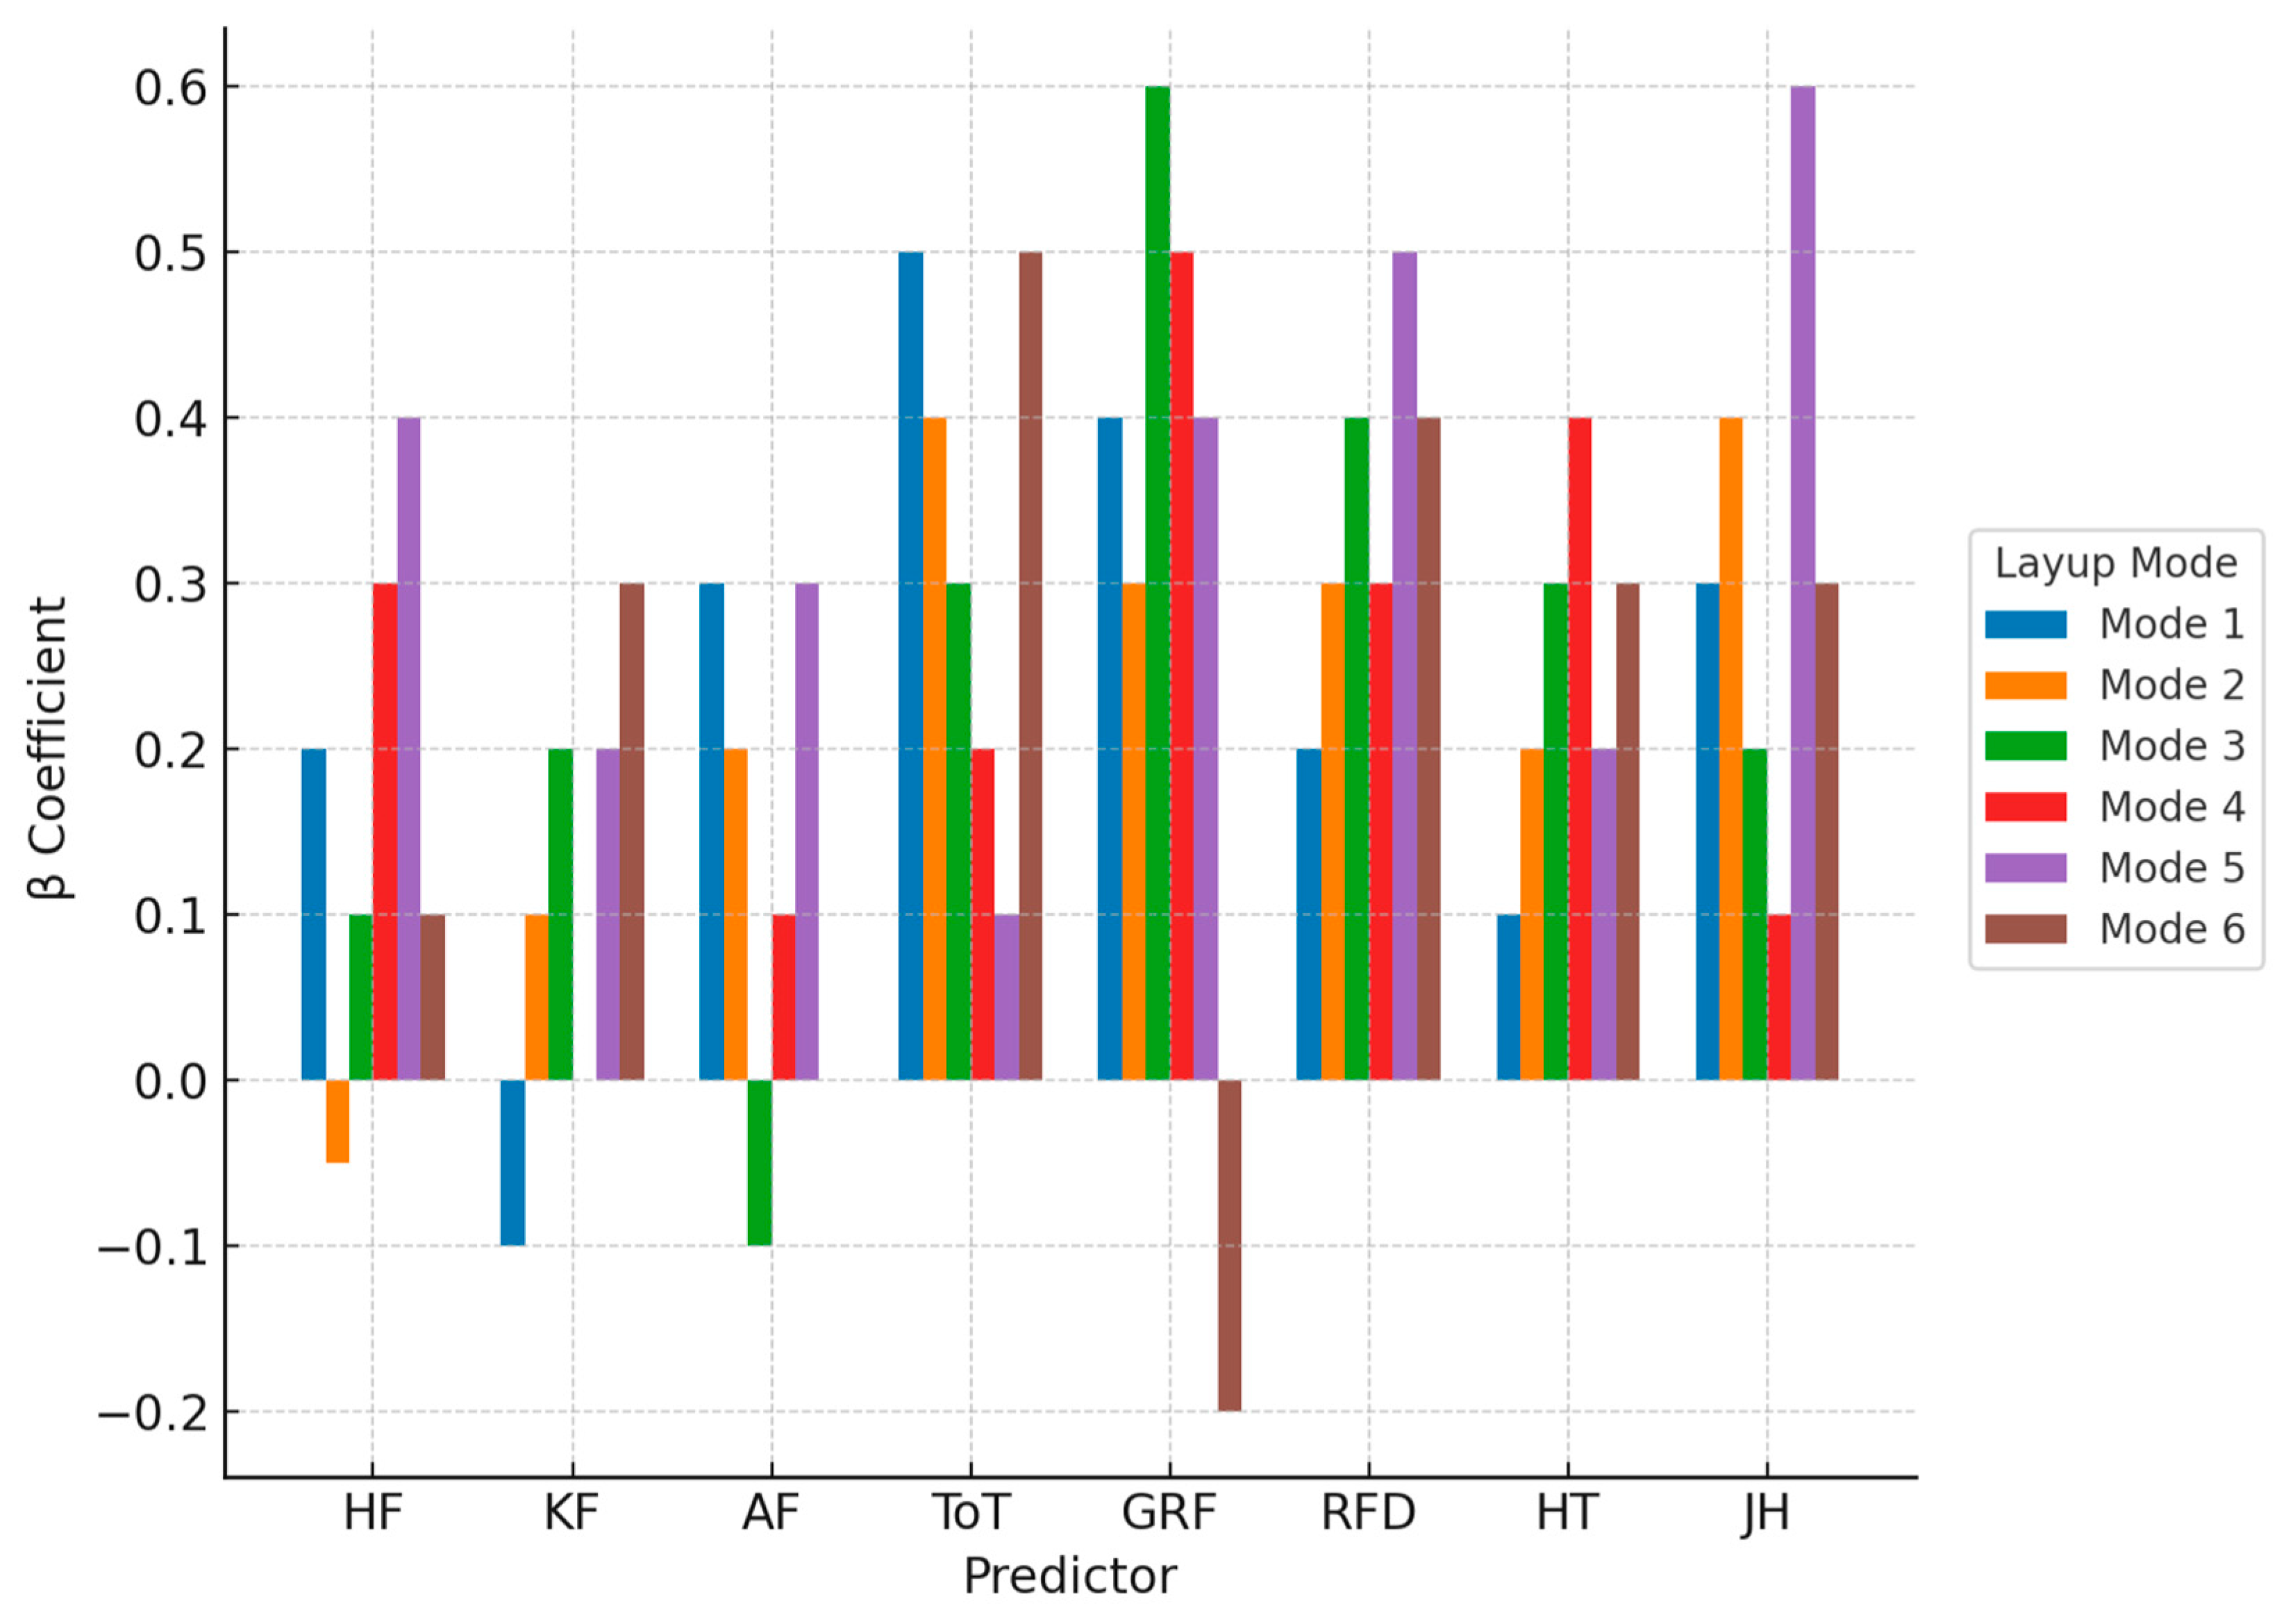
3.5. Multiple Linear Regression Analysis

Through multiple linear regression analysis, this study examined the effects of lower limb joint mobility (including hip joint, knee joint, and ankle joint) and lower limb explosiveness (including jump time, ground reaction force, rate of force development, hang time, and jump height) on advanced layup success rates (Mode 1 was a left-hand crossover layup. Mode 2 was a right-hand crossover layup. Mode 3 was a left-hand spin move layup. Mode 4 was a right-hand spin move layup. Mode 5 was a left-hand straight-line layup. Mode 6 was a right-hand straight-line layup). The results of the analysis are presented in Figure 3. The results showed that the RFD had the highest β coefficient for advanced layup success rates, indicating its strongest predictive capability. GRF ranked second, while take-off time had a lower β coefficient, suggesting its relatively weaker predictive effect. Additionally, the coefficient of determination (R2) for the regression model ranged from 0.50 to 0.72. Specifically, the independent variables explained 61% of the variance in left-hand crossover layup success rates, 55% in right-hand crossover layup success rates, 65% in left spin layup success rates, 50% in right spin layup success rates, 68% in left-hand straight-line layup success rates, and 71% in right-hand straight-line layup success rates. These findings indicated that lower limb joint mobility and explosiveness had significant explanatory power for advanced layup success rates. These results validated that plyometric training significantly improved the advanced layup success rates and technical performance of basketball players. Moreover, they provided scientific evidence for coaches to design high-performance training programs.

3.6. Sports Injury Rate

This study used the sports injury rate from the three months prior to training (5 days per week, 2 h per day, for a total of 120 h) as the pre-test data and conducted a post-test after the 12-week experiment (total training time of 144 h). The results showed a significant difference between the pre- and post-test data (t = 6.87, p < 0.05), with the sports injury rate significantly decreasing from 18% in the pre-test to 8%, as presented in Table 5.
These results indicate that plyometric training combined with post-exercise stretching activities effectively reduced the occurrence of sports injuries. The mechanism may be related to the improvements of lower limb strength, joint stability, and neuromuscular control through plyometric training. In addition, stretching activities further reduced the risk of sports injuries by promoting muscle recovery and reducing fatigue accumulation. These findings validated the effectiveness of plyometric training in lowering sports injury rates and provided athletes with a training model that combines performance improvement and injury prevention.

4. Discussion

The findings of this study demonstrated that plyometric training significantly improved lower limb joint mobility and explosiveness, effectively reduced sports injury rates, and consequently increased advanced layup success rates among male college basketball players. The following sections will provide an in-depth exploration of these results.

4.1. Plyometric Training and Lower Limb Joint Mobility

Plyometric training (PT) was chosen as the core intervention in this study because it enhances the rapid stretch–shortening cycle (SSC) function of muscles [37], improving participants’ lower limb strength and enabling them to generate greater force in a short period. This is particularly crucial for advanced layup movements [38]. This intervention utilized movements such as box jumps, squat jumps, and split jumps, effectively activating the muscle groups surrounding the knee, hip, and ankle joints. Consequently, it promoted joint flexibility and stability. Additionally, PT not only increased lower limb joint mobility but also improved neuromuscular coordination [39]. This was because PT required rapid movement transitions to be completed within extremely short time frames, forcing the nervous system to more efficiently control joint ranges of motion. Training involved hip joint and knee joint adduction and abduction, simultaneously enhancing the elasticity of ligaments and tendons [40]. Additionally, numerous studies have supported the effectiveness of PT in enhancing athletic performance [41,42,43]. However, there are still discrepancies among different studies regarding its mechanisms, application methods, and target populations. Therefore, this study aimed to further clarify these effects by employing a quasi-experimental pre-test and post-test design with both experimental and control groups, allowing for a more rigorous comparison of plyometric training outcomes against general endurance training.

4.2. Plyometric Training and Lower Limb Explosiveness in Layups

The participants exhibited significant improvements in all key indicators of lower limb explosiveness for layups after undergoing PT. Specifically, take-off time was reduced by 28.4%, GRF increased by 11.9%, RFD improved by 13%, hang time was extended by 20%, and jump height increased by 27.27%. These results demonstrated that PT effectively improved the rapid stretch–shortening response of muscles [44], thereby significantly enhancing lower limb explosiveness [2]. Because the layup was a technique that combined speed and explosive strength, PT significantly enhanced lower limb performance by stimulating fast-twitch muscle fibers [45]. This improved muscle reaction speed and neuromuscular coordination [46], thereby providing stable support for the success rate of layup execution. This training method not only enhanced athletes’ explosiveness but also optimized the fluidity and stability of their movements, enabling them to more effectively simulate technical actions in high-intensity competitive scenarios. Additionally, when evaluating the effects of PT in this study, it was important to consider potential confounding factors. For example, the success rate of advanced layups was not solely influenced by muscle strength but was also closely related to technical details, game experience, and psychological state [47,48]. Furthermore, aside from the effects of PT, other forms of training such as resistance training, agility training, and core stability training could also influence athletic performance [49]. These factors were not included in the comparisons of this study. Lastly, when undergoing PT, athletes may experience varying degrees of adaptation and effectiveness depending on their physical conditions [50,51].

4.3. Relationship Between Lower Limb Joint Mobility, Explosiveness, and Advanced Layup Success Rates

During the process of enhancing lower limb explosiveness, the flexion angles of the hip, knee, and ankle joints played a critical role. The range of motion and synergistic effects of these joints directly determined the efficiency of force transmission and the performance of explosiveness [52]. Especially in explosive movements, the flexion angle of the hip joint had a significant impact on the load distribution of the lower limb muscle groups and the generation of explosiveness. It was also closely related to the synergistic operation of the knee and ankle joints [53]. The study by Larsen et al. indicated that an appropriate hip flexion angle promoted the stretch response of muscles, significantly enhancing lower limb explosiveness and further optimizing athletic performance [54]. Additionally, the research conducted by Di Domenico et al. supported this perspective, indicating that optimal joint flexion angles contributed to athletes’ ability to achieve maximum explosiveness [55], which aligned closely with the findings of this study. This study significantly improved the lower limb joint mobility and explosiveness of participants through PT. Specifically, after training, the flexion angles of the hip, knee, and ankle joints in the participants were significantly optimized. This finding aligned with the results of Ramirez-Campillo et al., indicating that PT effectively improved the functionality of the lower limb kinetic chain, thereby increasing layup height and hang time [56].
Further analysis revealed a strong correlation between the success rate of advanced layups and lower limb joint mobility as well as explosiveness. Using a multiple linear regression model analysis, the coefficient of determination (R2) ranged from 0.50 to 0.72. This indicated that the mobility and explosiveness of the hip, knee, and ankle joints explained 50% to 72% of the variance in advanced layup success rates. This result was consistent with the study by Bastholm, further confirming the effectiveness of PT in improving explosiveness and technical performance [2]. Its coordination and stability directly influenced the efficiency of force transmission and athletic performance [52]. PT improved lower limb joint mobility and explosiveness, significantly enhancing the overall functionality of the kinetic chain, thereby increasing the success rate of advanced layups. This training method not only strengthened muscle power and elasticity but also optimized neuromuscular control, enabling athletes to transmit force more efficiently and reduce energy loss during high-intensity movements. These comprehensive improvements provided basketball players with significant advantages in competition while also offering a scientific basis for future training design.

4.4. Sports Injury Rate

This study further compared the differences in participants’ sports injury rates before and after undergoing PT. The data showed that after 12 weeks of PT, the injury rate significantly decreased from 18% to 8%. This result indicated that PT not only improved athletic performance but also effectively reduced the risk of sports-related injuries [57]. The mechanism likely involved several aspects: Firstly, PT significantly strengthened the lower limb muscle groups and improved joint stability, thereby reducing injuries caused by joint instability or insufficient muscle strength [58]. For example, actions such as box jumps and squat jumps effectively activated the muscle groups surrounding the hip, knee, and ankle joints, enhancing joint stability. Secondly, plyometric training strengthened the core muscle groups, providing better support for the body, reducing the risk of injuries to the lower back and hips, and improving overall stability [59]. Furthermore, the training significantly improved athletes’ balance and coordination, enabling them to control their bodies more effectively during high-intensity movements, thereby reducing errors and the likelihood of injuries [60]. Ultimately, enhanced joint mobility helped reduce the risks of muscle strains and joint sprains, enabling athletes to adapt more flexibly to various athletic demands [3].
Advanced layup techniques in basketball—such as crossover layups, spin layups, and straight-line layups—demand excellent physical control, speed, and a combination of strength. These moves often involve rapid directional changes, high-intensity jumps, and multi-angle rotations. Their complexity and high difficulty may elevate injury risks [61]. PT improved the stability and functionality of the kinetic chain, particularly enhancing the coordination and control of the hip, knee, and ankle joints, significantly reducing sports injury rates [62]. Furthermore, plyometric training boosted movement memory and neuromuscular control [63], allowing athletes to execute rapid directional changes or rotational movements more smoothly and stably. These improvements not only increased the success rate of advanced layup techniques but also effectively reduced sports injury risks, offering crucial support for athletes’ long-term professional development.

4.5. Selection Bias

The potential sources of selection bias in this study consisted of two parts. The first was participant selection bias: (1) All participants were male university athletes, which did not represent the general population of basketball players. As a result, the study’s findings could not be directly extrapolated to other groups, such as adolescents, professional players, or female athletes [47,48]. (2) Because participants voluntarily chose to engage in the training, there could have been differences in motivation [49]. For example, athletes who were more willing to accept challenges or who perceived their explosive strength as relatively low might have been more inclined to participate. This could have resulted in the findings being skewed toward the characteristics of that subgroup rather than reflecting the average response of all athletes. (3) Differences in athletes’ physical conditions, prior training experience, and recovery capabilities could have influenced the effectiveness of PT. While some individuals may have experienced significant improvements, others may have seen limited effects [50]. This could have impacted the stability of the study’s conclusions.
The second part concerns the impact on the study’s results: (1) Regarding the measurement of joint mobility and explosive strength, if participants already had a high level of athletic ability, the training effects might have been more pronounced compared with average athletes [51]. This could have led to an overestimation of the impact of PT on general basketball players. (2) In the evaluation of layup success rates and injury rates, if athletes already had a higher level of technical proficiency, the effects of PT might have been exaggerated. Whether athletes with lower technical skills could have similarly benefited from PT remained to be verified.

4.6. Research Limitations

This study adopted a single-group pre-test and post-test design, which may have introduced internal validity concerns. Due to the absence of a control group, the results could have been influenced by participants’ natural growth or other external factors, such as gender, age group, and type of sport. Additionally, this study focused on PT primarily based on its research objective—examining the effects of a specific training method on basketball players’ lower limb joint mobility and explosive strength. Therefore, the study concentrated on a single variable to obtain clearer results. Furthermore, although PT has been widely implemented in athletic training, its specific effects on advanced layup success rates and sports injury reduction in basketball players remain underexplored and require further empirical validation. Therefore, this study addresses this gap by providing targeted evidence on these performance and safety outcomes. Lastly, as this study adopted a single-group pre-test and post-test design, it was not possible to simultaneously examine the comparative effects of multiple training methods. Therefore, a training approach with the most potential and relatively solid research foundation was selected as the intervention.

5. Conclusions

This study examined the effects of plyometric training on the advanced layup performance of male university basketball players. The results indicated that plyometric training significantly enhanced athletes’ lower limb joint mobility and explosive strength. Specifically, improvements in hip, knee, and ankle joint angle adjustments contributed to greater stability within the kinetic chain. Additionally, after training, athletes’ layup success rates increased, indicating that plyometric training had a positive impact on technical performance. The analysis of injury rates suggested that this training model could have contributed to a reduced risk of injury. While this study provided preliminary evidence supporting the effectiveness of plyometric training, further research was needed to examine its long-term effects and other influencing factors.

Author Contributions

Conceptualization, W.-Y.H. and C.-E.W.; methodology, W.-Y.H.; software, C.-E.W.; validation, W.-Y.H. and C.-E.W.; formal analysis, C.-E.W.; investigation, W.-Y.H.; resources, W.-Y.H., data curation, W.-Y.H.; writing—original draft preparation, W.-Y.H.; writing—review and editing, W.-Y.H.; supervision, W.-Y.H.; project administration, W.-Y.H. and C.-E.W. All authors have read and agreed to the published version of the manuscript.

Funding

The authors declare that this research received no external funding. All research expenses, including participant recruitment, data collection, and analysis, were fully covered by the authors themselves without any institutional or third-party financial support.

Institutional Review Board Statement

This study was conducted according to the guidelines of the Declaration of Helsinki and was approved by a local institutional review board (protocol code: A-ER-113-165).

Informed Consent Statement

Informed consent was obtained from all the participants in this study.

Data Availability Statement

Data on the participants were obtained before and after training. All authors confirm the authenticity and availability of the data. All datasets on which this paper’s conclusions are based have been made available to editors, reviewers, and readers.

Acknowledgments

The authors would like to thank all participants for their enthusiastic involvement in the experimental training sessions and their commitment to independent practice. We also acknowledge the Human Research Ethics Review Committee at National Cheng Kung University Hospital (NCKUH) for their review and approval of the ethical aspects of this study. All individuals mentioned in this section have provided their consent to be acknowledged.

Conflicts of Interest

The authors declare no conflicts of interest.

References

  1. Xiong, B. Influence of explosive strength training on lower limbs of badminton athletes. Rev. Bras. Med. Esporte 2023, 29. [Google Scholar] [CrossRef]
  2. Bastholm, M. The Role of Plyometric Training in Improving Explosive Power in Sprinters: A Qualitative Analysis. Int. J. Sport Stud. Health 2024, 7, 71–79. [Google Scholar] [CrossRef]
  3. Ramírez-delaCruz, M.; Bravo-Sánchez, A.; Esteban-García, P.; Jiménez, F.; Abián-Vicén, J. Effects of Plyometric Training on Lower Body Muscle Architecture, Tendon Structure, Stiffness and Physical Performance: A Systematic Review and Meta-analysis. Sports Med. Open 2022, 8, 40. [Google Scholar] [CrossRef]
  4. Bin, X. Knee joint injuries investigation and prevention in college basketball. Rev. Bras. Med. Esporte 2023, 29, e2022_0799. [Google Scholar] [CrossRef]
  5. Bathe, C.; Fennen, L.; Heering, T.; Greif, A.; Dubbeldam, R. Training interventions to reduce the risk of injury to the lower extremity joints during landing movements in adult athletes: A systematic review and meta-analysis. BMJ Open Sport Exerc. Med. 2023, 9, e001508. [Google Scholar] [CrossRef]
  6. Usgu, S.; Bicici, S.; Gönen, T. The association between ankle mobility and Achilles tendon, plantar fascia, iliotibial band stiffness and elasticity in athletes. Turk. J. Sports Med. 2023, 58, 8–14. [Google Scholar] [CrossRef]
  7. Foroughi, F.; Sadeh, S.; Hsiao, H.-Y. Effect of Vertical Ground Reaction Force Biofeedback on Knee and Hip Neuromechanical Characteristics During Walking in Older Adults. Appl. Sci. 2025, 15, 2945. [Google Scholar] [CrossRef]
  8. Tummala, S.V.; Morikawa, L.; Brinkman, J.; Crijns, T.J.; Economopoulos, K.; Chhabra, A. Knee Injuries and Associated Risk Factors in National Basketball Association Athletes. Arthrosc. Sports Med. Rehabil. 2022, 4, e1639–e1645. [Google Scholar] [CrossRef]
  9. Zhu, B. Biomechanical factors affecting sports injuries of college basketball players and training optimization. Mol. Cell. Biomech. 2025, 22, 718. [Google Scholar] [CrossRef]
  10. Harris, A.D.; McGregor, J.C.; Perencevich, E.N.; Furuno, J.P.; Zhu, J.; Peterson, D.E.; Finkelstein, J. The use and interpretation of quasi-experimental studies in medical informatics. J. Am. Med. Inf. Assoc. 2006, 13, 16–23. [Google Scholar] [CrossRef]
  11. Schoenfeld, B.J.; Ogborn, D.; Krieger, J.W. Effects of Resistance Training Frequency on Measures of Muscle Hypertrophy: A Systematic Review and Meta-Analysis. Sports Med. 2016, 46, 1689–1697. [Google Scholar] [CrossRef]
  12. Memon, M.; Ting, H.; Cheah, J.-H.; Ramayah, T.; Chuah, F.; Cham, T.-H. Sample Size for Survey Research: Review and Recommendations. J. Appl. Struct. Equ. Model. 2020, 4, i–xx. [Google Scholar] [CrossRef]
  13. Yue, H. Quantile-Quantile Plot Compared with Stablized Probability Plot in Figure on the Distribution of the Test Research. Am. J. Appl. Math. 2016, 4, 110. [Google Scholar] [CrossRef]
  14. Martínez-Mesa, J.; González-Chica, D.A.; Bastos, J.L.; Bonamigo, R.R.; Duquia, R.P. Sample size: How many participants do I need in my research? Bras. Dermatol. 2014, 89, 609–615. [Google Scholar] [CrossRef] [PubMed]
  15. Grgic, J.; Schoenfeld, B.J.; Mikulic, P. Effects of plyometric vs. resistance training on skeletal muscle hypertrophy: A review. J. Sport Health Sci. 2021, 10, 530–536. [Google Scholar] [CrossRef] [PubMed]
  16. Aztarain-Cardiel, K.; López-Laval, I.; Marco-Contreras, L.A.; Sánchez-Sabaté, J.; Garatachea, N.; Pareja-Blanco, F. Effects of Plyometric Training Direction on Physical Performance in Basketball Players. Int. J. Sports Physiol. Perform. 2023, 18, 135–141. [Google Scholar] [CrossRef]
  17. Bedoya, A.A.; Miltenberger, M.R.; Lopez, R.M. Plyometric Training Effects on Athletic Performance in Youth Soccer Athletes: A Systematic Review. J. Strength Cond. Res. 2015, 29, 2351–2360. [Google Scholar] [CrossRef]
  18. Chaabene, H.; Negra, Y.; Moran, J.; Prieske, O.; Sammoud, S.; Ramirez-Campillo, R.; Granacher, U. Plyometric Training Improves Not Only Measures of Linear Speed, Power, and Change-of-Direction Speed But Also Repeated Sprint Ability in Young Female Handball Players. J. Strength Cond. Res. 2021, 35, 2230–2235. [Google Scholar] [CrossRef]
  19. Deng, N.; Soh, K.G.; Abdullah, B.B.; Huang, D.; Xu, F.; Bashir, M.; Zhang, D. Effects of plyometric training on health-related physical fitness in untrained participants: A systematic review and meta-analysis. Sci. Rep. 2024, 14, 11272. [Google Scholar] [CrossRef]
  20. Fischetti, F.; Vilardi, A.; Cataldi, S.; Greco, G. Effects of Plyometric Training Program on Speed and Explosive Strength of Lower Limbs in Young Athletes. J. Phys. Educ. Sport 2018, 18, 2476–2482. [Google Scholar] [CrossRef]
  21. Mpampoulis, T.; Stasinaki, A.N.; Methenitis, S.; Zaras, N.; Bogdanis, G.C.; Terzis, G. Effect of Different Reduced Training Frequencies after 12 Weeks of Concurrent Resistance and Aerobic Training on Muscle Strength and Morphology. Sports 2024, 12, 198. [Google Scholar] [CrossRef] [PubMed]
  22. Rausch, M.; Weber, F.; Kühn, S.; Ledderhos, C.; Zinner, C.; Sperlich, B. The effects of 12 weeks of functional strength training on muscle strength, volume and activity upon exposure to elevated G(z) forces in high-performance aircraft personnel. Mil. Med. Res. 2021, 8, 15. [Google Scholar] [CrossRef]
  23. Sheoran, S.; Vints, W.A.J.; Valatkevičienė, K.; Kušleikienė, S.; Gleiznienė, R.; Česnaitienė, V.J.; Himmelreich, U.; Levin, O.; Masiulis, N. Strength gains after 12 weeks of resistance training correlate with neurochemical markers of brain health in older adults: A randomized control (1)H-MRS study. Geroscience 2023, 45, 1837–1855. [Google Scholar] [CrossRef]
  24. Kapsis, D.P.; Tsoukos, A.; Psarraki, M.P.; Douda, H.T.; Smilios, I.; Bogdanis, G.C. Changes in Body Composition and Strength after 12 Weeks of High-Intensity Functional Training with Two Different Loads in Physically Active Men and Women: A Randomized Controlled Study. Sports 2022, 10, 7. [Google Scholar] [CrossRef] [PubMed]
  25. Cigerci, A.E.; Genc, H. The effect of strength training with different frequency on untrained university students. Phys. Educ. Stud. 2020, 24, 186–193. [Google Scholar] [CrossRef]
  26. Camargo, L.D.R.; Doneda, D.; Oliveira, V.R. Whey protein ingestion in elderly diet and the association with physical, performance and clinical outcomes. Exp. Gerontol. 2020, 137, 110936. [Google Scholar] [CrossRef] [PubMed]
  27. Zinoubi, B.; Zbidi, S.; Vandewalle, H.; Chamari, K.; Driss, T. Relationships between rating of perceived exertion, heart rate and blood lactate during continuous and alternated-intensity cycling exercises. Biol. Sport 2018, 35, 29–37. [Google Scholar] [CrossRef]
  28. Buscà, B.; Quintana, M.; Padullés, J. High-speed cameras in sport and exercise: Practical applications in sports training and performance analysis. Aloma. Rev. Psicol. Ciències L’educació L’esport 2016, 34, 13–23. [Google Scholar] [CrossRef]
  29. Baritz, M. Video System Correlated with Force Plate Recordings for Vertical Jump Biomechanics Analysis. Procedia Manuf. 2020, 46, 857–862. [Google Scholar] [CrossRef]
  30. Schroeder, A.B.; Dobson, E.T.A.; Rueden, C.T.; Tomancak, P.; Jug, F.; Eliceiri, K.W. The ImageJ ecosystem: Open-source software for image visualization, processing, and analysis. Protein Sci. 2021, 30, 234–249. [Google Scholar] [CrossRef]
  31. Suzuki, T.; Hashisdate, H.; Fujisawa, Y.; Yatsunami, M.; Ota, T.; Shimizu, N.; Betsuyaku, T. Reliability of measurement using Image J for reach distance and movement angles in the functional reach test. J. Phys. Ther. Sci. 2021, 33, 112–117. [Google Scholar] [CrossRef] [PubMed]
  32. Chen, B.; Liu, P.; Xiao, F.; Liu, Z.; Wang, Y. Review of the Upright Balance Assessment Based on the Force Plate. Int. J. Environ. Res. Public Health 2021, 18, 2696. [Google Scholar] [CrossRef]
  33. Sands, W.; Bogdanis, G.; Penitente, G.; Donti, O.; McNeal, J.; Butterfield, C.; Poehling, R.; Barker, L. Reliability and validity of a low-cost portable force platform. Isokinet. Exerc. Sci. 2020, 28, 247–253. [Google Scholar] [CrossRef]
  34. Struzik, A.; Pietraszewski, B.; Zawadzki, J. Biomechanical analysis of the jump shot in basketball. J. Hum. Kinet. 2014, 42, 73–79. [Google Scholar] [CrossRef]
  35. Bronner, S.; Ojofeitimi, S.; Mayers, L. Comprehensive Surveillance of Dance Injuries A Proposal for Uniform Reporting Guidelines for Professional Companies. J. Danc. Med. Sci. 2006, 10, 69–80. [Google Scholar] [CrossRef]
  36. Nakagawa, S.; Lagisz, M.; Yang, Y.; Drobniak, S.M. Finding the right power balance: Better study design and collaboration can reduce dependence on statistical power. PLoS Biol. 2024, 22, e3002423. [Google Scholar] [CrossRef] [PubMed]
  37. Groeber, M.; Reinhart, L.; Kornfeind, P.; Baca, A. The Contraction Modalities in a Stretch-Shortening Cycle in Animals and Single Joint Movements in Humans: A Systematic Review. J. Sports Sci. Med. 2019, 18, 604–614. [Google Scholar]
  38. Marzouki, H.; Ouergui, I.; Dridi, R.; Selmi, O.; Mbarki, R.; Mjadri, N.; Thuany, M.; Andrade, M.S.; Bouhlel, E.; Weiss, K.; et al. Effects of Four Weeks of Plyometric Training Performed in Different Training Surfaces on Physical Performances in School Children: Age and Sex Comparisons. Children 2022, 9, 1914. [Google Scholar] [CrossRef]
  39. Davies, G.; Riemann, B.L.; Manske, R. Current concepts of plyometric exercise. Int. J. Sports Phys. Ther. 2015, 10, 760–786. [Google Scholar]
  40. Kubo, K.; Ikebukuro, T.; Yata, H. Effects of plyometric training on muscle-tendon mechanical properties and behavior of fascicles during jumping. Physiol. Rep. 2021, 9, e15073. [Google Scholar] [CrossRef]
  41. Dallas, G.; Pappas, P.; Ntallas, C.; Paradisis, G.; Exell, T. The effect of four weeks of plyometric training on reactive strength index and leg stiffness is sport dependent. J. Sports Med. Phys. Fit. 2020, 60, 979–984. [Google Scholar] [CrossRef]
  42. Li, G.; Peng, K. Core Muscle Training and Its Impact on Athletes’ Explosive Power. Int. J. Public Health Med. Res. 2024, 1, 88–96. [Google Scholar] [CrossRef]
  43. Wang, X.; Lv, C.; Qin, X.; Ji, S.; Dong, D. Effectiveness of plyometric training vs. complex training on the explosive power of lower limbs: A Systematic review. Front. Physiol. 2022, 13, 1061110. [Google Scholar] [CrossRef] [PubMed]
  44. Booth, M.; Orr, R. Effects of Plyometric Training on Sports Performance. Strength Cond. J. 2016, 38, 30–37. [Google Scholar] [CrossRef]
  45. Hughes, D.C.; Ellefsen, S.; Baar, K. Adaptations to Endurance and Strength Training. Cold Spring Harb. Perspect. Med. 2018, 8, a029769. [Google Scholar] [CrossRef]
  46. Macaluso, F.; Isaacs, A.W.; Myburgh, K.H. Preferential type II muscle fiber damage from plyometric exercise. J. Athl. Train 2012, 47, 414–420. [Google Scholar] [CrossRef] [PubMed]
  47. Ashworth, J.; Heyndels, B. Selection Bias and Peer Effects in Team Sports the Effect of Age Grouping on Earnings of German Soccer Players. J. Sports Econ. 2007, 8, 355–377. [Google Scholar] [CrossRef]
  48. Cobley, S.; Baker, J.; Wattie, N.; McKenna, J. Annual Age-Grouping and Athlete Development. Sports Med. 2009, 39, 235–256. [Google Scholar] [CrossRef]
  49. Nuzzo, J. Volunteer Bias and Female Participation in Exercise and Sports Science Research. Quest 2021, 73, 82–101. [Google Scholar] [CrossRef]
  50. Bolckmans, S.; Starkes, J.L.; Towlson, C.; Barnes, C.; Parkin, G.; Helsen, W.F. Leveling the Playing Field: A New Proposed Method to Address Relative Age- and Maturity-Related Bias in UK Male Academy Soccer Players. Front. Sports Act. Living 2022, 4, 847438. [Google Scholar] [CrossRef]
  51. Stone, M.H.; Hornsby, W.G.; Suarez, D.G.; Duca, M.; Pierce, K.C. Training Specificity for Athletes: Emphasis on Strength-Power Training: A Narrative Review. J. Funct. Morphol. Kinesiol. 2022, 7, 102. [Google Scholar] [CrossRef] [PubMed]
  52. Ibrahim, R.; Kingma, I.; de Boode, V.; Faber, G.S.; van Dieën, J.H. Angular Velocity, Moment, and Power Analysis of the Ankle, Knee, and Hip Joints in the Goalkeeper’s Diving Save in Football. Front. Sports Act. Living 2020, 2, 13. [Google Scholar] [CrossRef]
  53. Baumgart, C.; Kurz, E.; Freiwald, J.; Hoppe, M.W. Effects of Hip Flexion on Knee Extension and Flexion Isokinetic Angle-Specific Torques and HQ-Ratios. Sports Med. -Open 2021, 7, 41. [Google Scholar] [CrossRef] [PubMed]
  54. Larsen, S.; Sandvik Kristiansen, B.; Swinton, P.A.; Wolf, M.; Bao Fredriksen, A.; Nygaard Falch, H.; van den Tillaar, R.; Østerås Sandberg, N. The effects of hip flexion angle on quadriceps femoris muscle hypertrophy in the leg extension exercise. J. Sports Sci. 2024, 43, 210–221. [Google Scholar] [CrossRef] [PubMed]
  55. Di Domenico, F.; Esposito, G.; Aliberti, S.; D’Elia, F.; D’Isanto, T. Determining the Relationship between Squat Jump Performance and Knee Angle in Female University Students. J. Funct. Morphol. Kinesiol. 2024, 9, 26. [Google Scholar] [CrossRef]
  56. Ramirez-Campillo, R.; García-Hermoso, A.; Moran, J.; Chaabene, H.; Negra, Y.; Scanlan, A.T. The effects of plyometric jump training on physical fitness attributes in basketball players: A meta-analysis. J. Sport Health Sci. 2022, 11, 656–670. [Google Scholar] [CrossRef]
  57. Gabbett, T.J. The training—Injury prevention paradox: Should athletes be training smarter and harder? Br. J. Sports Med. 2016, 50, 273–280. [Google Scholar] [CrossRef]
  58. Kons, R.L.; Orssatto, L.B.R.; Ache-Dias, J.; De Pauw, K.; Meeusen, R.; Trajano, G.S.; Dal Pupo, J.; Detanico, D. Effects of Plyometric Training on Physical Performance: An Umbrella Review. Sports Med.-Open 2023, 9, 4. [Google Scholar] [CrossRef]
  59. Zhou, J.Y.; Wang, X.; Hao, L.; Ran, X.W.; Wei, W. Meta-analysis of the effect of plyometric training on the athletic performance of youth basketball players. Front. Physiol. 2024, 15, 1427291. [Google Scholar] [CrossRef]
  60. Witvrouw, E.; Mahieu, N.; Danneels, L.; McNair, P. Stretching and injury prevention: An obscure relationship. Sports Med. 2004, 34, 443–449. [Google Scholar] [CrossRef]
  61. Hameed, I.; Farooq, N.; Haq, A.; Aimen, I.; Shanley, J. Role of strengthening exercises in management and prevention of overuse sports injuries of lower extremity: A systematic review. J. Sports Med. Phys. Fit. 2024, 64, 807–815. [Google Scholar] [CrossRef] [PubMed]
  62. Hasan, S. Effects of plyometric vs. strength training on strength, sprint, and functional performance in soccer players: A randomized controlled trial. Sci. Rep. 2023, 13, 4256. [Google Scholar] [CrossRef] [PubMed]
  63. Almansoof, H.S.; Nuhmani, S.; Muaidi, Q. Role of kinetic chain in sports performance and injury risk: A narrative review. J. Med. Life 2023, 16, 1591–1596. [Google Scholar] [CrossRef] [PubMed]
Figure 1. Normal distribution of participants’ background variables. Note: The horizontal axis represented “observed values”, while the vertical axis indicated “deviation from normality”. The abbreviation for body mass index was BMI; skeletal muscle mass was abbreviated as SMM, and body fat mass was abbreviated as BFM.
Applsci 15 05356 g001aApplsci 15 05356 g001b
Figure 2. Correlation analysis of lower limb joint range of motion, explosive strength, and advanced layup. Hip flexion was abbreviated as HF; knee flexion as KF; ankle flexion as AF; take-off time as ToT; ground reaction force as GRF; rate of force development as RFD; hang time as HT; and jump height as JH. Left-hand and right-hand crossover layups were abbreviated as CLLH/CLRH; left spin and right spin layups were abbreviated as SLL/SLR; and left-hand and right-hand straight-line layups were abbreviated as SLLH/SLRH. p < 0.05.
Applsci 15 05356 g002
Figure 3. Regression analysis of lower limb joint range of motion and explosive strength on advanced layup success rate. Standardized β coefficients of predictor variables across six advanced layup modes. The X-axis displays eight biomechanical predictors: HF (hip flexion), KF (knee flexion), AF (ankle flexion), ToT (take-off time), GRF (ground reaction force), RFD (rate of force development), HT (hang time), and JH (jump height). The Y-axis indicates the standardized regression coefficients (β), reflecting the strength and direction of each predictor’s influence on layup success rate in each mode.
Applsci 15 05356 g003
Table 1. Plyometric training program.
ContentIntensity/Repetitions
Warm-UpDynamic stretching: 8 min. Stationary high knees: 1 min. Side-step movements: 1–2 min
Squat JumpsIntensity: 70–75%, repeated 10–12 times
Box JumpsIntensity: 75–80%, repeated 8–10 times
Split JumpsIntensity: 70–75%, repeated 10–12 times
Jump RopeIntensity: 60–70%, 2–3 min
Single-Leg HopsIntensity: 75–80%, repeated 6–8 times
Lateral BoundsIntensity: 70–75%, repeated 10–12 times
Vertical JumpsIntensity: 80–85%, repeated 6–8 times
Lunge JumpsIntensity: 70–75%, repeated 8–10 times
Step JumpsIntensity: 70–75%, repeated 10–12 times
Double-Leg Squat JumpsIntensity: 75–80%, repeated 8–10 times
Stretching1. Hamstring stretch: bent forward and tried to touch the toes of the extended leg, holding the position for 20–30 s.
2. Hip flexor stretch: adopted a half-kneeling position with one leg in front and one leg behind. Pushed the hips forward and held the position for 20–30 s.
3. Calf muscle stretch: placed hands against a wall with one leg in front and one leg behind. Pressed the heel of the back leg towards the ground, holding the position for 20–30 s.
Table 2. Analysis of covariates and effect size for lower limb joint range of motion.
ParametersTestsParticipants
(n = 15)
M ± SD
Effects
(Pre-Test and Post-Test)
F-Value
η2
Hip joint flexion (Deg.)Pre142 ± 13.94124.78 *0.89
Post127 ± 13.45
Knee joint flexion (Deg.)Pre138 ± 13.08109.19 *0.88
Post122 ± 12.67
Ankle joint flexion (Deg.)Pre69 ± 6.54109.18 *0.88
Post61 ± 6.33
The mean ± standard deviation is expressed as M ± SD. F-test values are indicated by F-values. * p < 0.05.
Table 3. Analysis of covariates and effect size for lower limb explosive strength.
ParametersTestsParticipants
(n = 15)
M ± SD
Effects
(Pre-Test and Post-Test)
F-Value
η2
Take-off time (s)Pre0.67 ± 0.1042.27 *0.75
Post0.48 ± 0.03
GRF (Nt)Pre813 ± 10528.90 *0.67
Post910 ± 129
RFD (r)Pre8060 ± 58032.71 *0.70
Post9115 ± 629
Hang time (s)Pre0.45 ± 0.05246.89 *0.95
Post0.54 ± 0.05
Jump height (cm)Pre33 ± 5.94158.02 *0.92
Post42 ± 4.95
Rate of force development, abbreviated as RFD. Ground reaction force, abbreviated as GRF. The mean ± standard deviation is expressed as M ± SD. F-test values are indicated by F-values. * p < 0.05.
Table 4. Analysis of covariates and effect size for advanced layup success rate.
Success Rates (%)TestsParticipants
(n = 15)
M ± SD
Effects
(Pre-Test and Post-Test)
F-Value
η2
Crossover
layup
Left-handPre79 ± 9.6158.41 *0.81
Post94 ± 5.07
Right-handPre65 ± 9.16109.38 *0.89
Post81 ± 9.16
Spin
layup
Left-turnPre53 ± 8.17686.00 *0.98
Post81 ± 9.16
Right-turnPre50 ± 12.54127.89 *0.91
Post67 ± 10.34
Straight
layup
Left-handPre80 ± 8.4534.46 *0.71
Post91 ± 7.04
Right-handPre89 ± 5.9410.42 *0.43
Post95 ± 5.16
Starting from a distance of 6.75 m at a 45-degree angle on both the left and right sides of the three-point line, advanced layup techniques were performed with dribbling. Success rate (%) was calculated as the number of successful shots divided by the total attempts. The mean ± standard deviation is expressed as M ± SD. F-test values are indicated by F-values. * p < 0.05.
Table 5. Pre- and post-test t-tests for participants’ sports injury rate.
TestsM ± SDdft-Valuesp-Values
SIR (%)Pre18 ± 6.28146.87 *0.00
Post8 ± 5.57
The sports injury rate (SIR) is represented as a percentage (%). The mean ± standard deviation is expressed as M ± SD. t-test values are indicated by t-values (p-values). * p < 0.05.
Disclaimer/Publisher’s Note: The statements, opinions and data contained in all publications are solely those of the individual author(s) and contributor(s) and not of MDPI and/or the editor(s). MDPI and/or the editor(s) disclaim responsibility for any injury to people or property resulting from any ideas, methods, instructions or products referred to in the content.

