Article

A Confocal Ellipsoidal Densification Model for Estimating Improvement Effects on Soil Under Dynamic Compaction

1
School of Civil Engineering, Xuzhou University of Technology, Xuzhou 221018, China
2
College of Water Conservancy and Hydropower Engineering, Hohai University, Nanjing 210024, China
3
College of Civil and Transportation Engineering, Hohai University, Nanjing 210024, China
4
School of Earth Sciences and Engineering, Hohai University, Nanjing 210024, China
5
Architectural Engineering Institute, Nanjing Institute of Technology, Nanjing 211167, China
*
Author to whom correspondence should be addressed.
Appl. Sci. 2025, 15(10), 5292; https://doi.org/10.3390/app15105292
Submission received: 20 March 2025 / Revised: 7 May 2025 / Accepted: 8 May 2025 / Published: 9 May 2025

Abstract

:
This paper focuses on improvement effects on soil foundations under dynamic compaction (DC). Firstly, a confocal ellipsoidal densification model (CEDM) composed of a heavy compacted zone (HCZ) and a weak compacted zone (WCZ) was proposed to describe the subarea characteristic of an improvement range. Next, based on a confocal assumption of HCZ and WCZ ellipses, a mass balance equation considering changes in soil dry density in different compacted zones was established for solving the ellipsoidal parameters. Then, a designed laboratory test was conducted and a two-dimensional (2D) finite element model (FEM) established. The simulated crater depth and dynamic stress agreed well with testing results, confirming that the established FEM could be used for investigating the DC process. Finally, the applicability of the solution procedure for the proposed CEDM was verified. The predicted HCZ and WCZ were in close agreement with the simulated results, indicating that the proposed CEDM could be used for estimating the soil improvement range. With increases in tamping times, the HCZ ellipse moved down in the vertical direction without volumetric expansion, while the WCZ ellipse expanded along the depth and lateral directions. These findings may offer some guidelines for research into improvement effects on soil foundation under DC.

1. Introduction

Dynamic compaction (DC) is a commonly used soil densification method [1,2] in which soil is compacted through repeated or multiple impacts using a heavy-weight tamper, thereby inducing volumetric compression and improving bearing capacity. Due to its significant advantages of operational simplicity and low economic cost, DC has been widely used in various engineering applications, including airports, earth dams, and highways. Obviously, accurate estimations of improvement areas, including assessments of crater dimensions, improvement depths, and lateral extents are of great importance in the design of DC for use in engineering applications, prompting widespread concerns among researchers.
Since the empirical formula for the relationship between crater depth and drop energy was originally proposed by Menard [1] and then further modified by Leonards [2], numerous studies have focused on the correction of empirical formulas for various soil types. Mayne et al. [3] collected 120 site measurements and obtained general trends involving variations in crater size and depth of influence with tamping energy, which was also selected as a key index by Lukas [4] and by Zhang et al. [5] for calculating crater depth. Feng et al. [6,7] reported the effectiveness of high-energy DC and suggested different empirical factors for coarse-grained soil and desert sand. Poran et al. [8,9] analyzed the effect of normalized impact energy on crater depth for dry sand through model tests and numerical simulations. Oshima et al. [10,11] used ram momentum to calculate crater depths under heavy tamping based on centrifugal model tests. Li et al. [12] studied how the evolution of crater depth varied with the number of blows. In addition, numerical analyses have been conducted to estimate crater depth under the influence of DC operating parameters [13], as well as soil constitutive models [14,15]. Although there are some differences among pre-estimations of DC design and construction parameters, these extended empirical formulas can provide easy and convenient guidelines for determining relevant DC parameters in terms of single-point tamping. However, the dynamic stress wave generated by DC does not only densify soil beneath the tamping location, but also in the area around this location [16,17]. Thus, the estimation of improvement depth and lateral extension also plays an important role in DC design and construction, especially for multiple-point tamping. It can help in ascertaining tamping spacing, tamping order, and the grid pattern. Accordingly, various empirical relationships have been developed to predict improvement depth and lateral extension based on simplified theoretical models [18,19] and field measurements [20].
Moreover, numerous numerical methods have been adopted to evaluate improvement ranges. Poran et al. [9] obtained the dimensions of volumetric strain contours for dry sand using a finite element model (FEM). Yao et al. [14] embedded a cap model into the ABAQUS program for simulating successive DCs. Ghassemi et al. [21] developed a fully coupled hydromechanical FEM to evaluate the DC effect on saturated granular soils. Since then, FEM simulations have been used to describe improvement ranges with considerations of energy efficiency [22], multi-point tamping [23,24], and the groundwater table [25]. Because the discrete element method (DEM) can offer microscopic insights into the soil densification mechanism, it has been widely used for simulating DC processes involving gravel soil [26,27] and granular soils [28,29]. Recently, Zhang et al. [30] investigated DC of rockfill and its efficiency using a newly developed material point method. These findings indicate that the improvement range of soil due to DC exhibits a significant partition feature.
In order to directly and quickly evaluate the improvement range of soil induced by DC, it is commonly described using a specific geometric shape [8,9,14,22,23,30]. Poran et al. [8,9] were the first to show that the improvement zone was approximately ellipsoidal by plotting the relative density contours of soil after DC based on model tests. Yao et al. [14] found that the elliptic equation can fit well with simulated volumetric strain contours using a 3D FEM. It was assumed that the soil in an ellipsoidal region reached the same relative density or volumetric strain after tamping. However, this assumption was found to be inconsistent with the situation that the degree of soil improvement gradually decreases with increases in distance from the tamping point, so that the accuracy of predicted results was limited. Subsequently, Wen et al. [22] and Dou et al. [23] considered the partition feature of the improvement range and divided the ellipsoidal improved region into two zones: compacted, affected zones; and heavy, weakly reinforced zones. Similarly, changes in soil properties (relative density or internal friction) in the transition region were ignored. Zhang et al. [30] pointed out that the volumetric strain below the tamper point exponentially decreases along the depth. However, the soil near the tamping point should be considered as a special zone with the highest degree of improvement.
To sum up, application of the ellipsoidal densification zone to represent the improvement range has been widely recognized by scholars. However, the influence of the partition feature upon the degree of soil improvement and its spatial distribution has not been well characterized in the existing models. For instance, the size of the compacted zone with the highest degree of density around the tamping point needs to be quantitatively described, the partition features of compacted zones with different degrees of density remain undefined, and spatial variation in soil dry density in the transition region between the compacted zone with the highest degree of density and the uncompacted zone is still unclear. For this purpose, an innovative confocal ellipsoidal densification model (CEDM) was established in the present study to predict the improvement range of soil under DC. Using this model, both the partition of the improvement range and its geometric relationships were defined. In addition, a mass balance equation considering the spatial distribution of soil dry density after DC was established. Subsequently, a designed laboratory test was carried out and a 2D FEM established to investigate the DC process. Finally, the applicability of the proposed CEDM was verified by comparing the simulated and predicted improvement ranges.

2. Confocal Ellipsoidal Densification Model (CEDM)

2.1. Description of CEDM

In this study, the improvement range of soil foundation under DC was considered to be approximately ellipsoidal, and its vertical section was described using a confocal ellipsoidal densification model (CEDM), as shown in Figure 1. The proposed CEDM was established on three basic assumptions, as follows:
Assumption 1. 
The improvement range of soil foundation induced by DC is divided into two ellipsoidal zones: a heavy compacted zone (HCZ) and a weak compacted zone (WCZ). Considering that the densification zones around the tamping point typically exhibit smooth, continuous transitions in soil properties and behaviors, HCZ and WCZ ellipses are assumed to share a common focus with reference to cavity expansion theory. This allows for convenient coordinate transformations in polar coordinates, facilitating closed-form or semi-analytical solutions for densification patterns.
Assumption 2. 
After tamping, the soil in HCZ is assumed to reach its maximum dry density or unit weight ( γ max ) due to the high energy concentration and intense particle rearrangement caused by DC. As the distance from the tamping point increases, the compaction effect gradually decreases due to energy dissipation, extending to the outer boundary of WCZ with initial dry density or unit weight ( γ 0 ). Considering that a linear function allows for simplified integration in volume-average calculations, the soil dry density or unit weight in WCZ is assumed to decrease linearly from  γ max  at the HCZ edge (e.g., point  P H i ) to the initial dry density  γ 0  at the WCZ edge (e.g., point  P W i ), as shown in Figure 1. In addition, the extended line of point  P W i  and point  P W i  is assumed to pass through the common focus of the HCZ and WCZ ellipses.
Assumption 3. 
The soil in the range of HCZ and WCZ before and after DC satisfies the mass balance equation, which considers changes in soil dry density in different compacted zones.

2.2. Ellipsoid Equation for CEDM

The equations for the vertical sections of the HCZ and WCZ ellipsoids shown in Figure 1, in rectangular coordinates, are as follows:
( z h i 1 ) 2 b i 1 2 + x 2 a i 1 2 = 1
( z h i 2 ) 2 b i 2 2 + x 2 a i 2 2 = 1
where h i 1 is the vertical coordinate of the HCZ ellipsoid; a i 1 and b i 1 are the minor axis and major axis of the HCZ ellipsoid, respectively; h i 2 is the vertical coordinate of the WCZ ellipsoid; a i 2 and b i 2 are the minor axis and major axis, respectively, of the WCZ ellipsoid; and i is the number of tampings.
Taking the common focus as the origin of polar coordinates, the equations for the vertical sections of the HCZ and WCZ ellipsoids, in polar coordinates, are as follows:
ρ = e i 1 p i 1 1 e i 1 cos θ
ρ = e i 2 p i 2 1 e i 2 cos θ
where e i 1 = c i 1 / b i 1 and e i 2 = c i 2 / b i 2 ; p i 1 = a i 1 2 / c i 1 and p i 2 = a i 2 2 / c i 2 ; c i 1 is the eccentric distance of the HCZ ellipsoid, where c i 1 = b i 1 2 a i 1 2 ; and c i 2 is the eccentric distance of the WCZ ellipsoid, where c i 2 = b i 2 2 a i 2 2 .
Because the edges of the HCZ and WCZ ellipsoids pass through the corner point R , d i of the tamper, substituting this point into Equations (1) and (2) gives
( d i h i 1 ) 2 b i 1 2 + R 2 a i 1 2 = 1
( d i h i 2 ) 2 b i 2 2 + R 2 a i 2 2 = 1
Applying ξ i 1 = h i 1 d i > 0 and ξ i 2 = h i 2 d i > 0 , Equations (5) and (6) are transformed into the following expressions:
ξ i 1 2 b i 1 2 + R 2 a i 1 2 = 1
ξ i 2 2 b i 2 2 + R 2 a i 2 2 = 1
Taking the derivation of Equations (1) and (2) with respect to x, we obtain
d z d x = x b i 1 2 ( z h i 1 ) a i 1 2 = x b i 1 2 ( h i 1 z ) a i 1 2
d z d x = x b i 2 2 ( z h i 2 ) a i 2 2 = x b i 2 2 ( h i 2 z ) a i 2 2
In addition, Equation (11) is obtained as follows:
d z d x x = R = cot α 1 , 2 α 1   for   HCZ   and   α 2   for   WCZ
where α 1 and α 2 are the angles between the connecting lines of the common focus and the corner point R , d i and the tangent lines of HCZ and WCZ ellipsoids.
During the dynamic compacting process, the soil at the corner point of the crater R , d i is in a state of limit equilibrium. According to the Mohr–Coulomb strength criterion, the angle between the two failure surfaces (the tangent line of the ellipsoid) is expressed as 45 ° + φ / 2 , in which φ is the friction angle of soil for the improved zones. α 1 and α 2 may thus be expressed as follows:
α 1 = 45 ° φ 1 / 2 and α 2 = 45 ° φ 2 / 2
Combining Equations (7)~(12), the following equations are obtained:
a i 1 2 = R cot α 1 ξ i 1 + R 2
b i 1 2 = ξ i 1 2 + R cot α 1 ξ i 1
a i 2 2 = R cot α 2 ξ i 2 + R 2
b i 2 2 = ξ i 2 2 + R cot α 2 ξ i 2
According to Assumption 1, there is a common focus for the ellipsoids of HCZ and WCZ, so that:
h i 1 c i 1 = h i 2 c i 2
Consequently,
ξ i 1 ξ i 2 = b i 1 2 a i 1 2 b i 2 2 a i 2 2
Substituting Equations (13)~(16) into Equation (18), we obtain
ξ i 1 ξ i 2 = ξ i 1 2 + R ( cot α 1 tan α 1 ) ξ i 1 R 2 ξ i 2 2 + R ( cot α 2 tan α 2 ) ξ i 2 R 2
Equation (19) is now squared twice, and the parameters η 1 , η 2 , A , B , and C are defined using the following expressions:
η 1 = R ( cot α 1 tan α 1 ) η 2 = R ( cot α 2 tan α 2 ) A = η 2 2 + 4 η 2 ξ i 1 4 η 1 ξ i 1 + 4 R 2 B = ( 8 R 2 ξ i 1 4 η 1 ξ i 1 2 + 4 η 2 ξ i 1 2 + 2 η 1 η 2 ξ i 1 ) C = ( η 1 2 + 4 R 2 ) ξ i 1 2
Equation (21) is now obtained, as follows:
A ξ i 2 2 B ξ i 2 + C ξ i 1 2 = 0
Solving Equation (21), and considering ξ i 2 > ξ i 1 > 0 , we obtain the following:
ξ i 2 = B + B 2 4 A C 2 A = F ( ξ i 1 )

2.3. Mass Balance Equation for CEDM

According to Assumption 3, the mass balance equation after DC may be expressed thus:
W crater γ 0 + W WCZ γ 0 = W HCZ γ max + W WCZ HCZ γ ρ , δ , θ
where W crater is the weight of soil related to the initial dry density of the crater cylinder before DC; W WCZ is the weight of soil related to the initial dry density of the WCZ ellipsoid before DC; W HCZ is the weight of soil related to the maximum dry density of the HCZ ellipsoid after the ith tamping; and W WCZ HCZ γ ρ , δ , θ is the weight of soil related to the variational dry density of the weak compacted zone ( V WCZ V HCZ ) after the ith tamping.
The soil weight with the initial dry density corresponding to the volume of crater is
W crater = γ 0 π R 2 d i
The soil weight with initial dry density corresponding to the volume of the WCZ ellipsoid is calculated thus:
W WCZ = 2 3 π γ 0 b i 2 a i 2 2 + 3 2 R 2 ( h i 2 d i ) + b i 2 a i 2 ( a i 2 2 R 2 ) 3 2
The soil weight with maximum dry density corresponding to the volume of the HCZ ellipsoid is calculated thus:
W HCZ = 2 3 π γ max b i 1 a i 1 2 + 3 2 R 2 ( h i 1 d i ) + b i 1 a i 1 ( a i 1 2 R 2 ) 3 2
The soil weight with variational dry density corresponding to the volume of the weak compacted zone ( V WCZ V HCZ ) in the polar coordinates is calculated thus:
W WCZ - HCZ = V WCZ V HCZ γ ( ρ , δ , θ ) d V = V WCZ V HCZ γ ( ρ , δ , θ ) ρ 2 sin θ d ρ d δ d θ   = 4 0 π / 4 d δ 0 β sin θ d θ e 1 p 1 1 e 1 cos δ e 2 p 2 1 e 2 cos δ γ ( ρ , δ , θ ) ρ 2 d ρ
where β is the angle between the connecting line of the origin and point R , d i and the vertical direction; this angle may be determined using Equation (28), as follows:
β = arccot c i 1 h i 1 + d i R
According to Assumption 2, the soil dry density of any point in the range of WCZ is expressed as follows:
γ ( ρ , δ , θ ) = γ 0 + ρ e i 2 p i 2 1 e i 2 cos θ e i 1 p i 1 1 e i 1 cos θ e i 2 p i 2 1 e i 2 cos θ γ max γ 0
where γ 0 is the initial dry density of soil for unimproved area; γ max is the maximum dry density of soil in HCZ; e i 1 and e i 2 are the eccentricity ratios of HCZ and WCZ ellipsoids, respectively; and p i 1 and p i 2 are the vertical distances from the focus to the datum lines for HCZ and WCZ ellipsoids, respectively.
Substituting Equations (29) into Equation (27), we obtain
W WCZ - HCZ = π 6 1 2 γ d max + 3 γ 0 e i 2 2 p i 2 3 1 ( 1 e i 2 ) 2 1 ( 1 e i 2 cos β ) 2   1 2 3 γ d max + γ 0 e i 1 2 p i 1 3 1 ( 1 e i 1 ) 2 1 ( 1 e i 1 cos β ) 2   + γ d max γ 0 e i 1 p i 1 e i 2 p i 2 2 e i 1 ( e i 1 e i 2 ) 2 ln ( 1 e i 1 cos β ) ( 1 e i 2 ) ( 1 e i 2 cos β ) ( 1 e i 1 )   + 1 e i 1 e i 2 1 1 e i 2 cos β 1 1 e i 2   + γ d max γ 0 e i 1 p i 1 2 e i 2 p i 2 e i 2 ( e i 2 e i 1 ) 2 ln ( 1 e i 2 cos β ) ( 1 e i 1 ) ( 1 e i 1 cos β ) ( 1 e i 2 )   + 1 e i 2 e i 1 1 1 e i 1 cos β 1 1 e i 1 ] }

2.4. Solution of Ellipsoid Parameters for Different Compacted Zones

Six parameters, including radius of tamper, crater depth, initial dry density, maximum dry density, friction angle, and unit weight, were selected to solve the ellipsoidal parameters of HCZ and WCZ based on the following considerations: (1) The radius of tamper directly determines the initial contact area between the tamper and the ground surface, while the crater depth provides a measurable proxy for the penetration depth. These two parameters contribute to the horizontal and vertical extents of compacted zones, especially for the HCZ ellipse. (2) Initial dry density and maximum dry density define the densification potential of the soil. The difference between them governs the possible volumetric strain, which is crucial for calculating the extent and intensity of compacted zones. (3) Because friction angle reflects resistance to particle rearrangement and soil shear strength, it is the key to determining how compaction stress propagates and distributes spatially in the soil foundation. (4) Unit weight affects how impact energy translates into effective stress and densification. In summary, these parameters ensure that the ellipsoidal geometry derived in CEDM reflects external loading conditions, soil mechanical behavior, and densification. They also strike a balance between theoretical completeness and practical measurability in engineering applications.
Herein, the trial-and-error method was used to solve Equation (22), representing confocal ellipse geometry, and Equation (23), representing mass balance. Figure 2 shows the solution procedure of the proposed CEDM for calculating the ellipsoid parameters of different compacted zones.

3. Validation of Proposed CEDM

3.1. Model Test and Numerical Simulation

Figure 3 shows the laboratory test design and the finite element model (FEM) for DC. As shown in Figure 3a,b, the testing equipment consisted of a loading device, a model box filled with soil sample, a measurement cell, and a designed data-acquisition and analysis system. The impact load was applied by raising the drop hammer to a certain height and letting it fall freely. The drop hammer was a cylinder with a diameter of 135 mm, a height of 14.5 mm and a weight of 16.8 kg. The model box was made of wooden plate with a thickness of 2 cm. The height of the soil foundation was 120 cm, and the horizontal dimensions were 80 cm by 80 cm. Soil was dried, crushed, sieved, and filled to the model box layer by layer. Tiny earth pressure gauges were placed in the designated location to measure the stress distribution, as shown in Figure 3a,b.
Based on the designed model test and considerations of symmetry, a 2D axisymmetric FEM was established based on the ABAQUS software [31] to reproduce the field case, as shown in Figure 3c. The width and depth of the soil foundation were set to 40 cm and 80 cm, respectively, while the tamper radius, height, and weight were set to 67.5 mm, 14.5 mm, and 4.2 kg, respectively. Following the method proposed by Lee et al. [13], the applied impact loading was simulated by exerting an initial velocity on the tamper to impact the ground surface. The friction effect was simulated by defining the tangential contact between the tamper and the soil or between soil particles as proportional to the normal force using the Coulomb friction law, allowing the interfaces to separate from each other when the shear stress exceeded a critical value (frictional resistance). In this study, a four-node quadrilateral element (CPE4) with reduced integration was adopted to perform the mesh generation. To avoid a sudden change in mesh density and improve computational efficiency, the tamper was divided into 435 fine grids, while a gradient grid division scheme was applied to the soil foundation, as illustrated in Figure 3c. It can be seen that, starting from the fine grid near the tamping point, the grid size gradually increases as the distance from the tamping point increases. Consequently, 14,400 elements for soil foundation were generated. The side boundaries were fixed against the horizontal movement while the bottom was fixed in both horizontal and vertical directions.
Because cap models [13,22,23,24,25] have been widely used to simulate the dynamic behavior of soil under DC, a cap model [25] with a shear yield surface and an elliptical volumetric hardening cap was adopted to simulate the DC process, as shown in Figure 4.
The shear failure surface is represented by
F s = q p tan φ c = 0
where c and φ are the Drucker–Prager model parameters.
The expression for the hardening cap is as follows:
F c = p p a 2 + χ q 2 χ c + p a tan φ = 0
where p and q are the principal and deviator stresses, respectively; χ is the parameter controlling the shape of the cap; and p a is the intersection point of shear failure surface and cap, which may be expressed as follows:
p a = p b χ c 1 + χ tan φ
where p b is the isotropic yield stress related to the plastic volumetric strain ( ε v p ), which may be expressed as follows:
p a = p 0 1 A ln 1 ε v p B
where p 0 is the in situ mean effective stress; and A are B the volumetric hardening coefficients.
To update the modulus and density of soil during the dynamic compacting process, the following empirical relationships [20,21] were adopted in this work:
K = κ 1 exp κ 2 D r P A P / P A 0.5 , γ s = G s γ w / 1 + e
where P A is the atmospheric pressure; D r is the relative density of soil; κ 1 and κ 2 are the empirical parameters; γ s is the soil density; γ w is the water density; G s is the specific gravity of soil; and e is the void ratio of soil.
Table 1 shows the physical and mechanical parameters of the soil used for the model test and numerical simulation.

3.2. Results and Analysis

Figure 5 shows a comparison of testing and simulated crater depths. It can be seen that crater depth increases with tamping times, so that a cylindrical crater is formed whose shape is similar to that of the tamper. In addition, the simulated crater depths under different tamping times are consistent with the testing results. Figure 6 shows testing and simulated dynamic stresses in vertical and horizontal directions under the first tamping. It can be seen from the figure that the peak dynamic stress decreases with increases in distance from the tamping point. However, the attenuation laws for the peak dynamic stresses in the vertical and horizontal directions are different. By comparing the experimental and simulated results, it may be verified that the numerical simulation method and soil model can reflect the deformation and dynamic stress propagation characteristics of soil foundation induced by DC. Thus, the numerical simulated improvement range for soil foundation can be used to verify the applicability of the proposed CEDM.

3.3. Proposed CEDM for Estimating Improvement Range

Based on the testing and simulated results, the soil properties representing different dense degrees were obtained, as shown in Table 2. Because the radii of tamper and crater depths during DC process were known, the ellipsoid parameters of the proposed CEDM for different compacted zones could be solved using the solution procedure in Figure 2.
Figure 7 shows the simulated dry density and the predicted improvement range of the soil foundation after the first, third, fifth, and seventh tampings. It can be seen that the HCZ and WCZ improvement zones of the soil foundation under DC can both be well fitted by an ellipse. The fitting degrees of HCZ and WCZ under different tamping times are all above 90%. For HCZ, the ellipsoidal parameters after the first tamping are as follows: a center point location of −8 cm; a major axis of 8 cm; and a minor axis of 11 cm. With increases in tamping times, the center point location of the HCZ ellipse moves down from −8 cm to −15 cm, while its major and minor axes remain unchanged. This indicates that the improvement effect of HCZ under DC mainly develops in the vertical direction without volumetric expansion. For WCZ, after the first, third, fifth, and seventh tampings, the center point locations of the ellipses are −18 cm, −23 cm, −25 cm and −28 cm, respectively. At the same time, the minor axis of the WCZ ellipse increases from 12 cm to 14.5 cm, and its major axis increases from 20 cm to 23.5 cm. This indicates that WCZ expands in both the vertical and horizontal directions under successive tampings, with an average area expansion rate of approximately 7%. However, this trend of volumetric expansion generally slows with increases in tamping times. It should be noted that because the proposed CEDM assumes that the edge of the densification ellipsoid passes through the corner point of the tamper, an elliptical function tends to underestimate the extent of soil improvement extent in this area. Nevertheless, the depth and lateral extent of the simulated improvement can be well predicted with the HCZ and WCZ ellipses. These results verify the applicability of the proposed CEDM.

3.4. Discussion of Proposed CEDM for Future Research

Although the proposed CEDM exhibits reliable predictive capability for compacted zones with different degrees of density due to DC, some inherent limitations are evident when the model is applied to real-world scenarios. These limitations mainly stem from the following simplifications which were made in the model assumptions: (1) Because the soil was treated as homogeneous and isotropic, the elliptical model assumed a symmetric densification pattern around the tamping point; however, this is often not evident in real-world scenarios, especially those involving irregular or heterogeneous soil conditions. (2) The model assumed idealized soil properties; however, in practice, soil behavior may be influenced by many factors, including moisture content, particle size distribution, and previous compaction history. (3) The model assumed linear or smoothly varying density gradients. In reality, soil compaction may occur in more discontinuous or nonlinear patterns, particularly in irregular or non-homogeneous soils. (4) While the elliptical model captured overall densification, it does not explicitly account for dynamic stress wave interactions (e.g., wave reflections, nonlinear damping) that can affect compaction and the spatial distribution of improvement zones.
To address these issues, some possible adjustments might be made to improve the applicability of proposed CEDM for broader engineering applications in real-world scenarios, as follows: (1) The model could be adapted to incorporate layered or spatially varying soil properties. This could be achieved by dynamically adjusting the soil parameters (e.g., density, friction angle) based on local measurements or geotechnical surveys. Correspondingly, the contour of the improvement range could be modified through piecewise treatment or by applying the spatial interpolation technique. (2) Introducing nonlinear compaction relationships or adjusting the compaction gradient function could provide a more accurate representation of how soil stiffness evolves during compaction. (3) Some dynamic parameters could be introduced to modify the elliptical model. For example, the attenuation of dynamic stress waves with time and distance could be considered by introducing an attenuation coefficient that varies with time and distance.

4. Conclusions

In this study, we developed a confocal ellipsoidal densification model (CEDM) for estimating compacted zones with different degrees of density due to dynamic compaction. In addition, a self-designed laboratory test and a 2D axisymmetric FEM were performed to investigate the DC process. Based on the obtained results, the applicability of the proposed CEDM was verified. The following conclusions were drawn:
  • A CEDM composed of HCZ and WCZ was proposed for describing the subarea characteristics of improvement ranges of soil foundations under DC. Based on the confocal assumption of HCZ and WCZ ellipses, a mass balance equation considering variations in soil dry density in different compacted zones was established. Six available parameters, including radius of tamper, crater depth, initial dry density and its corresponding friction angle, and maximum dry density and its corresponding friction angle, were selected to solve the HCZ and WCZ ellipsoidal parameters (center point, major and minor axes).
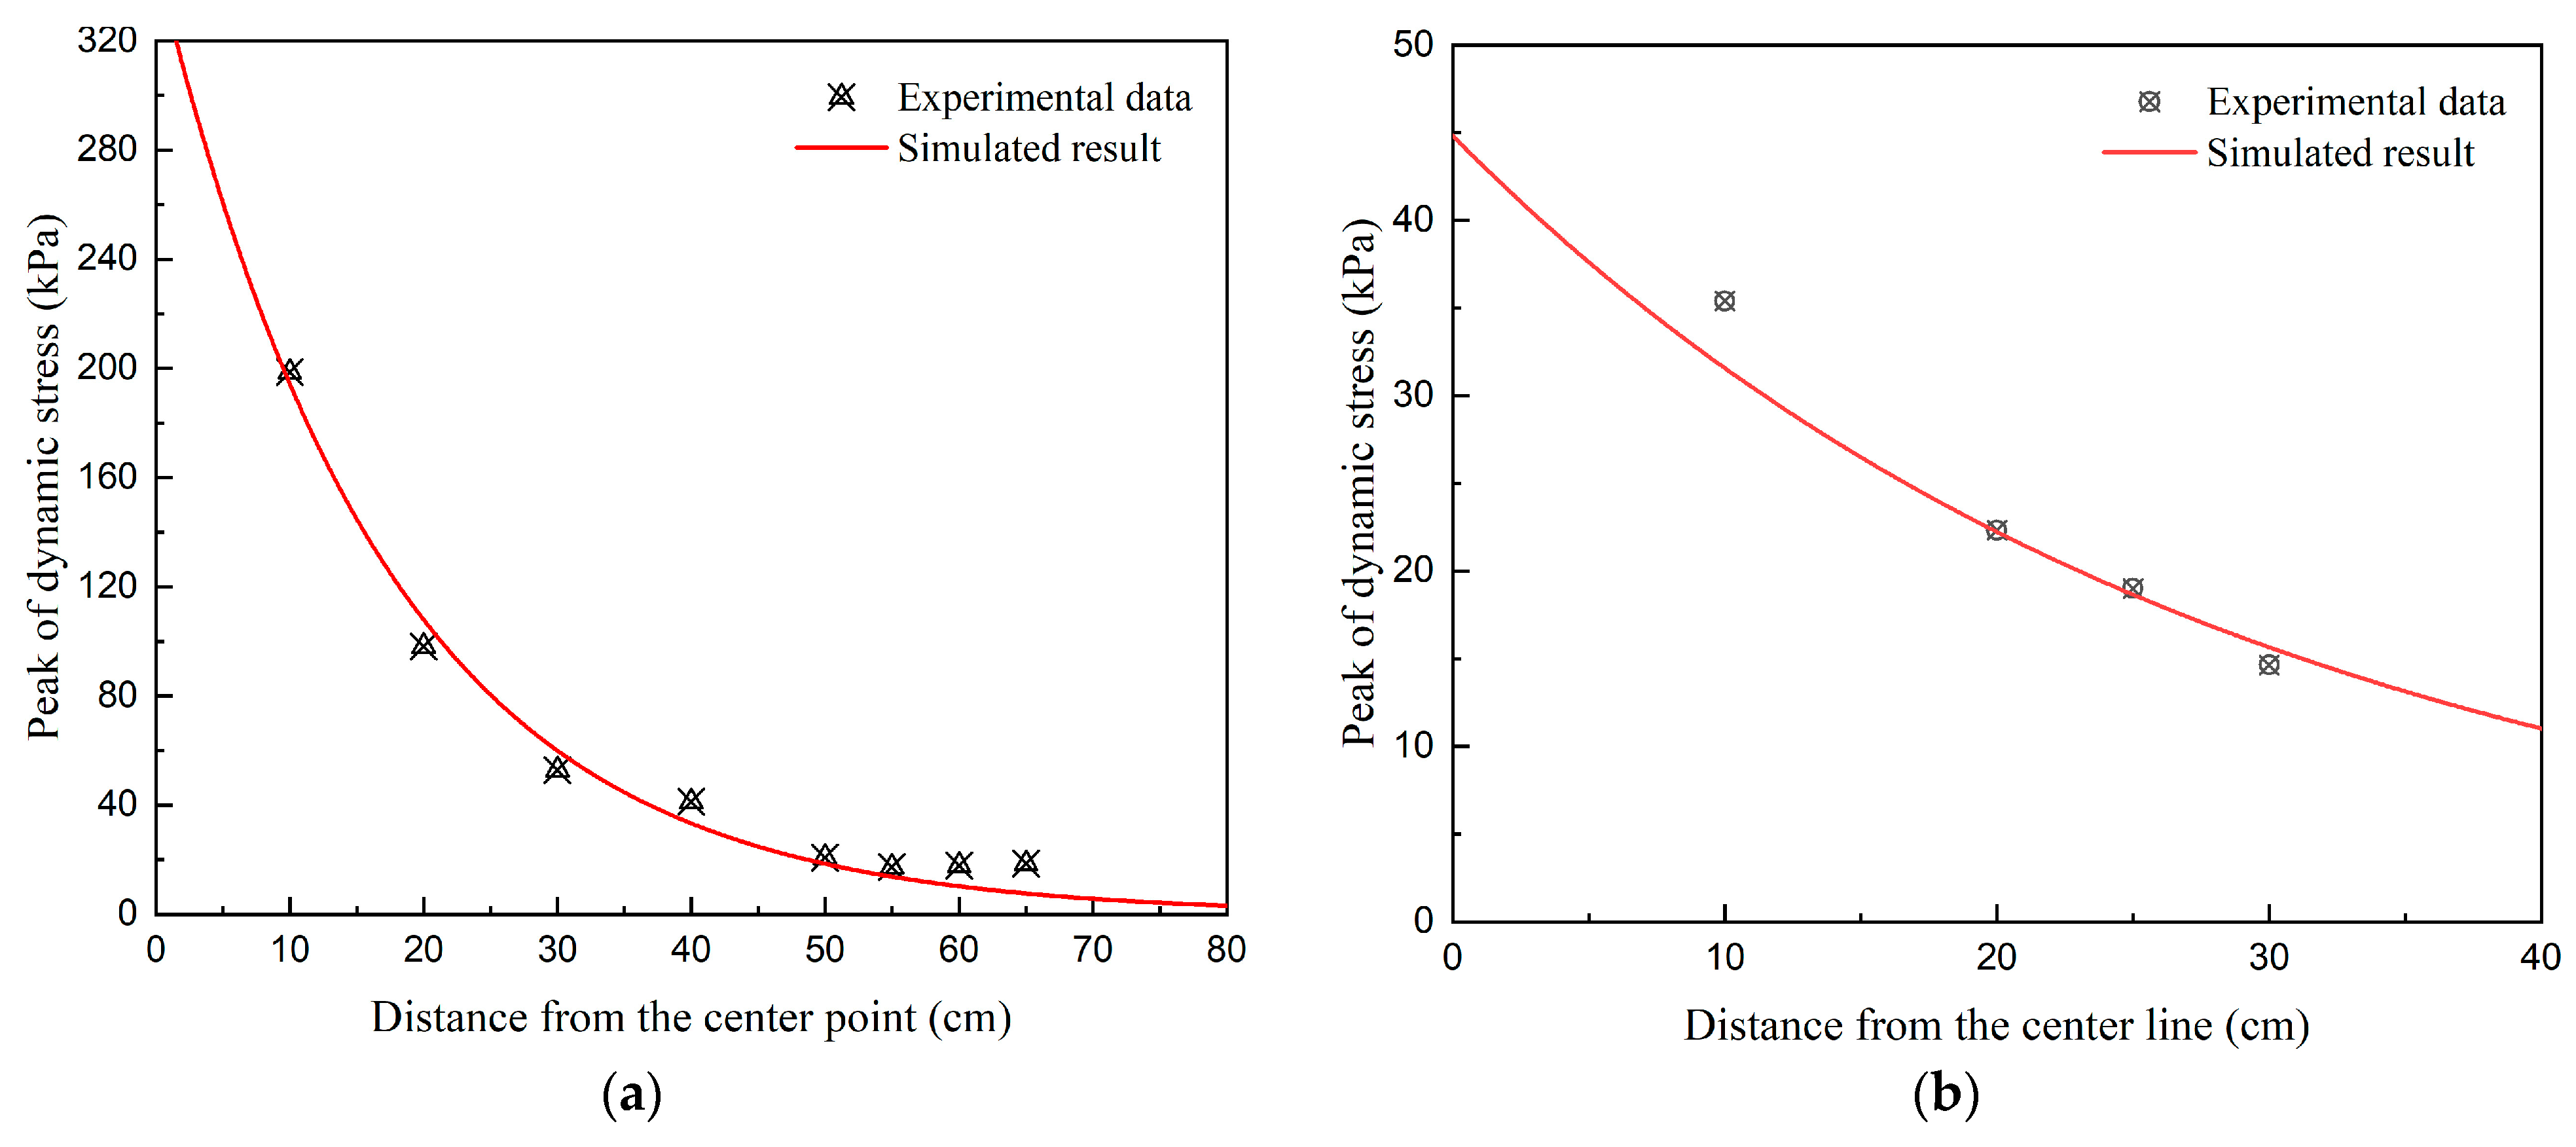
  • The development pattern of the crater depth obtained by FEM simulations was consistent with the measured results, and the relative errors between the simulated and measured values under different tamping times were within ±10%. In addition, the same attenuation laws for peak dynamic stresses in the vertical and horizontal directions were observed. The simulated peak dynamic stresses at specific positions were close to the measured values, and their relative errors remained consistently below 15%. These results demonstrated that the established FEM exhibits reliable capability for simulating the DC process and can be further used for verifying the applicability of the proposed CEDM.
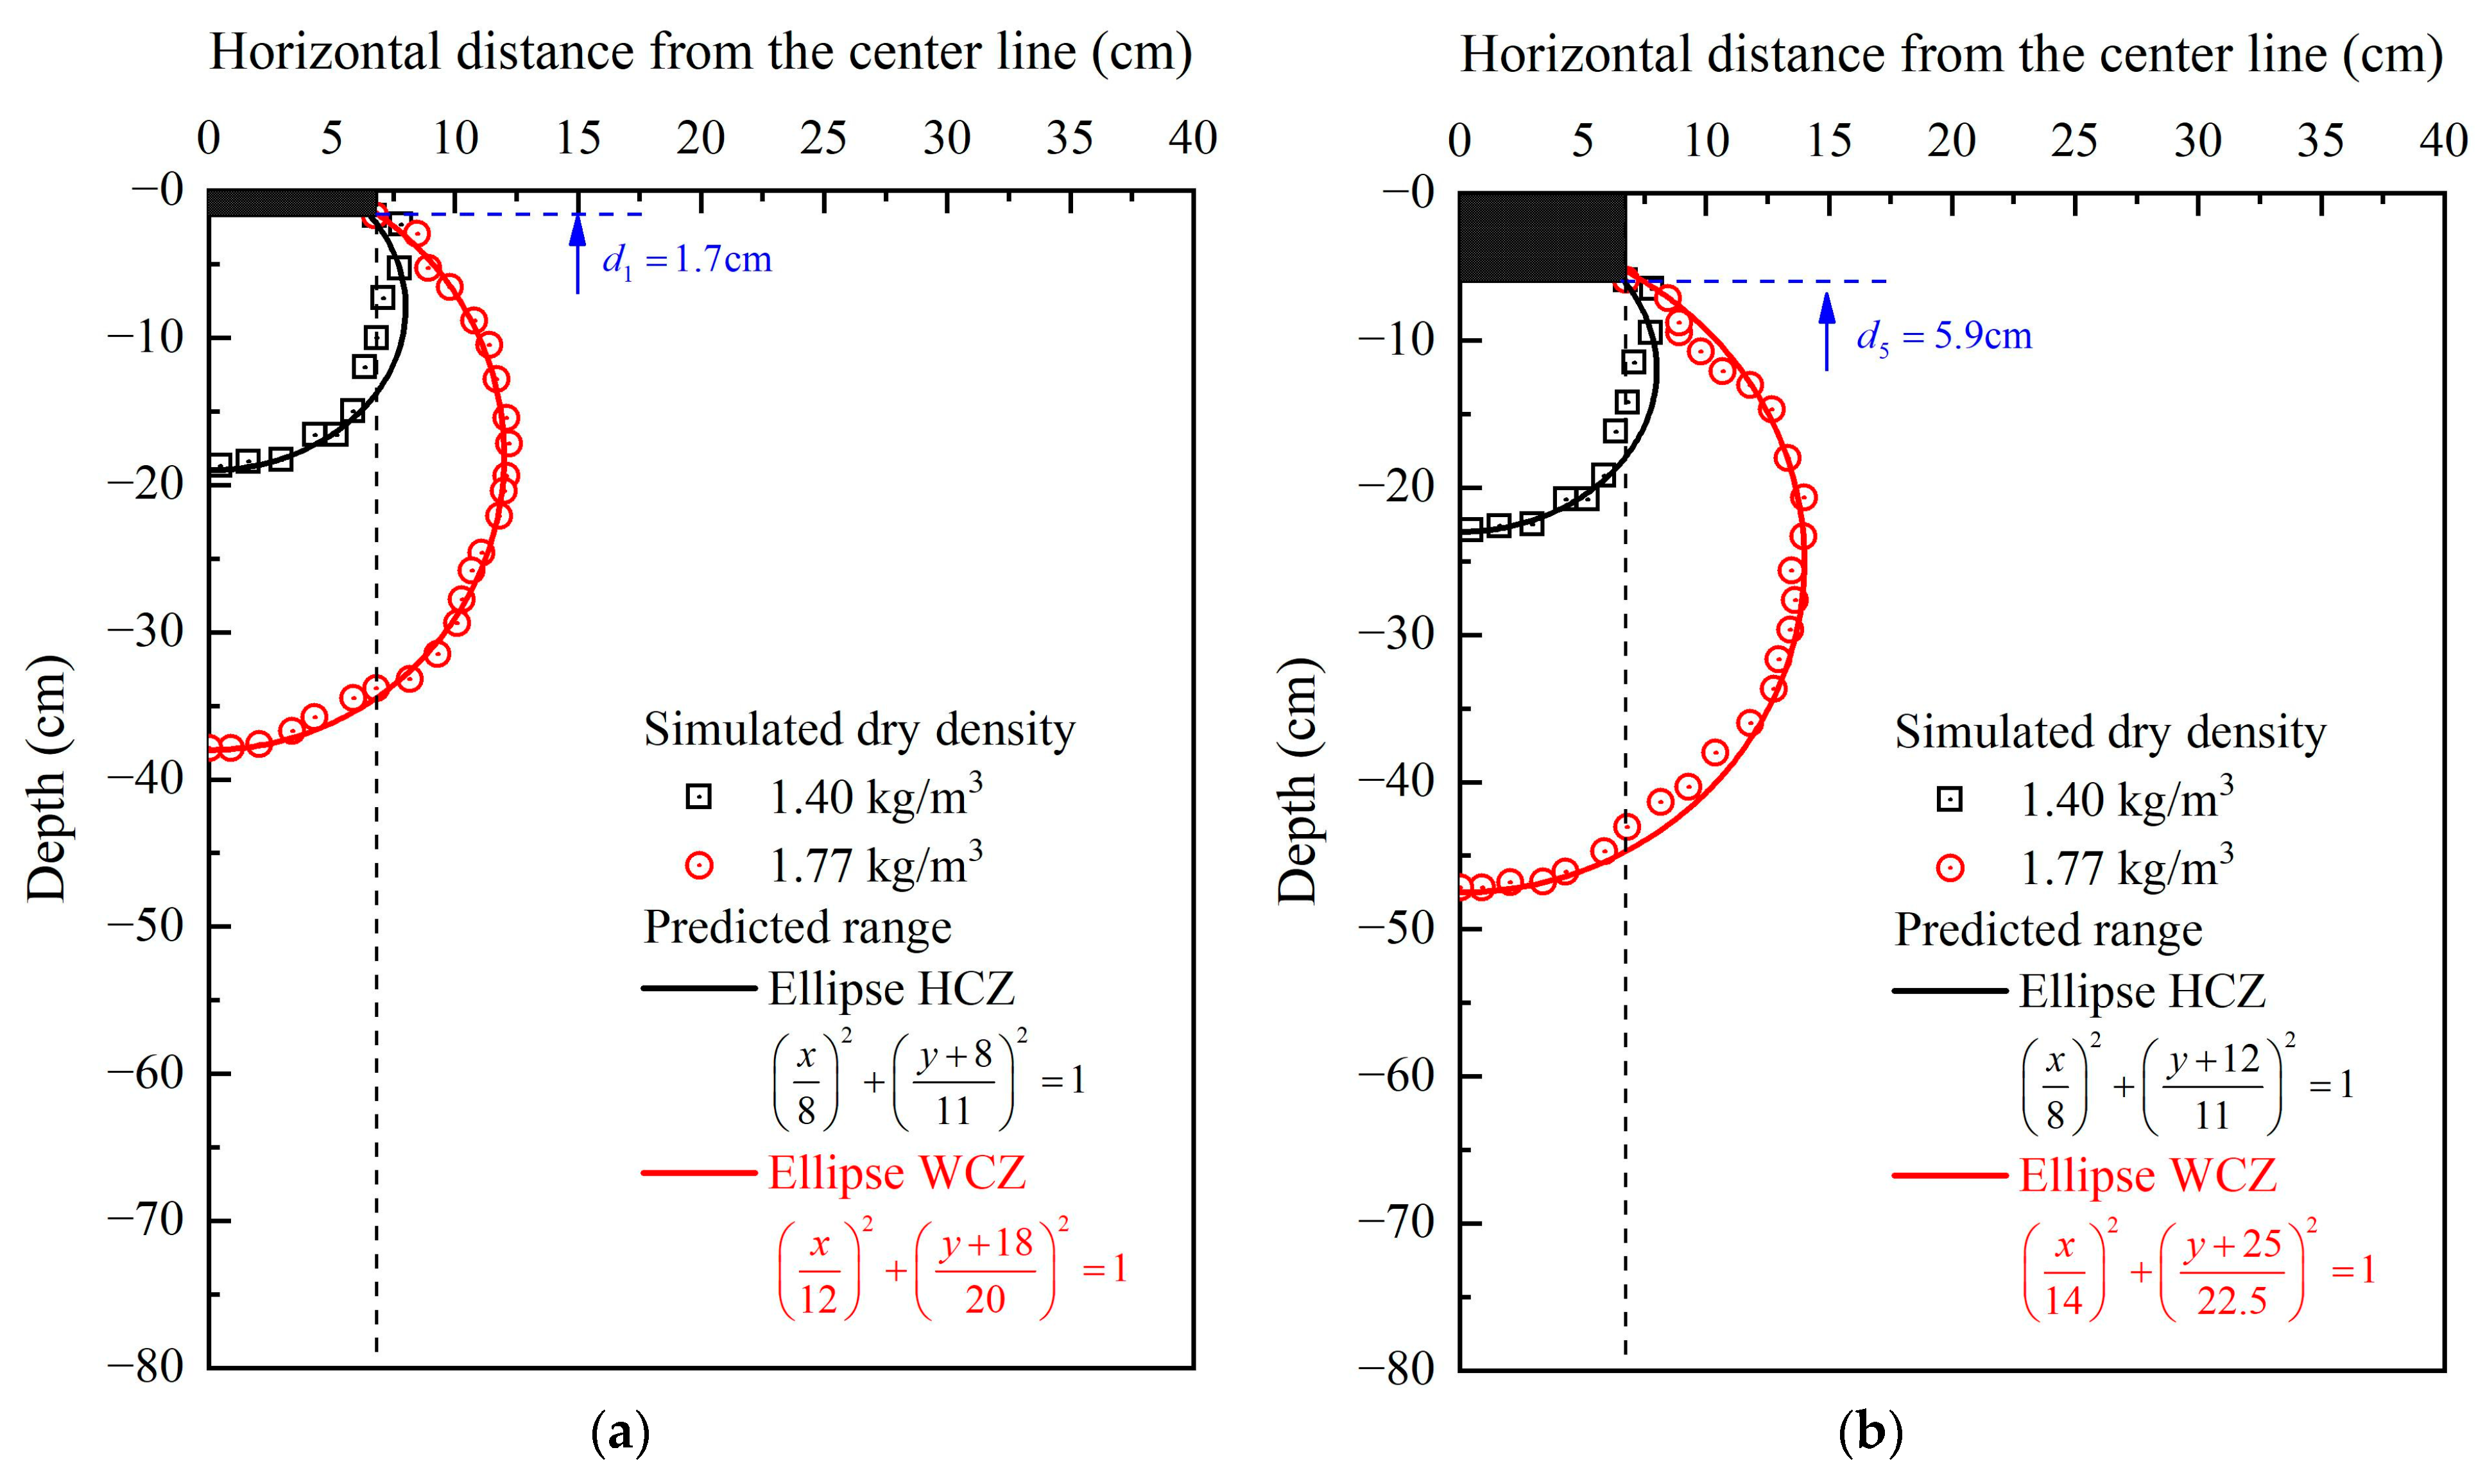
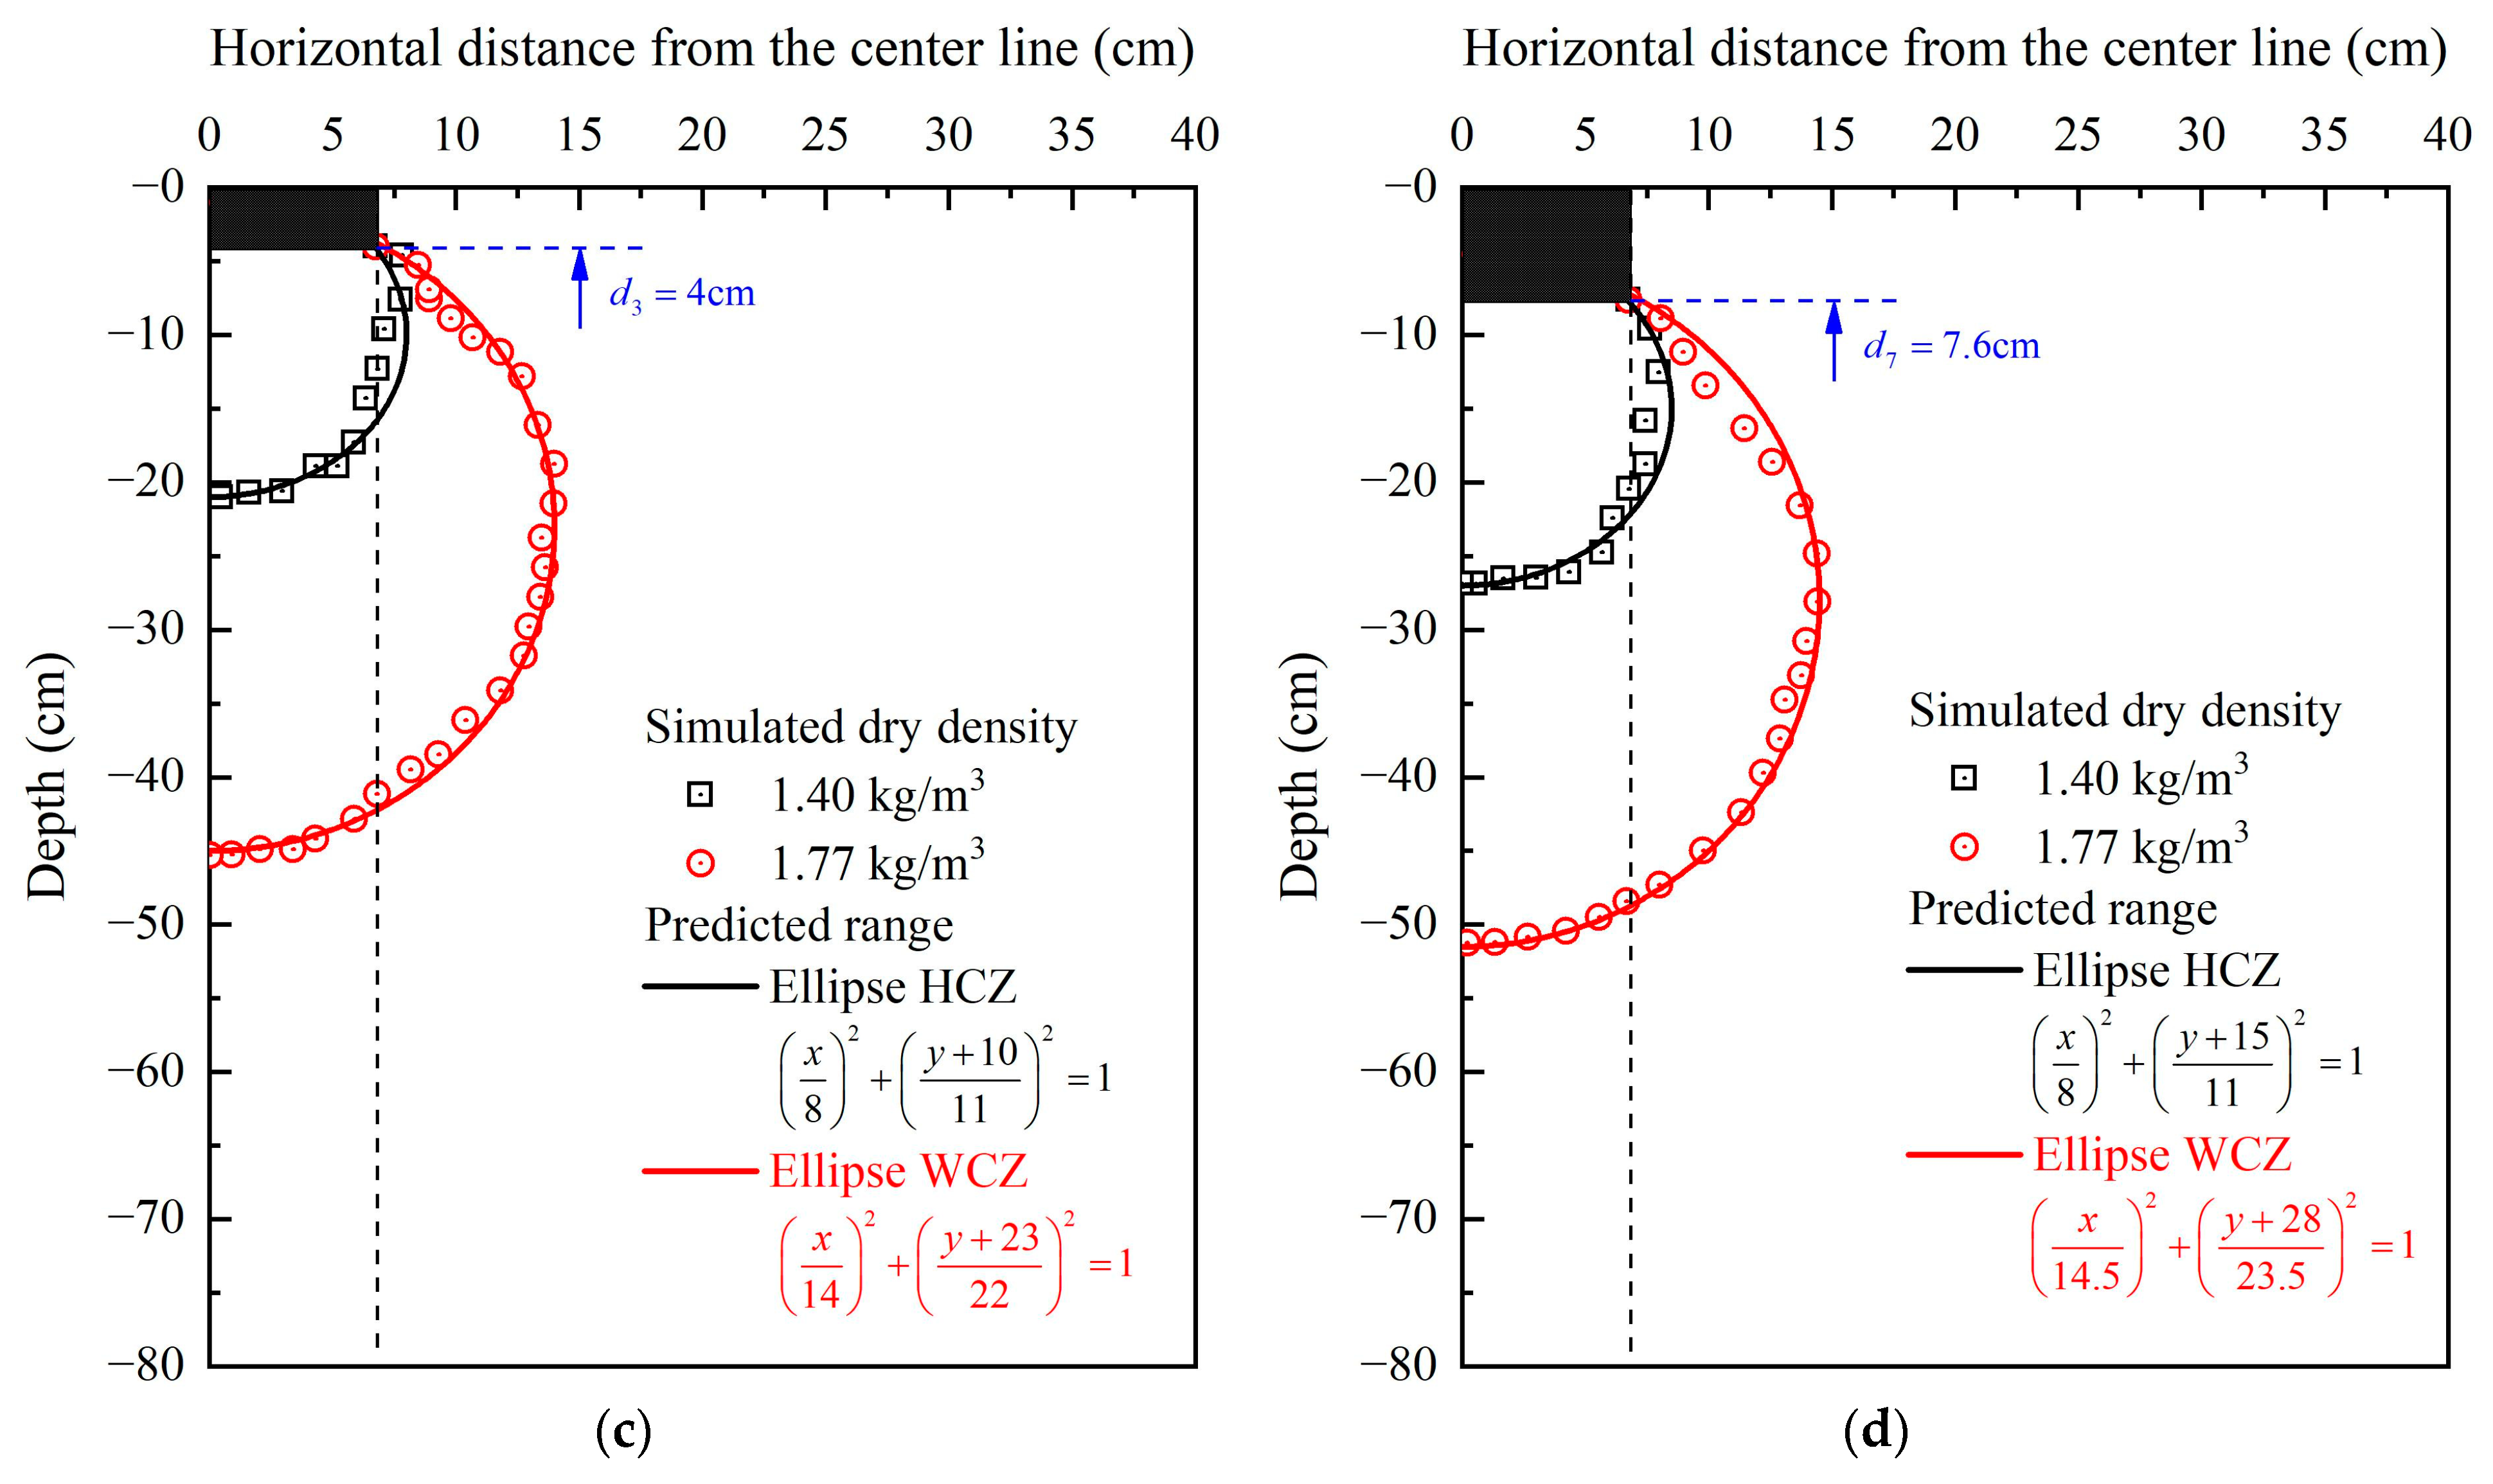
  • Because the edge of the densification ellipsoid was assumed to pass through the corner point of the tamper or crater, HCZ and WCZ ellipses tended to underestimate improvement in lateral extent in this area. However, the overall compacted zones corresponding to initial and maximum dry densities after the first, third, fifth, and seventh tampings obtained from simulations were well fitted by the predicted HCZ and WCZ ellipses, with fitting degrees of over 90%. These results indicated the feasibility of the proposed CEDM for estimating improvement ranges of soil foundations caused by DC.
  • With increases in tamping times, the HCZ ellipse moved down in the vertical direction without volumetric expansion, while the WCZ ellipse expanded along both depth and lateral directions. Specifically, as the number of tampings increased from one to seven, the HCZ ellipse moved downward by 7 cm, while the major and minor axes remained unchanged. At the same time, the center point of WCZ ellipse moved downward by 10 cm, while the major axes increased from 20 cm to 23.5 cm and the minor axes increased from 12 cm to 14.5 cm. These findings indicated that successive tamping mainly contributed to WCZ expansion, with an average area expansion rate of approximately 7%.
The soil was treated as homogeneous and isotropic in the proposed CEDM. However, idealized elliptical densification zones and confocal assumptions considering symmetry do not hold true in real-world scenarios. In future research, we will investigate the flexibility of the elliptical model for estimating dynamic compaction effects in real-world scenarios, focusing on irregular or heterogeneous soil conditions through application of piecewise treatment or a spatial interpolation technique.

Author Contributions

Conceptualization, H.S., F.Z., X.L., K.S. and F.X.; methodology, H.S. and F.Z.; software, H.S. and F.Z.; validation, H.S., F.Z., X.L., K.S. and F.X.; formal analysis, H.S. and F.Z.; investigation, H.S., F.Z., X.L., K.S. and F.X.; resources, H.S., F.Z., X.L., K.S. and F.X.; data curation, H.S., F.Z., X.L. and K.S.; writing—original draft preparation, H.S. and F.Z.; writing—review and editing, H.S., F.Z., X.L., K.S. and F.X.; visualization, H.S. and F.Z. All authors have read and agreed to the published version of the manuscript.

Funding

This research was funded by the Jiangsu Funding Program for Excellent Postdoctoral Talent (No. 2023ZB583; No. 2024ZB739), by Fundamental Research Funds for the Central Universities (No. B240201070), and by the State Key Laboratory of Precision Blasting and Hubei Key Laboratory of Blasting Engineering, Jianghan University (No. PBSKL2023B5).

Institutional Review Board Statement

Not applicable.

Informed Consent Statement

Not applicable.

Data Availability Statement

Some or all of the data, models, or codes that support the findings of this study are available from the corresponding author upon reasonable request.

Acknowledgments

We would like to express our sincere gratitude to Jun Liu for his invaluable guidance, encouragement, and support throughout this research project.

Conflicts of Interest

The authors declare no conflicts of interest concerning the research, authorship, and/or publication of this article.

Abbreviations

The following abbreviations are used in this manuscript:
DCDynamic Compaction
CEDMConfocal Ellipsoidal Densification Model
HCZHeavy Compacted Zone
WCZWeak Compacted Zone
FEMFinite Element Model

References

  1. Menard, L.; Broise, Y. Theoretical and practical aspects of dynamic consolidation. Geotechnique 1975, 25, 3–18. [Google Scholar] [CrossRef]
  2. Leonards, G.A.; Holtz, R.D.; Cutter, W.A. Dynamic compaction of granular soils. J. Geotech. Eng. 1980, 106, 35–44. [Google Scholar] [CrossRef]
  3. Mayne, P.W.; Jones, J.S.; Dumas, J.C. Ground response to dynamic compaction. J. Geotech. Eng. 1984, 10, 757–774. [Google Scholar] [CrossRef]
  4. Lukas, R.G. Dynamic compaction engineering considerations. In Grouting, Soil Improvement and Geosynthetics; ASCE: Reston, VA, USA, 2010; pp. 940–953. [Google Scholar]
  5. Zhang, P.C.; Wang, R. A study of dynamic consolidation depth in engineering practice. China Rock Soil Mech. 2000, 21, 76–78. [Google Scholar] [CrossRef]
  6. Feng, S.J.; Shui, W.H.; Gao, L.Y.; He, L.J.; Tan, K. Field studies of the effectiveness of dynamic compaction in coastal reclamation areas. Bull. Eng. Geol. Environ. 2010, 69, 129–136. [Google Scholar] [CrossRef]
  7. Feng, S.J.; Tan, K.; Shui, W.H.; Zhang, Y. Densification of desert sands by high energy dynamic compaction. Eng. Geol. 2013, 157, 48–54. [Google Scholar] [CrossRef]
  8. Poran, C.J.; Rodriguez, J.A. Design of dynamic compaction. Can. Geotech. J. 1992, 29, 796–802. [Google Scholar] [CrossRef]
  9. Poran, C.J.; Rodriguez, J.A. Finite element analysis of impact behavior of sand. Soils Found. 1992, 32, 68–80. [Google Scholar] [CrossRef]
  10. Oshima, A.; Takada, N. Effect of ram momentum on compaction by heavy tamping. In Proceedings of the 13th International Conference on Soil Mechanics and Foundation Engineering, New Delhi, India, 5–10 January 1994; pp. 1141–1144. [Google Scholar]
  11. Oshima, A.; Takada, N. Relation between compacted area and ram momentum by heavy tamping. In Proceedings of the 14th International Conference on Soil Mechanics and Foundation Engineering, Hamburg, Germany, 6–12 September 1997; pp. 1641–1644. [Google Scholar]
  12. Li, X.; Lu, Y.; Cui, Y.; Qian, G.; Zhang, J.; Wang, H. Experimental investigation into the effects of tamper weight and drop distance on dynamic soil compaction. Acta Geotech. 2024, 19, 2563–2578. [Google Scholar] [CrossRef]
  13. Lee, F.H.; Gu, Q. Method for estimating dynamic compaction effect on sand. J. Geotech. Geoenviron. Eng. 2004, 130, 139–152. [Google Scholar] [CrossRef]
  14. Yao, Y.P.; Zhang, Z.B. Reinforcement range of dynamic compaction based on volumetric strain. China Rock Soil Mech. 2016, 37, 2663–2671. [Google Scholar] [CrossRef]
  15. Wang, W.; Chen, J.J.; Wang, J.H. Estimation method for ground deformation of granular soils caused by dynamic compaction. Soil Dyn. Earthq. Eng. 2017, 92, 266–278. [Google Scholar] [CrossRef]
  16. Miller, G.F.; Pursey, H. On the partition of energy between elastic waves in a semi-infinite solid. In Proceedings of the Royal Society of London; Royal Society: London, UK, 1955; pp. 55–69. [Google Scholar] [CrossRef]
  17. He, C.M.; Zou, J.F.; Li, L. Field test on measurement of dynamic stress of dynamic compaction. China J. Geotech. Eng. 2007, 29, 628–632. [Google Scholar] [CrossRef]
  18. Chow, Y.K.; Yong, D.M.; Yong, K.Y.; Lee, S.L. Dynamic compaction analysis. J. Geotech. Eng. 1992, 118, 1141–1157. [Google Scholar] [CrossRef]
  19. Chow, Y.K.; Yong, D.M.; Yong, K.Y.; Lee, S.L. Dynamic compaction of loose granular soils: Effect of print spacing. J. Geotech. Eng. 1994, 120, 1115–1133. [Google Scholar] [CrossRef]
  20. Cheshomi, A. Lateral Extent and Environmental Effects of Dynamic Compaction in a Coastal Area of Southern Iran. Environ. Eng. Geosci. 2019, 25, 203–211. [Google Scholar] [CrossRef]
  21. Ghassemi, A.; Pak, A.; Shahir, H. Numerical study of the coupled hydro-mechanical effects in dynamic compaction of saturated granular soils. Comput. Geotech. 2010, 37, 10–24. [Google Scholar] [CrossRef]
  22. Wen, S.Q.; Li, Y.P.; Ma, K. Research on inversion of energy efficiency and compacted and affected scope of dynamic compaction. China Rock Soil Mech. 2015, 36, 185–192. [Google Scholar] [CrossRef]
  23. Dou, J.Z.; Chen, J.J.; Wang, W. Method for estimating the degree of improvement in soil between adjacent tamping locations under dynamic compaction. Int. J. Geomech. 2019, 19, 04019134. [Google Scholar] [CrossRef]
  24. Yao, Z.; Zhou, C.; Lin, Q.Q.; Yao, K.; Satchithananthan, U.; Lee, F.H.; Tang, A.M.; Jiang, H.; Pan, Y.; Wang, S.T. Effect of dynamic compaction by multi-point tamping on the densification of sandy soil. Comput. Geotech. 2022, 151, 104909. [Google Scholar] [CrossRef]
  25. Zhou, C.Y.; Yao, K.; Rong, Y.; Lee, F.; Zhang, D.; Jiang, H.; Yang, C.; Yao, Z.; Chen, L. Numerical investigation on zone of improvement for dynamic compaction of sandy ground with high groundwater table. Acta Geotech. 2022, 18, 695–709. [Google Scholar] [CrossRef]
  26. Ma, Z.Y.; Dang, F.N.; Liao, H.J. Numerical study of the dynamic compaction of gravel soil ground using the discrete element method. Granul. Matter 2014, 16, 881–889. [Google Scholar] [CrossRef]
  27. Li, Y.; Ma, Z.; Yang, F. Numerical study on micro-reinforcement mechanism and environmental control of gravel soil under dynamic compaction. Arab. J. Geosci. 2021, 14, 2682. [Google Scholar] [CrossRef]
  28. Li, Y.; Fang, Y.; Yang, Z. Two criteria for effective improvement depth of sand foundation under dynamic compaction using discrete element method. Comput. Part. Mech. 2022, 10, 397–404. [Google Scholar] [CrossRef]
  29. Li, X.; Lu, Y.B.; Qian, G.P.; Yang, H.; Yu, H.N.; Wang, H.; Zhu, Z.H. A New Index for Estimating the Improved Depth of Dynamic Compaction. Int. J. Geomech. 2024, 24, 06023027. [Google Scholar] [CrossRef]
  30. Zhang, R.; Sun, Y.; Song, E. Simulation of dynamic compaction and analysis of its efficiency with the material point method. Comput. Geotech. 2019, 116, 103218. [Google Scholar] [CrossRef]
  31. Helwany, S. Applied Soil Mechanics with ABAQUS Applications; John Wiley and Sons: Hoboken, NJ, USA, 2007. [Google Scholar]
Figure 1. Confocal ellipsoidal densification model of improvement range induced by DC.
Applsci 15 05292 g001
Figure 2. Solution procedure for solving ellipsoidal parameters using trial-and-error method.
Applsci 15 05292 g002
Figure 3. Laboratory test design and numerical simulation for dynamic compaction: (a) front view and (b) top view of model test; and (c) 2D axisymmetric FEM.
Applsci 15 05292 g003
Figure 4. Yield surface of the cap model in p-q plane.
Applsci 15 05292 g004
Figure 5. Comparison of testing and simulated crater depths.
Applsci 15 05292 g005
Figure 6. Comparisons of testing and simulated dynamic stress in the (a) vertical and (b) horizontal directions after the first tamping.
Applsci 15 05292 g006
Figure 7. Comparison of predicted and simulated improvement range after (a) 1st, (b) 3rd, (c) 5th and (d) 7th tampings.
Applsci 15 05292 g007aApplsci 15 05292 g007b
Table 1. Physical and mechanical parameters of soil.
ω (%)ρ (kg/m3)E (kPa)c (kPa)φχA (kPa)B
32.118505000812.50.80.00020.4
ω—moisture content; ρ—density; E—elastic modulus; c—cohesion; φ—friction angle; χ—shape parameter of cap; A, B—volumetric hardening coefficients.
Table 2. Soil properties with different dense degrees.
ω (%)ρ (kg/m3)E (kPa)c (kPa)φDense Degree
32.118505000812.5Loose
18.4210010,000830Dense
Disclaimer/Publisher’s Note: The statements, opinions and data contained in all publications are solely those of the individual author(s) and contributor(s) and not of MDPI and/or the editor(s). MDPI and/or the editor(s) disclaim responsibility for any injury to people or property resulting from any ideas, methods, instructions or products referred to in the content.

