1. Introduction
The norm of the geometric configuration of the flow channels of the central circulation remains in the field of empirical studies and lacks a formal description, despite the significant amount of accumulated data. This is due to the fact that there is no generally accepted concept of the hydrodynamic structure of blood flow in these departments, which is intrinsically linked to the geometry of the flow channels. The circulatory system is a self-organizing system, as during the process of evolution and ontogenesis, the formation of a complex geometrical configuration of the vascular channel should occur in such a way that the resulting blood flow fully provides the function of blood circulation, i.e., it has sufficient pressure and flow characteristics and maintains the stability of biologically active components in the blood and vascular wall. This task is only possible if the blood flow has a certain structure, the nature of which is still insufficiently understood.
Since the 1930s, increasing attention has been paid to the swirling structure of blood flow in cardiac cavities and large vessels [
1,
2], but the lack of an adequate hydrodynamic model and the difficulty of setting correct initial and boundary conditions have prevented a formal description of the blood flow. Such a description is necessary both for solving practical problems in cardiology and cardiac surgery and for modeling flow in normal and pathological conditions.
In fact, ordered flow, including swirling, is more energetically favorable than turbulent flow because of the absence of chaotic vortices, which increase resistance and energy consumption through additional friction losses and turbulent diffusion. Furthermore, any natural process obeys the principle of minimum action, i.e., where the flow can self-organize into an ordered structure, turbulent flow should not occur.
In previous publications, we proposed a method for analyzing the structure of swirling flows based on exact solutions of the unsteady hydrodynamic equations of Kiknadze–Krasnov [
3], reduced to quasi-stationary solutions for the Bürgers vortex [
4]. In particular, it was argued in these works that the longitudinal-radial profile of the flow channel should satisfy the condition
zr2 =
const (where
z is the current longitudinal coordinate and
r is the corresponding radius) at all stages of blood jet evolution. This statement was based on experimental data [
5].
In this study, we propose a formal algorithm and present results of the geometric reconstruction of the flow channel along the length of the channel from the left atrium to the aortic bifurcation, confirming the validity of this condition.
This result creates the prerequisites for the creation of a formal geometric model of the blood channel of the central parts of the circulatory system. Such a model is not only necessary for the formal setting of hydrodynamically correct initial and boundary conditions to describe the blood flow in a given segment, but also provides an understanding of what the geometric configuration of the channel should be in the norm. This is important for diagnosing the blood flow state when the channel geometry changes, for planning and performing adequate surgical correction of geometric changes resulting from cardiac and aortic remodeling, and for physical and mathematical modeling of the blood circulation.
Hydrodynamic-based geometric modeling of cardiovascular segments is key to the design and technological development of new, more efficient implants, such as prosthetic heart and vascular valves, implantable assist pumps, and artificial hearts.
The aim of this study was to formally describe the normal geometric configuration of the aorta, taking into account the swirling hydrodynamic structure of the flow according to quasi-stationary solutions of the basic equations of hydrodynamics.
To this end, the shape of the streamlined surfaces of the left heart and aorta was studied using computed tomography data, metric studies were performed on the resulting three-dimensional models, and the shape of the studied surfaces was analyzed.
2. Materials and Methods
The cardiovascular system is a hydraulic system, self-organizing in the process of morphogenesis, which means that each of its elements is connected to all the others in accordance with the laws of hydrodynamics [
6]. This property of blood circulation implies the necessity of a correct geometric shape for streamlined surfaces, as deviations in them, which occur as a result of diseases or aging, can significantly affect the efficiency of the functioning of the organism as a whole. Due to the self-organization of the system, the laws of hydrodynamics influence the formation of the geometrical configuration of the vessels of the blood supply system. Therefore, it is reasonable to assume the possibility of describing the shape of the streamlined surfaces of the heart and main vessels in the form of approximate analytical functions of three variables in three-coordinate space.
In this study, the task was to geometrically model biological surfaces based on their three-dimensional triangulated computer models in ‘stl’ format. The available files were generated on the basis of tomographic images of a healthy person using the program ‘Inobitec DICOM viewer 2.6’. The modeling of the morphometric ruler was carried out in ‘Blender 2.93’ and the geometric modeling was carried out in the program ‘Compass-3D’. Such a set of programs is traditionally used to solve problems related to the modeling of curvilinear surfaces [
7,
8].
Such files contain point coordinates from which triangular faces of a polyhedral surface are formed. The resulting volumetric models are analyzed in the form of graphical plane images that are in projective relationship to each other. The plane sections obtained with the help of a special tool of the computer-aided design system were also analyzed. The research was based on the assumption that any normal cross-section of a vessel can be approximated by a circle, and therefore the approximating surface is a cyclic surface. It is clear that the diameter of the circular cross-section of the target surface is not a constant value. The construction of the geometric model of a cyclic surface can be performed on the basis of the equations of its spatial curve axis [
9,
10,
11,
12,
13]. Thus, the task of constructing the target normal cyclic surface can be performed in three stages: deriving the function of the change in the radius of the circle formation, constructing the curve of the surface axis, and constructing the model of the target cyclic surface.
The criterion of accuracy in performing these constructions was the visual correspondence of the result with the given task. It is not necessary to achieve higher accuracy when working with available images of organs, taking into account possible registration errors. The estimation of the accuracy of a result by its visual conformity with the expectation is not important either. It is obvious that the plasticity of the original object, deviations in its shape within the physiological norm, and errors in the equipment used to obtain these images create the range of measured values within which the error of the applied method can be neglected.
In order to solve this task, three segments of the channel from the left atrium to the end of the aorta were studied according to the possibility of the existence of a continuous jet in the segment under consideration:
left atrium-left ventricle, immediately after the opening of the mitral valve
left ventricle-aorta, immediately after opening of the aortic valve
aorta with the aortic valve closed.
These locations were chosen in the above conditions because, at these times, the swirling jet formed exists in a space with natural constraints: when the mitral valve is open, it is simultaneously in both the left atrium and the left ventricle; when the aortic valve is open, it is simultaneously in both the left ventricle and the aorta; and when the aortic valve is closed, the jet evolves in the aorta.
In the case of pulsating blood flow, the Struhal criterion number Sh is between 10−1 and 5 × 10², allowing us to consider the blood flow as quasi-stationary.
Based on the exact solutions of Kiknadze–Krasnov [
3], the flow lines of the centripetal swirling flow, projected on the longitudinal-radial plane, are described by the expression
where
z,
r are longitudinal and radial coordinates along the jet, and
B is an arbitrary constant proportional to the jet volume.
A swirling potential flow can only be generated and maintained in a channel whose longitudinal-radial profile corresponds to the directions of the current lines; therefore, if it can be shown that the flow channels of the heart and aorta satisfy this condition throughout the cardiac cycle, it can be confidently asserted that the blood flow can be described exhaustively by the above solutions.
Since the origin of the cylindrical coordinate system in which the jet is described is not known, the approximation function must be expressed in the form:
where
z0 is the distance from the origin to the first measurement point,
zi are the measured values of the longitudinal coordinate,
ri are the measured values of the radial coordinate,
p is the exponent of the power function, and
B is the value of the constant.
If the approximation results show that the value of the degree exponent is close to 2 and the value of
z0 calculated by the least-squares method is of the order of the corresponding size of the cardiac cavities, it can be assumed that the conditions of the Kiknadze–Krasnov solutions [
3] are fulfilled. These solutions can be used to describe and model such a flow and the boundaries in which it takes place.
The evolution of the blood jet moving from the left atrium to the left ventricle was studied by analyzing the cross sections of these cavities (
Figure 1a). The cross sections were obtained from a bundle of planes perpendicular to the contour of the selected section of the streamlined surface. The angle of view was chosen so that the plane containing the conditional axis of the atrium was parallel to the projection plane.
The left atrium has a complex three-dimensional shape that is difficult to consider as a hyperbolically converging channel. However, it is possible to imagine the flowing part of the left atrium as a segmental part of such a channel, along the curvature of which the jet acquires sufficient azimuthal velocity, the center of rotation of which can be outside the boundaries of the channel. Therefore, the true radius of rotation of such a jet is not the radius of the circle inscribed inside the left atrium (red line in
Figure 1b), but the radius of curvature of the free wall of the left atrium. The change in value of this radius is shown by the blue curve in
Figure 1b.
The data in
Figure 1a were analyzed using the method of least squares. Two vectors of values were given:
where
zi,
ri are the longitudinal and radial coordinates of the corresponding flow channel section, starting from the first measurement point. If these vectors are approximated by a dependence of the form:
the following optimum values were obtained:
which were selected within the following limits: [(−0.05, 1 × 10
−5, 0.0), (0.05, 1 × 10
−3, 3.0)] in accordance with previously obtained experimental data [
12].
The value of z0 in this case is 10 mm, which corresponds to the distance from the point of formation of the twisted jet to the beginning of the cylindrical coordinate system in which this jet can be described, and the value of the constant is proportional to the volume of the jet in the segment from the left atrium to the ventricle, as if this jet were formed in the volume of the entire hyperboloid and not in its segmental part. Therefore, the value of the constant in this segment is greater than in the left ventricle-aorta segment (see below).
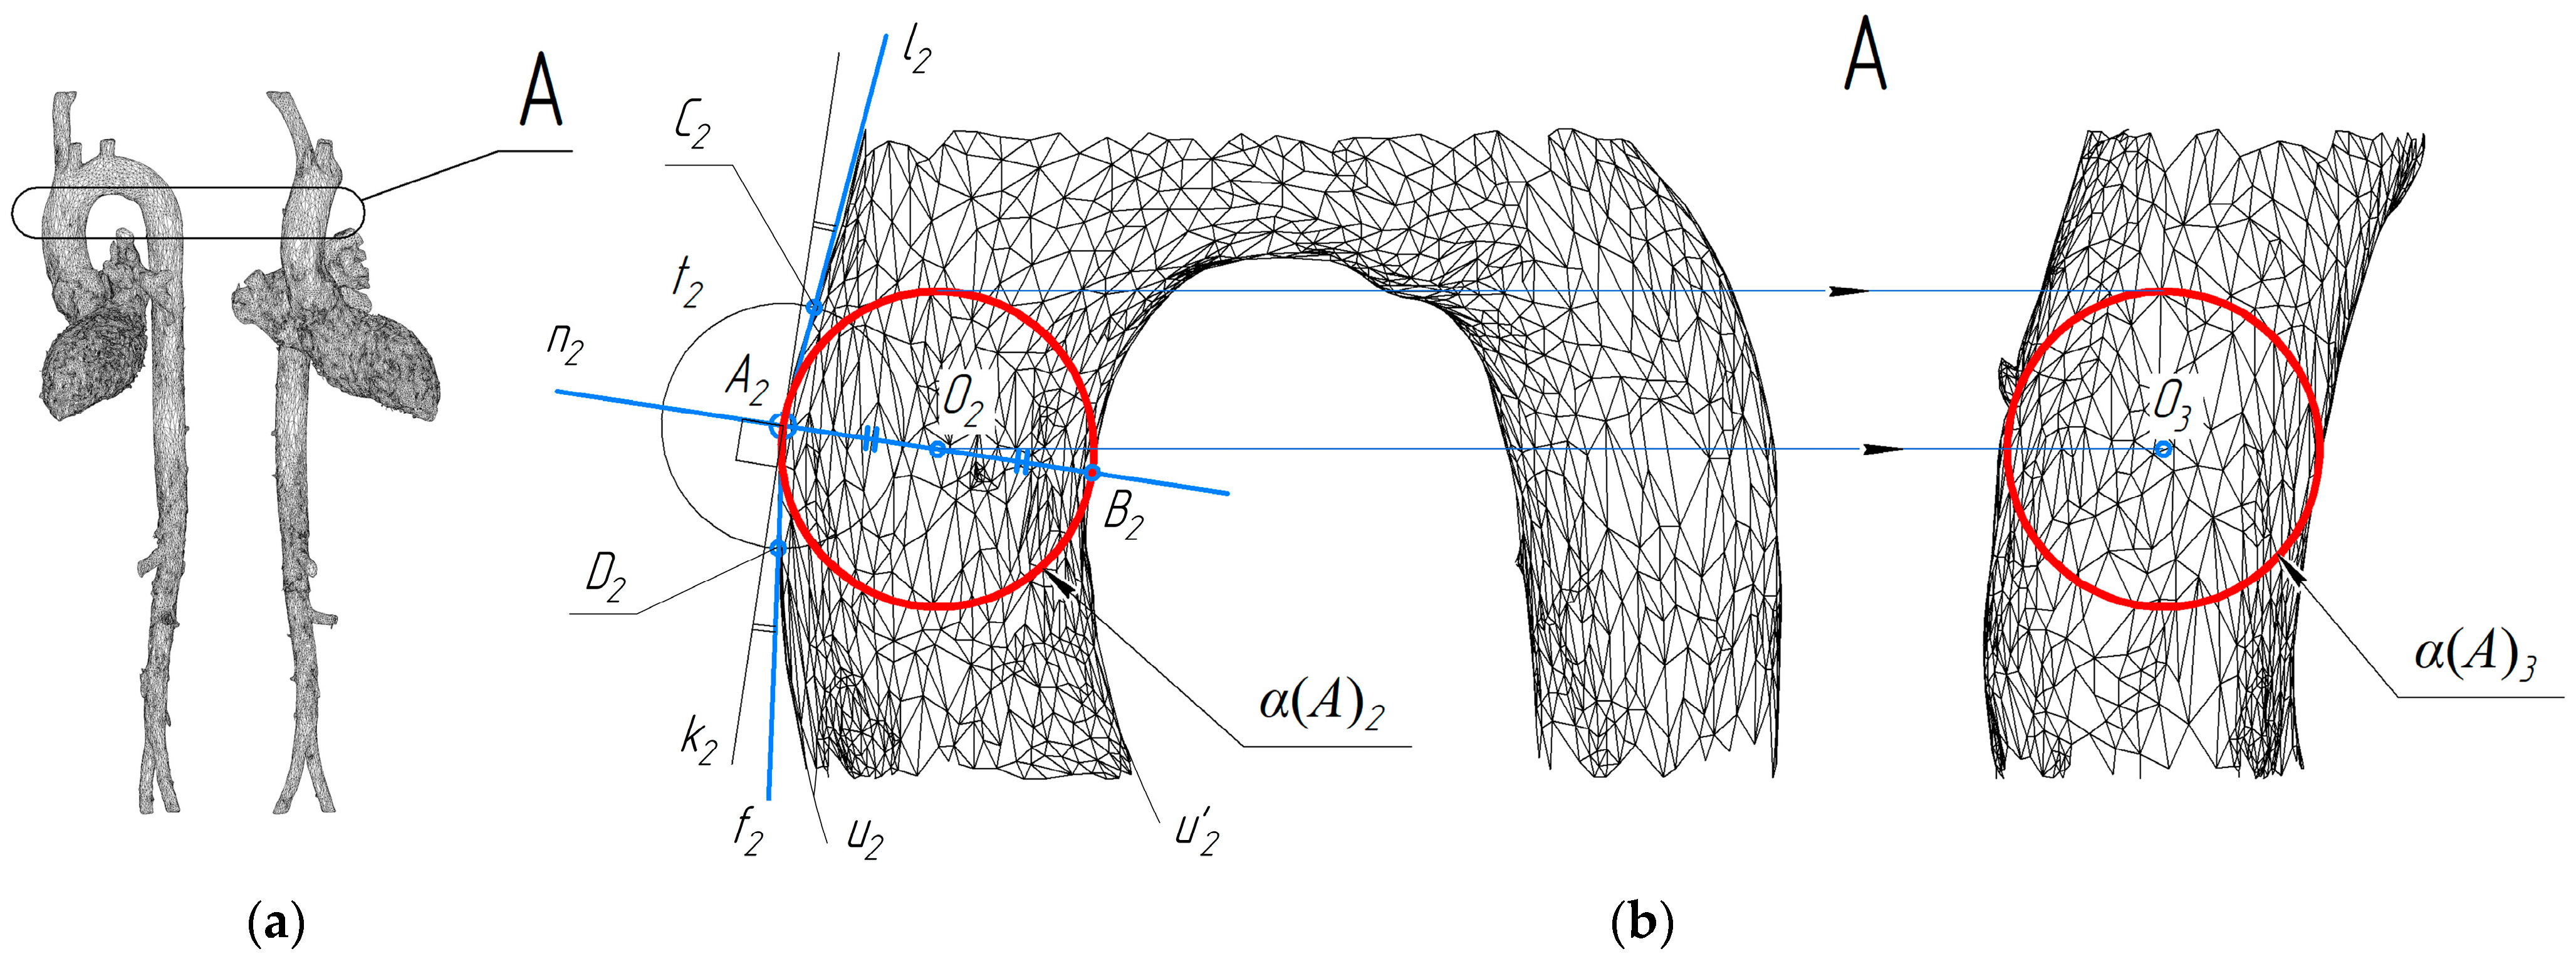
When studying the shape of the left ventricular and aortic system with the aortic valve open, we measured spheres inscribed successively in the lumen of the channel, because the distortions of the spatial axis of the system in the area of the ventricle and the aortic valve do not allow us to determine the position of the normal plane of the vessel cross-section. The essence of the approach used is to inscribe in 3D object projections the connected projections of a number of spheres. In other words, the study was carried out using methods of descriptive geometry. The scheme shown in
Figure 2b shows the construction of projections of the sphere α(
A) touching the surface at point
A on two connected projections of the aorta.
The projections α(A)2 and α(A)3 have been constructed taking into account the projective relationship of the images obtained. The circle t2 is used to find the normal to the outline of the surface. The center of the sphere must lie on this normal, at the same distance from the two opposite outlines, and the sphere outline must contain the point A2.
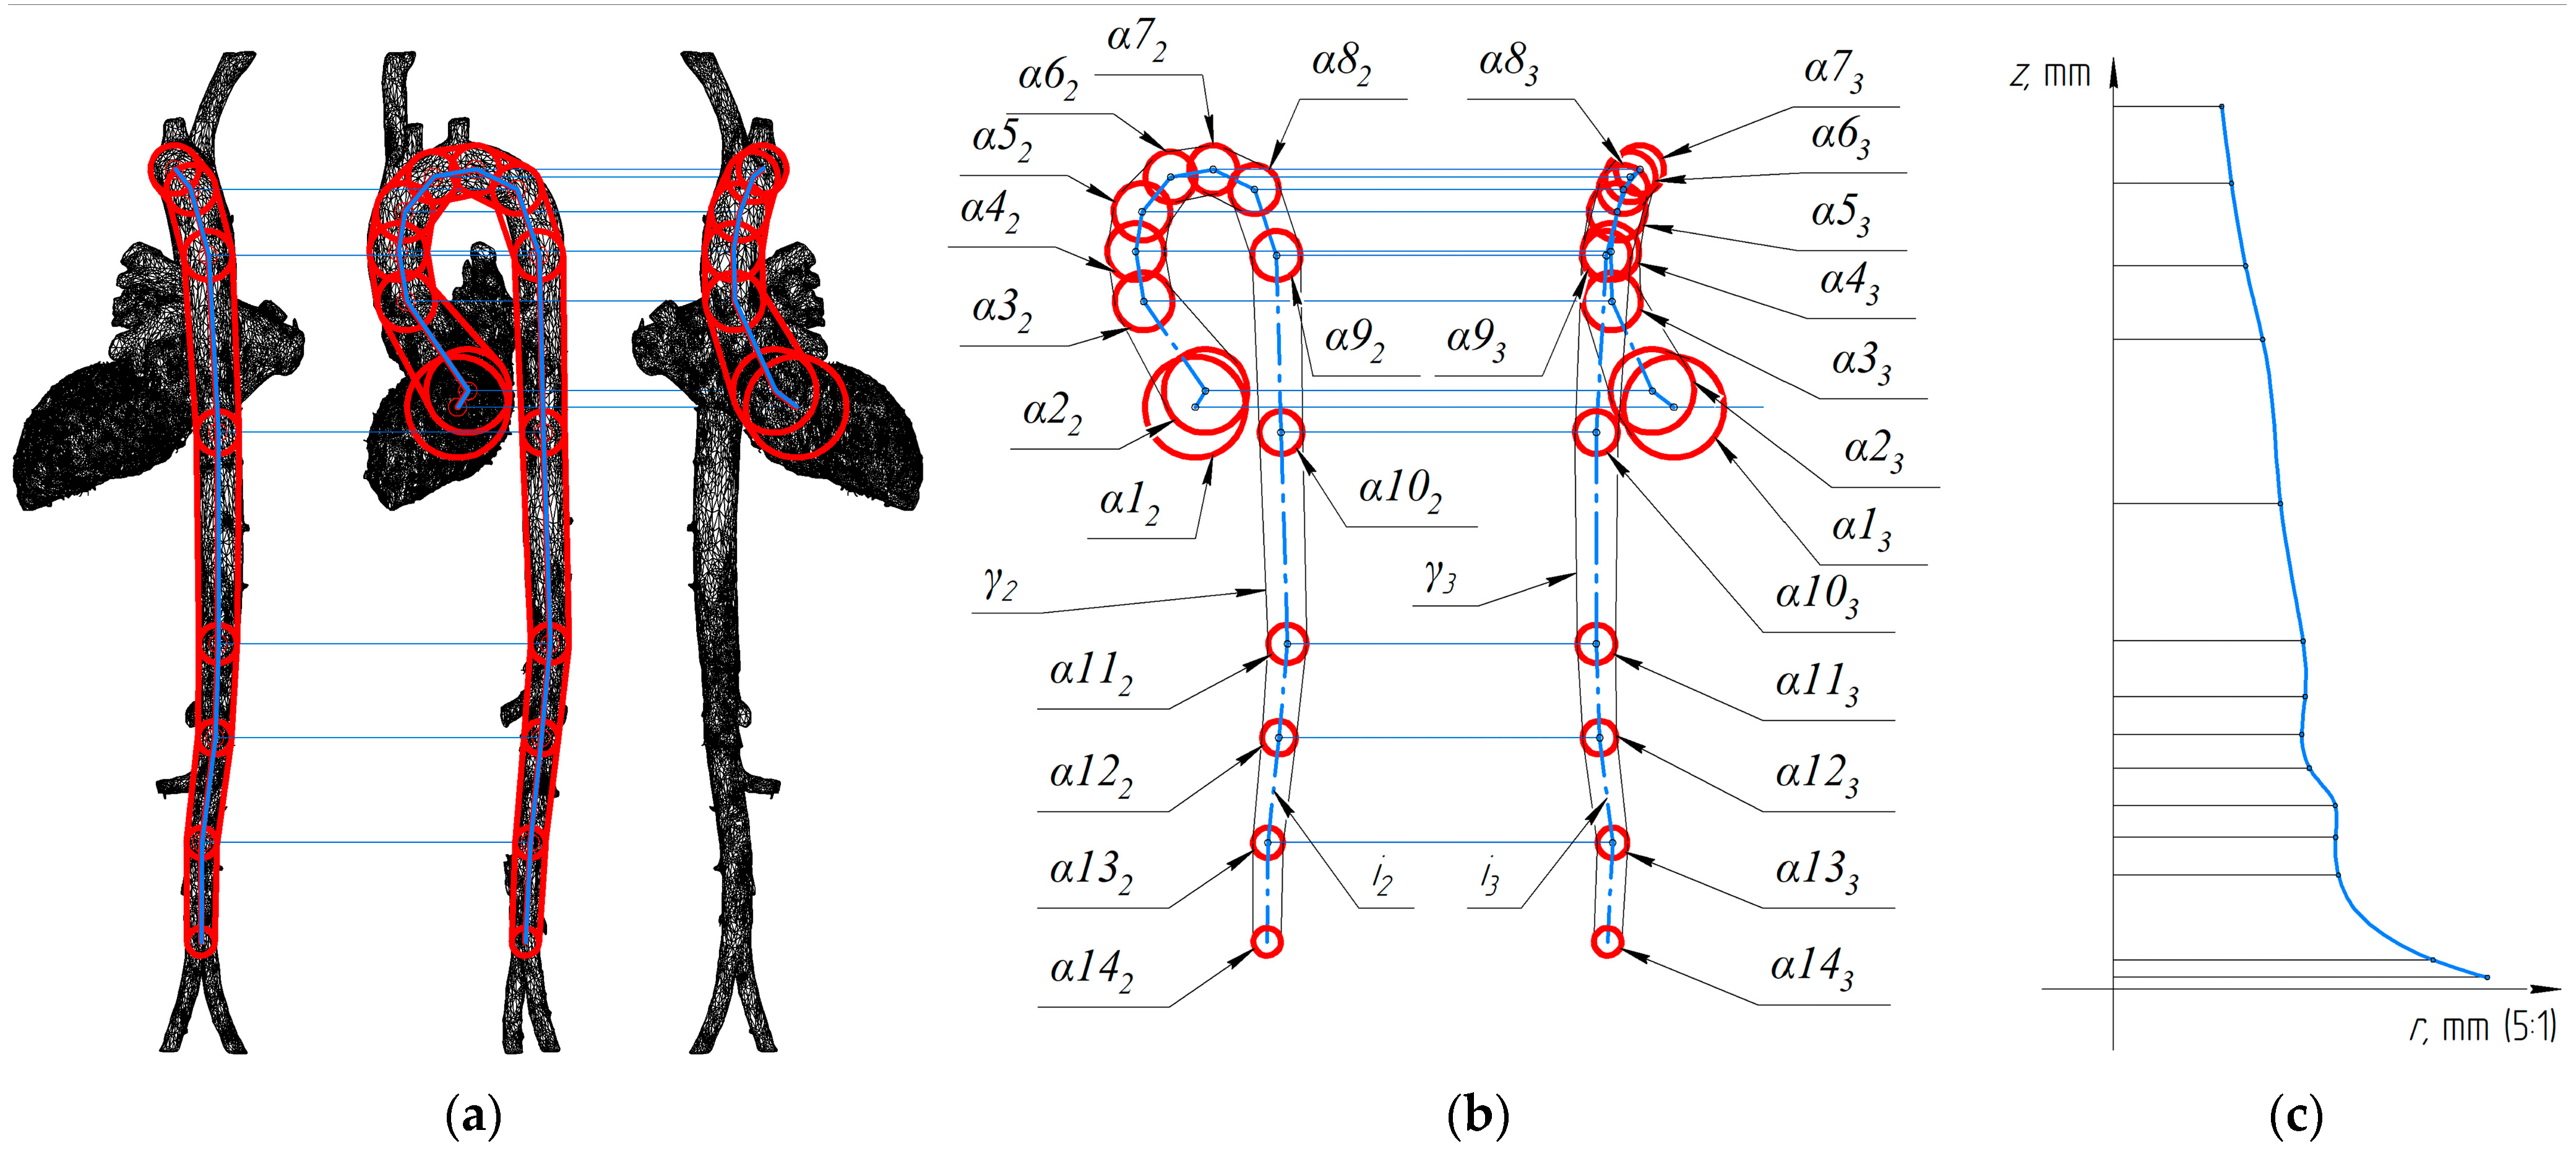
In order to study the evolution of the blood jet traveling from the left ventricle to the aorta, the construction of fourteen spheres consecutively inscribed in the system of the left ventricle and the aorta was carried out (
Figure 3).
Figure 3b also shows the circumferential formations of the desired surface as an approximate surface γ. Also in
Figure 3b, the
i-axis of the left ventricle-aorta system is shown in two connected projections, which are sufficient to construct its three-dimensional model.
Least-squares analyses of the data presented in
Figure 3 also allowed the following optimal values of the constants of
zrp =
B to be determined:
The values of
B and
z0 correspond to those given in the article [
12].
The study of the shape of the aortic flow channel with the aortic valve closed was carried out in the same way. The spheres were inscribed in the aortic lumen and then the data obtained were analyzed by the method of least squares, which showed the optimal values of the constants:
The optimal values of the parameters were chosen within the following limits [
12]: [(−0.1, 1 × 10
−5, 0.0), (0.1, 1 × 10
−2, 3.0)].
In this approach, the absolute values of z0 and B depend on the choice of flow channel fragment and therefore their values are not meaningful for this study. On the other hand, it is important to note that the degree exponent p in all three cases studied is close to the value 2, which is consistent with the exact solutions for the Bürgers vortex used in our quasi-stationary regime.
3. Results
The values (2), (3), (4) of the degree (p) of the variable (r) obtained in the experiments indicate the uniformity of the shaping for the studied surfaces at the moment of maximum productivity of the blood flow. All the values obtained for the degree of r are close to two. Consequently, it is reasonable to use a degree p equal to two when constructing the approximating surface.
Equation (1) can be written as a function of
r on the argument
z. Then Equation (1) takes the form:
It should be noted that the function under consideration only makes sense for positive values of function and argument; therefore, the loss of roots in the equation does not affect the final result when going from (1) to (5). The value of the constant B was corrected because the value of the degree (
p) was rounded to two. As a result, we obtained the following equations for calculating the radius of the atrial and ventricular-aortic flow channels, respectively:
where
z is the distance along the spatial curve of the vessel axis. Equation (6) was used to calculate the data shown in
Figure 4.
Based on the data obtained (
Figure 4), it can be concluded that Equation (6) can be used to construct target approximation surfaces.
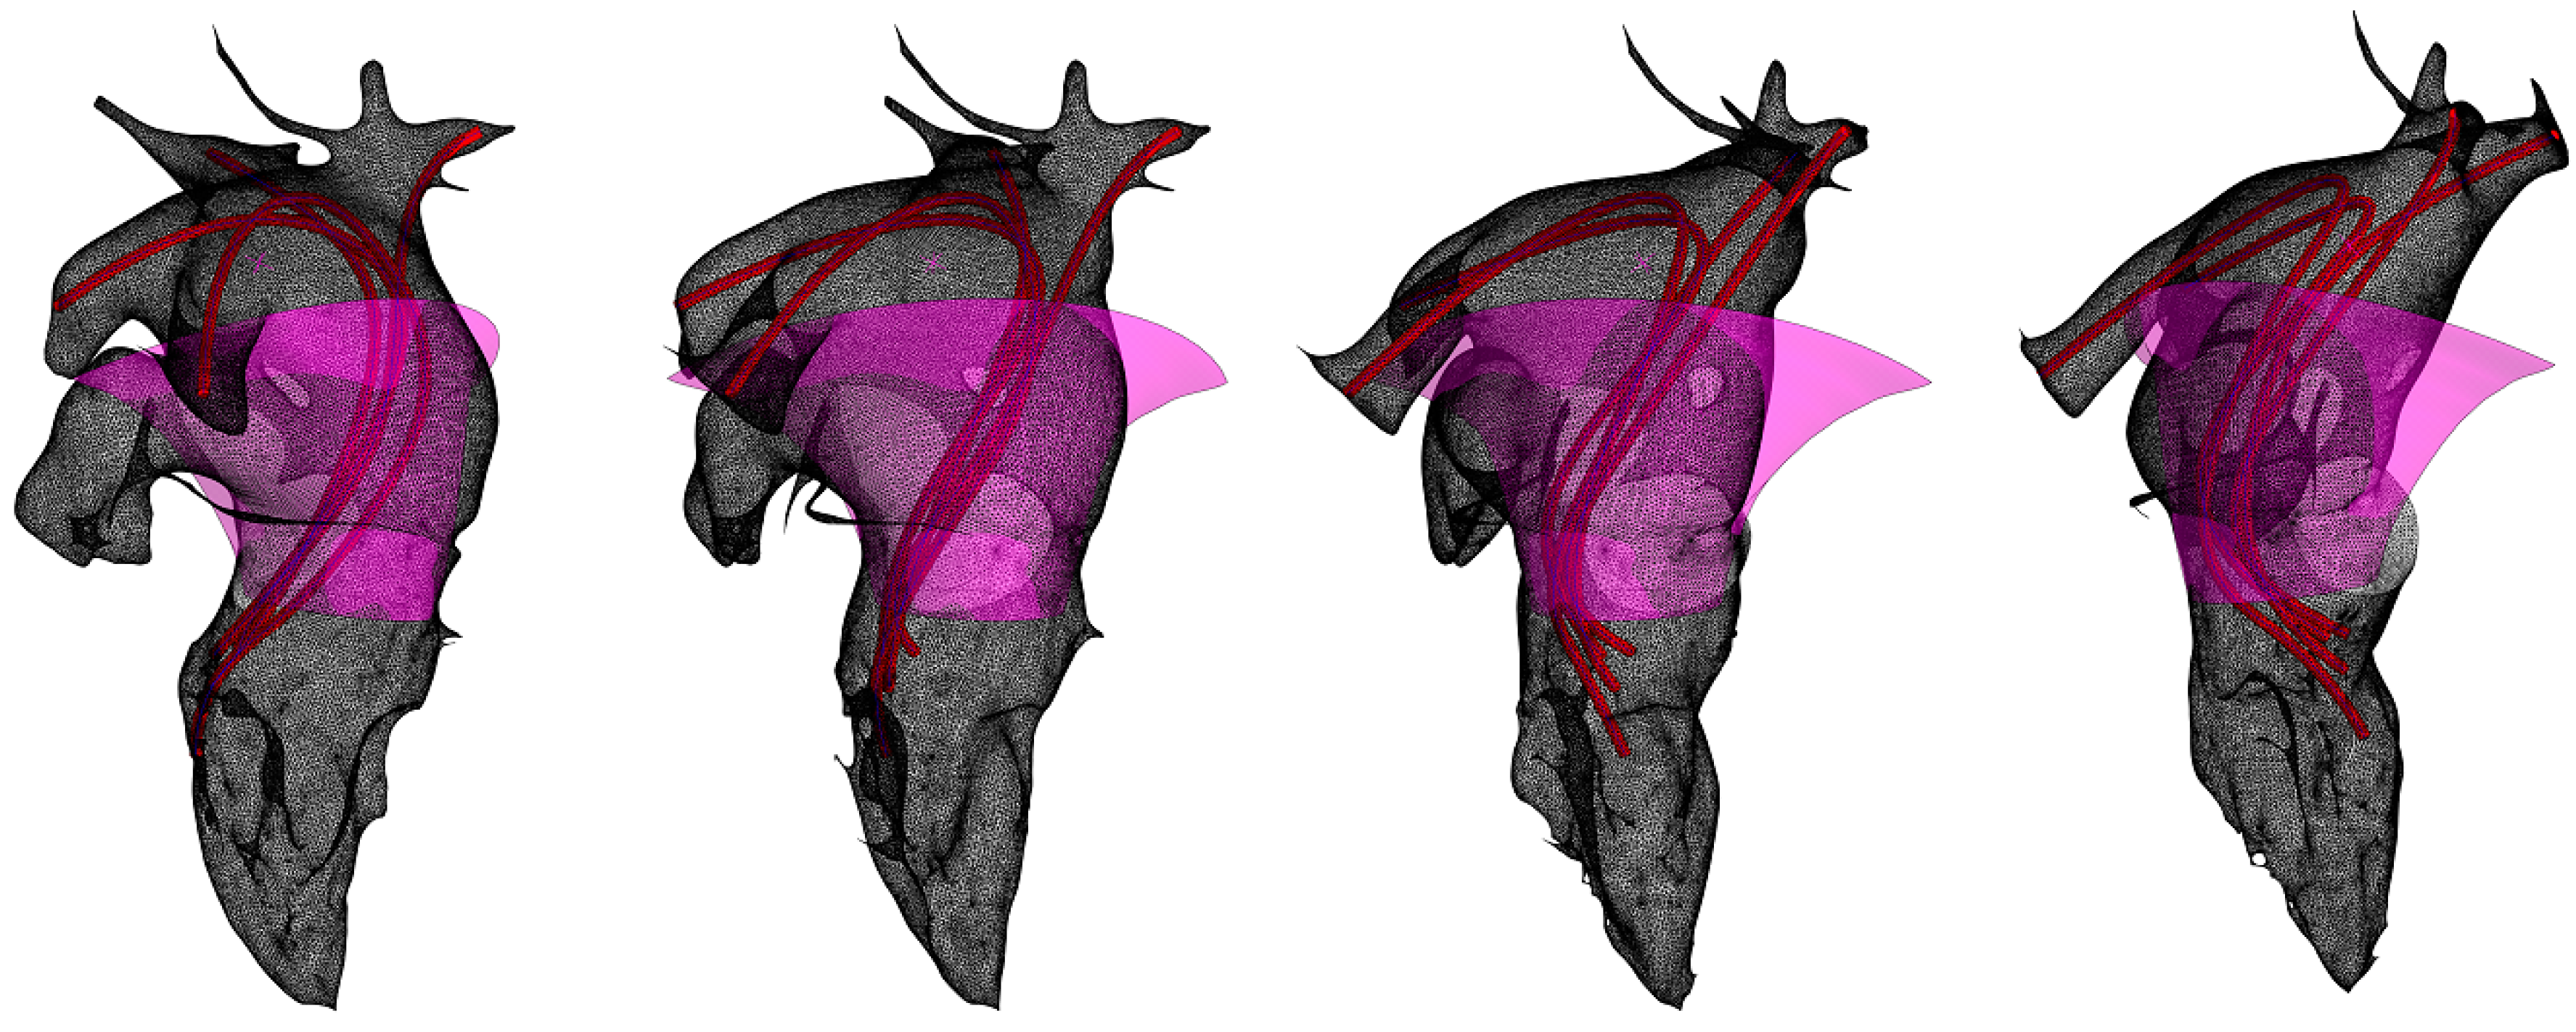
For a more visual representation of the direction of blood flow from the pulmonary veins, they are modeled conventionally (
Figure 5). The images obtained show the relationship between the direction of flow and the shape of the flow channel, confirming the effectiveness of the hydrodynamic model chosen [
5]. The segment of the surface approximating the atrial shape (
Figure 5) can be represented as an image of a straight confuser [
13] in accordance with ‘oblique symmetry’ [
14]. The atrial current lines are inscribed based on the position of the pulmonary vein axes and the axis of the hyperboloid, a segment of which is the left atrial channel. This construction is empirical. The analytical solution should be based on the instantaneous values of the functions of the current lines of the twisted jet in the left atrium.
In order to construct a surface that approximates the shape of the ventricle-aorta system, it is necessary to obtain a model of its spatial axis curve. In this study, a spline curve constructed on the centers of the spheres shown in
Figure 3 was used for this purpose. The choice of spline construction method [
15,
16,
17] remains open in this case. In our solution, the rational Bézier curve is used.
Circular sections of the surface were defined in normal planes and the surface was then drawn on them using the appropriate tool in the computer-aided design system. Equation (6) and the data presented in
Figure 4 were used to determine the radii of the forming circles.
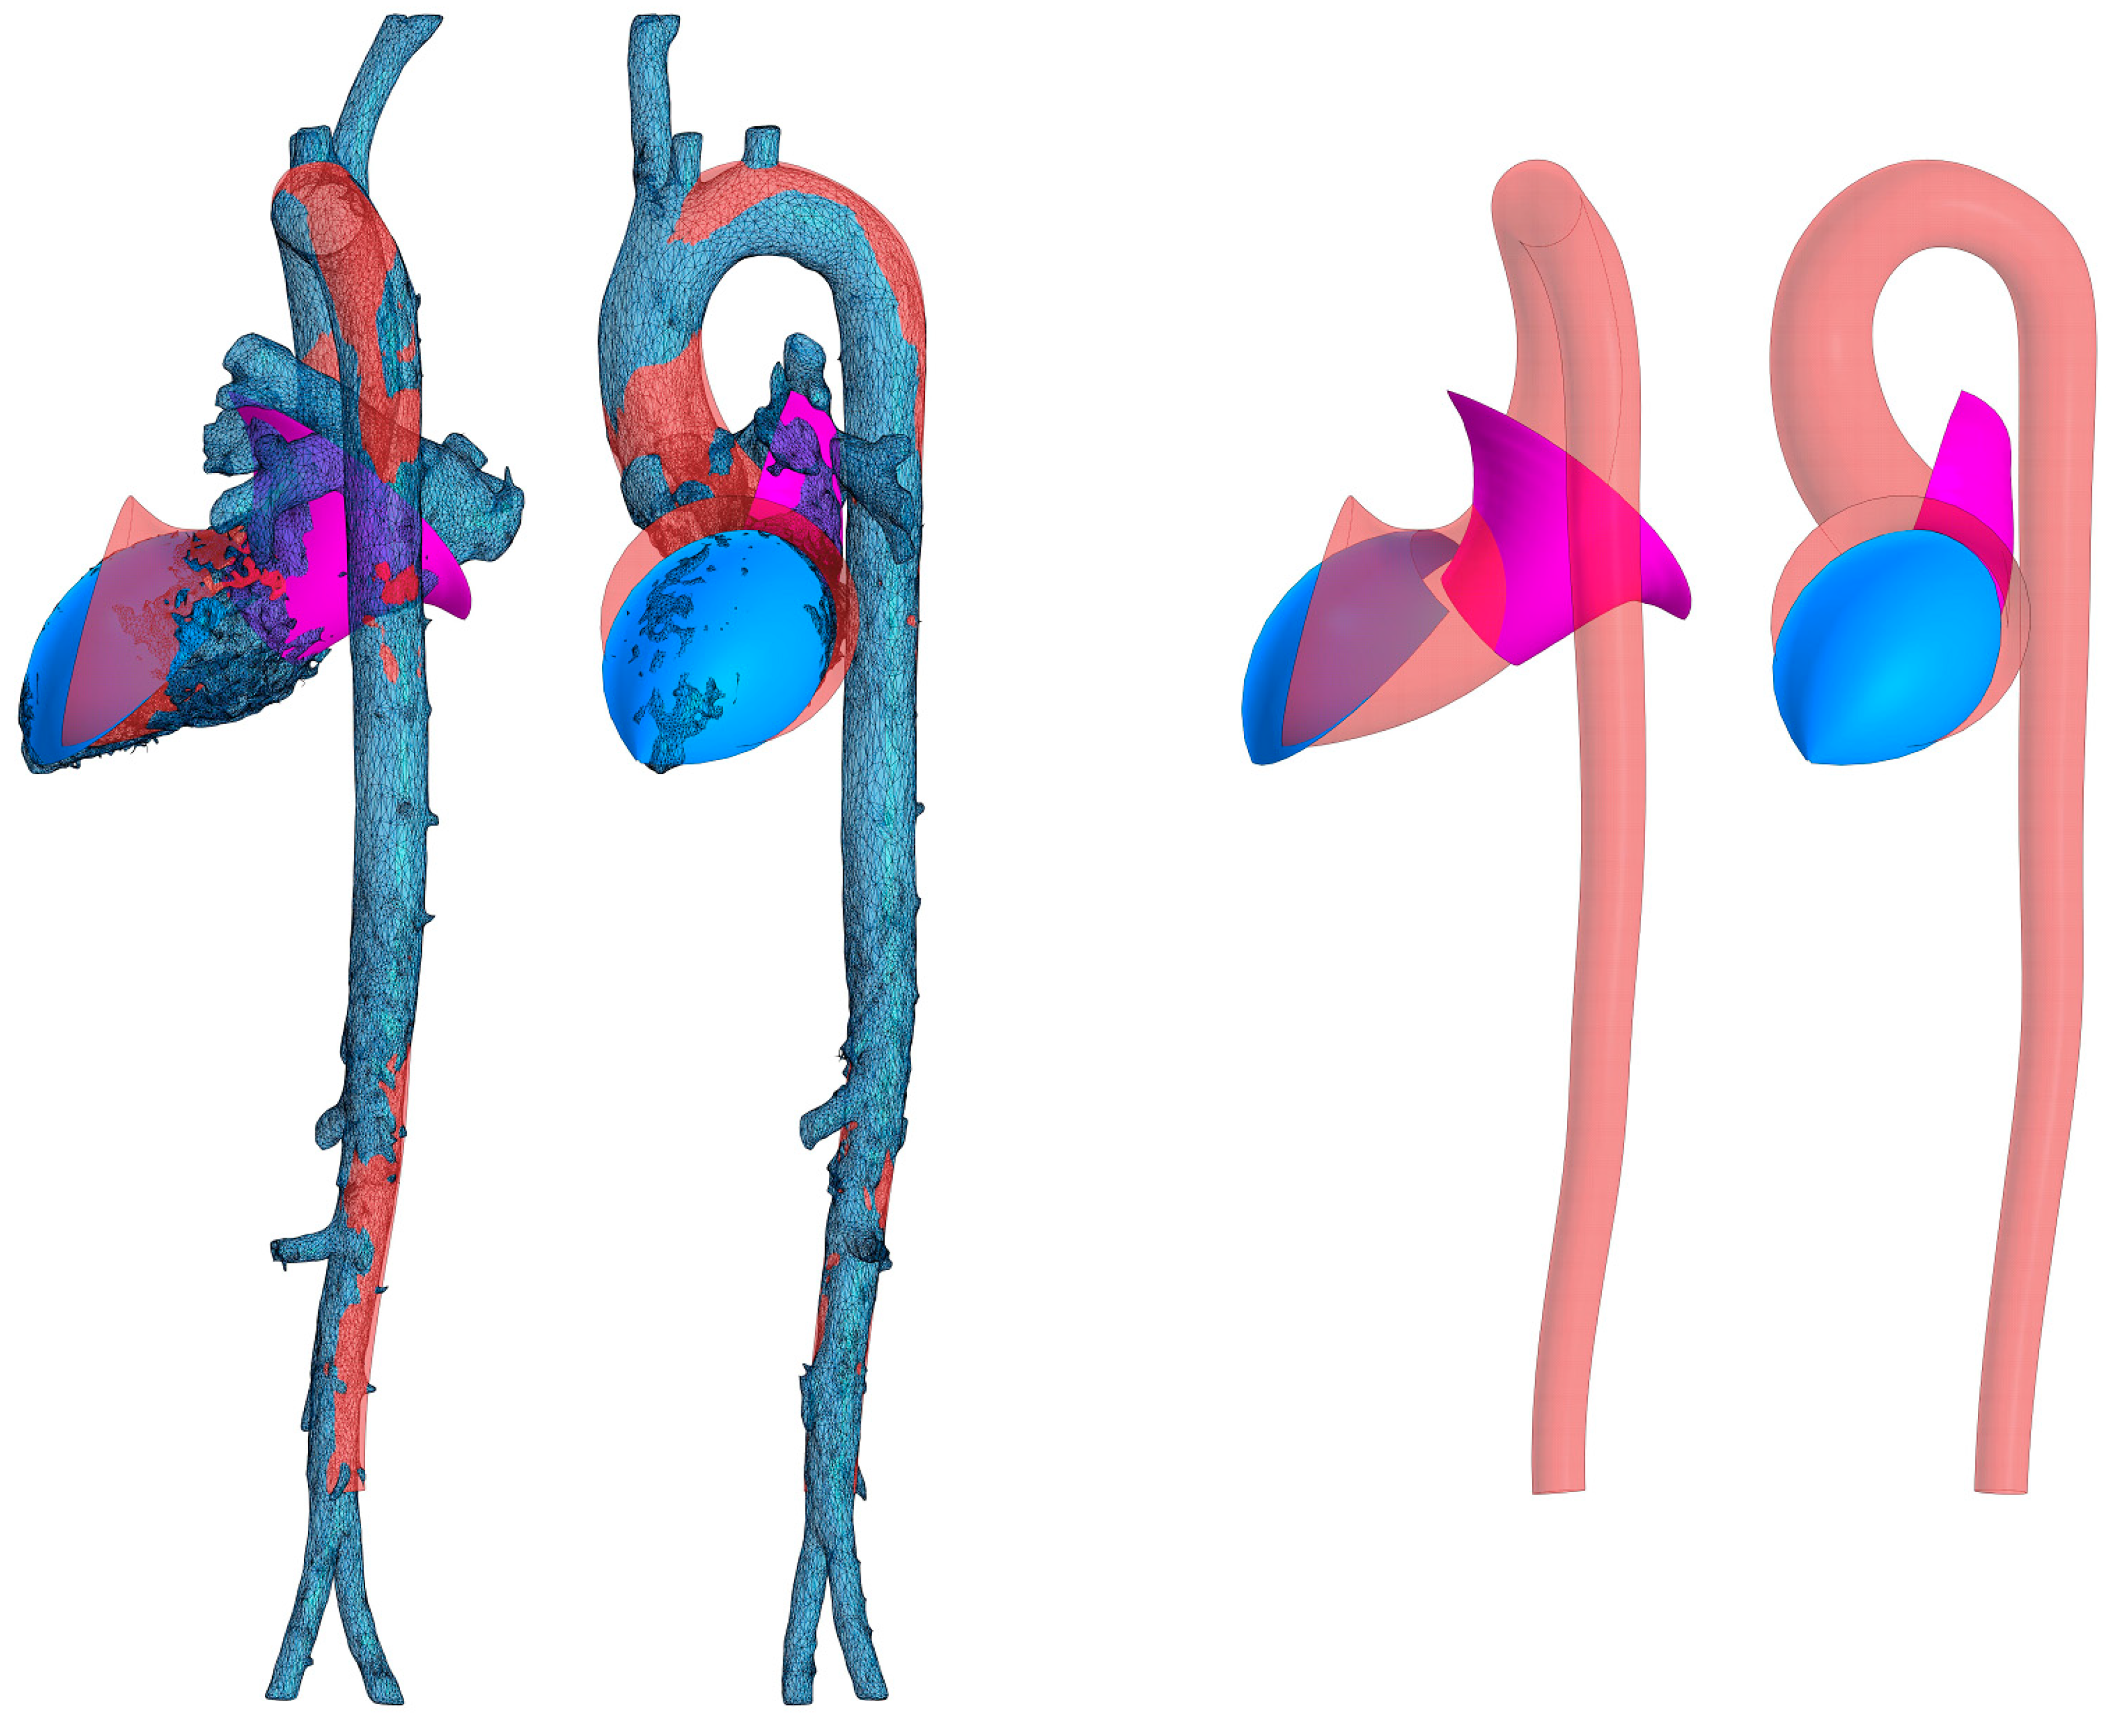
The resulting surface fragment models approximating the aorta, left ventricle, and left atrium are superimposed on the original STL model in
Figure 6. In the figure, the left atrial cavity (pink) is delineated as a segment of a hyperboloid, the flow portion of the left ventricular and aortic cavities is obtained by sphere inscription (beige), and the blue surface corresponds to the concave streamlined surface lying at the jet initiation site. This surface is empirically approximated by a segment of a closed torus. The torus used is the simplest surface that satisfies the condition of concavity of the streamlined surface at the point of initiation of the swirling jet and at the same time provides sufficient accuracy of approximation.
4. Discussion
The twisted structure of the blood flow can only be formed in a flow channel with a certain geometrical configuration. This configuration is determined by the direction of the flow lines, whose three-dimensional velocity field is described by the Kiknadze–Krasnov equations [
3]:
where
uz, ur, and
uφ are velocity components,
ν is kinematic viscosity, and the unsteadiness and evolution of the flow are determined by the behavior of the time-dependent functions
C0(
t) and Γ
0(
t).
C0(
t) is an arbitrary function of time representing, in a physical sense, the gradient of the longitudinal component of velocity (s
−1), Γ
0(
t) is an arbitrary function of time corresponding in the physical sense to the circulation of the medium (m
2/s).
To ensure potential flow, the curvature of the streamlined surfaces of the flow channel must satisfy these conditions. As previously published, there are several mechanisms that serve to generate such flow. These mechanisms act at all stages of the development of a swirling jet and include the twisting action of the atrial contraction and the convergence of the left atrial channel, the action of the trabecular apparatus and the rotational motion of the left ventricle, the specific elasticity distribution and the convergence of the aortic flow channel, and the geometry of the branching of the main branches of the aorta [
5].
However, a coherent formal description of the geometric configuration of the flow channel in the section from the left atrium to the end of the aorta is still lacking. This is due to the fact that such a description has not been based on a coherent concept justifying the principles of self-organization of flow and flow channels. The possibility of developing such a concept arose with the appearance of accurate Kiknadze–Krasnov solutions and hydrodynamic studies of centripetal swirling flows of viscous fluids [
13].
It turned out that both the hydrodynamic structure of the blood flow and the streamlined boundaries of the channel in the central circulatory regions contain many features by which we can judge the applicability of these solutions. The proposed approach allows us to study not only static states of the channel, but also dynamic changes in its configuration according to pulsation oscillations. It has also become possible to describe the general geometric configuration of the heart and aorta in terms of geometric constructions. A similar problem was solved in [
18], but in that work there was no concept according to which the approximation was carried out and there was no reference to the hydrodynamic characteristics of the flow.
Within the framework of this study, there are still some unresolved issues, particularly the stage of describing the separate parts of the left atrium and the left ventricular apex. In addition, the description of the geometrical regularities of the main branches of the aorta using the same approach has not been completed. The right side of the heart has not been studied at all. This will be the subject of our further studies.
The results of this study allow us to take a new look at the processes of vasculature formation in phylo- and ontogenesis, the influence of vascular channel degradation on aging processes, and the pathogenesis of a number of circulatory diseases.
In practical terms, the results of this study open up new possibilities for modeling the blood circulation and formalizing the initial and boundary conditions of the blood flow, which can be used in cardiology and cardiac surgery for the diagnosis of the flow state, planning and performing reconstructive surgical interventions, as well as for developing technological concepts for the design of artificial heart valves, blood vessels, and fully implantable artificial hearts.

