
A Study on Sandstone Damage Model Based on the Correlation Between Energy Dissipation and Plastic Strain


Abstract
1. Introduction
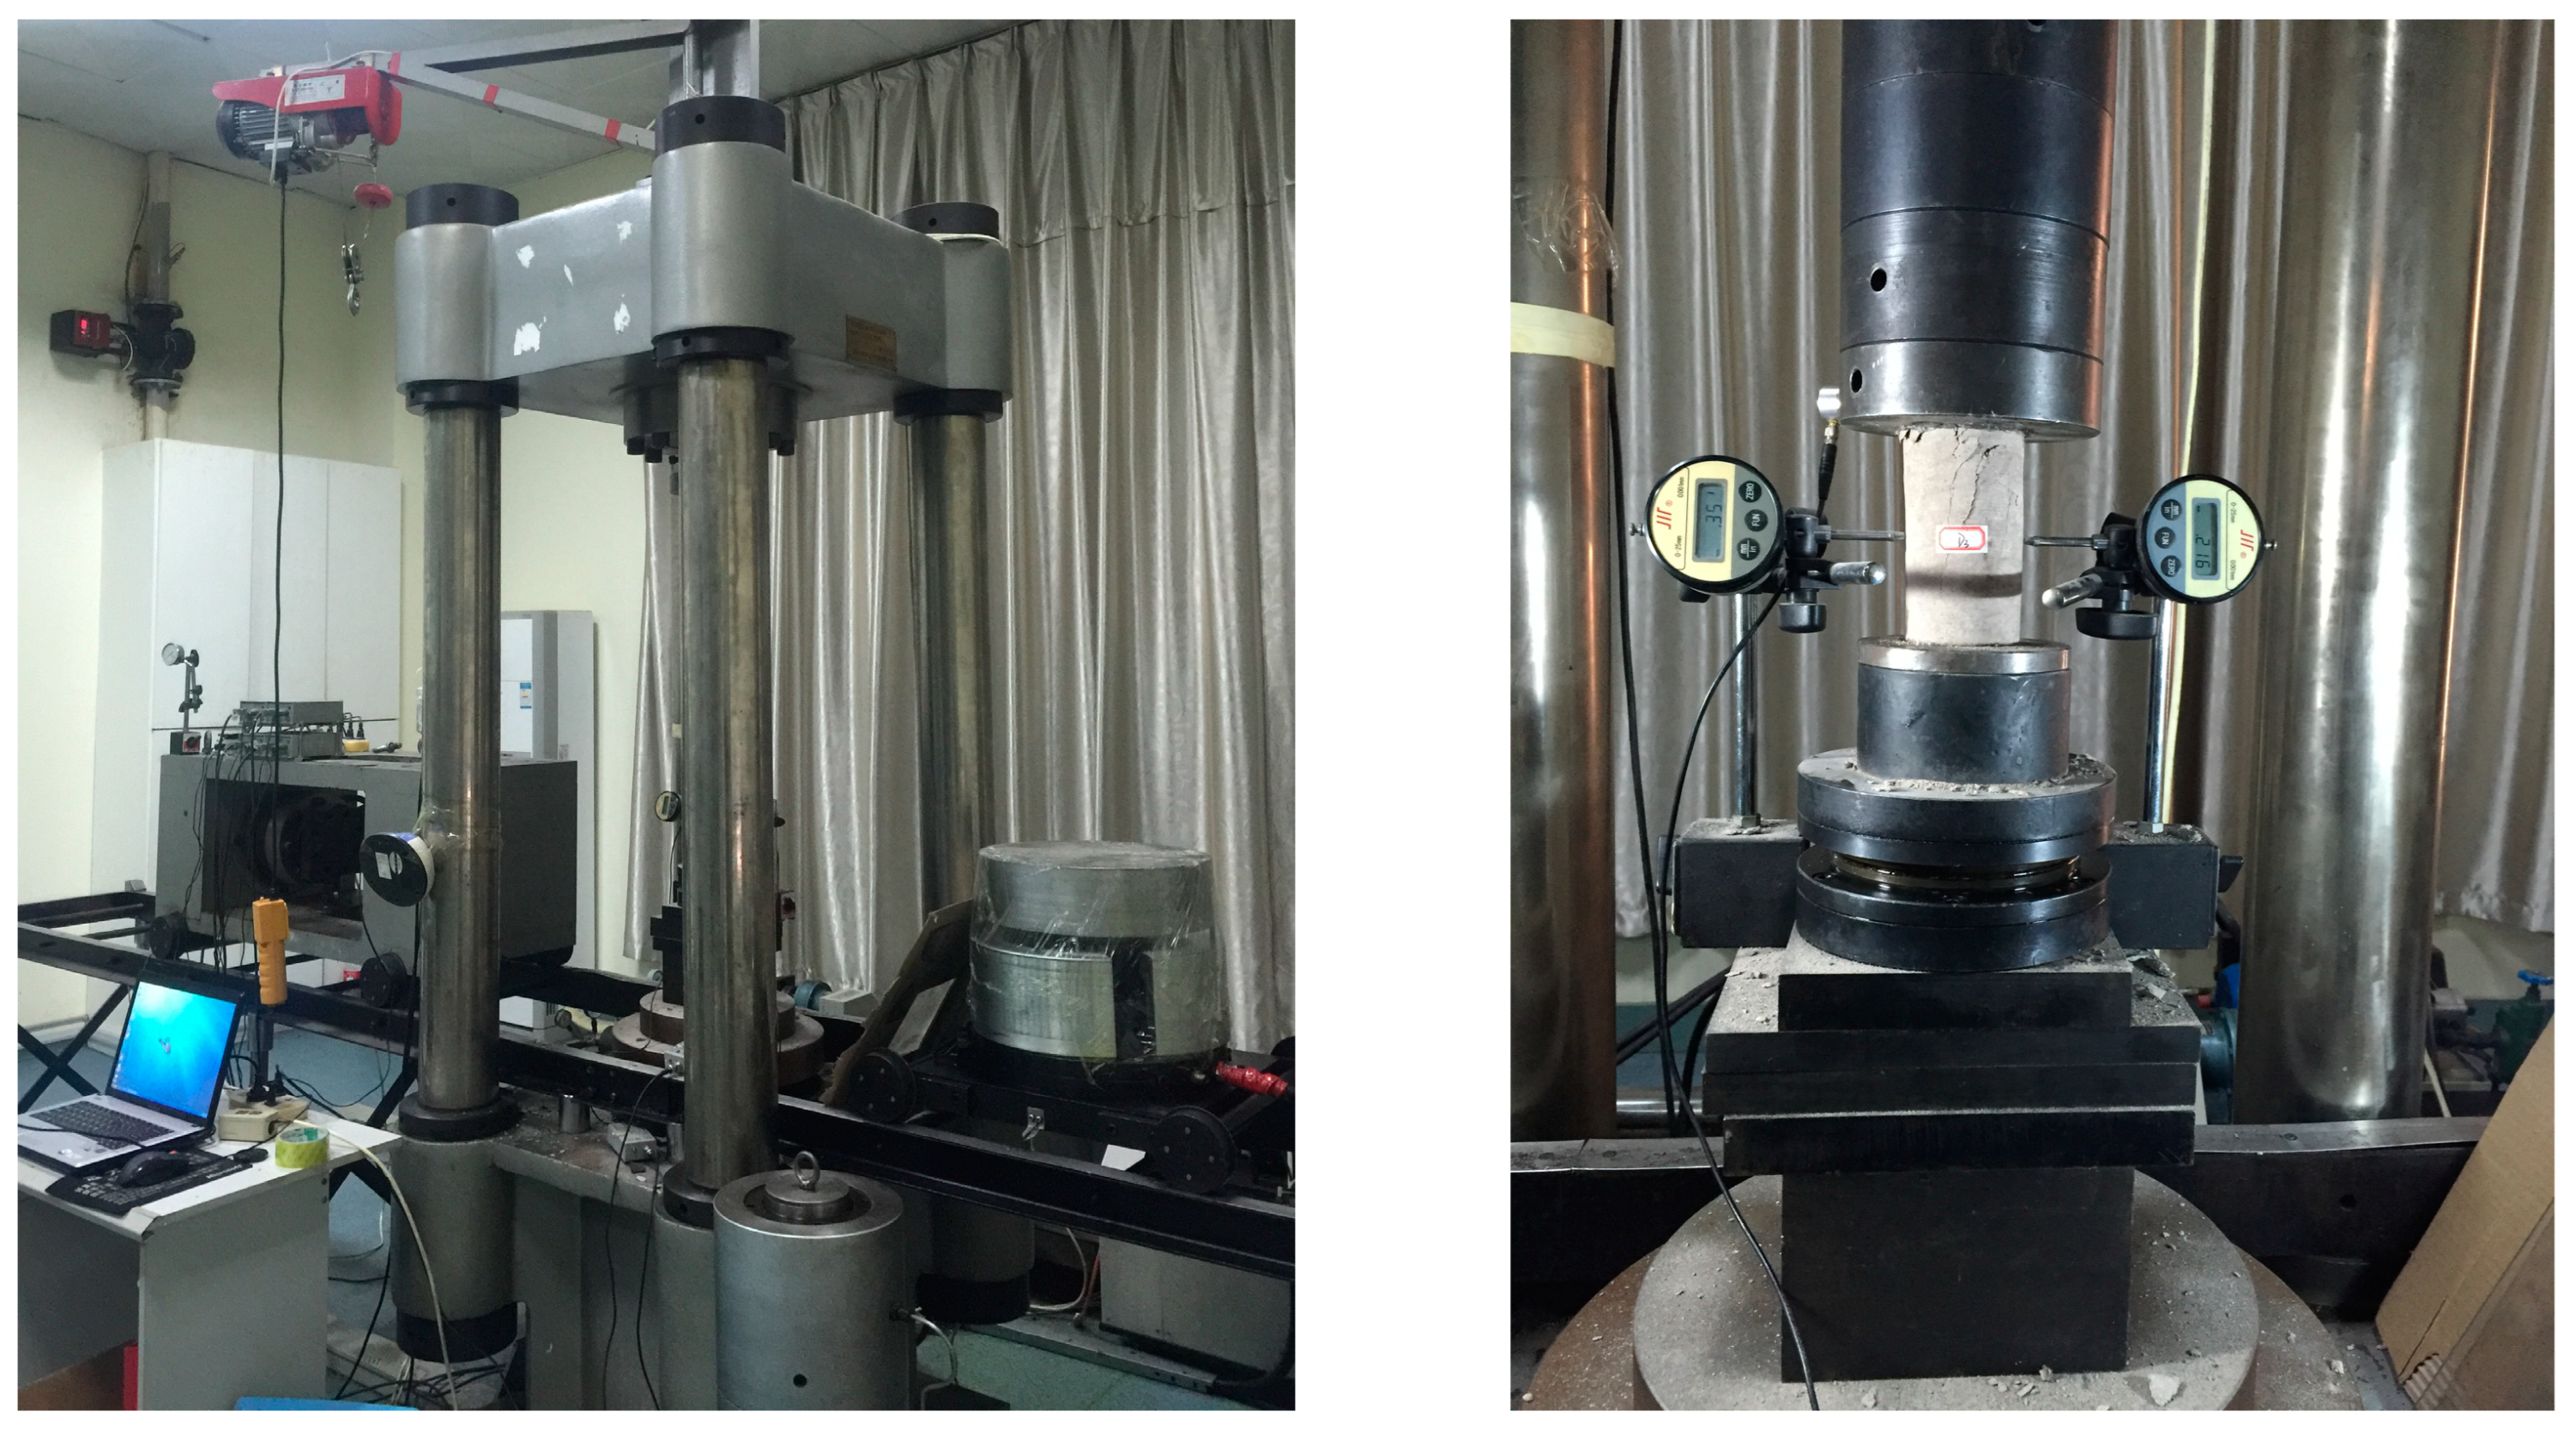
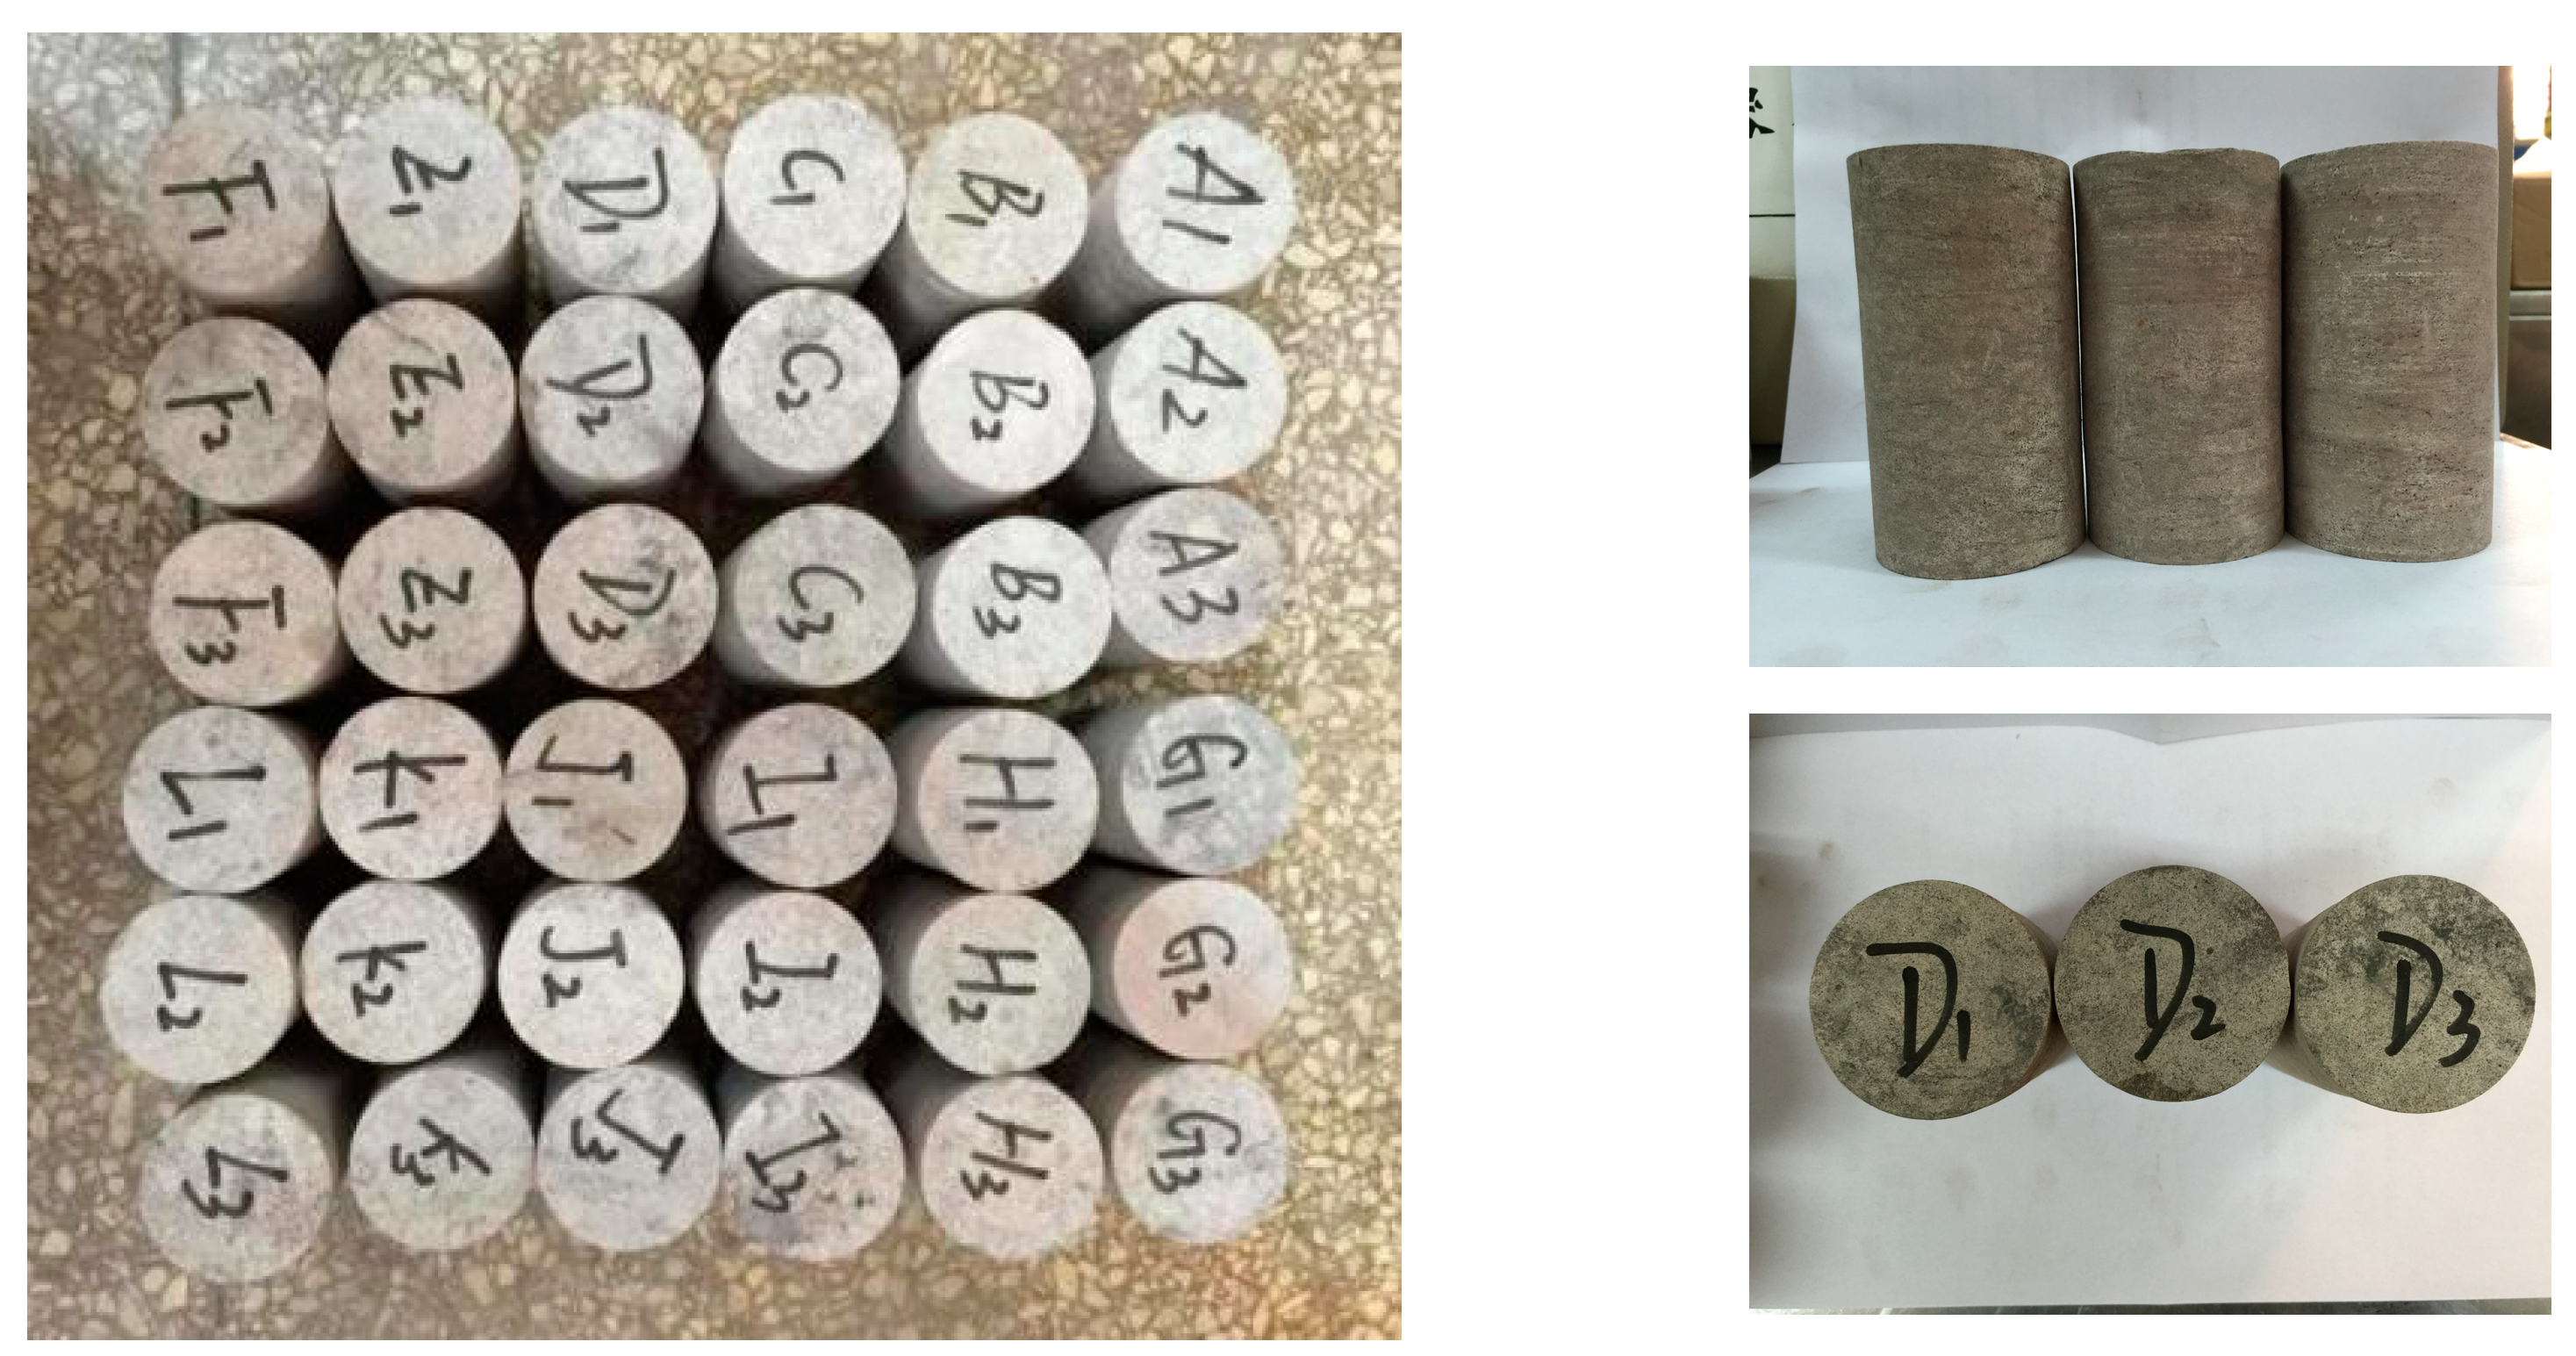
2. Testing Process
3. Results
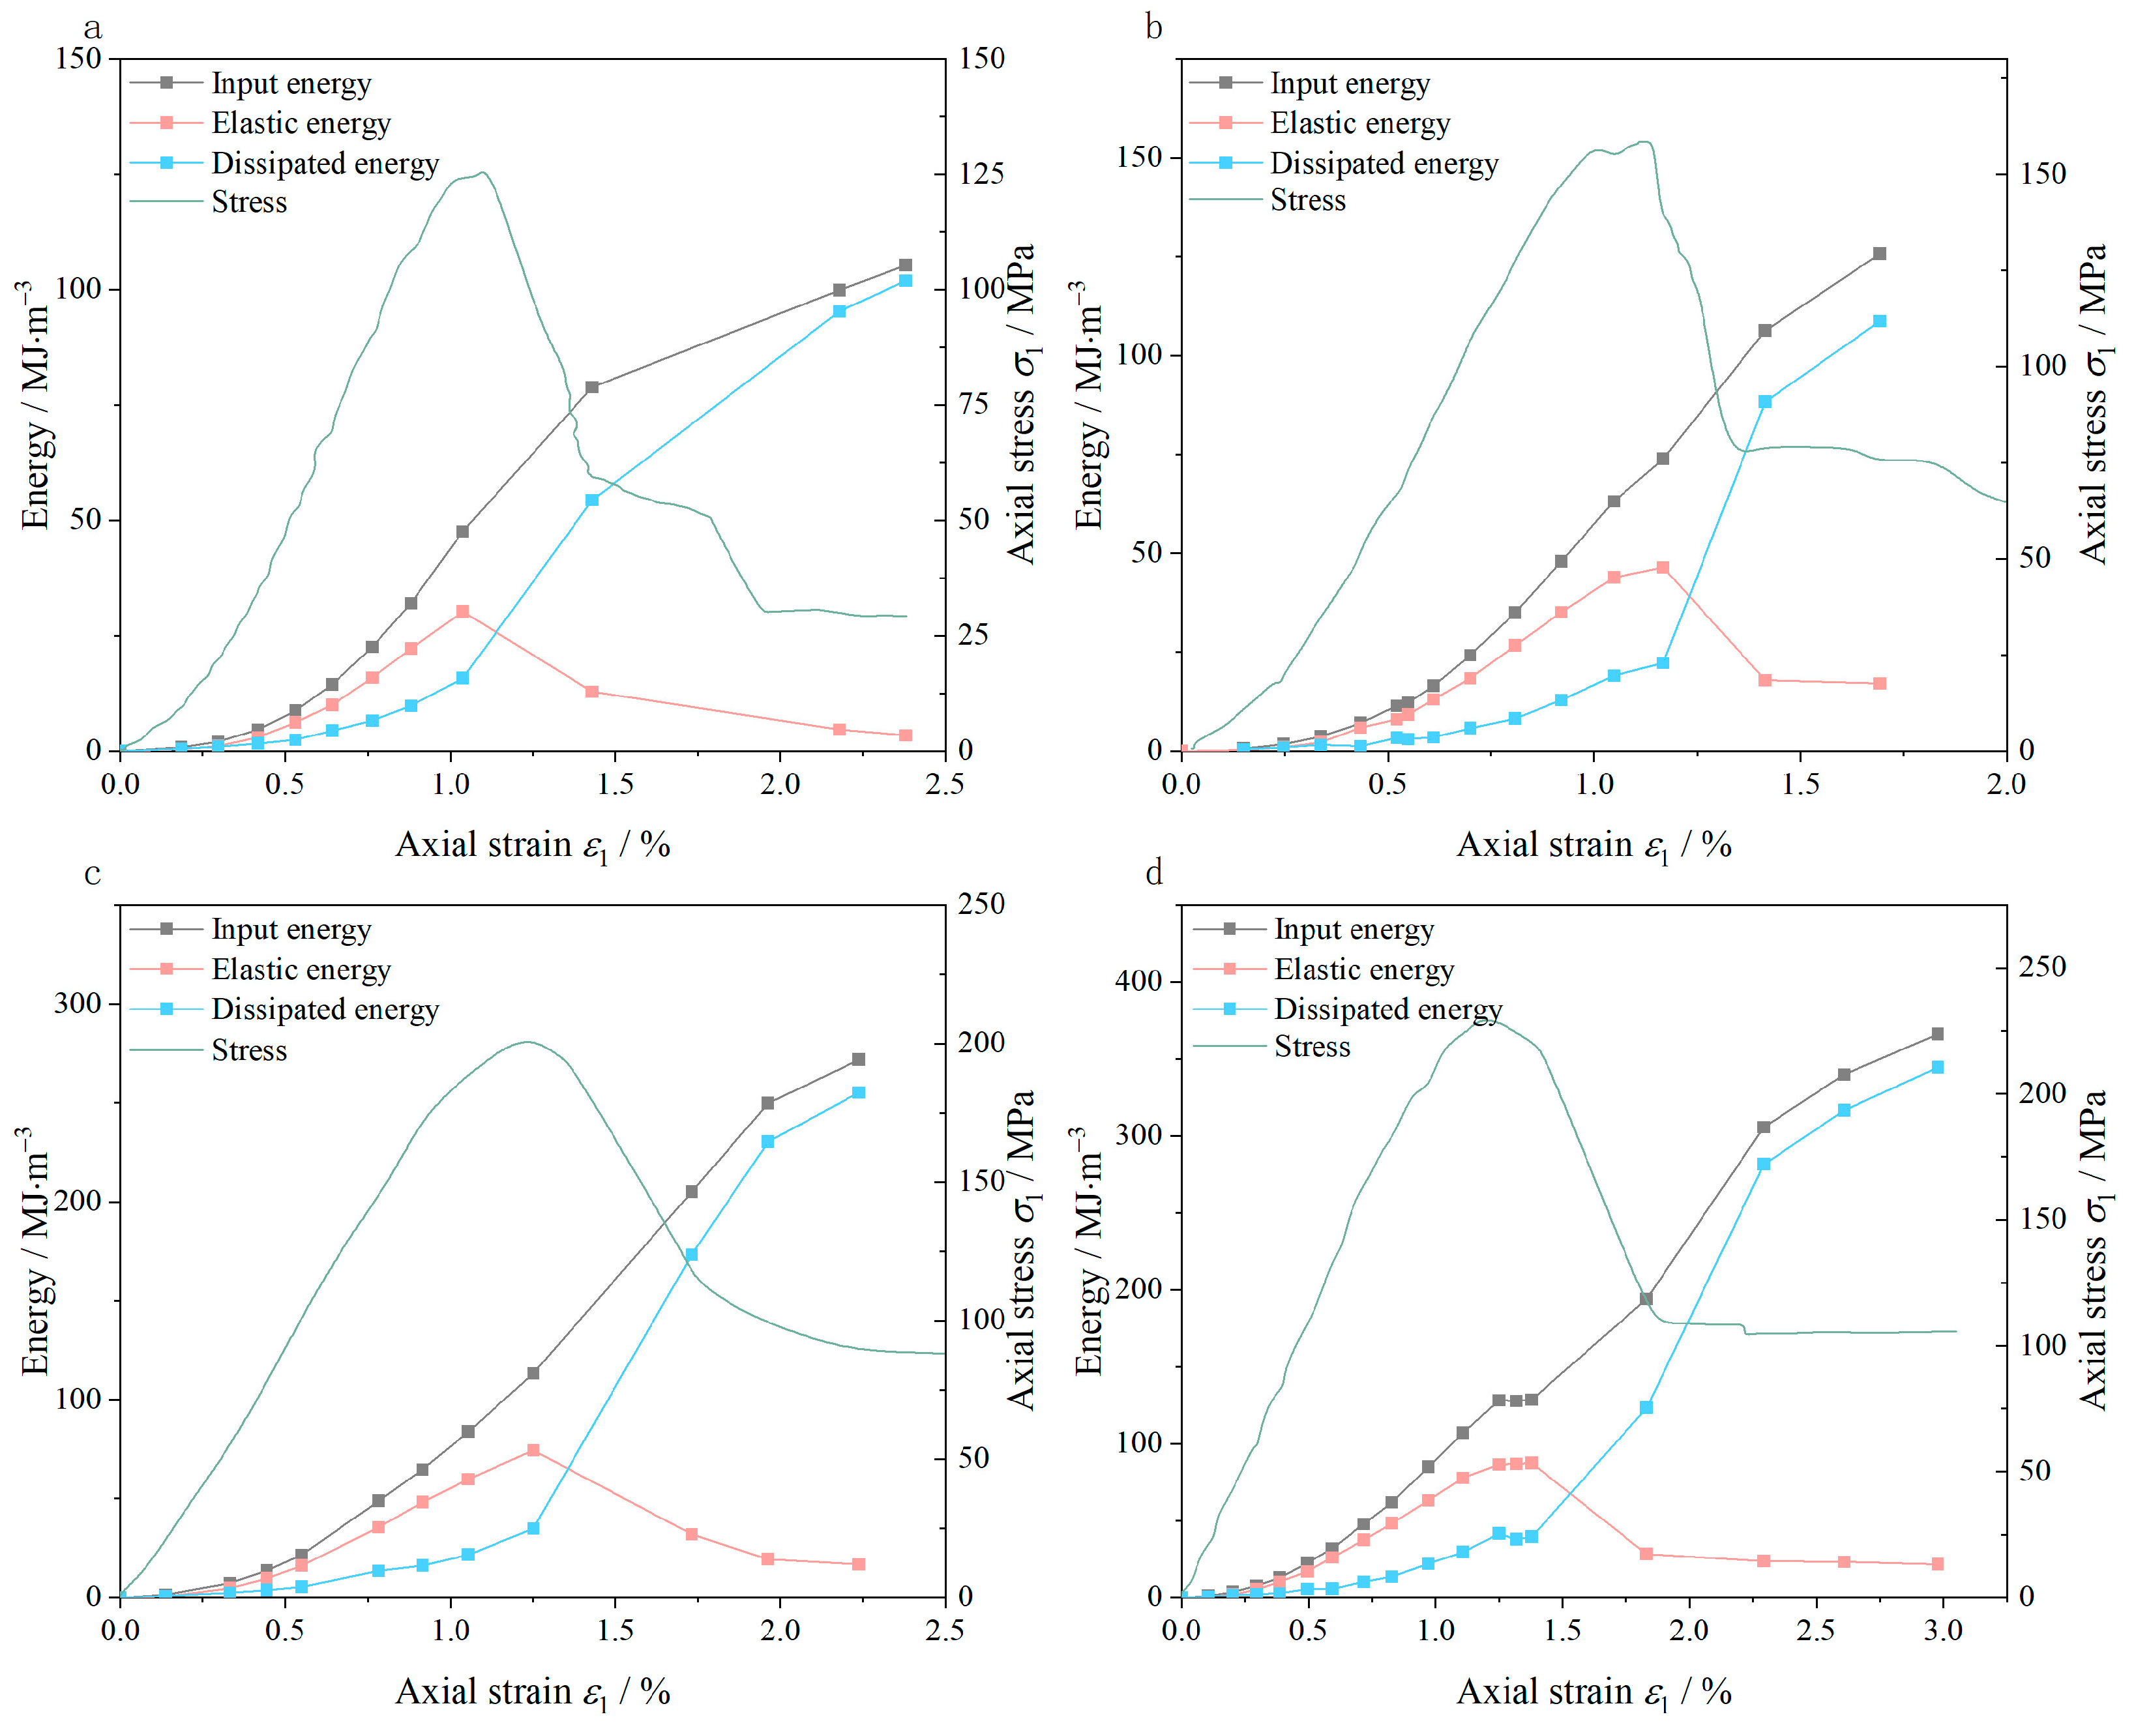
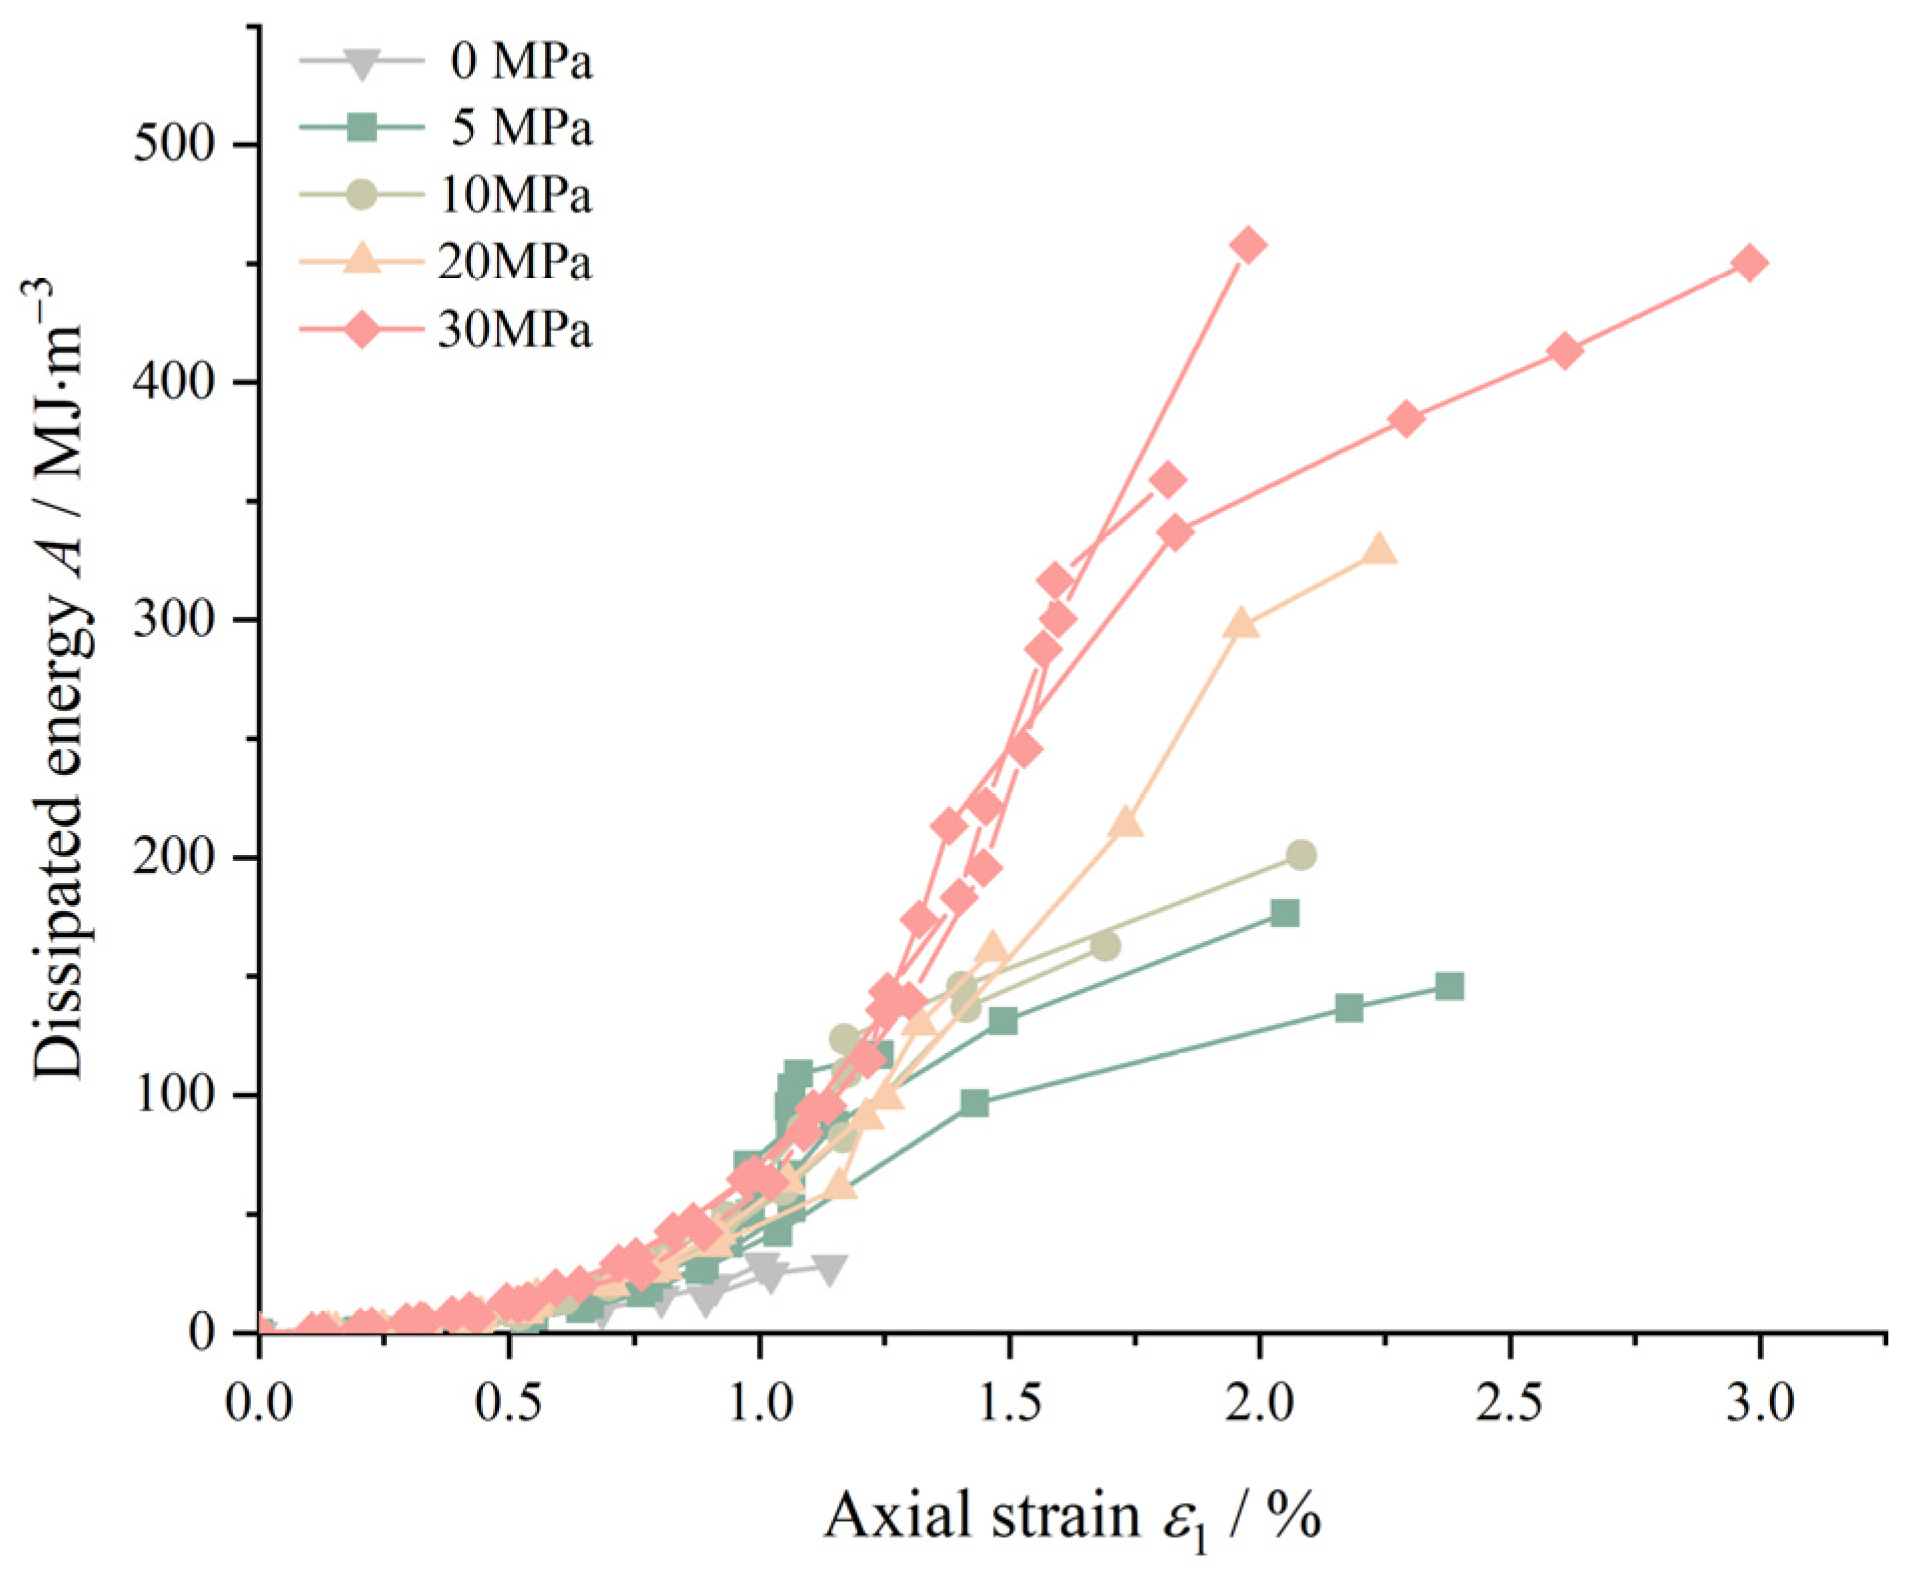
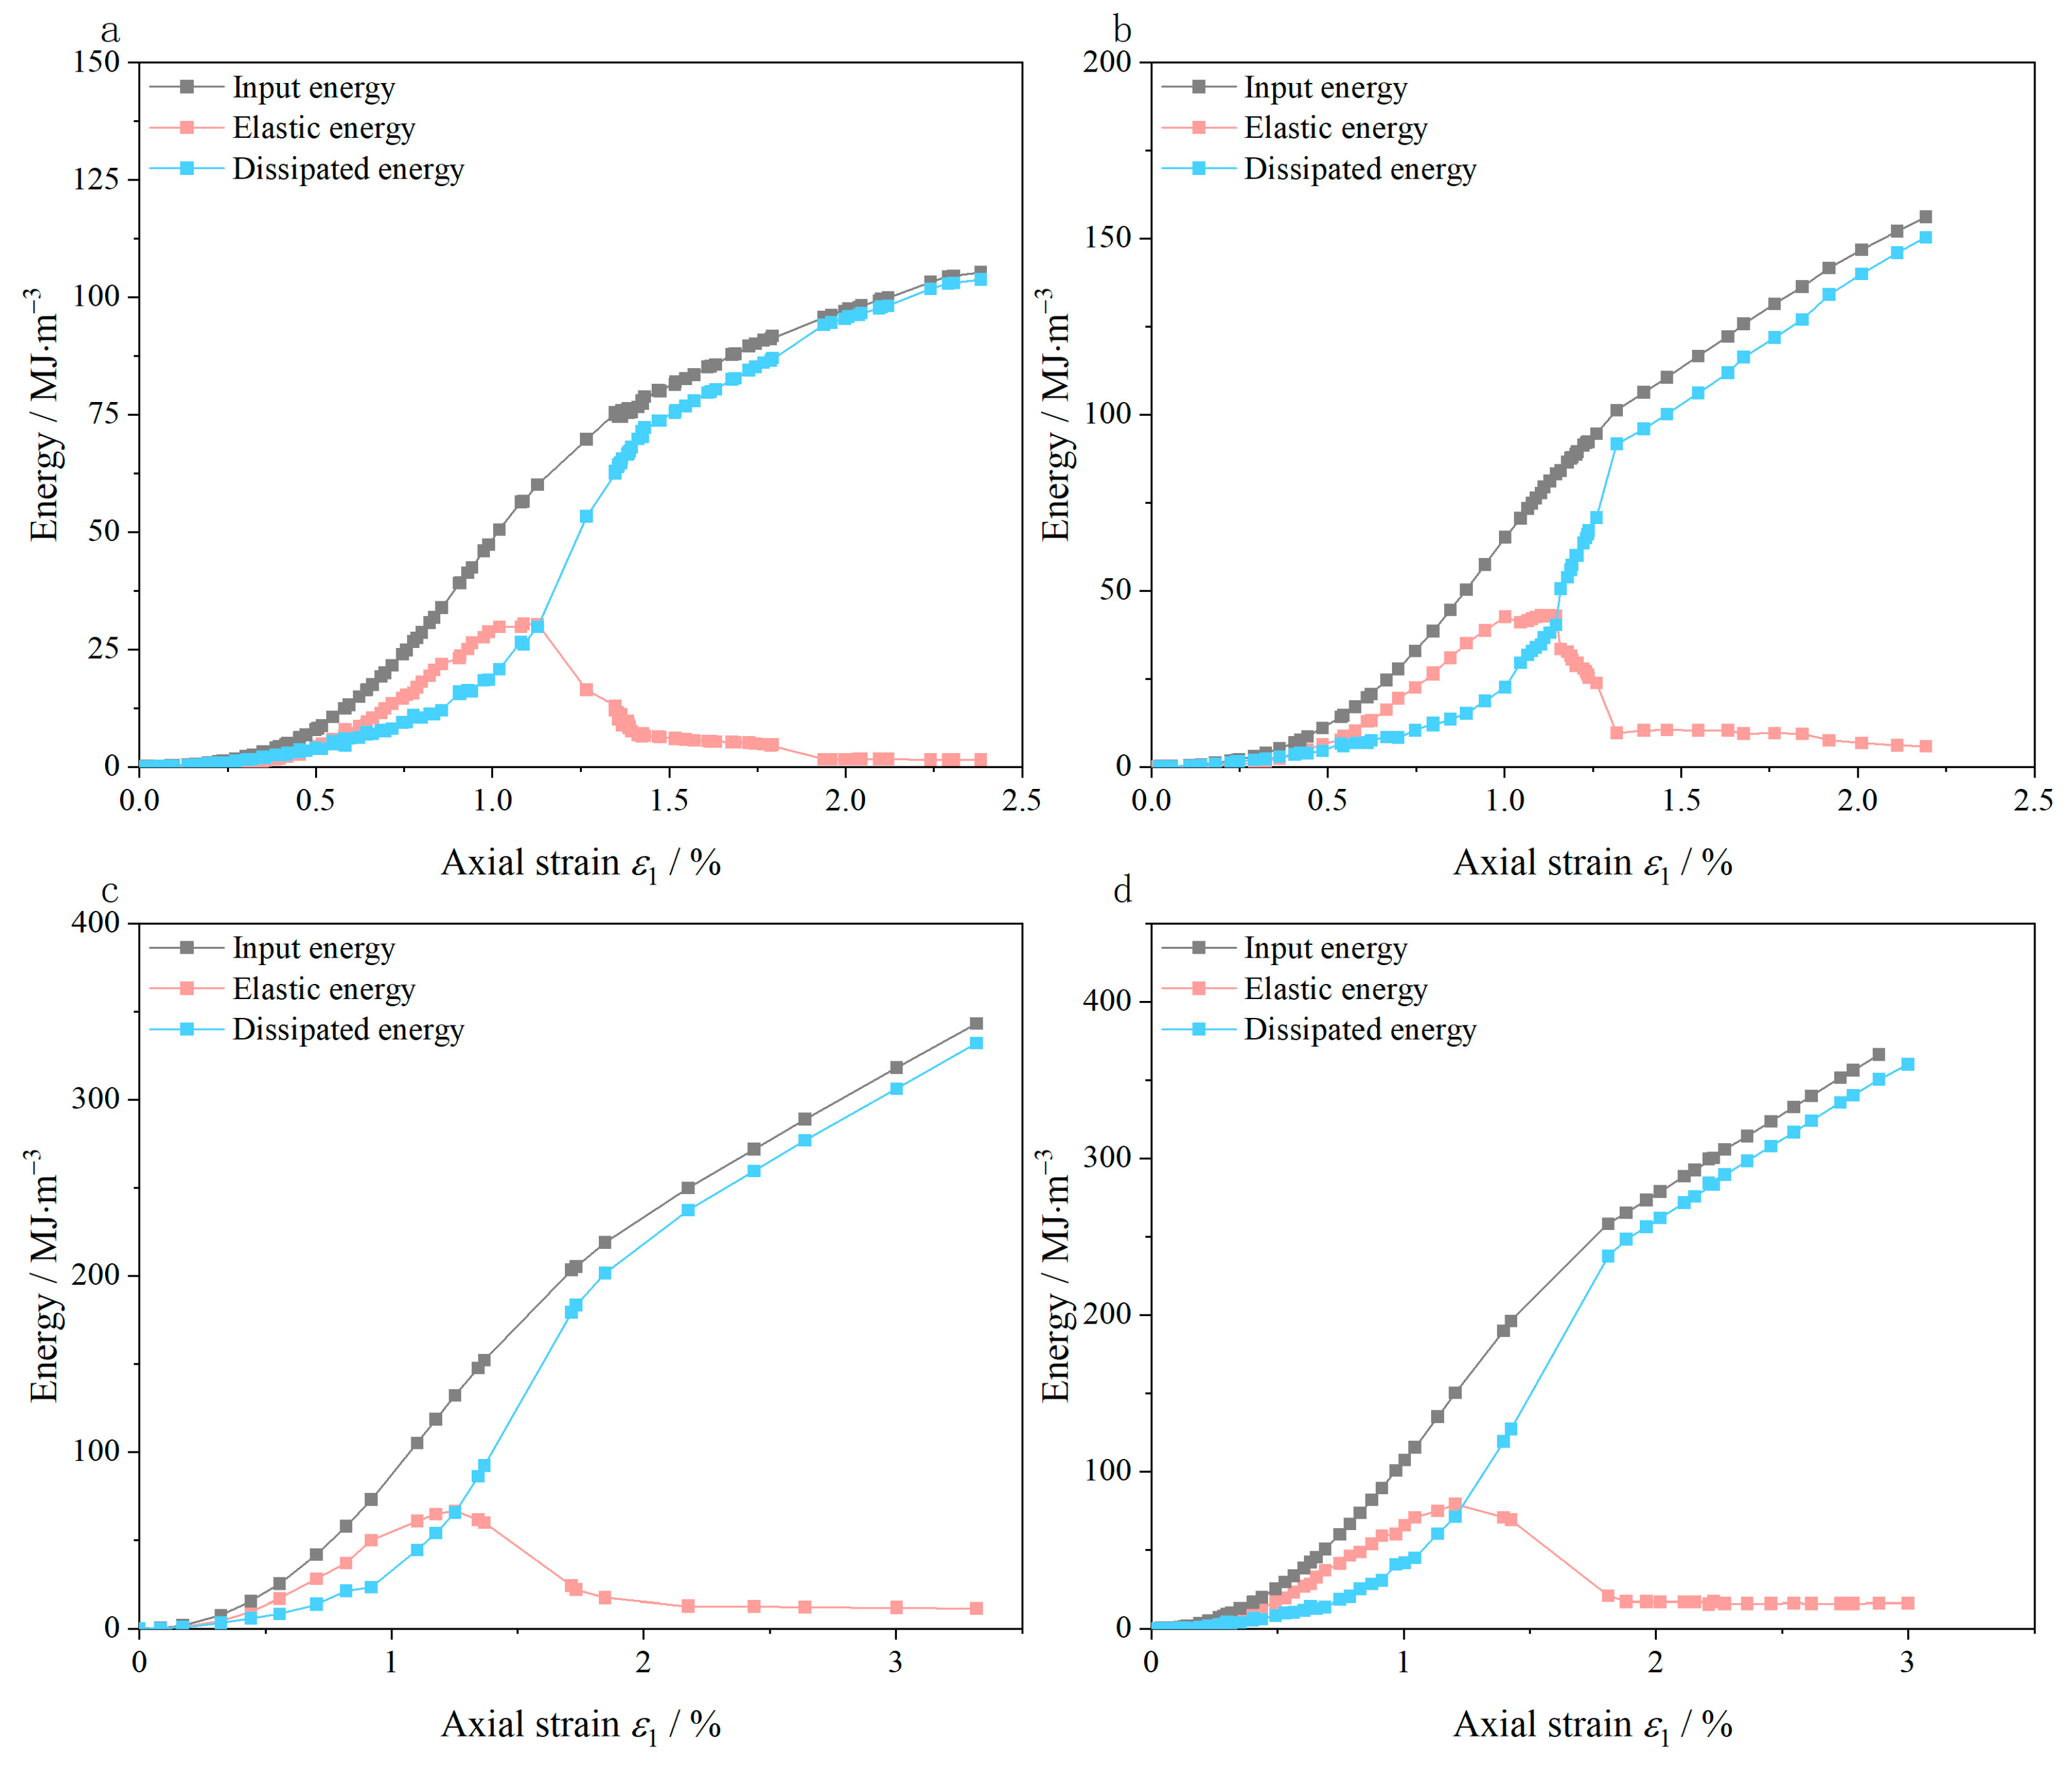
3.1. Energy Evolution
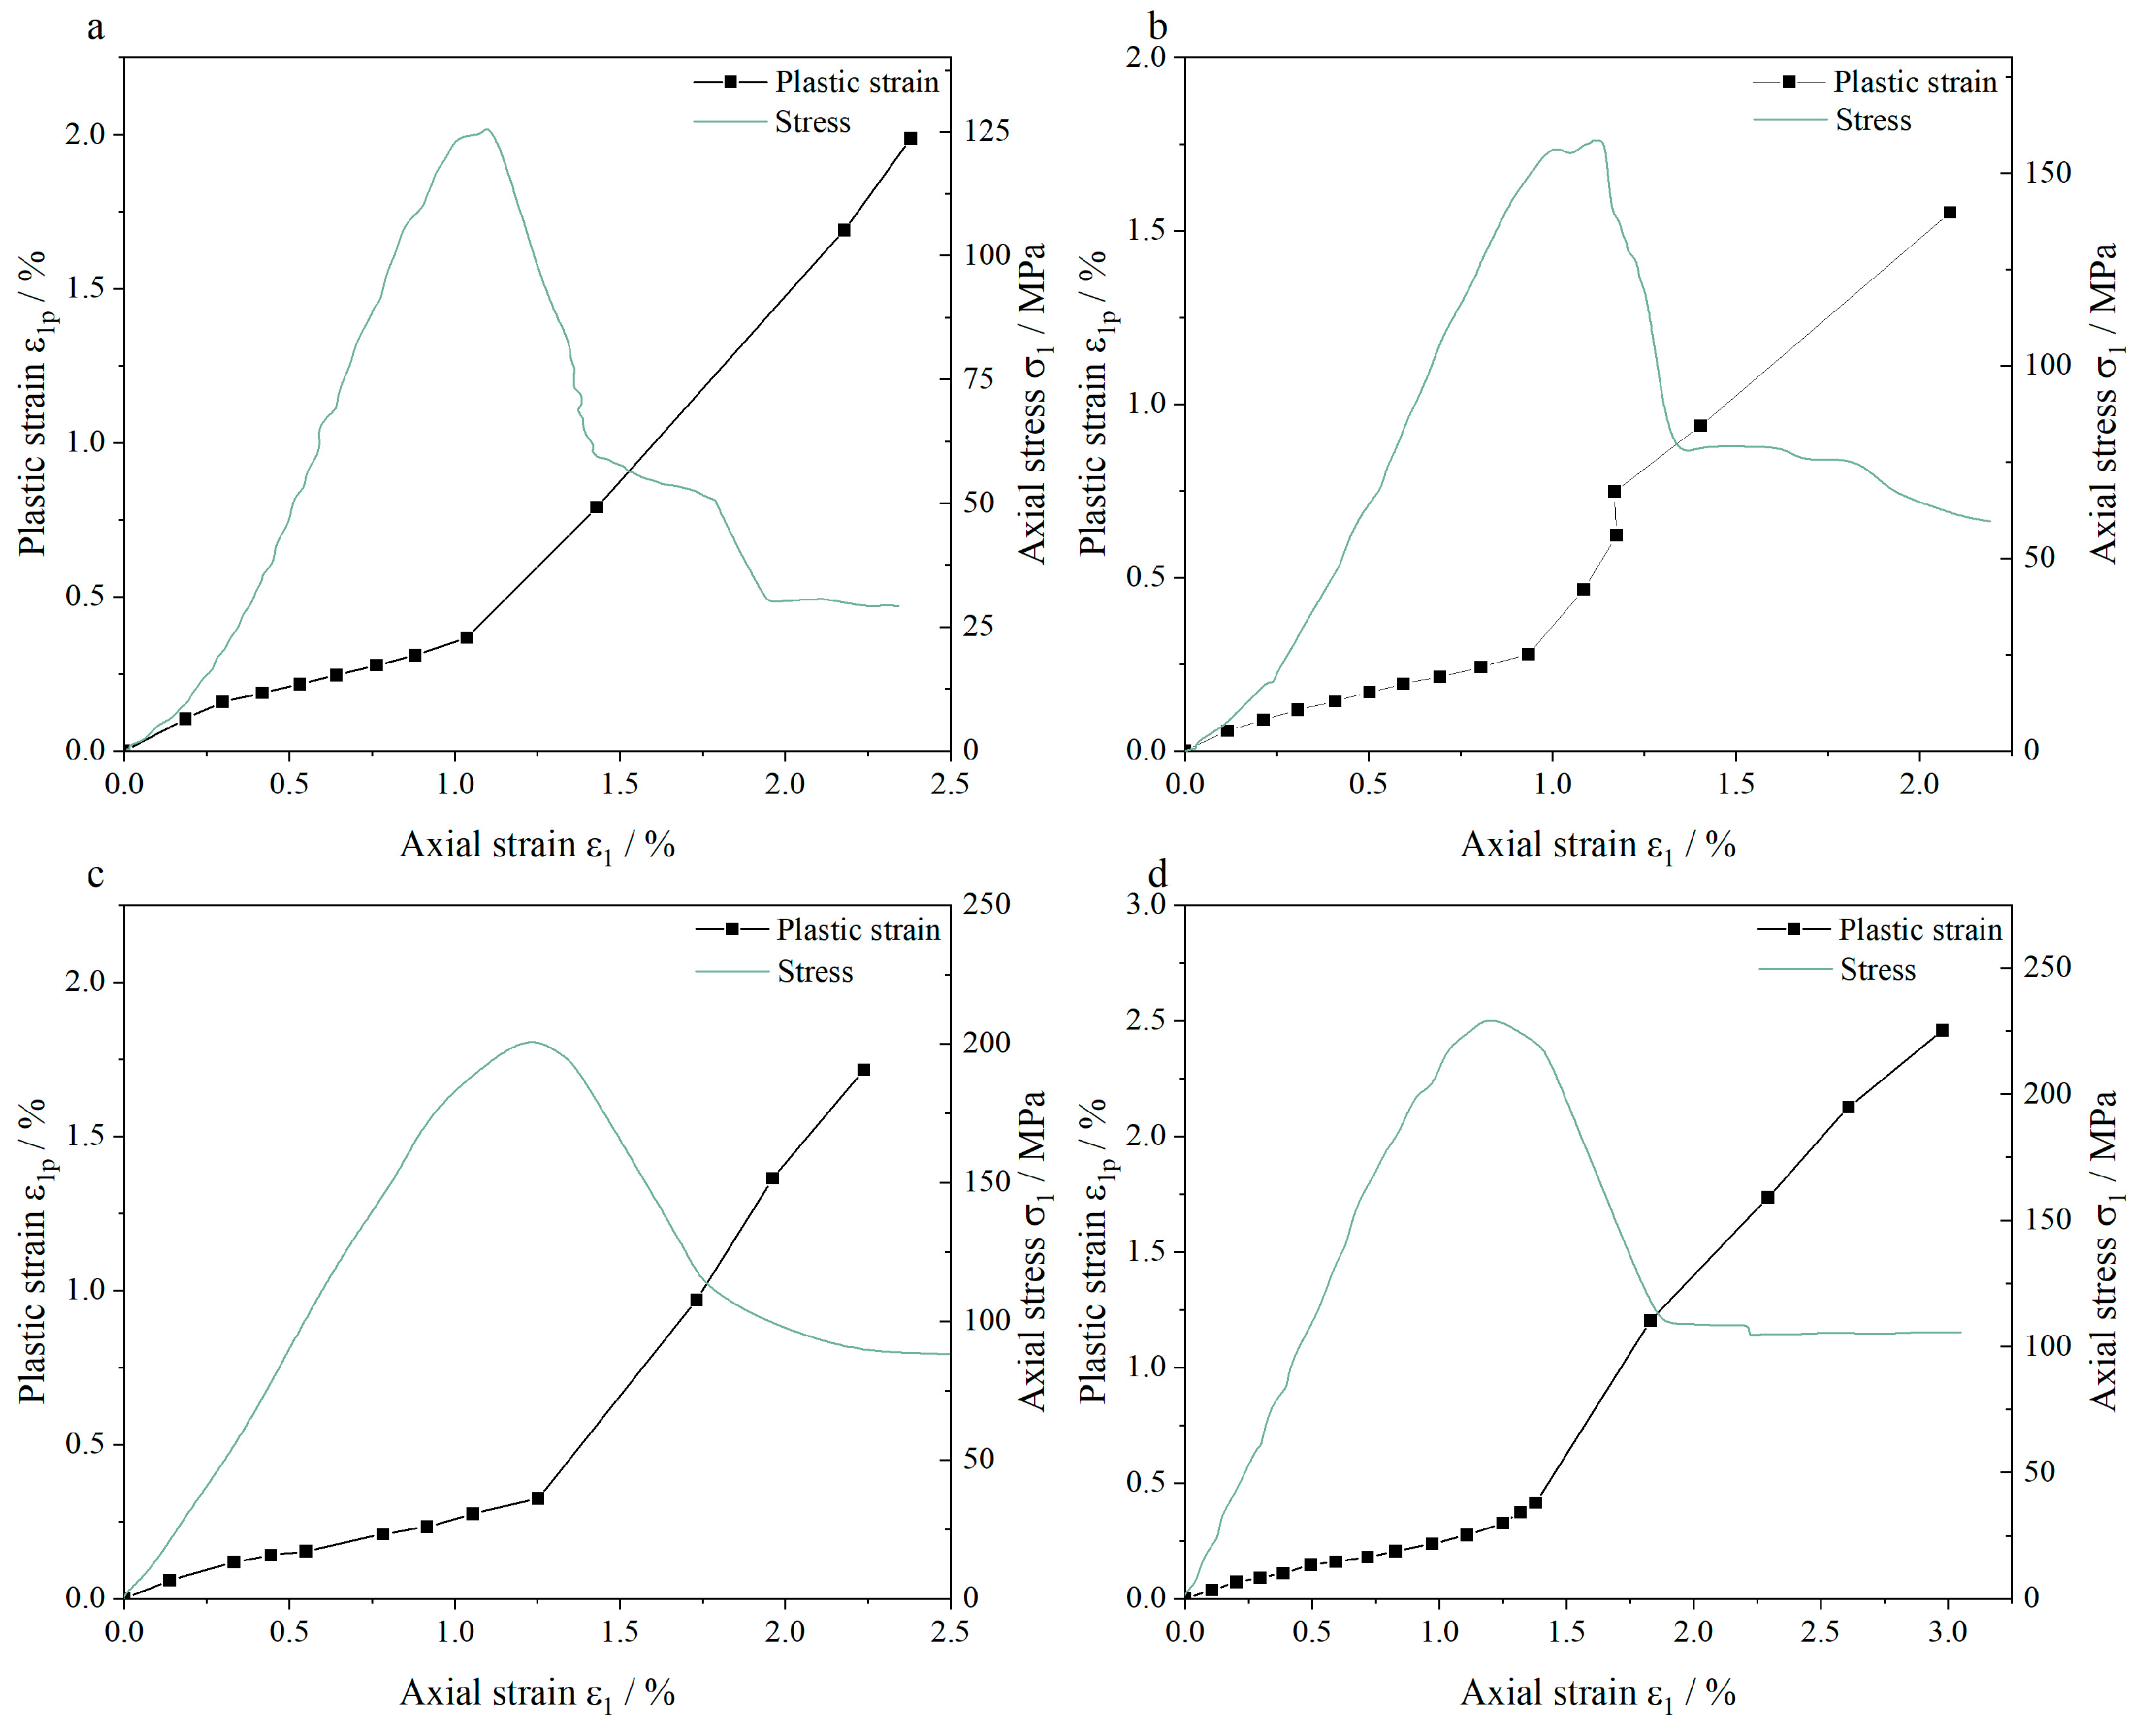
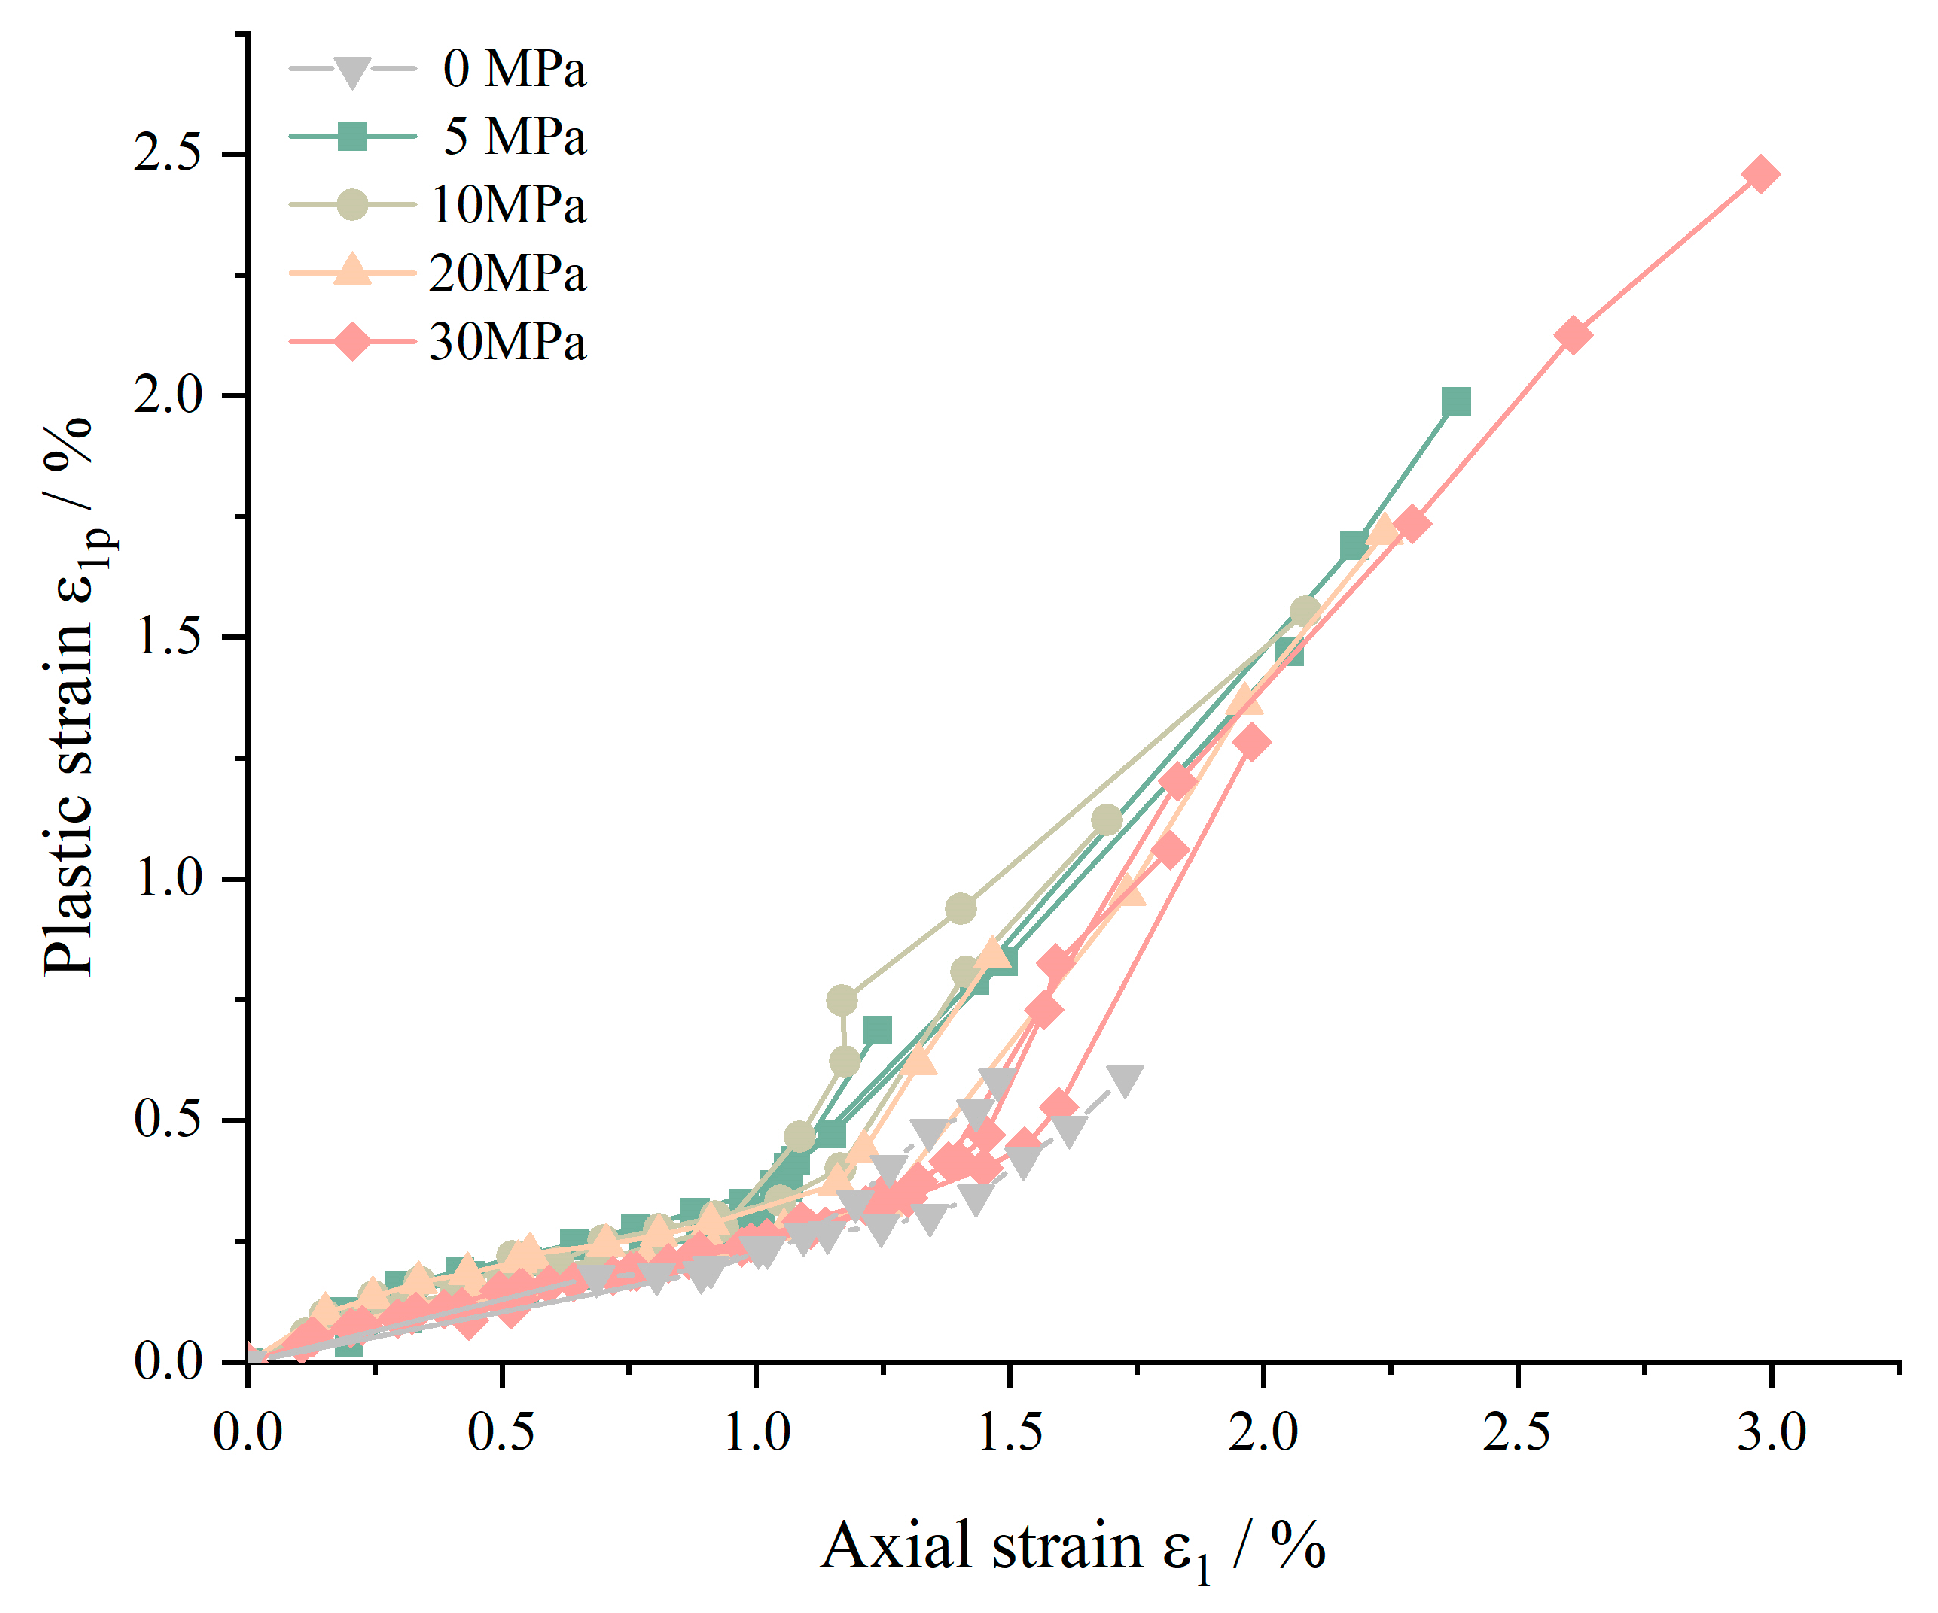
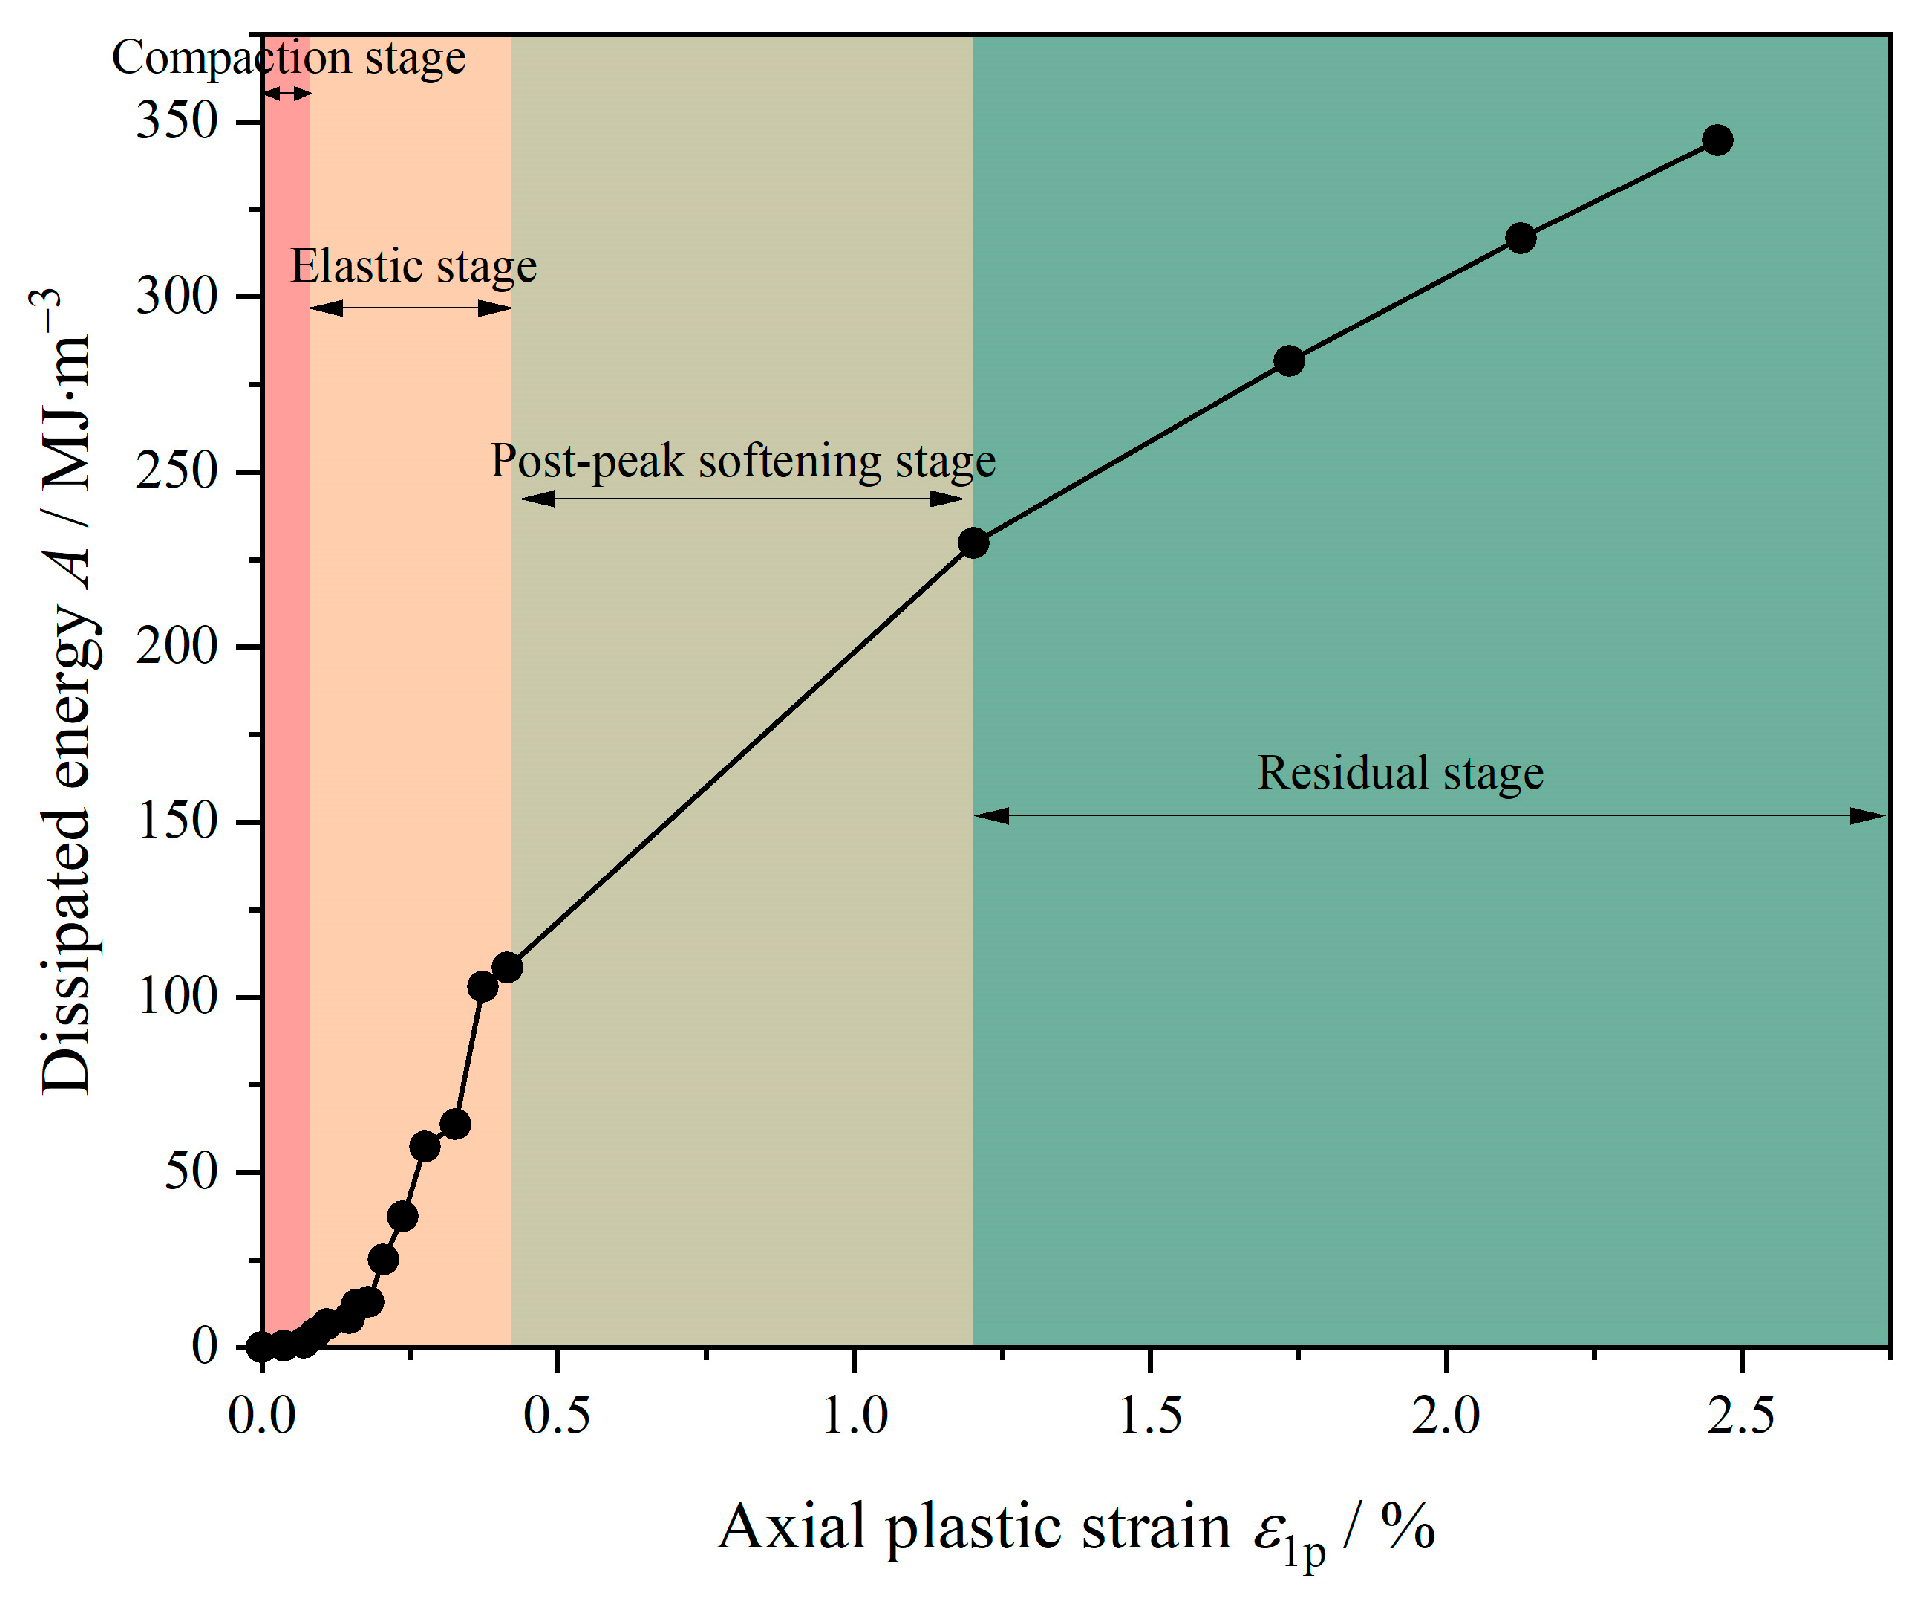
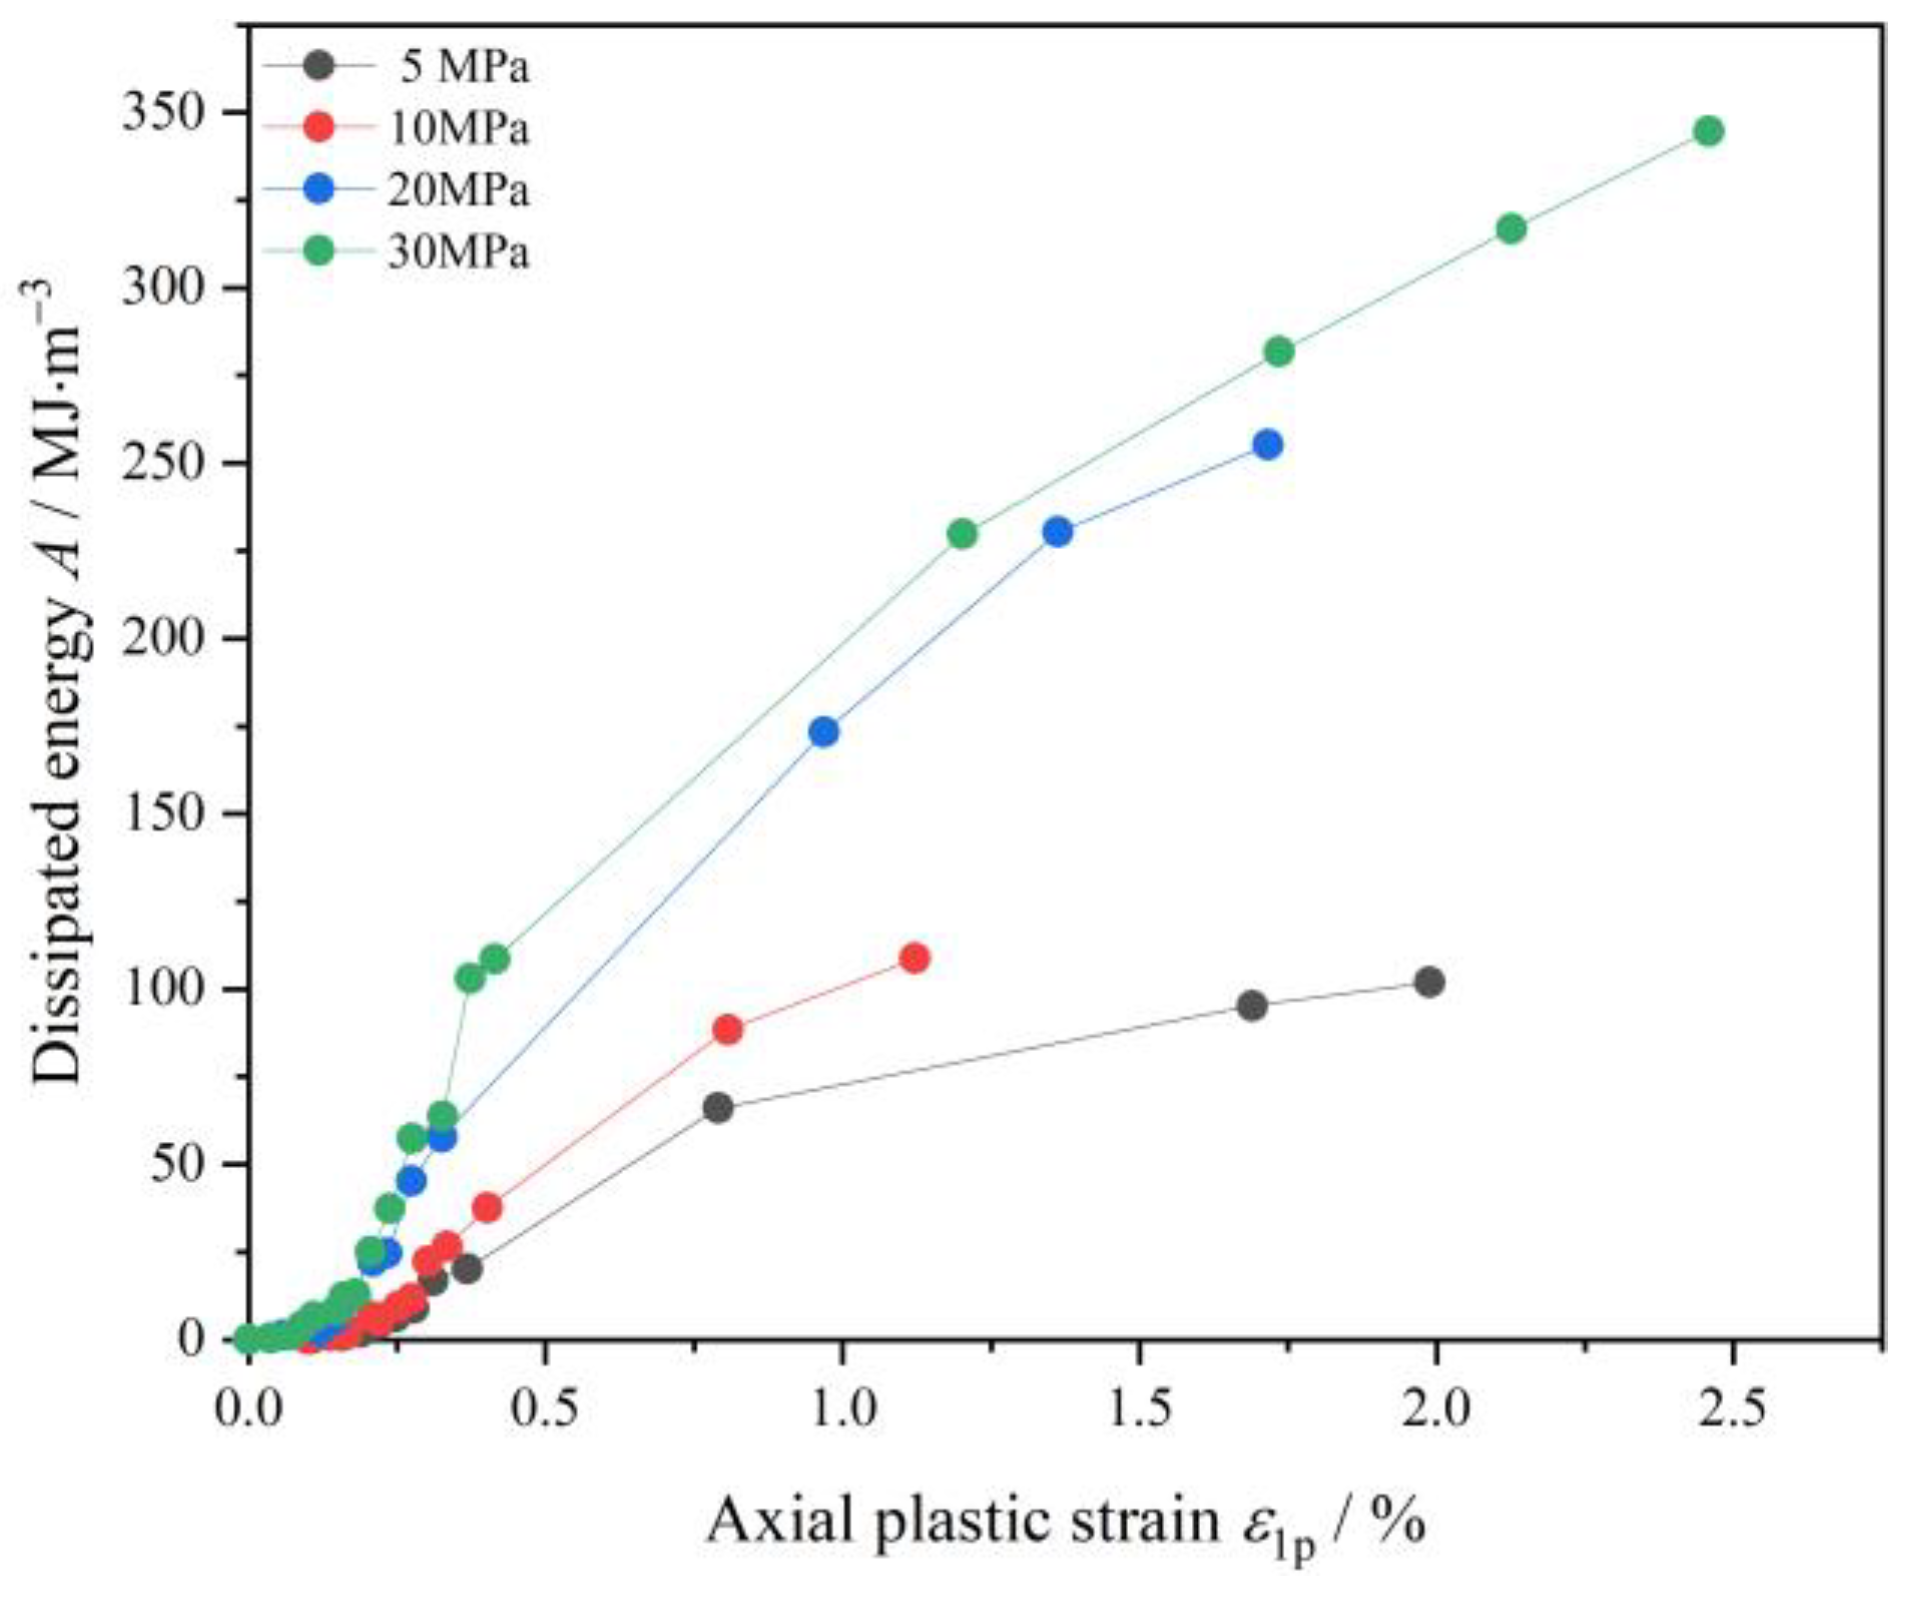
3.2. Plastic Deformation Evolution
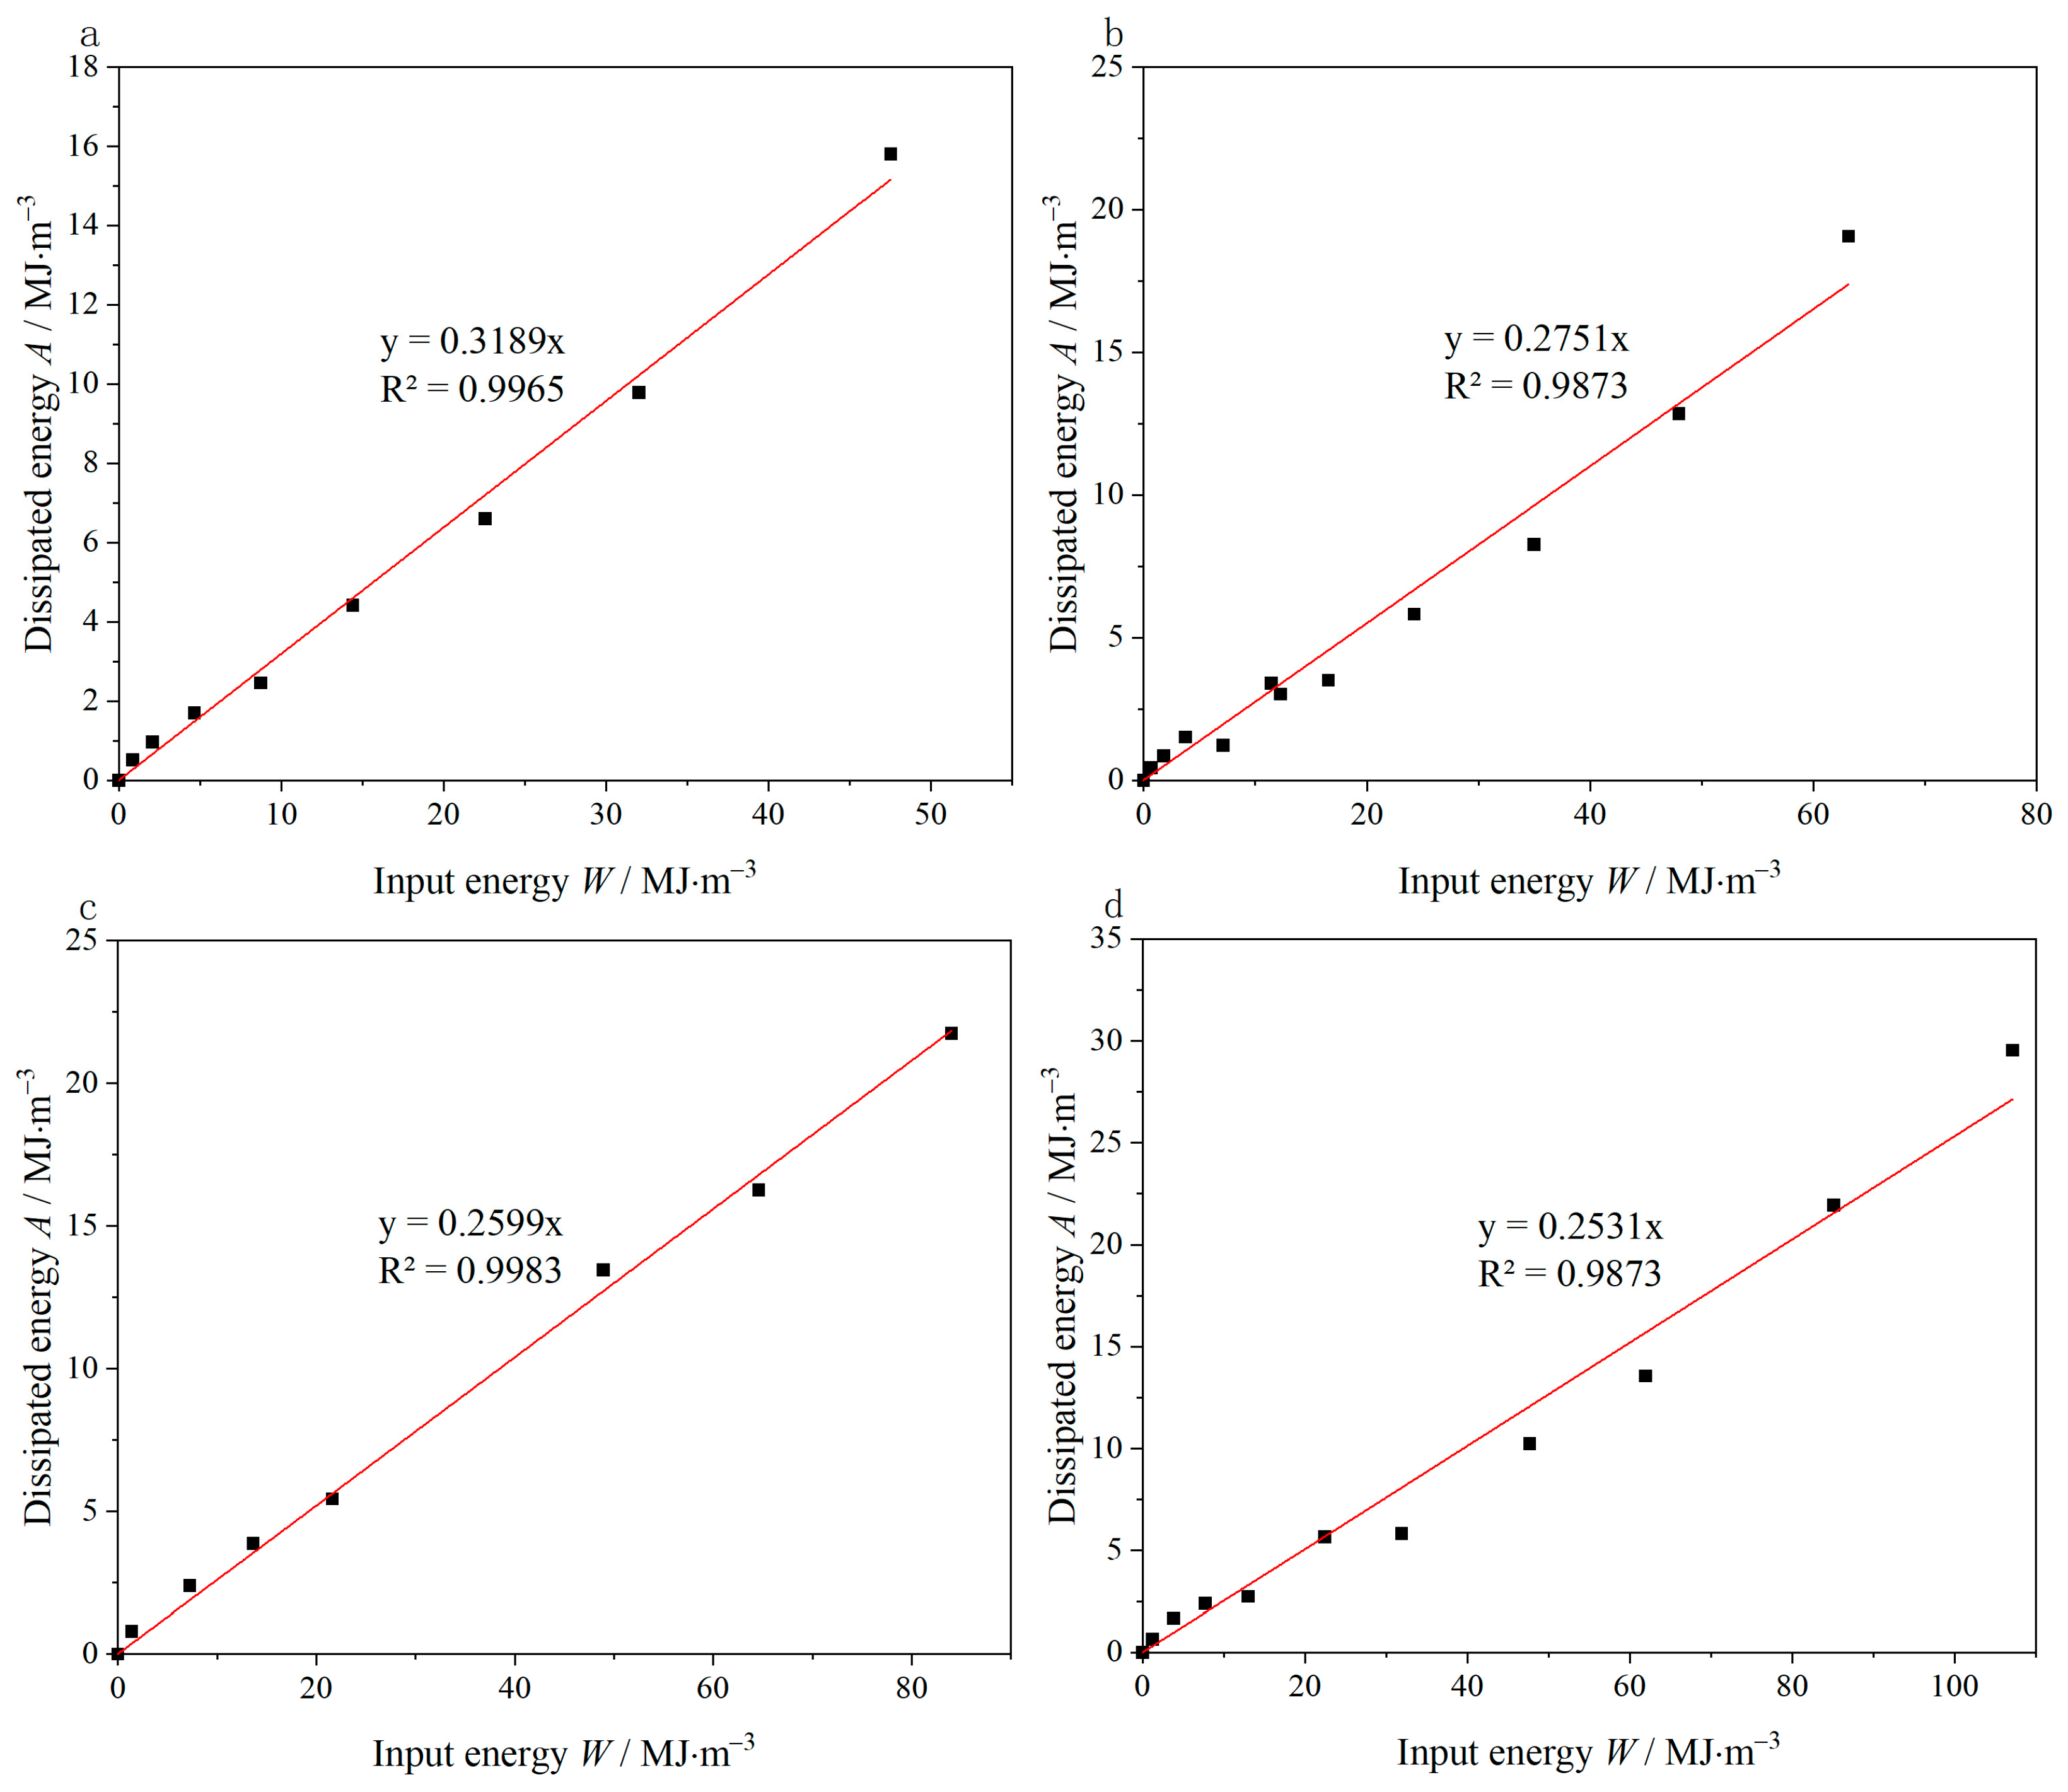
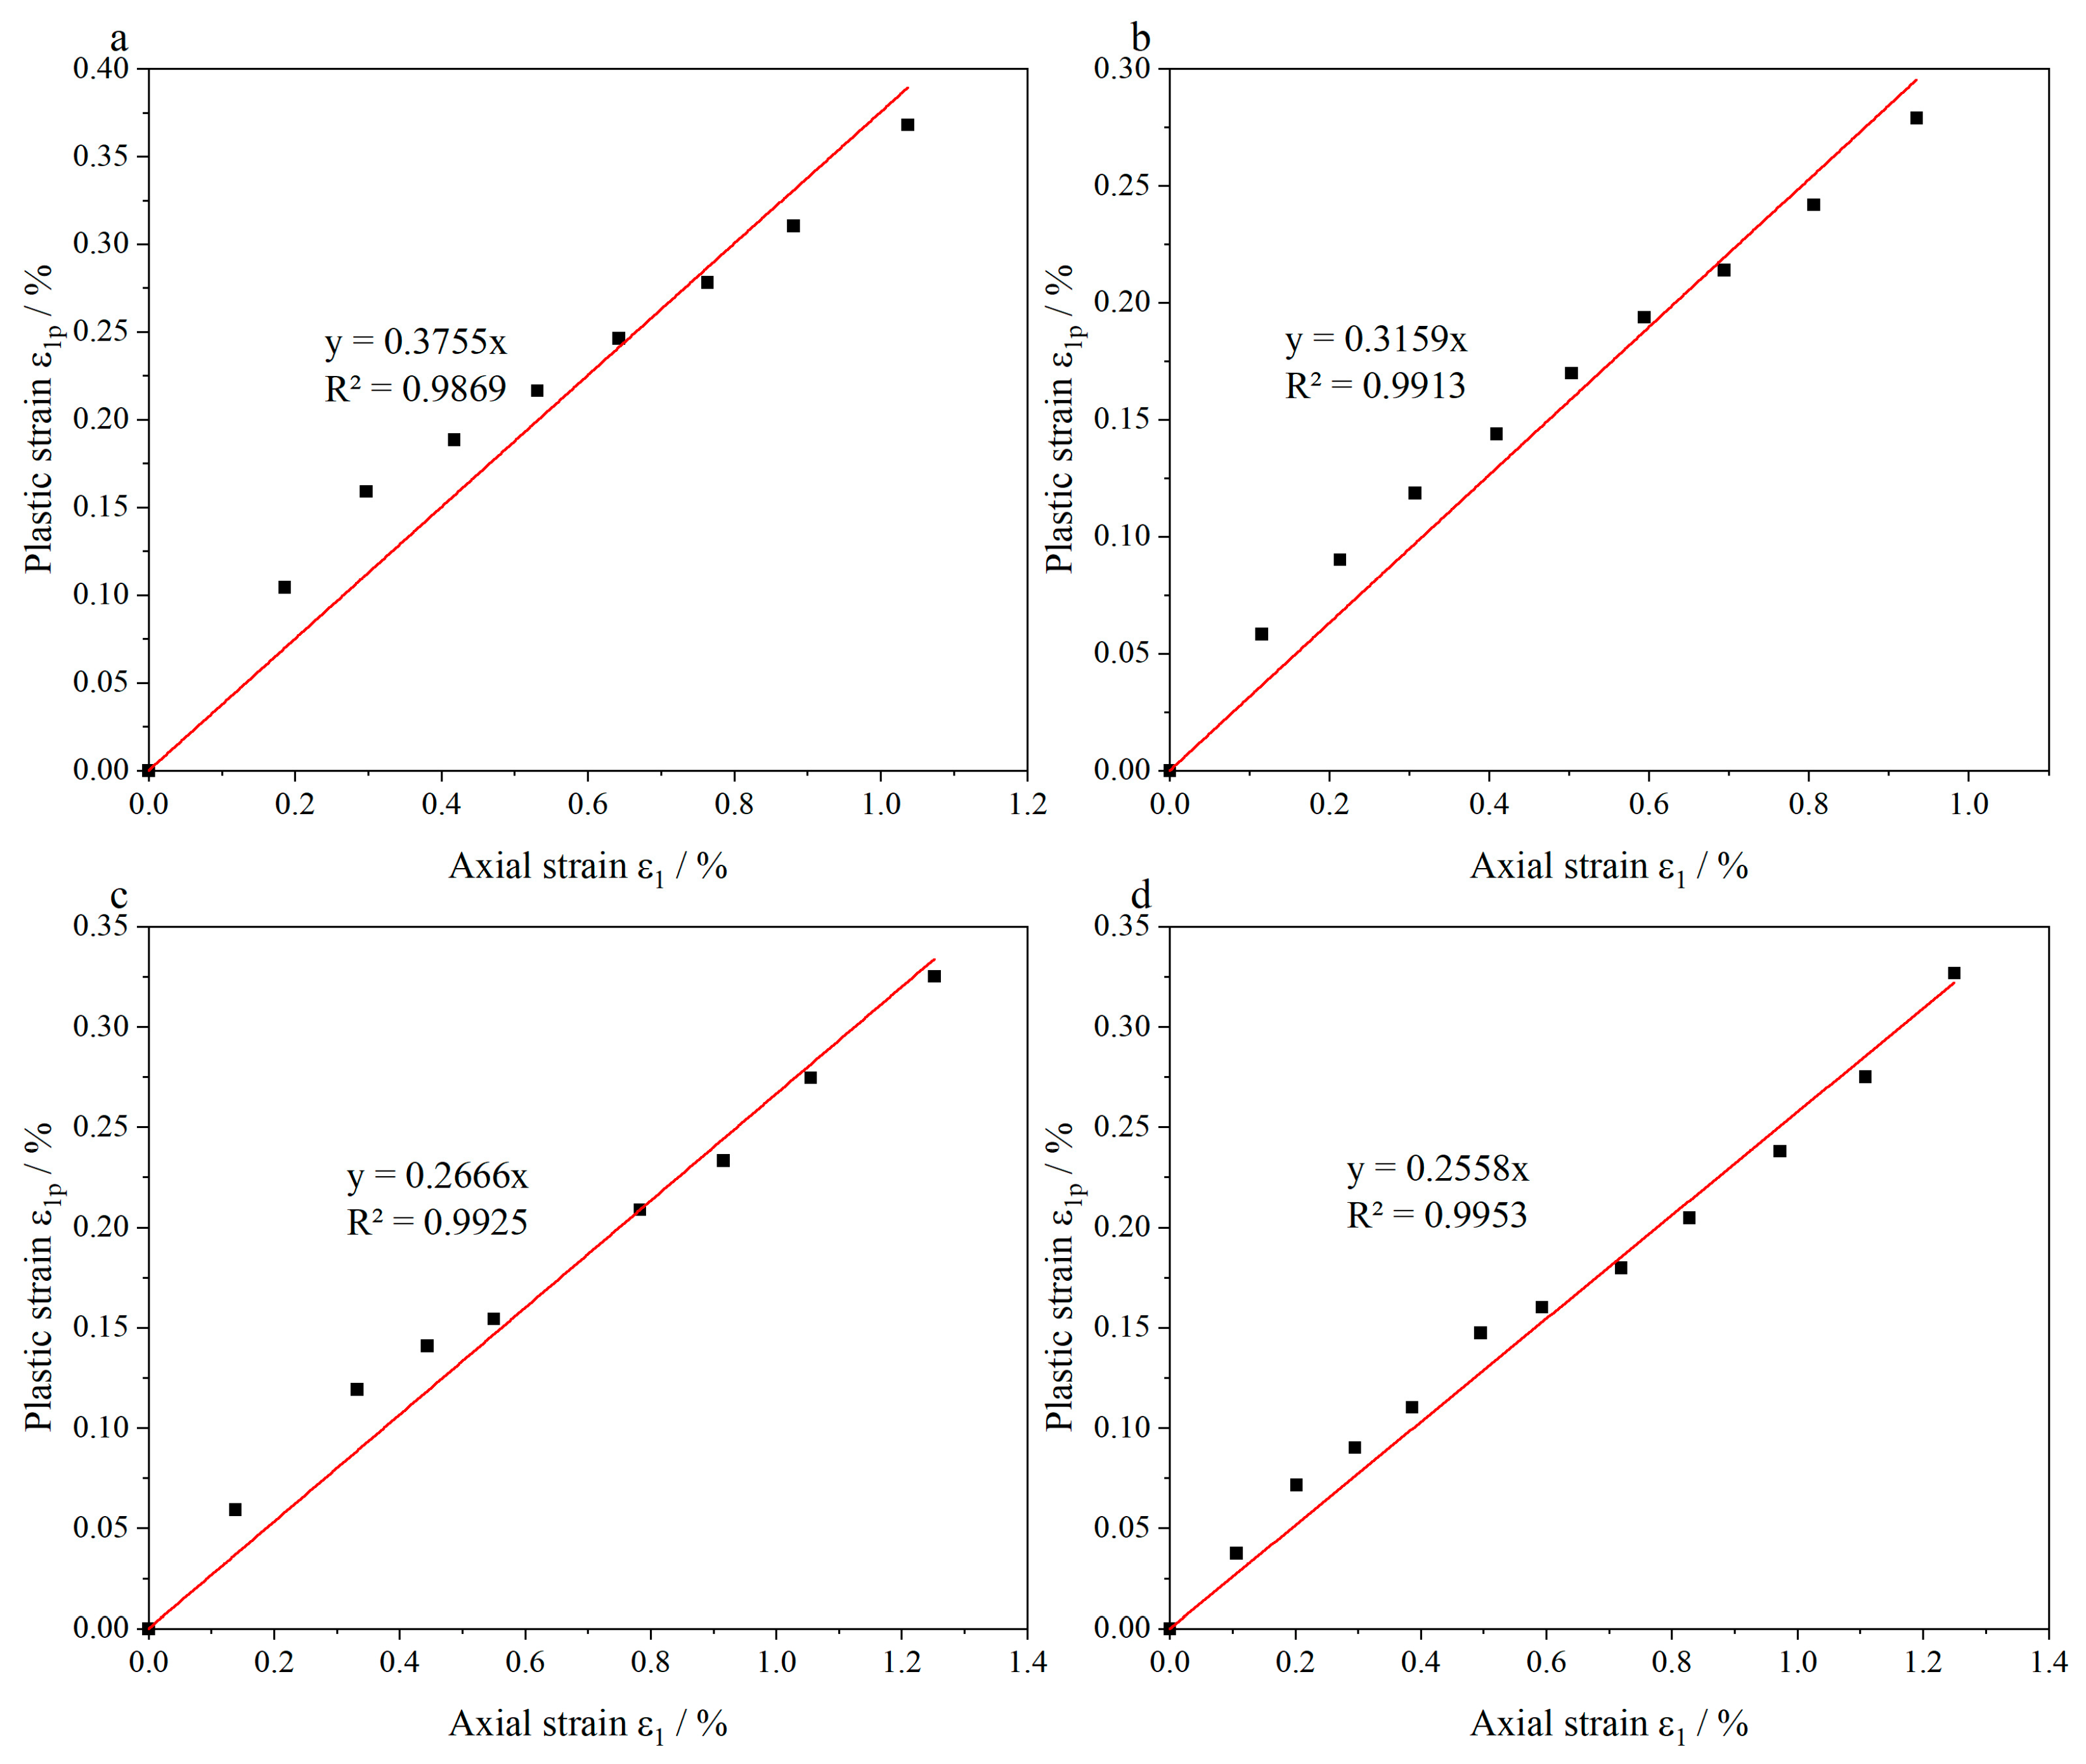
4. Analysis of Correlation Characteristics
- (1)
- Input energy
- (2)
- Elastic Energy
- (3)
- Dissipated energy
5. Damage Model and Numerical Test
5.1. Damage Model
5.2. Numerical Test
- (1)
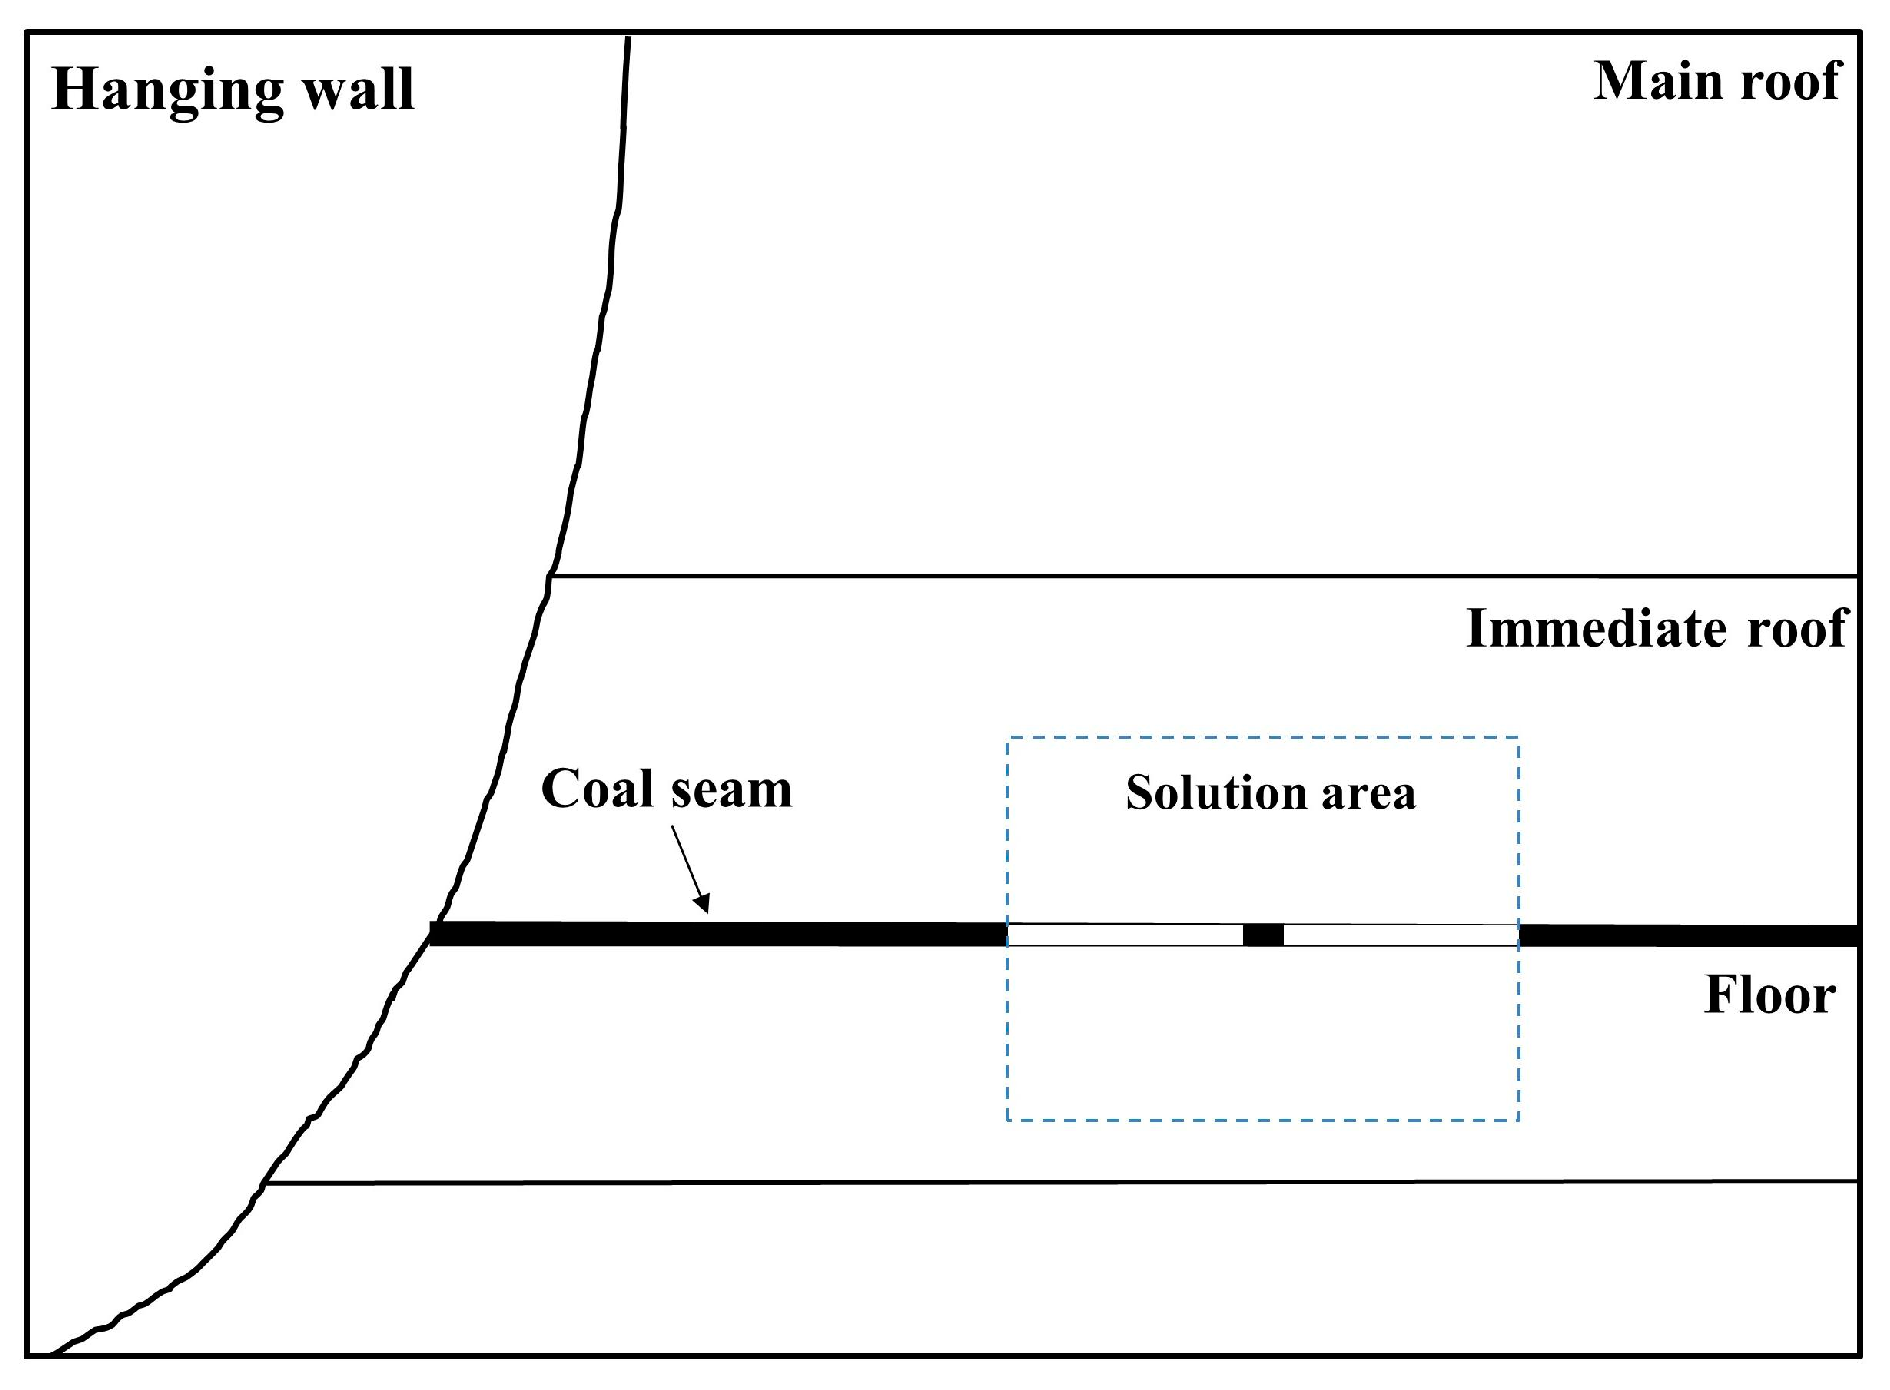
- Define constants, variables, and arrays. Input basic parameters and determine the solution area.
- (2)
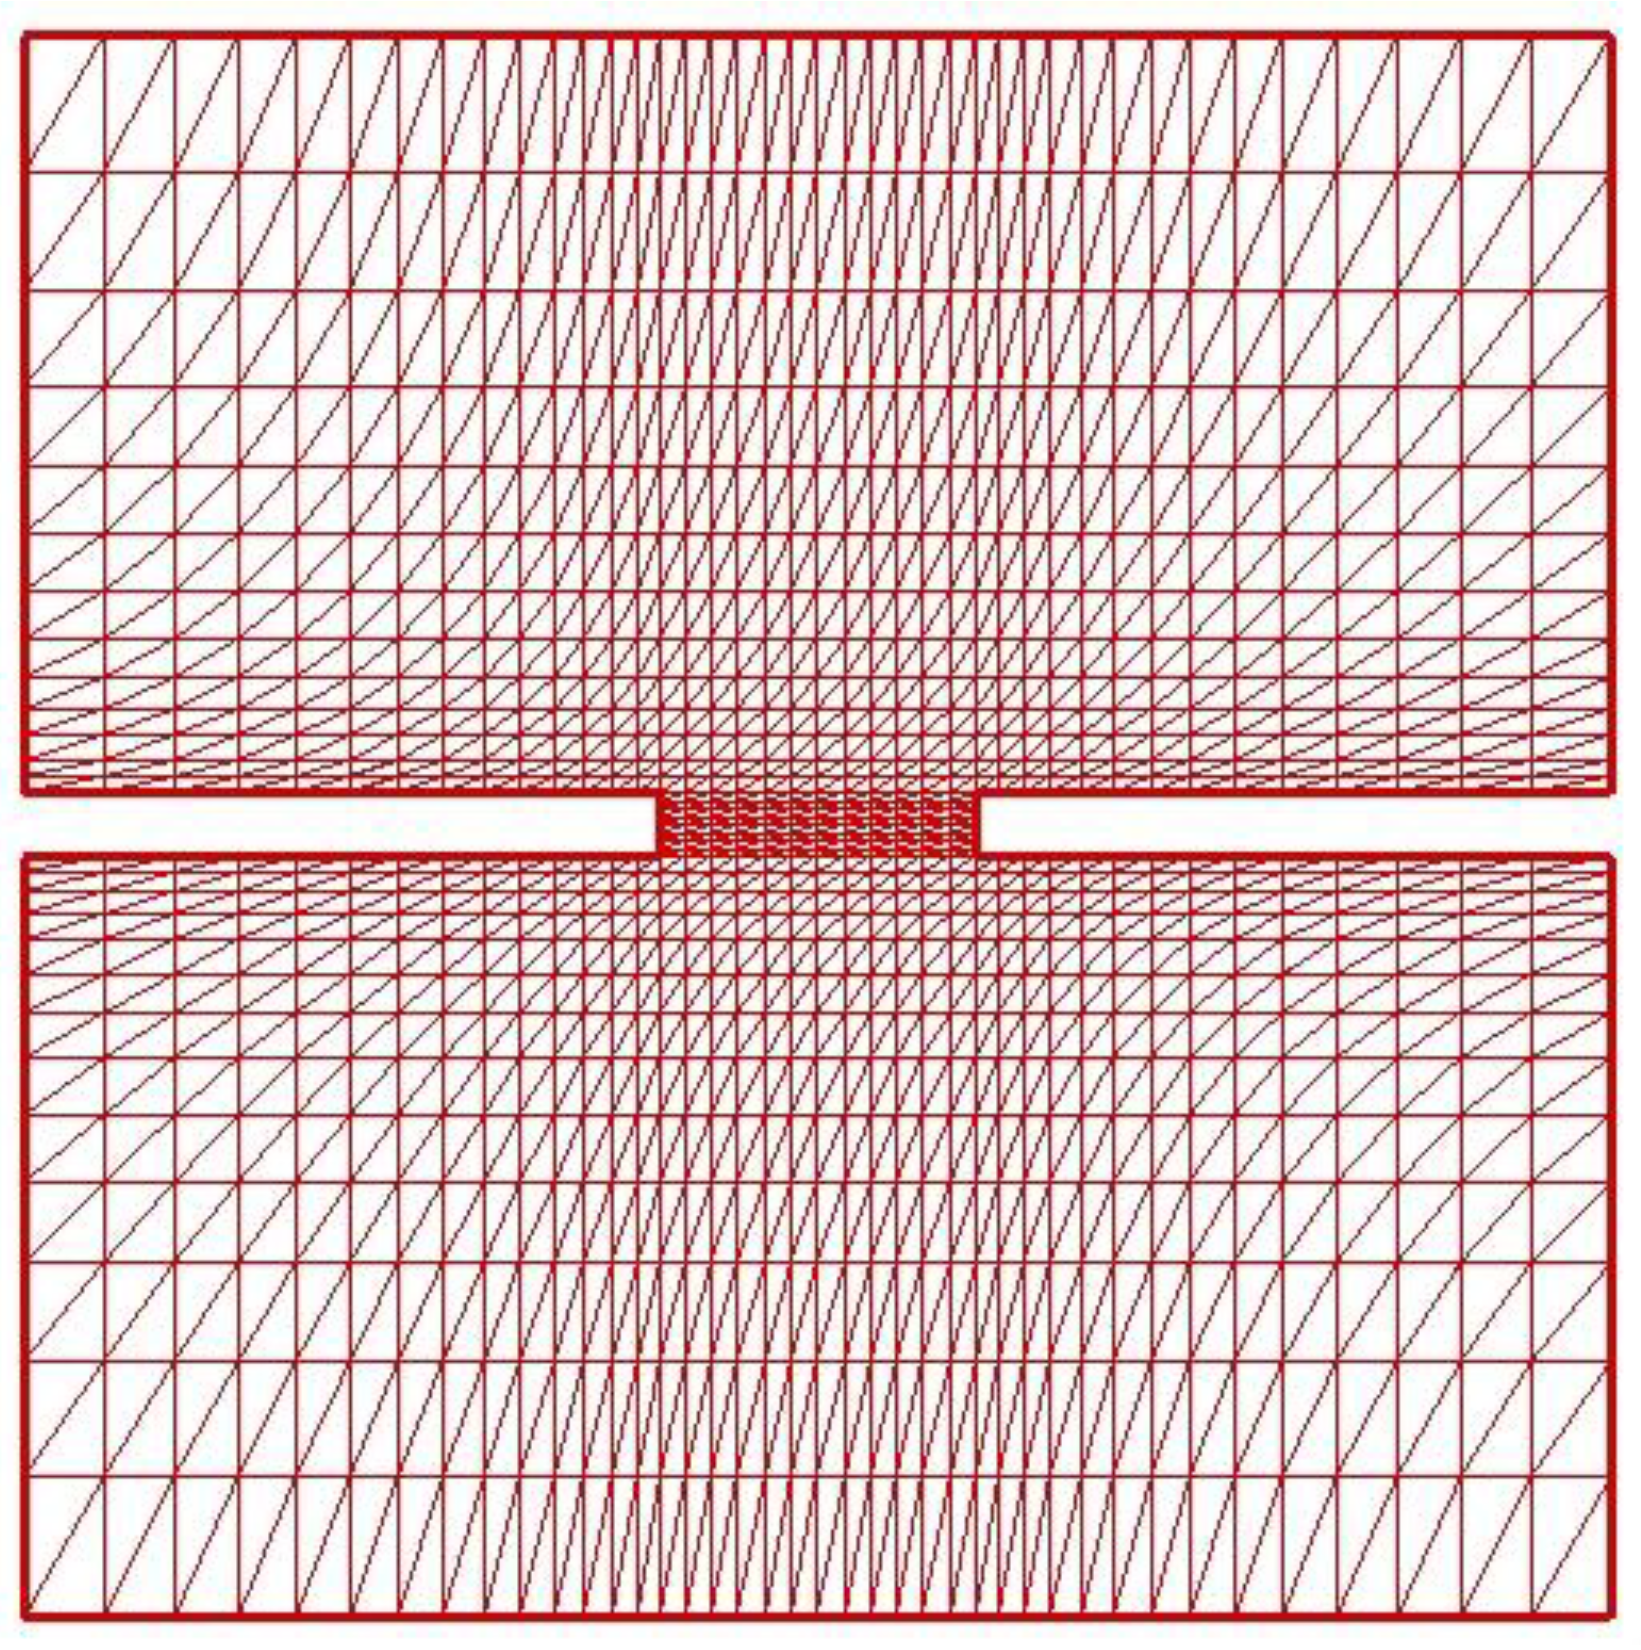
- Grid division can be carried out according to certain rules within the solution area, radiating from the inner boundary to the outer boundary of the solution area. The grid gradually changes from dense to sparse from the tunnel wall to the surrounding rock in the distance. After dividing the grid cells, associate the cells with nodes.
- (3)
- Select an appropriate control volume, with node displacement as an unknown variable, and integrate and form a stiffness matrix using the finite volume method.
- (4)
- When solving, first set boundary conditions and constraints. Start the iterative calculation with a preset time step; the damage can be solved using Equation (15) so that the elastic modulus can be updated. Then, calculate the displacement, strain, and stress of each unit at the new time step.
- (5)
- When the running time is greater than the set time or the damage is greater than or equal to 1, the iterative calculation is ended and the result is output.
6. Conclusions
- (1)
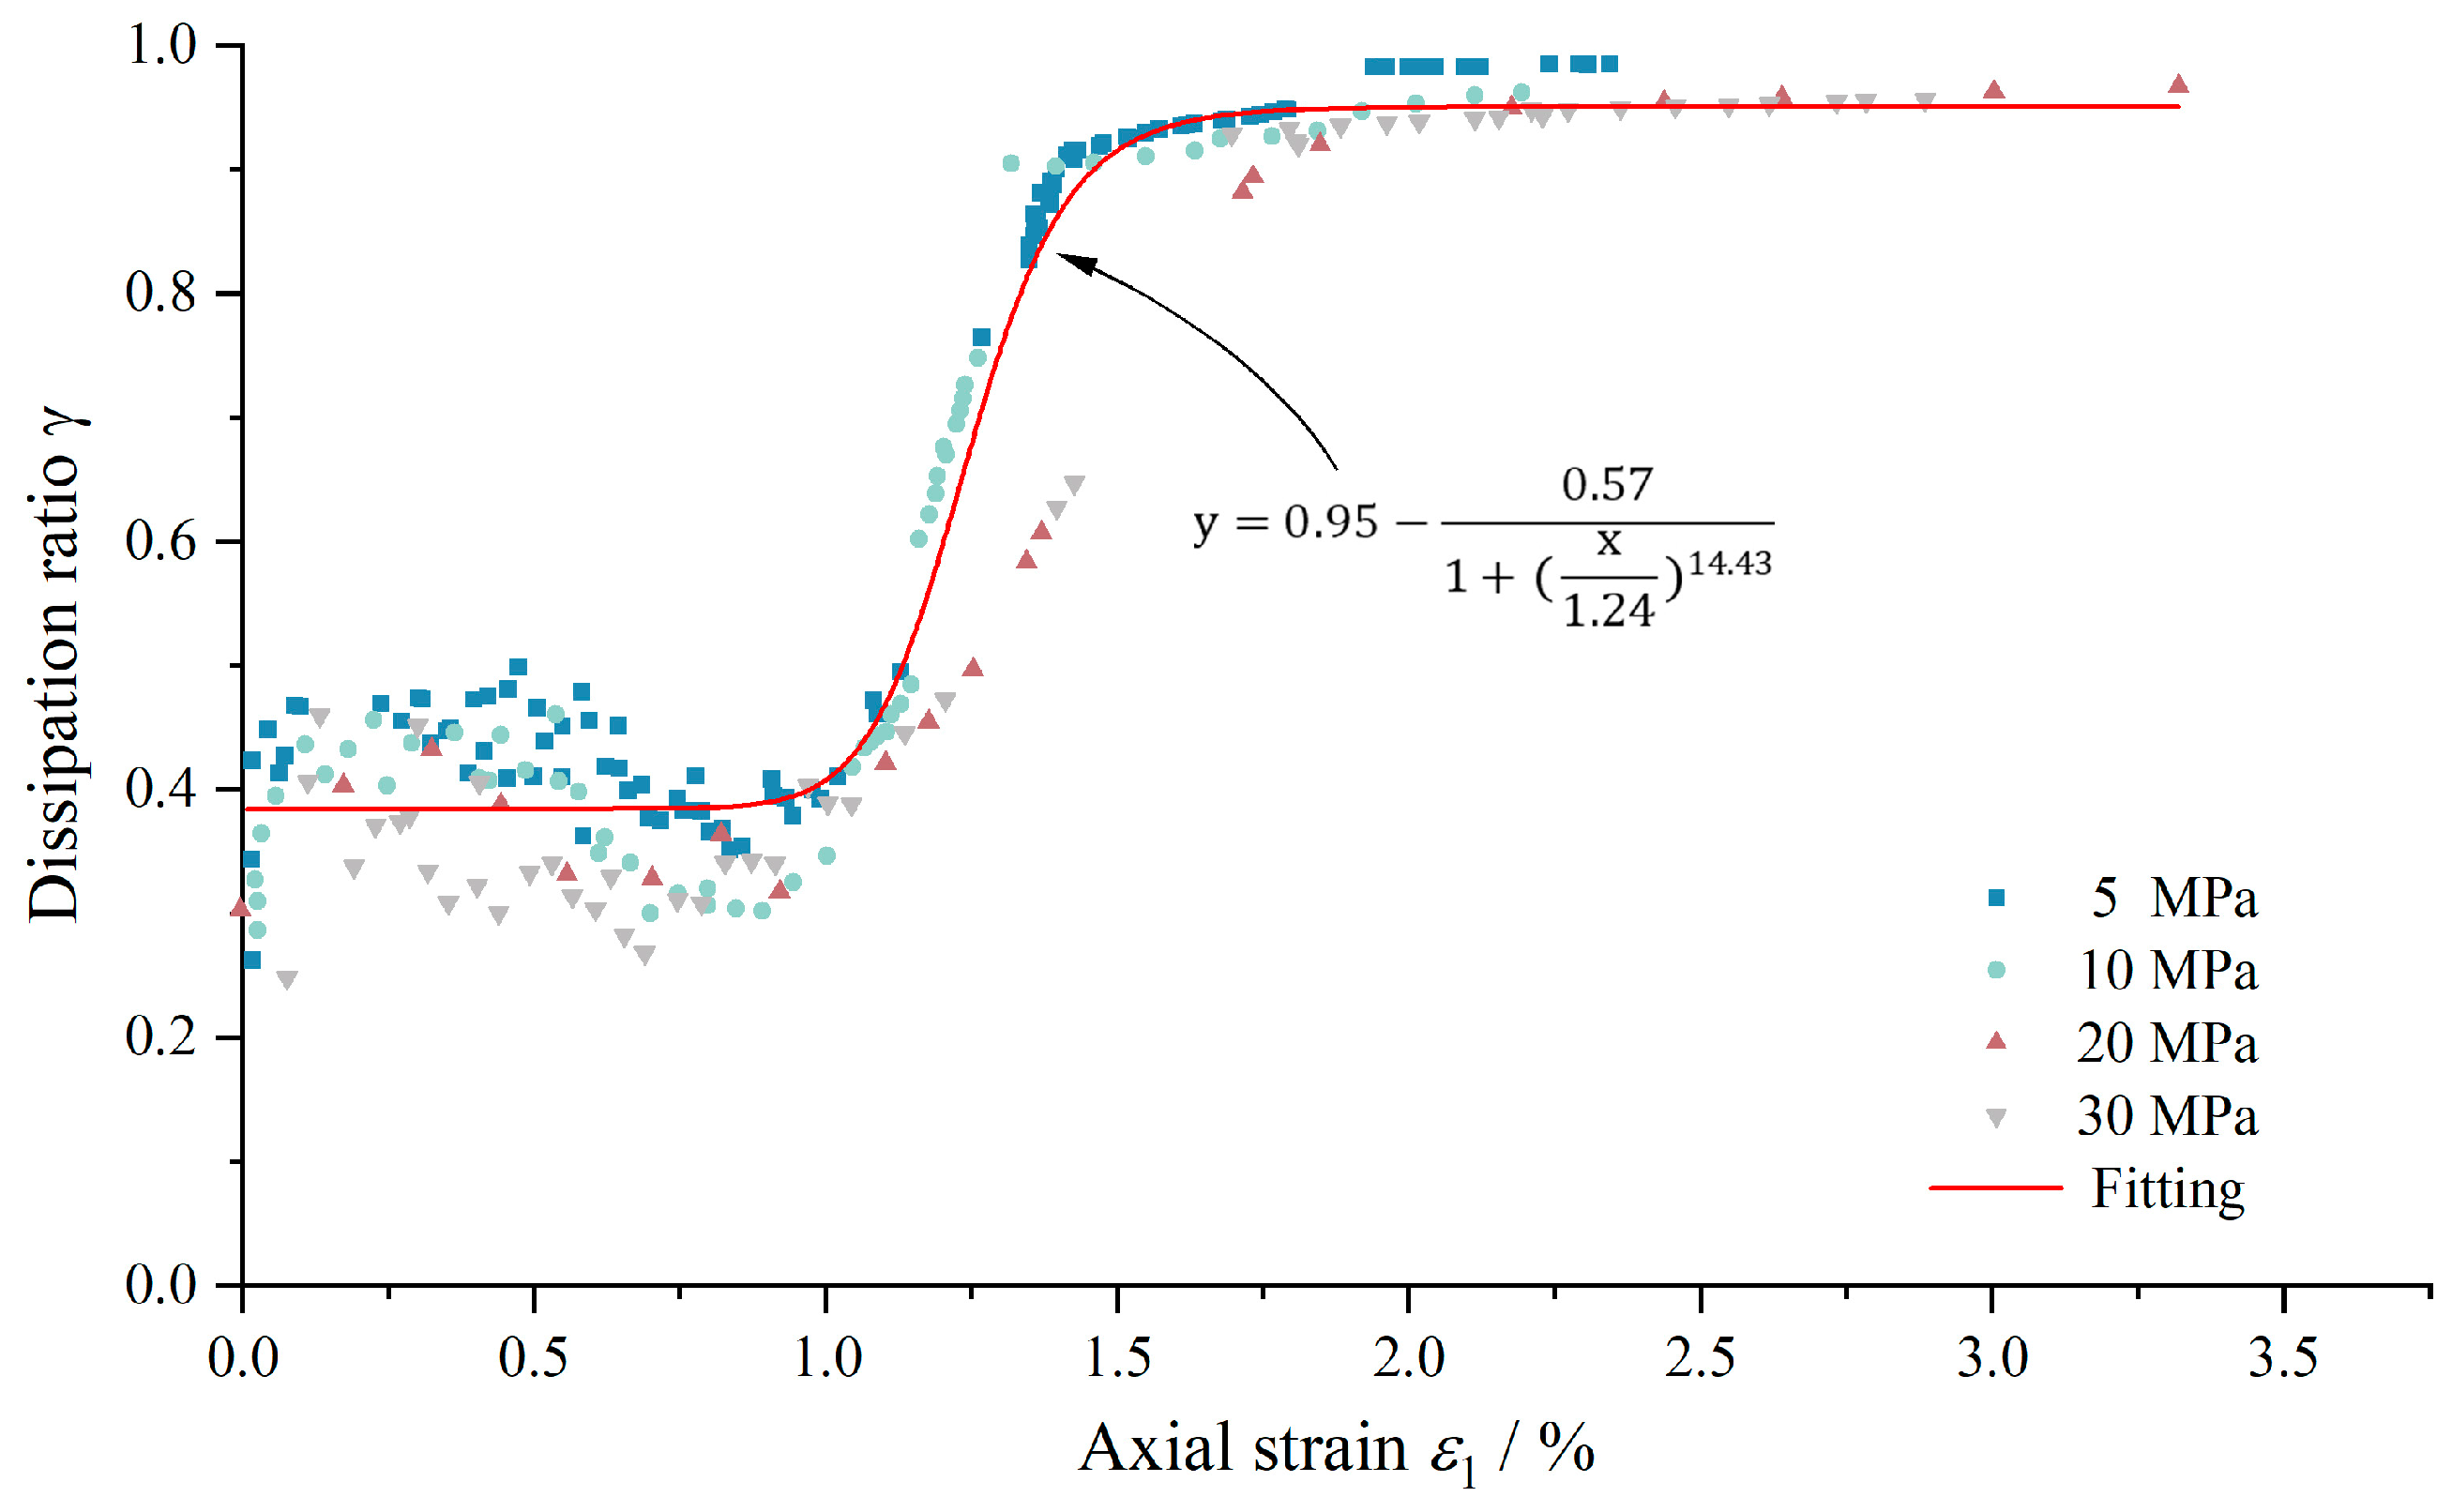
- Prior to reaching the stress peak, dissipated energy and plastic strain demonstrate a linear increase with input energy and axial strain. The conversion ratio of input energy to dissipated energy aligns closely with the transformation ratio of axial strain to plastic strain. In the residual stress stage, the growth trends of plastic strain under different confining pressures exhibit similarities, with comparable growth rates.
- (2)
- By introducing the elastic energy correction parameter, a method for estimating the input energy, elastic energy, and dissipated energy during the rock damage process was proposed, and it was validated using experimental results. A plastic strain estimation method based on the evolution mechanism of dissipated energy was also proposed, which enables the calculation of plastic deformation at any given time during the rock damage evolution process.
- (3)
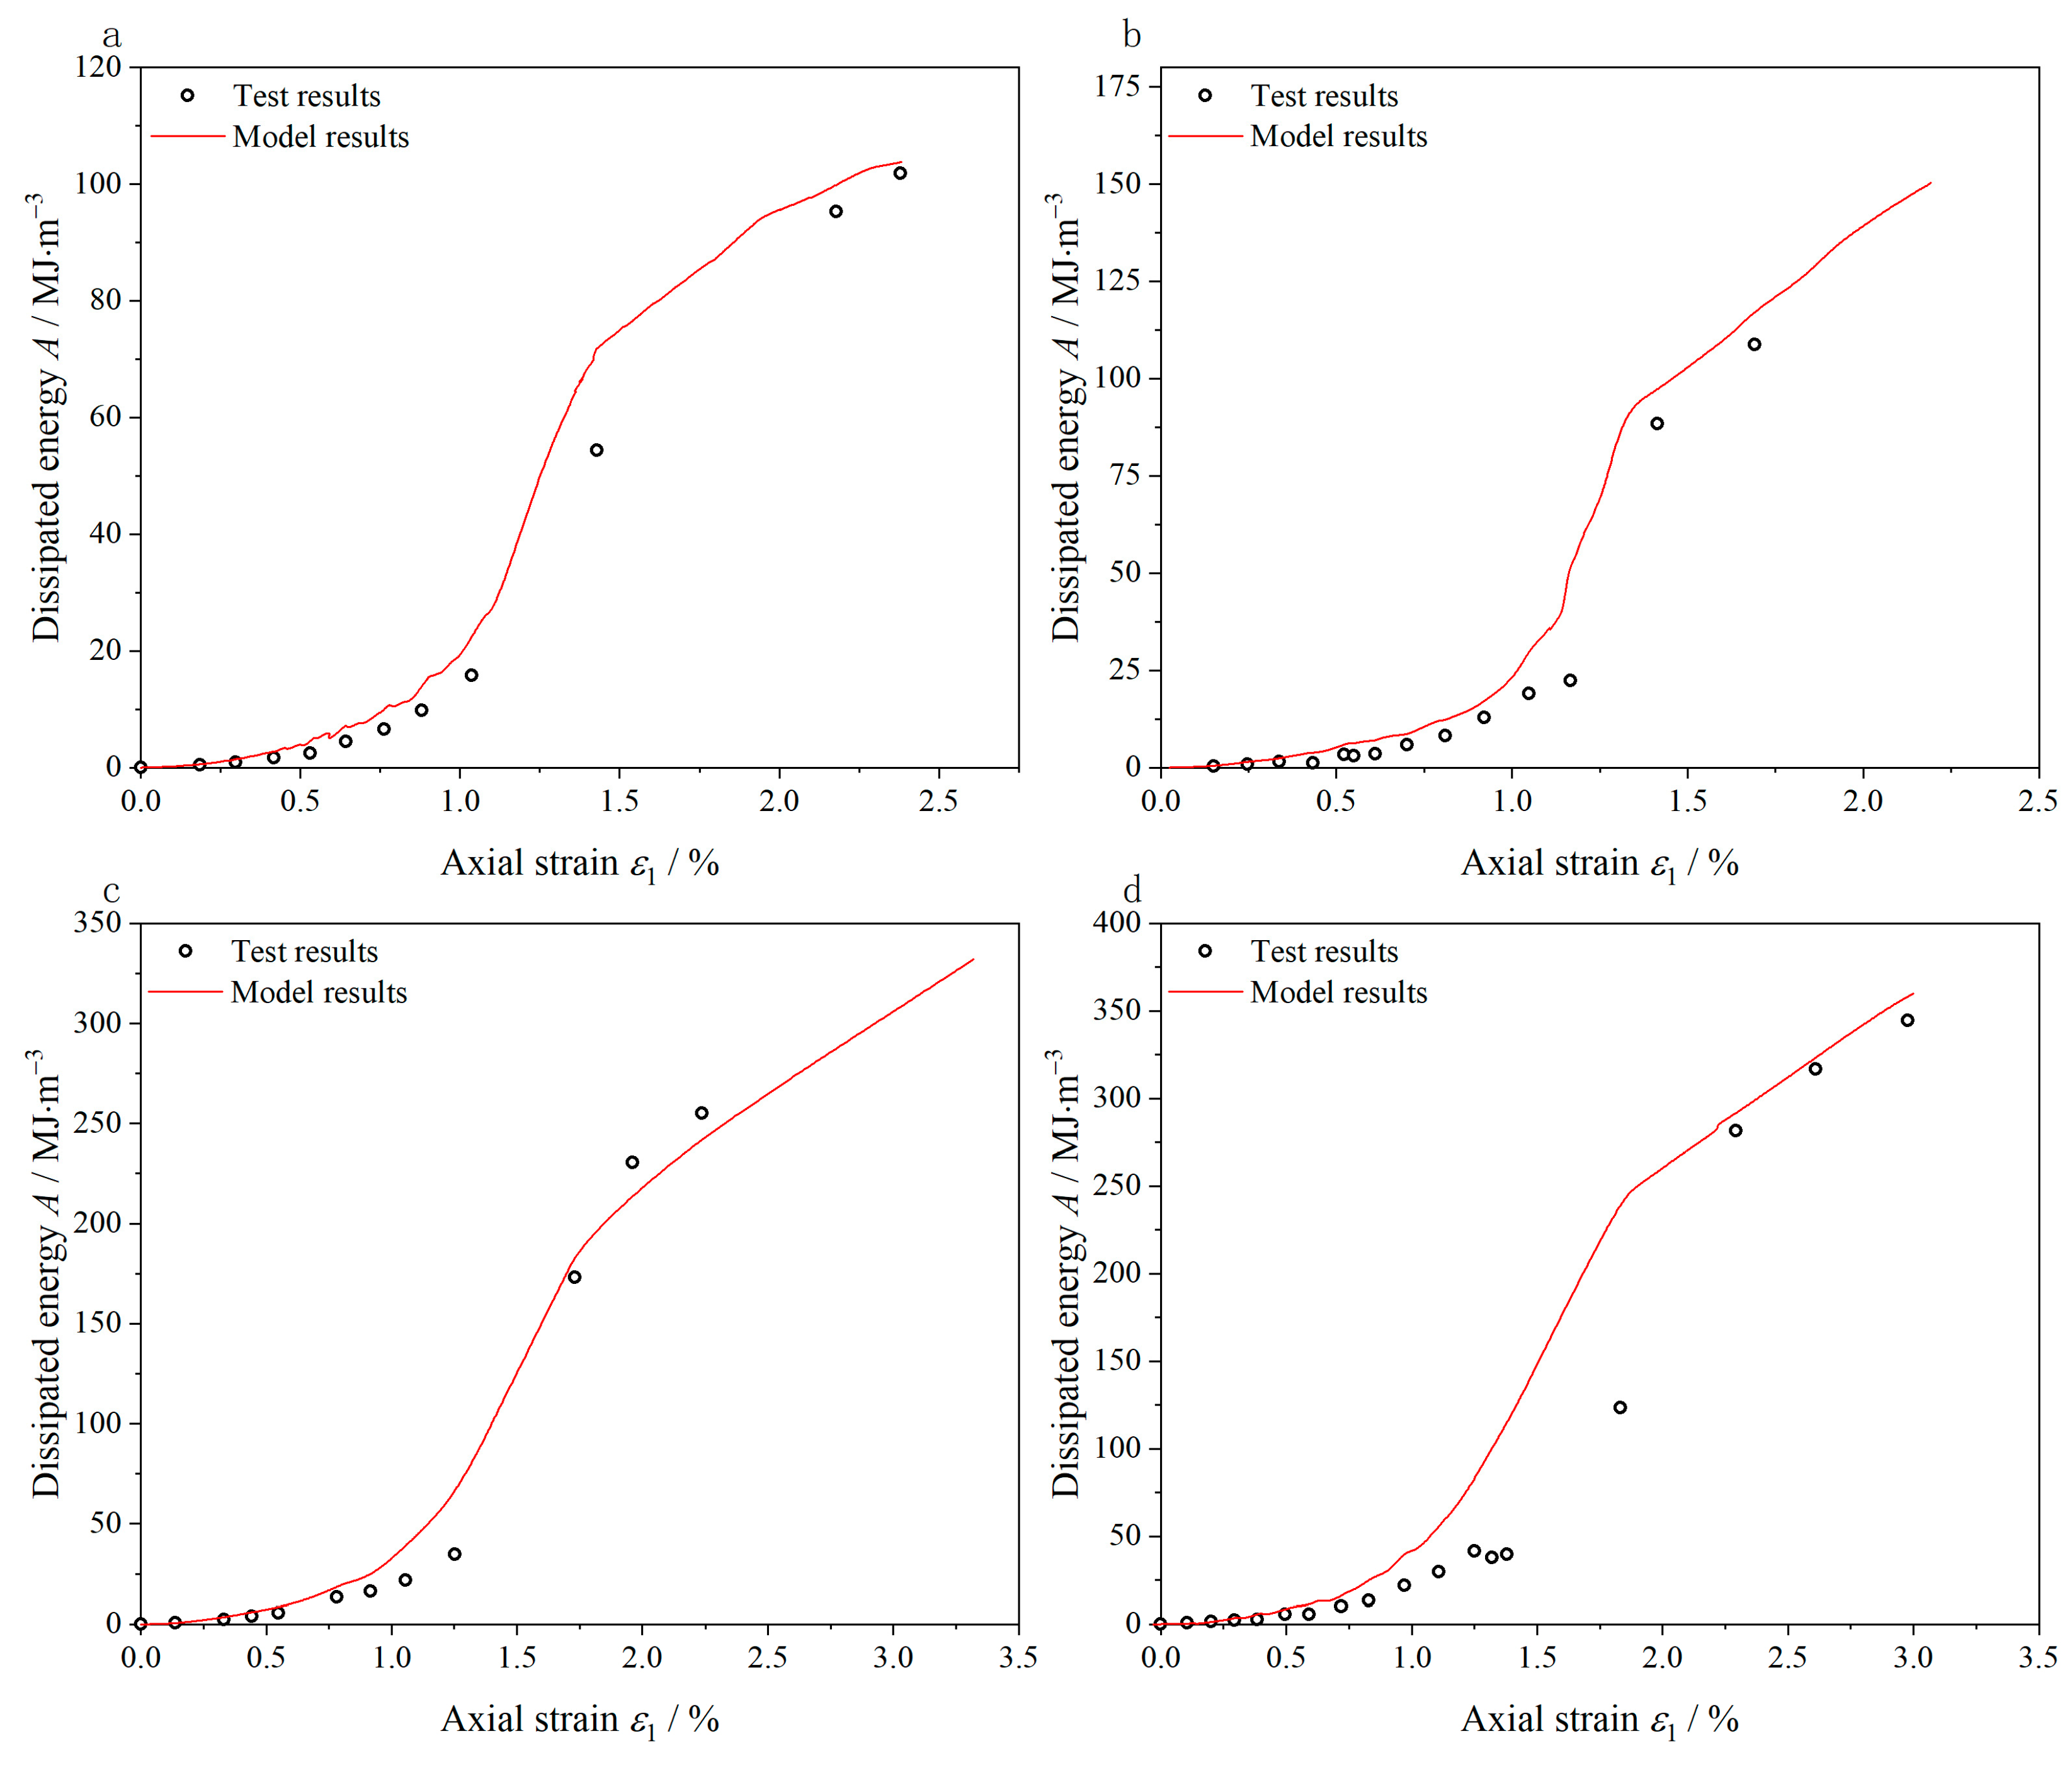
- An improved rock damage model was proposed based on the correlation characteristics of energy dissipation and plastic growth in this work. The model can reflect the rock damage evolution process under different confining pressures, and the model error mainly exists in the instability process of rock near the peak stress.
- (4)
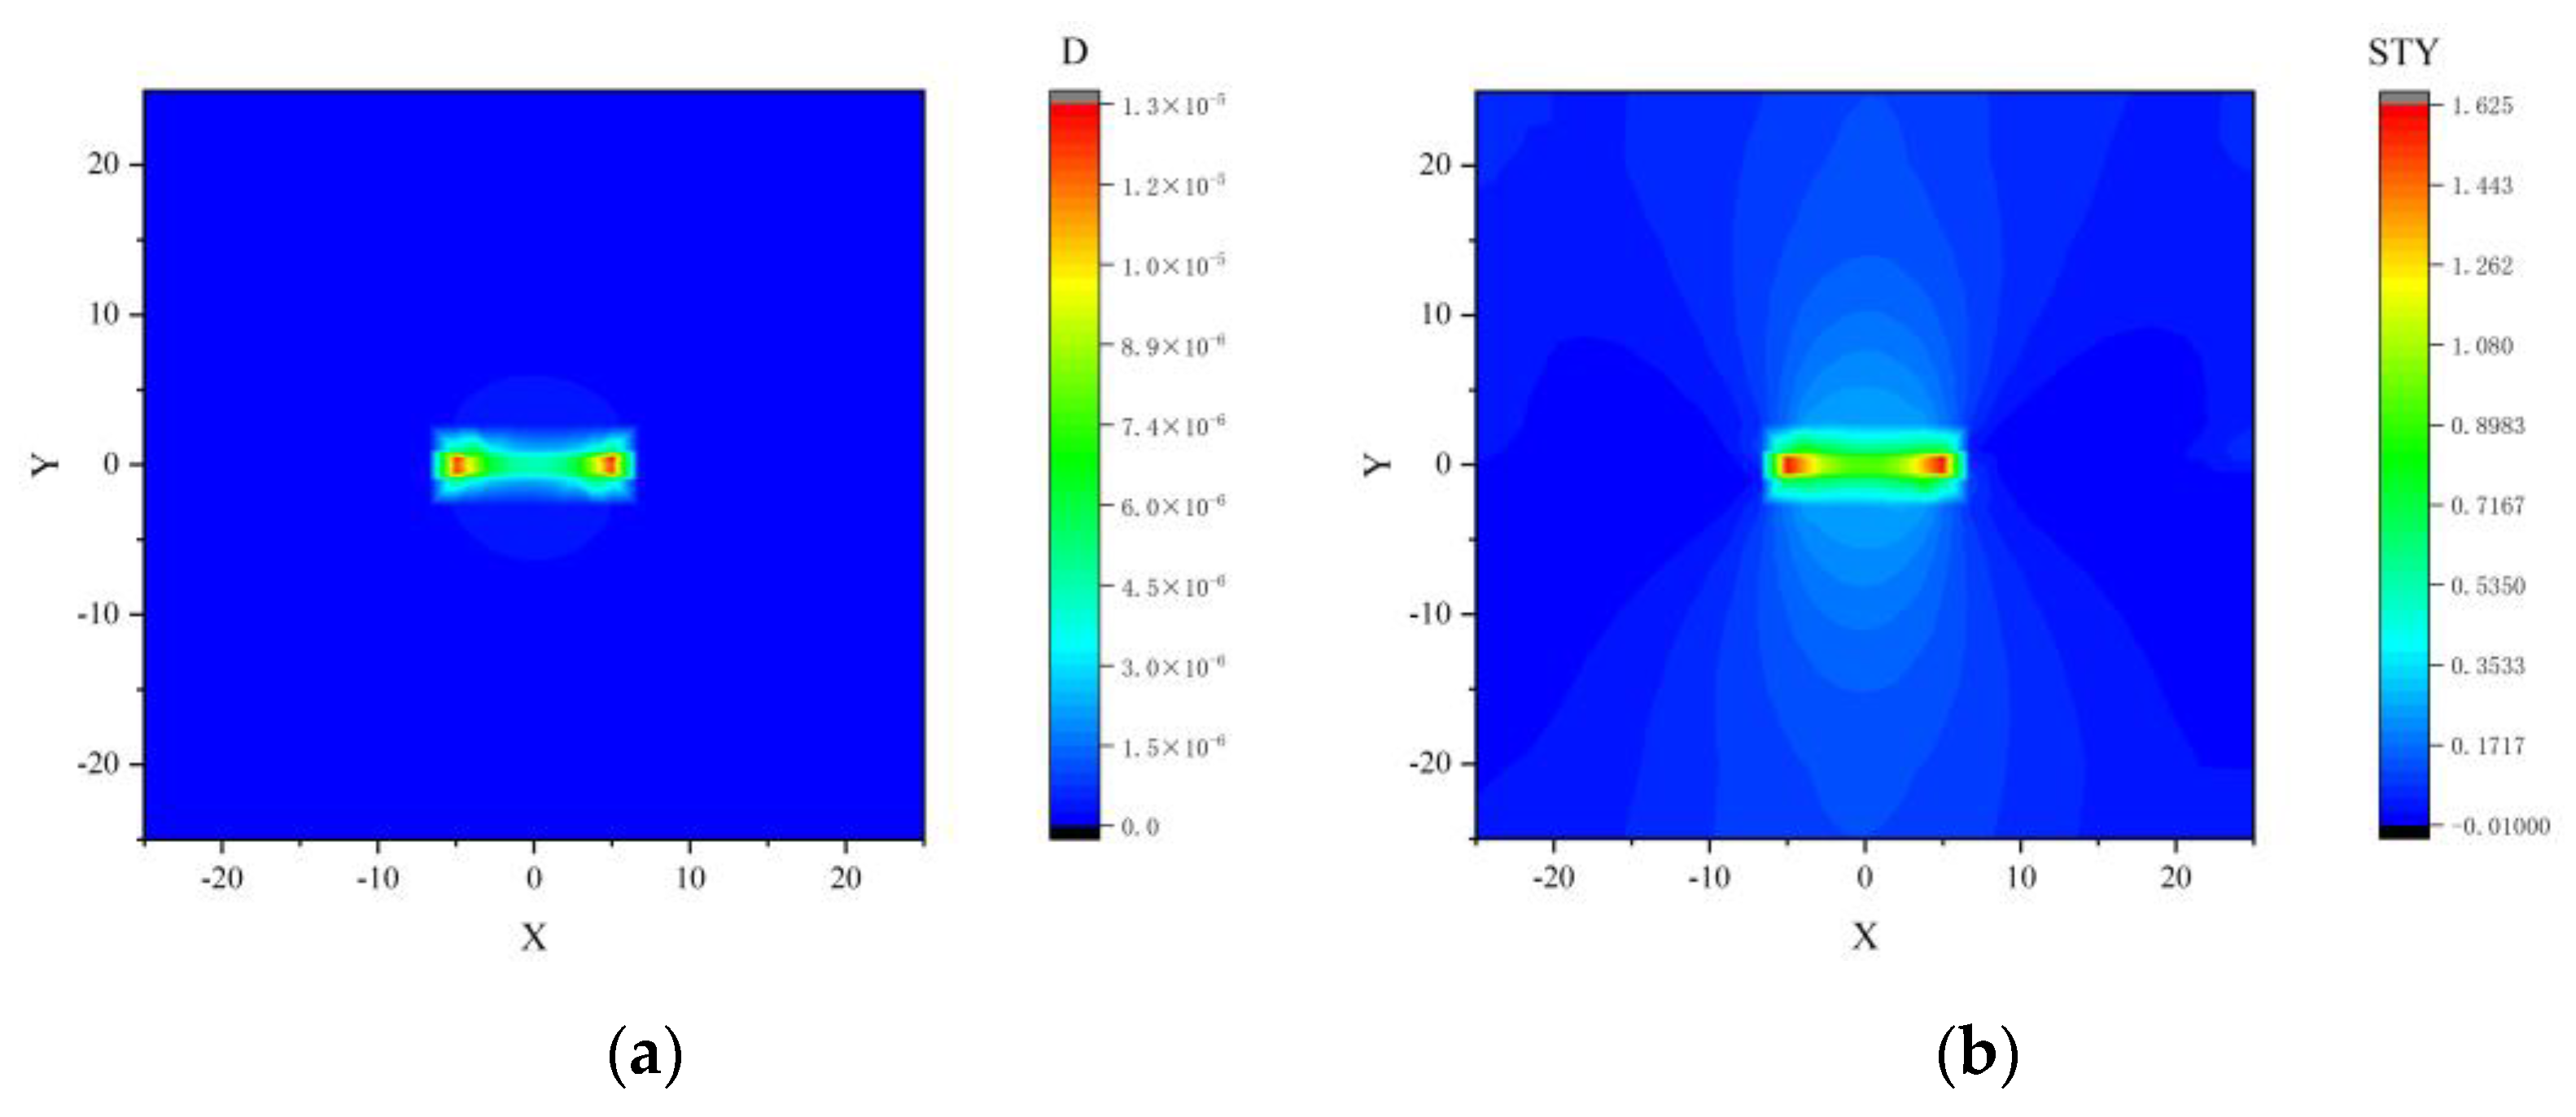
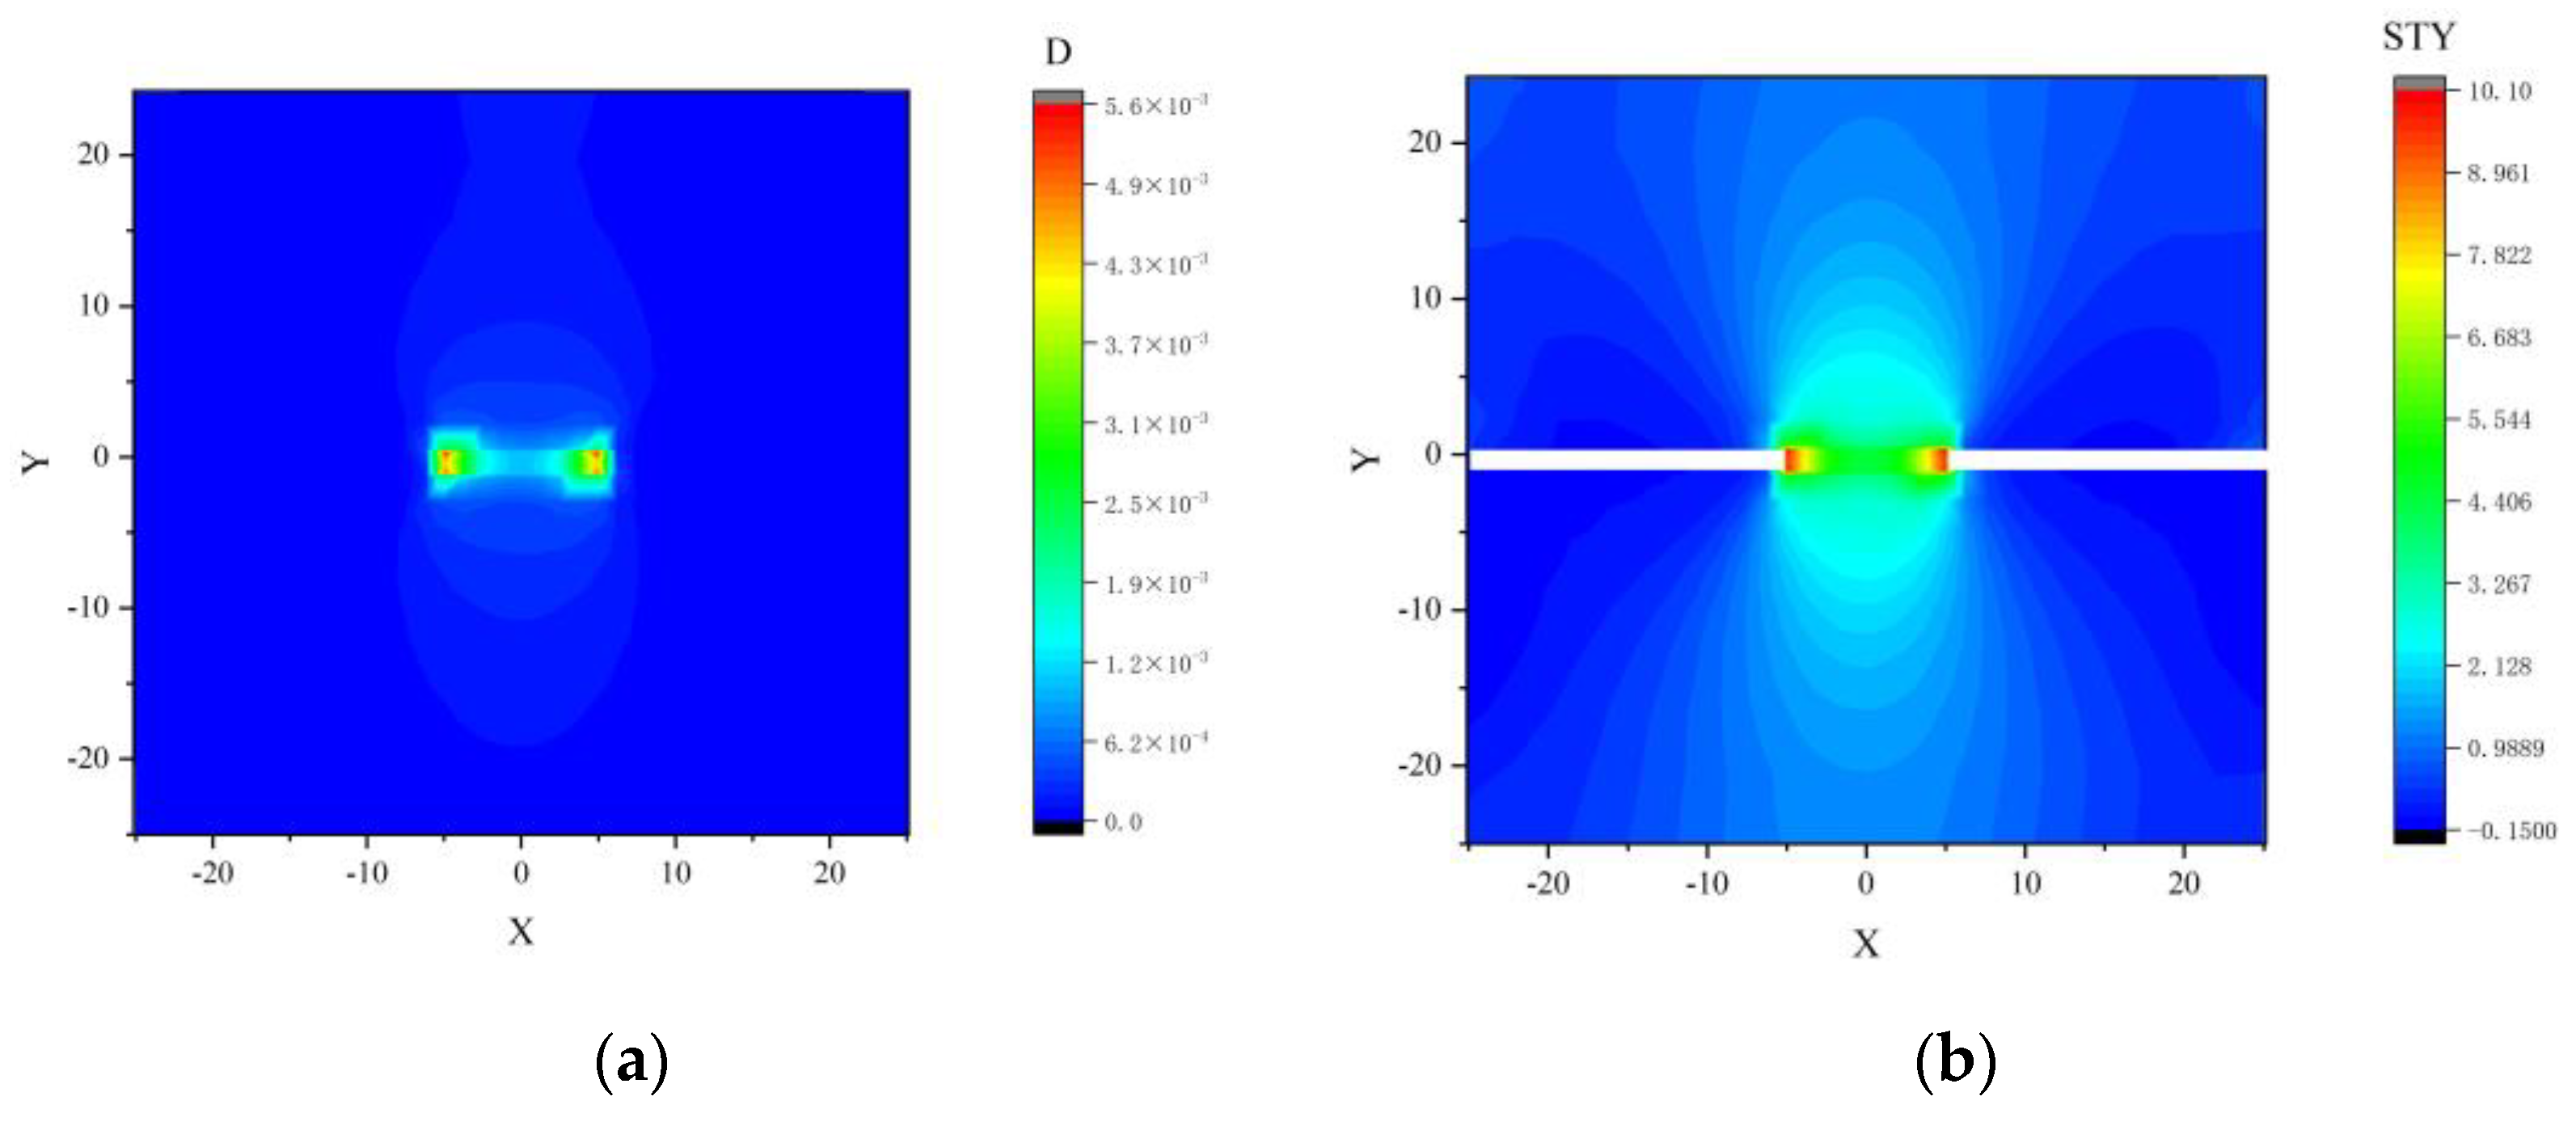
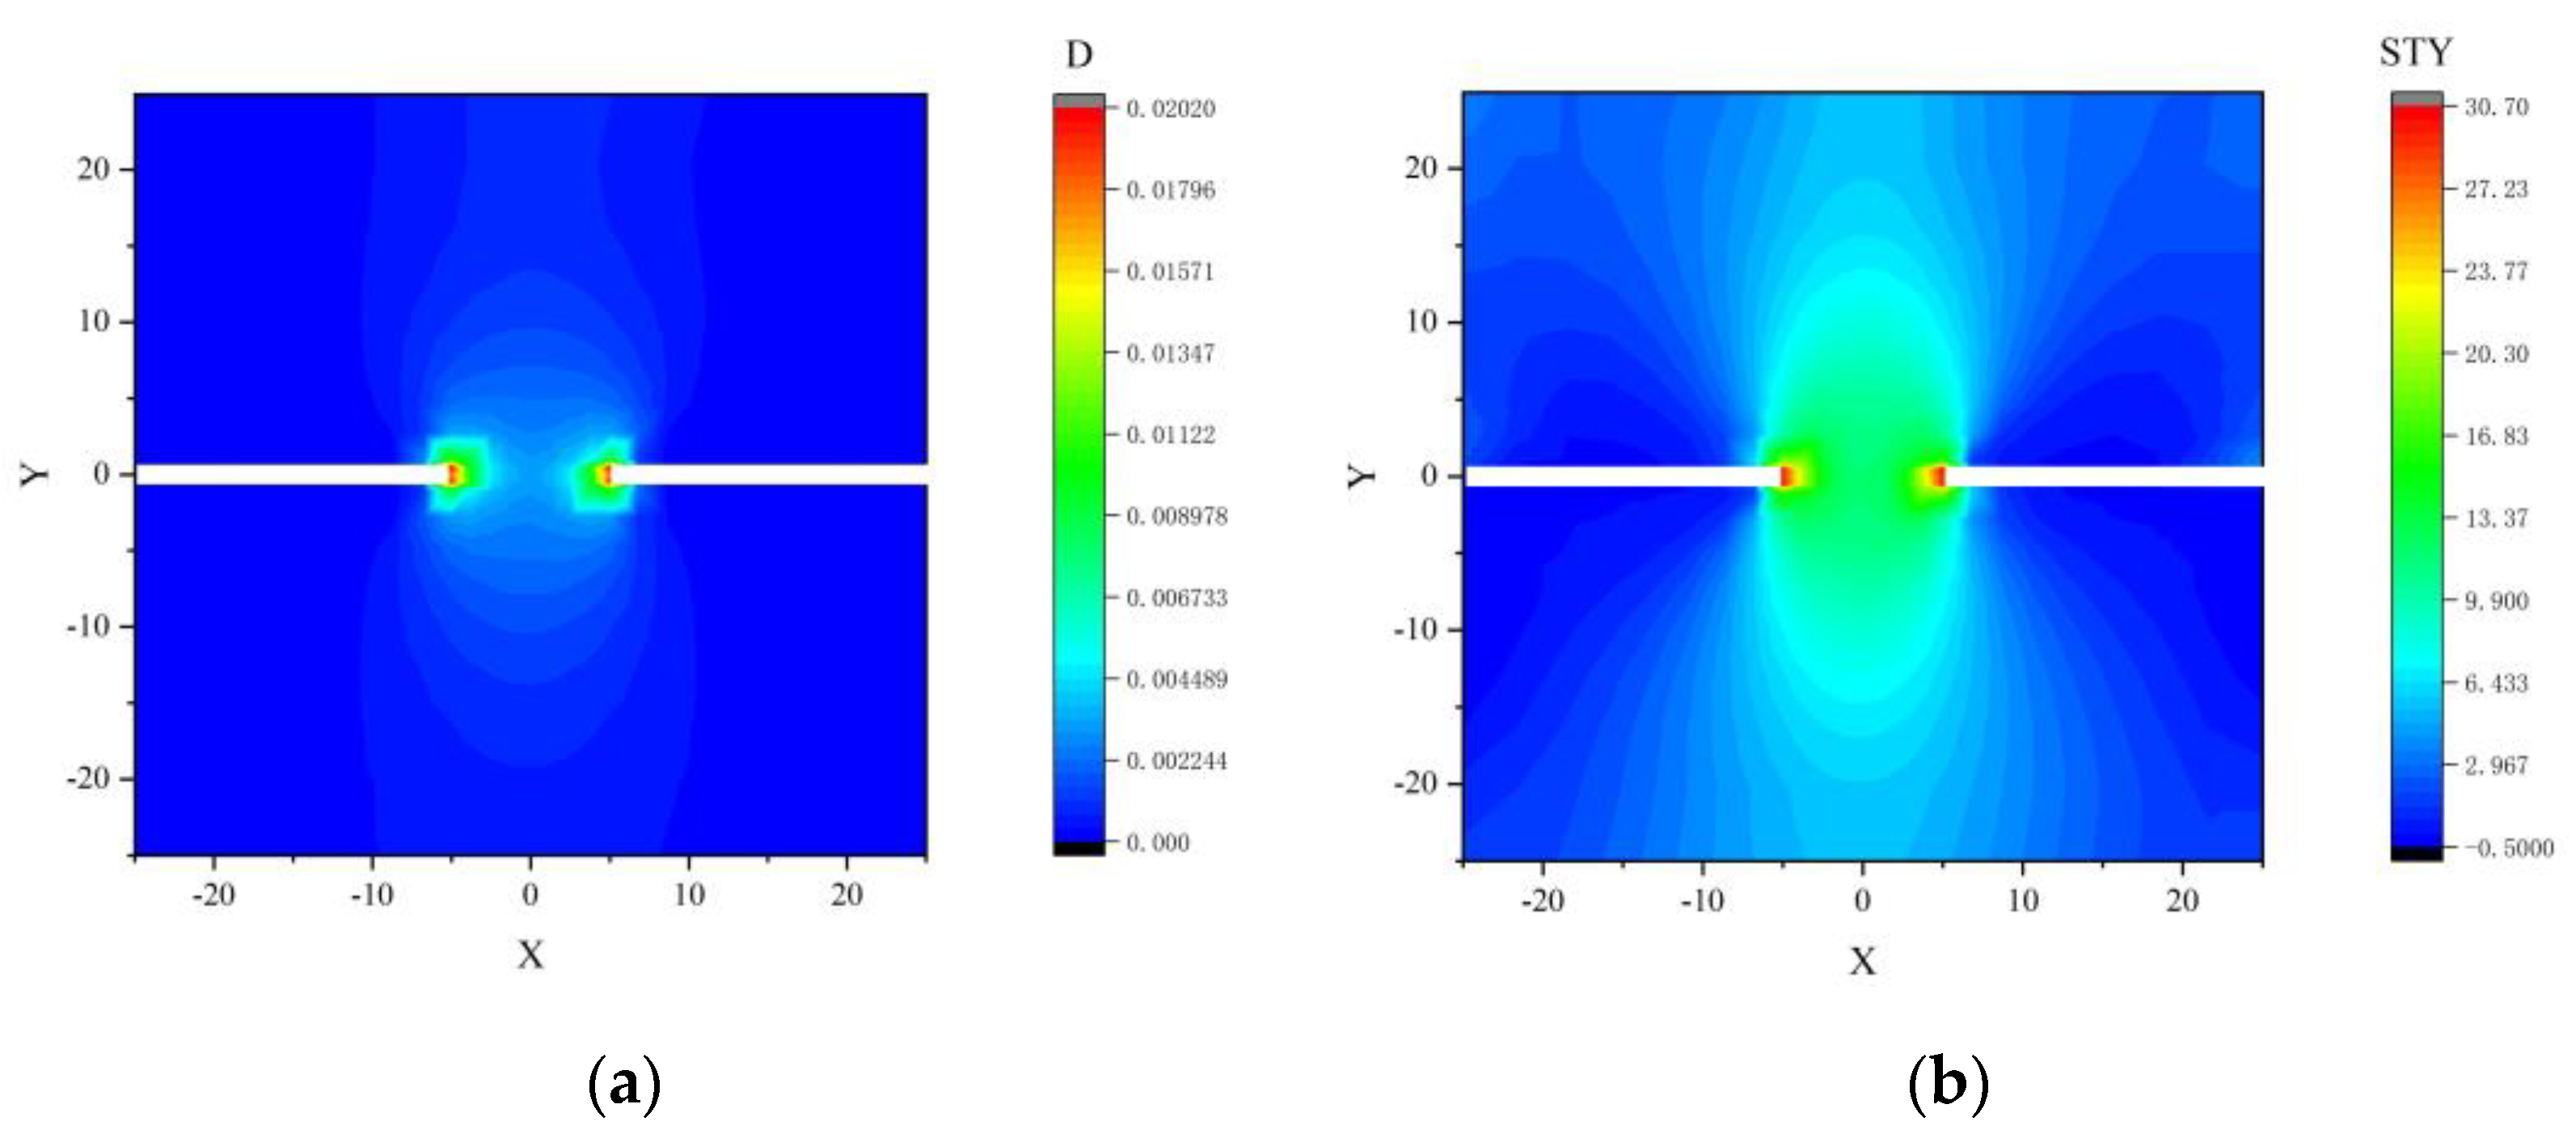
- Based on the damage model, a numerical calculation program using the finite volume method (FVM) was developed. The surrounding rock damage and vertical stress evolution process in the Yimaqianqiu Coal Mine was simulated, and the results showed that the proposed program can provide a basis for risk analysis of rockburst.
- (5)
- In this work, due to only exploring the correlation between energy dissipation and plastic growth of sandstone specimens, the broader applicability of the proposed model has not been validated. Energy dissipation and plastic growth are common accompanying phenomena in the damage and failure process of rock materials. The difference between different rocks lies in the possible evolution relationship between energy dissipation and plastic growth, which is reflected in the selection of material parameters.
Author Contributions
Funding
Institutional Review Board Statement
Informed Consent Statement
Data Availability Statement
Conflicts of Interest
References
- Xie, H.; Li, C.; Gao, M.; Zhang, R. Conceptualization and preliminary research on deep in situ rock mechanics. Chin. J. Rock Mech. Eng. 2021, 40, 217–232. [Google Scholar]
- Yin, S.; Li, Z.; Wang, E.; Niu, Y.; Tian, H.; Li, X.; Li, H.; Yang, C. The infrared thermal effect of coal failure with different impact types and its relationship with bursting liability. Infrared Phys. Technol. 2024, 138, 105263. [Google Scholar] [CrossRef]
- Gong, F.; Xu, L.; Gao, M.; Zhao, Y.; Zhang, P. Compressive damage constitutive model for brittle coal based on the compaction effect and linear energy dissipation law. Int. J. Coal Sci. Technol. 2025, 12, 43. [Google Scholar] [CrossRef]
- Michał, K.; Paweł, B.; Jerzy, M. Determination and validation of Karagozian-Case Concrete constitutive model parameters for numerical modeling of dolomite rock. Int. J. Rock Mech. Min. Sci. 2020, 129, 512–522. [Google Scholar]
- Meng, G.; Christine, D.; Peter, C. Formulation and application of a constitutive model for multijointed material to rock mass engineering. Int. J. Geomech. 2020, 20, 912–923. [Google Scholar] [CrossRef]
- Xie, S.; Lin, H.; Chen, Y.; Yong, R.; Xiong, W.; Du, S. A damage constitutive model for shear behavior of joints based on determination of the yield point. Int. J. Rock Mech. Min. Sci. 2020, 128, 188–199. [Google Scholar] [CrossRef]
- Liu, L.; Ji, H.; Elsworth, D.; Zhi, S.; Lv, X.; Wang, T. Dual-damage constitutive model to define thermal damage in rock. Int. J. Rock Mech. Min. Sci. 2020, 126, 845–861. [Google Scholar] [CrossRef]
- Deng, J.; Liu, Y.; Yang, Q.; Cui, W.; Zhu, Y.; Liu, Y.; Li, B. A viscoelastic, viscoplastic, and viscodamage constitutive model of salt rock for underground energy storage cavern. Comput. Geotech. 2020, 119, 156–172. [Google Scholar] [CrossRef]
- Zhu, Q.Z.; Min, Z.Z.; Wang, Y.Y.; Wang, W. Study on the size effect of silty sandstone samples under conventional triaxial compression. Chin. J. Rock Mech. Eng. 2019, 38, 3296–3303. [Google Scholar]
- Ghorbani, M.; Shahriar, K.; Sharifzadeh, M.; Masoudi, R. A critical review on the developments of rock support systems in high stress ground conditions—ScienceDirect. Int. J. Min. Sci. Technol. 2020, 30, 555–572. [Google Scholar] [CrossRef]
- Li, X.; Yao, Z.; Huang, X.W. Investigation of deformation and failure characteristics and energy evolution of sandstone under cyclic loading and unloading. Rock Soil Mech. 2021, 42, 1693–1704. [Google Scholar]
- Yang, L.; Gao, F.; Wang, X.; Li, J. Energy evolution law and failure mechanism of coal-rock combined specimen. J. China Coal Soc. 2019, 44, 3894–3902. [Google Scholar]
- Zhao, K.; Yu, X.; Zhou, Y.; Wang, Q.; Wang, J.; Hao, J. Energy evolution of brittle granite under different loading rates. Int. J. Rock Mech. Min. Sci. 2020, 132, 1125–1142. [Google Scholar] [CrossRef]
- Zhao, C.; Wu, K.; Li, S.; Zhao, J. Energy characteristics and damage deformation of rock subjected to cyclic loading. Chin. J. Geotech. Eng. 2013, 35, 890–896. [Google Scholar]
- Dai, J.; Gong, F.; Huang, D.; Zhang, Q. Quantitative evaluation method of rockburst prevention effect for anchoring rock masses around deep-buried tunnels. Tunn. Undergr. Space Technol. 2025, 156, 106268. [Google Scholar] [CrossRef]
- Yin, S.; Wang, E.; Li, Z.; Zang, Z.; Liu, X.; Zhang, C.; Ding, X.; Aihemaiti, A. Multifractal and b-value nonlinear time-varying characteristics of acoustic emission for coal with different impact tendency. Measurement 2025, 248, 116896. [Google Scholar] [CrossRef]
- Munoz, H.; Taheri, A.; Chanda, E. Rock Drilling Performance Evaluation by an Energy Dissipation Based Rock Brittleness Index. Rock Mech. Rock Eng. 2016, 49, 3343–3355. [Google Scholar] [CrossRef]
- Liu, W.; Zhang, S.; Sun, B. Energy evolution of rock under different stress paths and establishment of a statistical damage model. KSCE J. Civ. Eng. 2019, 23, 4274–4287. [Google Scholar] [CrossRef]
- Xue, Y.; Wang, L.-C.; Liu, Y.; Ranjith, P.G.; Cao, Z.-Z.; Shi, X.-Y.; Gao, F.; Kong, H.-L. Brittleness evaluation of gas-bearing coal based on statistical damage constitution model and energy evolution mechanism. J. Cent. South Univ. 2025, 32, 566–581. [Google Scholar] [CrossRef]
- Xie, H.; Peng, R.; Ju, Y. Energy dissipation of rock deformation and fracture. Chin. J. Rock Mech. Eng. 2004, 23, 3565–3570. [Google Scholar]
- Xie, H.; Ju, Y.; Li, L. Criteria for strength and structural failure of rocks based on energy dissipation and energy release principles. Chin. J. Rock Mech. Eng. 2005, 24, 3003–3010. [Google Scholar]
- Chloe, A. Micro-macro mechanics of damage and healing in rocks. Open Geomech. 2020, 25, 251–257. [Google Scholar]
- Zhou, T.; Qin, Y.; Ma, Q. Study on sandstone damage evolution model under triaxial loading and post-peak unloading considering nonlinear behaviors. Geofluids 2021, 2021, 2395789. [Google Scholar] [CrossRef]
- Xue, Y.; Wang, L.-C.; Liu, Y.; Ranjith, P.G.; Cao, Z.-Z.; Shi, X.-Y.; Gao, F.; Kong, H.-L. Research on characteristic stress and constitutive equation of confined sandstone during damage evolution based on energy evolution analysis. Adv. Mater. Sci. Eng. 2019, 2019, 4145981. [Google Scholar]
- Liu, P.; Liu, A.; Liu, S.; Qi, L. Experimental evaluation of ultrasound treatment induced pore structure and gas desorption behavior alterations of coal. Fuel 2021, 307, 121855. [Google Scholar] [CrossRef]
- Zhang, P.; Gong, F.; Luo, S.; Si, X.; Xu, L. Damage constitutive model of uniaxially compressed coal material considering energy dissipation. J. Mater. Res. Technol. 2023, 27, 920–931. [Google Scholar] [CrossRef]
- Gong, F.; Zhang, P.; Xu, L. Damage constitutive model of brittle rock under uniaxial compression based on linear energy dissipation law. Int. J. Rock Mech. Min. Sci. 2022, 160, 105273. [Google Scholar] [CrossRef]
- Kang, Y.; Hou, C.; Liu, B.; Liu, Q.; Sang, H.; Tian, Y. Frost Deformation and a Quasi-Elastic- Plastic- Creep Constitutive Model for Isotropic Freezing Rock. Int. J. Geomech. 2020, 20, 1214–1229. [Google Scholar] [CrossRef]
- Cui, X.; Cao, Y.; Jin, Y.; Zheng, Z.; Shen, W. A non-orthogonal fractional plastic damage constitutive model for porous rock-like materials considering porosity evolution. Acta Geotech. 2024, 19, 3185–3198. [Google Scholar] [CrossRef]
- Ma, Q.; Liu, Z.; Qin, Y.; Tian, J.; Wang, S. Rock plastic-damage constitutive model based on energy dissipation. Rock Soil Mech. 2021, 42, 1210–1220. [Google Scholar]
- Zhou, T. Study on the energy and damage characteristics of gas-containing coal under confining pressure unloading process. AIP Adv. 2023, 13, 0176895. [Google Scholar] [CrossRef]
- Hou, P.; Cai, M. A modified Hoek–Brown model for determining plastic-strain-dependent post-peak strength of brittle rock. Rock Mech. Rock Eng. 2023, 56, 2375–2393. [Google Scholar] [CrossRef]
- Ren, C.; Yu, J.; Liu, S.; Yao, W.; Zhu, Y.; Liu, X. A Plastic Strain-Induced Damage Model of Porous Rock Suitable for Different Stress Paths. Rock Mech. Rock Eng. 2022, 55, 1887–1906. [Google Scholar] [CrossRef]
- Unteregger, D.; Fuchs, B.; Hofstetter, G. A damage plasticity model for different types of intact rock. Int. J. Rock Mech. Min. Sci. 2015, 80, 402–411. [Google Scholar] [CrossRef]
- Zhang, J.; Xu, W.; Wang, H.; Wang, R.; Meng, Q.; Du, S. A coupled elastoplastic damage model for brittle rocks and its application in modelling underground excavation. Int. J. Rock Mech. Min. Sci. 2016, 84, 130–141. [Google Scholar] [CrossRef]
- Niu, S.; Wu, J.; Zhao, J. Study on the energy characteristics of rocks under cyclic loading and unloading. Sci. Rep. 2025, 15, 12302. [Google Scholar] [CrossRef]
- Zhang, X.; Cai, Y.; Zhou, T.; Chen, J. Thermodynamic characteristics of methane adsorption on coal molecular with selected metamorphism degree: Considering the influence of temperature, moisture contents, and in-situ modification. Fuel 2023, 342, 127771. [Google Scholar] [CrossRef]
- GB/T 50266-2013; Standard Test Methods for Engineering Rock Masses. Ministry of Housing and Urban-Rural Development of the People’s Republic of China: Beijing, China, 2013.
- Qin, T.; Duan, Y.; Sun, H.; Wang, L.; Liu, H. Mechanical characteristics and energy dissipation characteristics of sandstone under triaxial stress conditions. J. China Coal Soc. 2020, 45, 255–262. [Google Scholar]


Disclaimer/Publisher’s Note: The statements, opinions and data contained in all publications are solely those of the individual author(s) and contributor(s) and not of MDPI and/or the editor(s). MDPI and/or the editor(s) disclaim responsibility for any injury to people or property resulting from any ideas, methods, instructions or products referred to in the content. |
© 2025 by the authors. Licensee MDPI, Basel, Switzerland. This article is an open access article distributed under the terms and conditions of the Creative Commons Attribution (CC BY) license (https://creativecommons.org/licenses/by/4.0/).
Share and Cite
Zhou, T.; Zhang, X.; Cai, Y.; Wang, L.; Li, Q. A Study on Sandstone Damage Model Based on the Correlation Between Energy Dissipation and Plastic Strain. Appl. Sci. 2025, 15, 5270. https://doi.org/10.3390/app15105270
Zhou T, Zhang X, Cai Y, Wang L, Li Q. A Study on Sandstone Damage Model Based on the Correlation Between Energy Dissipation and Plastic Strain. Applied Sciences. 2025; 15(10):5270. https://doi.org/10.3390/app15105270
Chicago/Turabian StyleZhou, Tianbai, Xiaoyu Zhang, Yongbo Cai, Long Wang, and Qixian Li. 2025. "A Study on Sandstone Damage Model Based on the Correlation Between Energy Dissipation and Plastic Strain" Applied Sciences 15, no. 10: 5270. https://doi.org/10.3390/app15105270
APA StyleZhou, T., Zhang, X., Cai, Y., Wang, L., & Li, Q. (2025). A Study on Sandstone Damage Model Based on the Correlation Between Energy Dissipation and Plastic Strain. Applied Sciences, 15(10), 5270. https://doi.org/10.3390/app15105270