
Experimental Study on Pullout Behavior of Coir Geotextiles Based on Transparent Soil

Abstract
Featured Application
Abstract
1. Introduction
2. Materials and Methods
2.1. Test Materials
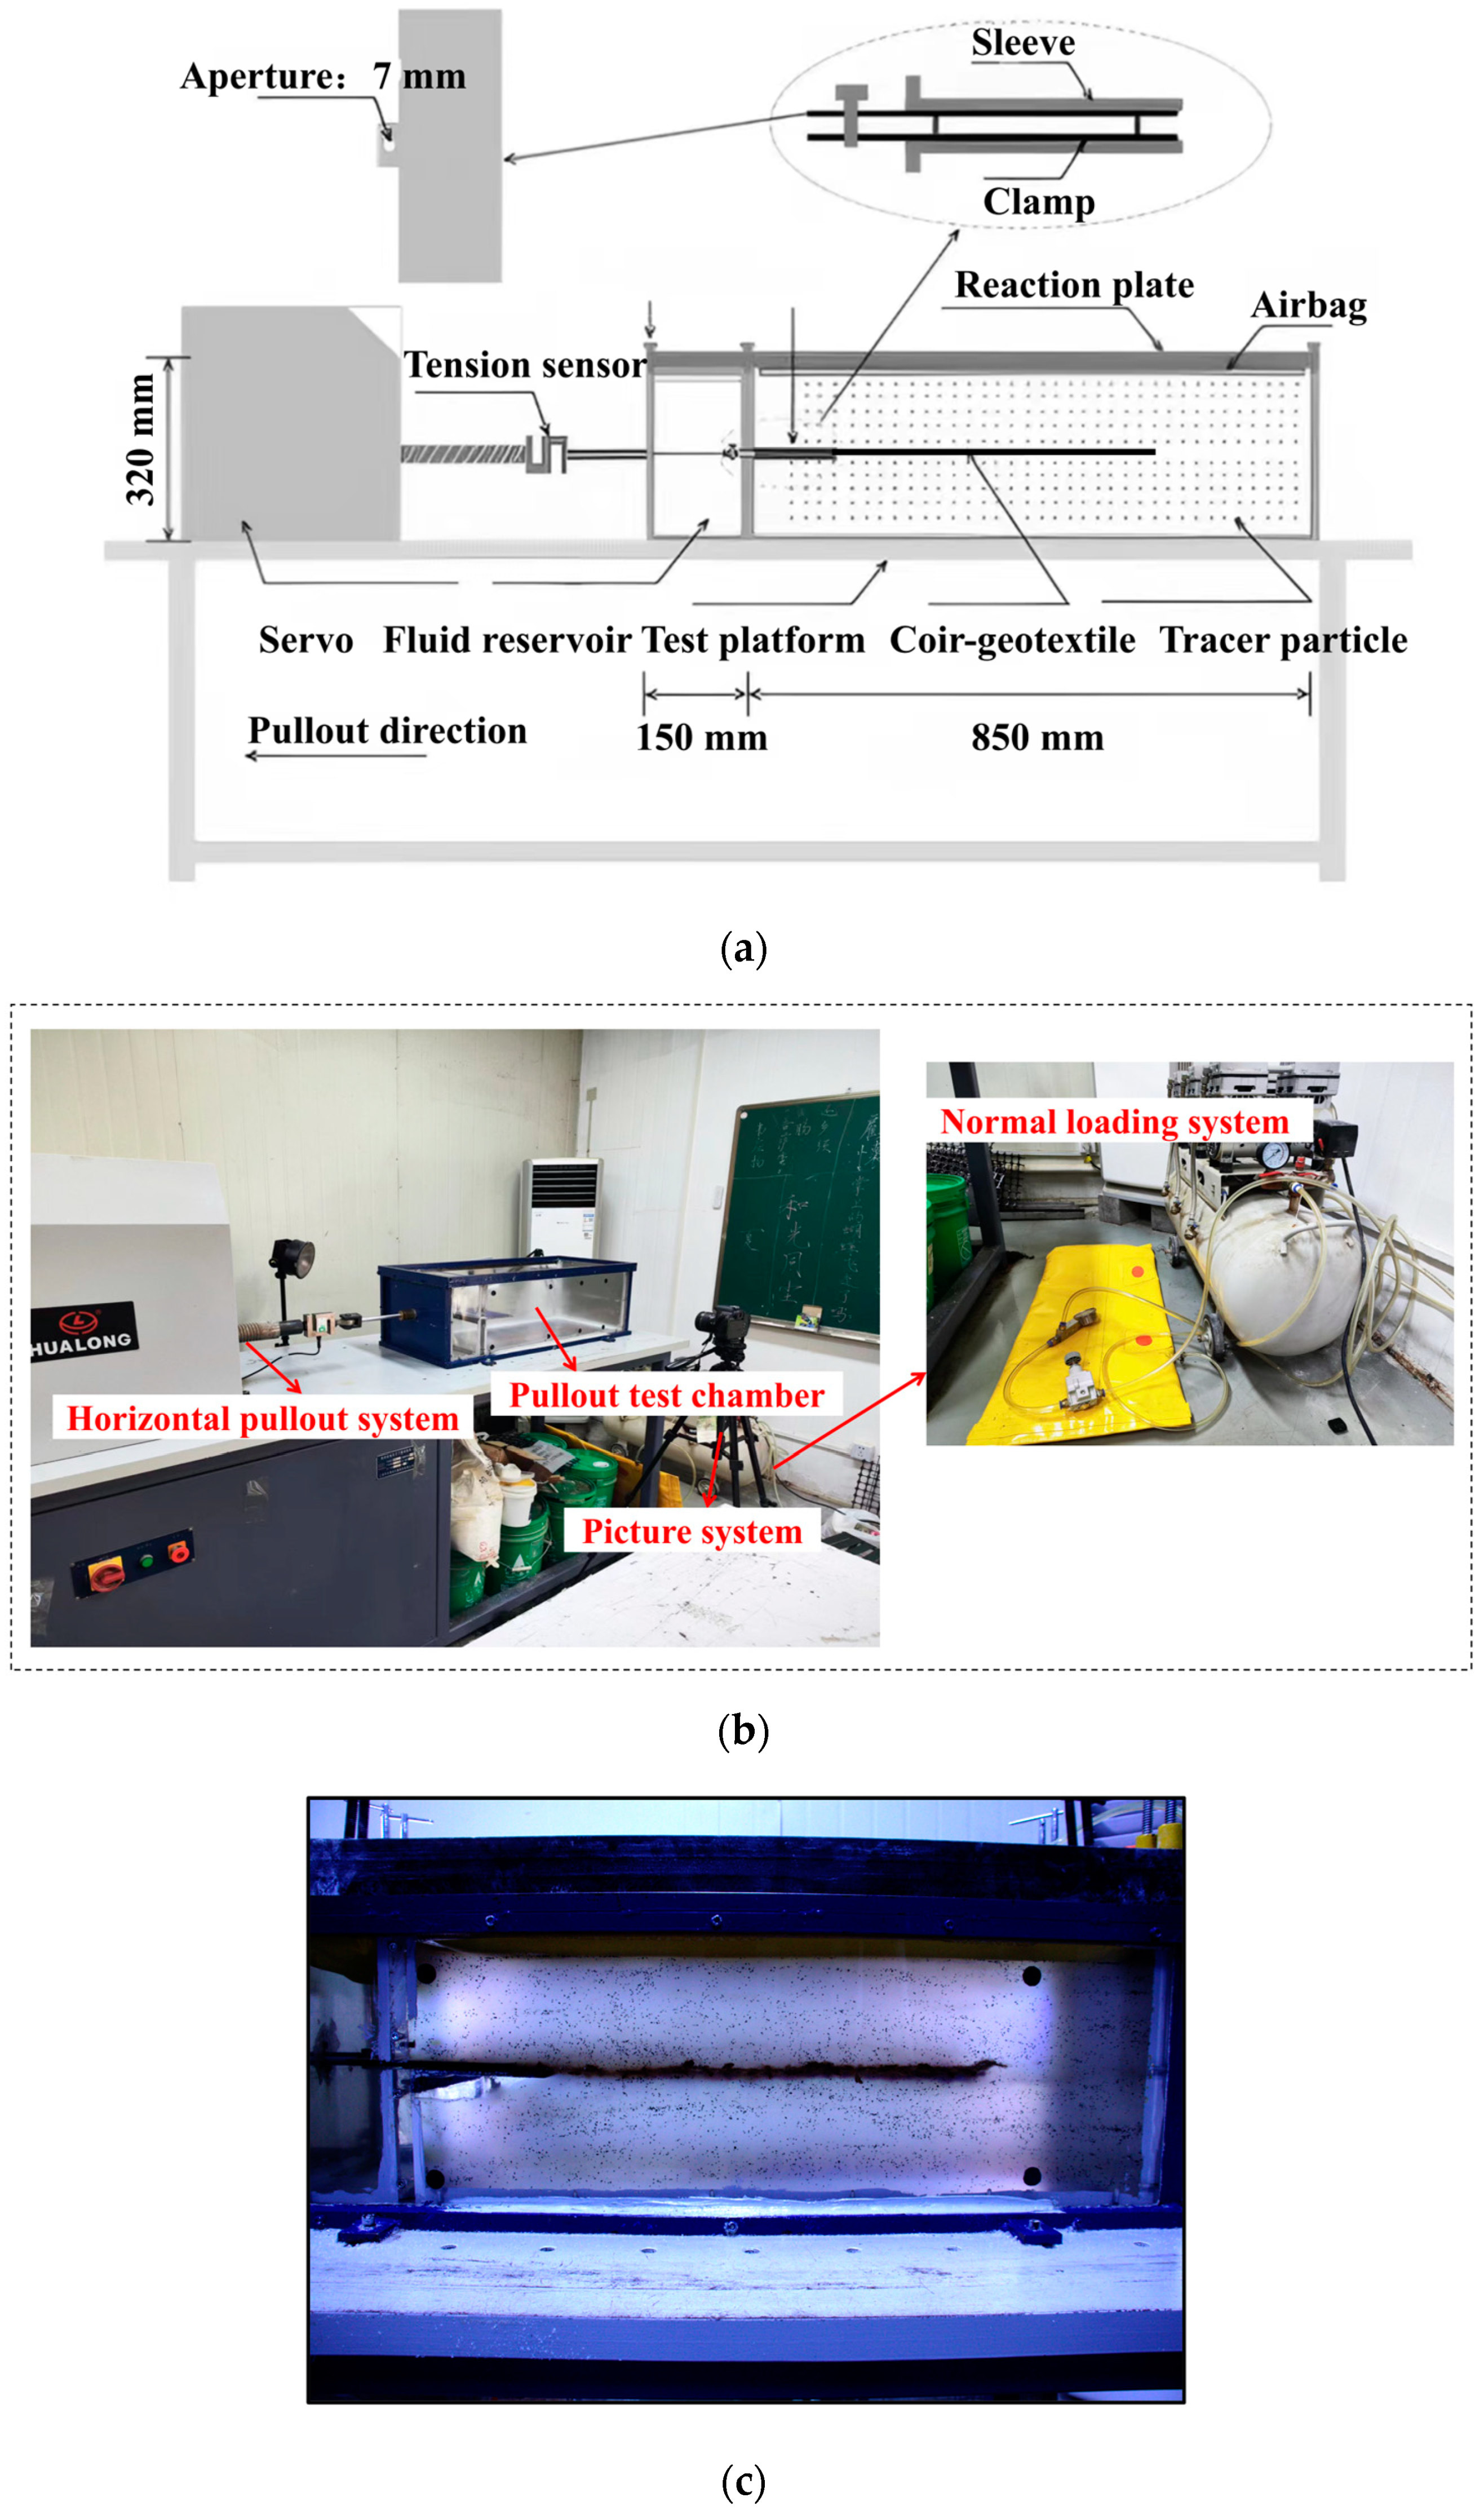
2.2. Test Equipment
2.3. Test Plan
2.4. Test Procedure
3. Results and Discussion
3.1. Influence of Normal Stress
3.2. Influence of Anchorage Length
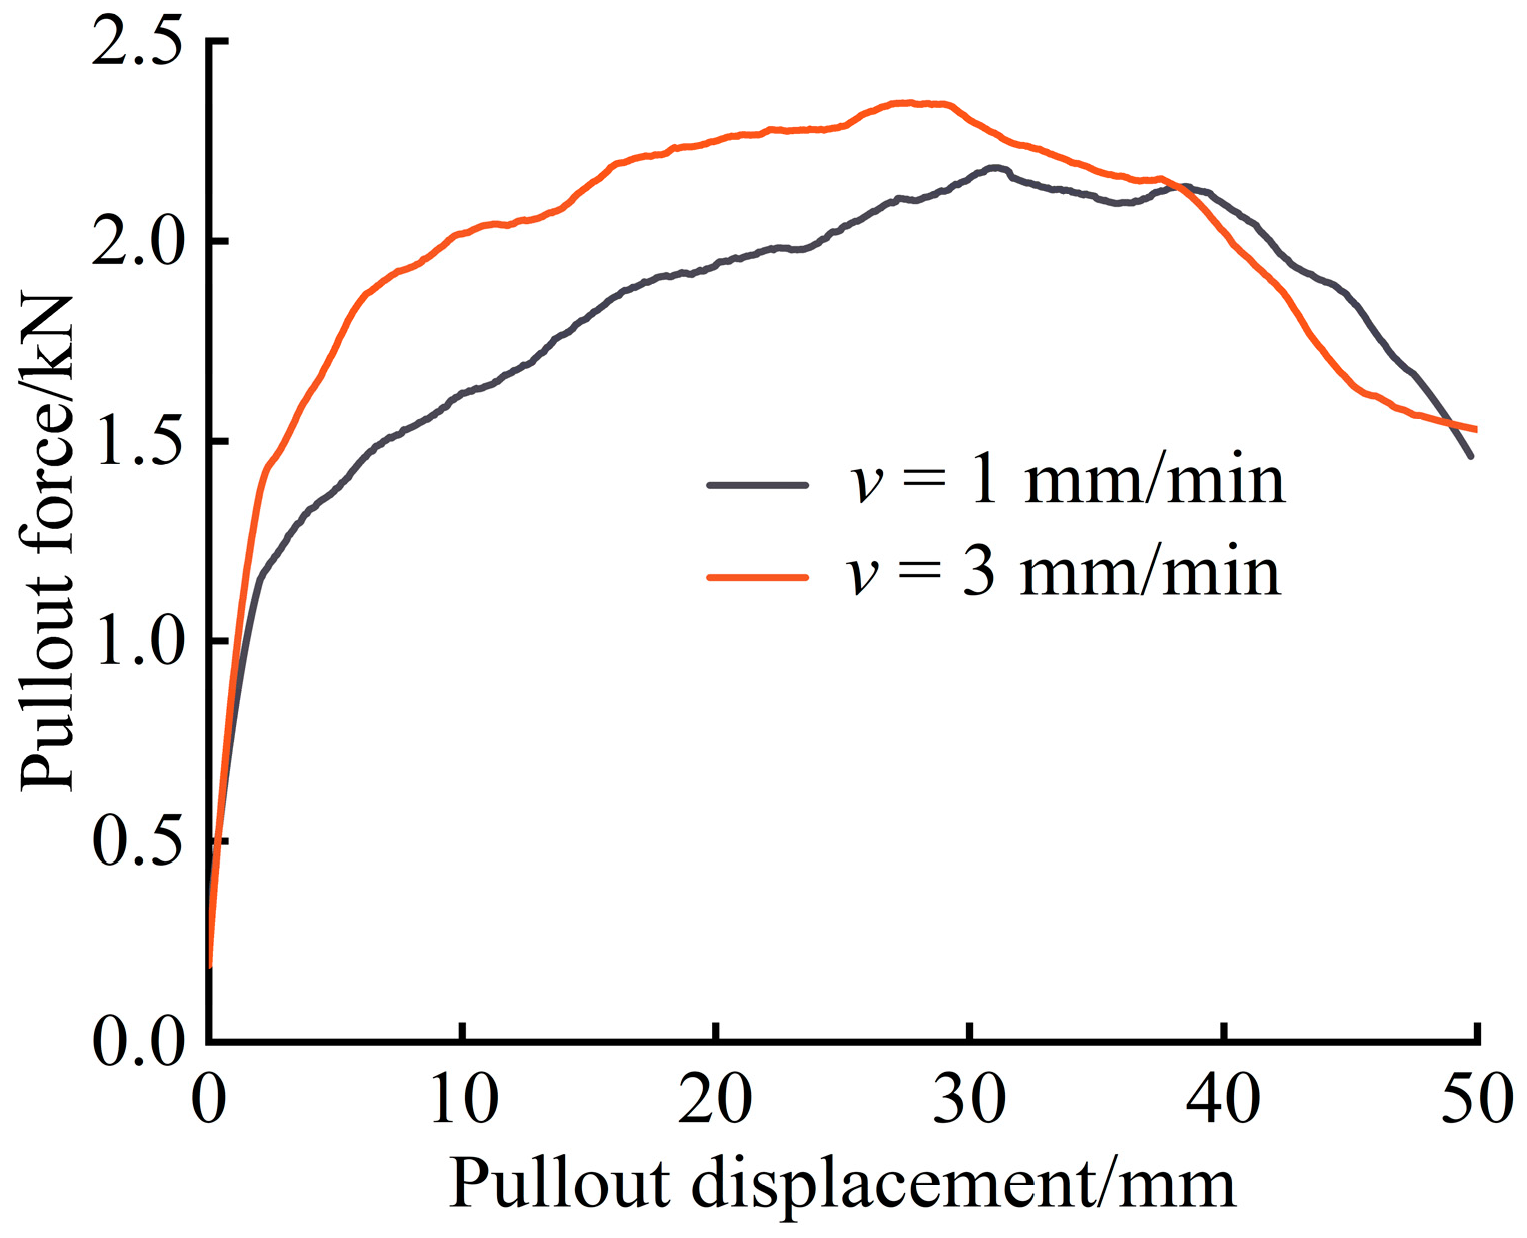
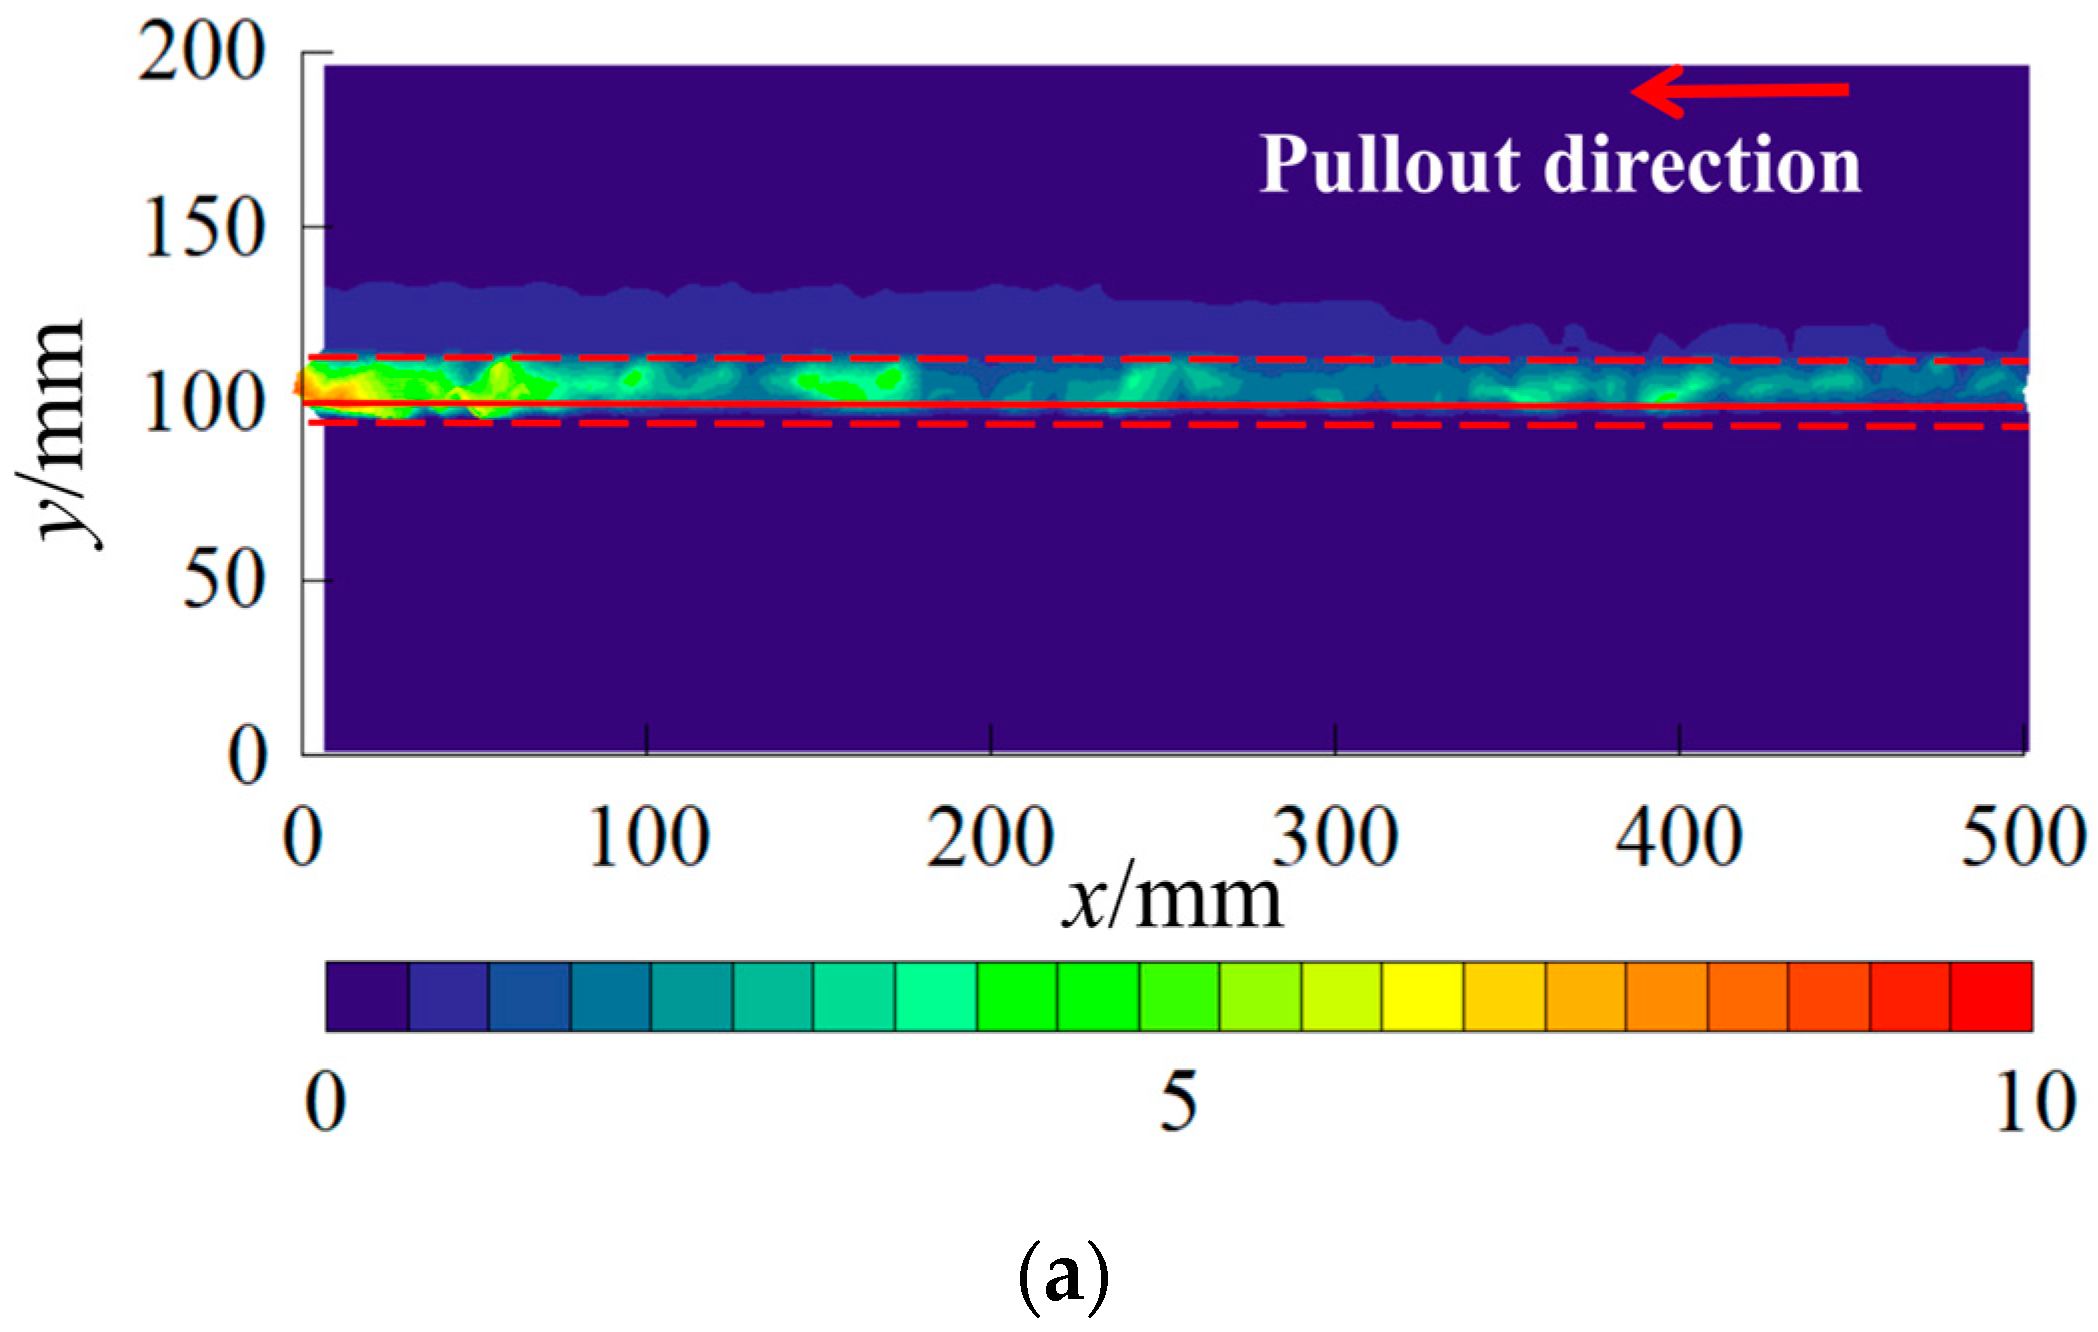
3.3. Influence of Pullout Rate
4. Conclusions
- (1)
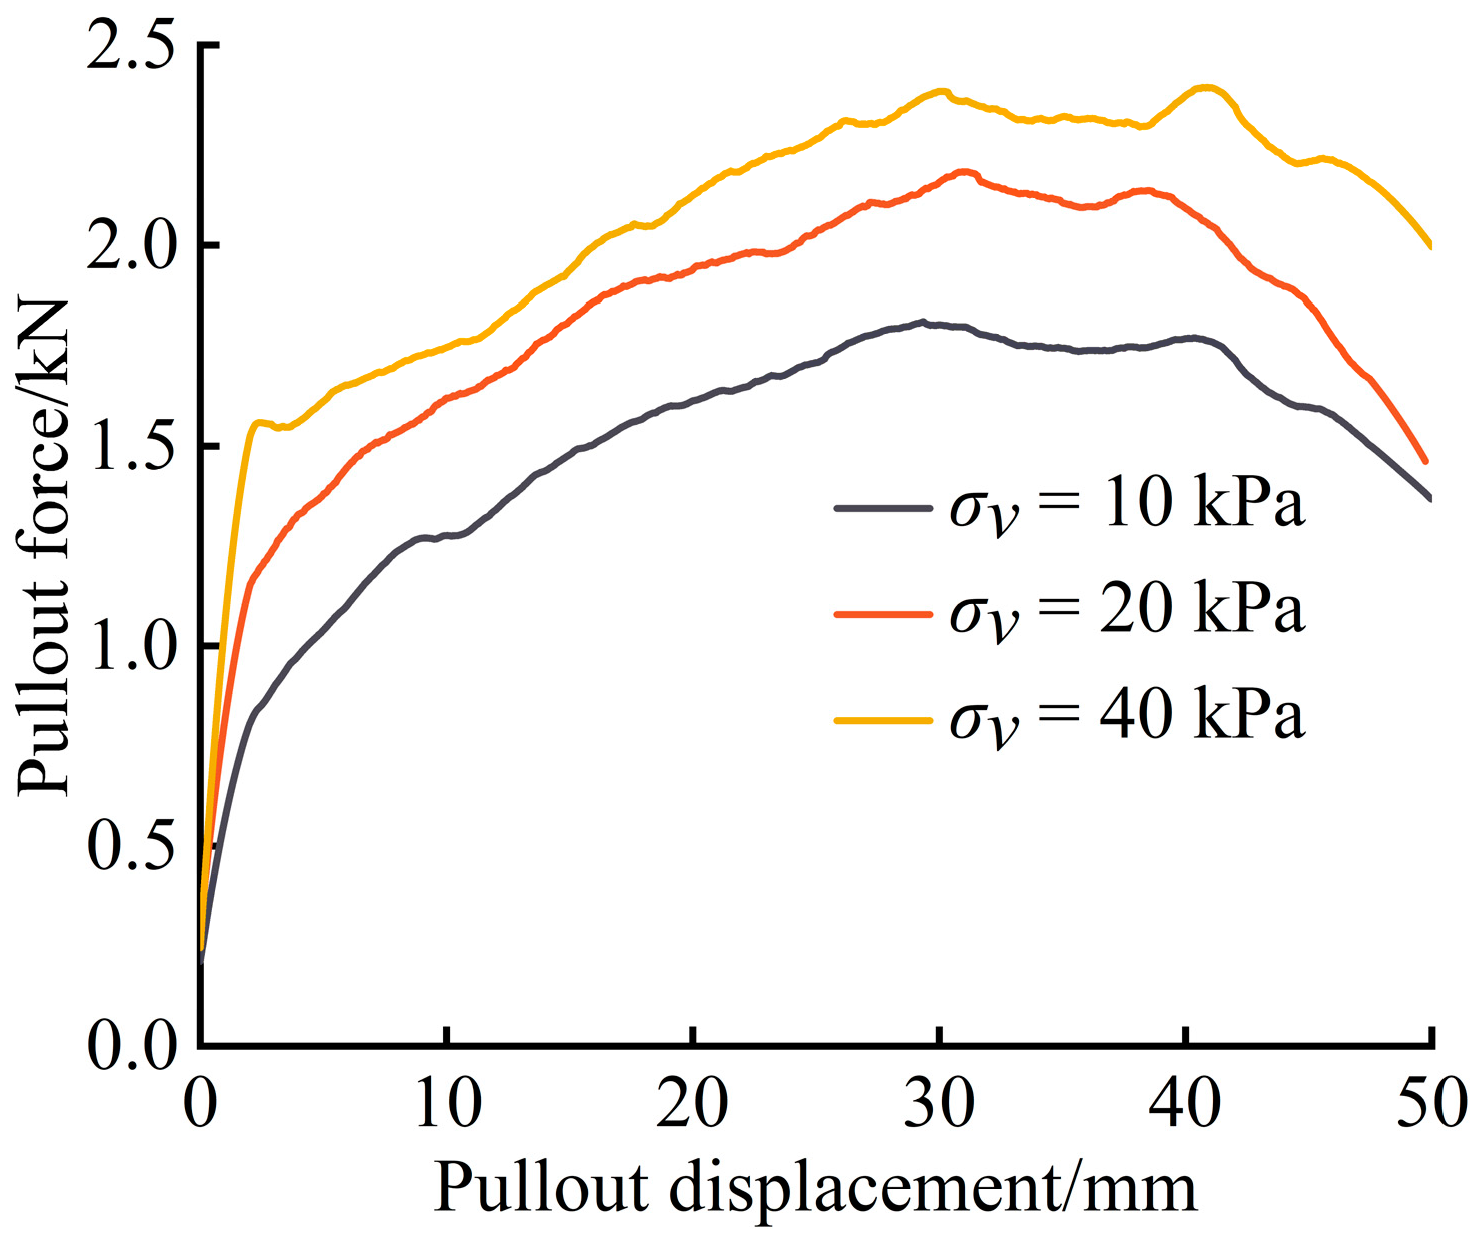
- The mechanical response of different pullout tests was basically similar, that is, with the increase in pullout displacement, the pullout force first increased rapidly, then slowly increased to the peak value, and then gradually decreased with the fluctuation.
- (2)
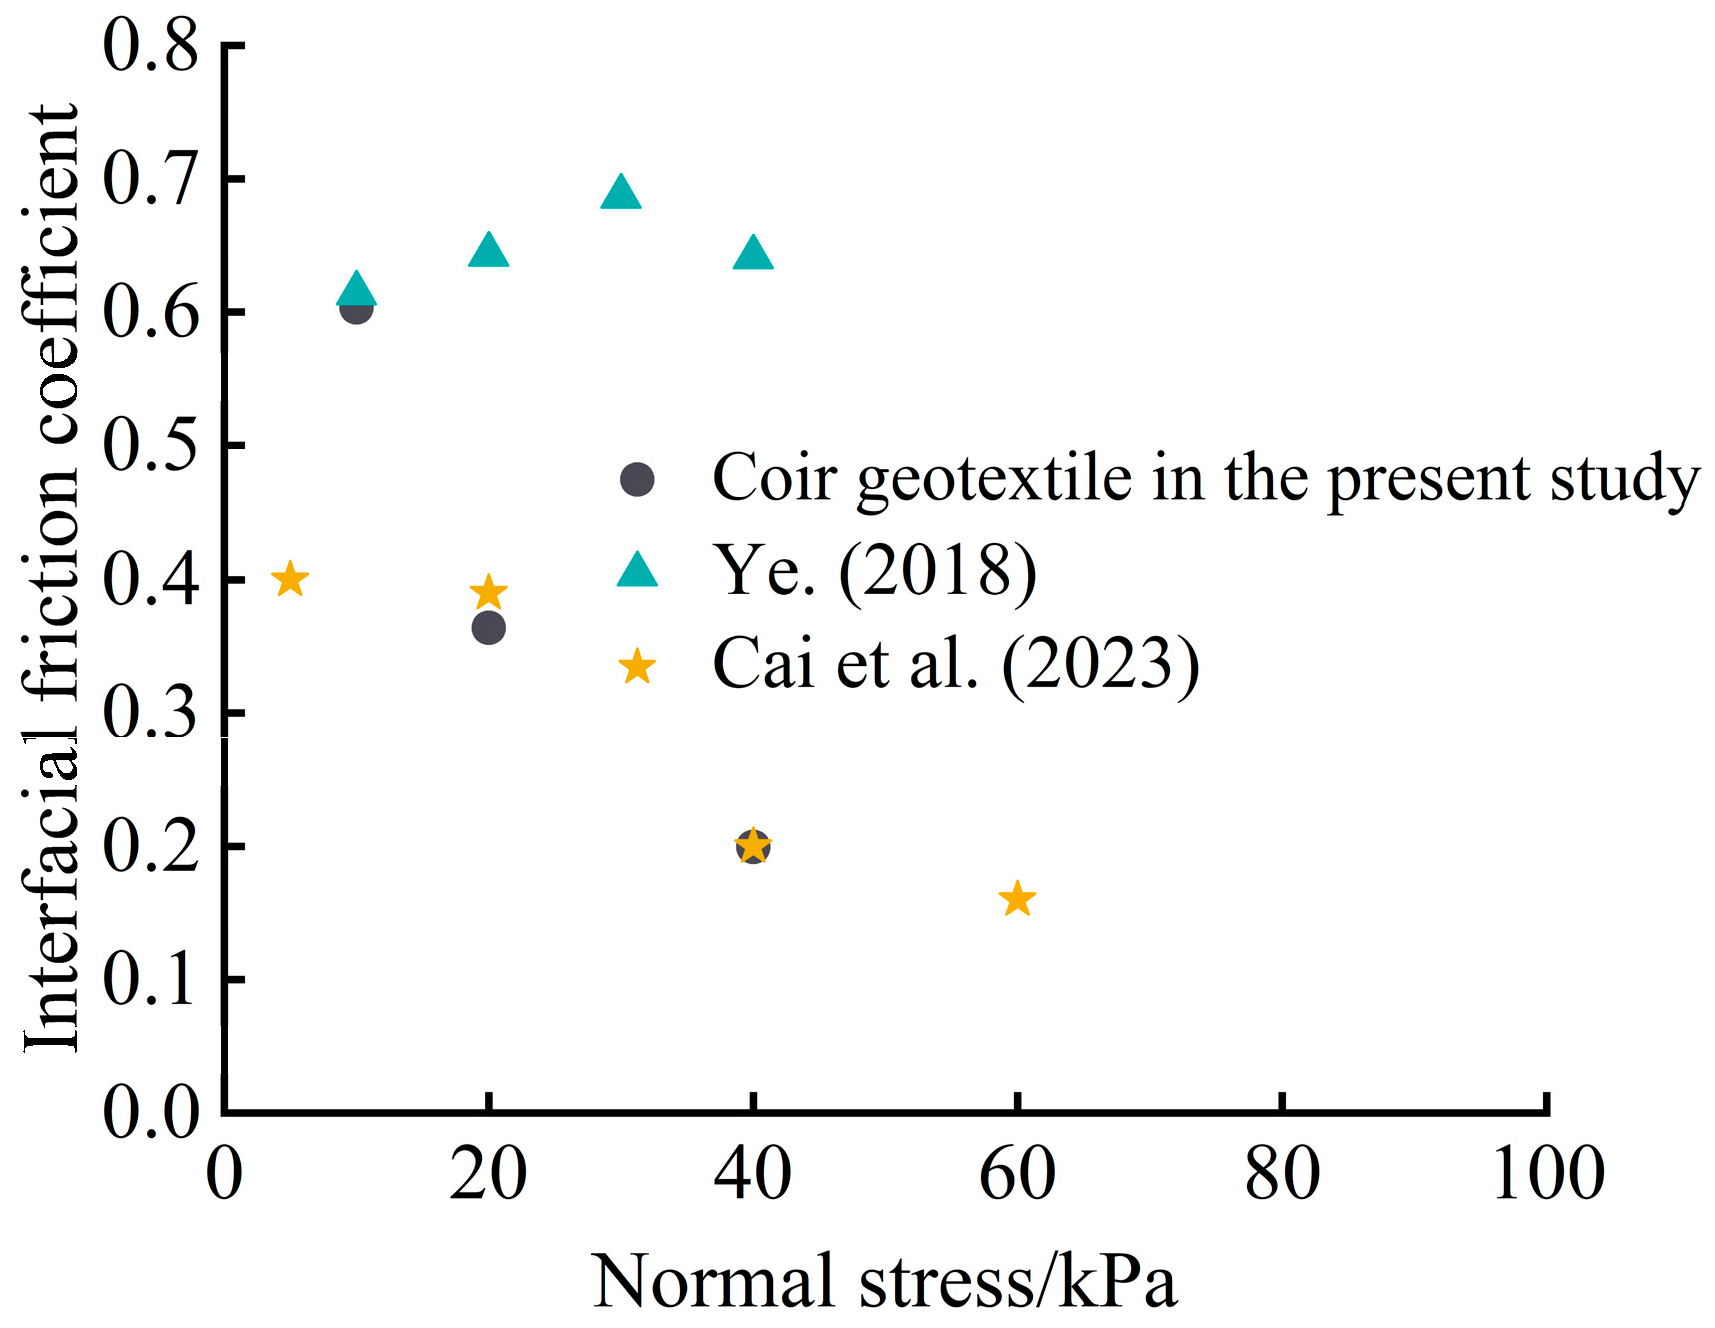
- The cohesion at the stiff–soil interface was 5.68 kPa, and the internal friction angle was 3.43°. The interfacial friction coefficient was in the range of 0.2–0.6.
- (3)
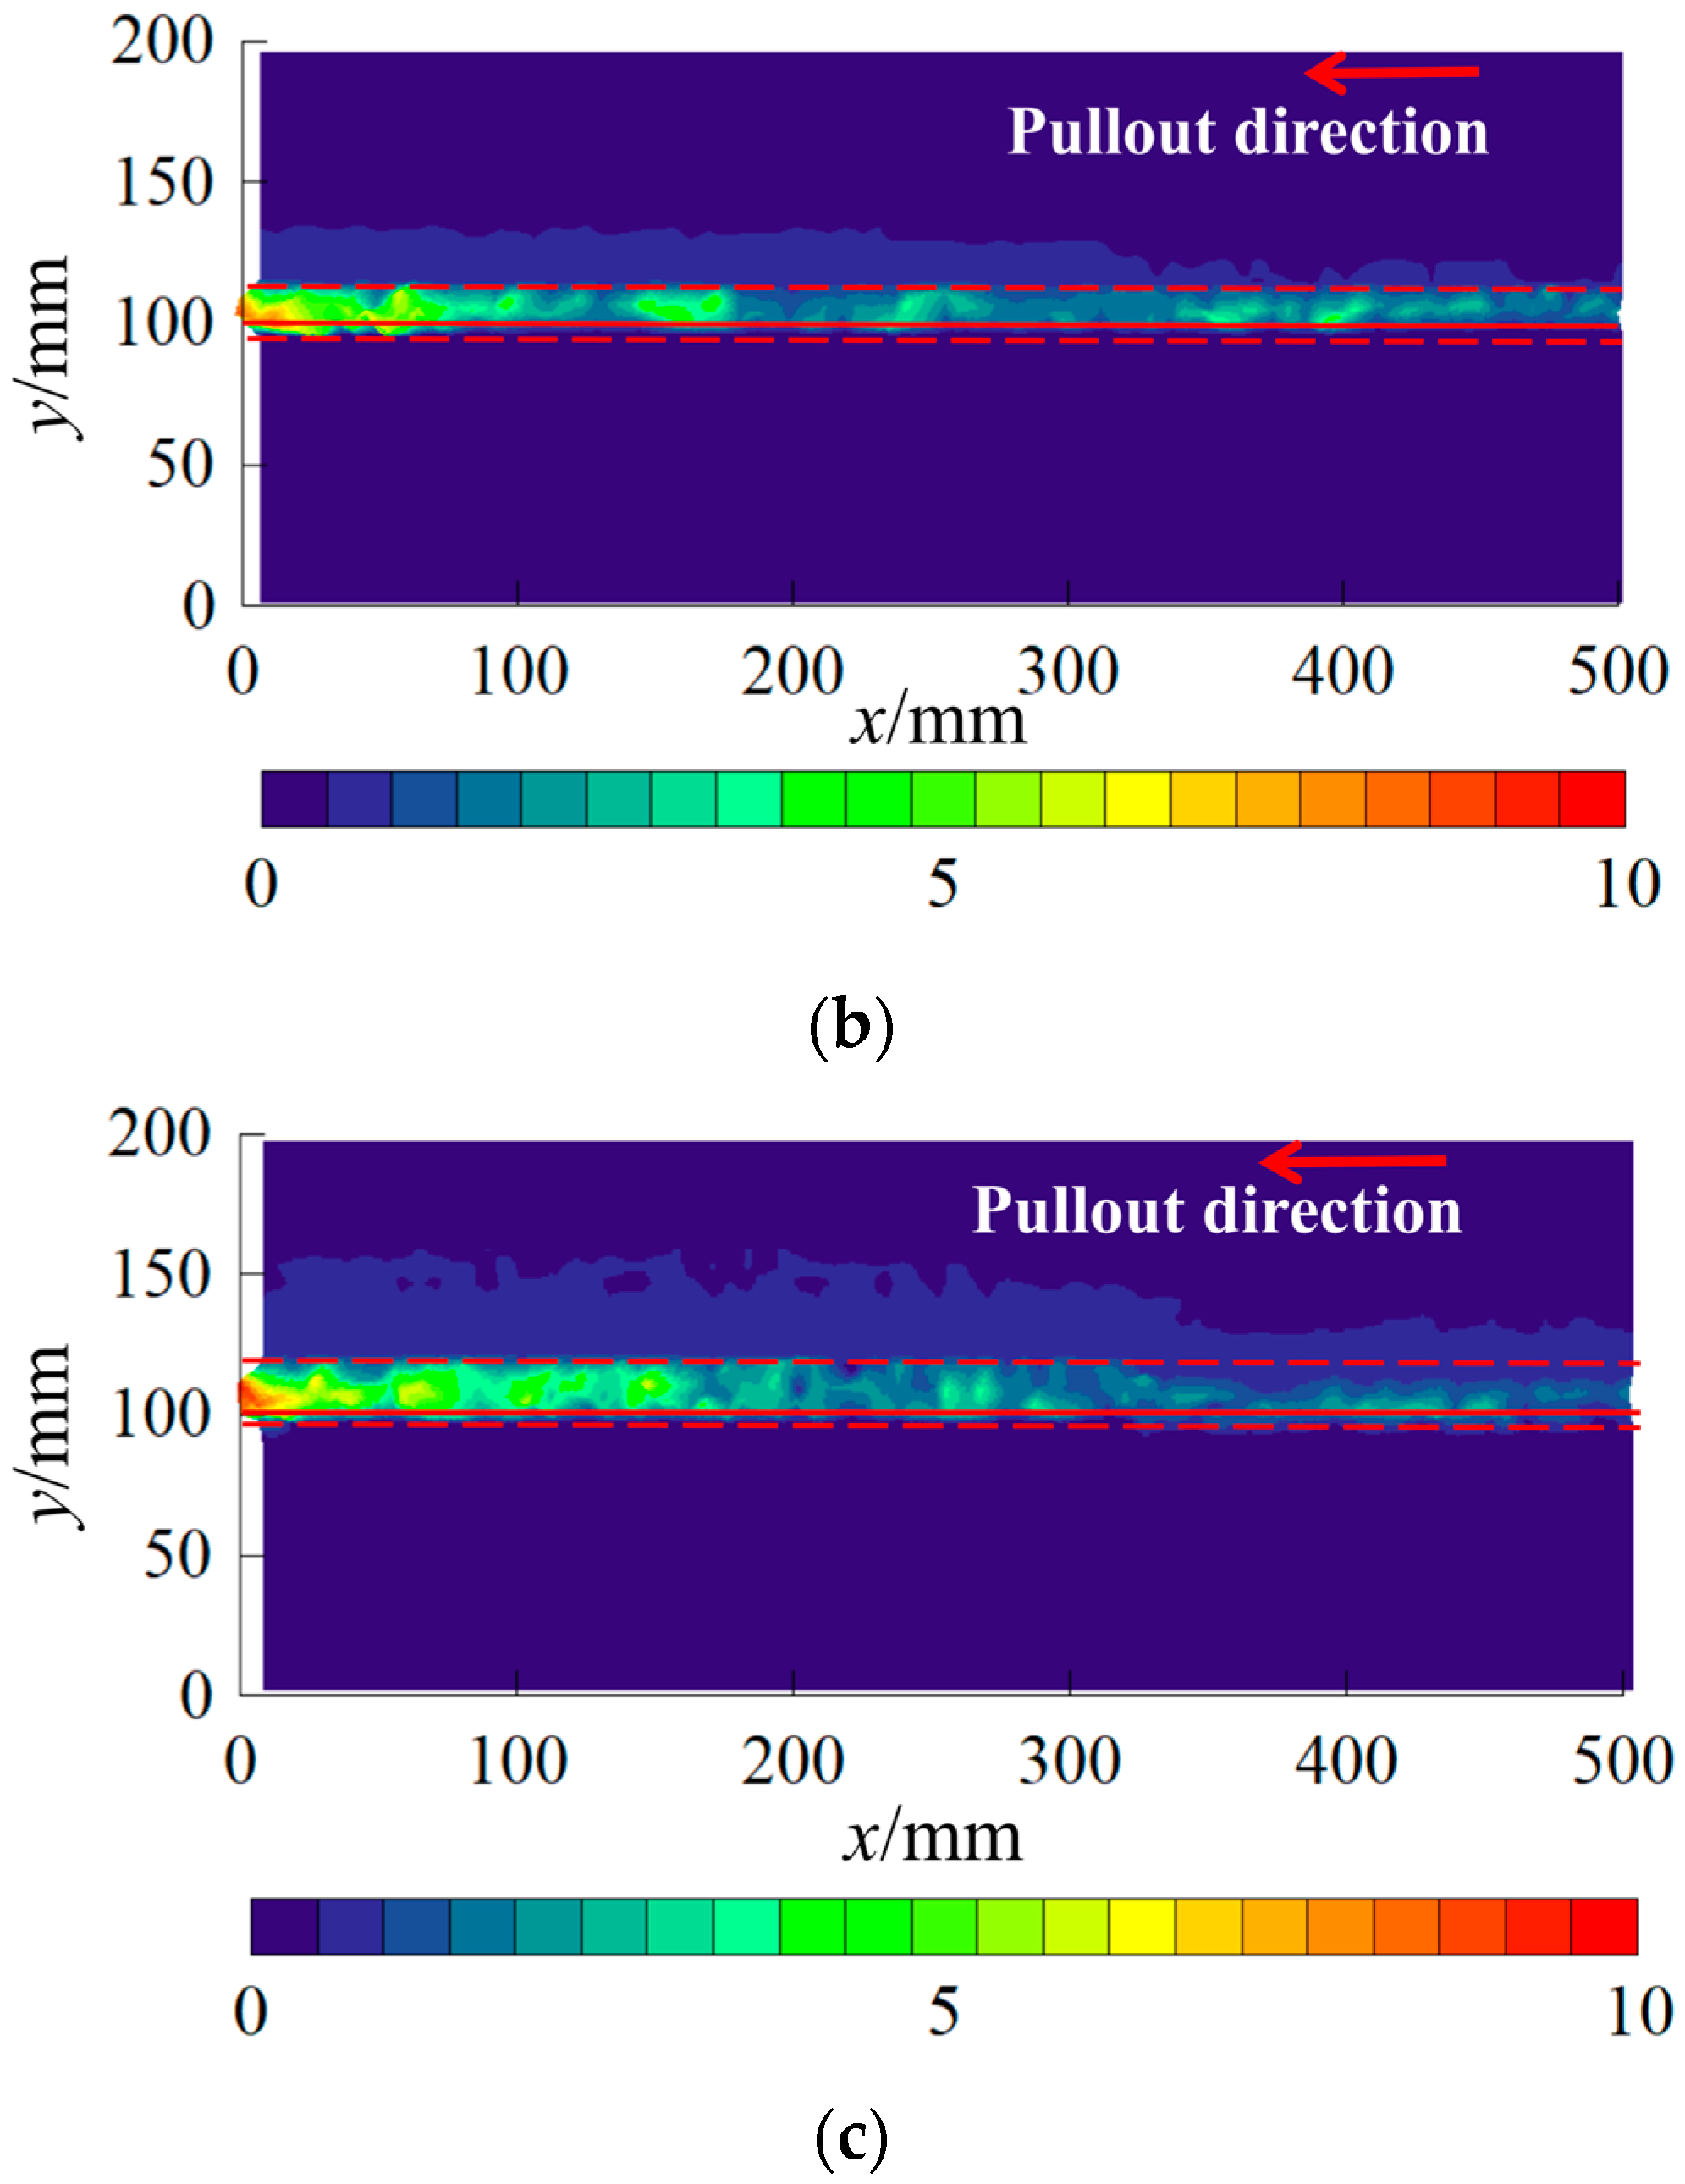
- With the normal stress increasing from 10 kPa to 20 kPa and 40 kPa successively, the peak value of the pullout force increased from 1.8 kN to 2.2 kN and 2.4 kN successively and the thickness of the shear band increased from 13 mm to 16 mm and 20 mm successively.
- (4)
- As the anchorage length increased from 100 mm to 300 mm and 500 mm successively, the peak pullout force increased from 1.3 kN to 1.6 kN and 2.2 kN successively and the thickness of the shear band increased from 11 mm to 14 mm and 16 mm successively.
- (5)
- As the pullout rate increased from 1 mm/min to 3 mm/min, the peak pullout force increased from 2.2 kN to 2.4 kN and the thickness of the shear band increased from 16 mm to 18 mm.
Author Contributions
Funding
Institutional Review Board Statement
Informed Consent Statement
Data Availability Statement
Conflicts of Interest
References
- Agarwal, A.; Ramana, G.V.; Datta, M.; Soni, N.K.; Satyakam, R. Pullout behaviour of polymeric strips embedded in mixed recycled aggregate (MRA) from construction & demolition (C&D) waste—Effect of type of fill and compaction. Geotext. Geomembr. 2023, 51, 405–417. [Google Scholar] [CrossRef]
- Abdi, M.R.; Mirzaeifar, H.; Asgardun, Y.; Hatami, K. Assessment of pegged geogrid (PG) pullout performance in coarse-grained soils using PIV analysis. Geotext. Geomembr. 2024, 52, 27–45. [Google Scholar] [CrossRef]
- Abdi, M.R.; Zandieh, A.R. Experimental and numerical analysis of large scale pull out tests conducted on clays reinforced with geogrids encapsulated with coarse material. Geotext. Geomembr. 2014, 42, 494–504. [Google Scholar] [CrossRef]
- Cardile, G.; Gioffrè, D.; Moraci, N.; Calvarano, L.S. Modelling interference between the geogrid bearing members under pullout loading conditions. Geotext. Geomembr. 2017, 45, 169–177. [Google Scholar] [CrossRef]
- Chen, C.; Duan, Y.; Rui, R.; Wang, L. Study of single and two-layer geogrid reinforced ballasted trackbed using pullout test and discrete element method. Rock. Soil. Mech. 2021, 42, 954–962. (In Chinese) [Google Scholar] [CrossRef]
- Ferreira, F.B.; Vieira, C.S.; Lopes, M.L. Pullout behavior of different geosynthetics—Influence of soil density and moisture content. Front. Built Environ. 2020, 6, 12. [Google Scholar] [CrossRef]
- Xu, Y.; Williams, D.J.; Serati, M. Influence of anchorage angles on pull-out resistance of geotextile wrap around anchorage. Geosynth. Int. 2018, 25, 378–391. [Google Scholar] [CrossRef]
- Ezzein, F.M.; Bathurst, R.J. A new approach to evaluate soil-geosynthetic interaction using a novel pullout test apparatus and transparent granular soil. Geotext. Geomembr. 2014, 42, 246–255. [Google Scholar] [CrossRef]
- Bathurst, R.J.; Ezzein, F.M. Geogrid pullout load–strain behaviour and modelling using a transparent granular soil. Geosynth. Int. 2016, 23, 271–286. [Google Scholar] [CrossRef]
- Derksen, J.; Ziegler, M.; Fuentes, R. Geogrid-soil interaction: A new conceptual model and testing apparatus. Geotext. Geomembr. 2021, 49, 1393–1406. [Google Scholar] [CrossRef]
- Dafalla, M.; Obaid, A. The Role of Polypropylene Fibers and Polypropylene Geotextile in Erosion Control. In Proceedings of the Second International Conference on Geotechnical and Earthquake Engineering, Lisboa, Portugal, 21–25 June 2013; pp. 669–676. [Google Scholar] [CrossRef]
- Agrawal, B.J. Geotextile: It’s application to civil engineering–overview. In Proceedings of the National Conference on Recent Trends in Engineering & Technology, Gujarat, India, 13–14 May 2011; pp. 1–6. [Google Scholar]
- Koerner, R.M. Early background and history of geotextiles. In Geotextiles: From Design to Applications; Koerner, R.M., Ed.; Woodhead Publishing: Amsterdam, The Netherlands, 2016; pp. 3–15. ISBN 9780081002346. [Google Scholar] [CrossRef]
- Kiffle, Z.B.; Steele, S.E.; Bhatia, S.K.; Smith, J.L. Use of Jute as a Sustainable Alternative for PP in Geotextile Tubes. In Proceedings of the Geotechnical Frontiers 2017, Orlando, FL, USA, 12–15 March 2017; pp. 369–378. [Google Scholar] [CrossRef]
- Chow, M.F.; Hashrim, H.; Chong, S.T.; Ng, Y.J. Investigating the effectiveness of Water Hyacinth Fiber Mat for Soil Erosion Control. In IOP Conference Series: Materials Science and Engineering; IOP Publishing: Bristol, UK, 2019. [Google Scholar] [CrossRef]
- Giménez-Morera, A.; Ruiz Sinoga, J.D.; Cerdà, A. The impact of cotton geotextiles on soil and water losses from mediterranean rainfed agricultural land. Land Degrad. Dev. 2010, 21, 210–217. [Google Scholar] [CrossRef]
- Artidteang, S.; Bergado, D.T.; Tanchaisawat, T.; Saowapakpiboon, J. Investigation of tensile and soil-geotextile interface strength of kenaf woven limited life geotextiles (llgs). Lowl. Technol. Int. 2012, 14, 1–8. [Google Scholar]
- Ramasubbarao, G. Strength behaviour of kerosene coated coir fiber-reinforced expansive soil. Facta Univ.—Ser. Arch. Eng. 2014, 12, 113–120. [Google Scholar] [CrossRef]
- Sumi, S.; Unnikrishnan, N.; Mathew, L. Surface Modification of Coir Fibers for Extended Hydrophobicity and Antimicrobial Property for Possible Geotextile Application. J. Nat. Fibers. 2017, 14, 335–345. [Google Scholar] [CrossRef]
- Sumi, S.; Unnikrishnan, N.; Mathew, L. Durability studies of surface-modified coir geotextiles. Geotext. Geomembr. 2018, 46, 699–706. [Google Scholar] [CrossRef]
- Marques, A.R.; Santiago de Oliveira Patrício, P.; Soares dos Santos, F.; Monteiro, M.L.; de Carvalho Urashima, D.; de Souza Rodrigues, C. Effects of the climatic conditions of the southeastern Brazil on degradation the fibers of coir-geotextile: Evaluation of mechanical and structural properties. Geotext. Geomembr. 2014, 42, 76–82. [Google Scholar] [CrossRef]
- Adajar, M.A.; Cutora, M.; Bolima, S.J.; Chua, K.J.; Isidro, I.A.; Ramos, J.V. Strength Performance of Nonwoven Coir Geotextiles as an Alternative Material for Slope Stabilization. Appl. Sci. 2023, 13, 7590. [Google Scholar] [CrossRef]
- Lal, D.; Sankar, N.; Chandrakaran, S. Effect of reinforcement form on the behaviour of coir geotextile reinforced sand beds. Soils Found. 2017, 57, 227–236. [Google Scholar] [CrossRef]
- Vinod, P.; Bhaskar, A.B.; Sreehari, S. Behaviour of a square model footing on loose sand reinforced with braided coir rope. Geotext. Geomembr. 2009, 27, 464–474. [Google Scholar] [CrossRef]
- Bhole, C.R.; Sunitha, V.; Mathew, S. Coir Geotextile Reinforcement for Sustainable Pavements: An Experimental Investigation into Structural Behavior. Int. J. Pavement Res. Technol. 2023, 1–14. Available online: https://link.springer.com/article/10.1007/s42947-023-00367-y (accessed on 1 January 2025). [CrossRef]
- Sudarsanan, N.; Mohapatra Sunil, R.; Karpurapu, R.; Amirthalingam, V. Use of Natural Geotextiles to Retard Reflection Cracking in Highway Pavements. J. Mater. Civ. Eng. 2018, 30, 04018036. [Google Scholar] [CrossRef]
- Anusudha, V.; Sunitha, V.; Mathew, S. Performance of coir geotextile reinforced subgrade for low volume roads. Int. J. Pavement Res. Technol. 2021, 14, 213–221. [Google Scholar] [CrossRef]
- Harinder, D.; Shankar, S. 10—Behavior assessment of poor subgrade soil using natural coir geotextile under static and repeated load condition. In Green Materials in Civil Engineering; GuhaRay, A., Hata, T., Iyer, N.R., Samui, P., Kumar, S., Eds.; Woodhead Publishing: Sawston, UK, 2024; pp. 153–164. [Google Scholar] [CrossRef]
- Yang, G. Lateral Deformation Characteristics of Geogrid Reinforced Earth Retaining Wall. Ph.D. Thesis, Beijing Jiaotong University, Beijing, China, 2005. (In Chinese). [Google Scholar]
- Wang, J.; Qi, H.; Lin, Z.; Tang, Y. Pullout test on geosynthetic reinforced sand based on digital image analysis. Rock. Soil. Mech. 2022, 43, 3259–3269. (In Chinese) [Google Scholar] [CrossRef]
- Li, Y.; Zhang, Q.; Lin, Z.; Wang, X. Spatiotemporal evolution rule of rocks fracture surrounding gob-side roadway with model experiments. Int. J. Min. Sci. Technol. 2016, 26, 895–902. [Google Scholar] [CrossRef]
- Sun, Z.; Zhang, D.; Li, A.; Lu, S.; Tai, Q.; Chu, Z. Model test and numerical analysis for the face failure mechanism of large cross-section tunnels under different ground conditions. Tunn. Undergr. Space Technol. 2022, 130, 104735. [Google Scholar] [CrossRef]
- Liu, S.; Zhang, Q.; Ma, B.; Li, Z.; Yin, W.; Lou, Q. Study on surface roughness effect on shear behavior of concrete-soil interface. Eng. Fail. Anal. 2023, 145, 107050. [Google Scholar] [CrossRef]
- JTG E50-2006; Test Method of Geosynthetics for Highway Engineering. Research Institute of Highway Science Ministry of Transport: Beijing, China, 2006. (In Chinese)
- Ye, Y. Study on Pullout Test Based on Transparent Soil Technology. Master’s Thesis, Tongji University, Shanghai, China, 2018. (In Chinese). [Google Scholar]
- Cai, X.; Feng, J.; Liu, W.; Li, S.; Huang, X.; Xu, H. Experimental study on interface friction characteristics of geosynthetics. Build. Struct. 2023; in press. (In Chinese). [Google Scholar] [CrossRef]
- Zhou, J.; Chen, J.; Xue, J.; Wang, J. Micro-mechanism of the interaction between sand and geogrid transverse ribs. Geosynth. Int. 2012, 19, 426–437. [Google Scholar] [CrossRef]
- Mirzaalimohammadi, A.; Ghazavi, M.; Lajevardi, S.H.; Roustaei, M. Experimental Investigation on Pullout Behavior of Geosynthetics with Varying Dimension. Int. J. Geomech. 2021, 21, 04021089. [Google Scholar] [CrossRef]


| Types of Fiber Geotextiles | Impact on Strengthened Soil | Ref. |
|---|---|---|
| PP (artificial fiber) | Soil erosion control | [11] |
| PE (artificial fiber) | Soil reinforcement | [12] |
| PET (artificial fiber) | Soil reinforcement | [13] |
| Jute (natural fiber) | Soil erosion control, drainage, filtration | [14] |
| Water hyacinth (natural fiber) | Soil erosion control | [15] |
| Cotton (natural fiber) | Soil erosion control | [16] |
| Kenaf (natural fiber) | Soil reinforcement | [17] |
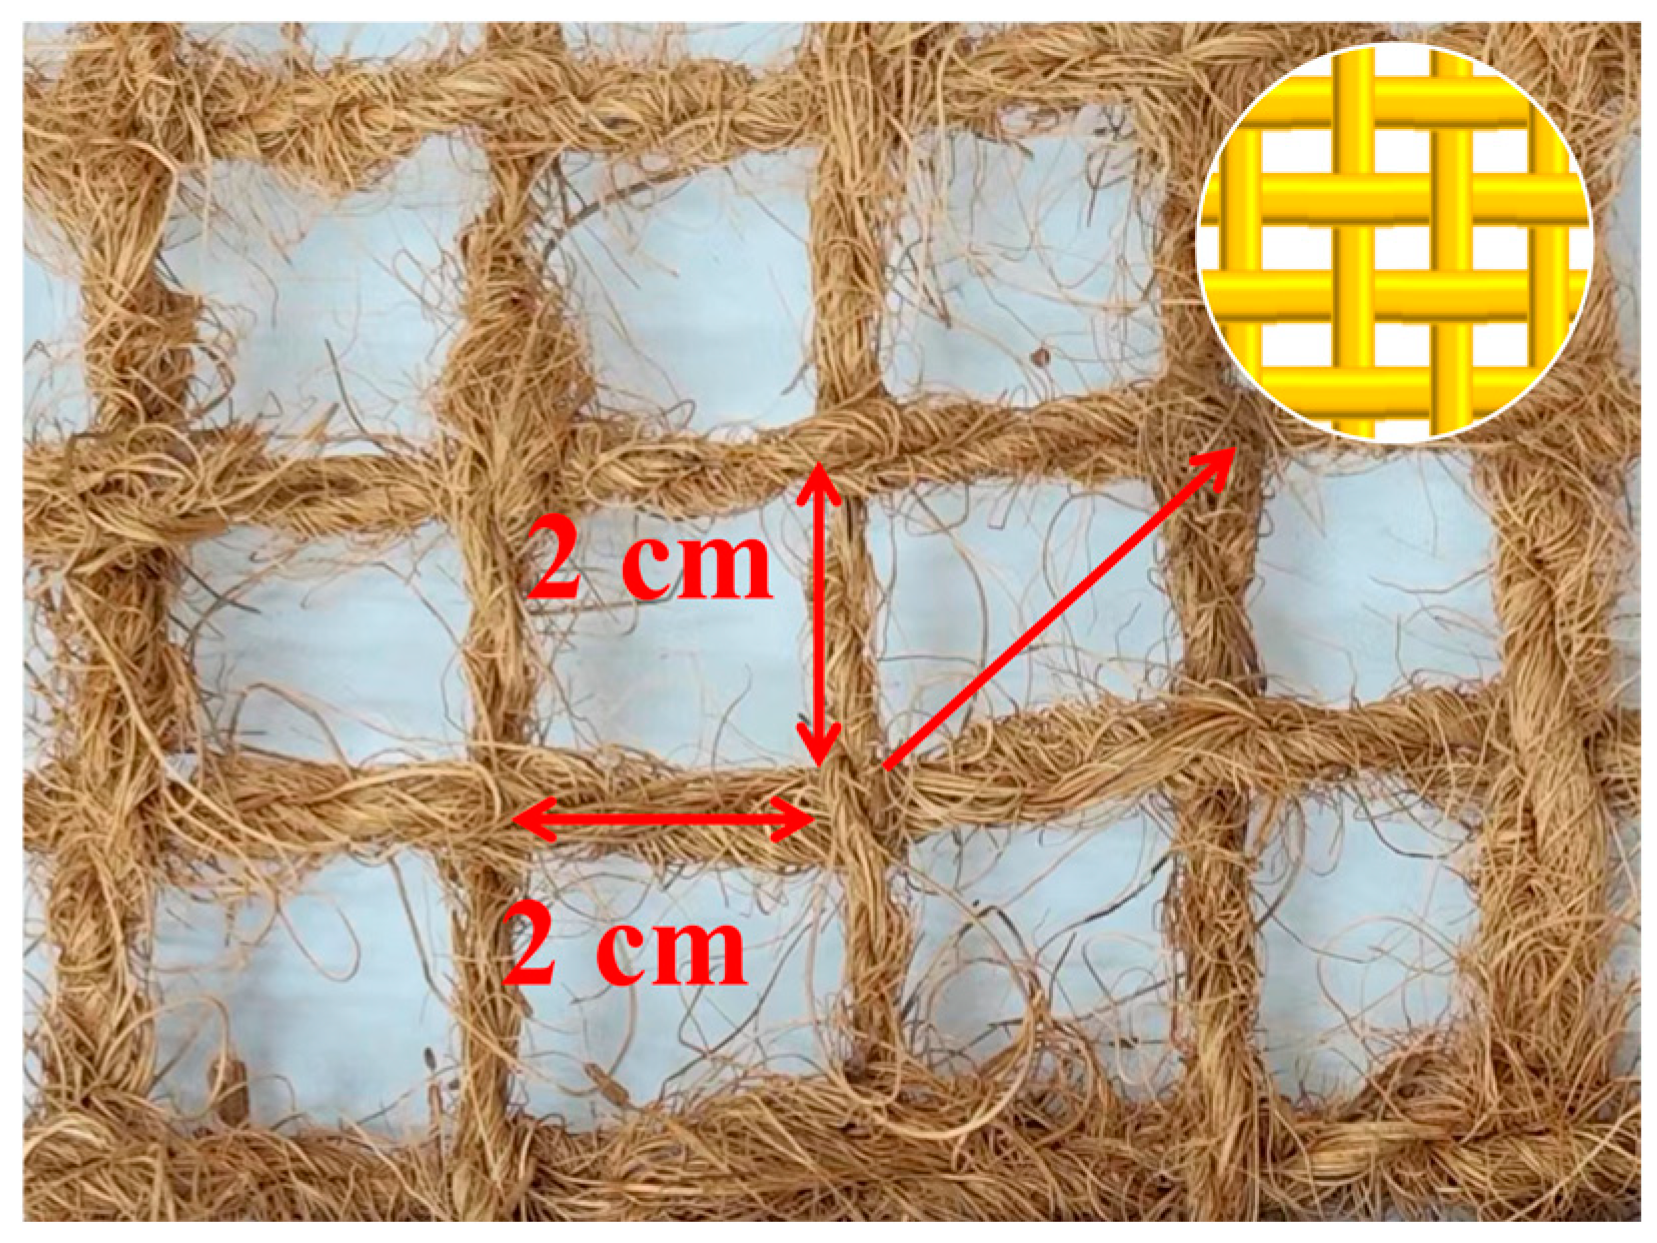
| Name | Mesh Size (mm) | Linear Density (tex) | Weight (g/m2) | Thickness (mm) | Width (mm) |
|---|---|---|---|---|---|
| Coir geotextile | 20 | 3933 | 401 | 3.6 | 300 |
| Group Number | Anchorage Length (mm) | Normal Stress (kPa) | Pullout Rate (mm/min) |
| 1 | 500 | 10, 20, 40 | 1 |
| 2 | 100, 300, 500 | 20 | 1 |
| 3 | 500 | 20 | 1, 3 |
Disclaimer/Publisher’s Note: The statements, opinions and data contained in all publications are solely those of the individual author(s) and contributor(s) and not of MDPI and/or the editor(s). MDPI and/or the editor(s) disclaim responsibility for any injury to people or property resulting from any ideas, methods, instructions or products referred to in the content. |
© 2025 by the authors. Licensee MDPI, Basel, Switzerland. This article is an open access article distributed under the terms and conditions of the Creative Commons Attribution (CC BY) license (https://creativecommons.org/licenses/by/4.0/).
Share and Cite
Li, L.; Li, H.; Cao, W. Experimental Study on Pullout Behavior of Coir Geotextiles Based on Transparent Soil. Appl. Sci. 2025, 15, 488. https://doi.org/10.3390/app15010488
Li L, Li H, Cao W. Experimental Study on Pullout Behavior of Coir Geotextiles Based on Transparent Soil. Applied Sciences. 2025; 15(1):488. https://doi.org/10.3390/app15010488
Chicago/Turabian StyleLi, Liangyong, Houyang Li, and Weiqiang Cao. 2025. "Experimental Study on Pullout Behavior of Coir Geotextiles Based on Transparent Soil" Applied Sciences 15, no. 1: 488. https://doi.org/10.3390/app15010488
APA StyleLi, L., Li, H., & Cao, W. (2025). Experimental Study on Pullout Behavior of Coir Geotextiles Based on Transparent Soil. Applied Sciences, 15(1), 488. https://doi.org/10.3390/app15010488