Abstract
To be applicable to real-world networks, a realistic evaluation of network measurement tools requires the conditions of the test network to be as similar as possible to the networks in which they are later deployed. Thus, having an existing real-world network which can be utilized for testing, while also allowing the reconfiguration of certain characteristics and features, is of significant interest to researchers. Providing the researchers with corresponding management tools with which they can introduce artificial conditions and topology changes into the network would help in realizing more realistic testbed setups and scenarios. The purpose of this study is to develop a configurable test environment based on the Control and Management Framework (OMF) to support researchers in a realistic empirical evaluation of network measurement tools. The proposed OMF-enabled test environment has the merit of automatizing the deployments and executions of any measurement experiments, collecting their final estimates, and then transporting them back to a single experiment controller without requiring any physical access to the corresponding experimental nodes used. It is demonstrated how the test environment can be used for the evaluation of network measurement experiments based on four representative case studies. These include validating the accuracy of end-to-end round-trip time and available bandwidth estimation tools, measuring the TCP and UDP throughput, and analyzing the impact of packet loss and jitter on VoIP performance, all conducted over dynamically adjusted testbed configurations. These case studies highlight the versatility and effectiveness of the OMF-enabled test environment, positioning it as a valuable tool for advancing the realistic evaluation of network measurement tools in controlled yet adaptable settings.
1. Introduction
To be applicable to real-world networks, the evaluation of network measurement tools requires the conditions of the test network to be as similar as possible to the networks in which they are later deployed. This similarity is essential for ensuring the tools are reliable, accurate, and practical in real-world usage scenarios [1,2,3]. Consequently, there is a growing interest among researchers in developing and utilizing test networks that allow for the reconfiguration of specific characteristics and features to simulate real-world conditions. These adaptable test networks enable controlled experimentation by providing the flexibility to emulate various operational scenarios, including routine traffic patterns and extreme edge cases. This capacity to dynamically adjust network parameters ensures a thorough assessment of the measurement tools’ effectiveness and robustness, offering valuable insights that enhance their deployment readiness [4].
A broad survey in the field of network measurement research reveals a special interest in the real-world conditions of two categories of network characteristics: Those related to traffic control and those related to topology control. The first category of real-world conditions affects the network traffic traversing a link. Examples in that category range from causing artificial queuing delays, packet losses, duplications, corruptions, and re-orderings to setting up traffic shapers or network components working with non-FIFO queuing disciplines [5,6,7]. The second category, focusing on topology control, encompasses conditions such as switching between ad hoc and infrastructure modes of wireless cards, introducing multiple bottlenecks by reducing interface speeds, and inducing packet anomalies through multipath diversities, route alternations, or asymmetric links. Some detailed survey studies on how such real-world conditions and topologies are used by network measurement tools are presented in [8,9,10].
The scientific goal of this study is to design, develop, and validate a test environment that enables researchers to evaluate the performance of network measurement tools under configurable challenges and real-world Internet conditions. This environment uses the Control and Management Framework (OMF) [11] to manage and control measurement experiments, facilitating the deployment, monitoring, and testing of protocols, tools, and applications across diverse and reconfigurable scenarios.
The proposed OMF-enabled test environment is designed and implemented with two key considerations for network measurement research. First, the test environment must offer comprehensive management tools that enable researchers to reconfigure various characteristics and features. These tools, combined with standard measurement utilities such as cross-traffic generators, passive packet analyzers, and benchmarking tools, allow researchers to simulate realistic conditions and topology changes. This flexibility supports the creation of detailed and customizable testbed setups and scenarios. Second, effective network experiments require well-defined testbed configurations. Our survey highlights common setups used in measurement experiments, encompassing both wired and wireless communications with diverse cross-traffic scenarios. By integrating these setups into the OMF framework through provided scripts, the test environment significantly reduces the effort required to perform typical network measurement experiments.
This study addresses these gaps by developing a configurable OMF-enabled test environment that facilitates the deployment, execution, monitoring, and experimentation of network measurement tools, protocols, and applications. The key contributions of this paper are as follows:
- The design and development of a configurable test environment for conducting network measurement experiments are proposed. Particularly, the test environment, organized in a grid network topology, envisages the separation of the so-called communication and research networks, where the dynamically routed devices within the communication network are used to access and configure the experiment devices within the research network. By using OMF as the experiment controller, researchers can easily setup any reconfigurable mixed wired/wireless testbeds and scenarios on the OMF-enabled research network without requiring any physical access to the corresponding research nodes used.
- To support researchers in defining and conducting their experiments on the proposed test environment, several OMF-based template scripts for well-known and frequently used third-party network management and measurement tools are provided. Currently, over twenty tools for artificially causing various network traffic conditions and topology changes have been integrated into the OMF-enabled test environment.
- Additionally, several configurable experiment descriptions have been prepared that can automatically setup typical evaluation testbed setups and scenarios on the OMF-enabled test environment. Currently, four common testbed setups and scenarios are provided as ready-to-use experiment description scripts: path-persistent and hop-persistent cross-traffic scenarios, mixed wireless and wired network scenario, and wireless ad hoc network scenario.
- Finally, the efficiency and applicability of the provisioned test environment, OMF-based template scripts and experiment descriptions are presented by validating the accuracies of several end-to-end round-trip time and available bandwidth (avail-bw) estimation tools and measuring the achievable throughput for TCP and UDP on a two-hop 802.11 g wireless ad hoc network.
The structure of this paper is organized as follows: Section 2 presents the related works, providing a review of existing testbeds and frameworks and highlighting the unique contributions of the proposed environment. Section 3 details the architecture of the OMF framework, explaining the roles of its core components and the workflow involved in conducting network experiments. In Section 4, the methods used to develop the testbed setup and integrate third-party tools are described, offering insights into how customizable network scenarios are established within the OMF environment. Section 5 presents four case studies, each demonstrating the application of the OMF-enabled testbed for various network measurement experiments. Finally, Section 6 concludes with a summary of the study’s key contributions and proposes potential directions for future research to expand the functionality and applicability of the test environment.
2. Related Works
In the related literature, several studies have been conducted to build test research networks for enabling experiments under real-world conditions. Chen et al. [12] introduced the Software Defined Topology Testbed (SDT), a cost-effective platform that allows researchers to construct reconfigurable network topologies using commodity switches. This testbed facilitates evaluations of network tools by simulating various topological scenarios, enabling dynamic testing under diverse conditions. Similarly, Chouman et al. [13] proposed a modular 5G+ testbed that integrates Radio Access Networks (RAN) with real-world User Equipment. The system supports full network functionality, including user-plane data handling, making it suitable for next-generation network research, such as 6G experiments. Callebaut et al. [14] extended these advancements with Techtile, a versatile research testbed designed for 6G technologies. Techtile provides fine-grained distributed resources for communication, positioning, sensing, and wireless power transfer, making it ideal for validating new algorithms and exploring hyper-connected interactive environments.
To enhance testbed control and monitoring, Morano et al. [15] developed an advanced experiment control and monitoring system for the LOG-a-TEC testbed. This system supports the real-time management of sensor networks and machine-type communications in indoor-outdoor setups, ensuring reliable and comparable experimental conditions. On the virtualization front, Muelas et al. [16] proposed a software-driven approach for defining virtual testbeds. Their method leverages network emulation and virtualization to mimic operational deployments, enabling reproducible testing of emergent technologies under cost-effective experimental setups.
IoT testbeds have gained considerable attention, offering platforms for both fundamental and applied research. Adjih et al. [17] introduced FIT IoT-LAB, a large-scale testbed comprising thousands of low-power nodes and mobile robots. This testbed supports IoT protocol evaluations and service testing, ranging from low-level communication stacks to high-level IoT applications. Similarly, Tsakalidis et al. [18] developed an IoT testbed using OpenHAB (https://www.openhab.org/, accessed date: 15 December 2024), integrating a variety of wireless protocols to test smart home automation systems, providing a flexible platform for evaluating wireless interfaces and sensors.
Testbeds addressing security concerns have also been developed. Candell et al. [19] built a cybersecurity testbed for industrial control systems, providing an environment for validating security protocols and studying performance degradation under cyberattacks. Pospisil et al. [20] designed a LoRaWAN security testbed using software-defined radios (SDR), enabling the exploration of practical vulnerabilities such as replay and bit-flipping attacks, along with their mitigation strategies.
For Software-Defined Networking (SDN) and advanced communication systems, innovative testbeds continue to emerge. Sharma et al. [21] compared prominent wireless testbeds, including Fed4Fire and COSMOS, for conducting SDN experiments on IoT networks. Their study evaluated performance metrics such as throughput, latency, and failure recovery times, showcasing the versatility of these platforms for experimental research. Buzura et al. [22] proposed a hybrid SDN testbed that integrates real hardware sensors with Mininet, enabling realistic testing of SDN-based systems. Sørensen et al. [23] presented an inexpensive Raspberry Pi-based testbed designed for network coding experiments, offering a replicable and cost-effective solution for testing communication and storage systems. Finally, Chamran et al. [24] developed a distributed platform combining Universal Software Radio Peripheral (USRP) devices with Raspberry Pi units. This setup supports autonomous decision-making in 5G device-to-device communication experiments, further highlighting the utility of Raspberry Pi-based platforms for wireless technologies.
These testbeds, however, have some significant limitations because they either (a) are based on fixed test topologies and do not allow to reconfigure the underlying testbed setups according to researchers’ experimental needs; or (b) only provide access to end hosts of experimental paths and do not allow to change the properties of the intermediate routing devices; or (c) do not have a sophisticated measurement management and collection system for automizing experiments; or (d) have not been designed for testing and evaluating network measurement experiments which require the integration of special network equipment (e.g., NICs allowing the adjustment of various interrupt coalescing features or Wi-Fi cards supporting various modes of communication and frequencies), software, and configuration during design and implementation phase.
The design and implementation of the proposed OMF-enabled test environment address all these limitations by offering a fully reconfigurable and flexible platform. It supports dynamic testbed setups, allowing researchers to adjust both end hosts and intermediate devices. The environment includes an advanced management and automation system for experiment control and data collection, significantly simplifying the process of conducting complex experiments. Furthermore, it is specifically tailored to integrate specialized hardware, software, and configurations, enabling researchers to evaluate network measurement tools under a wide variety of real-world conditions.
3. Overview of OMF Architecture
Before designing and implementing the OMF-enabled test environment, it is essential to understand the underlying structure and components of the OMF architecture. This section provides an in-depth look at the main components and how they interact to create a dynamic and scalable test environment. The step-by-step workflow for running an experiment using OMF is also examined, capturing the intricacies of each phase, from setup to data collection.
3.1. OMF Components and Their Functional Roles
The OMF architecture revolves around three core components that collaboratively control and manage network experiments. At the heart of the architecture is the experiment controller (EC), which serves as the experiment’s orchestrator. Acting as the primary driver of experiments within the OMF framework, the EC is responsible for interpreting the experiment specifications provided by researchers and executing the necessary commands to run these experiments. Researchers define their experiments using the Experiment Description Language (EDL), a high-level language specifically designed for the OMF platform. EDL allows researchers to articulate experiment parameters, tools, node specifications, and configuration details in a structured and accessible format. Once the EDL file is created, it is passed to the EC, which parses and processes the description to initiate the experiment setup. The EC’s capability to interpret and coordinate complex experimental procedures significantly streamlines the execution process.
The EC does not operate in isolation but instead works in concert with the Aggregate Manager (AM), which manages resource availability and oversees the general configuration of the testbed infrastructure. The AM is responsible for ensuring that each research node required for the experiment is available and configured correctly. This process includes managing the on/off status of nodes, loading appropriate node images, and maintaining detailed inventory and configuration information for each resource. Beyond these tasks, the AM also manages a measurement collection server, which plays a critical role in handling the data generated during experiments. By coordinating the data flow and storage, the AM simplifies data retrieval, enabling researchers to access their experimental results with minimal delay.
A key feature of the OMF architecture is its scalability, which is essential for managing extensive testbeds involving multiple resources. When a larger experiment setup is needed, multiple ECs and AMs can be added to the testbed, creating a modular system that maintains high performance while reducing the risk of bottlenecks. This scalability allows the OMF framework to adapt to both small and large experimental environments, providing efficient resource management even as the complexity and number of resources increase.
Each research node within the OMF-enabled testbed hosts a Resource Controller (RC). The RC acts as the executor of node-specific instructions and is deployed across all devices within the test environment. The RC’s primary function is to facilitate localized control over each node, receiving commands from the EC and executing them based on the specific requirements of the experiment. This distributed control architecture enables each node to be managed independently, enhancing the system’s ability to scale and respond quickly. In a testbed with many nodes, this localized control ensures that each node operates autonomously without relying on a central point for every action, thereby improving responsiveness and reducing latency.
The three components—EC, AM, and RC—form a cohesive and interdependent architecture where each part plays a vital role. The EC oversees the experiment’s broader scope, coordinating the resources managed by the AM and executing tasks on each node through the RC. This interconnected structure not only allows for a high level of control and precision in experiments but also accommodates the diverse needs of network measurement research, making it a suitable choice for both simple and complex experimental setups.
3.2. OMF Experiment Workflow
The workflow of a typical OMF experiment is illustrated in Figure 1, which captures the sequence of interactions between the EC, AM, and RC. This process begins with the researcher specifying the experiment parameters in an EDL file. The EDL file serves as a blueprint for the experiment, detailing the configuration of each node, the specific measurement tools required, and the actions that each node will undertake. Once this file is passed to the EC, it interprets the commands within the file, translating high-level experiment descriptions into executable instructions.
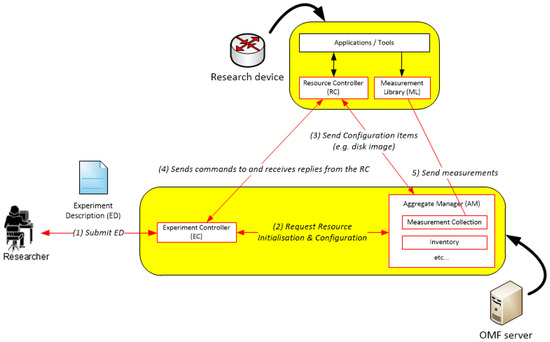
Figure 1.
Overview of OMF architecture.
Following interpretation, the EC communicates with the AM to verify the availability of all necessary resources. The AM checks the current status and configuration of each node designated for the experiment, ensuring that each node is loaded with the correct images and prepared for deployment. If a node requires initialization or reconfiguration, the AM initiates the setup process by sending specific commands to the RC on that node. This setup phase includes tasks such as loading operating system images, configuring network interfaces, and ensuring that each node meets the experiment’s prerequisites. The AM then informs the EC once all nodes have been configured properly.
Once the nodes are ready, the EC proceeds to start the experiment by sending execution commands to the RCs on each node, initiating the measurement applications or tools specified in the EDL file. At this stage, each RC controls the local operations of its node, executing the tasks assigned by the EC independently. This localized execution allows for parallel operations across multiple nodes, which is particularly valuable in experiments that involve distributed network measurements or simulations. By enabling each node to operate independently under the EC’s coordination, the OMF architecture minimizes delays and optimizes the experiment’s overall efficiency.
During the experiment, data collected by measurement applications on each node is transmitted to the OMF measurement library (OML). The OML functions as an intermediary data handler, responsible for capturing, storing, and, if necessary, preprocessing measurement data. Preprocessing may involve performing calculations, such as sums, averages, or products, directly on the data before it is stored in the measurement collection service managed by the AM. This pre-processing capability reduces the need for additional data handling after the experiment, allowing researchers to access processed results almost immediately after the experiment concludes.
The measurement collection service, managed by the AM, is central to data retrieval and analysis. By centralizing the collection of experiment data, the AM provides a streamlined system where results from each node are readily accessible in a unified format. The AM’s measurement collection service also simplifies post-experiment analysis by organizing the data based on each measurement’s origin and parameters, enabling researchers to interpret results efficiently. This structure is particularly beneficial for experiments involving large amounts of data or multiple data types, as it provides an organized framework for managing complex datasets.
In large-scale experiments, scalability is further supported by the modular nature of the EC-AM-RC structure, which allows for the addition of multiple ECs and AMs when required. This flexibility ensures that even extensive experiments involving hundreds of resources can maintain optimal performance and stability. By connecting additional ECs and AMs, the architecture adapts to increased demands without sacrificing efficiency or control, making it ideal for conducting high-impact network measurement experiments that simulate real-world conditions.
Overall, the OMF experiment workflow, as demonstrated in Figure 1, exemplifies a structured yet adaptable process for conducting network experiments. From the initial specification in the EDL file to the final data collection and processing, each stage of the workflow is designed to facilitate a seamless experiment experience. This robust and modular approach enhances the OMF architecture’s applicability to a wide range of research objectives, supporting not only network measurement studies but also more complex, large-scale experimental designs.
While the OMF framework provides a robust foundation for managing and automating network experiments, it is primarily a software tool that lacks concrete physical implementation and pre-configured templates tailored to specific research needs, requiring researchers to manually integrate hardware, tools, and configurations. The proposed OMF-enabled test environment addresses these limitations by integrating OMF with physical nodes, third-party measurement tools, and predefined templates, offering a fully implemented, reconfigurable testbed. This setup simplifies the deployment of complex experiments, enables dynamic customization, and bridges the gap between theoretical frameworks and practical applications, providing a scalable and efficient platform for realistic and reproducible network measurements.
4. Methods
This section outlines the methods used to setup the OMF-enabled testbed, integrate third-party measurement tools, and configure customizable experiment scenarios. By leveraging OMF’s flexible architecture, the testbed enables realistic network simulations and efficient tool evaluations across varied conditions. Each subsection describes the procedures for configuring the testbed, implementing tools, and developing reconfigurable templates to enhance testing accuracy and consistency.
4.1. Testbed Setup
The current test environment, on which OMF has been enabled, initially consists of nine test nodes (TNs) arranged in a grid network, as illustrated in Figure 2. Each TN on the OMF-enabled testbed consists of the couple communication device and research device. Communication devices are mainly used to enable access to the provided research devices. Research devices, on the other hand, are only used for running experiments and can, in turn, form their separate research networks according to a specified experiment description. Each communication and research device forming a TN is directly connected over a point-to-point link.
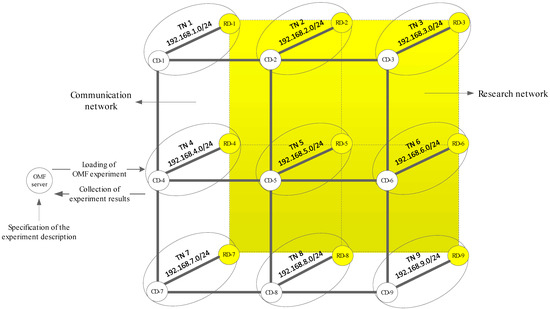
Figure 2.
Current OMF-enabled testbed.
The communication devices forming the access network to the research devices are running an Ubuntu 24.04 operating system. To connect the communication devices to each other, the Quagga network routing software suite, which provides an implementation of the Routing Information Protocol (RIP), was used to manage dynamic routing and communication in the network. The research devices, also running Ubuntu 24.04, are equipped with 4 GB of RAM, 256 GB of storage, three wired Gigabit Ethernet interfaces and one wireless dual-band Linksys interface.
The testbed uses private IPv4 address space in the 192.168.0.0/24 range. The local network range is 192.168.N.0/24, where N is the number of TNs in the test environment. Communication devices of the testbed are reachable as 192.168.N.1 from within the test environment whereas research devices are accessible via 192.168.N.2. Finally, another machine serving as server component, equipped with 4 GB of RAM and Gigabit Ethernet network interfaces, acts as the OMF server. On this host, the EC and AM components are operated which provide experiment controlling services.
The proposed OMF-enabled test environment provides the benefit that it automatizes the deployments and executions of any measurement experiments, collect their final estimates, and then transport them back to the experiment controller without requiring any physical access to the corresponding experimental nodes used. Furthermore, additional third-party management and measurement tools can easily be integrated into the OMF architecture to provide a more comprehensive test environment. Finally, independently administered OMF-enabled network segments can simply be federated together to form a uniform management domain.
4.2. Integration and Use of Third-Party Tools in OMF
This section presents how a third-party tool can be integrated into the OMF measurement library and how it can be used in an experiment.
The task of integrating and using a tool in OMF consists of three steps. These are (i) creating the measurement point definitions inside the source code of the tool, (ii) creating the tool definition file, and, finally, (iii) integrating and using the tool in OMF experiments. To explain these stages in more detail, we use the pathload [25] tool which estimates the end-to-end avail-bw on a path and converges to a range of avail-bw that is defined by a lower and upper bound value. From a practical point of view, a user can run this tool by starting a measurement client and server at the sender and receiver hosts, respectively. The client is responsible for sending the carefully scheduled probing packets which are received and analyzed by the server to estimate the final avail-bw range on the receiver host.
As the first stage, the source code of this tool should be extended with measurement points so that it sends the final estimation to the OML server instead of the standard output. In this case, we defined two measurement point metrics: the lower and upper bound avail-bw estimates. In OMF terminology, this extended version is also called the OMLized tool. To be able to use this OMLized tool in an OMF experiment, declaration of a corresponding OMF tool definition is needed as the second stage. A tool definition can be viewed as an interface that makes the OMF EC aware of the tool. More specifically, it defines which parameters the tool accepts, which measurement points it provides, and where to find the tool to be executed. Since pathload is a both-ended tool requiring the cooperation of the sender and receiver components, an additional tool definition should be written for its sender component, too. However, since the actual measurements are only performed by the receiver component, the tool definition file for the sender component does not provide any declarations of measurement points.
Finally, to run an experiment with pathload in OMF, the experiment scenario should be described in an experiment description file. It contains detailed descriptions of the resources involved in an experiment and the sets of actions to perform in order to realize that experiment. In this case, the resources are two research nodes acting as the sender and receiver hosts running the client and server components of the tool. The action corresponds to the start of these components with appropriate parameters to perform the measurement.
Usually, the duration of an OMF experiment will be explicitly customized in the experiment description file. However, since the pathload tool is based on an iterative algorithm that converges to a final estimate depending on current network conditions, its exact duration cannot be anticipated in advance. Thus, for the parallel termination of the pathload tool and the experiment description executions, we use event-driven mechanisms that are provided by the OMF framework. More specifically, the EC holds and updates an XML tree of states about the running experiments and the involved resources that can periodically be observed and caught via event-driven mechanisms. Examples of some experiment states include the start of a tool or its termination with success or failure. Fortunately, OMF allows querying such states during the experiment runtime. Thus, using an event-driven mechanism, whether or not the pathload execution has finished is checked. If yes, a corresponding final event is triggered for terminating the entire experiment.
The procedure for integrating and using tools in OMF is of generic nature and can be applied to all third-party tools. To enrich the test environment with more OMLized tools, we performed a survey of the literature related to network management and measurement research in order to identify the well-known and most often used tools. Our initial review resulted in the list of tools shown in Table 1 that are mainly categorized as management, measurement, and security tools. At the time of writing this paper, most of these tools have already been integrated into OMF to support experiments.

Table 1.
Survey of typical network management, measurement and security tools.
4.3. Configuring Testbed Scenarios in OMF
In addition to the provided management and measurement tool templates, we also provide sample experiment descriptions that can realize some representative wired and wireless testbed setups and scenarios from the related literature. In Figure 3, four common example scenarios are presented.
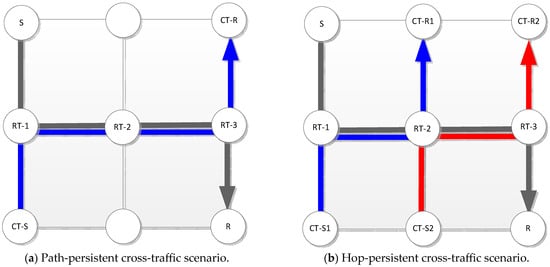
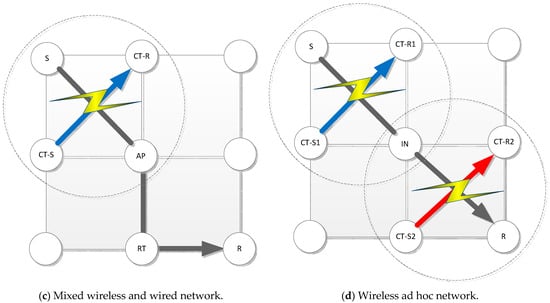
Figure 3.
Some representative testbed scenarios from related literature for evaluating network estimation tools. The black arrow represents the measurement data, while the blue and red arrows indicate independent cross-traffic flows. Abbreviations: S, sender; R, receiver; RT, router; CT-S, cross-traffic sender; CT-R, cross-traffic receiver; AP, access point; IN, intermediate node.
We distinguish two types of traffic: probe traffic and artificial cross-traffic. The former will be generated by the researcher’s tool to be evaluated. The latter will be generated by cross-traffic tools provided by our template experiment description files.
Testbed 1: Path-persistent cross-traffic scenario on a wired testbed with four hops: The first case, illustrated in Figure 3a, considers a path-persistent cross-traffic scenario, meaning that the cross-traffic generator components will be deployed on both end hosts and their generated cross-traffic will be transmitted over the same path to be probed.
Testbed 2: Hop-persistent cross-traffic scenario on a wired testbed with four hops: The second test scenario, illustrated in Figure 3b, considers hop-persistent cross-traffic behavior. As in the first case, the probing traffic traverses the entire path between sender and receiver hosts. However, differently from the first scenario, for each hop, a separate cross-traffic generator with a different burstiness degree and behavior can be defined.
Testbed 3: Three-hop testbed consisting of a mixture of wireless and wired links: As shown in Figure 3c, differently from the two previous testbeds, a path made up of a mixed of wireless and wired links is considered. Two pairs of sender and receiver nodes are communicating with each other over one shared medium.
Testbed 4: Two-hop wireless ad hoc testbed: This type of network configuration is usually used to cover larger areas. The transmission range of the radio is very limited. Some devices might not be able to communicate directly to each other because of their limited radio range. These networks need other intermediate nodes to forward messages. In such cases, intermediary devices act as relays. Figure 3d illustrates communication in the worst-case scenario through two hops before reaching its final destination.
The experiment descriptions provided for the testbed setups and scenarios, as illustrated in Figure 3a through Figure 3d, include (i) the node definitions for S, R, RT, CT-S, CT-R, AP, and IN as well as their network configurations including routing entries; (ii) the tool definition files of the cross-traffic generators on nodes CT-S and CT-R as well as their parametrization; and, finally, (iii) regulation of parallel experiment executions (i.e., starting the cross-traffic generator and the probing tool concurrently) and their synchronous termination.
Before using the provided experiment description files, the researcher should only configure (i) the names of the research nodes to be used for the experiment; (ii) the settings of the cross-traffic configuration (i.e., rate, packet size, distribution etc.); and (iii) the settings of their own measurement tool they want to evaluate. To be able to execute the provided experiment description files, the researchers should ensure that the proposed OMF-enabled test network includes the required number of research nodes that are involved in the experiment scenario. Furthermore, in the case of wireless experiments, research nodes should not be out of range.
5. Case Studies on the OMF-Enabled Testbed
This section demonstrates how the proposed OMF-enabled test environment can be used for the validation of network measurement experiments based on four representative case studies which, in turn, use the four testbed setups and scenarios illustrated in Figure 3a–d.
5.1. Case Study 1: Round-Trip Time Measurements
In this section, the accuracy of a passive RTT measurement tool, named the RTT-tool [26], is validated using the results of two active ping tools as reference values. More specifically, the measurements of the passive TCP-based RTT-tool are compared with the results of two active ICMP-based and UDP-based approaches which, hereafter, are referred to as icmpping and udpping, respectively. As the names of the tools suggest, icmpping uses ICMP Echo Request and ICMP Echo Response packets, whereas udpping is based on sending and receiving UDP request and UDP response datagrams, respectively.
The RTT is the total time taken for a packet to travel from the sender to the receiver and back to the sender. It is expressed as:
In Equation (1), represents the time spent waiting in queues due to congestion or scheduling delays, while is the time required for the signal to propagate through the medium, such as fiber optics or copper wires. The term accounts for the time needed to push the packet bits onto the link, depending on the link bandwidth, and refers to the time taken by intermediate devices like routers to process and forward the packet. Together, these components determine the total RTT under symmetric and additive delays.
The passive RTT-tool implements the SYN/ACK (SA) methodology, which measures the RTT during the setup of a TCP connection. Establishing a TCP connection consists of a sequence of three segments: SYN, SYN/ACK, and ACK, collectively called the three-way handshake (TWH). The passive RTT-tool, placed anywhere on the path between the client and server, measures the RTT by observing these three consecutive segments. The arrival times of the initial SYN segment () and the ACK segment () following the SYN/ACK segment () are recorded. Subsequently, the end-to-end RTT can be determined using the equation:
In Equation (2), is the timestamp when the SYN segment is sent, is the timestamp when the ACK segment is received, and represents the calculated round-trip time based on the passive methodology. Although is part of the process, it is not directly used in the final calculation. Accurate measurement requires that none of the three segments are lost and that the client or server sends the segments immediately [27].
To validate the results of the passive RTT-tool against the ones of the active icmpping and udpping tools, a similar experimental methodology used in [27] was implemented in an experiment description file using the testbed setup and configuration illustrated in Figure 3a. Particularly, as the SA methodology examines the TWH phase of a TCP connection, the active ping measurements, the results of which are used for reference purposes, are collected just before the connection establishment.
The Apache web server operated on research node R illustrated in Figure 3a forms the measurement target. An available HTTP file, larger than 10 KB, is provided by the web server. First, to actively measure the RTTs of the path which will represent the reference values for the SA estimations, the prepared experiment description file first triggers the active ping measurements from research node S to research node R. Immediately after the RTT for the path has actively been measured by icmpping and udpping, the experiment description file causes the client to download the HTTP file from the target research node R using the GNU Wget utility over the same path. After the transfer is over, the RTTs of the HTTP-TCP transfer for the same path is passively estimated by the RTT-tool. Finally, the RTT passively estimated by the RTT-tool is compared to the average one of the ten active icmpping and udpping measurements.
The varying queuing times simulating the required real-world condition during the measurements were also specified in the experiment description file. Particularly, in the web server machine, the delay of packet forwarding has been controlled using the netem tool which was configured to cause 100 different randomly set queuing delay variations between 50 ms and 400 ms. For each of the randomly set queuing time, the average of the 10 ping measurements was used as a basis for comparison with the SA estimates.
Figure 4 illustrates the passive TCP-based SA estimates in comparison with the corresponding active ICMP-based and UDP-based ping measurements for the same end-to-end path between research nodes S and R. Analogously to the methodology used in [27], an SA estimate for the end-to-end connection is categorized as accurate if it is within 5 ms or 10% of the corresponding average active ping measurement. The dashed lines in Figure 4 illustrate this accuracy region. With this error tolerance, it is observed that compared with the results obtained by using icmpping and udpping, the fraction of inaccurate measurements of the RTT-tool is 6% and 9%, respectively. It can be concluded that RTT-tool, though passive, produces comparable RTT estimates to that measured by the two active ping tools.
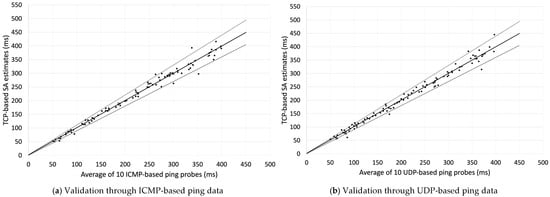
Figure 4.
Comparison of the passive TCP-based SA estimates with the average of ten active ICMP-based and UDP-based ping measurements just before the TCP connection establishment.
5.2. Case Study 2: Available Bandwidth Estimations
In this section, the estimation accuracies of various end-to-end avail-bw estimation tools, namely pathload [25], spruce [28], wbest [29], and pathchirp [30], are evaluated on two different testbed setups and cross-traffic scenarios.
The avail-bw is defined mathematically as:
In Equation (3), represents the capacity of the link, and denotes the utilization of the link over a particular time period. This equation provides the foundational metric for comparison between the tools under test and the MRTG derived ground truth.
First, the estimation accuracies of pathload and spruce are validated through the results obtained by performing passive measurements using the Multi Router Traffic Grapher (MRTG). Pathload estimates the avail-bw by generating periodic probe packets and analyzing the one-way delay trends of these packets. The tool measures the difference in inter-arrival times of packets between the sender and receiver, expressed as:
where and are the inter-packet time differences between the sender and receiver, respectively. When the delay increase becomes significant, it indicates that the probing rate exceeds the avail-bw, allowing pathload to converge on an accurate estimation of avail-bw.
Spruce uses a packet pair dispersion model to estimate avail-bw. The dispersion of two packets, sent back-to-back, is used to calculate the estimate as:
In Equation (5), is the size of the packets, is the time difference between the arrivals of the two packets at the receiver, and C is the known capacity of the link. Spruce relies on the assumption that cross-traffic does not fully utilize the link’s capacity.
MRTG estimates avail-bw based on the difference between the measured traffic utilization and the total link capacity over a 5 min period. The average avail-bw is calculated as:
where is the number of samples collected over the 5-minute period, is the total link capacity, and is the measured utilization at sample . MRTG provides a low-resolution, passive measurement that serves as a benchmark for evaluating active tools.
MRTG is a widely used tool for monitoring and visualizing network traffic, providing detailed insights into bandwidth utilization across links. More specifically, assuming that MRTG is able to obtain the same available bandwidth (avail-bw) as the pathload and spruce tools under test, it can provide reference values (i.e., the ground truth avail-bw) against which estimates from both active tools are compared to indicate their consistency and accuracy. In the literature, MRTG data are considered one of the most accurate methods for verifying the output of active avail-bw estimation tools.
The experiments of pathload, spruce, and MRTG have been specified in an experiment description file using the testbed setup and configuration illustrated in Figure 3b. Consider the end-to-end path consisting of four links between the research nodes S and R acting as the sender and receiver hosts. The pathload and spruce tools with their sender and receiver components are started along the path to estimate the end-to-end avail-bw. By assuming the previous knowledge of the capacity of all traversed links and running the MRTG on each node of the measurement path, avail-bw on each link segment can be measured separately. Concatenation of avail-bw measurements of different link segments enables us to estimate this metric at the end-to-end scope. Thus, upon the end of the experiment, the avail-bw is measured in two different ways. Firstly, two independent estimates are given by pathload and spruce actively, and another estimate is given by MRTG passively. Finally, a comparative evaluation of the estimates can be undertaken to assess the accuracy of the tested active tools. However, MRTG data provides low-resolution measurements and enables us to calculate the average avail-bw every 5 min. To comply with this low resolution, pathload and spruce are executed repeatedly, and the 18 measurements are smoothed by taking the average estimates of the tools over similar 5 min periods.
The D-ITG tool, which simulates the real-world cross-traffic conditions during the experiments, was also integrated into the experiment description file. In our experiments, two pairs of D-ITG senders and receivers were started on CT-S1/CT-R1 and CT-S2/CT-R2 research nodes to simulate hop-persistent cross-traffic scenarios. Particularly, the two paths between CT-S1/CT-R1 and CT-S2/CT-R2 crossing the measurement path were loaded with poissonian and exponential cross-traffic, respectively, with varying rates from 10 to 90 Mbps. The measurement path has been monitored over a period of one hour.
Figure 5a illustrates the results achieved by pathload, spruce and MRTG. As pathload only gives the lower and upper bound estimates for avail-bw, the average of these two values was calculated to obtain the final estimate. The main observation is that pathload was consistently inaccurate, over-, or underestimating the avail-bw. Particularly, compared to the reference avail-bw measurements obtained by MRTG, the underestimation error of pathload ranges from 6.64% to 59.25%, whereas the overestimation error varies between 3.10% and 31.60%. In our previous study [31], we showed that the estimation results of pathload, in general, was accurate when during the measurement cross-traffic with constant rates was available on the path. These experiments, however, indicate that if cross-traffic with rapidly varying rates passes the measurement path, the tool is not able to capture the avail-bw with sufficient accuracy. In contrast to pathload, spruce was able to relatively closely track the avail-bw and correctly respond to injected cross-traffic variations. More specifically, compared to the reference avail-bw measurements obtained by MRTG, the underestimation error of spruce ranges from 1.53% to 10.90%, whereas the overestimation error varies between 3.28% and 12.89%.
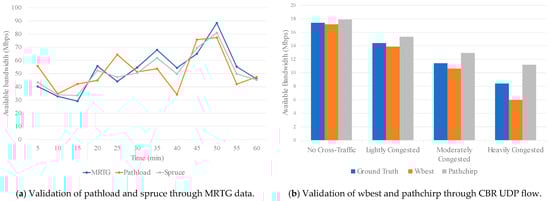
Figure 5.
Validation of end-to-end avail-bw estimation tools.
Another experiment scenario for evaluating the estimation accuracies of wbest and patchirp has been specified in a separate experiment description file using the testbed setup and configuration illustrated in Figure 3c. As distinct from the two previous experiments, this scenario includes a mixed combination of wireless and wired links, which pose additional challenges to avail-bw estimation techniques. The main difficulty in performing avail-bw measurements over wireless links is the existence of a shared medium. Particularly, wireless nodes communicating over a shared medium can face several issues such as collisions and packet losses, which normally do not occur in wired networks. Using the ethtool, the WiFi mode of the wireless link has been set to 802.11 g. The sender and receiver components of wbest and pathchirp were run on research nodes S and R, respectively. The D-ITG sender and receiver components, on the other hand, were started on research nodes CT-S1 and CT-R1, respectively, to simulate the real-world condition of constant cross-traffic. In total, four different cross-traffic scenarios were created to investigate their effects on wbest’s and pathchirp’s avail-bw estimates. Particularly, wbest and pathchirp measurements were conducted when the shared medium is (a) free of cross-traffic, (b) lowly congested (i.e., appr. 3 Mbps), (c) moderately congested (i.e., appr. 6 Mbps), and, finally, (d) heavily congested (i.e., appr. 9 Mbps). Each experiment was repeated 20 times and average accuracies were then calculated. Differently from the previous experiment, where the true avail-bw has been obtained using the MRTG data, the reference value in this experiment scenario is approximated by the throughput of a single constant bitrate (CBR) UDP flow with a packet size of 1500 Byte. When the wireless channel is idle, the measured ground truth throughput shows the avail-bw of appr. 17.40 Mbps.
The achieved results are illustrated in Figure 5b. In the ideal case, where no cross-traffic is available in the shared medium, wbest and pathchirp yield acceptable estimation errors of 1.26% and 2.87%, respectively, i.e., the produced avail-bw estimates are close to the ground truth. In lowly congested scenario, wbest and pathchirp yield estimation errors of 3.75% and 6.45%, respectively. In moderately congested scenario, the observed estimation errors of wbest and pathchirp increase to 6.84% and 13.50%, respectively. Finally, in a heavily congested scenario, both tools exhibit a very high variance in estimating the avail-bw and yield highly unreliable estimates (i.e., the produced estimates reach errors of up to 33.21%). The high discrepancies between ground truth and active tool estimates are mainly caused by the fact that both active tools are based on sending carefully scheduled successive probe packets which are distorted by cross-traffic simultaneously passing the same shared medium. Particularly, in contrast to wired single-access networks, where the duration for transmitting the packet from the application layer onto the link can be approximated with a constant time, the lower layer of 802.11 networks can induce nondeterministic time jitters between successive probe packets due to shared medium and multiple access characteristics. The detrimental effects of cross-traffic on wbest’s and pathchirp’s estimation accuracies become more apparent for heavily congested network scenarios. When compared with pathchirp, wbest could relatively closely approximate the avail-bw. In general, it is seen that pathchirp consistently overestimates the avail-bw with a large variance whereas wbest underestimates the avail-bw, especially as the rate of generated cross-trafic increases in the shared medium.
5.3. Case Study 3: Achievable Throughput Measurements
In contrast to the three previous experiment examples, this case study does not evaluate the accuracy of estimation tools but conducts performance measurements on a two-hop 802.11 g wireless ad hoc testbed to determine the maximum achievable throughput for TCP and UDP. To this end, two well-known end-to-end throughput measurement tools, namely iperf and netperf have been used.
Achievable throughput is defined as the maximum rate at which data can be successfully transmitted over a network channel without packet loss, considering the payload size and the limitations imposed by the underlying protocol layers. For TCP and UDP, this can be expressed as:
In Equation (7), PS refers to the data portion of the packet excluding headers (i.e., payload size), RTT is the roundtrip time, and Efficiency accounts for the impact of protocol overhead and retransmissions.
The measurements of achievable throughput for TCP and UDP have been specified in an experiment description file using the testbed setup and configuration illustrated in Figure 3d, with the exception that no cross-traffic has been generated during the measurements. Particularly, using the ethtool, the WiFi mode has been set to 802.11 g, and the link layer rates have been adjusted to 18 Mbps, 36 Mbps, and 54 Mbps. As iperf and netperf are both-ended tools and their sender and receiver components were run on research nodes S and R, respectively. The maximum achievable throughput that is obtained on the transport layer strongly depends on the payload size. For example, a TCP segment or a UDP datagram with a larger payload size leads to a correspondingly larger throughput, since the overheads of layers 2 and 3 have a much greater impact on small payloads than on large payloads. In this respect, it is necessary to use the maximum possible payload size of a TCP segment or a UDP datagram to determine the maximum achievable throughput of the transport layer. The maximum possible TCP/UDP payload sizes, including headers, are limited by the maximum transmission unit (MTU) of layer 2. Thus, the achievable throughput on the transport layer is defined as the maximum transmission rate on this layer, which can be reached using the maximum possible payload size limited by MTU. Accordingly, the iperf and netperf measurements were conducted using a payload size of 1500 Byte, which is the MSS for Ethernet. Furthermore, the window sizes of both tools were set to 8 KByte. The rest of the other tool parameters were used in default settings.
The measured achievable throughput for TCP and UDP at the three link layer rates are illustrated in Figure 6a,b, respectively. The results indicate that on a two-hop 802.11 g wireless ad hoc testbed, iperf was only able to exploit 30.94%, 21.33% and 18.01% of TCP’s effective capacities of 18 Mbps, 36 Mbps, and 54 Mbps, respectively. Similarly, netperf could utilize 28.89%, 19.47%, and 17.13% of TCP’s effective capacities of 18 Mbps, 36 Mbps, and 54 Mbps, respectively. When the performance of both benchmarking tools are compared, it is observed that the achievable TCP throughput reduces between 0.66 Mbps and 1.40 Mbps while changing the software from iperf to netperf. Furthermore, it is seen that in each experiment scenario UDP achieves significantly higher throughput than TCP. This is caused by the fact that in contrast to TCP, UDP does not include any connection management, congestion, and flow control or retransmission mechanisms that have a detrimental effect on the overall achievable throughput. Particularly, as compared to the achieved throughput of TCP, the percentage increment rates in achieved throughput of UDP for 18 Mbps, 36 Mbps, and 54 Mbps link layer rates are 20.99%, 21.33%, and 22.16% in case of iperf; and 18.89%, 19.47%, and 17.13% in case of netperf, respectively.
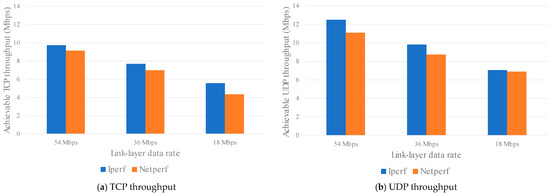
Figure 6.
Achievable throughput measurements for TCP and UDP on a two-hop 802.11 g wireless ad hoc network.
5.4. Case Study 4: Packet Loss and Jitter Analysis in VoIP Applications
This case study evaluates the performance of Voice over IP (VoIP) applications under varying network conditions, focusing on packet loss and jitter, two critical metrics that significantly affect real-time communication quality. The experiment demonstrates the OMF-enabled test environment’s flexibility in simulating diverse network scenarios and validating their impact on VoIP performance.
This test environment utilized again a two-hop 802.11 g wireless ad hoc testbed, as shown in Figure 3d. Research nodes S and R served as the sender and receiver, respectively, with intermediate wireless hop introduced to emulate real-world network conditions. The experiment used the D-ITG tool to generate VoIP traffic, specifically simulating G.711 codec streams with a packet size of 160 bytes transmitted at 50 packets per second.
To introduce controlled network impairments, the OMLized netem tool was configured on the intermediate node to simulate varying levels of packet loss and jitter. Packet loss rates were incrementally adjusted from 0% to 5%, while jitter values ranged from 10 ms to 50 ms in steps of 10 ms. Each configuration was tested for a duration of 5 min to ensure statistically reliable measurements. Two key performance metrics were evaluated for this case study:
- Mean Opinion Score (MOS): This metric provides a subjective measure of perceived audio quality, calculated using the E-model. The MOS value is computed as the following:where is the quality rating derived from network metrics, including packet loss, jitter, and delay. Higher MOS values indicate better perceived quality, with a maximum score of 5.
- Packet Delivery Ratio (PDR): The PDR is a measure of the percentage of packets successfully delivered to the receiver compared to those sent. This metric evaluates the reliability of packet delivery under varying network conditions. It is expressed as the following:
The OML was used to collect and preprocess experimental data, including packet timestamps, loss rates, and delays. MOS and PDR values were derived using these measurements. Figure 7a presents the MOS values as a function of packet loss rates. The results show a sharp decline in perceived audio quality when packet loss exceeds . For instance, at a loss rate, MOS values dropped below 2, indicating poor communication quality unsuitable for real-time applications. Figure 7b illustrates the impact of jitter on PDR. As jitter values increased beyond 30 ms, the percentage of successfully delivered packets decreased significantly, demonstrating the sensitivity of VoIP traffic to variable delays. At 50 ms of jitter, the PDR dropped below 85%, suggesting compromised reliability. These results validate the capability of the OMF-enabled test environment to replicate real-world network impairments and evaluate their effects on VoIP performance under realistic conditions.
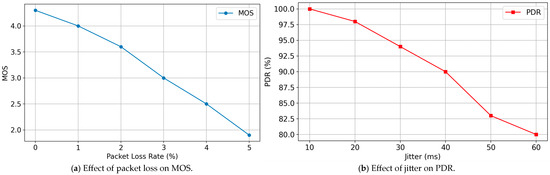
Figure 7.
Analyzing packet loss and jitter in VoIP over two-hop 802.11 g wireless ad hoc networks.
This case study highlights the adaptability of the OMF-enabled test environment in creating realistic scenarios for evaluating performance metrics critical to real-time applications. By dynamically configuring network parameters like packet loss and jitter, the framework enables researchers to assess application resilience and performance under diverse conditions. These findings underscore the practicality of the test environment for testing not only VoIP applications but also other latency-sensitive systems such as video conferencing and online gaming, further demonstrating its versatility and utility in network research.
The diversity of case studies on the proposed OMF-enabled test environment can be enriched by conducting further experiments such as analyzing the convergence times and scalability of various routing protocols, measuring packet loss under controlled congestion scenarios, and investigating energy consumption in resource-constrained environments, to name just a few. Nonetheless, it is noteworthy that although the test environment is presented in the context of measurement experiments, it can also be used to support researchers in deploying, running, monitoring, and experimenting with any kind of other services, protocols and applications under similarly configurable real-world conditions. Also, new testbed setups such as grid networks or multi-hop scenarios (e.g., for investigating the effect of the number of hops on measurement experiments) can easily be configured on the proposed OMF-enabled test environment.
6. Conclusions and Future Work
In this section, the key findings from developing the OMF-enabled test environment are concluded, highlighting its contributions to network measurement research. Additionally, potential directions for future enhancements are explored, aimed at expanding the environment’s capabilities and addressing emerging needs in network testing and evaluation.
6.1. Conclusions
This study introduced a configurable test environment utilizing the OMF to facilitate the empirical evaluation of network measurement tools. By addressing limitations of traditional testbeds, such as fixed topologies and lack of flexibility, the proposed environment provides a modular and reconfigurable platform for conducting a wide range of network experiments under realistic conditions.
A key contribution of this work is the seamless integration of widely used measurement tools, including pathload, spruce, wbest, pathchip, iperf, netperf, and many more, into the OMF framework. This extensive toolset enhances the versatility of the test environment, catering to a wide range of experimental needs. Predefined templates automate the setup of common scenarios, enabling researchers to execute robust and repeatable experiments with minimal effort. This integration significantly reduces setup time while ensuring consistency, adaptability, and the ability to address diverse use cases effectively.
The framework’s capabilities were validated through four case studies. The first demonstrated its ability to simulate real-world network dynamics by evaluating the accuracy of RTT measurement tools under varying queuing delays. The second highlighted its suitability for bandwidth estimation by comparing active tool outputs with MRTG-derived ground truth under fluctuating cross-traffic conditions. The third showcased its effectiveness in measuring achievable throughput for TCP and UDP in wireless networks, illustrating its utility in exploring protocol performance under varying link layer rates. The fourth case study focused on evaluating the performance of VoIP applications under diverse network conditions, such as varying levels of packet loss and jitter, using key metrics like MOS and PDR to assess communication quality and reliability.
The modular architecture of the environment ensures scalability, supporting small-scale tests and large-scale multi-node experiments. Automation features, including centralized data collection integrated with the OMF measurement library, enable efficient real-time data analysis, simplifying the interpretation of experimental results.
The OMF-enabled environment represents a significant advancement in network research, offering unparalleled flexibility, configurability, and automation. Its ability to replicate realistic network conditions and integrate diverse tools makes it a valuable resource for researchers, facilitating precise, repeatable, and meaningful experiments that address complex research questions.
6.2. Future Work
The OMF-enabled test environment presents several opportunities for future research to enhance its configurability, functionality, and scalability. A key area of focus is the integration of additional measurement tools to address further network metrics, such as packet duplication, reordering, and buffer utilization. These enhancements would extend the environment’s utility to scenarios requiring precise evaluations of network behavior under controlled conditions, such as congestion control mechanisms and traffic prioritization strategies. Furthermore, support for more diverse configurations, such as asymmetric links and variable network delays, would broaden the testbed’s scope, particularly for applications in IoT, smart city deployments, and latency-sensitive systems.
Incorporating machine learning (ML) and artificial intelligence (AI) techniques could optimize experiment configuration and data analysis. For example, ML-driven anomaly detection could identify irregularities in real time, while adaptive experiment scheduling could dynamically adjust parameters based on network conditions. These advancements would enhance the accuracy and efficiency of network simulations.
Federated testbeds, which connect independently managed OMF-enabled networks, could enable large-scale, geographically distributed experiments. This approach would support studies on wide-area networks, latency, and resource synchronization while fostering cross-organizational collaboration.
Lastly, integrating security tools, such as intrusion detection systems and encryption protocols, alongside privacy-preserving data handling, would enable the testbed to address critical network security challenges. Continuous feedback from the research community will ensure the platform adapts to emerging research trends and technologies.
Author Contributions
Conceptualization, F.A.; methodology, F.A. and M.K.; formal analysis, M.K.; investigation, F.A. and M.K.; project administration, F.A.; supervision, F.A.; writing—original draft, F.A.; writing—review and editing, F.A. and M.K. All authors have read and agreed to the published version of the manuscript.
Funding
This research received no external funding.
Institutional Review Board Statement
Not applicable.
Informed Consent Statement
Not applicable.
Data Availability Statement
The original contributions presented in this study are included in the article. Further inquiries can be directed to the corresponding author.
Conflicts of Interest
Author Mehmet Kızıldağ was employed by the company SABIS Bilgi Teknolojileri ve San. Tic. Ltd. Şti. The remaining authors declare that the research was conducted in the absence of any commercial or financial relationships that could be construed as a potential conflict of interest.
References
- Sun, M.; He, B.; Li, R.; Li, J.; Zhang, X. A Survey: Network Feature Measurement Based on Machine Learning. Appl. Sci. 2023, 13, 2551. [Google Scholar] [CrossRef]
- MacMillan, K.; Mangla, T.; Saxon, J.; Marwell, N.P.; Feamster, N. A Comparative Analysis of Ookla Speedtest and Measurement Labs Network Diagnostic Test (NDT7). Proc. ACM Meas. Anal. Comput. Syst. 2023, 7, 1–26. [Google Scholar] [CrossRef]
- Labit, Y.; Owezarski, P.; Larrieu, N. Evaluation of Active Measurement Tools for Bandwidth Estimation in Real Environment. In Proceedings of the Workshop on End-to-End Monitoring Techniques and Services, Nice, France, 15 May 2005; pp. 71–85. [Google Scholar]
- Wahid-Ul-Ashraf, A.; Budka, M.; Musial, K. NetSim—The Framework for Complex Network Generator. Procedia Comput. Sci. 2018, 126, 547–556. [Google Scholar] [CrossRef]
- Kashihara, S.; Tamai, M.; Hasegawa, A.; Yokoyama, H. Multilayer Measurement Methodology with Open-Source Tools for Evaluating IEEE 802.11ad Communication Quality. Appl. Sci. 2023, 13, 5378. [Google Scholar] [CrossRef]
- Mazhar, T.; Malik, M.A.; Mohsan, S.A.H.; Li, Y.; Haq, I.; Ghorashi, S.; Karim, F.K.; Mostafa, S.M. Quality of Service (QoS) Performance Analysis in a Traffic Engineering Model for Next-Generation Wireless Sensor Networks. Symmetry 2023, 15, 513. [Google Scholar] [CrossRef]
- Mehraban, S.; Yadav, R.K. Traffic Engineering and Quality of Service in Hybrid Software Defined Networks. China Commun. 2024, 21, 96–121. [Google Scholar] [CrossRef]
- Abut, F. Through the Diversity of Bandwidth-Related Metrics, Estimation Techniques and Tools: An Overview. Int. J. Comput. Netw. Inf. Secur. 2018, 10, 1–16. [Google Scholar] [CrossRef]
- Motamedi, R.; Rejaie, R.; Willinger, W. A Survey of Techniques for Internet Topology Discovery. IEEE Commun. Surv. Tutor. 2015, 17, 1044–1065. [Google Scholar] [CrossRef]
- Wang, J.; Zhou, M.; Li, Y. Survey on the End-to-End Internet Delay Measurements. In High Speed Networks and Multimedia Communications; Mammeri, Z., Lorenz, P., Eds.; Springer: Berlin/Heidelberg, Germany, 2004; Volume 3079, pp. 155–166. [Google Scholar]
- Rakotoarivelo, T.; Ott, M.; Jourjon, G.; Seskar, I. OMF: A Control and Management Framework for Networking Testbeds. Oper. Syst. Rev. 2009, 43, 54–59. [Google Scholar] [CrossRef]
- Chen, Z.; Zhao, Z.; Li, Z.; Shao, J.; Liu, S.; Xu, Y. SDT: A Low-Cost and Topology-Reconfigurable Testbed for Network Research. In Proceedings of the IEEE Computer Society, Santa Fe, NM, USA, 31 October–3 November 2023; pp. 343–353. [Google Scholar]
- Chouman, A.; Manias, D.M.; Shami, A. A Modular, End-to-End Next-Generation Network Testbed: Toward a Fully Automated Network Management Platform. IEEE Trans. Netw. Serv. Manag. 2024, 21, 5445–5463. [Google Scholar] [CrossRef]
- Callebaut, G.; Mulders, J.V.; Ottoy, G.; Delabie, D.; Cox, B.; Stevens, N.; der Perre, L.V. Techtile—Open 6G R&D Testbed for Communication, Positioning, Sensing, WPT and Federated Learning. In Proceedings of the 2022 Joint European Conference on Networks and Communications & 6G Summit (EuCNC/6G Summit), Grenoble, France, 7–10 June 2022. [Google Scholar]
- Morano, G.; Hrovat, A.; Vučnik, M.; Puhan, J.; Gardašević, G.; Vasiljević, D.; Javornik, T. Experiment Control and Monitoring System for LOG-a-TEC Testbed. Sensors 2021, 21, 6422. [Google Scholar] [CrossRef] [PubMed]
- Muelas, D.; Ramos, J.; López de Vergara, J.E. Software-Driven Definition of Virtual Testbeds to Validate Emergent Network Technologies. Information 2018, 9, 45. [Google Scholar] [CrossRef]
- Adjih, C.; Baccelli, E.; Fleury, E.; Harter, G.; Mitton, N.; Noël, T.; Pissard-Gibollet, R.; Saint-Marcel, F.; Schreiner, G.; Vandaele, J.; et al. FIT IoT-LAB: A Large Scale Open Experimental IoT Testbed. In Proceedings of the 2015 IEEE 2nd World Forum on Internet of Things (WF-IoT), Milan, Italy, 14–16 December 2015; pp. 459–464. [Google Scholar]
- Tsakalidis, S.; Tsoulos, G.; Kontaxis, D.; Athanasiadou, G. Design and Implementation of a Versatile OpenHAB IoT Testbed with a Variety of Wireless Interfaces and Sensors. Telecom 2023, 4, 597–610. [Google Scholar] [CrossRef]
- Candell, R.; Stouffer, K.; Anand, D. A Cybersecurity Testbed for Industrial Control Systems. In Proceedings of the ISA Symposium on Process Control and Safety, Houston, TX, USA, 6–9 October 2014. [Google Scholar]
- Pospisil, O.; Fujdiak, R.; Mikhaylov, K.; Ruotsalainen, H.; Misurec, J. Testbed for LoRaWAN Security: Design and Validation through Man-in-the-Middle Attacks Study. Appl. Sci. 2021, 11, 7642. [Google Scholar] [CrossRef]
- Sharma, S.; Urumkar, S.; Fontanesi, G.; Ramamurthy, B.; Nag, A. Future Wireless Networking Experiments Escaping Simulations. Future Internet 2022, 14, 120. [Google Scholar] [CrossRef]
- Buzura, S.; Peculea, A.; Iancu, B.; Cebuc, E.; Dadarlat, V.; Kovacs, R. A Hybrid Software and Hardware SDN Simulation Testbed. Sensors 2023, 23, 490. [Google Scholar] [CrossRef] [PubMed]
- Sørensen, C.W.; Hernández Marcano, N.J.; Cabrera Guerrero, J.A.; Wunderlich, S.; Lucani, D.E.; Fitzek, F.H.P. Easy as Pi: A Network Coding Raspberry Pi Testbed. Electronics 2016, 5, 67. [Google Scholar] [CrossRef]
- Chamran, M.K.; Yau, K.-L.A.; Noor, R.M.D.; Wong, R. A Distributed Testbed for 5G Scenarios: An Experimental Study. Sensors 2020, 20, 18. [Google Scholar] [CrossRef]
- Jain, M.; Dovrolis, C. Pathload: A Measurement Tool for End-to-End Available Bandwidth. IEEE/ACM Trans. Netw. 2003, 11, 537–549. [Google Scholar] [CrossRef]
- Leischner, M. A Tool for Measuring End-to-End Round-Trip Time over TCP Connections. Available online: http://www.leischner.inf.fh-rhein-sieg.de/rtt-tool (accessed on 15 October 2024).
- Jiang, H.; Dovrolis, C. Passive Estimation of TCP Round-Trip Times. SIGCOMM Comput. Commun. Rev. 2002, 32, 75–88. [Google Scholar] [CrossRef]
- Strauss, J.; Katabi, D.; Kaashoek, F. A Measurement Study of Available Bandwidth Estimation Tools. In Proceedings of the 3rd ACM SIGCOMM Conference on Internet Measurement, New York, NY, USA, 27 October 2003; pp. 39–44. [Google Scholar]
- Ribeiro, V.; Riedi, R.; Navrátil, J.; Cottrell, L. pathChirp: Efficient Available Bandwidth Estimation for Network Paths. Passiv. Act. Meas. Workshop 2003, 1–11. [Google Scholar] [CrossRef][Green Version]
- Li, M.; Claypool, M.; Kinicki, R. WBest: A Bandwidth Estimation Tool for IEEE 802.11 Wireless Networks. In Proceedings of the 33rd IEEE Conference on Local Computer Networks (LCN), Montreal, QC, Canada, 14–17 October 2008; pp. 374–381. [Google Scholar]
- Abut, F.; Leischner, M. An Experimental Evaluation of Tools for Estimating Bandwidth-Related Metrics. Int. J. Comput. Netw. Inf. Secur. 2018, 10, 1–11. [Google Scholar] [CrossRef][Green Version]
Disclaimer/Publisher’s Note: The statements, opinions and data contained in all publications are solely those of the individual author(s) and contributor(s) and not of MDPI and/or the editor(s). MDPI and/or the editor(s) disclaim responsibility for any injury to people or property resulting from any ideas, methods, instructions or products referred to in the content. |
© 2025 by the authors. Licensee MDPI, Basel, Switzerland. This article is an open access article distributed under the terms and conditions of the Creative Commons Attribution (CC BY) license (https://creativecommons.org/licenses/by/4.0/).