Article

Influence of the Oxide Layer Thickness on the Behavior of the Electrical Wheel–Rail Contact in Static Conditions

1
SNCF, Direction Technologies Innovation et Projets Groupe, 1-3 Avenue François Mitterrand, 92300 La Plaine Saint Denis, France
2
GeePs, Group of Electrical Engineering Paris, CNRS, CentraleSupélec, Université Paris-Saclay, 3 & 11 Rue Joliot-Curie, 91192 Gif-sur-Yvette, France
3
SNCF Réseau, Direction Générale Industrielle & Ingénierie, Direction Technique Réseau, Département de la Signalisation Ferroviaire, 6 Avenue François Mitterrand, 93574 La Plaine Saint Denis, France
*
Author to whom correspondence should be addressed.
Appl. Sci. 2025, 15(1), 471; https://doi.org/10.3390/app15010471
Submission received: 3 November 2024 / Revised: 20 December 2024 / Accepted: 27 December 2024 / Published: 6 January 2025

Abstract

:
To manage and ensure the safety of traffic on rail networks, trains need to be reliably located at all times. This is achieved in many countries by electrically detecting their presence using so-called “track circuits” installed at regular intervals on each track, designed to detect when the wheels and axles of a train are shunting the two rails and to act accordingly on the signaling system. Such a detection principle is highly dependent on the quality of the electrical contacts between rails and wheels; the occurrence of high wheel–rail contact resistances can induce malfunctions known as “deshunting”, when the system is unable to judge the presence or absence of a train on a section of track. This type of potentially risky event must obviously be avoided at all costs. In this article, we focus on wheel–rail contact degradation resulting from steel oxidation, using a home-made, scaled-down test bench that reproduces real contact in the laboratory under controlled conditions. Given the complexity of the topic, the investigations are focused on static contact characterizations involving different degrees of rail oxidation and slow, stepwise variations in DC intensity.

1. Introduction

The accurate localization of trains is a paramount subject for ensuring the correct functioning of railway tracks and hence their safety. A “track circuit” system is classically employed to provide real-time information about the presence of a train in a specific track section. The short circuit between the two rails, created by its wheels and axle, triggers a signal indicating the occupancy of the zone, and the signaling systems can be activated accordingly. Maintaining the best possible electrical conduction at the wheel–rail contact is therefore a major issue for ensuring the reliability of the track circuit system. A high contact resistance leads to a phenomenon known as “deshunting”, where the presence of the train is no longer detected for a certain period, resulting in a critical safety issue. The thin oxide layer at the wheel–rail interface is a well-known cause of deshunting, especially on tracks with low frequentation, and despite the implementation of various devices to prevent [1,2] or reduce the occurrence of deshunting, many instances are still detected every year.
Deshunting events can have a detrimental effect on railroad management and give rise to potentially dangerous situations. It is therefore necessary to better understand the behavior of the wheel–rail electrical contact in order to minimize their occurrence and make track circuits more robust to failure.
The subject of wheel–rail contact is a complex multi-physical subject involving mechanical and electrical aspects. In [3,4,5], the detection and impact of the mechanical deterioration of the wheel rail was studied. The parameters of the surface, such as surface roughness [6,7], local temperature and physical chemistry [8], have a strong influence on the wheel–rail contact resistance. In some cases it was also reported that arcing between the wheel and the rail could occur, thus leading to microstructural modifications of the surface [6,9]. The state of the surface and the difficulties inherent in this multi-physical character apply not only to the two solids in contact, but also to a layer called “third body” present in their interface. This third body has a wide variety of components that can affect the friction at the interface [10,11] since it can incorporate wear particles from wheels and rails, external contaminants such as dead leaves, frost, sand, and oil, as well as rust formed naturally on the surfaces [12]. In [13], third body samples were examined by tribological, morphological and microscopic analysis, and their electrical conductivity, heterogeneity and compactness properties were compared between good and bad shunting conditions.
Rust can have serious effects on the maintenance of railways, especially in costal or humid areas where corrosion can be more severe. As matter of fact, the rain can deposit salts or contaminants contained in the atmosphere, leading to acid rains, acting as a catalyst to the corrosion process [14]. The rust composition was studied by Suzumura et al. using in situ X-ray diffraction [15]. On the railhead, the main species detected were FeOOH oxyhydroxides in various forms and Fe3O4 magnetite. From a more global point of view, Fukuda et al. [16] examined the influence of the type of track environment and of the traffic frequency on the thickness of rust formed on rails and wheel roughness. Using a huge test bench involving real wheel and rail elements, they also studied the influence of several factors, such as normal load, current intensity and oxide layer thickness on contact resistance.
A few years later, the understanding of wheel–rail electrical contact was enriched by new studies carried out in parallel on a ¼-scale test bench and on site using an instrumented regional train, both stationary and running at low speed [17,18]. The results obtained with the reduced-scale tests proved to be fully representative of those obtained with the full-scale tests, validating the relevance of working on a maquette to make it easier to study the influence of the many possible parameters (load force, imposed current intensity, surface properties, rolling speed, etc.). In the logic of this approach, the authors have developed a flexible experimental device that can be used to faithfully mimic wheel–rail contact conditions in the laboratory, combined with a protocol enabling different oxidation states to be achieved on demand [19]. It is this versatile platform for studies on a much smaller scale than those previously proposed that is used in the present work.
It has been shown in the literature that the presence of rust in the interface results in non-linear current-voltage characteristics [20]. This is why our study focuses on the influence of a controlled oxide layer thickness under static conditions, to better understand its non-ohmic behavior, with the aim of identifying the maximum permissible oxidation state in a railway network context.

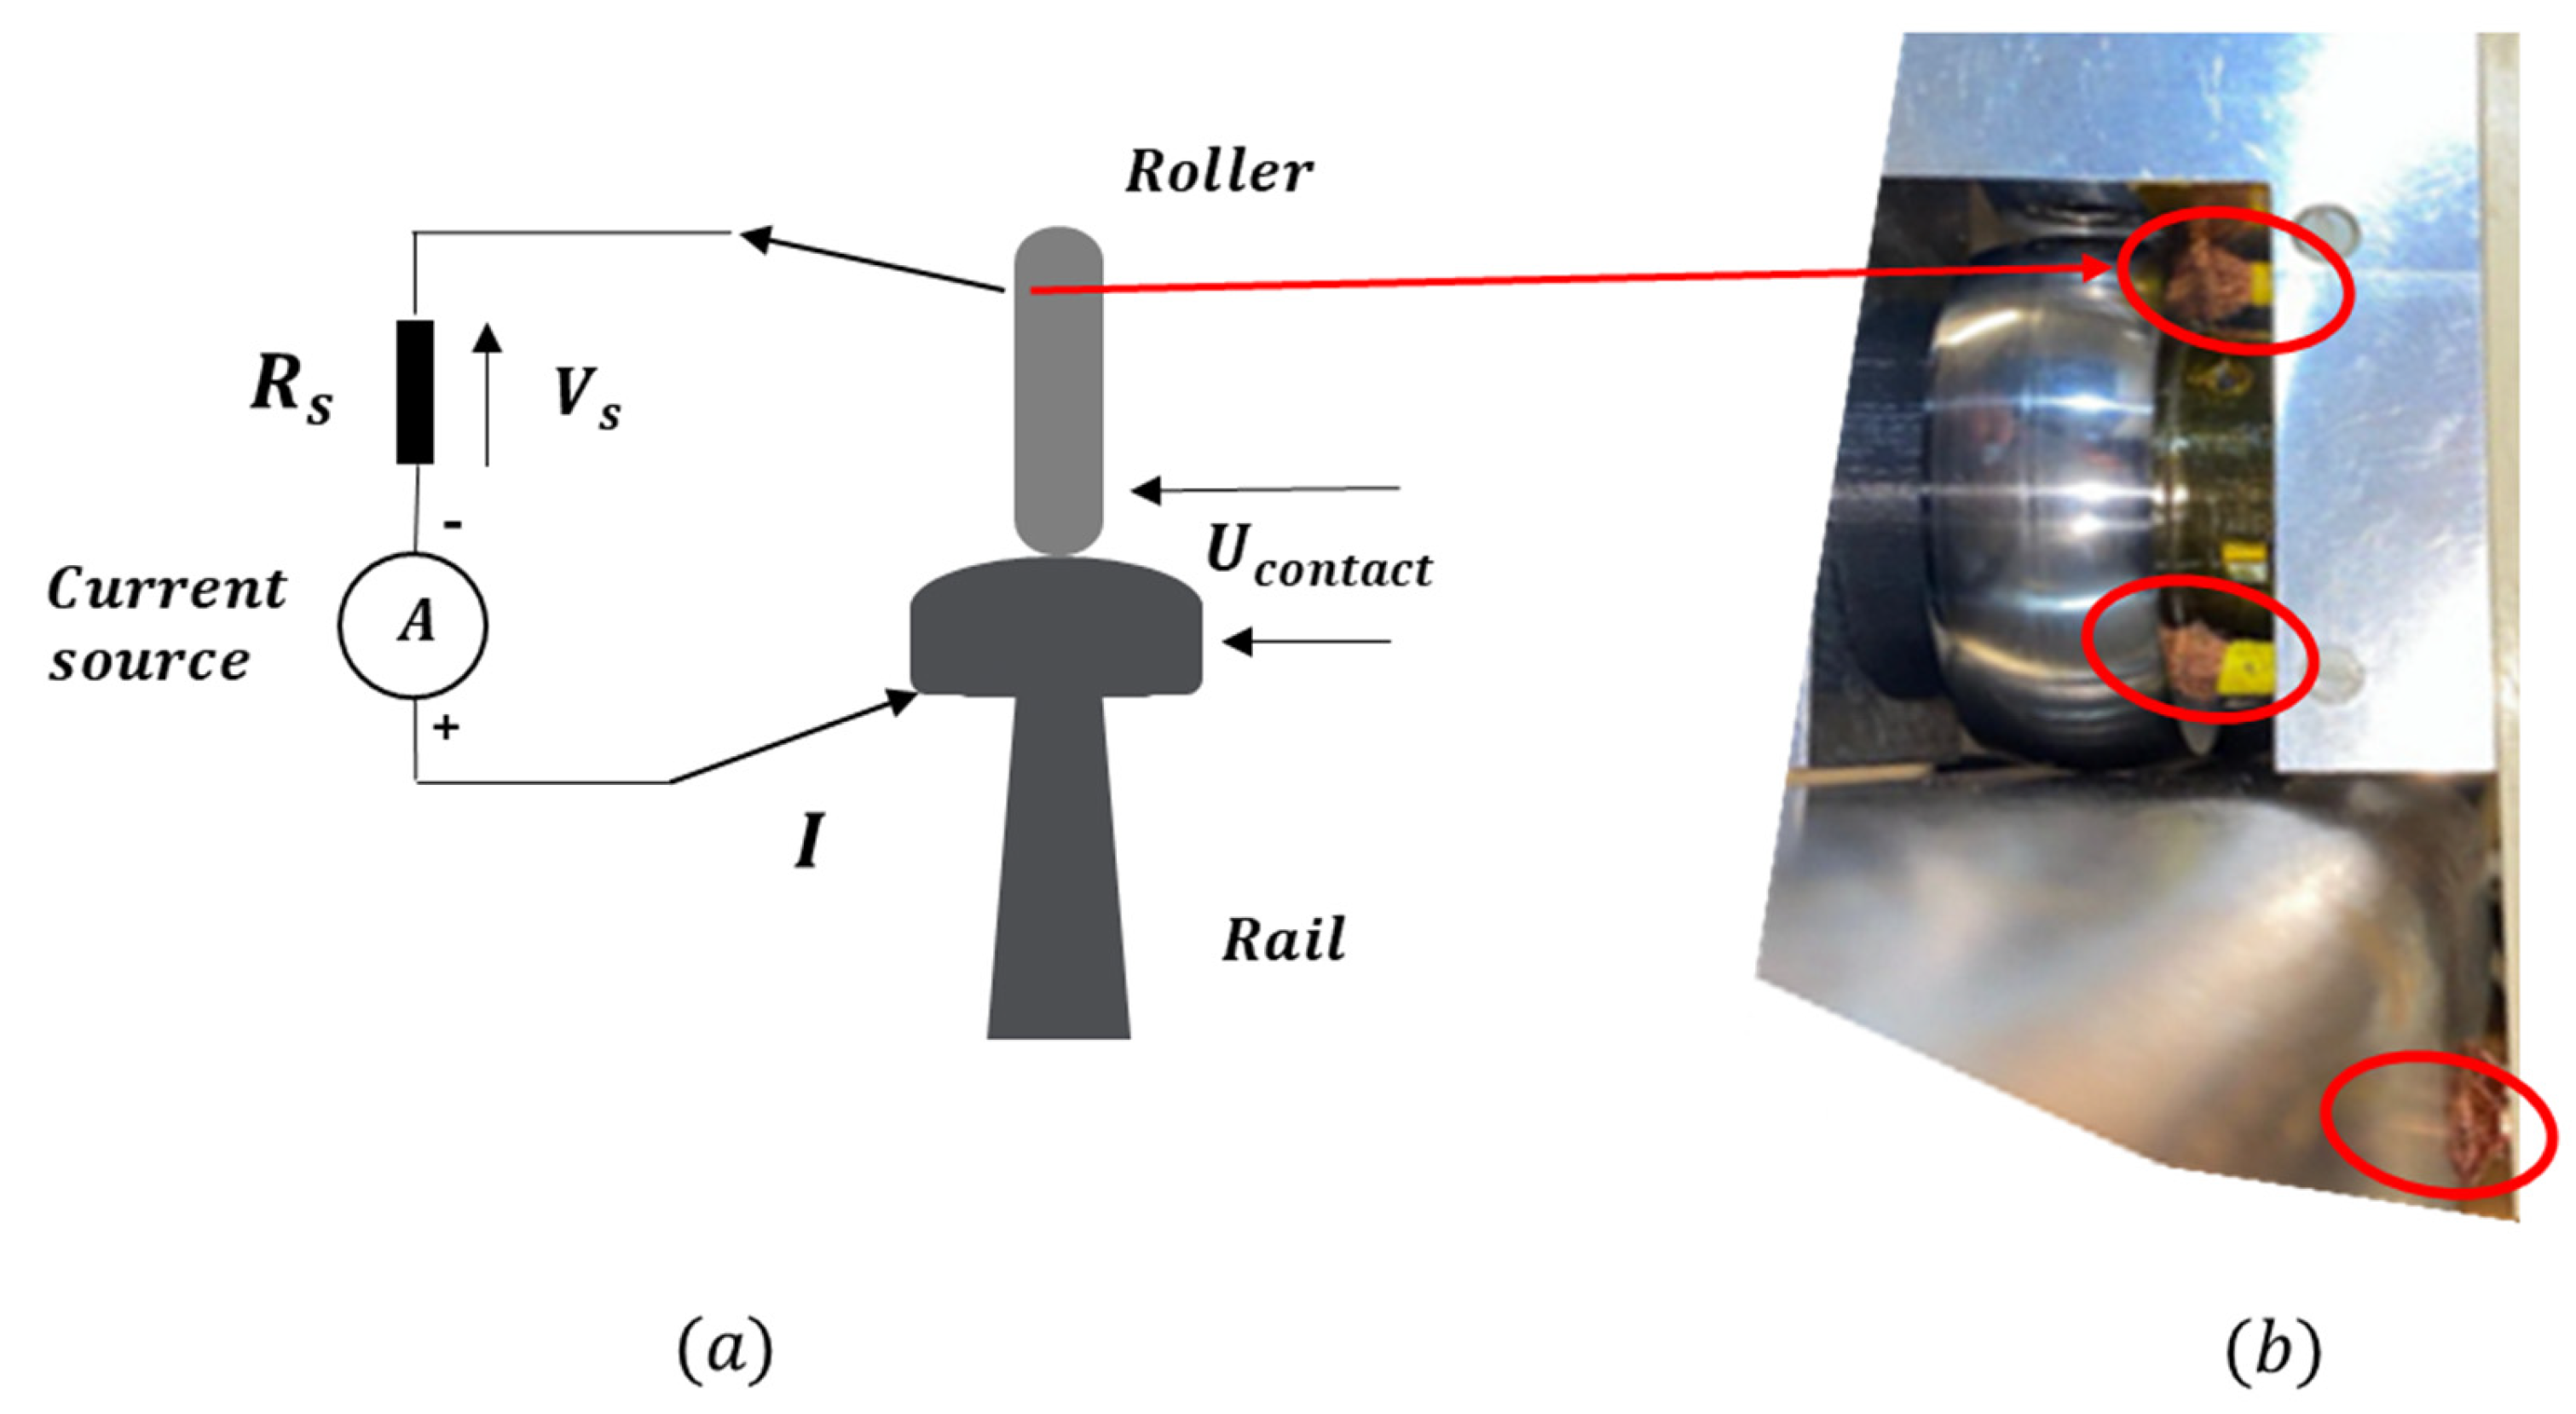
2. Experimental Setup

The principle of the setup developed was described in [19]. It consists of a reduced-scale wheel (referred to in the following as the “roller”) mounted in a carriage running on a full-scale rail 1 m long. For the dynamic investigations, a linear motion axis allows the roller carriage to move along the rail at a controlled, scaled-down speed. Mechanical criteria were considered in order for the roller to be representative of the full-scale behavior of the wheel–rail contact. In particular, the aspect ratio of the contact areas as well as the average contact pressure at both scales are maintained. The normal force is applied to the roller axis by an electrical actuator. It is measured using a load cell positioned between the actuator and the carriage and kept constant by a feedback loop. In this paper, the sizing of the roller has been designed to mimic the situation of a train of interest used on the French rail network (FRN). For a clean, smooth and fully conductive contact surface, with a normal force F = 400 N, the half-axes of the resulting elliptical contact area were calculated as a = 0.47   mm and b = 0.29   mm .
The measurement of the wheel–rail electrical contact resistance is performed using the four-point method, as shown in Figure 1a, which illustrates the principle of this technique applied to the test bench. A first pair of wires and connections are dedicated to current injection, whereas a second one—as close to the contact elements as possible—is allocated for voltage measuring. This method eliminates resistive contributions from wires and connections. The current intensity is evaluated by measuring the voltage V s across a well-known shunt resistance R s . Figure 1b shows a photograph of the concrete implementation, where connections to roller and rail are ensured using copper thread brushes. In practice, for the direct current (DC) tests reported in this paper, we used a KEITHLEY 2400 source meter (Keithley Instruments, Cleveland, OH, USA) with a resolution of 5½ digits. This device is particularly suitable for injecting current intensities over a wide range, while allowing simultaneous measurement of voltage. It was controlled using a dedicated program under LabVIEW 2013, which has made it possible to automate the tests by defining time profiles for the evolution of the injected current.

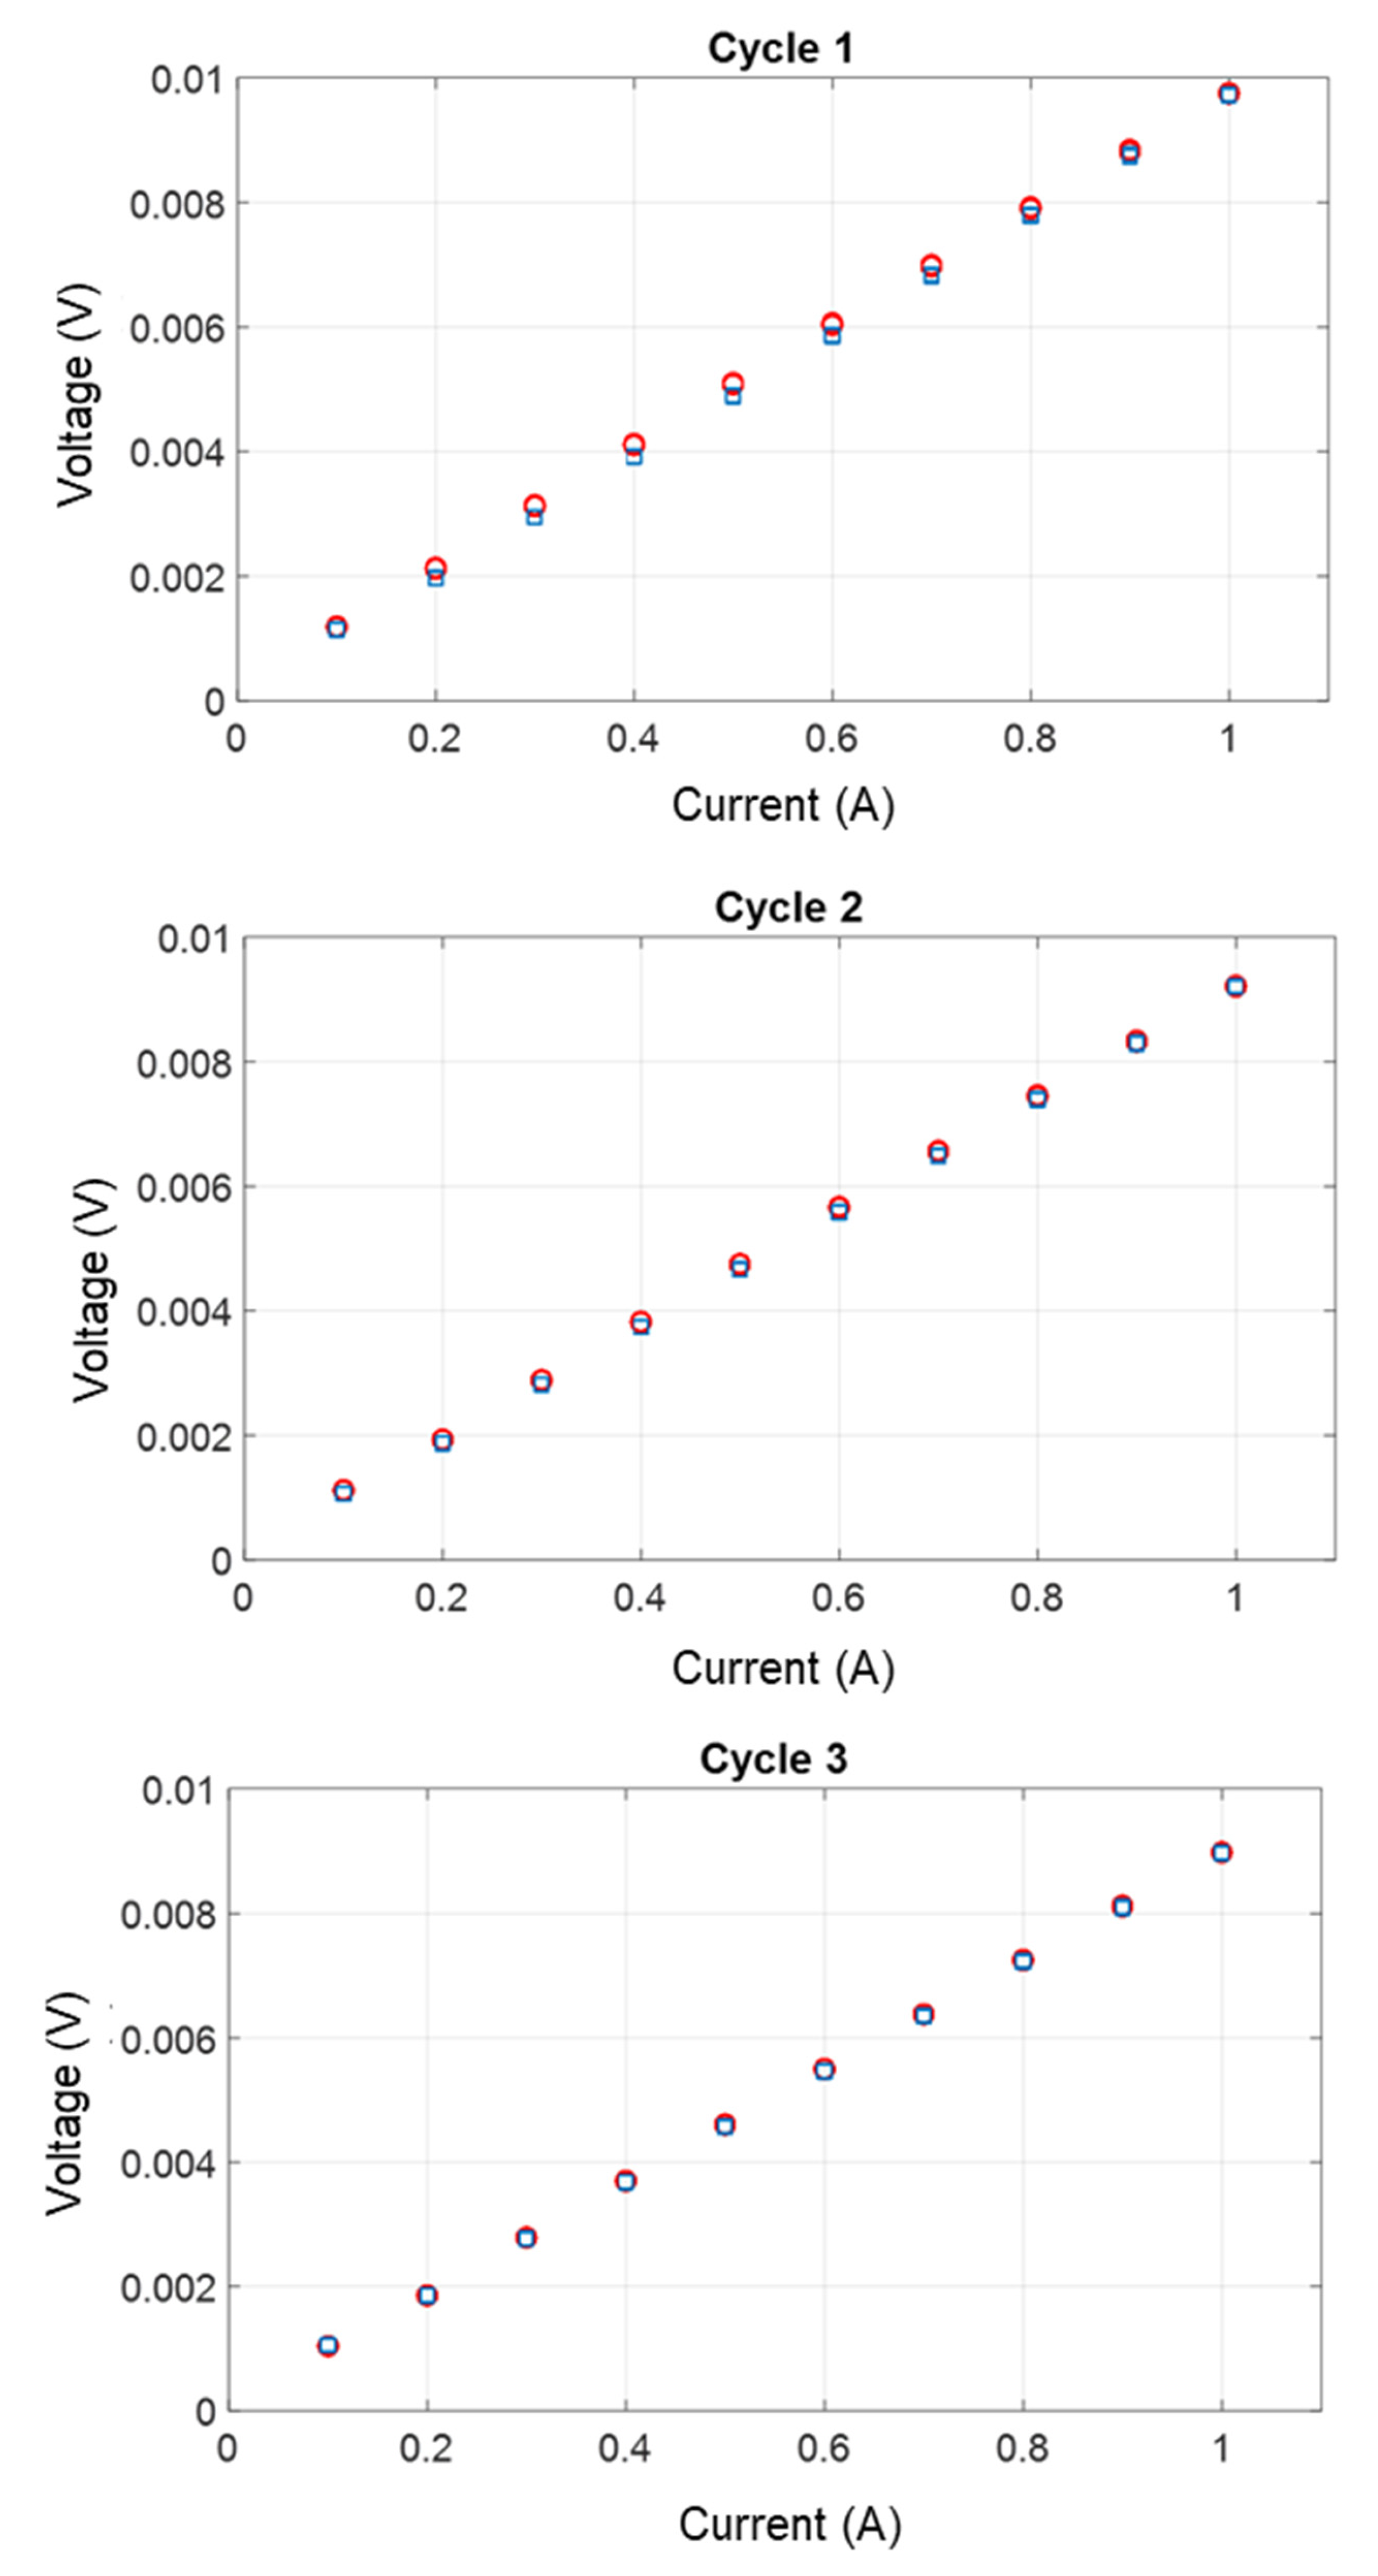
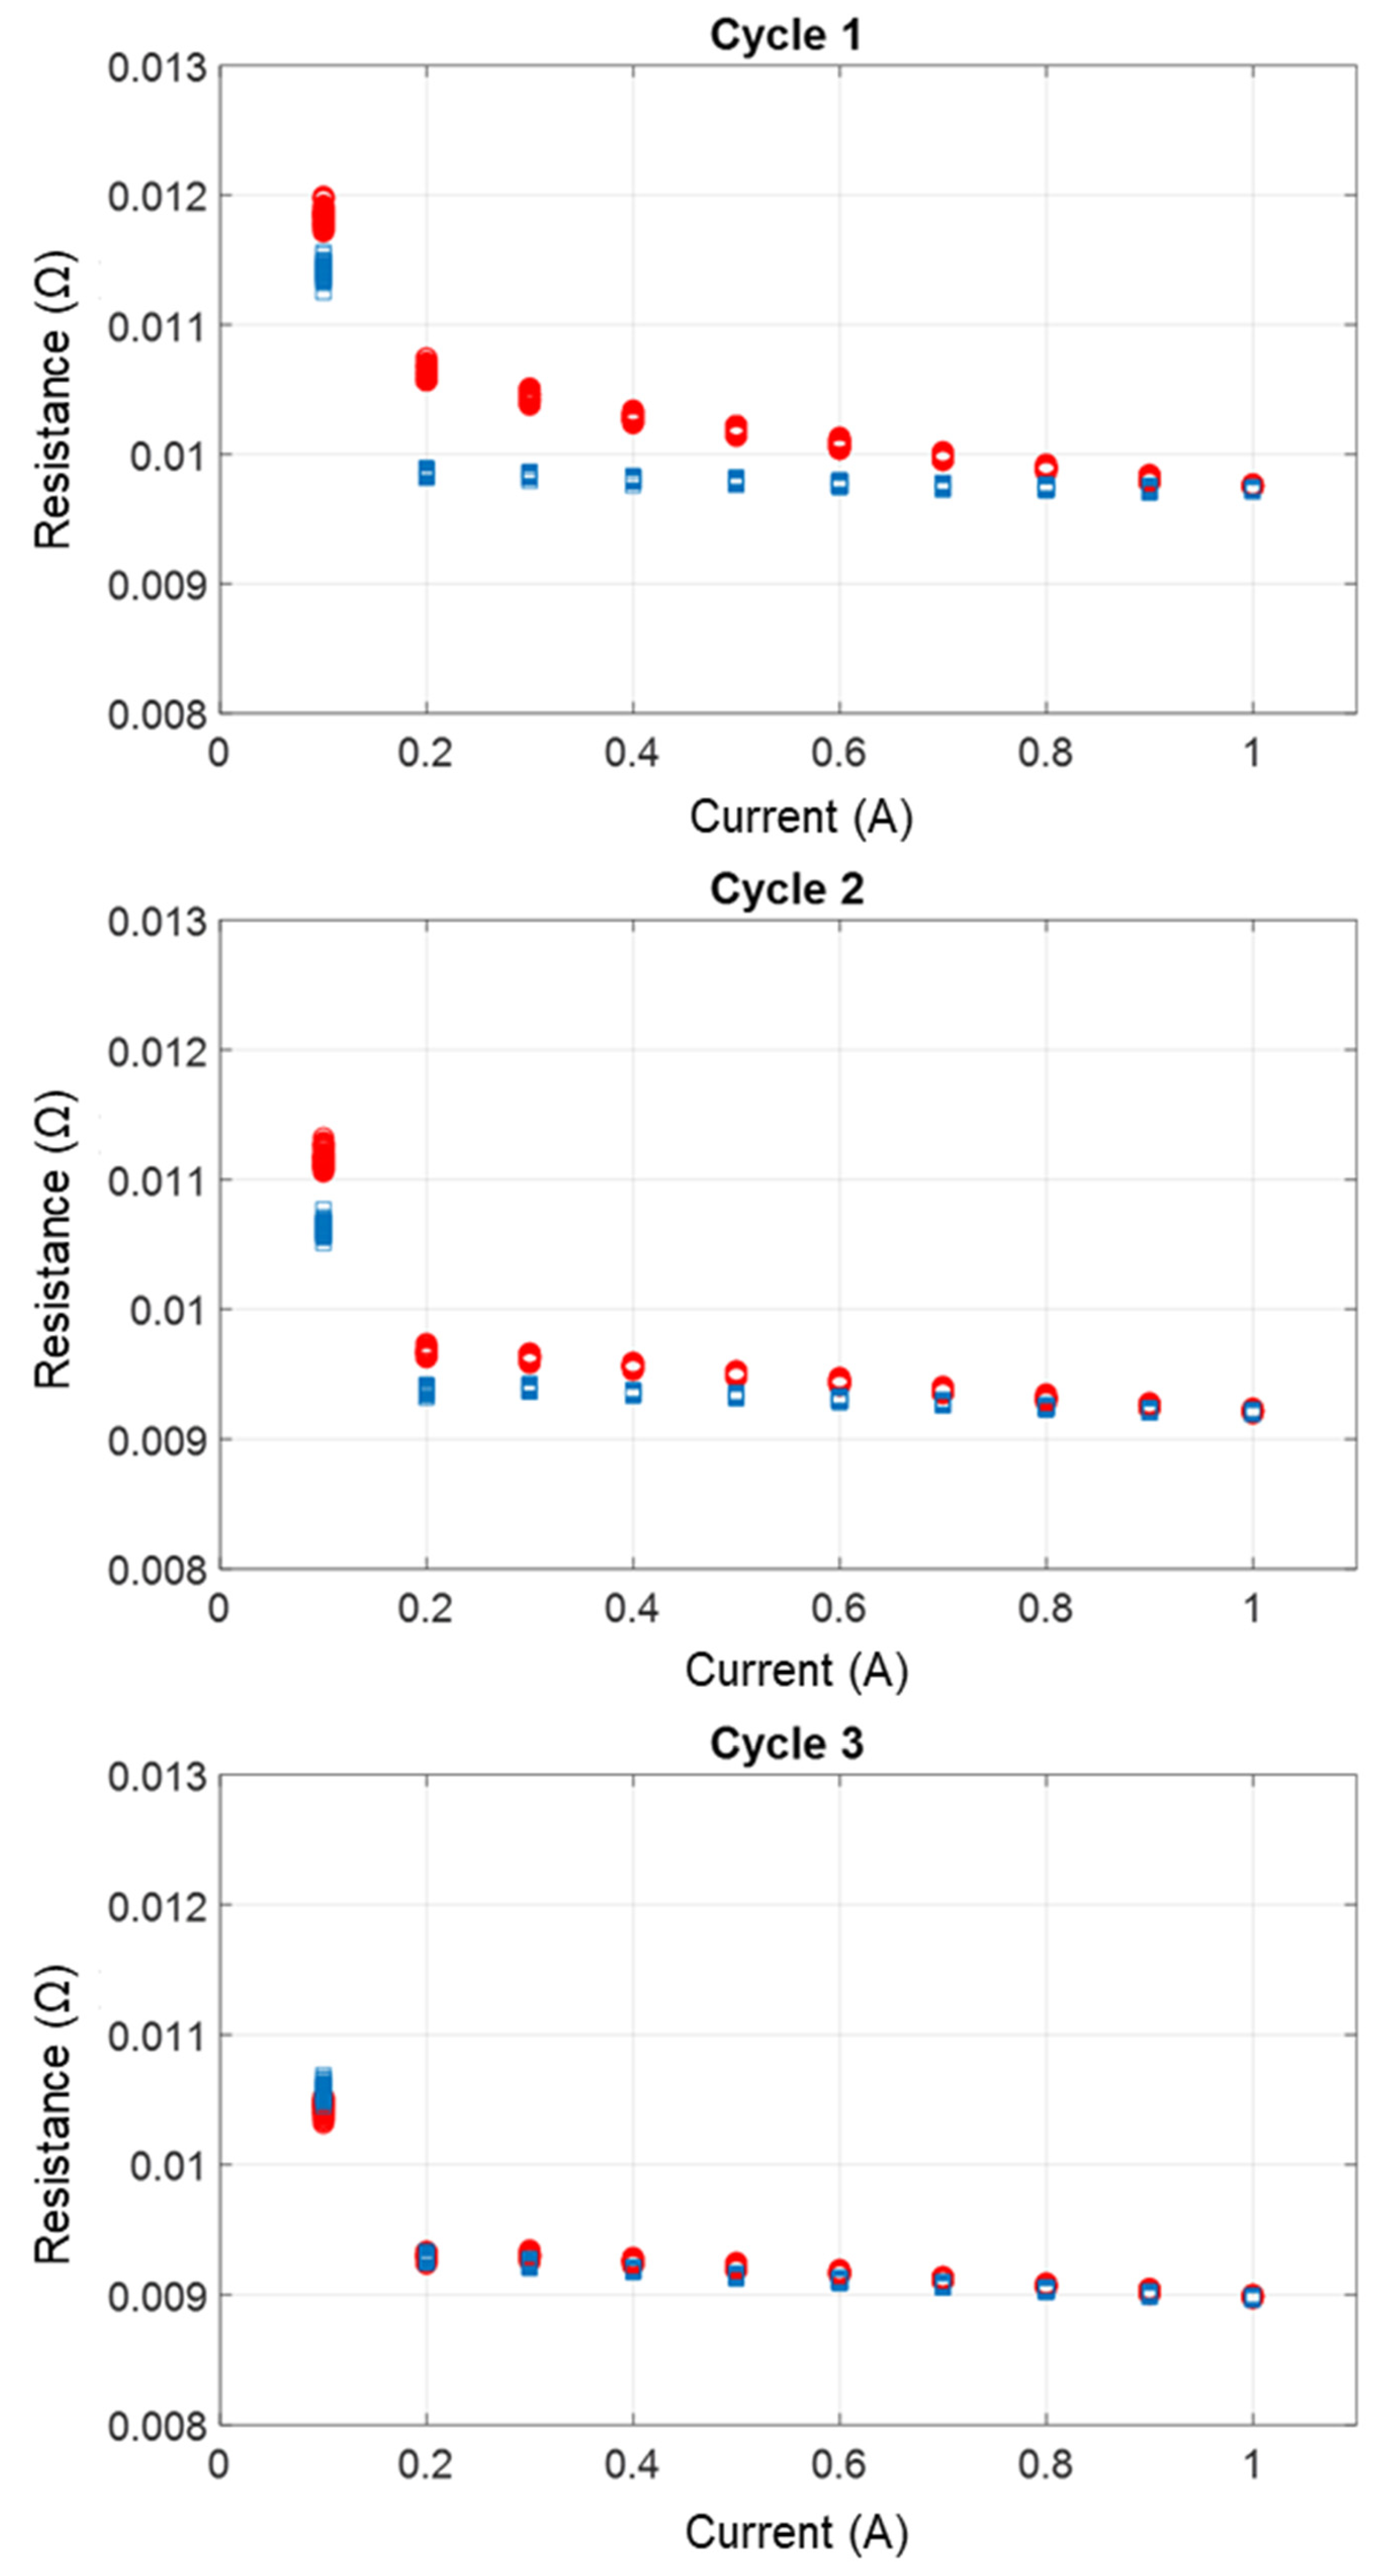
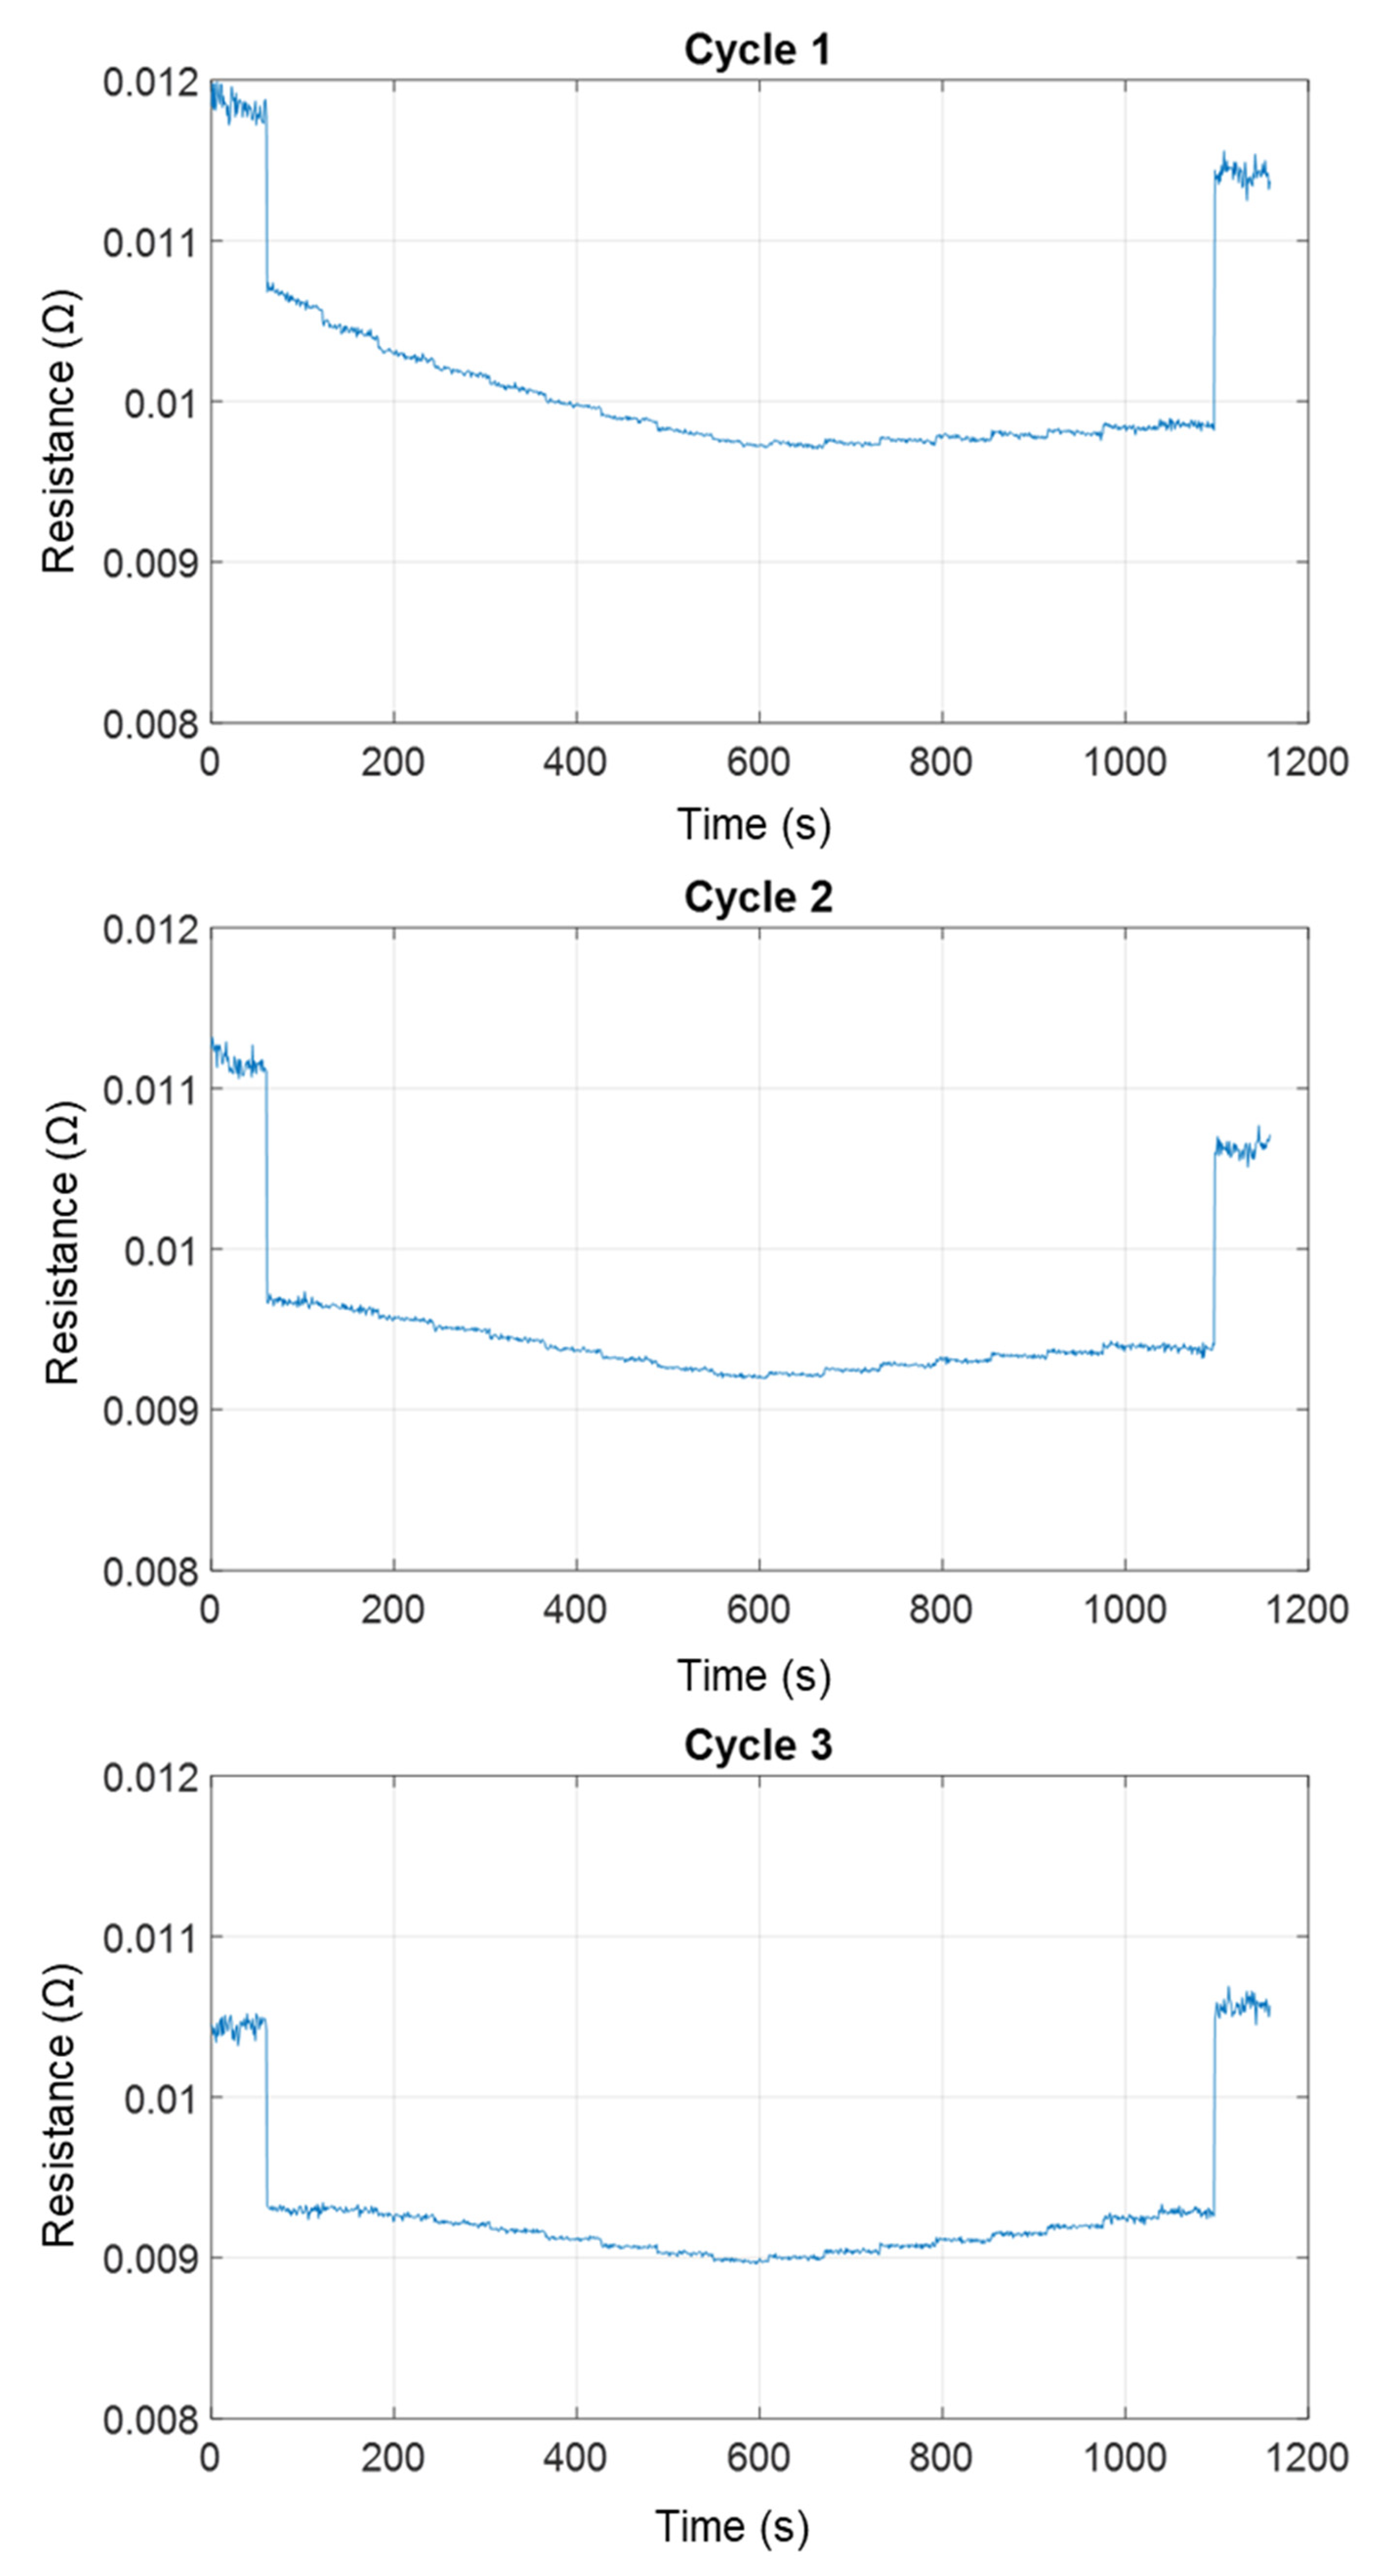
3. Electrical Behavior of a Clean Contact Taken as a Reference

To begin with, we studied a clean contact involving roller and rail surfaces derusted, polished and cleaned to serve as a reference configuration (load force F = 400 N). We applied a current of increasing and decreasing intensity, from 100 mA to 1 A, in 100 mA steps. Each step lasts 60 s. The thin line in Figure 2 illustrates the evolution of the applied current intensity. The contact voltage, measured at one point every second, is drawn on the same figure by a thick green line. Figure 3 shows the corresponding voltage-current U-I characteristic. It is linear and reversible; the contact is therefore ohmic, the contact resistance Rc being constant and equal to 10 mΩ.
The theoretical value of the contact resistance in the case of a single-spot elliptical contact between two bodies of resistivity ρ can be expressed as follows [21]:
R c = ρ 2 a f γ  
with
γ = a b 1 2 = 1.27  
Here, we have the following:
f γ 1
and
R c ρ 2 a
Parallelepiped coupons, measuring 100 mm × 20 mm × 10 mm, were made of rail and wheel steel in order to experimentally determine their respective resistivities. We found very similar values, in the order of 2.3 × 10 7 Ω · m ; thus
R c ρ 2 a = 0.24   m Ω
There is a factor of 40 between the measured value and the theoretical value. As the surfaces are a priori considered to be oxide-free, this discrepancy would tend to indicate that the current flow area is much smaller than expected due to the roughness, leading to the hypothesis of a multi-spot contact. Furthermore, it is reasonable to assume that this contact geometry did not change during the test, since the resistance remained constant (the heating effect of the current was not sufficient to soften the material locally).
In the case of multi-spot contact, the number of spots (noted N ) is influenced by the degree of surface polish (roughness), material hardness (H), and applied force (F). According to [22], N can be estimated by the following equation:
N = 2.5   · 10 5 H 0.625   F 0.2
This equation is deduced empirically from the experimental results obtained in [10].
For F = 400   N and H = 840   N / m m 2 , N = 31 spots; for F = 400   N and H = 970   N / m m 2 , N = 34 spots. The order of magnitude is therefore about 30 spots.
Combining Holm’ s [21] and Greenwood’ s [23] approaches, the contact resistance can be approximated by the following:
R c = ρ 2 N < a > + ρ 2 r
where < a > is the average radius of the spots and r is the radius of the apparent contact area. For different values of N, we will look for the value of <a> that gives the measured contact resistance R c   m e s = 10 mΩ. For simplicity’s sake, we will assume for the theoretical contact resistance that
ρ 2 r = R c   t h
Let us say R c = R c   m e s R c   t h , and we will note k, the ratio between the effective contact area, sum of the areas of the N micro-spots, and the apparent contact area (here 0.43 mm2) [24,25]. From Equations (7) and (8),
k = N π a 2 π r 2 = ρ 2 4 N ( δ R c ) 2 r 2
As soon as N > 2, the value of k is less than 1%, and for N of the order of 30, k is less than 0.01%. These extremely low values lead us to reconsider the assumption of chemically clean contact surfaces, by which we have neglected the resistance induced by the presence of an oxide layer at the contact level. As mentioned in [20], a thin oxide layer of only 100 Å is capable of generating a resistance of 10   Ω / square . The presence of a microscopic “native” oxide layer at the contact level could therefore help explain the measured contact resistance of 10 mΩ.

4. Electrical Behavior of an Oxidized Contact

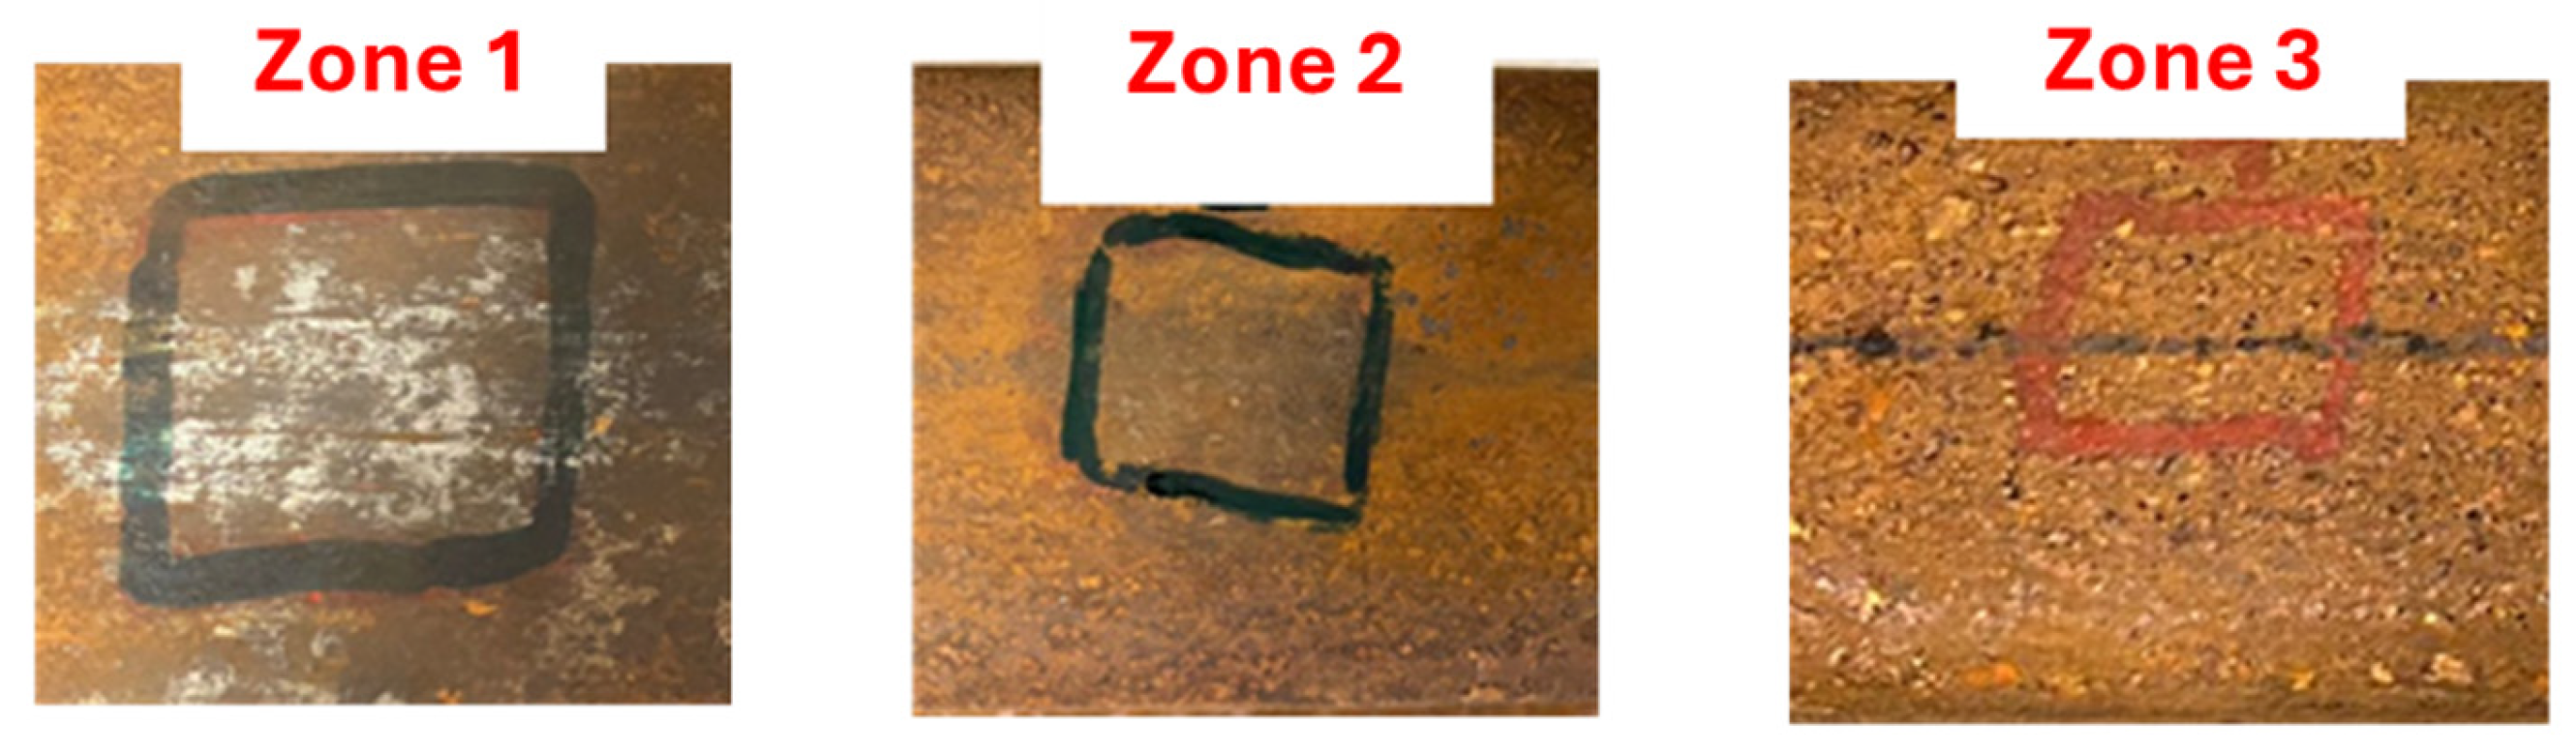
4.1. Surface Preparation

In order to study the case of an oxidized contact, three distinct areas of the rail with different oxide thicknesses were prepared following the protocol described in [19]. After oxidizing the rail, light sanding was carried out to adjust the desired oxide thickness, as shown in Figure 4.
Zone 3 featured a deliberately exaggerated oxide thicknesses in order to assess the impact of heavy oxidation on contact resistance and to reproduce the extreme conditions likely to cause deshunting. Zones 1 and 2, prepared by stripping the oxide layer with an abrasive sheet, were intended to reproduce more realistic oxide thicknesses, similar to those observed on a low-traffic track. The oxide thickness of the three zones was measured using a Fischer Deltascope FMP30 probe (Helmut Fischer Gmbh Institute of Electronics and Measuring Technology, Sindelfingen, Germany). Table 1 shows the mean value and standard deviation of oxide thickness for each rail zone, based on 30 measurements per zone.
The electrical behavior of those three zones was then evaluated by performing three cycles of current application on each zone following the protocol described in Section 3, with the roller surface previously polished and cleaned. The applied force was again F = 400 N.

4.2. Slightly Oxidized Contact

Figure 5 shows the evolution of the U-I characteristic in Zone 1. Staring from 0 A, the current is gradually increased (blue circles) by 100 mA every 60 s, then similarly decreased (red circles). After each current increment, the contact voltage is measured. Over the three cycles, a quasi-ohmic behavior is observed, similar to that of a clean contact, as seen in Figure 3.
The variation of contact resistance as a function of current (Figure 6) and time (Figure 7) shows that resistance decreases slightly with increasing current and increases slightly with decreasing current. During the third cycle, contact resistance remains almost constant for both directions of current variation.

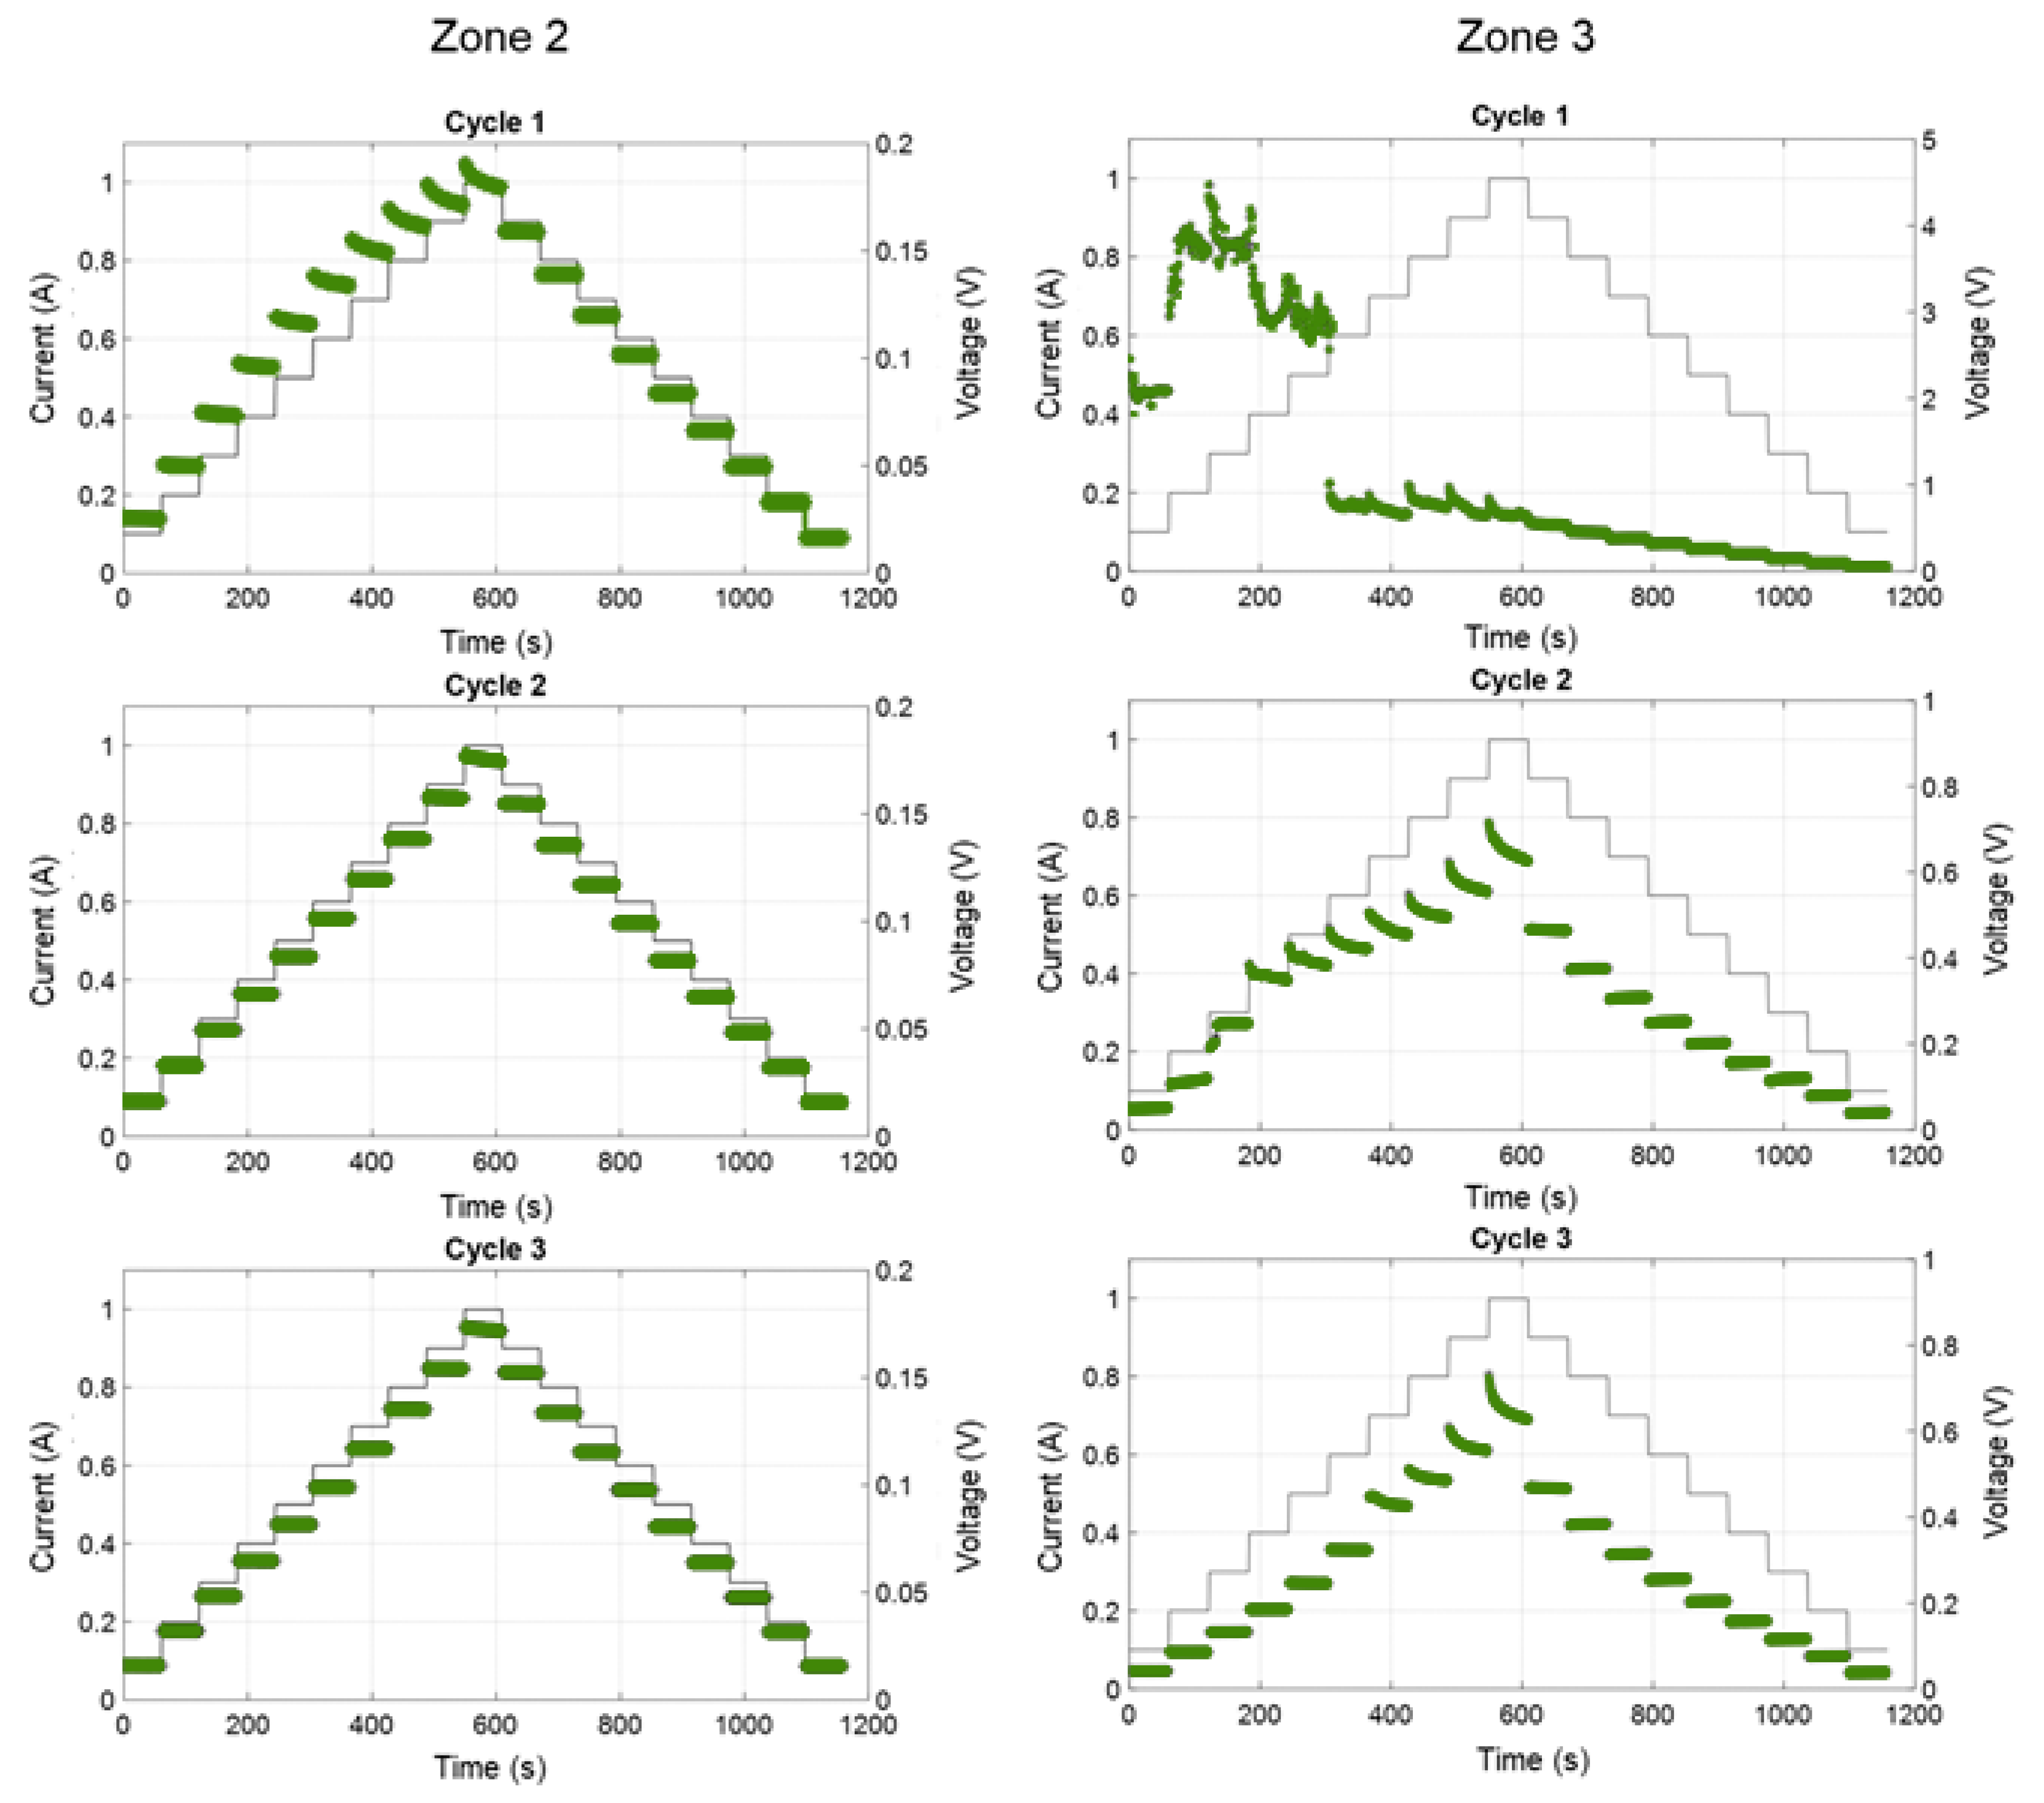
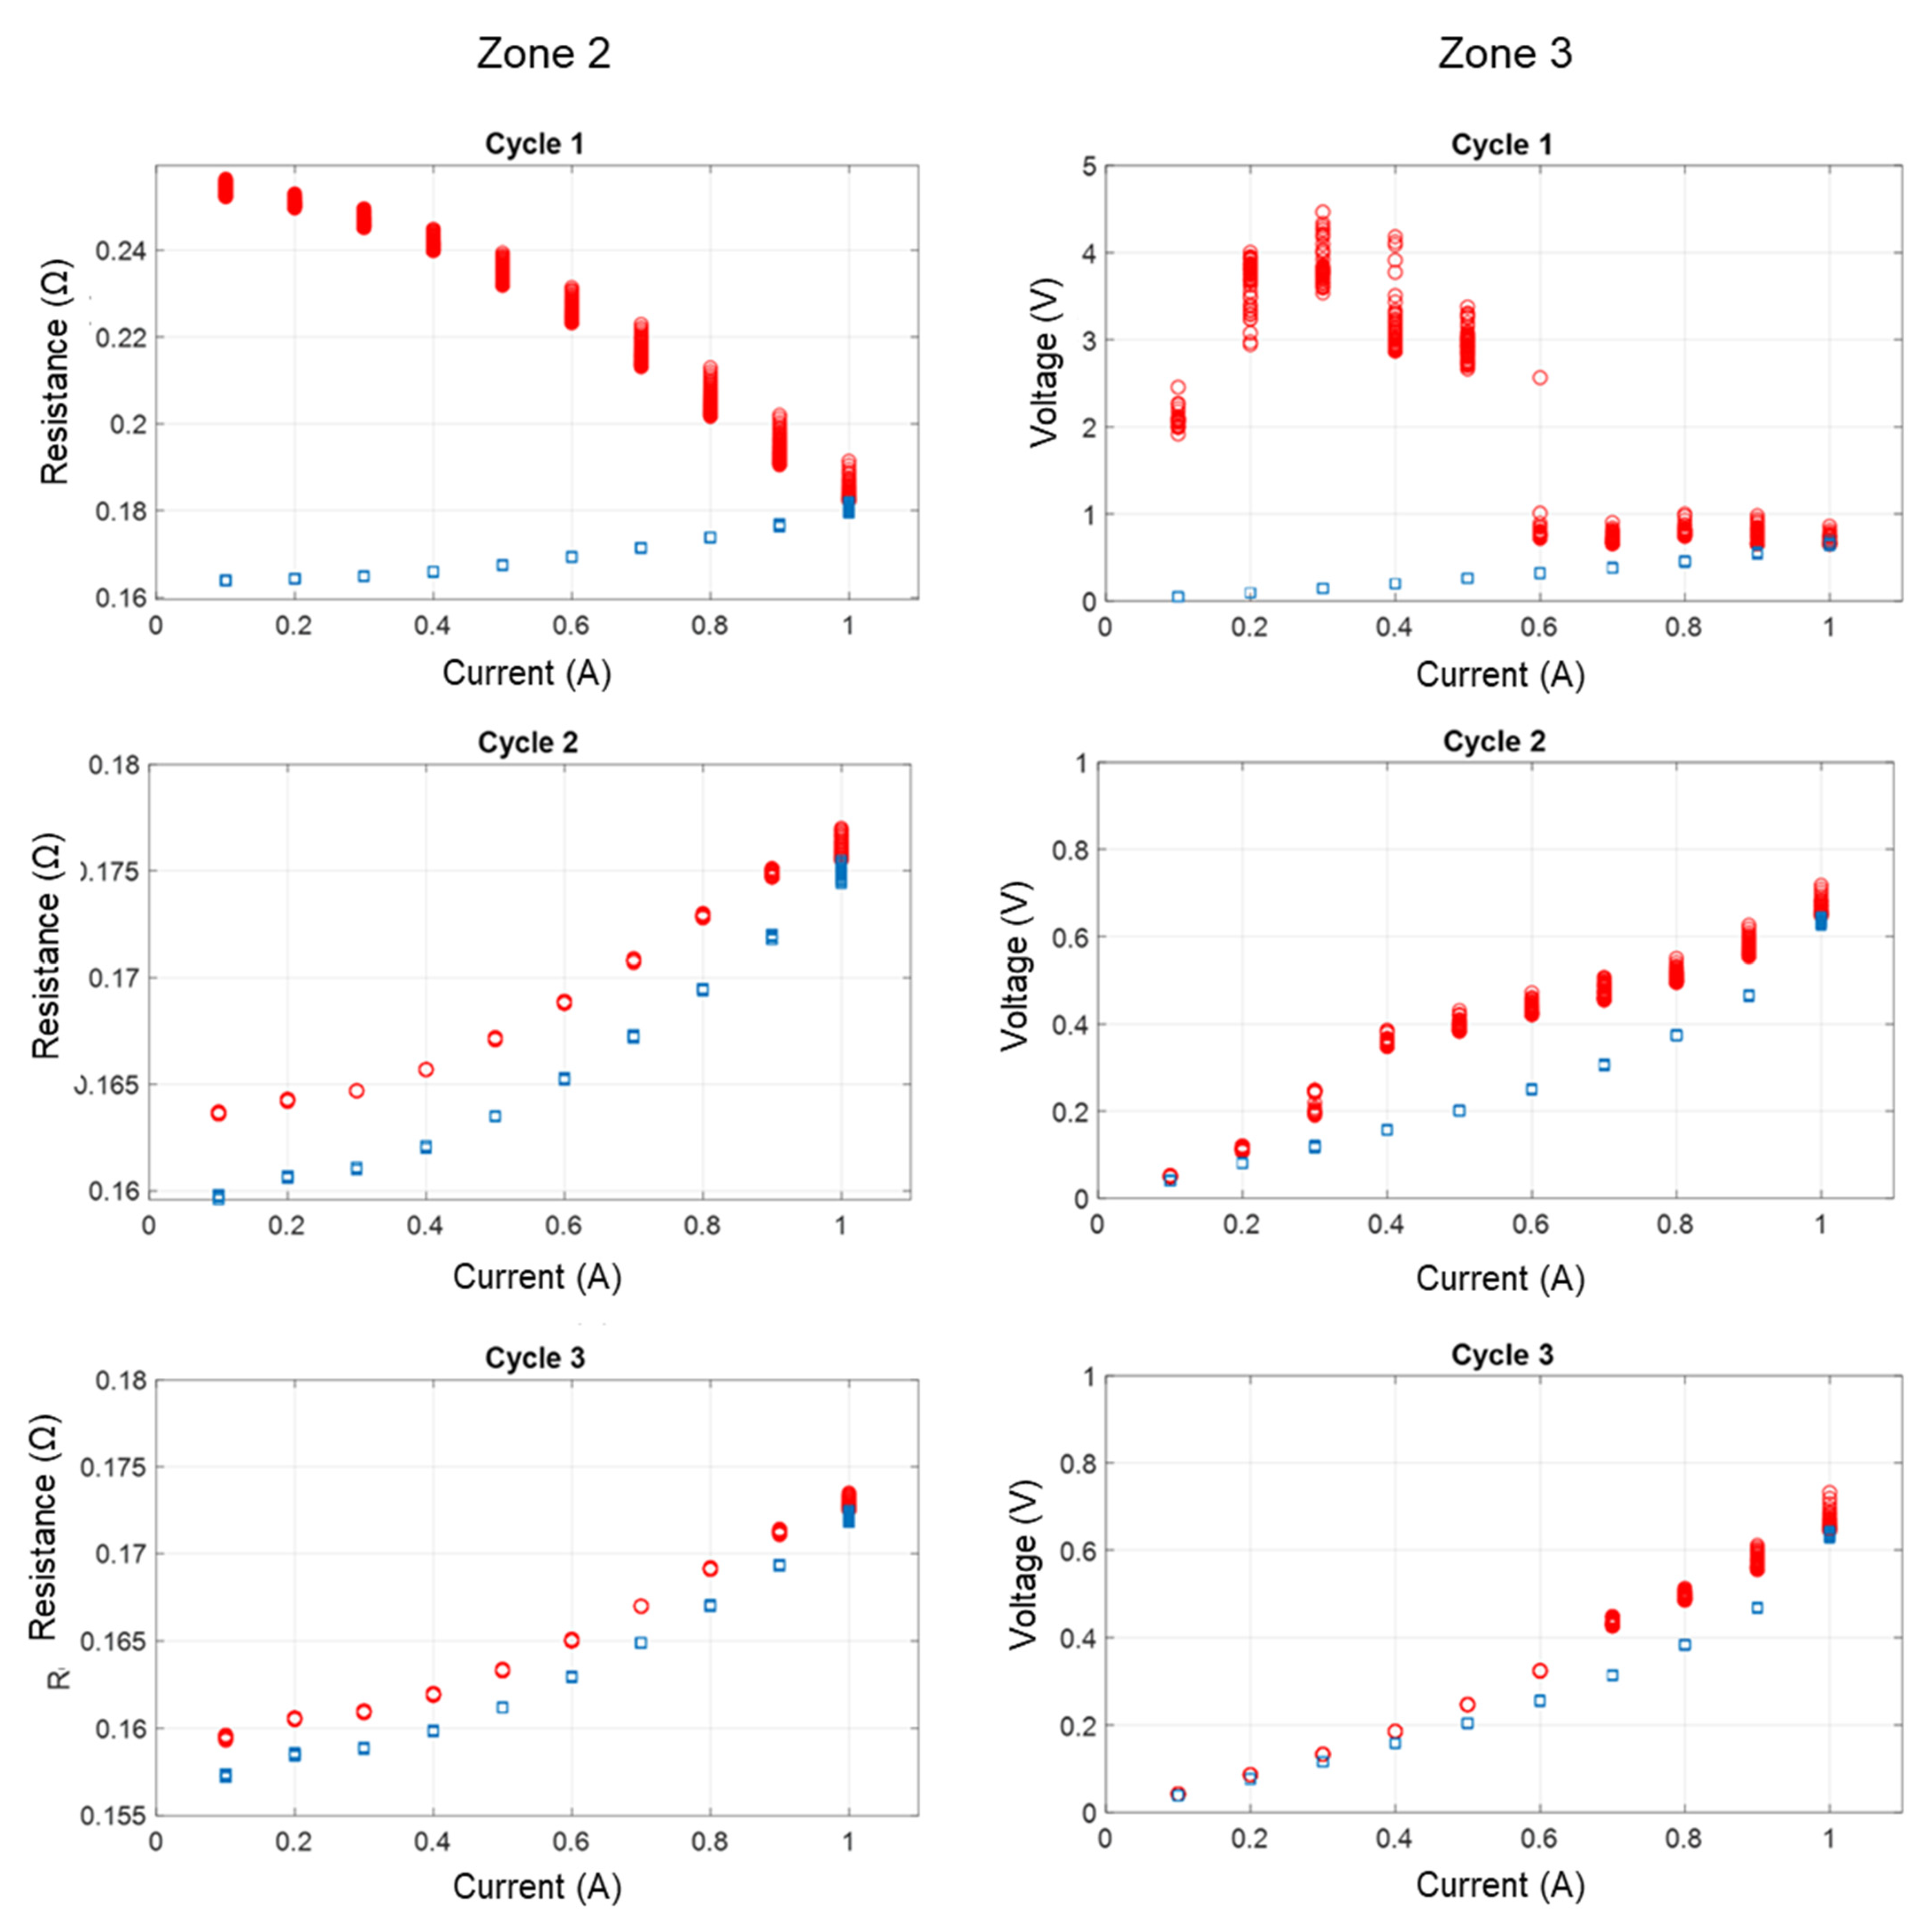
4.3. Moderately and Severely Oxidized Contact

For these two contacts, performed respectively in zones 2 and 3 of the rail shown in Figure 4, the results reveal a very different behavior from that observed for clean or slightly oxidized contacts.
Figure 8 shows the evolution of contact voltage for three successive cycles of current application (always varying between 0.1 A and 1 A in 100 mA steps), shown on the left for the moderately oxidized rail surface (zone 2, 10 µm oxide thickness) and on the right for the severely oxidized one (zone 3, 65 µm thickness). Figure 9, Figure 10 and Figure 11 show U I characteristics and variations in contact resistance as a function of current and time, respectively.
Zone 2, with an oxide thickness of 10   µ m ,   shows a different behavior from that observed on a clean or slightly oxidized contact. Figure 9 shows that after the initial current rise, the contact reaches a stable state with almost ohmic U I characteristics, which almost overlap during the second and third cycles. During the first cycle, the contact undergoes an irreversible evolution (Figure 10), resulting in a progressive decrease in resistance. Once the system has stabilized, a particular feature becomes apparent: the contact resistance tends to increase as the current increases, and to decrease as the current decreases. This trend, observable on all cycles once the system has stabilized, suggests a marked influence of thermal effects on conduction.
For zone 3, corresponding to the severely oxidized contact, Figure 9 also shows that, during the first cycle, a rapid evolution of the contact occurs as the current rises. This is reflected in a rapid drop in contact resistance, both during each constant current step and as current intensity increases. This phenomenon can be seen in Figure 9 for currents below 0.6   A   and in Figure 11 up to 300 s. Such behavior could result from an increase in the contact area due to the flattening of surface asperities under the combined effects of mechanical stress and Joule heating [25,26,27].
Let us take a closer look at a possible scenario. Initially, contact resistance is high due to the oxide layer present in the interface. As the current increases, Joule heating leads to a local increase in temperature (at the asperities) [28]. This increase in temperature leads to a progressive modification of the oxide layer, manifested by a decrease in its electrical resistivity [29]. At the same time, the hardness of the materials (steel and oxide) decreases [30], while the contact force remains unchanged. This results in a widening of the effective contact zone due to local breakdowns in the oxide film and flattening of the asperities, both promoting larger metal-to-metal contact areas.
Then, as the current continues to increase, the evolution of contact resistance gradually stabilizes, indicating a slower change in the contact, as shown in Figure 10 after the current has been increased from 0.6   A   t o   1   A . According to [28] this stabilization phase is reached once the influence of the oxide layer on the resistance is reduced. As reported in [28,31,32], the initial contribution of the oxide film can constitute up to 99.9% of the total contact resistance, thus explaining the magnitude of the drop in contact resistance measured in our case, from   25   Ω   to less than 1   Ω .
The first current cycle therefore led to significant and irreversible changes in contact, resulting in a clear improvement characterized by an increase in effective contact area and a reduction in contact resistance. In the second and third cycles, further irreversible contact modifications were clearly observed (U-I characteristics do not overlap between increasing and decreasing current), but to a lesser degree and with a significantly lower initial resistance than in the first cycle. The behavior observed at the decreasing current in the second and third cycles reflects a more stable contact state, suggesting that the conductive paths are no longer significantly modified by the application of the current. For the third cycle, the value of the contact resistance at low current has hardly changed between phases with increasing and decreasing currents.

5. Conclusions

Using a reduced-scale experimental setup that realistically mimics wheel–rail contact for real equipment identified as potentially “bad shunters”, we have studied in detail the electrical contact resistance under static conditions (corresponding to a stationary train) and under DC.
We compared non-oxidized and oxidized rail surfaces with different oxide thicknesses at a contact force of 400 N (equivalent to a loaded railcar at full-scale), increasing then decreasing the current in steps of 0.1 A between 0.1 and 1 A. In the case of a “clean” contact, the U-I characteristics prove to be linear and reversible. In the case of oxidized contacts, initial resistance is much higher, and increasing current is accompanied by several rapid drops in resistance, reflecting an irreversible evolution that we interpret as both the appearance of fractures in the oxide layer and the flattening of asperities softened by heating due to high local current densities. On return, as the current decreases, the U-I characteristics are almost linear, with much lower resistance values.
This study illustrates the ability of our test bench to investigate the various phenomena (mechanical, electrical, thermal, chemical and electrochemical) likely to affect wheel–rail contact resistance. In a future article, we will report on a study carried out under more realistic conditions (moving train and AC injected track signal).

Author Contributions

Conceptualization, F.L., F.H. and P.T.; methodology, L.H., F.L., F.H. and P.T.; software, L.H. and F.L.; validation, F.L., F.H. and P.T.; formal analysis, L.H., F.L., F.H. and P.T.; investigation, L.H., F.L., F.H. and P.T.; resources, K.S. and F.G.; data curation, L.H.; writing—original draft preparation, L.H., F.L., F.H. and P.T.; writing—review and editing, F.L., F.H., K.S., F.G. and P.T.; visualization, L.H., F.L., F.H., K.S., F.G. and P.T.; supervision, F.L., F.H., K.S., F.G. and P.T.; project administration, F.L., F.H., K.S., F.G. and P.T.; funding acquisition, F.L., F.H. and P.T. All authors have read and agreed to the published version of the manuscript.

Funding

This research was funded by the Société Nationale des Chemins de Fer français (SNCF), the French National Railway Network.

Data Availability Statement

The data are unavailable due to privacy restrictions.

Conflicts of Interest

The authors declare no conflicts of interest.

References

  1. Wybo, J.L. Track circuit reliability assessment for preventing railway accidents. Saf. Sci. 2018, 110 Pt B, 268–275. [Google Scholar] [CrossRef]
  2. Yu, H.; Wu, X. Wavelet packet energy entropy combined with ELM for prediction of shunting malfunction in track circuit. In Proceedings of the 4th International Symposium on Computer Technology and Information Science (ISCTIS), Xi’an, China, 12 July 2024. [Google Scholar]
  3. Mosleh, A.; Montenegro, P.A.; Costa, P.A.; Calçada, R. Railway Vehicle Wheel Flat Detection with Multiple Records Using Spectral Kurtosis Analysis. Appl. Sci. 2021, 11, 4002. [Google Scholar] [CrossRef]
  4. Mosleh, A.; Montenegro, P.; Alves Costa, P.; Calçada, R. An approach for wheel flat detection of railway train wheels using envelope spectrum analysis. Struct. Infrastruct. Eng. 2021, 17, 1710–1729. [Google Scholar] [CrossRef]
  5. Wei, Y.; Han, J.; Yang, T.; Wu, Y.; Chen, Z. Research on wheel/rail contact surface temperature and damage characteristics during sliding contact of a wheel. J. Eng. Appl. Sci. 2024, 71, 201. [Google Scholar] [CrossRef]
  6. Li, J.; Zhang, Y.; Zhao, B.; Zheng, Z. Research and Analysis on Contact Resistance of Wheel and Insulated Rail Joint in High-Speed Railway Stations. Electronics 2023, 12, 1272. [Google Scholar] [CrossRef]
  7. Ren, W.; Zhang, C.; Sun, X. Electrical Contact Resistance of Contact Bodies with Cambered Surface. IEEE Access 2020, 8, 93857–93867. [Google Scholar] [CrossRef]
  8. Itagaki, M.; Nozue, R.; Watanabe, K.; Katayama, H.; Noda, K. Electrochemical impedance of thin rust film of low-alloy steels. Corros. Sci. 2004, 46, 1301–1310. [Google Scholar] [CrossRef]
  9. Al-Juboori, A.; Zhu, H.; Wexler, D.; Li, H.; Lu, C.; Gazder, A.A.; McLeod, J.; Pannila, S.; Barnes, J. Microstructural changes on railway track surfaces caused by electrical leakage between wheel and rail. Tribol. Int. 2019, 140, 105875. [Google Scholar] [CrossRef]
  10. White, B.; Lewis, R.; Fletcher, D.; Harrison, T.; Hubbard, P.; Ward, C. Rail-wheel friction quantification and its variability under lab and field trial conditions. Proc. Inst. Mech. Eng. Part F J. Rail Rapid Transit 2024, 238, 569–579. [Google Scholar] [CrossRef]
  11. Broster, M.; Pritchard, C.; Smith, D.A. Wheel/rail adhesion: Its relation to rail contamination on british railways. Wear 1974, 29, 309–321. [Google Scholar] [CrossRef]
  12. Descartes, S.; Desrayaud, C.; Niccolini, E.; Berthier, Y. Presence and role of the third body in a wheel–rail contact. Wear 2005, 258, 1081–1090. [Google Scholar] [CrossRef]
  13. Descartes, S.; Renouf, M.; Fillot, N.; Gautier, B.; Descamps, A.; Berthier, Y.; Demanche, P. A new mechanical-electrical approach to the wheel-rail contact. Wear 2008, 265, 1408–1416. [Google Scholar] [CrossRef]
  14. Xu, W.; Zhang, B.; Deng, Y.; Wang, Z.; Jiang, Q.; Yang, L.; Zhang, J. Corrosion of rail tracks and their protection. Corros. Rev. 2021, 39, 1–13. [Google Scholar] [CrossRef]
  15. Suzumura, J.; Sone, Y.; Ishizaki, A.; Yamashita, D.; Nakajima, Y.; Ishida, M. In situ X-ray analytical study on the alteration process of iron oxide layers at the railhead surface while under railway traffic. Wear 2011, 271, 47–53. [Google Scholar] [CrossRef]
  16. Fukuda, M.; Terada, N.; Ban, T. Study of quantifying and reducing electrical resistance between wheels and rails. Q. Rep. RTRI 2008, 49, 158–162. [Google Scholar] [CrossRef]
  17. Chollet, H.; Houzé, F.; Testé, P.; Loete, F.; Lorang, X.; Debucquoi, S. Observation of Branly’s effect during shunting experiments on scaled wheel-rail contacts. In Proceedings of the 9th International Conference on Contact Mechanics and Wear of Rail/Wheel Systems (CM2012), Chengdu, China, 27–30 August 2012; pp. 111–114. [Google Scholar]
  18. Houzé, F.; Chollet, H.; Testé, P.; Lorang, X.; Loëte, F.; Andlauer, R.; Debucquoi, S.; Lerdu, F.; Antoni, M. Electrical behaviour of the wheel-rail contact. In Proceedings of the 26th International Conference on Electrical Contacts (ICEC-ICREPEC2012), Beijing, China, 14–17 May 2012; pp. 67–72. [Google Scholar]
  19. Haydar, L.; Loete, F.; Houzé, F.; Choupin, T.; Guiche, F.; Testé, P. Enhancing Railway Network Safety by Reproducing Wheel–Rail Electrical Contact on a Laboratory Scale. Appl. Sci. 2023, 13, 10253. [Google Scholar] [CrossRef]
  20. Kaza, G.-L.; Houzé, F.; Loëte, F.; Testé, P. Experimental Study and Phenomenological Laws of Some Nonlinear Behaviours of the Wheel–Rail Contact Associated with the Deshunting Phenomenon. Appl. Sci. 2023, 13, 11752. [Google Scholar] [CrossRef]
  21. Holm, R. Electrical Contacts: Theory and Applications, 4th ed.; Springer: Berlin, Germany, 2000. [Google Scholar]
  22. Johannet, P. Study of a Mathematical Model Representing the Ageing of Electrical Contacts Versus Time. IEEE Trans. Power App. Sys. 1972, PAS-91, 1211–1219. [Google Scholar] [CrossRef]
  23. Greenwood, A. Constriction resistance and the real area of contact. Brit. J. Appl. Phys. 1966, 17, 1621–1632. [Google Scholar] [CrossRef]
  24. Duvivier, P.-Y. Étude Expérimentale et Modélisation du Contact Electrique et Mécanique Quasi Statique Entre Surfaces Rugueuses d’or: Application Aux Micro-Relais Mems. Ph.D. Thesis, École Nationale Supérieure des Mines de Saint-Étienne, Saint-Étienne, France, 2010. [Google Scholar]
  25. Bhushan, B. Contact mechanics of rough surfaces in tribology: Multiple asperity contact. Trib. Lett. 1998, 4, 1–35. [Google Scholar] [CrossRef]
  26. Broué, A. Analyse Multi-Physique des Sources de Défiabilisation du Microcontact Ohmique dans les Interrupteurs MEMS. Ph.D. Thesis, Université Toulouse 3 Paul Sabatier, Toulouse, France, 2012. [Google Scholar]
  27. Kubler-Riedinger, M. Étude de L’échauffement des Contacts Dans un Disjoncteur Basse Tension. Influence de L’arc Electrique sur le Collage des Contacts. Ph.D. Thesis, Université d’Orléans, Orléans, France, 2021. [Google Scholar]
  28. Kim, W.; Wang, Q.J. Numerical Computation of Surface Melting at Imperfect Electrical Contact between Rough Surfaces. In Proceedings of the 52nd IEEE Holm Conference on Electrical Contacts, Montréal, QC, Canada, 25–27 September 2006; pp. 81–88. [Google Scholar]
  29. Puech, L. Élaboration et Caractérisations de Couches Minces de Magnétite Pour des Applications Microbolométriques. Ph.D. Thesis, Université Toulouse 3 Paul Sabatier, Toulouse, France, 2009. [Google Scholar]
  30. Huang, Y.-S.; Chen, L.; Lui, H.-W.; Cai, M.-H.; Yeh, J.-W. Microstructure, Hardness, Resistivity and Thermal Stability of Sputtered Oxide Films of AlCoCrCu0.5NiFe High-Entropy Alloy. Mater. Sci. Eng. A 2007, 457, 77–83. [Google Scholar] [CrossRef]
  31. Ruschau, G.; Yoshikawa, S.; Newnham, R. Resistivities of conductive composites. J. Appl. Phys. 1992, 72, 953–959. [Google Scholar] [CrossRef]
  32. Kogut, L.; Komvopoulos, K. Electrical contact resistance theory for conductive rough surfaces. J. Appl. Phys. 2003, 94, 3153–3162. [Google Scholar] [CrossRef]
Figure 1. Electrical measurement system based on the four-point method: (a) schematic of the electrical measurement setup on the bench, (b) photograph of the copper thread brushes (circled) pressed against the roller and rail.
Applsci 15 00471 g001
Figure 2. Evolution of the contact current (-left axis) and of the contact voltage (-right axis) for a clean contact between roller and rail (F = 400 N).
Applsci 15 00471 g002
Figure 3. U-I characteristics for clean contact with F = 400 N and current I: (O) increasing from 0.1 A to 1 A, and () decreasing from 1 A to 0.1 A.
Applsci 15 00471 g003
Figure 4. Various rail zones with different oxide thicknesses.
Applsci 15 00471 g004
Figure 5. Zone 1—U-I characteristics in the case of a slightly oxidized contact with F = 400 N and current I (O) increasing from 0.1 A to 1 A, then I () decreasing from 1 A to 0.1 A, for three successive cycles of current application.
Applsci 15 00471 g005
Figure 6. Zone 1—Rc = f(I), contact resistance as a function of current in the case of a slightly oxidized contact with F = 400 N and current I (O) increasing from 0.1 A to 1 A, then I () decreasing from 1 A to 0.1 A, for three successive cycles of current application.
Applsci 15 00471 g006
Figure 7. Zone 1—Rc = f(t), contact resistance versus time in the case of a slightly oxidized contact with F = 400 N and current I increasing from 0.1 A to 1 A (up to 600 s), then I decreasing from 1 A to 0.1 A (between 600 s and 1200 s), for three successive cycles of current application.
Applsci 15 00471 g007
Figure 8. Evolution of contact current (-left axis) and contact voltage (-right axis) for three successive cycles of current application in the case of (left) Zone 2, moderately oxidized rail surface, 10 µm thick oxide, and (right) Zone 3, severely oxidized rail surface, 65 µm thick oxide.
Applsci 15 00471 g008
Figure 9. U-I characteristics for three successive cycles of current application with F = 400 N and a current I (O) increasing from 0.1 A to 1 A, then I () decreasing from 1 A to 0.1 A, in the case of (left) Zone 2, moderately oxidized rail surface, 10 µm thick oxide, and (right) Zone 3, severely oxidized rail surface, 65 µm thick oxide.
Applsci 15 00471 g009
Figure 10. Rc = f(I), contact resistance as a function of current for three successive cycles of current application with F = 400 N and current I (O) increasing from 0.1 A to 1 A, then I () decreasing from 1 A to 0.1 A, for F = 400 N, in the case of (left) Zone 2, moderately oxidized rail surface, 10 µm thick oxide, and (right) Zone 3, severely oxidized rail surface, 65 µm thick oxide.
Applsci 15 00471 g010
Figure 11. Rc = f(t), evolution of contact resistance for three successive cycles of current application, in the case of (left) Zone 2, moderately oxidized rail surface, 10 µm thick oxide, and (right) Zone 3, severely oxidized rail surface, 65 µm thick oxide.
Applsci 15 00471 g011
Table 1. Average oxide thickness and standard deviation in the three rail zones shown in Figure 4, evaluated over 30 measurements per zone.
ZonesAverageStandard Deviation
Zone 1 6   μ m 1.7   μ m
Zone 2 10   μ m 2.5   μ m
Zone 3 65   μ m 14   μ m
Disclaimer/Publisher’s Note: The statements, opinions and data contained in all publications are solely those of the individual author(s) and contributor(s) and not of MDPI and/or the editor(s). MDPI and/or the editor(s) disclaim responsibility for any injury to people or property resulting from any ideas, methods, instructions or products referred to in the content.

