
Cross-Technology Interference-Aware Rate Adaptation in Time-Triggered Wireless Local Area Networks


Abstract
1. Introduction
- 1.
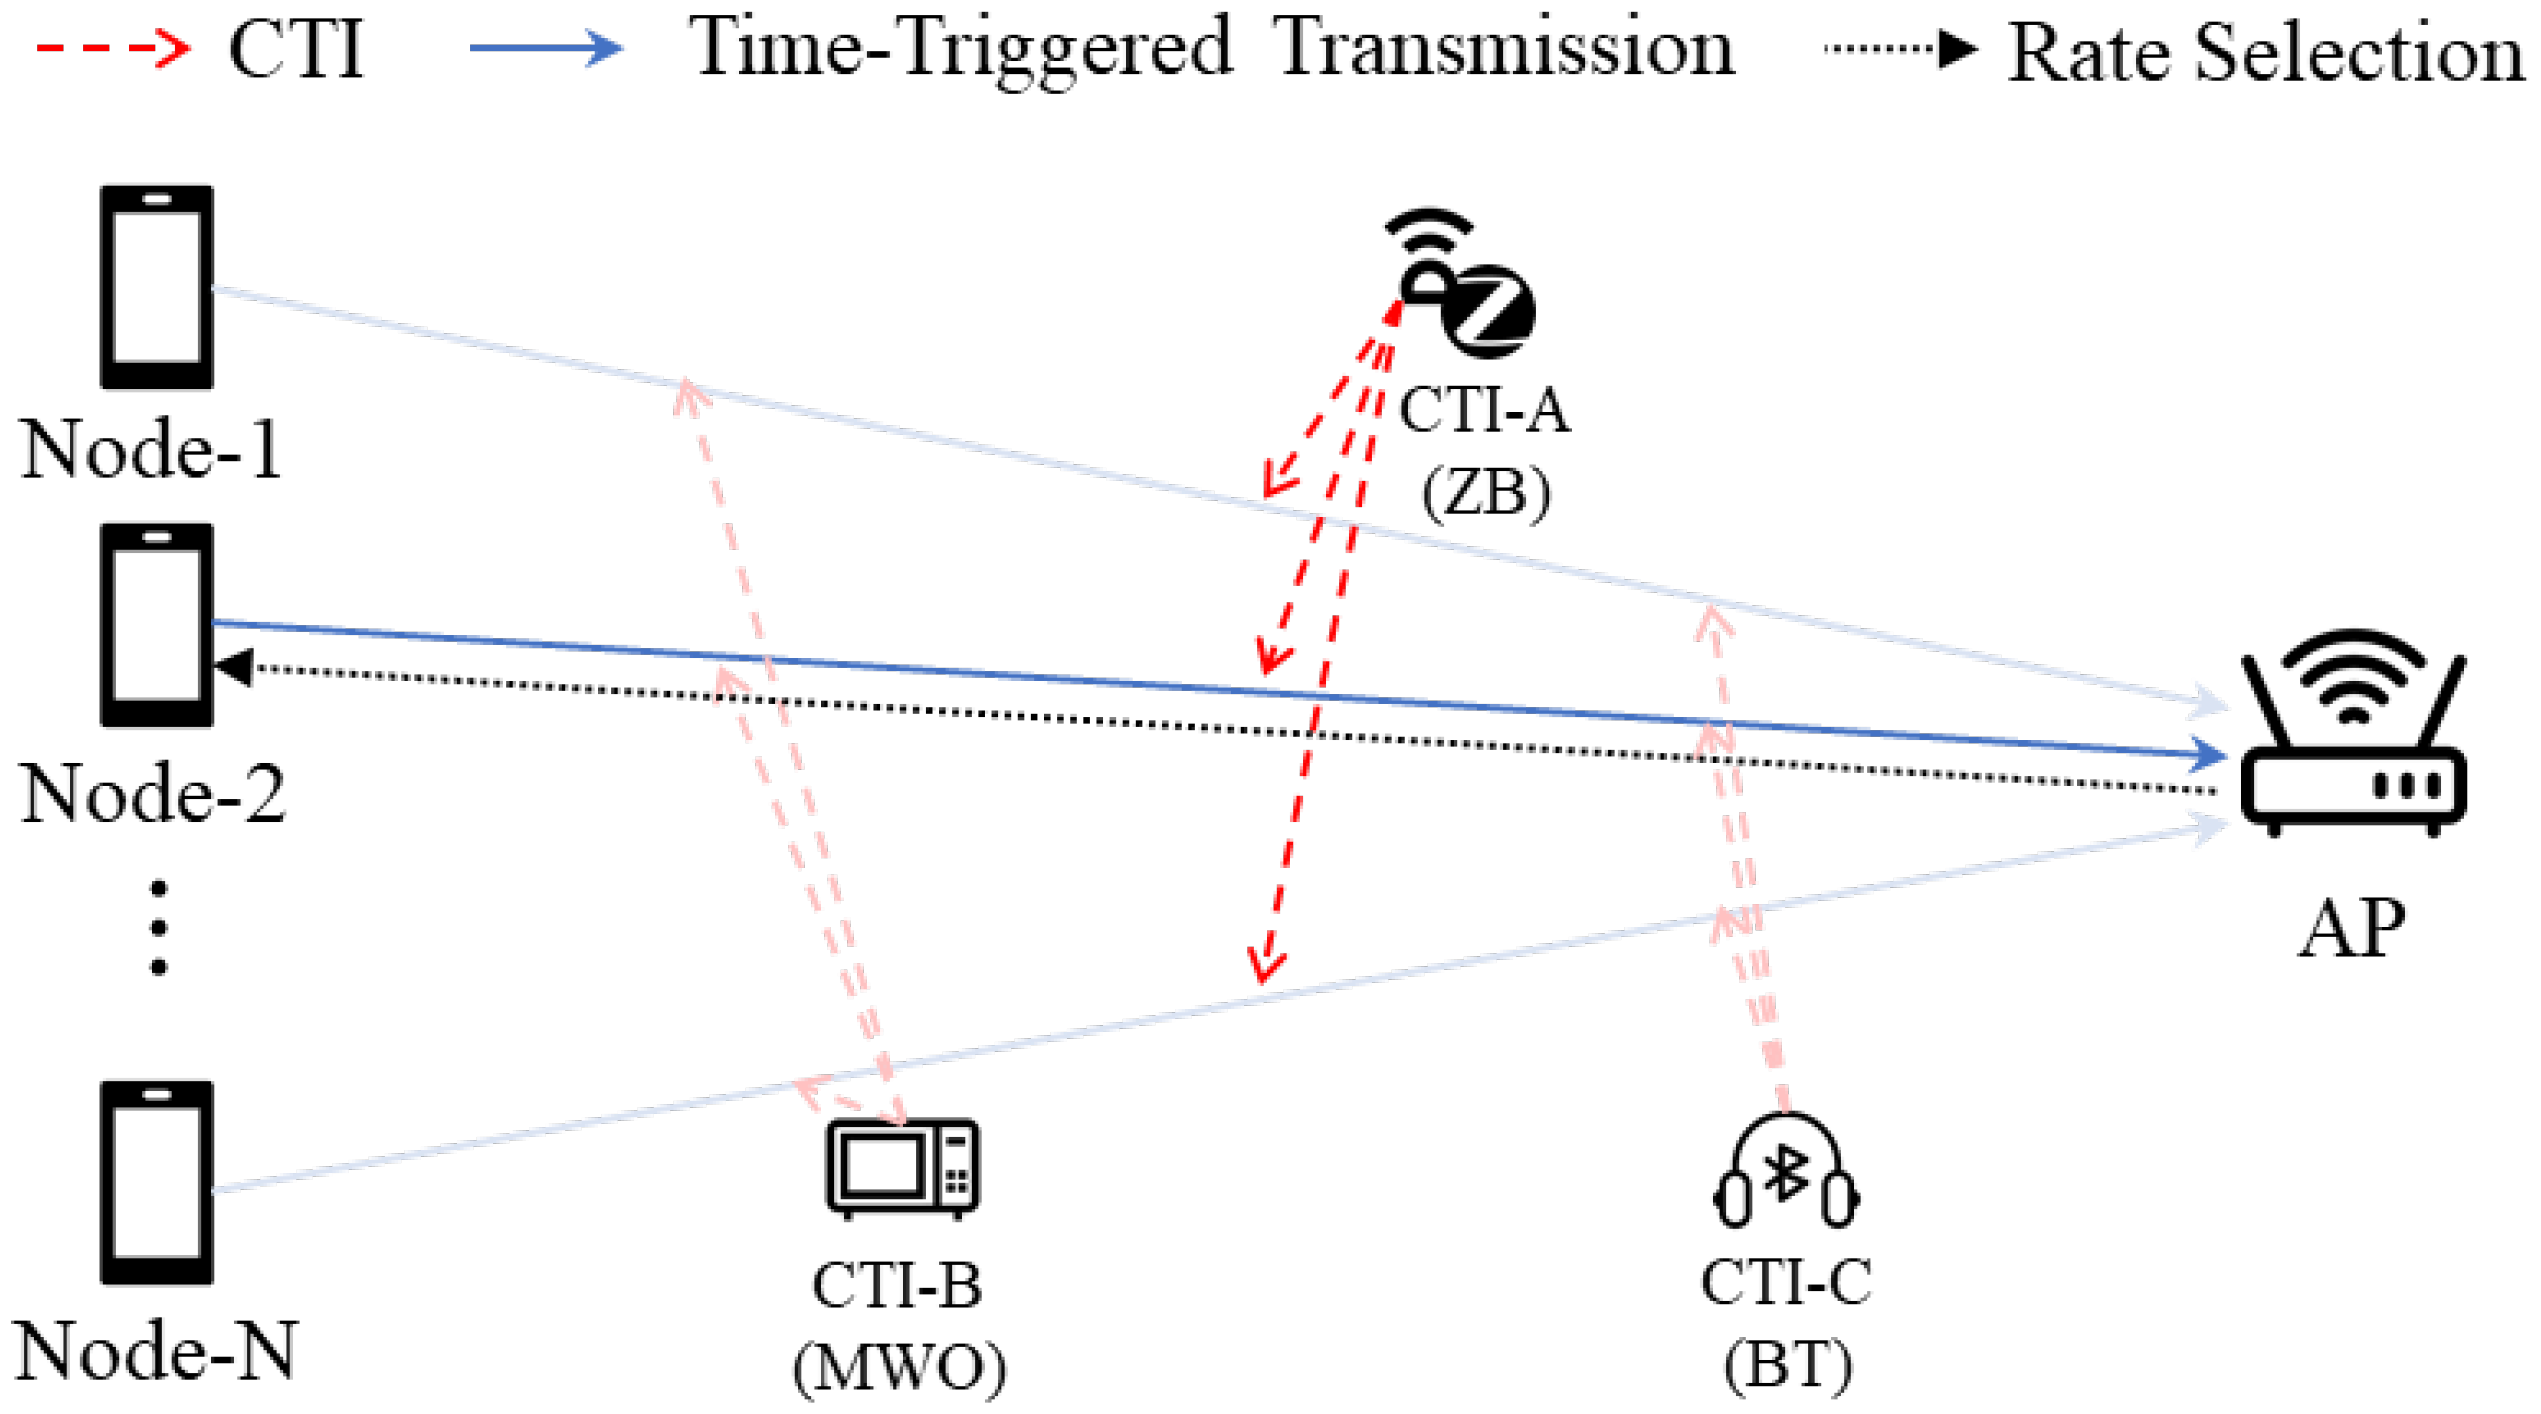
- We propose a framework that effectively identifies CTI by leveraging the distinct spectrum usage characteristics of various wireless technologies and performs interference-aware rate adaptation accordingly. This framework addresses two key challenges in time-triggered WLANs for mitigating interference from cross-technology wireless devices without requiring protocol designs specific to each device. These challenges involve identifying signals in each slot and using this information to select an appropriate transmission rate for the next time slot.
- 2.
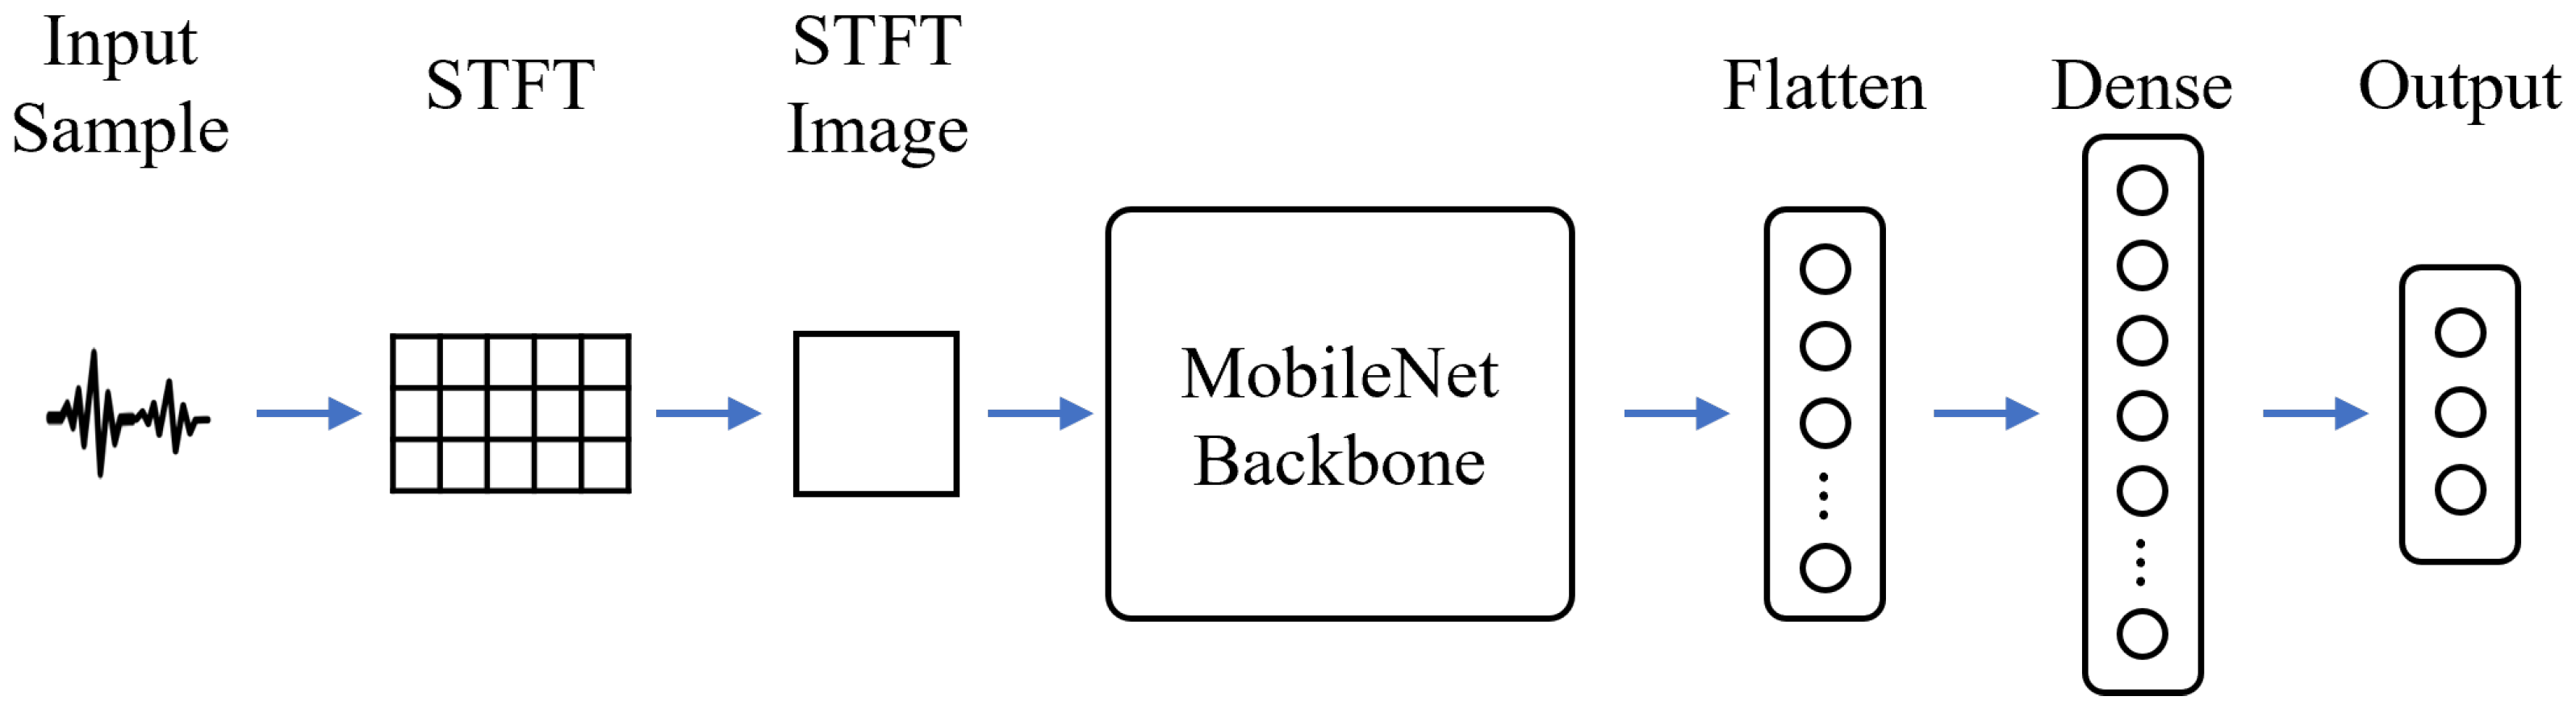
- Within the framework, we introduce a MobileNet-based CTI identification model designed for low computational complexity. This model estimates the presence and average power of CTI signals in each slot from the detected spectrum, accurately capturing CTI signal characteristics in the time, frequency, and power domains through the application of short-time Fourier transform (STFT). This approach enables estimation of the power of each CTI signal, supporting efficient CTI-aware rate adaptation.
- 3.
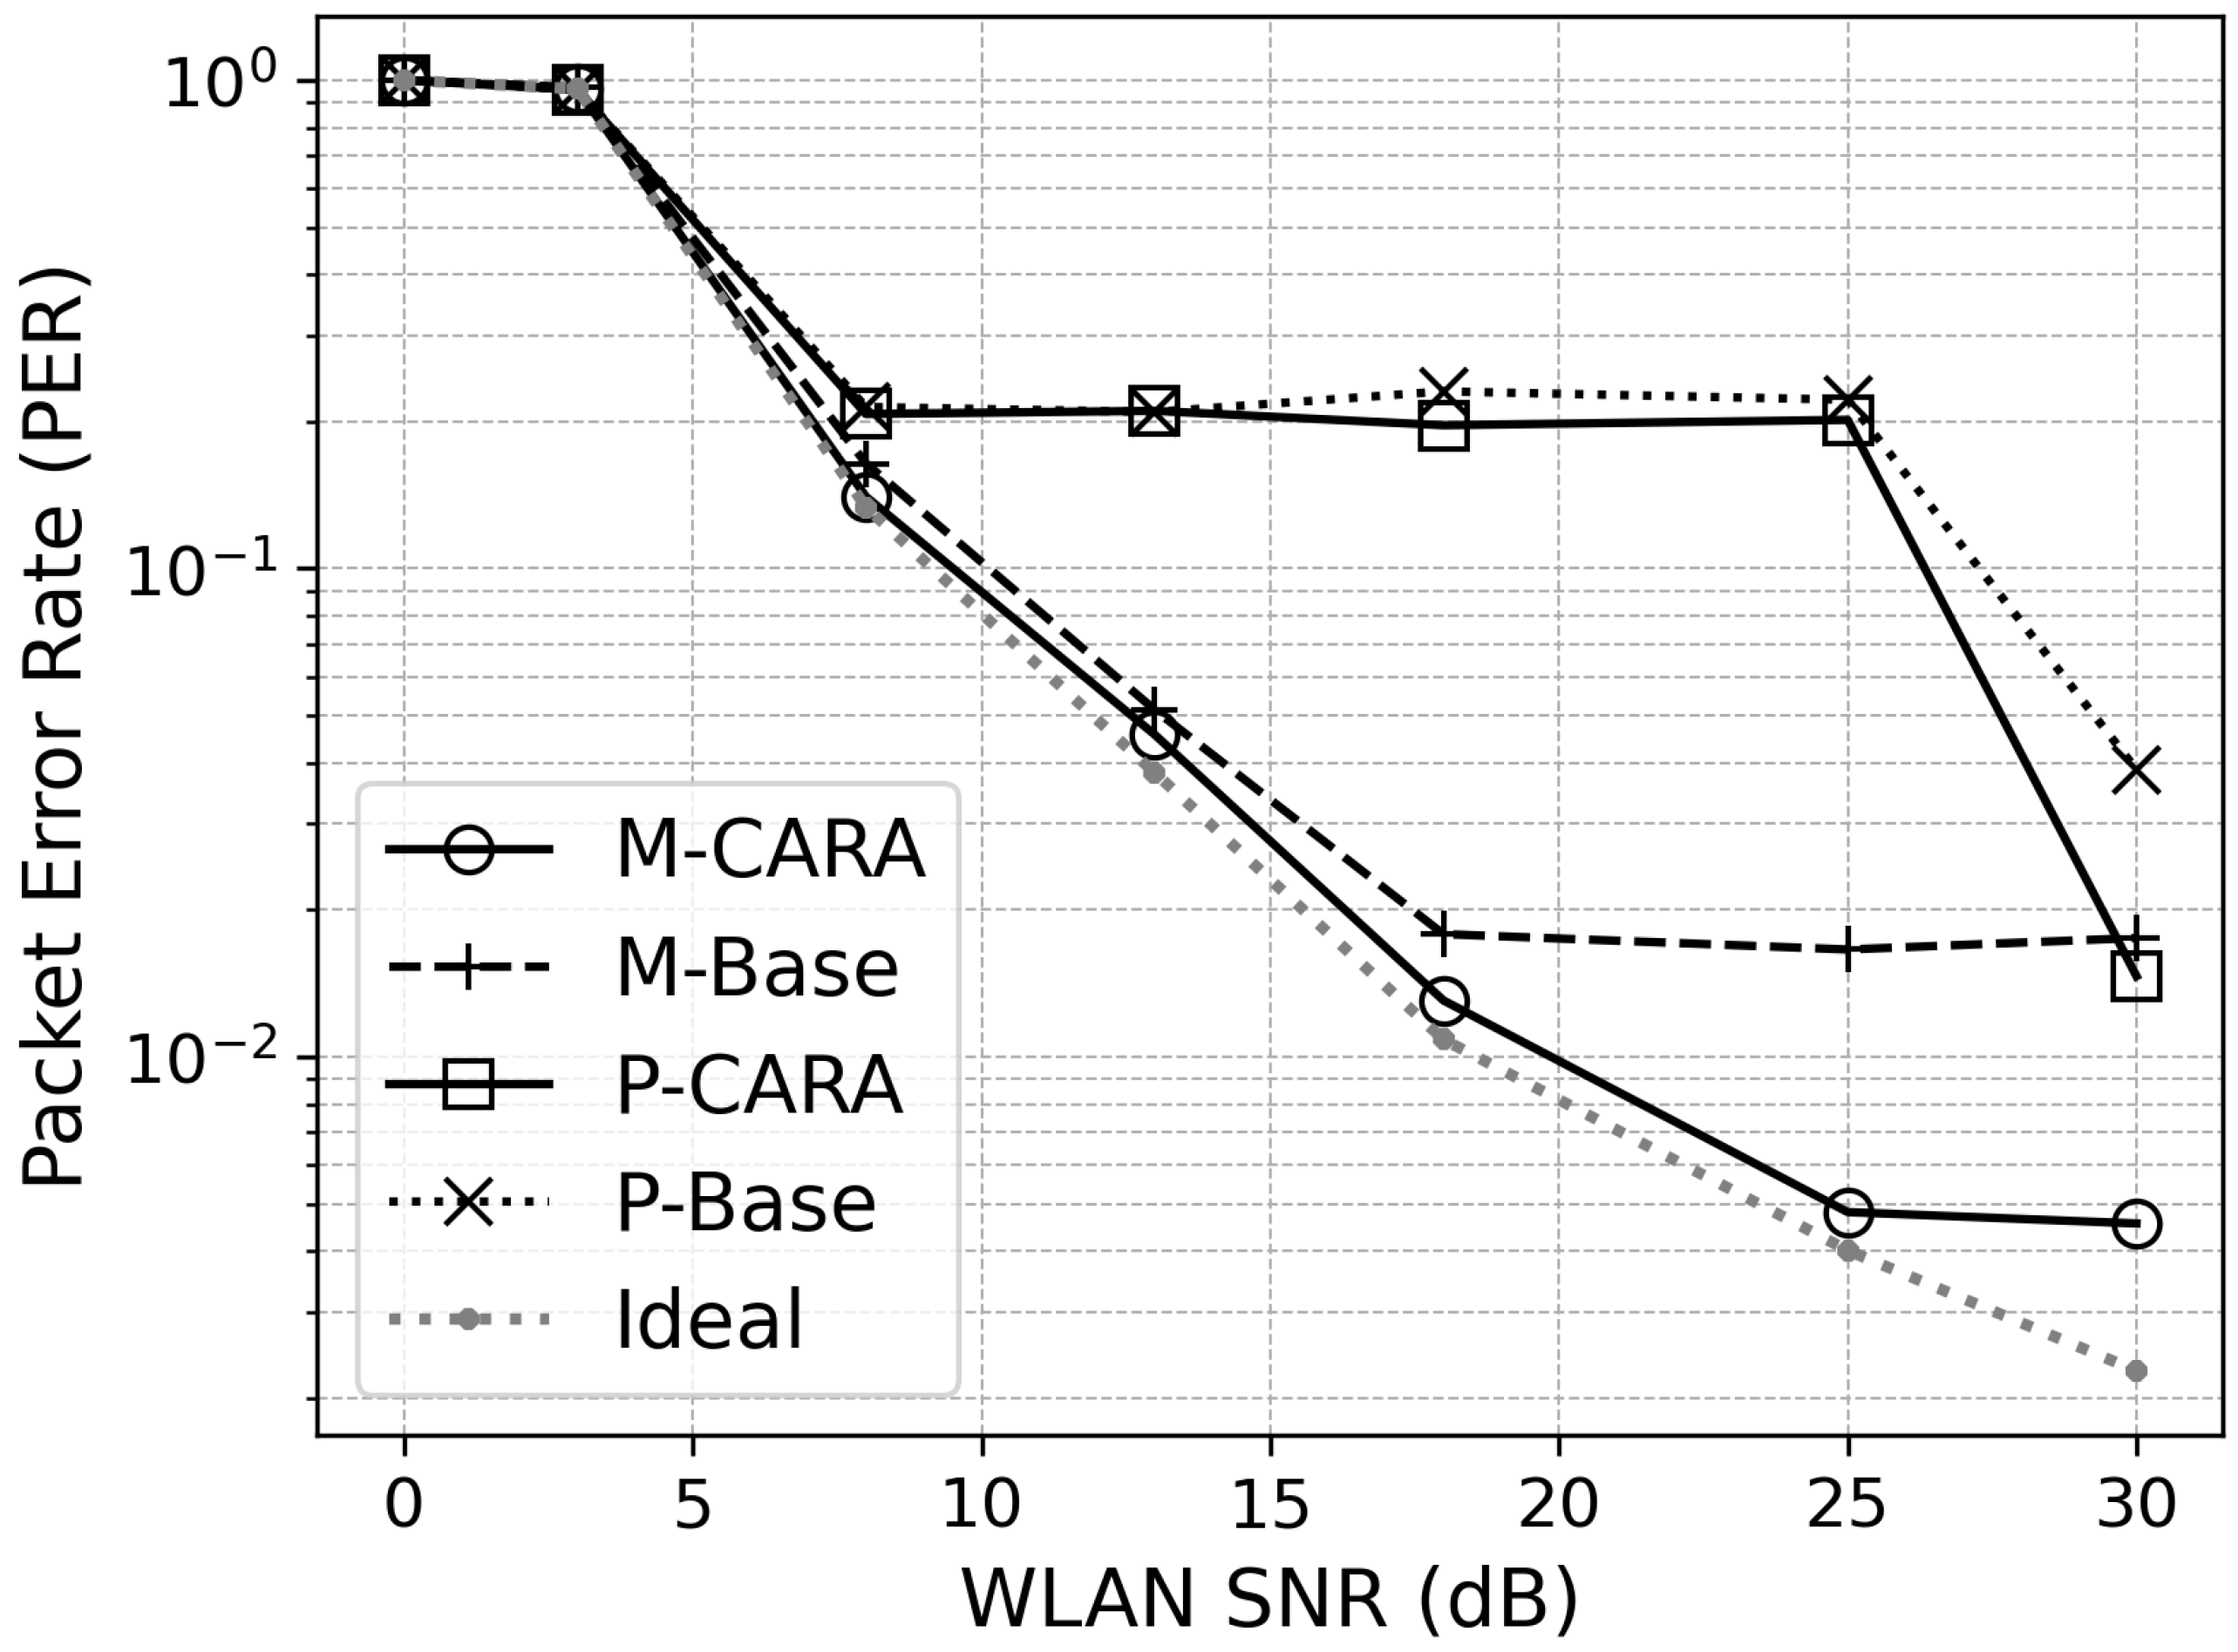
- We adapt our framework to two common WLAN interference mitigation approaches, one based on explicit channel measurements and the other leveraging packet error-based implicit interference mitigation, resulting in the M-CARA and P-CARA algorithms, respectively. Both algorithms utilize information obtained from the CTI identification model to project interference occurrence times according to each CTI type’s pattern, and then adjust their responses based on interference intensity. Simulation results show that both algorithms outperform existing methods in terms of packet error rate, goodput, and latency.
2. Related Work
2.1. Cross-Technology Interference Identification
2.2. Cross-Technology Interference Mitigation
2.3. Goals of This Study
- RQ1
- In time-triggered WLANs, how can interference mitigation be performed when WLAN devices experience cross-technology interference from multiple types of wireless devices without direct coordination with those devices?
- RQ2
- To perform interference mitigation based on CTI types, how can the CTI devices in the network be distinguished, and how can interference strength information for those devices be obtained?
- RQ3
- How can CTI in the network be effectively mitigated using interference mitigation methods in WLANs without direct coordination for CTI?
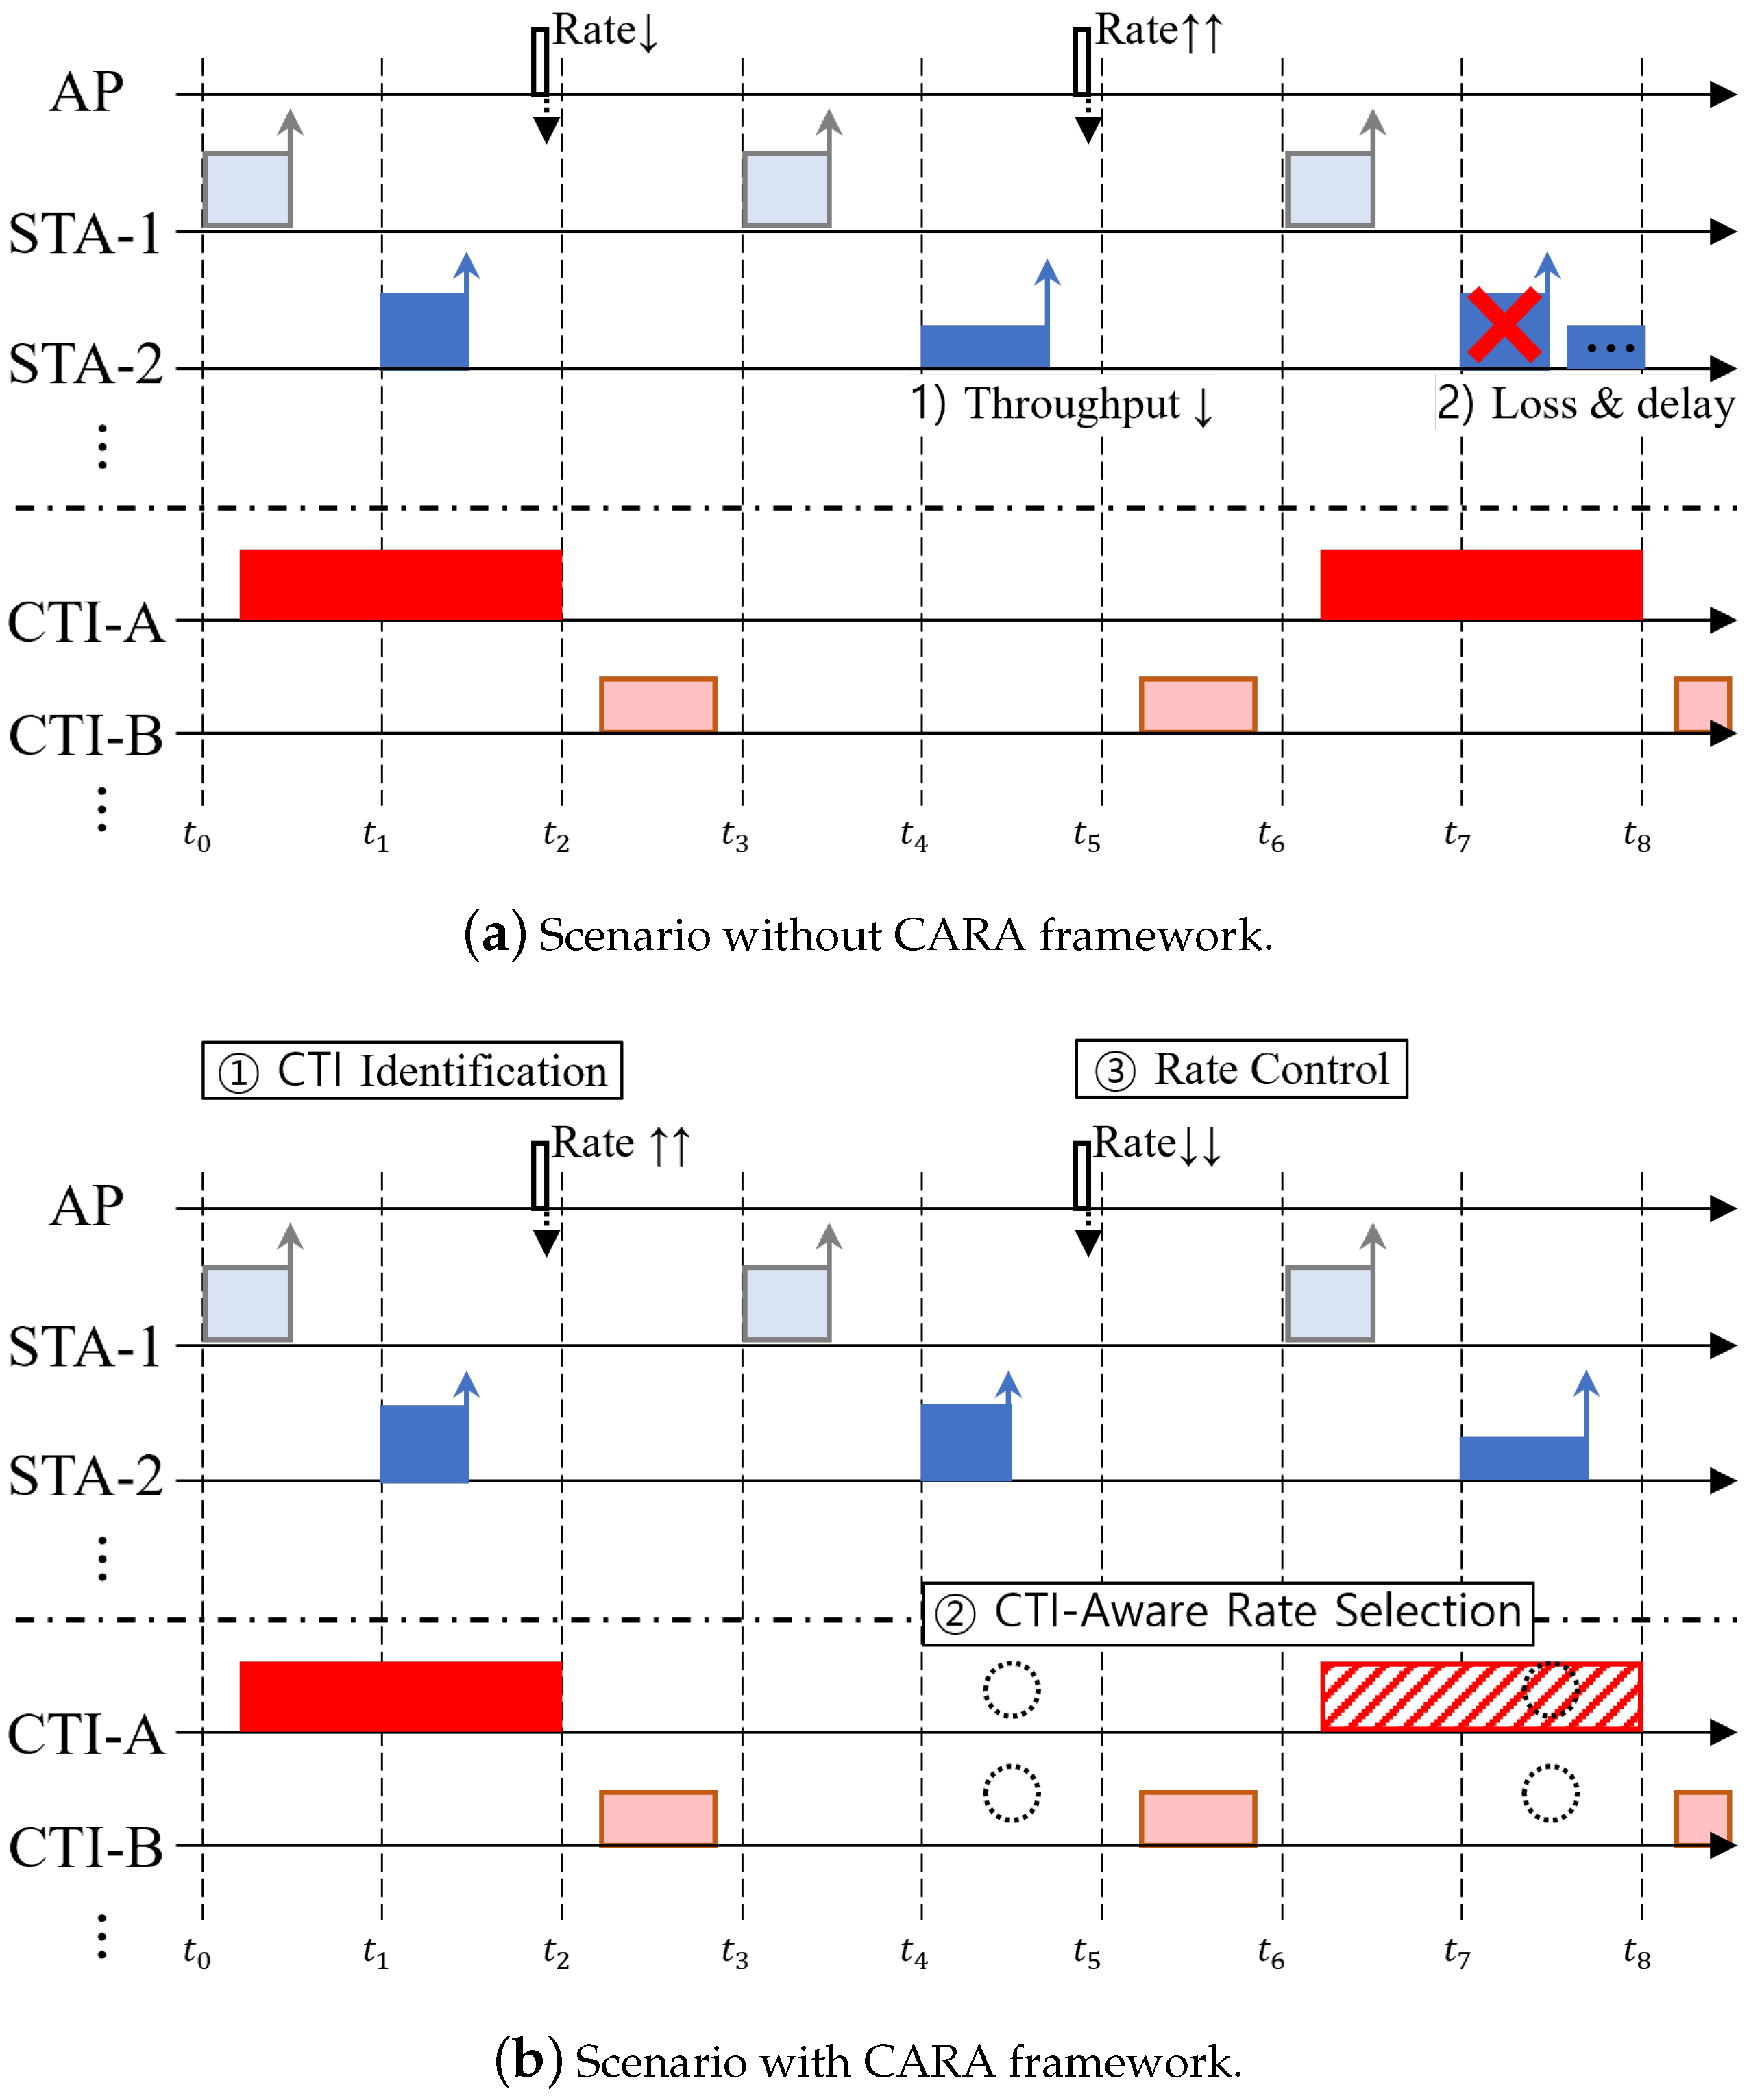
3. CTI-Aware Rate Adaptation Framework
3.1. Overview of the CARA Framework
3.2. CTI Identification
- : Predicted average power vector for the M CTI signal types;
- : CTI identification model parameterized by ;
- I: An image representation obtained by applying the STFT to the received signal over the duration .
- N is the total number of training samples;
- is the actual average power of CTI signal type m in sample i;
- is the predicted average power of CTI signal type m in sample i.
- : input sample size (width, height, and channels);
- : number of output channels and kernel size in the first layer;
- L: total number of layers;
- : kernel size of layer l;
- , : number of output channels from the previous layer and current layer, respectively;
- , : width and height of the output feature map at layer l;
- : stride at layer l;
- F: number of parameters in the final fully connected layer;
- N: number of final output labels.
3.3. CTI-Aware Rate Selection
| Algorithm 1 Measurement-based CTI-aware rate selection |
Require: Number of STAs N; slot duration ; signal identification period . Ensure: for each STA k. Initialization: CTI projection table; for all . for slot index to total number of slots do Determine the STA k assigned to the i-th slot. Estimate the signal and noise power of STA k and update average values. if then Identify CTI signals. if CTI signals are identified then Update the CTI projection table. end if end if Calculate SINR and derive for STA k’s next transmission slot. Return . end for |
| Algorithm 2 Packet error-based CTI-aware rate selection |
Require: Number of STAs N; slot duration ; signal identification period ; rate selection step m. Ensure: , for each STA k. Initialization: CTI projection table; set ; for all . for slot index to total number of slots do if A packet is received from the STA using slot i then Estimate the signal and noise power of the STA. Update the average signal and noise power values for the STA. Transmit an ACK message to the STA. end if if then Identify CTI signals. if CTI signals are identified then Update the CTI projection table. end if end if if CTI is predicted in the next m-th slot then Determine the STA k assigned to the next m-th slot. Set to on. Estimate the signal power of STA k. Calculate and for STA k. Compute . if and has changed then Return and . end if else Find STA k where . Set to off. Return . end if end for |
4. Experiment Setup
4.1. Data Generation and Model Training Parameters
4.2. Simulation Setup
5. Results and Analysis
5.1. Performance of CTI Identification
5.2. Performance of CTI-Aware Rate Selection
5.2.1. Packet Error Rate
5.2.2. Goodput
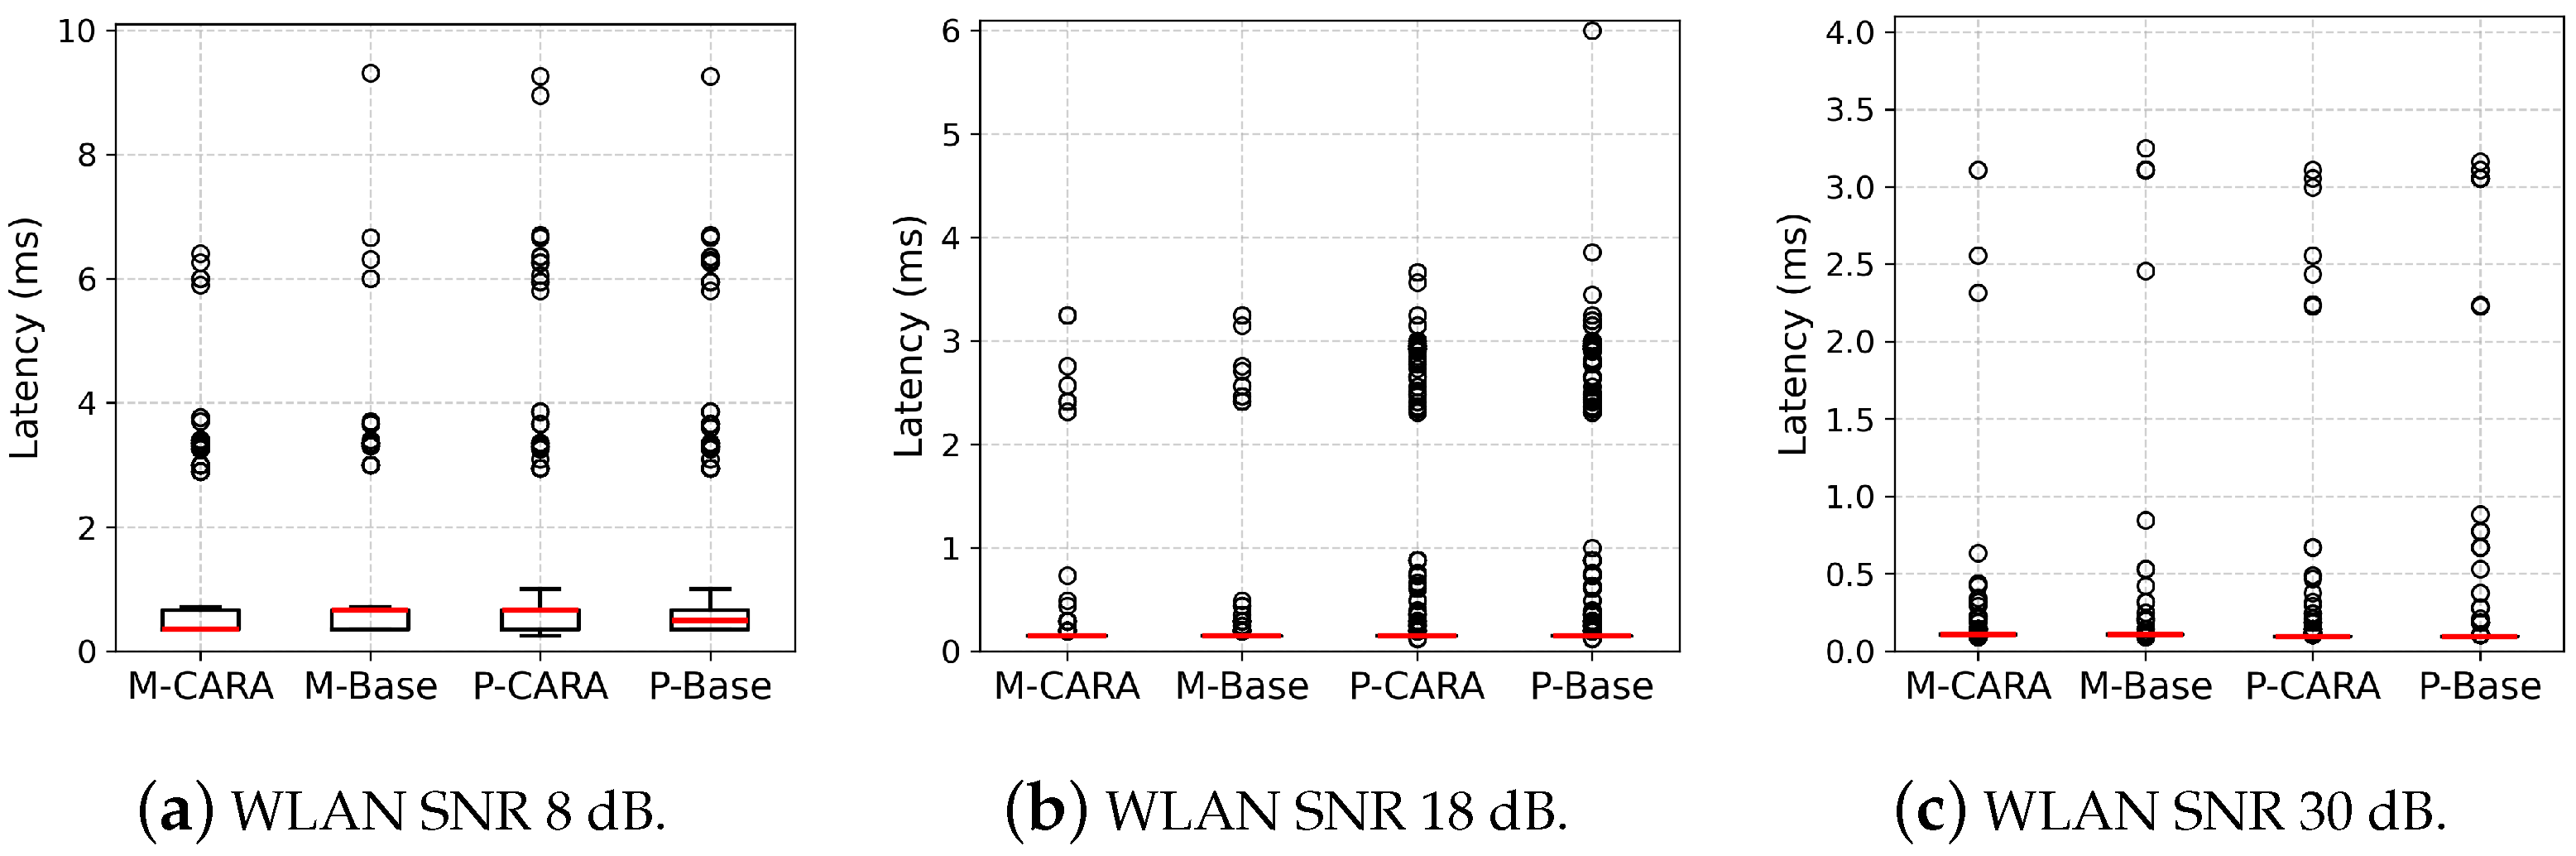
5.2.3. Latency
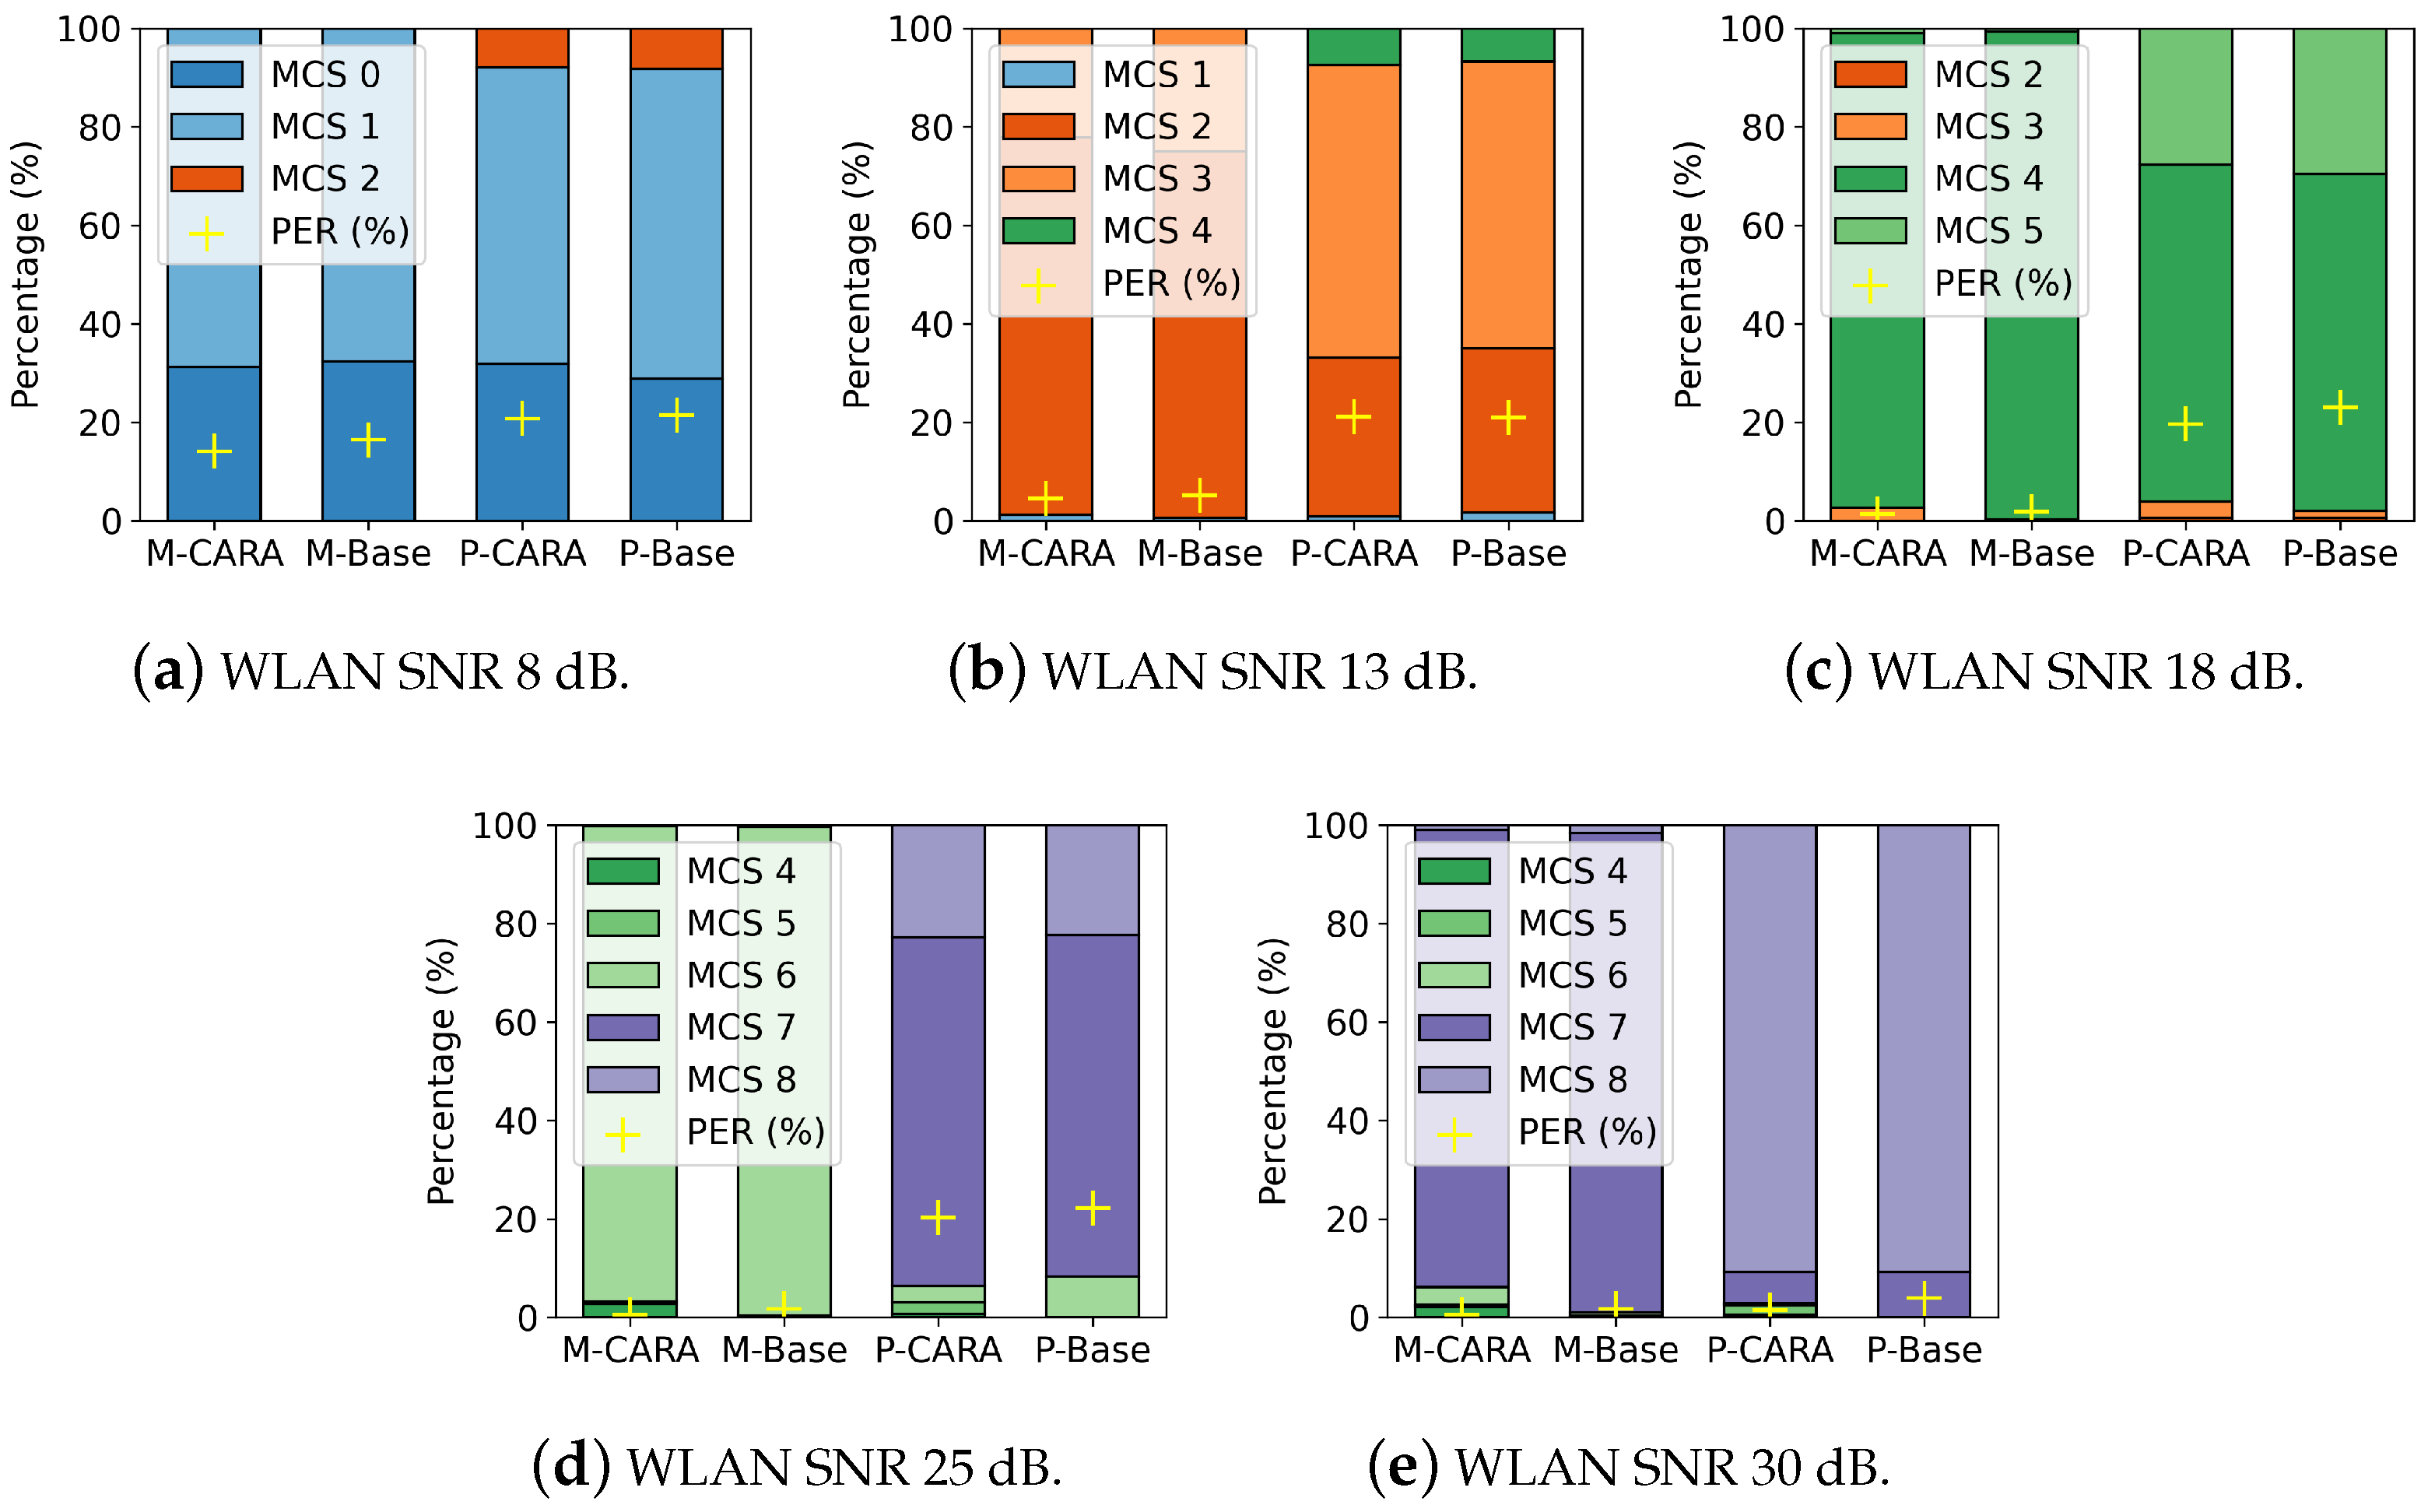
5.2.4. Rate Selection Ratios
6. Conclusions
Author Contributions
Funding
Institutional Review Board Statement
Informed Consent Statement
Data Availability Statement
Conflicts of Interest
References
- Park, J.; Park, J.O.; Choi, J.; Kwon, T.T. D-SCAN: Toward collaborative multi-radio coexistence in mobile devices via deep learning. Internet Things 2023, 21, 100646. [Google Scholar] [CrossRef]
- Doumit, J.; Youssef, M.J.; Nour, C.A.; Farah, J.; Douillard, C. Uncoordinated Spectrum Access for Massive Connectivity in IoT Applications. IEEE Internet Things Mag. 2024, 7, 78–84. [Google Scholar] [CrossRef]
- Hassan, S.; Rubab, S.; Saadat, S.; Gardezi, S.Q.A.; Khan, M.A.; Alasiry, A.; Marzougui, M.; Masood, A. Real-Time Investigation of Cross-Technology Interference in Heterogeneous IoT Networks. IEEE Access 2023, 11, 112223–112235. [Google Scholar] [CrossRef]
- Ciezobka, W.; Wojnar, M.; Rusek, K.; Kosek-Szott, K.; Szott, S.; Zubow, A.; Dressler, F. Using ranging for collision-immune IEEE 802.11 rate selection with statistical learning. Comput. Commun. 2024, 225, 10–26. [Google Scholar] [CrossRef]
- Guo, X.; He, Y.; Zhang, J.; Liu, Y.; Shangguan, L. Towards Programmable Backscatter Radio Design for Heterogeneous Wireless Networks. IEEE/ACM Trans. Netw. 2024, 32, 5020–5032. [Google Scholar] [CrossRef]
- Havinga, T.; Jiao, X.; Liu, W.; Moerman, I. Experimental Study Towards Efficient Interference Avoidance Using Wi-Fi 6 OFDMA on SDR. In Proceedings of the IEEE INFOCOM 2024—IEEE Conference on Computer Communications Workshops (INFOCOM WKSHPS), Vancouver, BC, Canada, 20–23 May 2024; pp. 1–6. [Google Scholar] [CrossRef]
- Kim, H.; Kim, Y.J.; Kim, W.T. Deep Reinforcement Learning-Based Adaptive Scheduling for Wireless Time-Sensitive Networking. Sensors 2024, 24, 5281. [Google Scholar] [CrossRef]
- Behnke, I.; Austad, H. Real-Time Performance of Industrial IoT Communication Technologies: A Review. IEEE Internet Things J. 2024, 11, 7399–7410. [Google Scholar] [CrossRef]
- Seijo, O.; Perez–Ramirez, J.; Val, I.; Rastorfer, D.; Akhmetov, D.; Das, D.; Sharma Banjade, V.R.; Cavalcanti, D. Experimental Hardware Implementation of Trigger Based Scheduled MAC for Next Generation Wi-Fi. In Proceedings of the ICC 2024—IEEE International Conference on Communications, Denver, CO, USA, 9–13 June 2024; pp. 4299–4304. [Google Scholar] [CrossRef]
- Yin, Z.; Li, Z.; Kim, S.M.; He, T. Explicit Channel Coordination via Cross-technology Communication. In Proceedings of the 16th Annual International Conference on Mobile Systems, Applications, and Services, Munich, Germany, 10–15 June 2018; ACM: New York, NY, USA, 2018. MobiSys ’18. pp. 178–190. [Google Scholar] [CrossRef]
- Yao, J.; Huang, H.; Su, J.; Xie, R.; Zheng, X.; Wu, K. Enabling Cross-Technology Coexistence for ZigBee Devices Through Payload Encoding. IEEE Trans. Mob. Comput. 2024, 23, 8289–8306. [Google Scholar] [CrossRef]
- Yin, W.; Hu, P.; Indulska, J.; Portmann, M.; Mao, Y. MAC-layer rate control for 802.11 networks: A survey. Wirel. Netw. 2020, 26, 3793–3830. [Google Scholar] [CrossRef]
- Kamerman, A.; Monteban, L. WaveLAN®-II: A high-performance wireless LAN for the unlicensed band. Bell Labs Tech. J. 1997, 2, 118–133. [Google Scholar] [CrossRef]
- Onasis, V.; Kosasih, A.; Gu, Y.; Hardjawana, W.; Qu, X.; Vucetic, B.; Chikkam, K. Improving The Minstrel Rate Adaptation Algorithm using Shallow Neural Networks in IEEE 802.11ah. In Proceedings of the 2022 IEEE Wireless Communications and Networking Conference (WCNC), Austin, TX, USA, 10–13 April 2022; pp. 1827–1832. [Google Scholar] [CrossRef]
- Chen, Y.; Li, M.; Chen, P.; Xia, S. Survey of cross-technology communication for IoT heterogeneous devices. IET Commun. 2019, 13, 1709–1720. [Google Scholar] [CrossRef]
- Lin, C.L.; Lin, K.C.J.; Lee, C.C.; Tsao, Y. Cross-Technology Interference Mitigation Using Fully Convolutional Denoising Autoencoders. In Proceedings of the GLOBECOM 2020—2020 IEEE Global Communications Conference, Taipei, Taiwan, 7–11 December 2020; pp. 1–6. [Google Scholar] [CrossRef]
- Yu, W.; Wang, L.; Song, J.; He, L.; Wang, Y. Environment-Aware Rate Adaptation Based on Occasional Request and Robust Adjustment in 802.11 Networks. Sensors 2023, 23, 7889. [Google Scholar] [CrossRef] [PubMed]
- S, S.C.; Kuri, J.; Akhtar, N. Performance Analysis of Channel-Dependent Rate Adaptation for OFDMA transmission in IEEE 802.11ax WLANs. In Proceedings of the 2022 14th International Conference on COMmunication Systems & NETworkS (COMSNETS), Bangalore, India, 4–8 January 2022; pp. 877–882. [Google Scholar] [CrossRef]
- Gorcin, A.; Arslan, H. Signal identification for adaptive spectrum hyperspace access in wireless communications systems. IEEE Commun. Mag. 2014, 52, 134–145. [Google Scholar] [CrossRef]
- Kim, H.; Kim, Y.J.; Kim, W.T. Multitask Learning-Based Deep Signal Identification for Advanced Spectrum Sensing. Sensors 2023, 23, 9806. [Google Scholar] [CrossRef]
- Li, X.; Dong, F.; Zhang, S.; Guo, W. A Survey on Deep Learning Techniques in Wireless Signal Recognition. Wirel. Commun. Mob. Comput. 2019, 2019, 5629572. [Google Scholar] [CrossRef]
- Dobre, O.A.; Oner, M.; Rajan, S.; Inkol, R. Cyclostationarity-Based Robust Algorithms for QAM Signal Identification. IEEE Commun. Lett. 2012, 16, 12–15. [Google Scholar] [CrossRef]
- Girmay, M.; Maglogiannis, V.; Naudts, D.; Aslam, M.; Shahid, A.; Moerman, I. Technology recognition and traffic characterization for wireless technologies in ITS band. Veh. Commun. 2023, 39, 100563. [Google Scholar] [CrossRef]
- Zhang, W.; Feng, M.; Krunz, M.; Hossein Yazdani Abyaneh, A. Signal Detection and Classification in Shared Spectrum: A Deep Learning Approach. In Proceedings of the IEEE INFOCOM 2021—IEEE Conference on Computer Communications, Vancouver, BC, Canada, 10–13 May 2021; pp. 1–10. [Google Scholar] [CrossRef]
- Yao, J.; Su, J.; Xie, R.; Wu, K.; Leung, V.C.M. Empowering Heterogeneous Wireless Networks through Efficient Signal Identification. IEEE Wirel. Commun. 2024, 31, 242–248. [Google Scholar] [CrossRef]
- Gong, J.; Qin, X.; Xu, X. Multi-Task Based Deep Learning Approach for Open-Set Wireless Signal Identification in ISM Band. IEEE Trans. Cogn. Commun. Netw. 2022, 8, 121–135. [Google Scholar] [CrossRef]
- Simeone, O. A Very Brief Introduction to Machine Learning with Applications to Communication Systems. IEEE Trans. Cogn. Commun. Netw. 2018, 4, 648–664. [Google Scholar] [CrossRef]
- Chen, R.; Gao, W. Enabling Cross-Technology Coexistence for Extremely Weak Wireless Devices. In Proceedings of the IEEE INFOCOM 2019—IEEE Conference on Computer Communications, Paris, France, 29 April–2 May 2019; pp. 253–261. [Google Scholar] [CrossRef]
- Grimaldi, S.; Mahmood, A.; Hassan, S.A.; Gidlund, M.; Hancke, G.P. Autonomous interference mapping for industrial Internet of Things networks over unlicensed bands: Identifying cross-technology interference. IEEE Ind. Electron. Mag. 2020, 15, 67–78. [Google Scholar] [CrossRef]
- Zheng, K.; Luo, R.; Liu, X.; Qiu, J.; Liu, J. Distributed DDPG-Based Resource Allocation for Age of Information Minimization in Mobile Wireless-Powered Internet of Things. IEEE Internet Things J. 2024, 11, 29102–29115. [Google Scholar] [CrossRef]
- Chen, J.; Ma, J.; He, Y.; Wu, G. Deployment-Friendly Link Adaptation in Wireless Local-Area Network Based on On-Line Reinforcement Learning. IEEE Commun. Lett. 2023, 27, 3424–3428. [Google Scholar] [CrossRef]
- Sammour, I.; Chalhoub, G. Evaluation of Rate Adaptation Algorithms in IEEE 802.11 Networks. Electronics 2020, 9, 1436. [Google Scholar] [CrossRef]
- Tao, Y.; Tan, W.L. A Reinforcement Learning Approach to Wi-Fi Rate Adaptation Using the REINFORCE Algorithm. In Proceedings of the 2024 IEEE Wireless Communications and Networking Conference (WCNC), Dubai, United Arab Emirates, 21–24 April 2024; pp. 1–6. [Google Scholar] [CrossRef]
- 802.11ac-2013; IEEE Standard for Information Technology–Telecommunications and Information Exchange between Systems Local and Metropolitan Area Networks–Specific Requirements Part 11: Wireless LAN Medium Access Control (MAC) and Physical Layer (PHY) Specifications–Amendment 4: Enhancements for Very High Throughput for Operation in Bands below 6 GHz. IEEE: New York, NY, USA, 2013. [CrossRef]
- SIG, B. Bluetooth Core Specification. 2021. Available online: https://www.bluetooth.com/specifications/specs/core-specification-5-3/ (accessed on 30 December 2024).
- IEEE Standard for Low-Rate Wireless Networks. IEEE Std 802.15.4-2020; Revision of IEEE Std 802.15.4-2015. IEEE: New York, NY, USA, 2020; pp. 1–800. [CrossRef]
- Zhao, Y.; Agee, B.; Reed, J. Simulation and measurement of microwave oven leakage for 802.11 WLAN interference management. In Proceedings of the 2005 IEEE International Symposium on Microwave, Antenna, Propagation and EMC Technologies for Wireless Communications, Beijing, China, 8–12 August 2005; Volume 2, pp. 1580–1583. [Google Scholar] [CrossRef]
- Howard, A.; Sandler, M.; Chen, B.; Wang, W.; Chen, L.; Tan, M.; Chu, G.; Vasudevan, V.; Zhu, Y.; Pang, R.; et al. Searching for MobileNetV3. In Proceedings of the 2019 IEEE/CVF International Conference on Computer Vision (ICCV), Seoul, Republic of Korea, 27 October–2 November 2019; pp. 1314–1324. [Google Scholar] [CrossRef]
- Noh, Y.; Lee, D.; Moon, S.; Cheong, M.; Yu, H. Link Adaptation for HE WLAN, IEEE 802.11-14/1329r2. In Proceedings of the IEEE 802.11 TGax Meeting, Berlin, Germany, 8–13 March 2015. [Google Scholar]
- Yuan, W.; Linnartz, J.P.M.G.; Niemegeers, I.G.M.M. Adaptive CCA for IEEE 802.15.4 Wireless Sensor Networks to Mitigate Interference. In Proceedings of the 2010 IEEE Wireless Communication and Networking Conference, Sydney, Australia, 18–21 April 2010; pp. 1–5. [Google Scholar] [CrossRef]
- Lin, M.; Chen, Q.; Yan, S. Network In Network. arXiv 2013, arXiv:1312.4400. [Google Scholar]
- Saeedan, F.; Weber, N.; Goesele, M.; Roth, S. Detail-Preserving Pooling in Deep Networks. In Proceedings of the CVPR, Salt Lake City, UT, USA, 18–23 June 2018; IEEE Computer Society: Washington, DC, USA, 2018; pp. 9108–9116. [Google Scholar]


| Time Domain | Frequency Domain | Power Domain | |
|---|---|---|---|
| WLAN [34] | Max 5.5 ms wavelength | 2400∼2480 MHz, 14 channels, 20 MHz BW | Max 100 mW (20 dBm) |
| Bluetooth [35] | 0.625 µs slot, 1600 hops/s, AFH | 2400∼2480 MHz, 79 channels, 1 MHz BW | 100 mW (20 dBm) 2.5 mW (4 dBm) 1 mW (0 dBm) |
| ZigBee [36] | Max 5 ms wavelength | 2400∼2480 MHz, 16 channels 2 MHz BW | 1 mW (0 dBm) |
| MWO [37] | ∼5 ms On, ∼15 ms Off repeat 60 Hz | 2450∼2465 MHz | 60 dBm |
| MCS Index | Modulation | Coding | SNR Threshold |
|---|---|---|---|
| 0 | BPSK | 1/2 | 2 |
| 1 | QPSK | 1/2 | 5 |
| 2 | QPSK | 3/4 | 9 |
| 3 | 16-QAM | 1/2 | 11 |
| 4 | 16-QAM | 3/4 | 15 |
| 5 | 64-QAM | 2/3 | 18 |
| 6 | 64-QAM | 3/4 | 20 |
| 7 | 64-QAM | 5/6 | 25 |
| 8 | 256-QAM | 3/4 | 29 |
| 9 | 256-QAM | 5/6 | 31 |
| Signal Type | Parameter | Values |
|---|---|---|
| WLAN [34] IEEE 802.11 | Standards | IEEE 802.11a, b, n, ac, ax |
| Modulation Schemes | BPSK, QPSK, 16-QAM, 64-QAM, 256-QAM | |
| Transmission Rate | Determined by MCS | |
| Center Frequency | 2.452 GHz | |
| Bandwidth | 20 MHz | |
| Transmission Power | ≤20 dBm | |
| ZigBee [36] IEEE 802.15.4 (CTI-A) | Modulation Schemes | OQPSK |
| Transmission Rate | 250 Kbps | |
| Center Frequency | 2.445, 2.45, 2.455, 2.46 GHz | |
| Bandwidth | 5 MHz | |
| Transmission Power | ≤0 dBm | |
| Microwave oven [37] (CTI-B) | Center Frequency | 2.45 GHz |
| AC Frequency | 60 Hz | |
| Transmission Power | ≤60 dBm | |
| Bluetooth [35] IEEE 802.15.1 (CTI-C) | Modulation Schemes | GFSK, DQPSK, 8DPSK |
| Transmission Rate | Determined by Tx Mode 1, 2, 3 Mbps | |
| Center Frequency | 18 channels, 2.443–2.461 GHz | |
| Bandwidth | 1 MHz | |
| Transmission Power | ≤20 dBm |
| Parameter | Value |
|---|---|
| Simulation time | 10 s |
| Number of APs | 1 |
| Number of STAs | 3 |
| Tx to Rx distance | 10 m |
| 1 ms | |
| Inter-frame space | 16 s |
| Payload size | 500 bytes |
| Ack size | 14 bytes |
| MCS feedback size | 20 bytes |
| Feedback interval (MB) | 1 ms |
| Success threshold (PE) | 20 |
| Failure threshold (PE) | 5 |
| Packet loss threshold | bit error |
| SNR | STFT 32 × 32 (3.232 MFLOPs) | STFT 64 × 64 (9.821 MFLOPs) | STFT 128 × 128 (36.178 MFLOPs) |
|---|---|---|---|
| 0 dB | 6.956 | 3.041 | 1.322 |
| 5 dB | 6.751 | 3.035 | 1.308 |
| 10 dB | 6.424 | 2.780 | 1.294 |
| 15 dB | 5.680 | 2.624 | 1.034 |
| 20 dB | 5.669 | 2.525 | 0.999 |
| Models | FLOPs (M) | Params (M) | MAE | CPU (ms) |
|---|---|---|---|---|
| CTINet-32-1.0 | 3.232 | 0.976 | 6.956 | 0.202 |
| CTINet-32-0.75 | 2.309 | 0.611 | 7.106 | 0.144 |
| CTINet-32-0.5 | 1.176 | 0.297 | 7.292 | 0.074 |
| CTINet-32-0.25 | 0.594 | 0.110 | 7.361 | 0.037 |
| CTINet-64-1.0 | 9.821 | 0.976 | 3.041 | 0.614 |
| CTINet-64-0.75 | 7.293 | 0.611 | 3.109 | 0.456 |
| CTINet-64-0.5 | 3.760 | 0.297 | 3.230 | 0.235 |
| CTINet-64-0.25 | 2.032 | 0.109 | 3.256 | 0.127 |
| CTINet-128-1.0 | 36.178 | 0.976 | 1.322 | 2.261 |
| CTINet-128-0.75 | 27.231 | 0.611 | 1.359 | 1.702 |
| CTINet-128-0.5 | 14.101 | 0.297 | 1.414 | 0.881 |
| CTINet-128-0.25 | 7.787 | 0.109 | 1.468 | 0.487 |
| WLAN SNR | M-CARA | M-Base | P-CARA | P-Base |
|---|---|---|---|---|
| 8 dB | 7.857% | 8.789% | 10.912% | 11.191% |
| 13 dB | 1.040% | 1.354% | 5.465% | 5.556% |
| 18 dB | 0.212% | 0.267% | 3.597% | 3.920% |
| 25 dB | 0.051% | 0.175% | 2.077% | 2.398% |
| 30 dB | 0.023% | 0.166% | 0.111% | 0.254% |
Disclaimer/Publisher’s Note: The statements, opinions and data contained in all publications are solely those of the individual author(s) and contributor(s) and not of MDPI and/or the editor(s). MDPI and/or the editor(s) disclaim responsibility for any injury to people or property resulting from any ideas, methods, instructions or products referred to in the content. |
© 2025 by the authors. Licensee MDPI, Basel, Switzerland. This article is an open access article distributed under the terms and conditions of the Creative Commons Attribution (CC BY) license (https://creativecommons.org/licenses/by/4.0/).
Share and Cite
Kim, H.; Kim, Y.-J.; Kim, W.-T. Cross-Technology Interference-Aware Rate Adaptation in Time-Triggered Wireless Local Area Networks. Appl. Sci. 2025, 15, 428. https://doi.org/10.3390/app15010428
Kim H, Kim Y-J, Kim W-T. Cross-Technology Interference-Aware Rate Adaptation in Time-Triggered Wireless Local Area Networks. Applied Sciences. 2025; 15(1):428. https://doi.org/10.3390/app15010428
Chicago/Turabian StyleKim, Hanjin, Young-Jin Kim, and Won-Tae Kim. 2025. "Cross-Technology Interference-Aware Rate Adaptation in Time-Triggered Wireless Local Area Networks" Applied Sciences 15, no. 1: 428. https://doi.org/10.3390/app15010428
APA StyleKim, H., Kim, Y.-J., & Kim, W.-T. (2025). Cross-Technology Interference-Aware Rate Adaptation in Time-Triggered Wireless Local Area Networks. Applied Sciences, 15(1), 428. https://doi.org/10.3390/app15010428