1. Introduction
Open-source artificial intelligence models (OSAIMs) are free, publicly available tools that have found applications in various fields, including computer science and medicine [
1,
2]. While OSAIMs offer advanced capabilities for processing and interpreting visual data, most of them are not specifically tailored for medical image analysis, such as X-ray images. In response to this gap, dedicated models like BiomedCLIP have been developed, combining natural language processing with medical image analysis, providing new opportunities for the evaluation and interpretation of radiological data.
The evaluation of scoliosis, a complex, three-dimensional deformity of the spinal column, traditionally relies on manual radiological interpretation by clinicians. This process includes the assessment of curvature, vertebral rotation, and spinal dynamics, typically using X-ray images in anterior–posterior (AP) and lateral views [
3,
4]. Identifying the degree and type of scoliosis requires significant expertise and can be time-consuming, especially when differentiating between single-curve and double-curve forms or determining the severity based on the Cobb angle [
5]. Challenges such as interobserver variability and the high volume of radiological data underline the need for automated tools that could enhance accuracy and reduce workload in clinical practice. Advanced AI models, such as BiomedCLIP, offer potential solutions to these challenges by providing automated, high-sensitivity analysis tailored to medical data.
Over the past year, there has been a global increase in interest in OSAIMs. This surge in attention is partly due to the release of advanced language models such as ChatGPT, produced by OpenAI. One of OpenAI’s products is Contrastive Language–Image Pretraining (CLIP), which integrates both natural language and images. This model is capable of a wide range of tasks, including zero-shot image classification, image captioning, and visual question answering [
6]. CLIP achieves its remarkable results by training on a diverse dataset of images and their textual descriptions, allowing the model to learn a shared embedding space, enabling it to process and understand both text and images more efficiently.
Based on CLIP, several zero-shot models have already been developed, including medical models such as SDA-CLIP, a domain adaptation method for surgical tasks based on CLIP. It enables the recognition of surgical actions across different domains, such as virtual reality and real-life operations [
7]. Another study utilizing this model was SleepCLIP, which demonstrated that CLIP could be effectively adapted to sleep staging tasks, showing potential for improving the diagnosis of sleep disorders [
8].
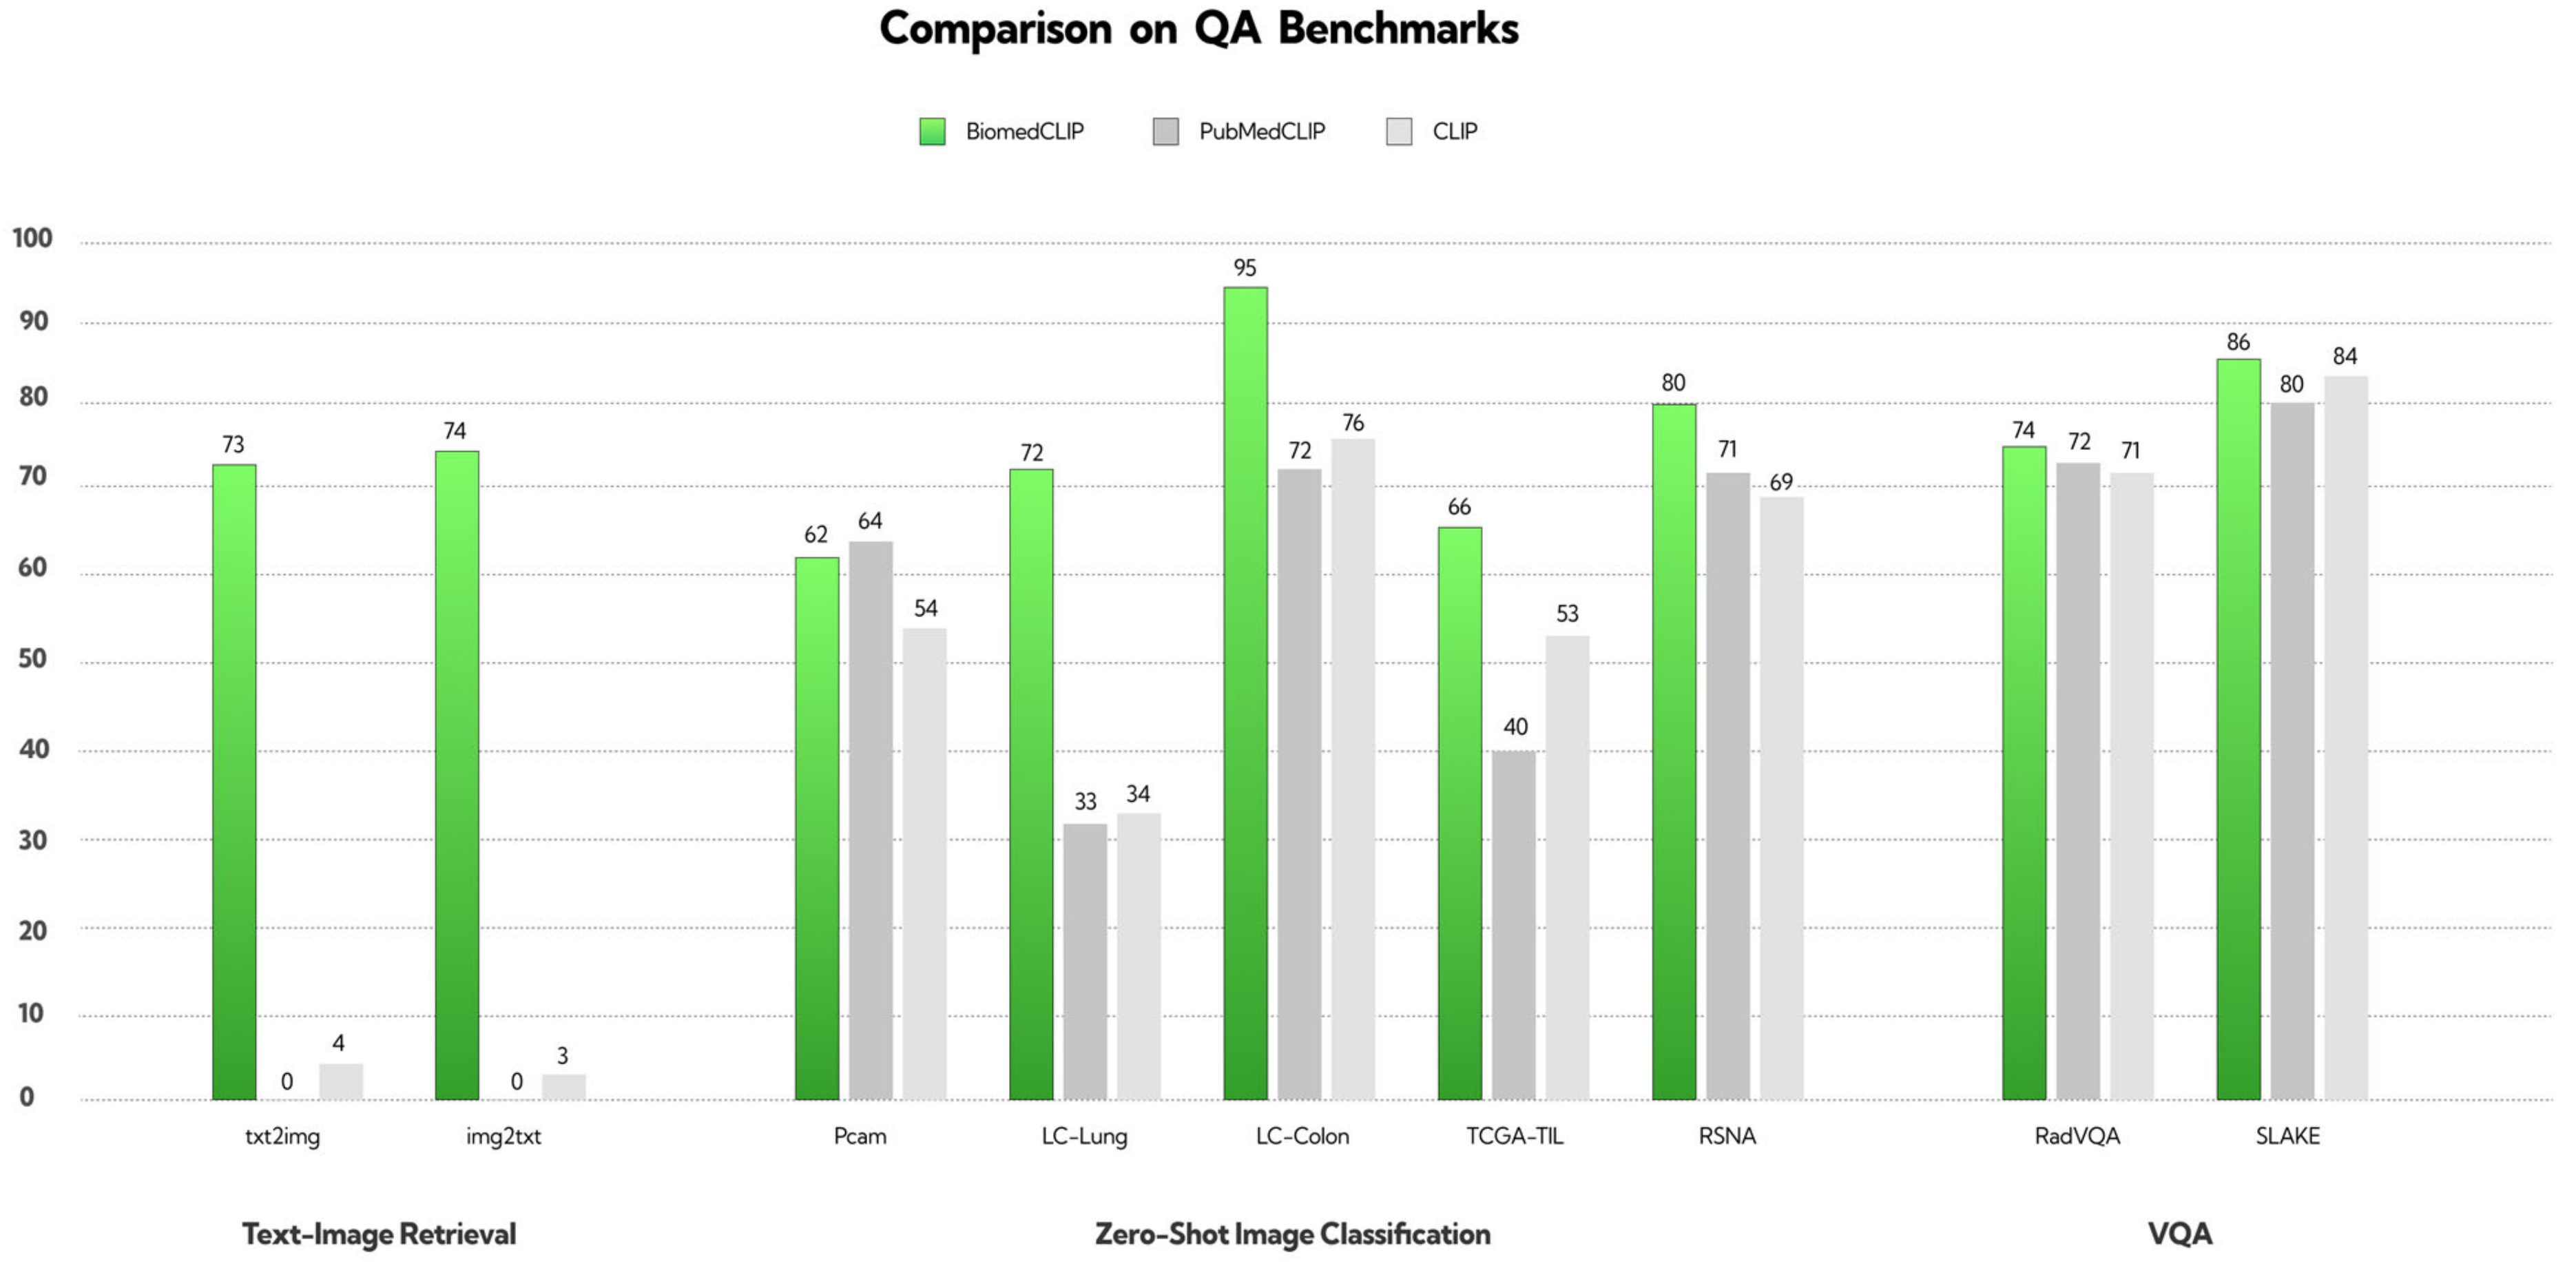
BiomedCLIP, known in its full version as Biomed-CLIP-PubMedBERT_256-vit_base_patch16_224, is an advanced model that combines natural language processing with medical image analysis. It belongs to the category of vision–language foundation models, integrating both domains to perform complex tasks. This model was trained on a massive dataset, PMC-15M, containing 15 million “image-description” pairs from scientific articles available in PubMed Central. As a result, BiomedCLIP is capable of efficiently interpreting both medical text and images (
Figure 1).
BiomedCLIP stands out due to its architecture, which combines the capabilities of PubMedBERT, a model dedicated to text analysis, with a Vision Transformer optimized for working with biomedical data. This combination allows it to achieve outstanding results across many benchmark datasets, making it one of the top models in its category.
The applications of BiomedCLIP are highly versatile. The model can be used for cross-modal retrieval (information search based on images or text), medical image classification, and answering questions related to those images. With its advanced technology, BiomedCLIP is becoming a powerful tool supporting diagnostics, scientific research, and medical education, opening new possibilities in the analysis and understanding of complex biomedical information [
9].
Although BiomedCLIP demonstrates superior performance across most evaluated benchmarks,
Figure 1 highlights an exception. In the PCam benchmark, PubMedCLIP outperformed BiomedCLIP, showcasing higher accuracy in this specific task. This observation suggests that while BiomedCLIP is a robust and versatile model, certain domain-specific datasets may still favor more specialized approaches like PubMedCLIP. This underscores the need for continued research to optimize vision–language models for diverse biomedical tasks.
Previous studies utilized the raw version of the CLIP model to evaluate posturographic X-ray images in the anteroposterior projection, demonstrating single-curve scoliosis at a severe stage. Since CLIP offers nine models with different architectures, our study partially confirmed the initial research hypothesis, indicating that only seven out of nine tested CLIP models were able to effectively recognize scoliosis from radiographic images. The second hypothesis was not confirmed, as only four of the nine models correctly answered questions regarding single-curve scoliosis. Assumptions regarding the accurate estimation of curvature degrees using AI were also not confirmed—none of the selected models achieved high sensitivity in the assessment of Cobb angles [
10].
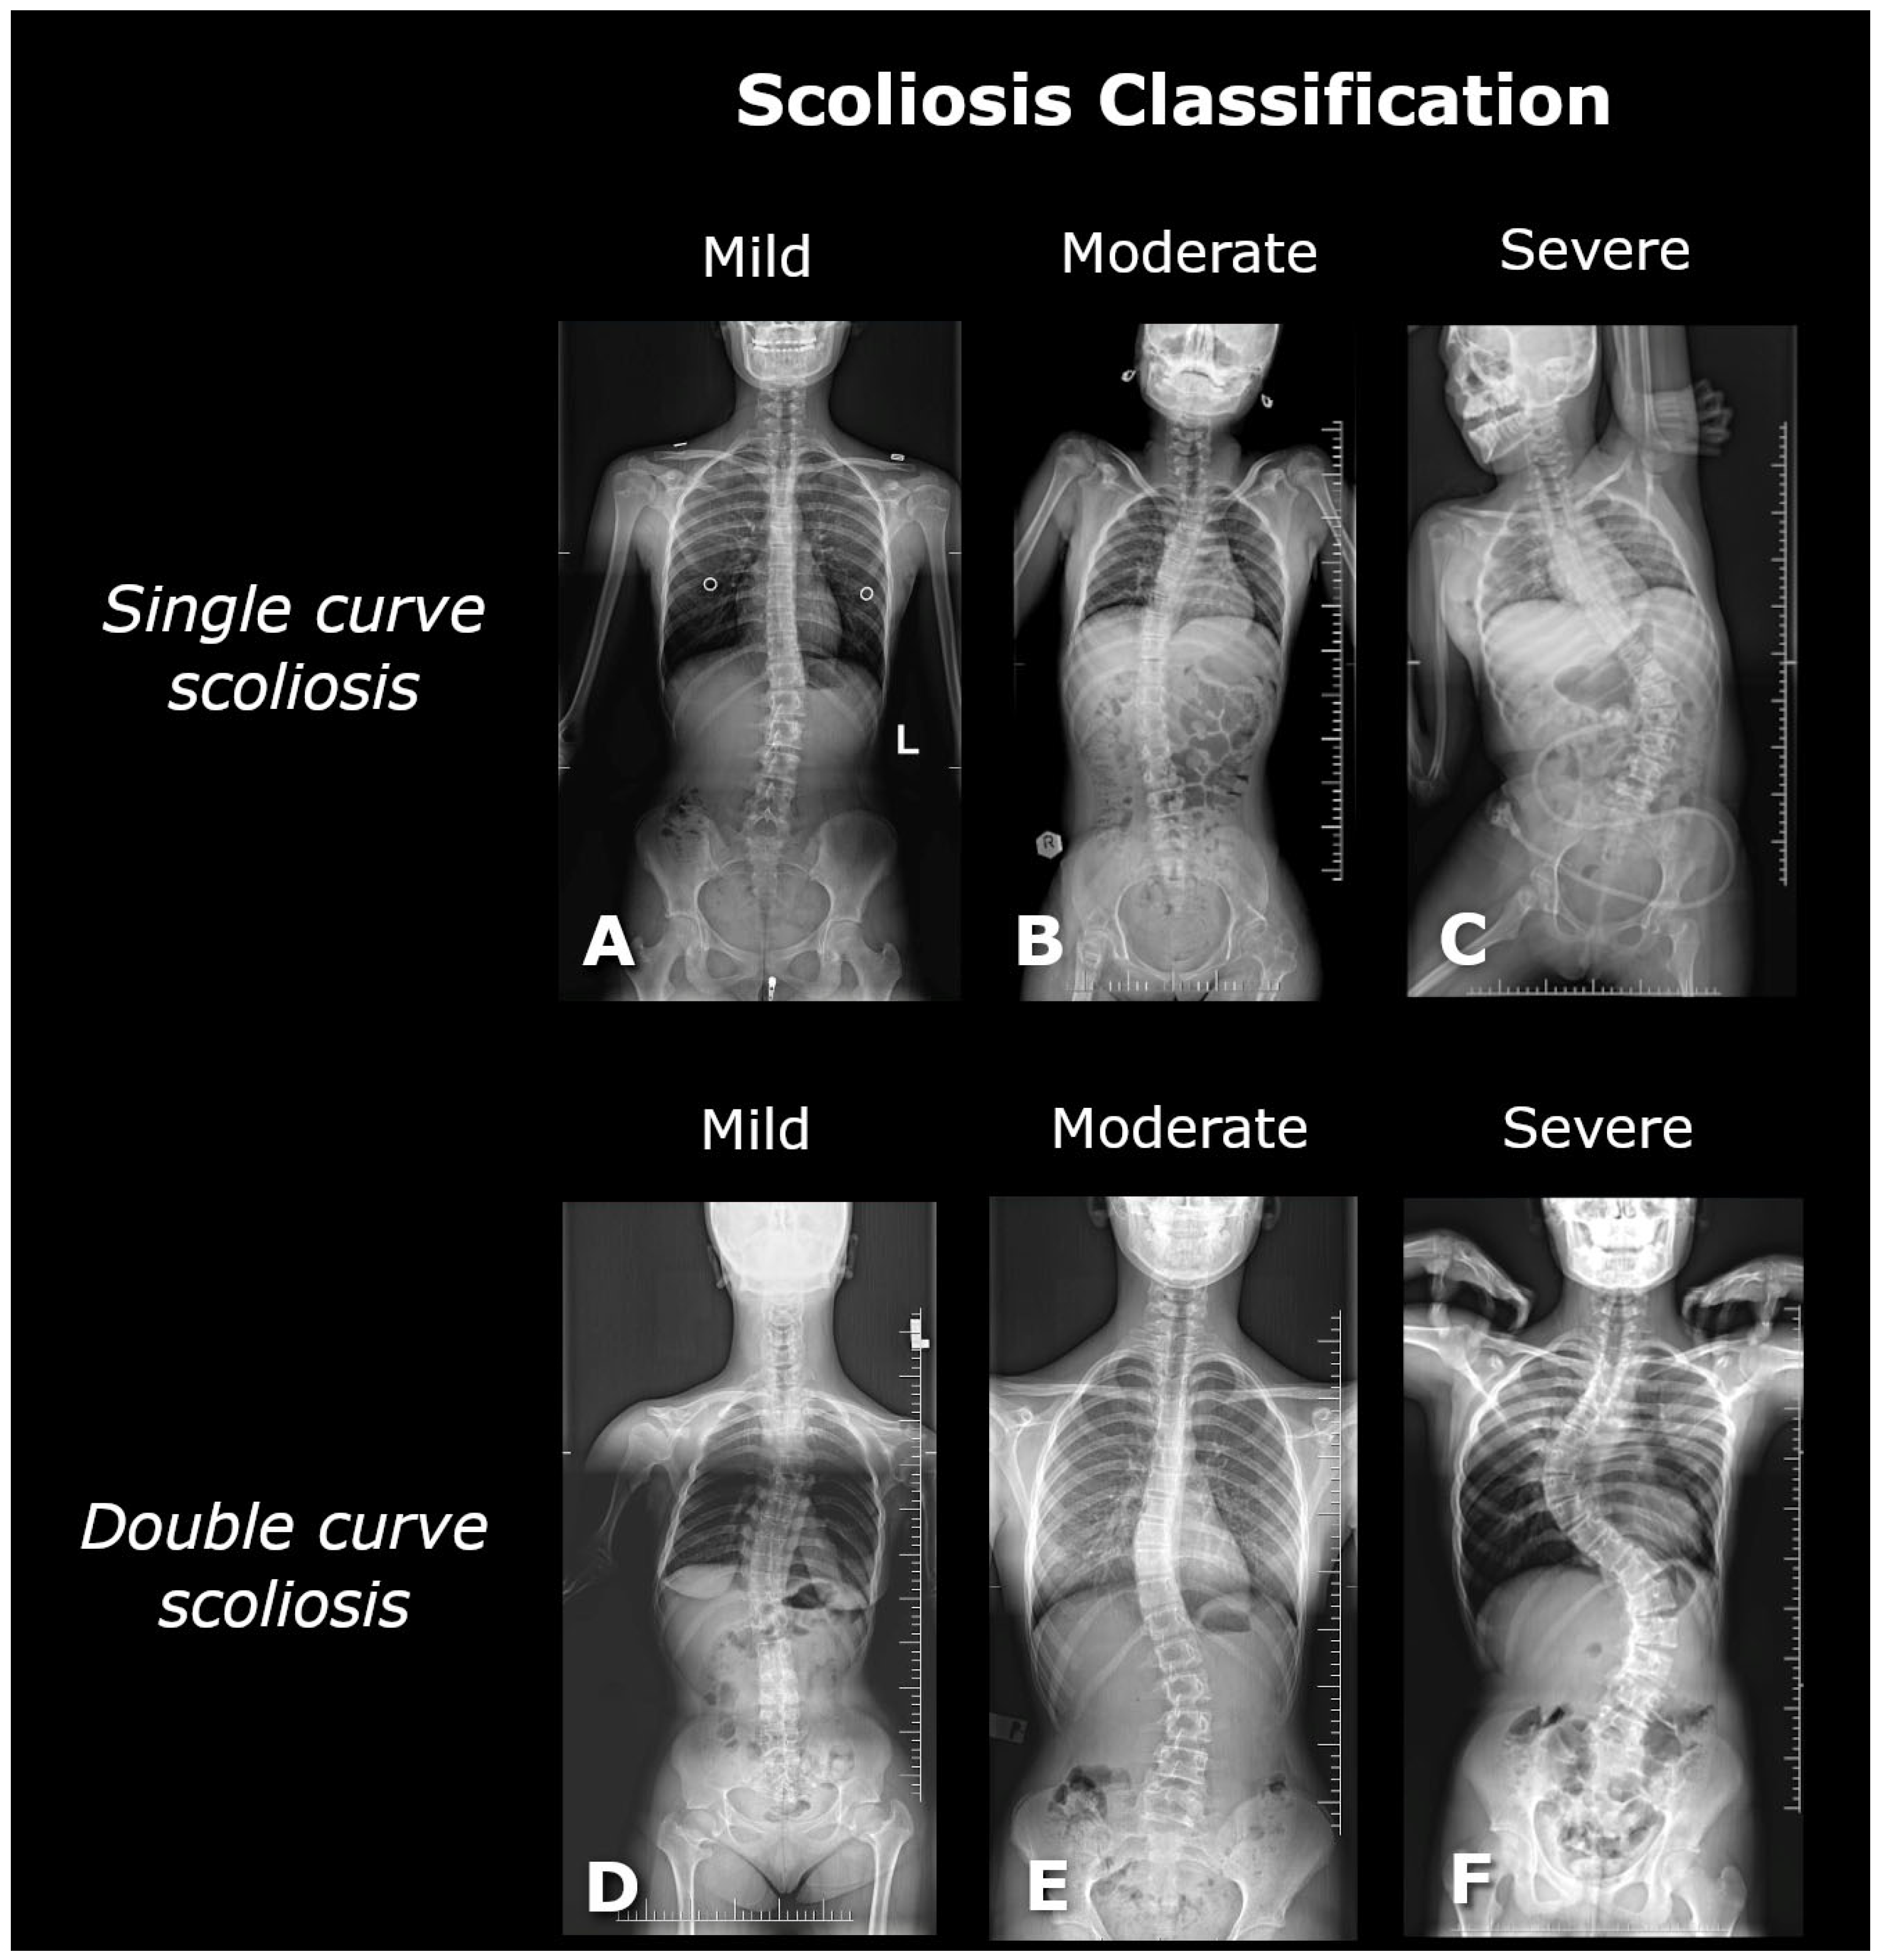
Scoliosis is a complex, three-dimensional deformity of the spinal column, identified by a curvature greater than 10 degrees, as determined by the Cobb method [
11]. The diagnosis of scoliosis typically involves a comprehensive radiological posturographic examination of the entire spine in both anterior–posterior (AP) and lateral views, which facilitates the assessment of curvature, vertebral rotation, spinal dynamics, and trunk deformity, and aids in planning appropriate therapy [
3,
4]. Scoliosis is classified based on factors such as the patient’s age, degree of curvature, underlying cause, location, and number of curves present. In this study, scoliosis is categorized into single-curve (C-shaped) and double-curve (S-shaped) forms [
5]. The severity of scoliosis, as indicated by the Cobb angle, is classified into mild (10–20 degrees), moderate (20–40 degrees), and severe (greater than 40 degrees) [
5,
12] (
Figure 2).
This study aimed to assess how a dedicated medical AI model, such as BiomedCLIP, performs in analyzing posturographic X-ray images that display both single-curve and double-curve scoliosis. To investigate this, three sets of questions were developed, partially building on prior research. The questions addressed whether the model detects the presence of scoliosis, correctly identifies its single-curve or double-curve form, and evaluates the severity of scoliosis—categorized as mild, moderate, or severe. Questions regarding Cobb angles were deliberately excluded, as earlier studies indicated that the CLIP model struggles with accurately determining these angles, often performing this task randomly. The following hypotheses (H) were formulated:
H1: BiomedCLIP will detect the presence of scoliosis on all posturographic images with high sensitivity.
H2: BiomedCLIP will correctly identify the type of scoliosis on the provided images with high sensitivity.
H3: BiomedCLIP will accurately categorize the severity of scoliosis on the provided images.
2. Materials and Methods
The study was conducted as part of the scientific research activities at the Polish-Mother’s Memorial Hospital Research Institute in Poland. The bioethics committee determined that no formal consent was required for the analysis of the obtained radiological images. Posturographic images of patients diagnosed with scoliosis in the anteroposterior projection were collected between January 2021 and July 2024 (ages ranging from 2 to 17 years). Medical indications are required to perform X-ray examinations, and therefore, we did not include posturographic studies of patients without spinal deformities. Only images of patients with a prior diagnosis of scoliosis were used in this study. All images were anonymized, and consent was obtained from the legal guardians of the patients for the use of the X-ray images in this research. Inclusion criteria encompassed technically accurate images and those displaying both single-curve and double-curve scoliosis. Image quality assessment included verifying image readability and ensuring there were no errors in collimation or cropping. Exclusion criteria included scoliosis with co-occurring pathologies, such as spina bifida or vertebral hump, images that did not cover the entire spine, and scoliosis post-surgical correction with visible implants. From the X-ray image database, 262 posturographic images with visible scoliosis were included in the study. All tests were conducted using the same equipment. The X-ray images were not subjected to any modifications and were saved in JPEG format with a resolution of 2663 × 1277 px.
2.1. Manual Measurements
Analysis of the posturographic X-ray images was conducted independently by two neurosurgery specialists. RadiAnt software (version 2023.1) was used to evaluate the posturographic images.
2.2. BiomedCLIP Methodology
Model Selection and Fine-Tuning
In this study, the Biomed CLIP model was employed. This model is a fine-tuned version of the CLIP (Contrastive Language–Image Pretraining) model, specifically adapted for classifying X-ray images of children’s spines into three scoliosis categories: mild, moderate, and severe. The CLIP model was selected due to its superior zero-shot classification performance and proven ability to interpret complex biomedical imagery, surpassing other multimodal models like DALL-E, MedCLIP, and PubMedCLIP. The open-source availability of the Biomed CLIP model further facilitated its use in this research.
The model was fine-tuned using the PMC-15 dataset, which includes 15 million biomedical image–text pairs derived from 4.4 million scientific articles. This broad and diverse dataset helped adapt the model to the specific demands of pediatric spinal imagery and enhanced its ability to interpret medical images.
Hyperparameters
The fine-tuning of Biomed CLIP followed the same hyperparameters as those used in training the original CLIP ViT-B/16 model (
Table 1). These include:
Hardware and Software Configuration
All computational tasks were carried out on two NVIDIA L40S GPUs, supported by 16 vCPUs and 124 GB of RAM, with 96 GB of VRAM on the RunPod platform. The software environment utilized a Docker image (pytorch:2.1.0-py3.10-cuda11.8.0-devel-ubuntu22.04) containing the necessary CUDA and PyTorch modules to support model training and evaluation.
Model Architecture
The Biomed CLIP model is based on the Vision Transformer (ViT-B/16) architecture for its vision encoder, which divides input images into 16 × 16-pixel patches. This architecture was chosen for its ability to capture long-range dependencies in medical images. Each patch is treated as a token and processed using a self-attention mechanism. The model supports images of 224 × 224 pixels, though experiments with a higher resolution (384 × 384) suggested improved performance for certain tasks, albeit with increased training time.
The ViT-B/16 model features approximately 86 million trainable parameters. To handle the specific demands of medical text, the text encoder was adjusted from the standard 77 tokens to a context size of 256 tokens, accommodating longer and more detailed biomedical descriptions.
Training Setup
Training was performed on large-scale hardware configurations using 16 NVIDIA A100 or V100 GPUs. To optimize memory usage and computational efficiency, techniques such as gradient checkpointing and automatic mixed precision were employed. The fine-tuning process was carried out for 32 epochs, with a batch size of 32,768, and the Adam optimizer was used with weight decay and a learning rate of 4 × 10⁻4.
Data Handling and Evaluation
The evaluation was performed using a database of anonymized X-ray images, enabling iterative assessments of the model’s classification performance across various stages of scoliosis. For this task, descriptive text labels were prepared to represent the classification of each category:
First Category:
- a.
“This is an image of scoliosis”.
- b.
“This is not an image scoliosis”.
Second Category:
- a.
“This is an image of single curve scoliosis”
- b.
“This is an image of double curve scoliosis”
Third Category:
- a.
“This is an image of mild scoliosis”.
- b.
“This is an image of moderate scoliosis”.
- c.
“This is an image of severe scoliosis”.
Each X-ray image was preprocessed through normalization before being input into the model. The model then computed the probability of the image belonging to each scoliosis category, with a confidence score ranging from 0 to 1. This score was used as a quantitative measure of the model’s certainty in its predictions.
The evaluation emphasized accuracy in image classification and the ability to generalize across unseen medical image data, testing both the robustness and real-world applicability of Biomed CLIP in clinical diagnostics.
Detection and Classification Framework
Detection and Classification Methodology
Detection of Scoliosis
The detection process focused on identifying the presence of spinal deformities in posturographic X-ray images. The BiomedCLIP model was utilized to automatically determine whether a given image depicted scoliosis. The steps involved in detection included:
Approach: Detection was conducted using descriptive text labels, assigning each image to one of two categories: “This is an image of scoliosis” or “This is not an image of scoliosis”.
Parameters:
- ○
The model’s vision encoder, based on the ViT-B/16 architecture, divided the input images into 16 × 16-pixel patches for analysis.
- ○
Images were normalized and resized to 224 × 224 pixels prior to being fed into the model.
- ○
The text encoder was extended to handle up to 256 tokens, accommodating detailed biomedical descriptions.
Outcome: The model computed the probability of the image belonging to the category of scoliosis, with confidence scores ranging from 0 to 1, providing a quantitative measure of detection.
Classification of Scoliosis
Once scoliosis was detected, the images were further classified into two additional dimensions: the type of scoliosis (single-curve or double-curve) and the severity of the condition (mild, moderate, or severe).
- 2.
Classification of Scoliosis Severity:
- ○
Approach: Severity classification divided images into three categories:
- ▪
Mild scoliosis (“This is an image of mild scoliosis”).
- ▪
Moderate scoliosis (“This is an image of moderate scoliosis”).
- ▪
Severe scoliosis (“This is an image of severe scoliosis”).
- ○
Parameters:
- ▪
Severity levels were defined based on the Cobb angle measurements:
- ▪
Mild: <20°.
- ▪
Moderate: 20°–40°.
- ▪
Severe: >40°.
- ▪
The model’s vision encoder leveraged detailed geometric features of the X-ray images to differentiate between severity levels.
- ○
Outcome: Probabilities were calculated for each severity category, enabling precise classification of the scoliosis stage.
Integration of Detection and Classification
Both detection and classification were performed using the BiomedCLIP model, fine-tuned to handle pediatric spinal imagery. Although these processes shared a common model architecture, they were treated as distinct stages in the analysis pipeline. The detection stage established the presence of scoliosis, while the classification stages refined the analysis by identifying the specific type and severity.
By addressing detection and classification as separate processes, this methodology ensured a clear, structured workflow and optimized the model’s performance for each task. The parameters and technical solutions implemented for both stages are detailed in the corresponding sections of the methodology.
2.3. Statistical Analysis
In the present analysis, the significance level was set at α = 0.05. Descriptive statistics were employed to summarize the data. For continuous variables, the median (Mdn) served as the central tendency measure due to its robustness against outliers and distributional skewness. Furthermore, the first (Q1) and third (Q3) quartiles were reported to delineate the central 50% range of the data. Additionally, the inclusion of minimum (Min) and maximum (Max) values offers a complete view of the data’s range, highlighting the extremes. Categorical variables were quantified by counts (n) and the proportion of each category. The relationship between two numerical variables was investigated using Pearson correlation. The 95% confidence intervals (CI 95%) and p-values were computed through the asymptotic approximation of the t-test statistic.
The predictive performance of the BiomedCLIP model was evaluated by determining the optimal cutpoints for dichotomous outcomes (positive class—incidence of the event, negative class—absence of the event) through a method that maximizes the sum of specificity and sensitivity. The model’s discriminative ability was further assessed by estimating metrics such as accuracy, sensitivity, specificity, and the Area Under the Curve (AUC) with results visualized via Receiver Operating Characteristic (ROC) curves. To ascertain the model’s predictive capability beyond mere guessing, the 95% confidence intervals for the AUC metrics were estimated employing the DeLong test [
13]. A high level of sensitivity was defined as achieving a result >90%, reflecting optimal performance for early detection and classification tasks.
Specificity requires a proper equation to connect ROC, AUC, and CI calculations for single- and double-curve scoliosis.
where
TP—true positive values;
FN—false negative values;
TN—true negative values;
FP—false positive value.
where
d is the difference in scores or ranks between the positive and negative classes.
Variance of AUC is defined as:
where
Vij is a weight assigned to each pair of observations;
n1—number of positive instances,
n2—number of negative instances,
i—index of positive instances,
j—index of negative instances.
where
CI—confidence interval for AUC;
z—is the critical value from the standard normal distribution (
z = 1.96 for 95% confidence);
SE—standard error, defined as:
Characteristics of the applied statistical tool and external packages
Analyses were conducted using the R Statistical language (version 4.3.3; [
14]) on Windows 11 Pro 64 bit (build 22631), using the packages see (version 0.9.0; [
15]), report (version 0.5.8; [
16]), correlation (version 0.8.5; [
17,
18]), patchwork (version 1.2.0; [
19]), pROC (version 1.18.5; [
20]), gtsummary (version 1.7.2; [
21]), cutpointr (version 1.1.2; [
22]), ggplot2 (version 3.5.0; [
23]), readxl (version 1.4.3; [
24]), dplyr (version 1.1.4; [
25]), and psych (version 2.4.6.26; [
26]).
Characteristics of the observed data
An analysis was conducted on 262 radiographic images all identified with scoliosis. These images were assessed by two independent neurosurgical experts who evaluated the Cobb angles, scoliosis type, and its stage. The results of these assessments are presented in
Table 2 and will be treated as observed data in further analyses.
The examination of the data demonstrated that the median Cobb angle was 42.0 degrees, with observed values ranging from 12 to 115 degrees. The first and third quartiles were noted at 25.0 and 66.8 degrees, respectively, reflecting a significant variability in the severity of curvature across the studied sample. In terms of scoliosis type, the majority of cases were classified as single (56.87%), with double scoliosis observed in 43.13% of the samples. Regarding the staging of scoliosis, the data showed that severe scoliosis was the most common stage, accounting for 51.15% of cases, followed by moderate and mild stages at 32.44% and 16.41%, respectively.
4. Discussion
Our study found that the presented hypotheses regarding the effectiveness of the BiomedCLIP model in detecting scoliosis were not fully confirmed. Although the model demonstrated high sensitivity in recognizing advanced scoliosis, its effectiveness in identifying mild cases and different curvature types was limited. Particularly for single-curve scoliosis, the model’s sensitivity was significantly lower than expected.
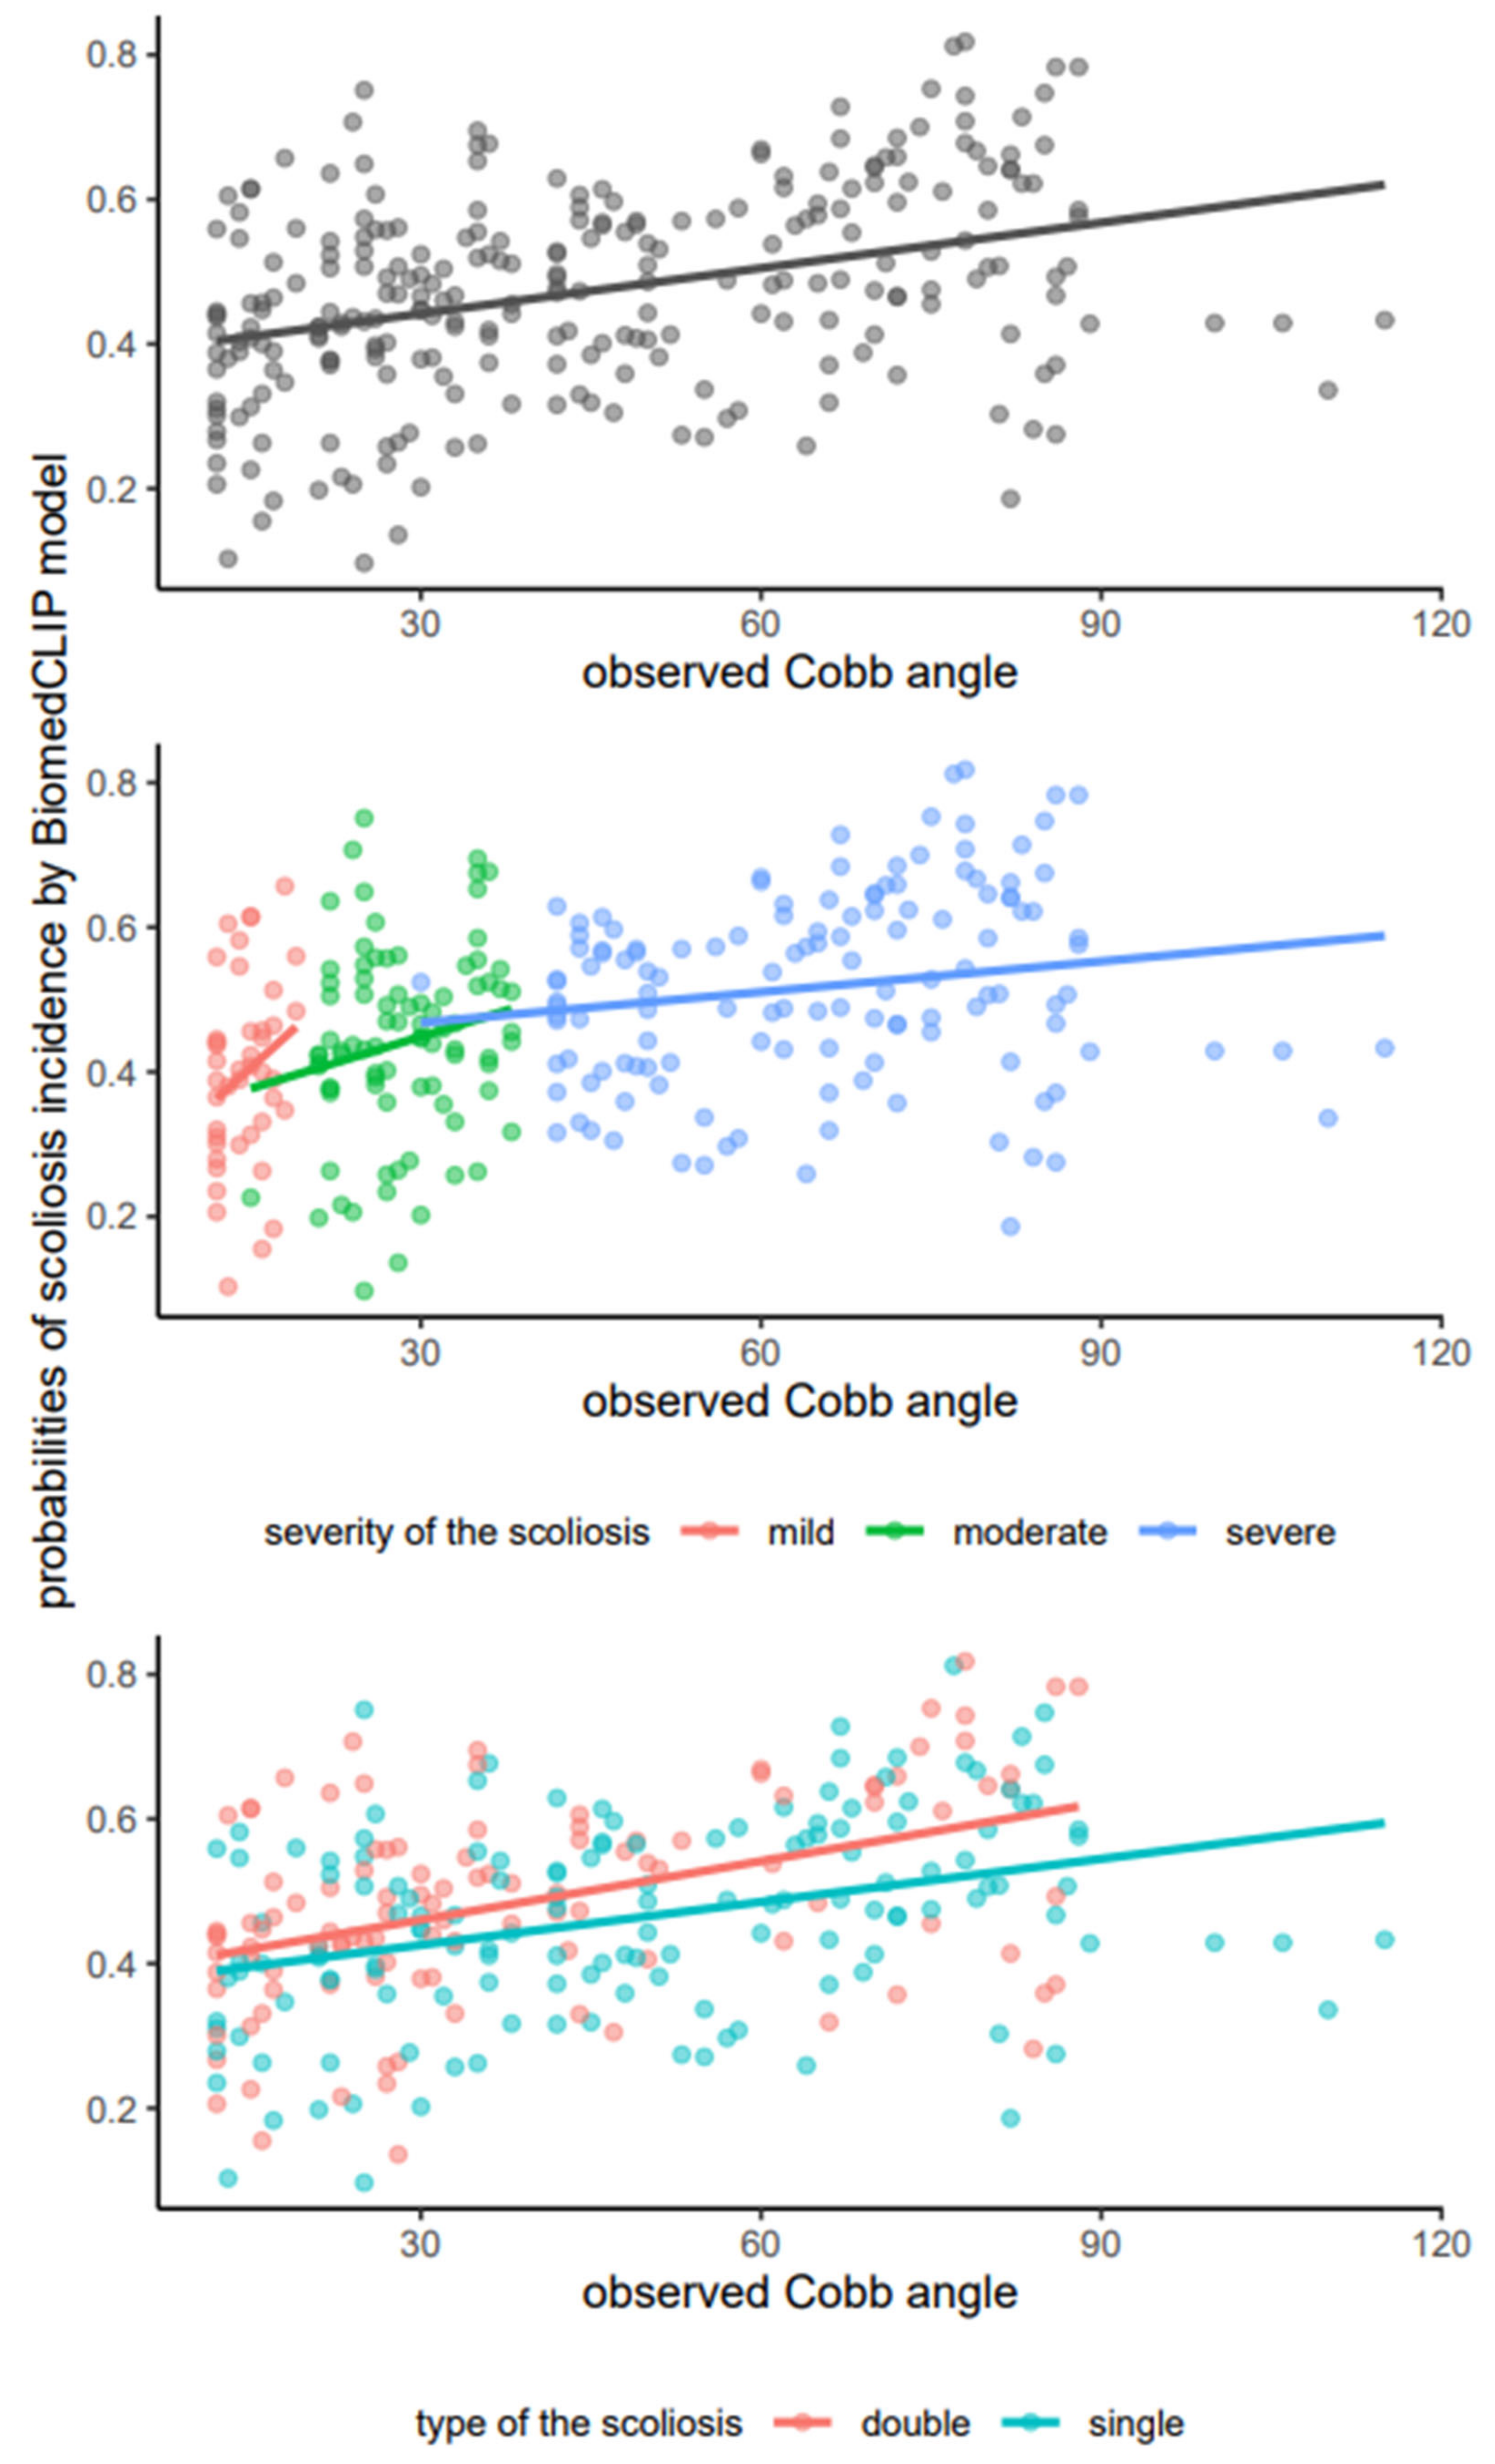
4.1. Evaluation of BiomedCLIP Sensitivity in Scoliosis Detection Across All Images
The results of the BiomedCLIP model showed an overall correlation between Cobb angles and the probabilities predicted by the model, with r = 0.37, indicating moderate agreement with actual clinical outcomes (p < 0.001). Despite statistical significance, this result does not suggest high sensitivity of the model’s predictions in all cases. When analyzing differences based on scoliosis stage, the correlation in mild cases was low (r = 0.24, p = 0.118), indicating limited effectiveness of the model in detecting mild cases. Similarly, in the moderate stage, the correlation was weak (r = 0.19, p = 0.077), and in the severe stage, although statistically significant, the correlation was relatively low (r = 0.18, p = 0.041). These findings suggest that the model struggles to predict scoliosis in mild and moderate stages, challenging the assumption of its high sensitivity in all situations. In conclusion, Hypothesis H1 was not confirmed. The results indicate that BiomedCLIP does not achieve high sensitivity in predicting the presence of scoliosis across all posturographic images. While the model shows moderate effectiveness in more advanced cases and in predicting scoliosis types, its performance is weaker for mild and moderate stages, as well as in distinguishing scoliosis types, emphasizing the need for further optimization of the model.
The limitations in distinguishing scoliosis types highlight the necessity for improving training datasets and advanced image processing techniques to enhance the model’s precision [
27]. Studies suggest that the integration of diverse imaging data could enhance AI performance in clinical environments [
28]. Despite these challenges, ongoing advancements in AI and imaging techniques may ultimately lead to more reliable diagnostic tools for scoliosis.
4.2. Performance of BiomedCLIP in Detecting Single-Curve and Double-Curve Scoliosis
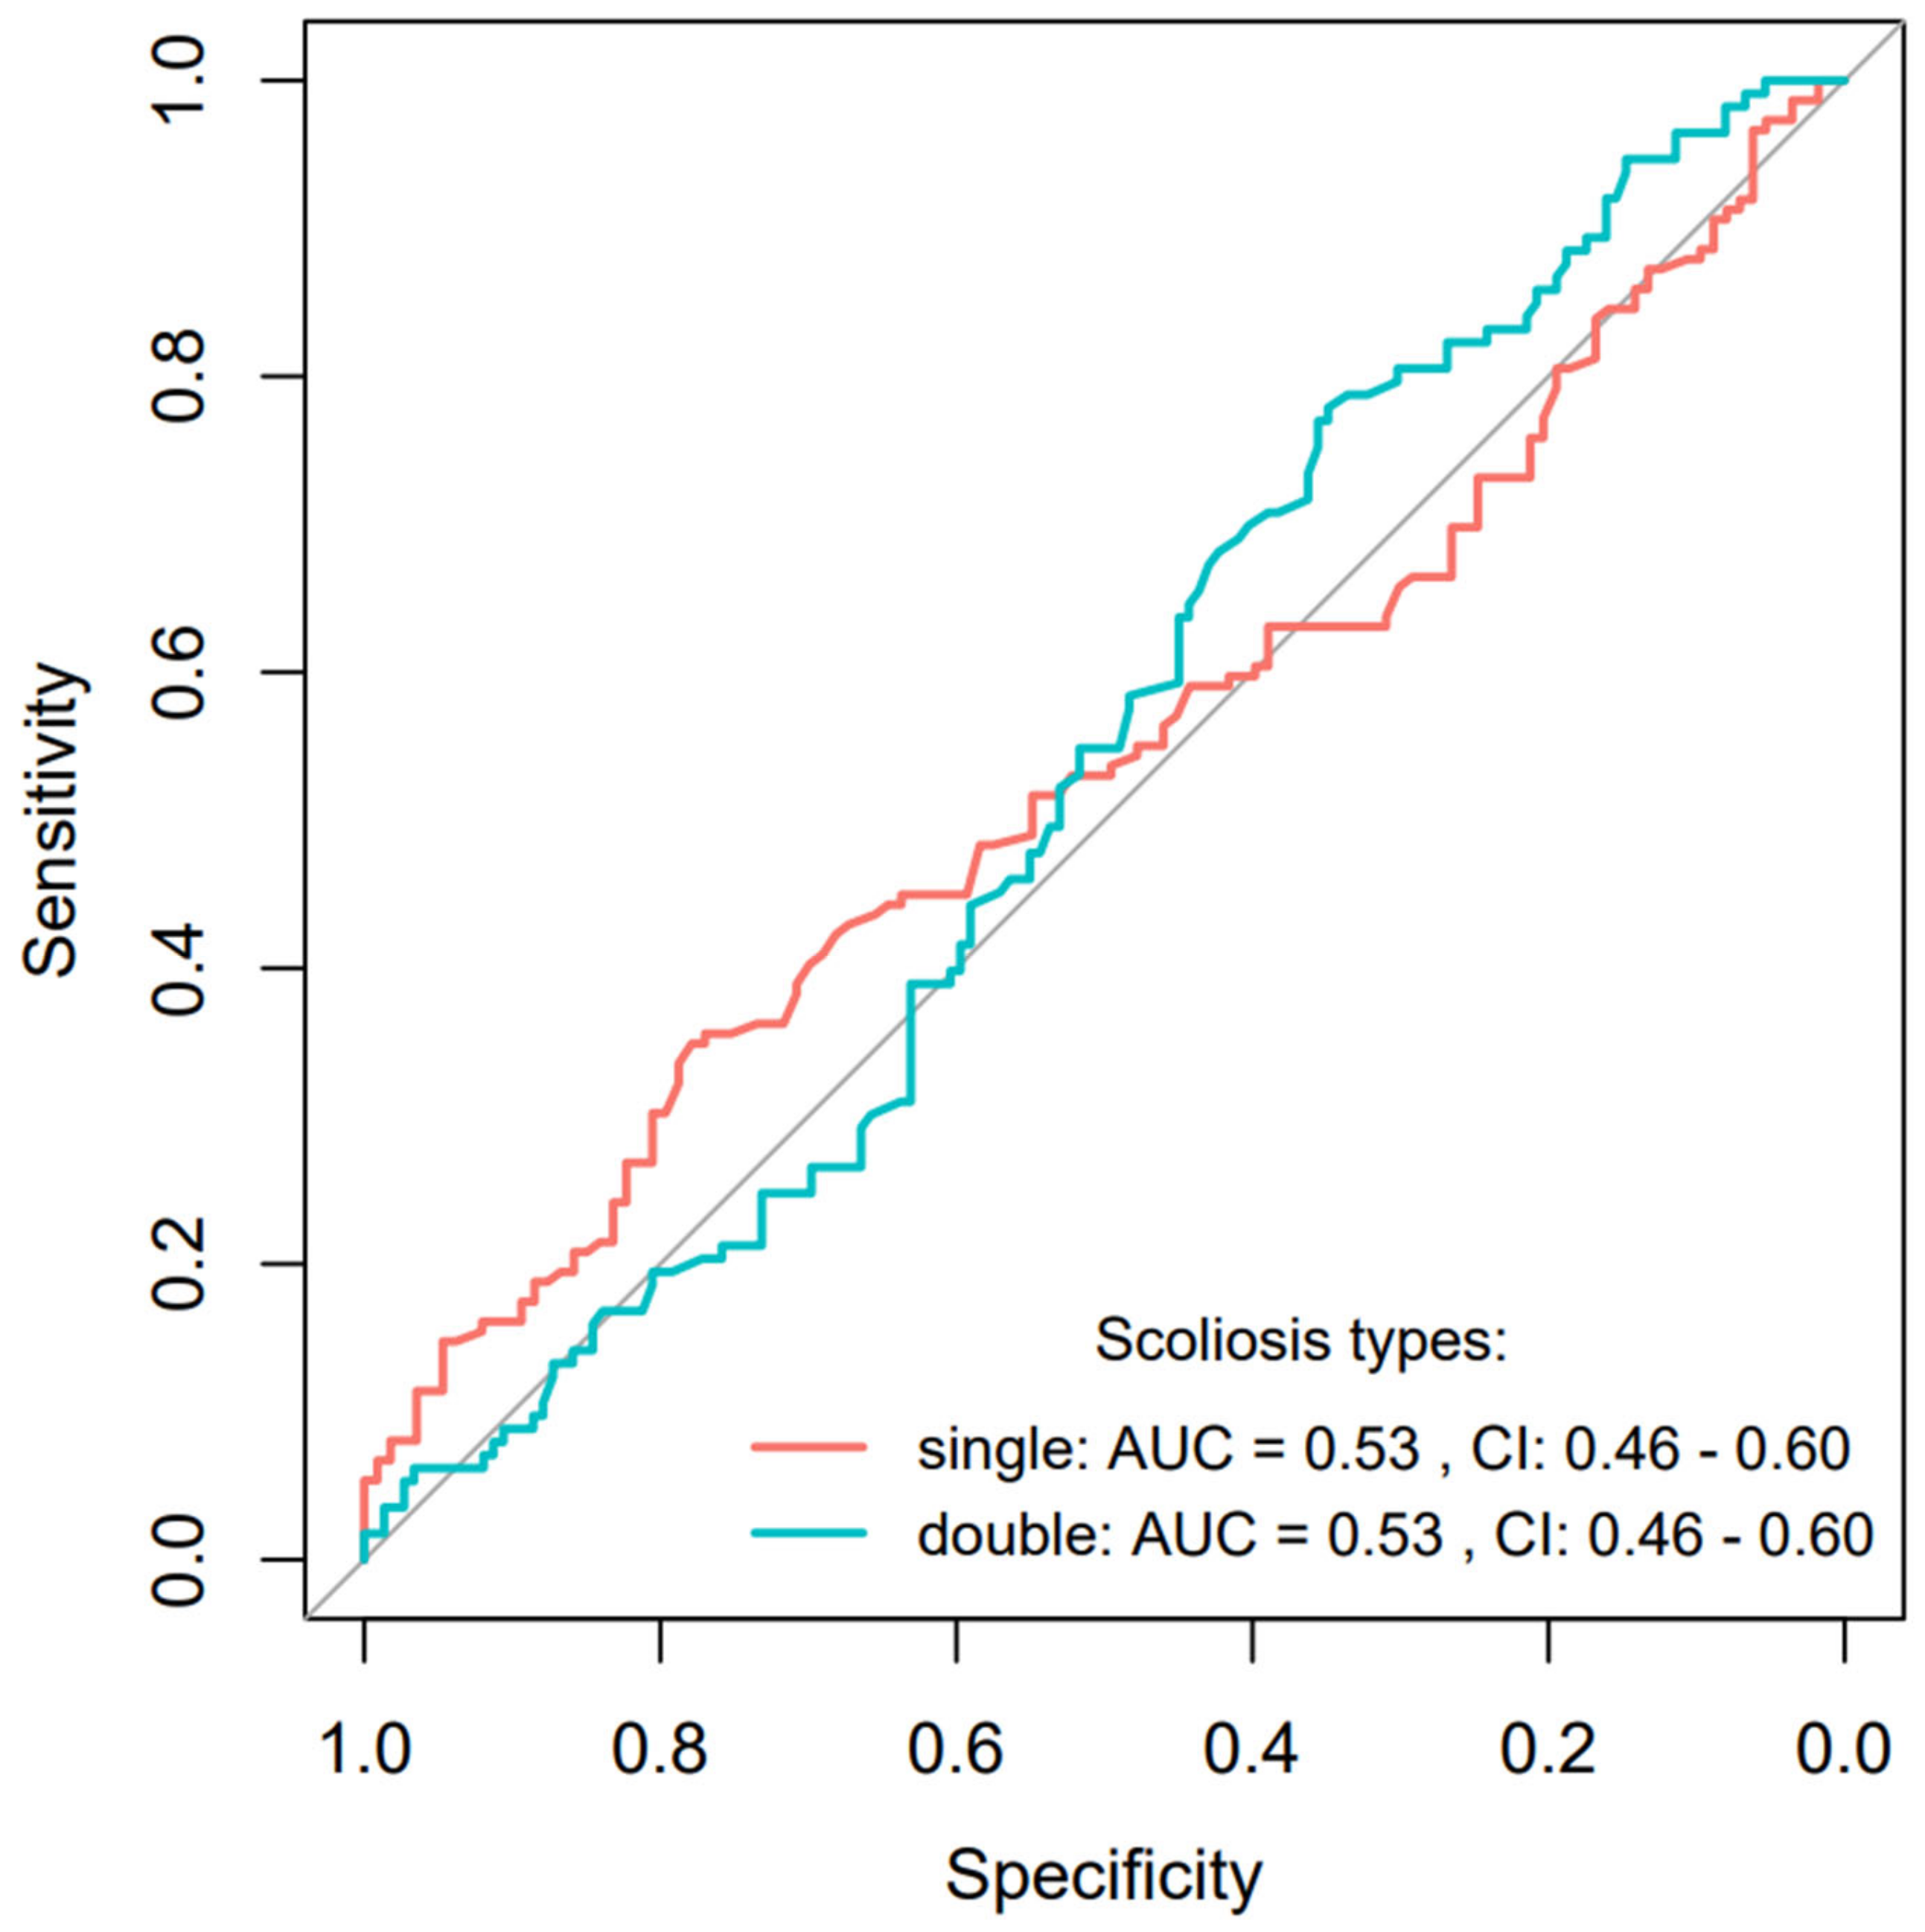
The results of the BiomedCLIP model demonstrated limited effectiveness in predicting both single-curve and double-curve scoliosis. For single-curve scoliosis, the model achieved low accuracy (0.53) and sensitivity (0.35), indicating difficulty in detecting actual cases. Although specificity was higher (0.78), the model struggled to confirm the presence of single-curve scoliosis, with an AUC of 0.53 suggesting performance only slightly better than random guessing. For double-curve scoliosis, the model showed a reverse pattern: higher sensitivity (0.78) but low specificity (0.35), resulting in numerous false positives. Accuracy remained at 0.53, and the AUC again indicated near-random performance (0.53). These consistent AUC results underscore the model’s challenges in distinguishing between single-curve and double-curve scoliosis The hypothesis (H2) that BiomedCLIP would accurately identify scoliosis types with high sensitivity was not fully confirmed. Hypothesis H2 posited that BiomedCLIP would accurately identify scoliosis types (single-curve and double-curve) with high sensitivity. However, the results demonstrated mixed outcomes. The model showed significant challenges in predicting single-curve scoliosis, achieving a sensitivity of only 0.35 and an AUC of 0.53, indicating performance slightly above random guessing. While the model exhibited higher specificity (0.78) in this category, it frequently failed to detect positive cases, leading to low overall accuracy (0.53). This suggests that the subtle radiographic features of single-curve scoliosis present a greater challenge for the model, likely due to the limited visibility of curvature in certain mild or intermediate stages. The overlapping of the two ROC curves near the middle of the sensitivity range reflects the complementary nature of the probabilities assessed by the AI model for features with two categories (single and double scoliosis). This behavior suggests that the model evaluates the features in a way that treats the two scoliosis types as interdependent or mutually exclusive.
This indicates that the AI model is likely assigning probabilities based on a shared feature set, where the sum of probabilities for both categories equals 1. The complementary probabilities reflect a balancing act by the model, where it adjusts predictions for one category as the likelihood for the other category increases. This approach is common in binary classification tasks, particularly when the model is trained on features that do not strongly distinguish between the two categories.
This complementary relationship in probability assessment is reflected in the nearly identical AUC values (0.53 for both single and double scoliosis) and the overlapping confidence intervals (CI: 0.46–0.60). These metrics suggest that the model’s performance in distinguishing between the two categories is limited and heavily influenced by shared characteristics of the feature space.
In contrast, the model performed better in detecting double-curve scoliosis, achieving a sensitivity of 0.78. However, this improvement came at the cost of reduced specificity (0.35), with the model misclassifying a notable number of non-double-curve cases as positive. The AUC value of 0.53 again highlights the lack of strong predictive capability. These results collectively suggest that while BiomedCLIP is capable of identifying double-curve scoliosis more reliably than single-curve cases, its overall performance in distinguishing scoliosis types remains limited. Further optimization, such as introducing additional training data with well-annotated examples of scoliosis types, is necessary to address these challenges. Low sensitivity for single-curve scoliosis and low specificity for double-curve scoliosis suggest that the model frequently failed to identify single-curve cases while misclassifying many as double-curve. This difficulty likely stems from the subtle imaging features of single-curve scoliosis, which are harder for the model to detect. While the model performed better in identifying double-curve scoliosis, this improvement came at the expense of increased false positives. These findings undermine the hypothesis of high sensitivity in recognizing scoliosis types and highlight the need for further optimization, particularly to improve sensitivity for single-curve scoliosis and specificity for double-curve scoliosis.
Detecting and classifying scoliosis using artificial intelligence (AI) models remains a significant challenge, especially in differentiating between these curvature types. Studies indicate that despite generally high accuracy, the sensitivity and specificity of AI models vary significantly depending on the curvature type and grade. For example, recent research demonstrated that an AI system achieved high sensitivity (0.97) and specificity (0.88) in detecting scoliosis, particularly in mild and moderate grades, while certain cases showed discrepancies exceeding 5° in Cobb angle measurement [
29]. This suggests that such cases may be more difficult for models to accurately identify. While models demonstrate better sensitivity in double-curve scoliosis, this comes at the expense of an increased number of false alarms, leading to misclassification and reduced specificity [
30].
These results underscore the need for further optimization of AI models to improve sensitivity in cases of single-curve scoliosis and increase specificity for double-curve scoliosis cases [
31]. Techniques such as deep learning and automated ultrasound imaging are being studied to enhance diagnostic accuracy and reduce human error in measurements [
31,
32]. Although AI shows potential in detecting scoliosis, current limitations in sensitivity and specificity require further research and model optimization to achieve reliable clinical results.
4.3. Assessment of BiomedCLIP Accuracy in Classifying Scoliosis Severity
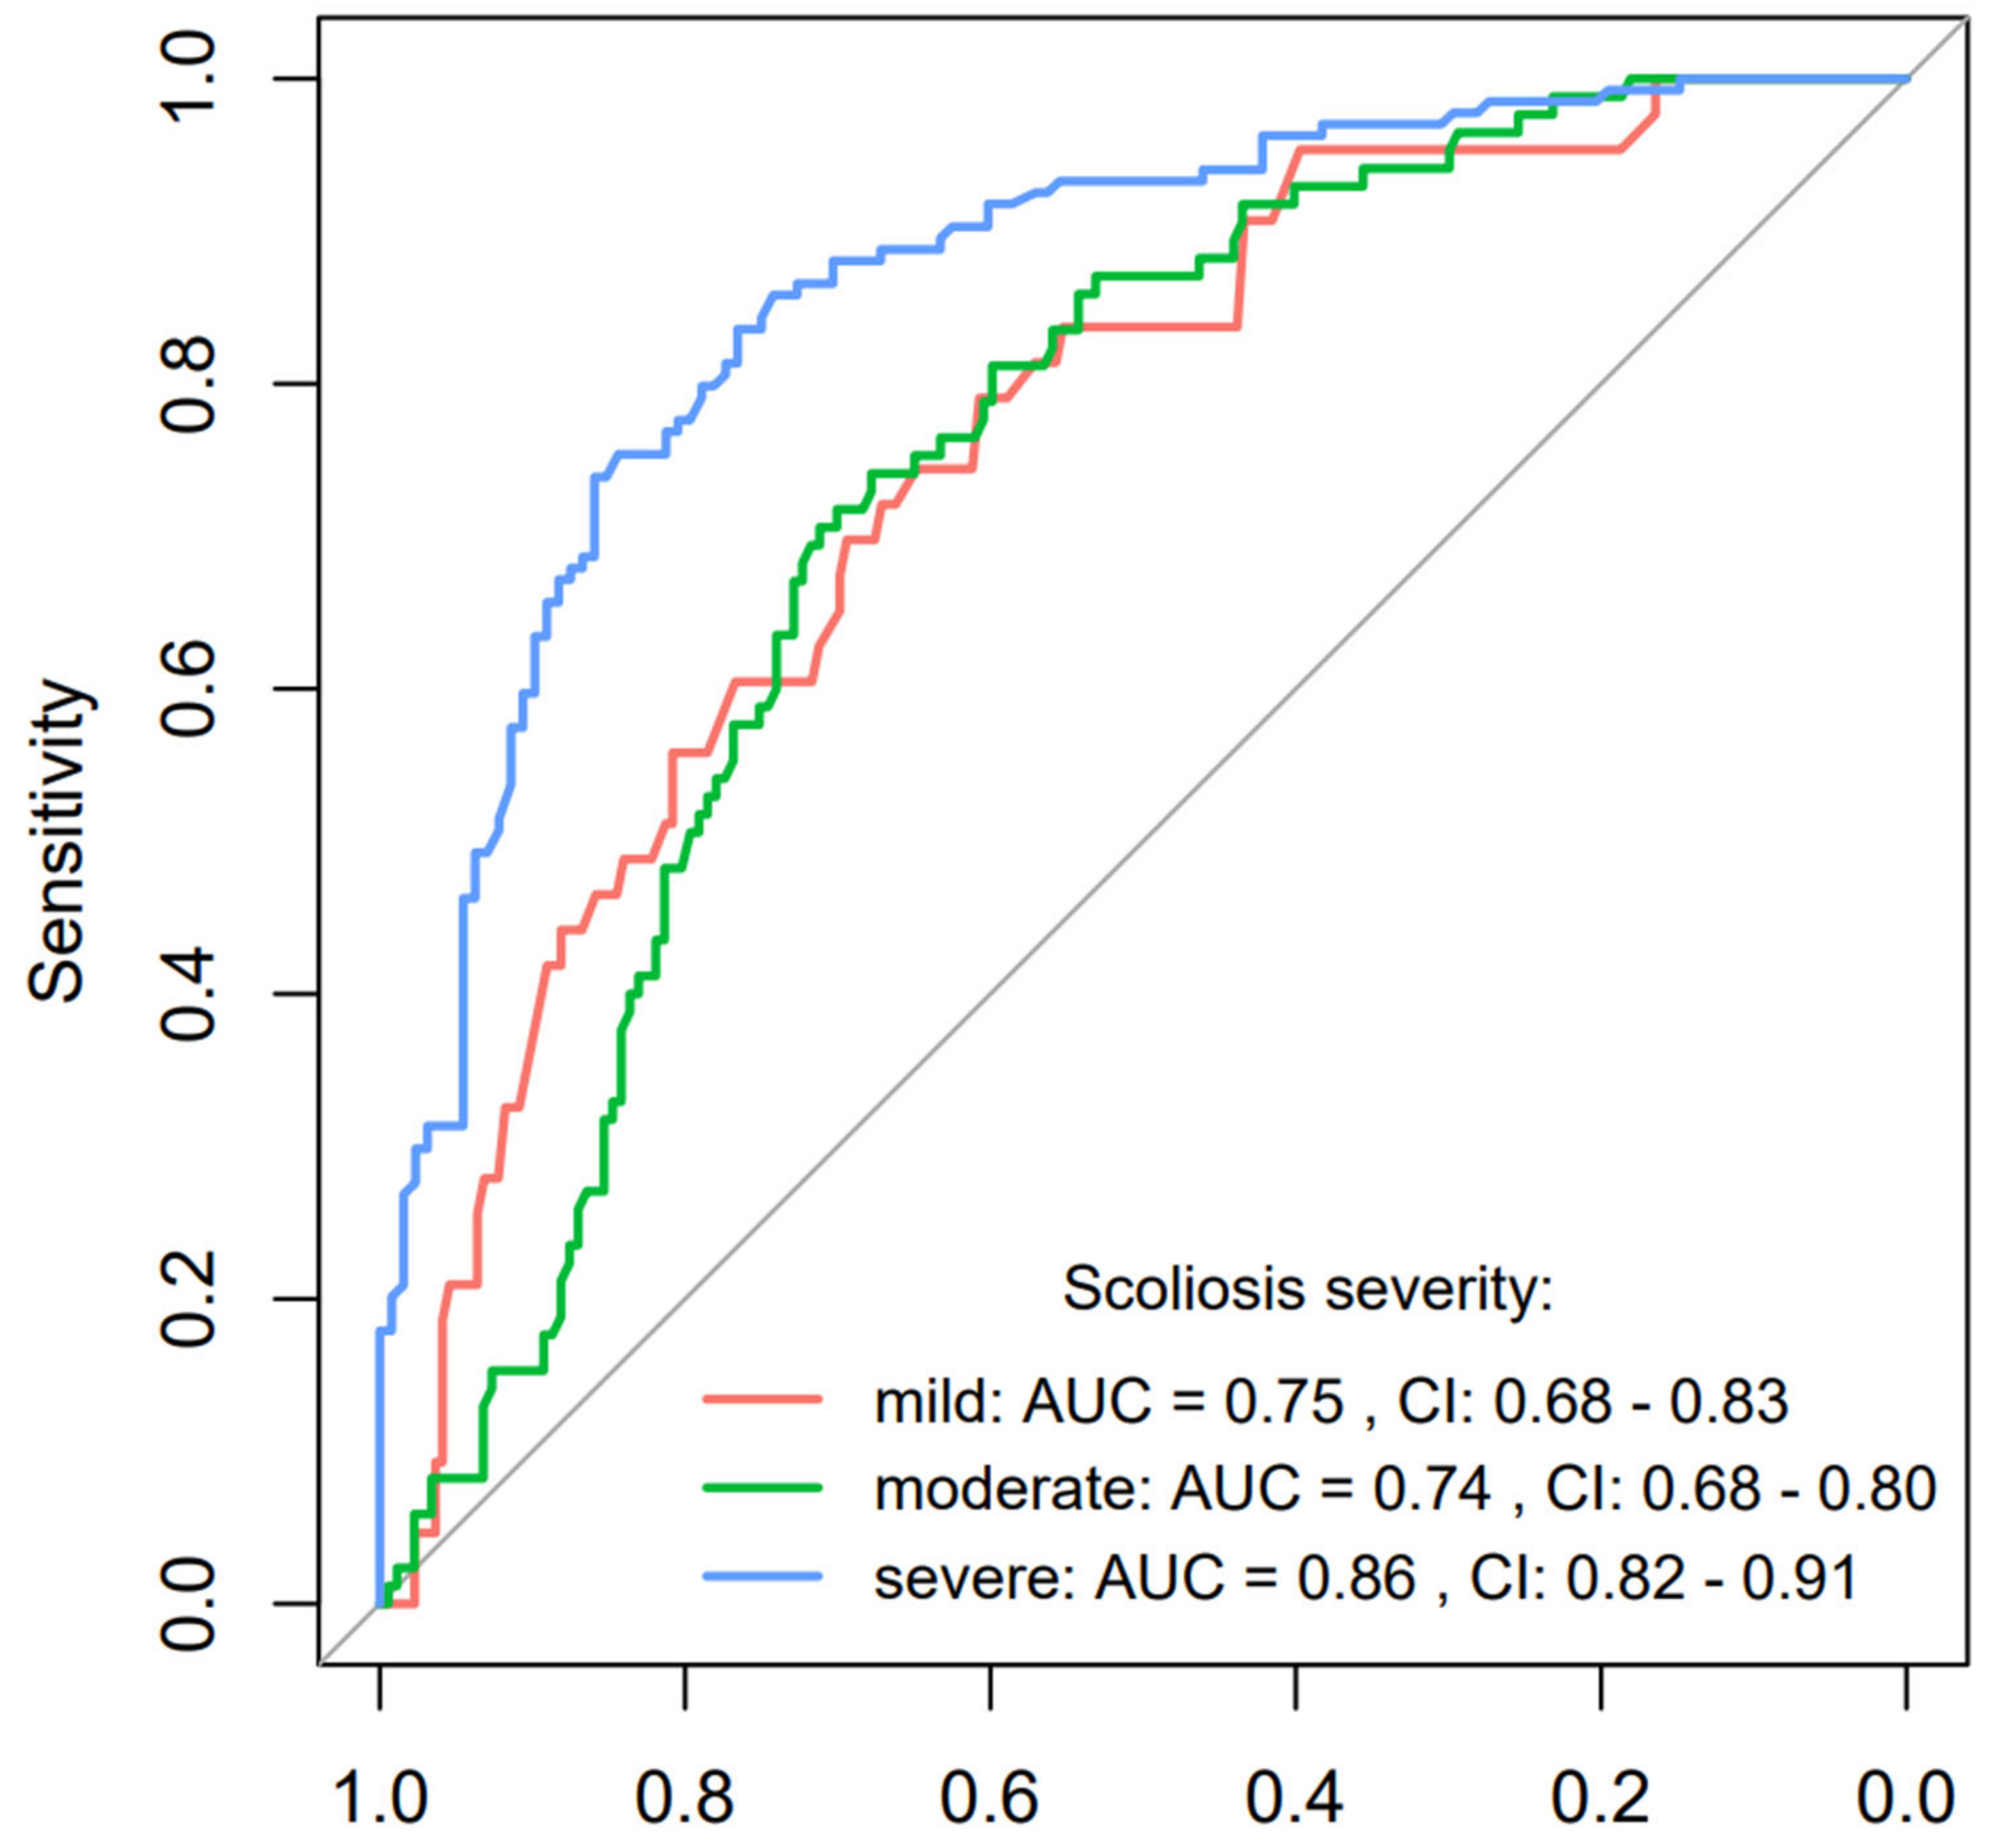
The results of the BiomedCLIP model in predicting scoliosis severity showed varying effectiveness depending on the disease stage. For mild scoliosis, the model achieved moderate accuracy (0.64), with a sensitivity of 0.79 and specificity of 0.61, highlighting limitations in precision. For moderate scoliosis, accuracy improved slightly to 0.70, with sensitivity at 0.74 and specificity at 0.68, indicating balanced performance in identifying true cases and reducing false positives. The best results were observed for severe scoliosis, where accuracy reached 0.80, sensitivity 0.84, and specificity 0.77, reflecting strong effectiveness in recognizing advanced cases.
The AUC analysis corroborates these findings. For mild scoliosis, the AUC was 0.75, suggesting moderate discrimination ability, while for moderate scoliosis, it was 0.74. For severe scoliosis, the AUC peaked at 0.87, underscoring excellent detection capability. The ROC curves further illustrate that the model consistently performed better than random guessing, particularly excelling in severe cases. These results indicate that BiomedCLIP performed significantly better in detecting severe scoliosis compared to mild and moderate stages. The model’s stronger performance in advanced cases can be attributed to more pronounced physiological changes visible in imaging. In contrast, subtler changes in mild scoliosis presented greater challenges, especially in maintaining specificity. The difficulty in detecting mild scoliosis reflects the subtleties of the disease, which make it harder for the model to discern changes on radiographic images. Hypothesis (H3), which proposed that BiomedCLIP would accurately classify scoliosis severity, was only partially confirmed. Hypothesis H3 proposed that BiomedCLIP would accurately categorize the severity of scoliosis into mild, moderate, and severe stages. The results indicate that the model’s performance varies depending on the severity stage. For severe scoliosis, BiomedCLIP achieved strong predictive power, with an accuracy of 0.80, sensitivity of 0.84, and specificity of 0.77, supported by an AUC of 0.87. These results confirm the model’s robustness in detecting advanced scoliosis cases, likely due to the more pronounced radiographic markers in severe stages.
In comparison, the model’s performance was more moderate for mild and moderate scoliosis. For mild cases, sensitivity reached 0.79, but accuracy was lower at 0.64, and specificity was limited to 0.61, indicating a tendency for false positives. Similarly, moderate cases showed a balanced performance with an accuracy of 0.70, sensitivity of 0.74, and specificity of 0.68, yet still fell short of the hypothesis’s expectation for high predictive precision. These findings highlight that while BiomedCLIP demonstrates notable success in identifying severe scoliosis, its ability to reliably classify mild and moderate stages remains limited.
The observed variability underscores the need for further refinement of the model and expansion of training datasets. Including more annotated examples of mild and moderate scoliosis, as well as enhancing image preprocessing techniques, could improve performance across all severity stages. Advanced AI models, although promising, still face limitations in accurately assessing Cobb angles and classifying less advanced cases of scoliosis [
33]. Despite these advancements, the challenges of diagnosing mild scoliosis emphasize the need for further refinement of AI models to enhance diagnostic capabilities across all severity stages.
In conclusion, the hypothesis regarding the model’s ability to classify scoliosis severity was only partially confirmed. BiomedCLIP demonstrated strong performance in detecting severe scoliosis but moderate effectiveness for mild and moderate cases. Further optimization is necessary to improve detection in early and intermediate stages of scoliosis.
4.4. Comparison with CLIP
When comparing the results obtained by the CLIP and BiomedCLIP models, a key question arises: why did an untrained model like CLIP achieve 100% accuracy in detecting severe single-curve scoliosis, while BiomedCLIP, specifically trained on medical data, performed less effectively in similar cases? Notably, CLIP was tested on only 23 images of severe single-curve scoliosis, whereas BiomedCLIP analyzed a larger and more diverse dataset of 262 images, covering various severities and scoliosis types.
One explanation for this paradox is the simplicity of the task given to CLIP. Severe single-curve scoliosis presents clear and easily detectable physiological changes, enabling even an untrained model to identify these cases. The prominence of severe scoliosis in X-ray images likely made it easier for CLIP to succeed without requiring specialized medical data training. In contrast, BiomedCLIP faced a more complex task, having to differentiate not only severe scoliosis but also mild and moderate cases, as well as classify scoliosis types. This broader scope introduced additional challenges for the model.
Trained models like BiomedCLIP are also more prone to errors due to the diversity of the datasets they are trained on. Learning to recognize subtle and inconsistent nuances across a wide range of cases may dilute the model’s predictive accuracy, making it less effective in straightforward tasks such as detecting severe scoliosis. This diversity, while necessary for generalization, can reduce performance when handling highly specific or obvious changes.
4.5. Model Adaptation and Generalization
Models like BiomedCLIP have shown improved performance through domain-specific adaptations, helping focus on relevant features in medical images [
34]. Introducing multi-level adaptation frameworks increases the model’s ability to generalize across different types of medical data, addressing domain discrepancies [
35].
4.6. Challenges with False Features
Research indicates that models like CLIP can learn false correlations, reducing performance when data distribution changes [
36]. Relying on such false features may limit effectiveness in scenarios with obvious but less specific changes, as the model may misinterpret signals. However, while data diversity poses challenges, it also broadens the model’s learning context, potentially increasing robustness in real-world applications.
Comparing the results of CLIP and BiomedCLIP is not entirely fair, as they were tested under different conditions. CLIP was evaluated on a simple task—detecting severe single-curve scoliosis—and performed well without specialized training. BiomedCLIP, on the other hand, had to handle a wider range of cases, including differentiating scoliosis types and severities, introducing complexities that likely impacted its performance. The differing test scenarios underline that the results of these models are not directly comparable. CLIP’s strong performance stemmed from a simple, focused task, while BiomedCLIP’s specialization required it to navigate more challenging diagnostic cases, affecting its accuracy in severe scoliosis detection.
The performance of BiomedCLIP can also be partially attributed to limitations in the dataset used for training. The PMC-15M dataset, containing 15 million image-text pairs from PubMed Central, includes a wide variety of biomedical image types, such as microscopy and histology. However, it does not guarantee suitability for scoliosis-specific training. A 2023 PubMed search for “scoliosis” yielded only approximately 31,226 articles, representing a small fraction of the PMC database. Many of these articles may lack relevant X-ray images, focusing instead on genetic, molecular, or clinical studies. Limited access to appropriate clinical scoliosis images likely constrained BiomedCLIP’s ability to detect mild cases and differentiate curvature types effectively.
BiomedCLIP’s use of the ViT (Vision Transformer) architecture also presents challenges for medical data. Transformers, initially designed for large-scale text data, require extensive datasets to extract meaningful patterns. Medical data, by contrast, are often highly specialized and context-dependent. Limited, variable datasets make it difficult to identify consistent patterns, leading to potential inaccuracies in predictions. Additionally, the complexity of interpreting medical images, which often depends on expert context, adds further difficulty. These limitations underscore the need for more targeted datasets and tailored architectural adjustments to improve performance in medical imaging tasks.
A significant challenge arises from the use of contrastive learning, a major component of transformer architectures, including BiomedCLIP. Contrastive learning can exacerbate these misinterpretations, potentially leading to incorrect classifications. Moreover, the limited availability of data presents another obstacle. The creators of BiomedCLIP themselves acknowledged that small datasets are insufficient for fine-tuning models like CLIP [
34]. For instance, PubMedCLIP was trained on the ROCO dataset, which contains 81,000 images [
37]. However, in the case of scoliosis, there are far fewer relevant articles and even fewer high-quality, annotated scoliosis images, further restricting the available data for model training.
This leads to another issue with the PMC-15 dataset, which focuses primarily on images where the accompanying text consists mainly of annotations. These annotations can be misleading and may provide incorrect clues about the overall context. Additionally, many medical conditions require a highly specific set of parameters for diagnosis, making it difficult to classify them correctly without sufficient and accurate data. Another limitation arises from the structure of the dataset itself, which includes images and descriptions from a wide range of biomedical fields. This diversity can result in the model being overly generalized in its predictions, making it less accurate for specific conditions like scoliosis. Furthermore, the lack of open-access PubMed articles restricts access to complete imaging datasets, which may have affected the quality and diversity of the training data available for BiomedCLIP. It is also important to note that our analysis was limited to radiographic images, which could restrict the generalizability of the results to other imaging techniques, such as MRI or CT. The lack of relevant data from other biomedical imaging modalities may have further constrained the model’s effectiveness in the broader diagnostic context of scoliosis.
Recent advancements in deep learning (DL) have significantly improved scoliosis detection and quantification, particularly in tasks such as axial vertebral rotation (AVR) estimation and Cobb angle (CA) measurement. For example, Zhao et al. proposed an automatic AVR measurement method that combines vertebra landmark detection and pedicle segmentation using an improved High-Resolution Network (HR-Net) with CoordConv layers and self-attention mechanisms. Their approach demonstrated high accuracy in estimating AVR by precisely extracting pedicle center coordinates and vertebral landmarks. This landmark-based approach provides detailed structural information, which is critical for assessing three-dimensional spinal deformities, particularly in adolescent idiopathic scoliosis (AIS) [
38].
Similarly, a recent systematic review of DL methods for CA measurement highlights various approaches, such as U-Net variants, Capsule Neural Networks (CapsNets), and multi-stage pipelines, achieving notable accuracy in estimating spinal curvature. For instance, CapsNet achieved a Pearson correlation coefficient (PCC) of 0.93, while LocNet and RegNet models demonstrated robust vertebral localization and CA prediction performance. These approaches rely on precise manual annotations of vertebral landmarks and demonstrate strong capabilities in quantifying curvature, which remains a gold standard for scoliosis severity assessment [
39].
Our study differs from these methods by addressing scoliosis classification tasks, specifically severity stages (mild, moderate, severe) and curvature types (single-curve, double-curve), using the BiomedCLIP model. Unlike landmark-dependent AVR or CA measurement methods, BiomedCLIP leverages a contrastive learning framework to embed image–text relationships, enabling classification without requiring explicit anatomical markers or angle calculations. This approach is particularly advantageous for automating scoliosis triage and broad classification in clinical settings.
However, similar challenges are observed across studies, including our own. While AVR- and CA-based methods achieve high precision in quantifying spinal deformities, they often require extensive manual annotations and are sensitive to image quality and data variability. Our findings, such as the lower sensitivity for mild scoliosis and reduced specificity for double-curve detection, align with these limitations. Moreover, subtle imaging features in early-stage scoliosis remain a significant challenge for both CA-based measurement and classification approaches.
Integrating precise AVR and CA measurement techniques with models like BiomedCLIP represents a promising direction for future research. By combining detailed anatomical quantification with classification-based predictions, a more comprehensive AI-driven framework could be developed, enhancing scoliosis diagnosis, severity assessment, and treatment planning.
This suggests the need for further optimization of the model, as discussed earlier, to improve its sensitivity in detecting subtle cases of scoliosis and accurately differentiate curvature types. Integrating precise AVR and CA estimation techniques with BiomedCLIP’s classification framework could be a valuable direction for future research.


 ,
, 
