
Analysis of Energy Dissipation and Sealing Performance of the Premium Connection in Modal Vibrations

Abstract
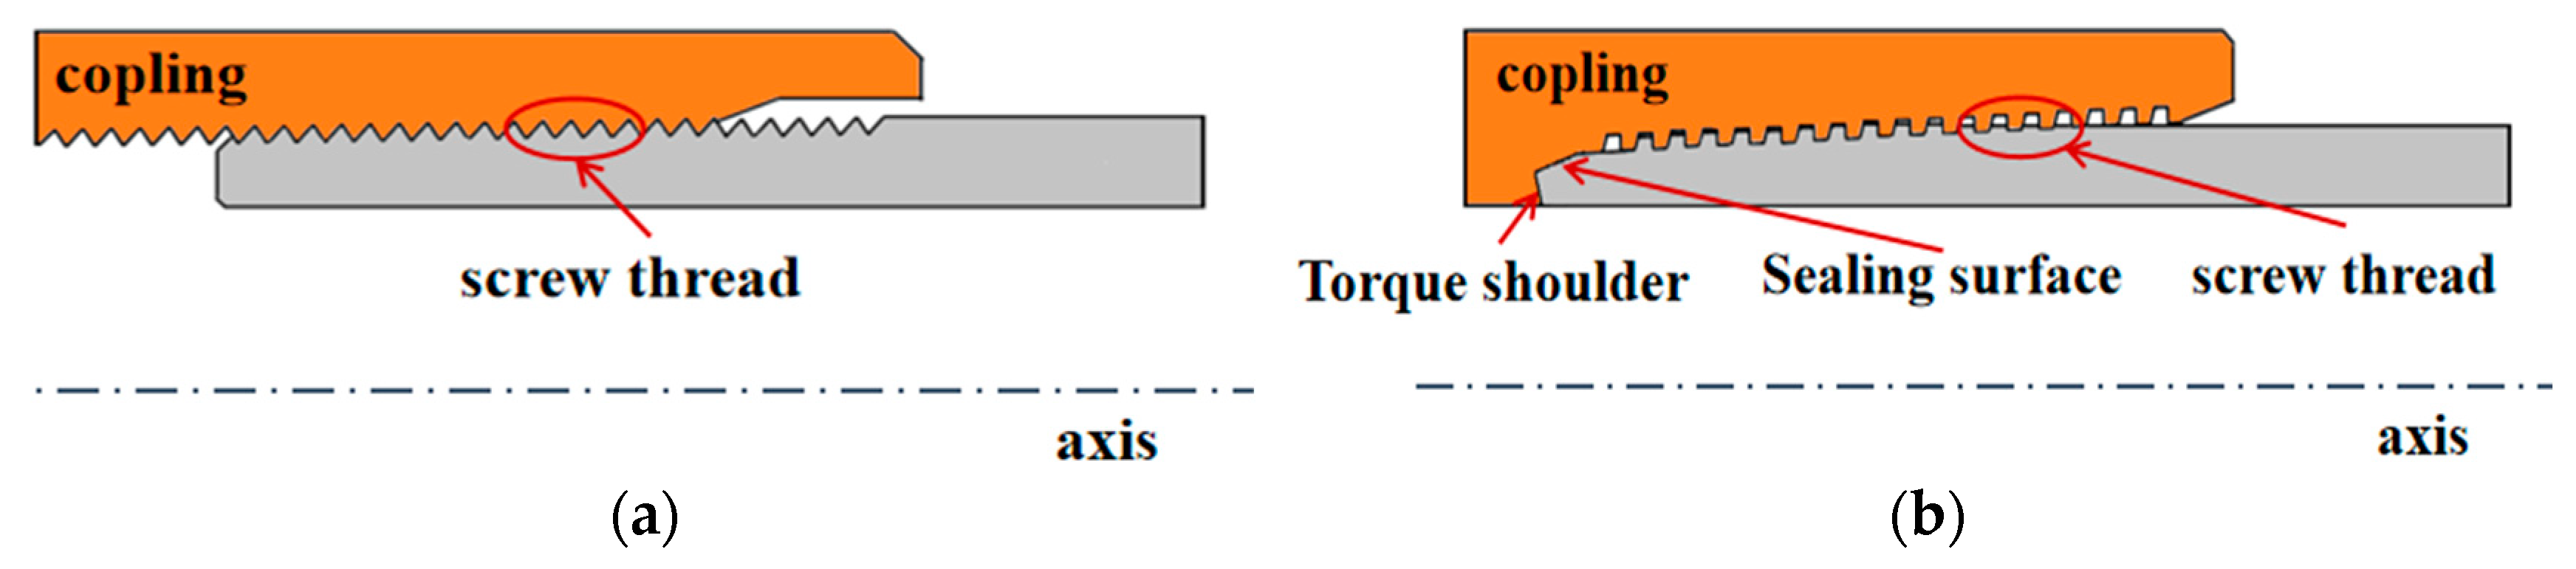
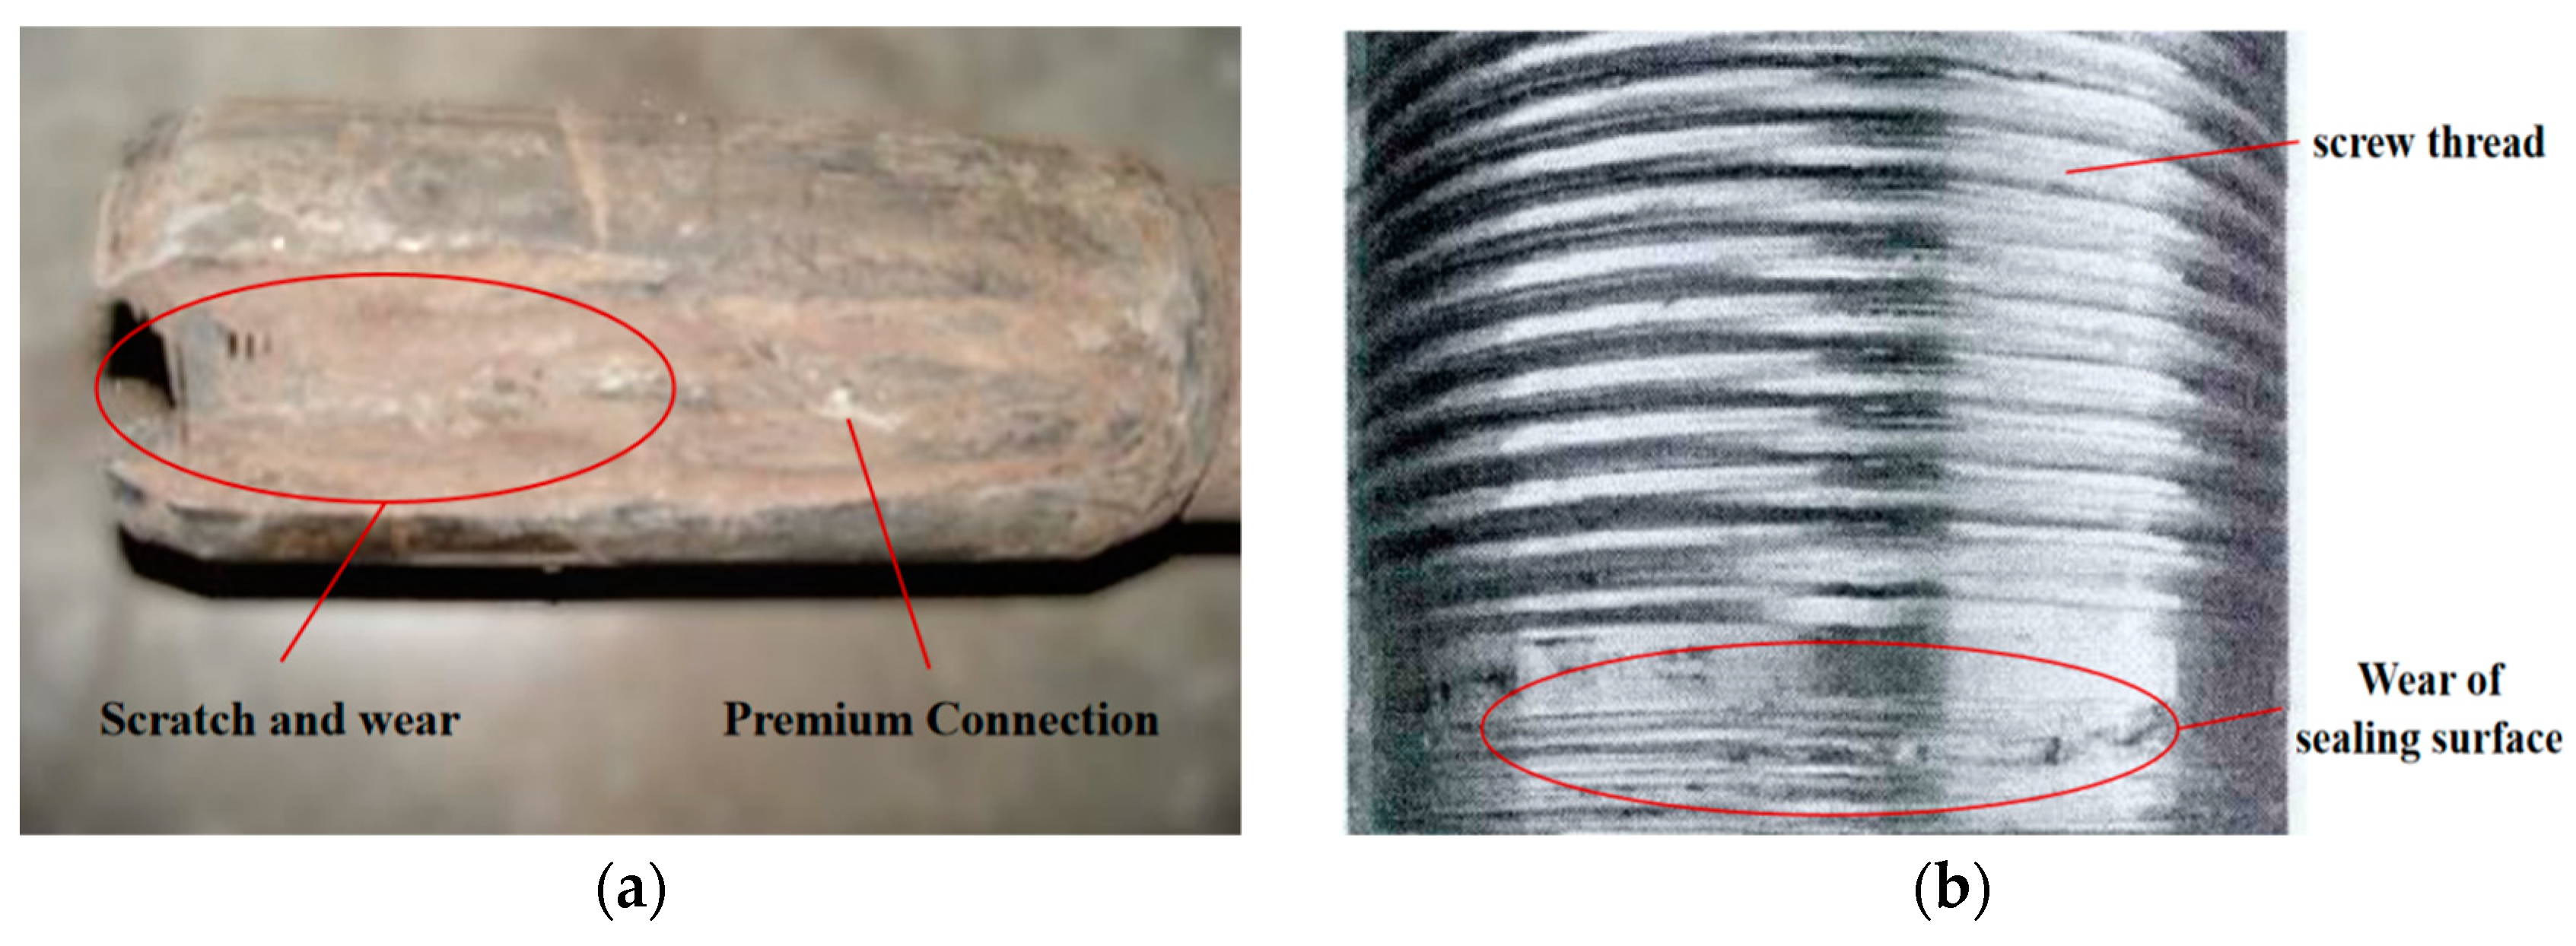
1. Introduction
2. Materials and Methods
2.1. Acquisition of Modal Shapes
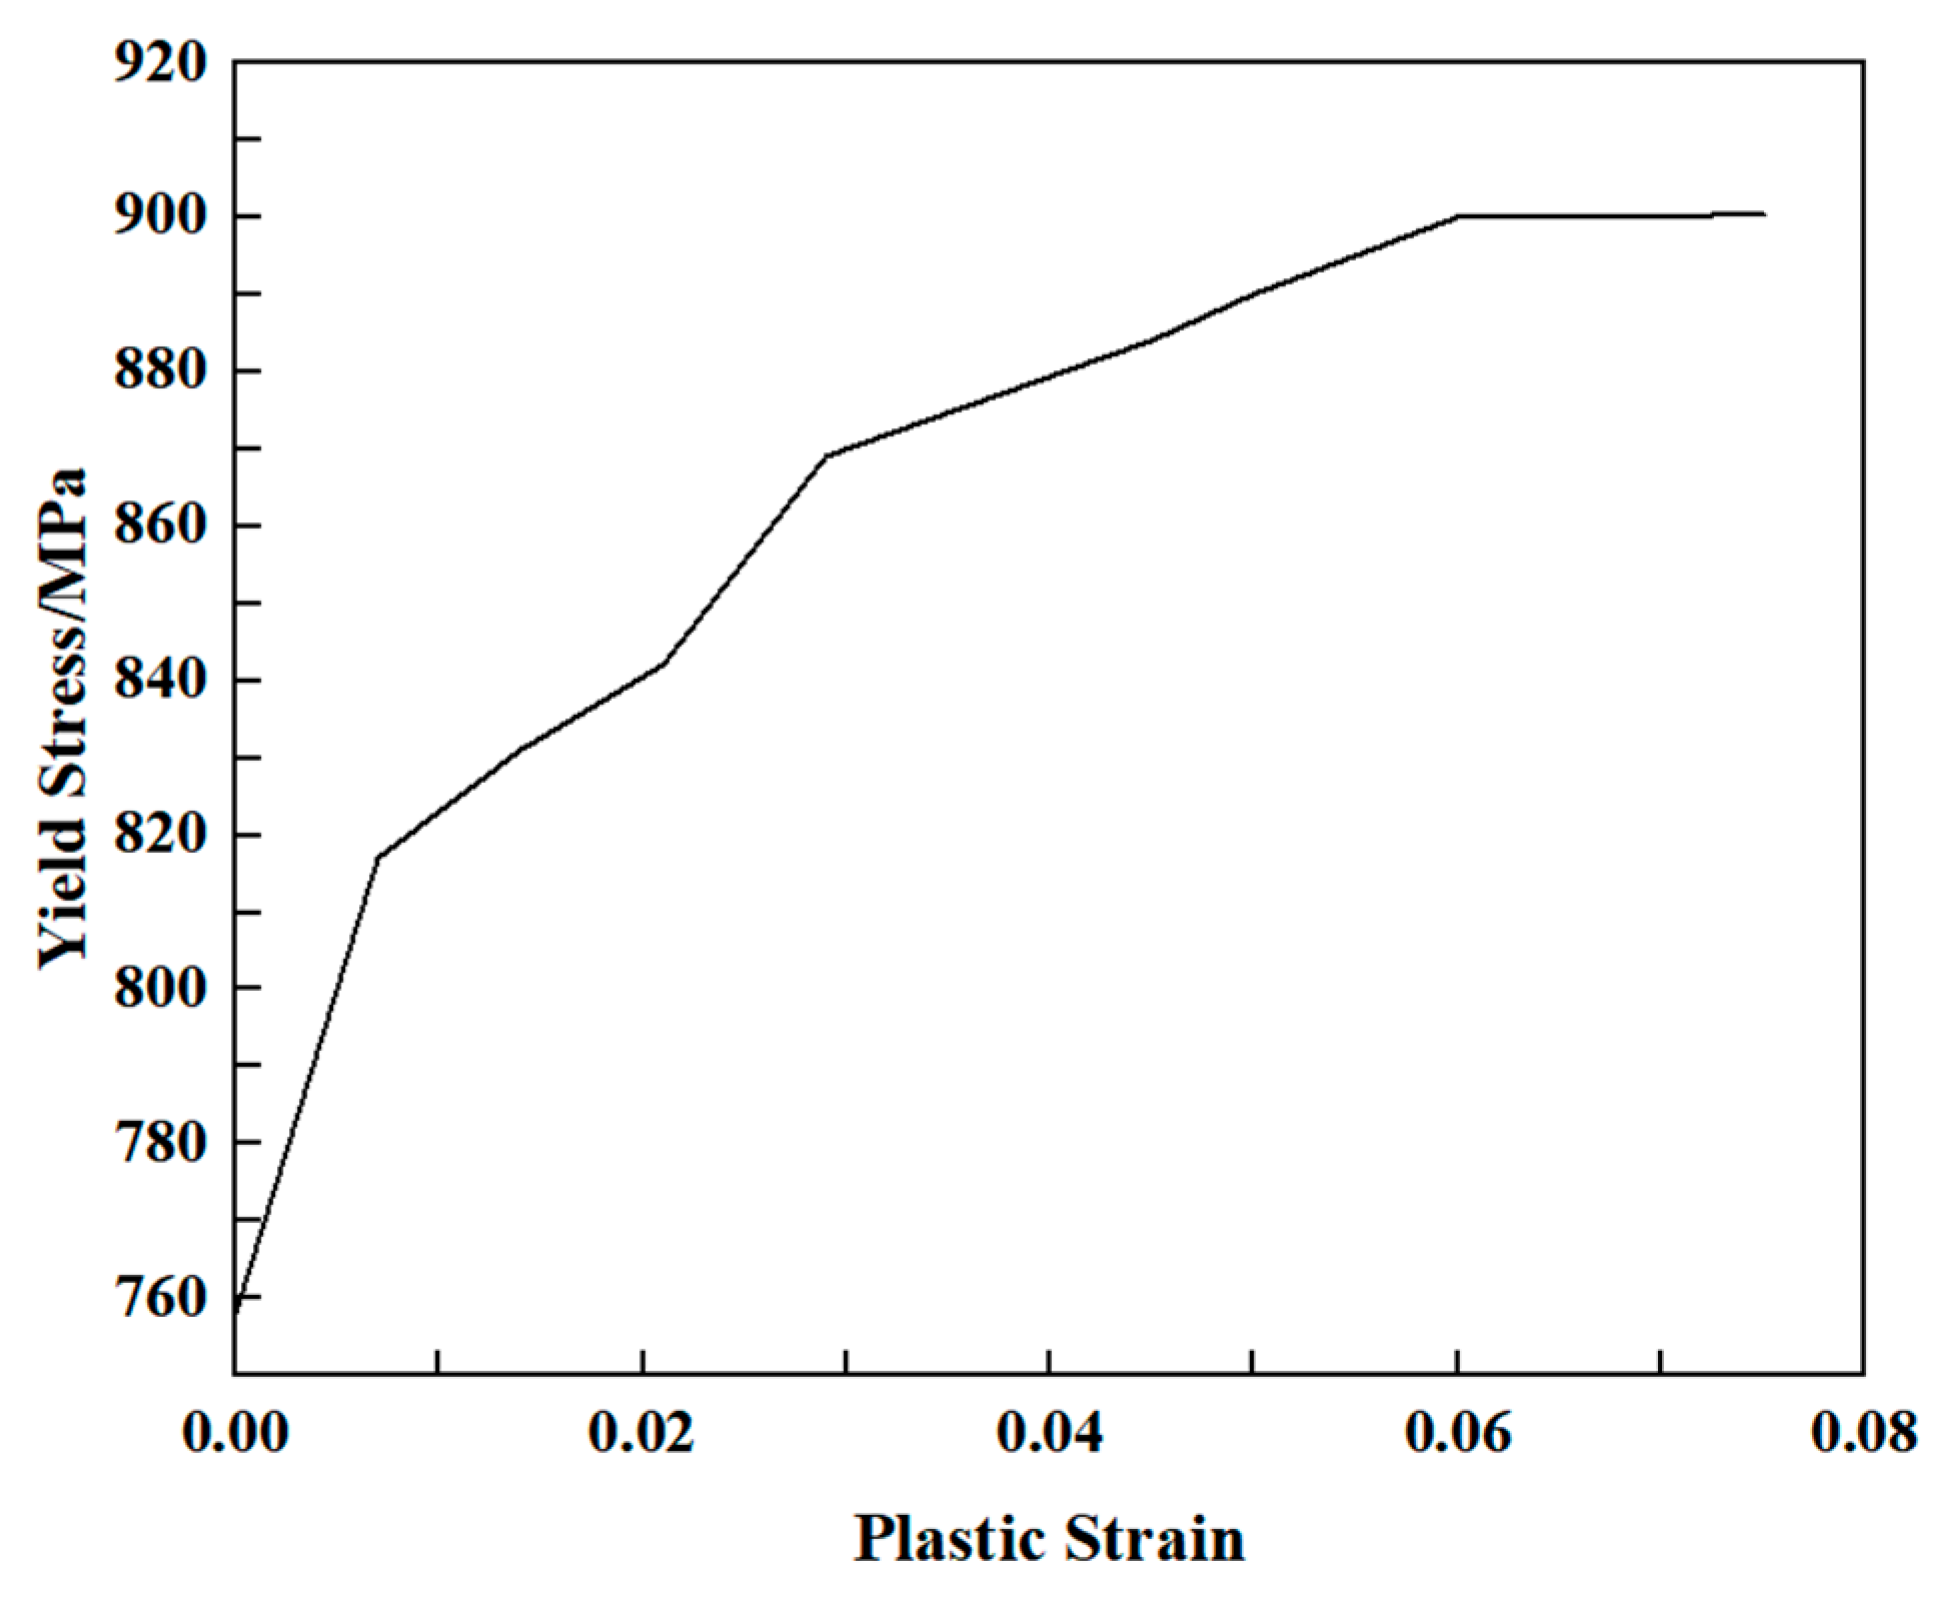
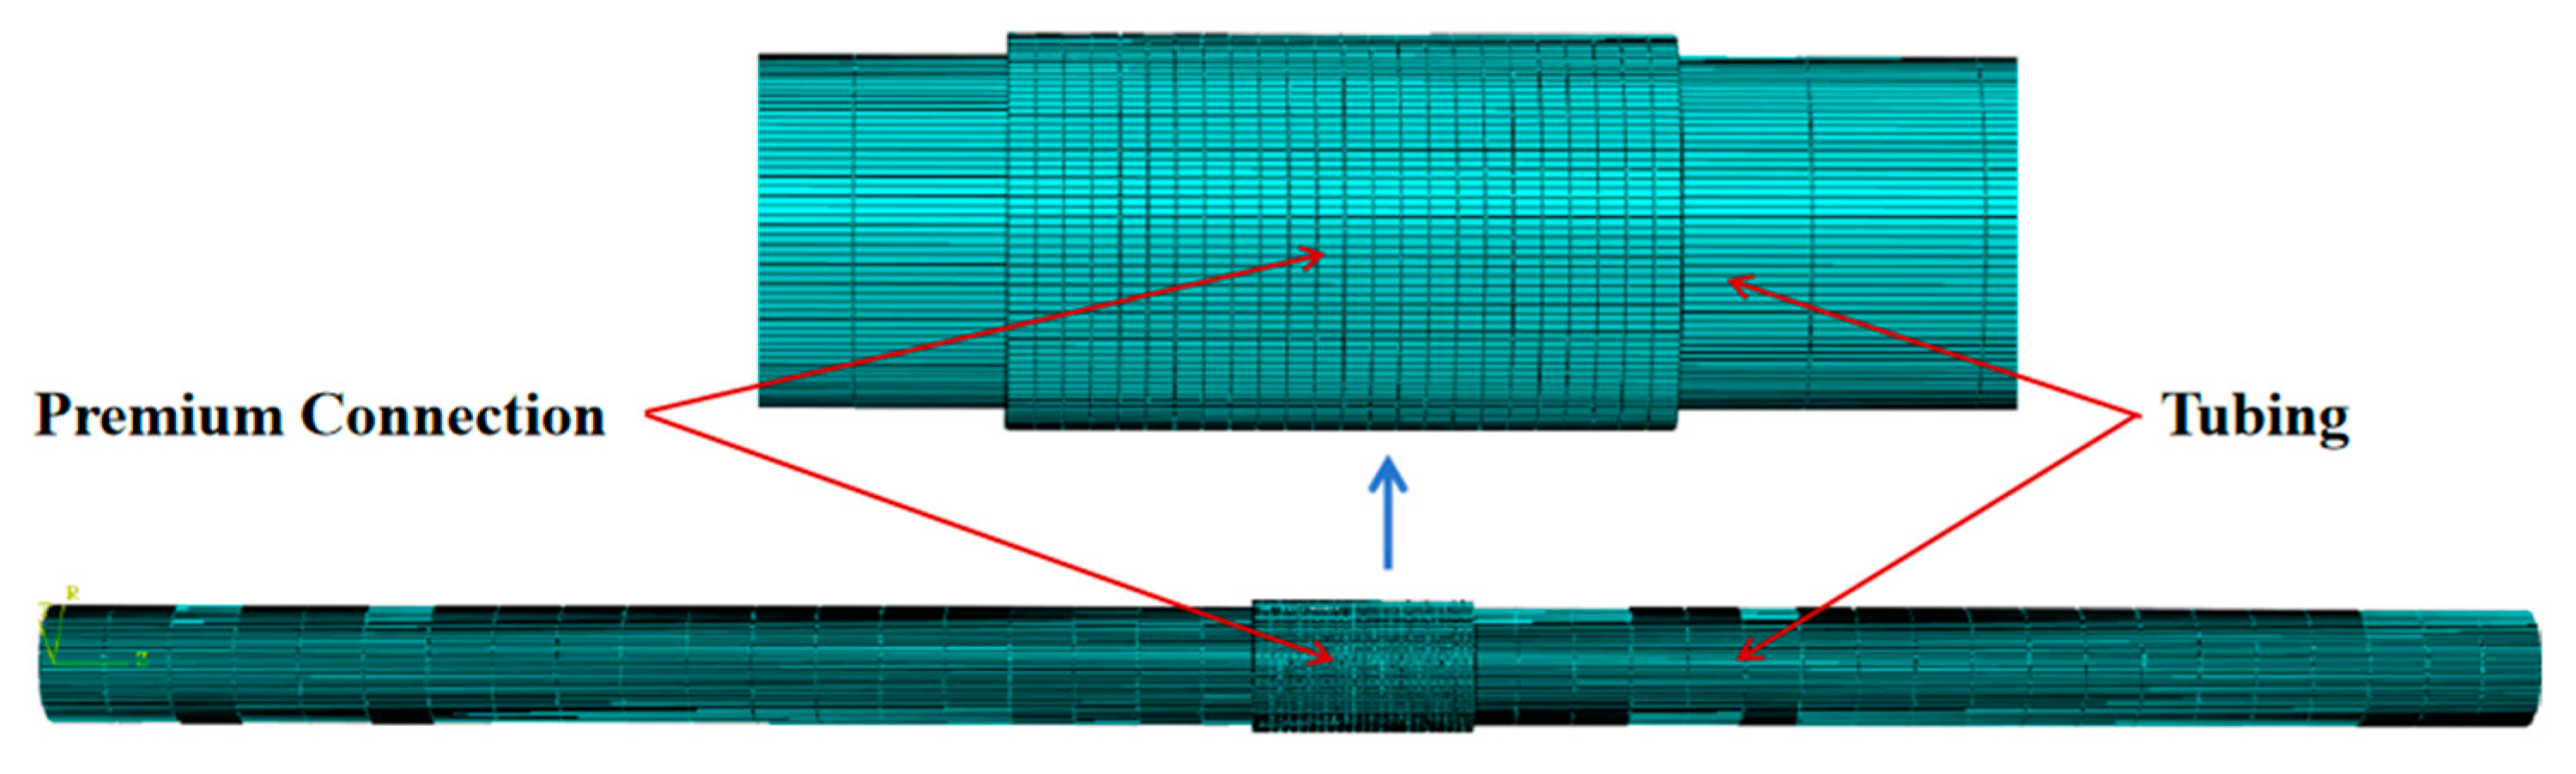
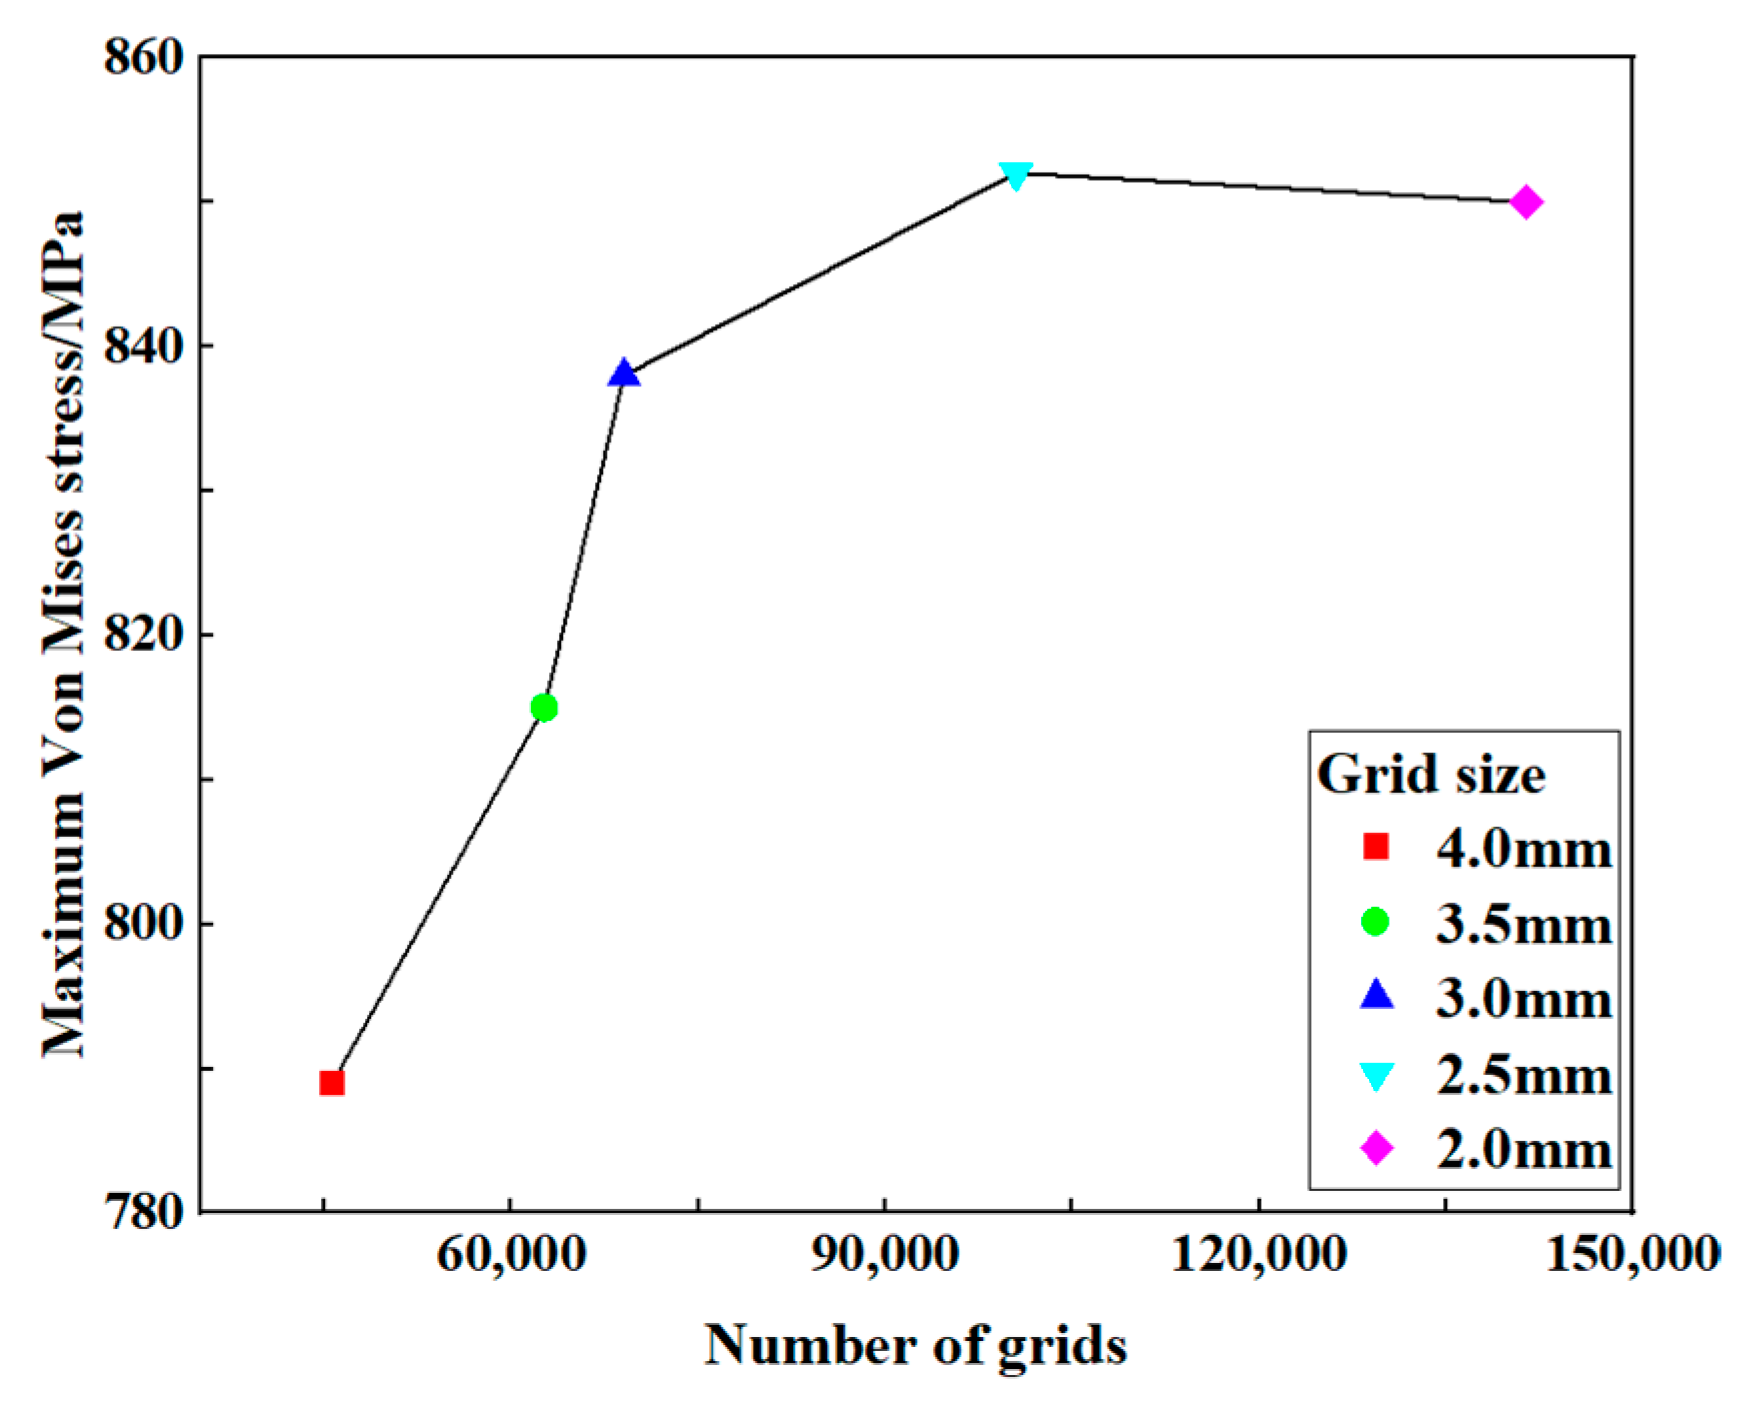
2.2. Establish a Finite Element Model of the Premium Connection
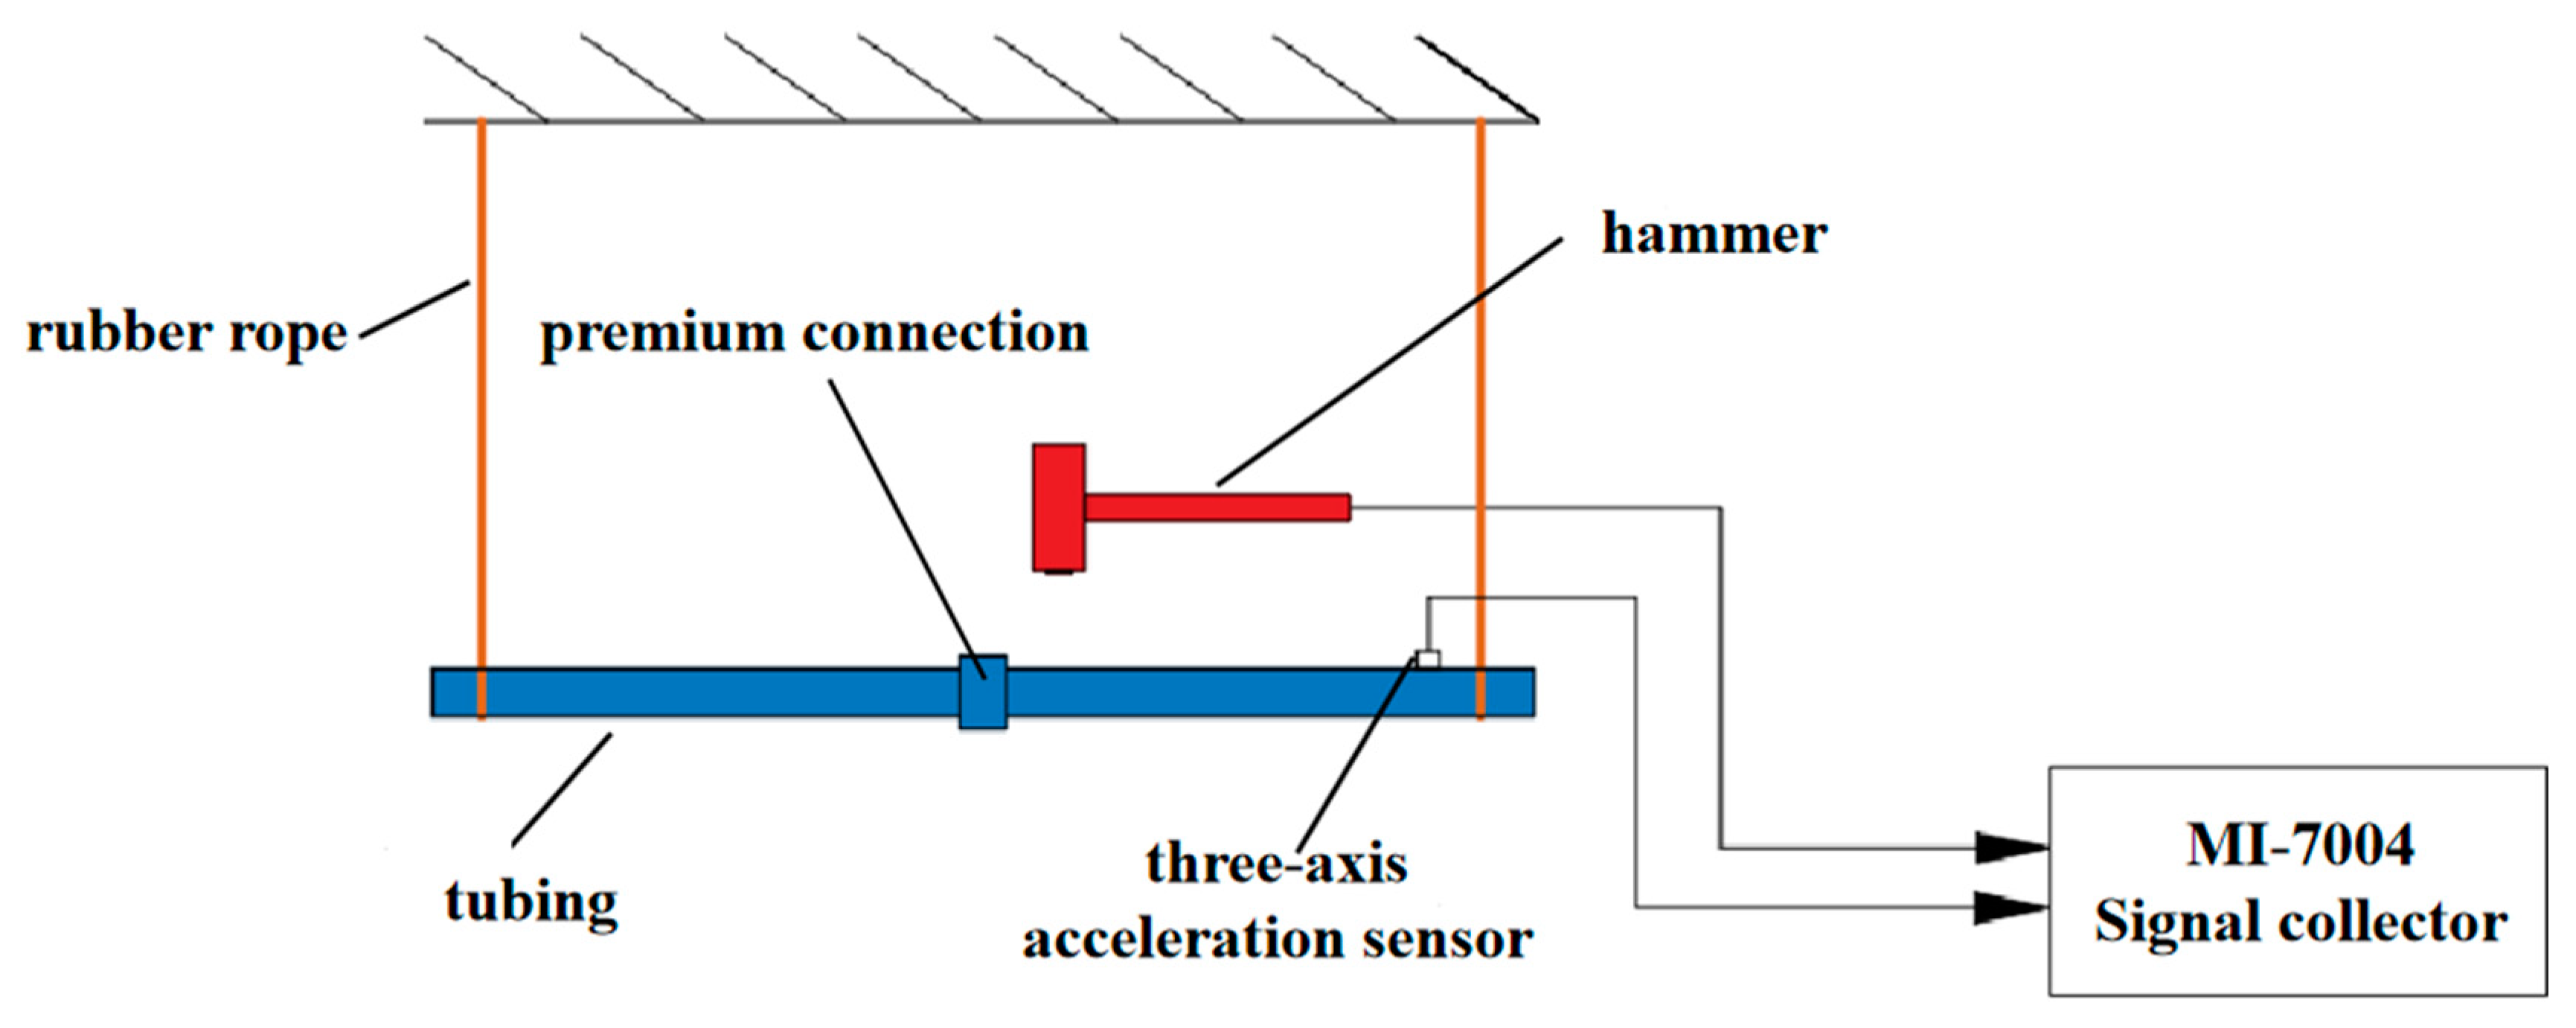
2.3. Modal Analysis Testing of the Premium Connection
2.4. Method of Energy Dissipation and Sealing Performance Analysis of the Premium Connection
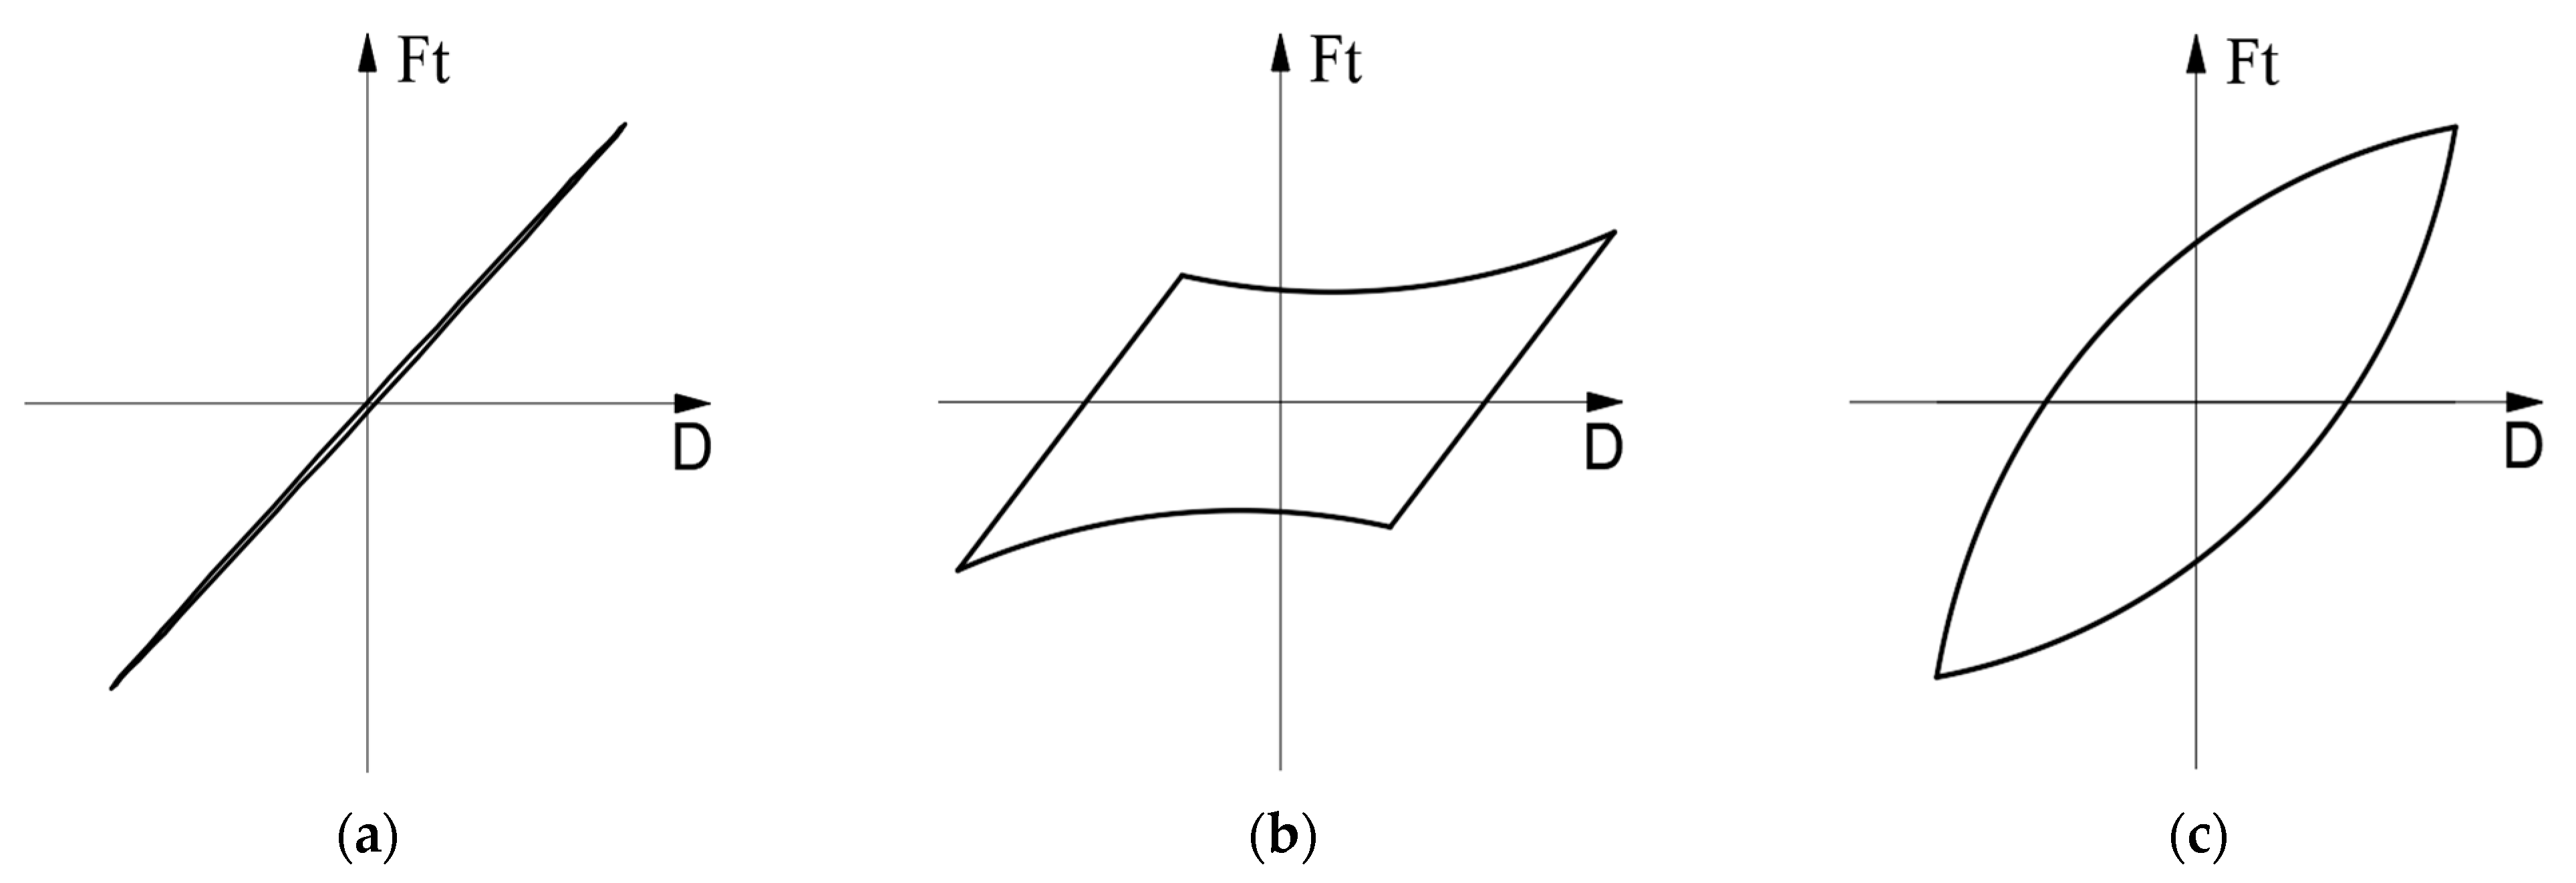
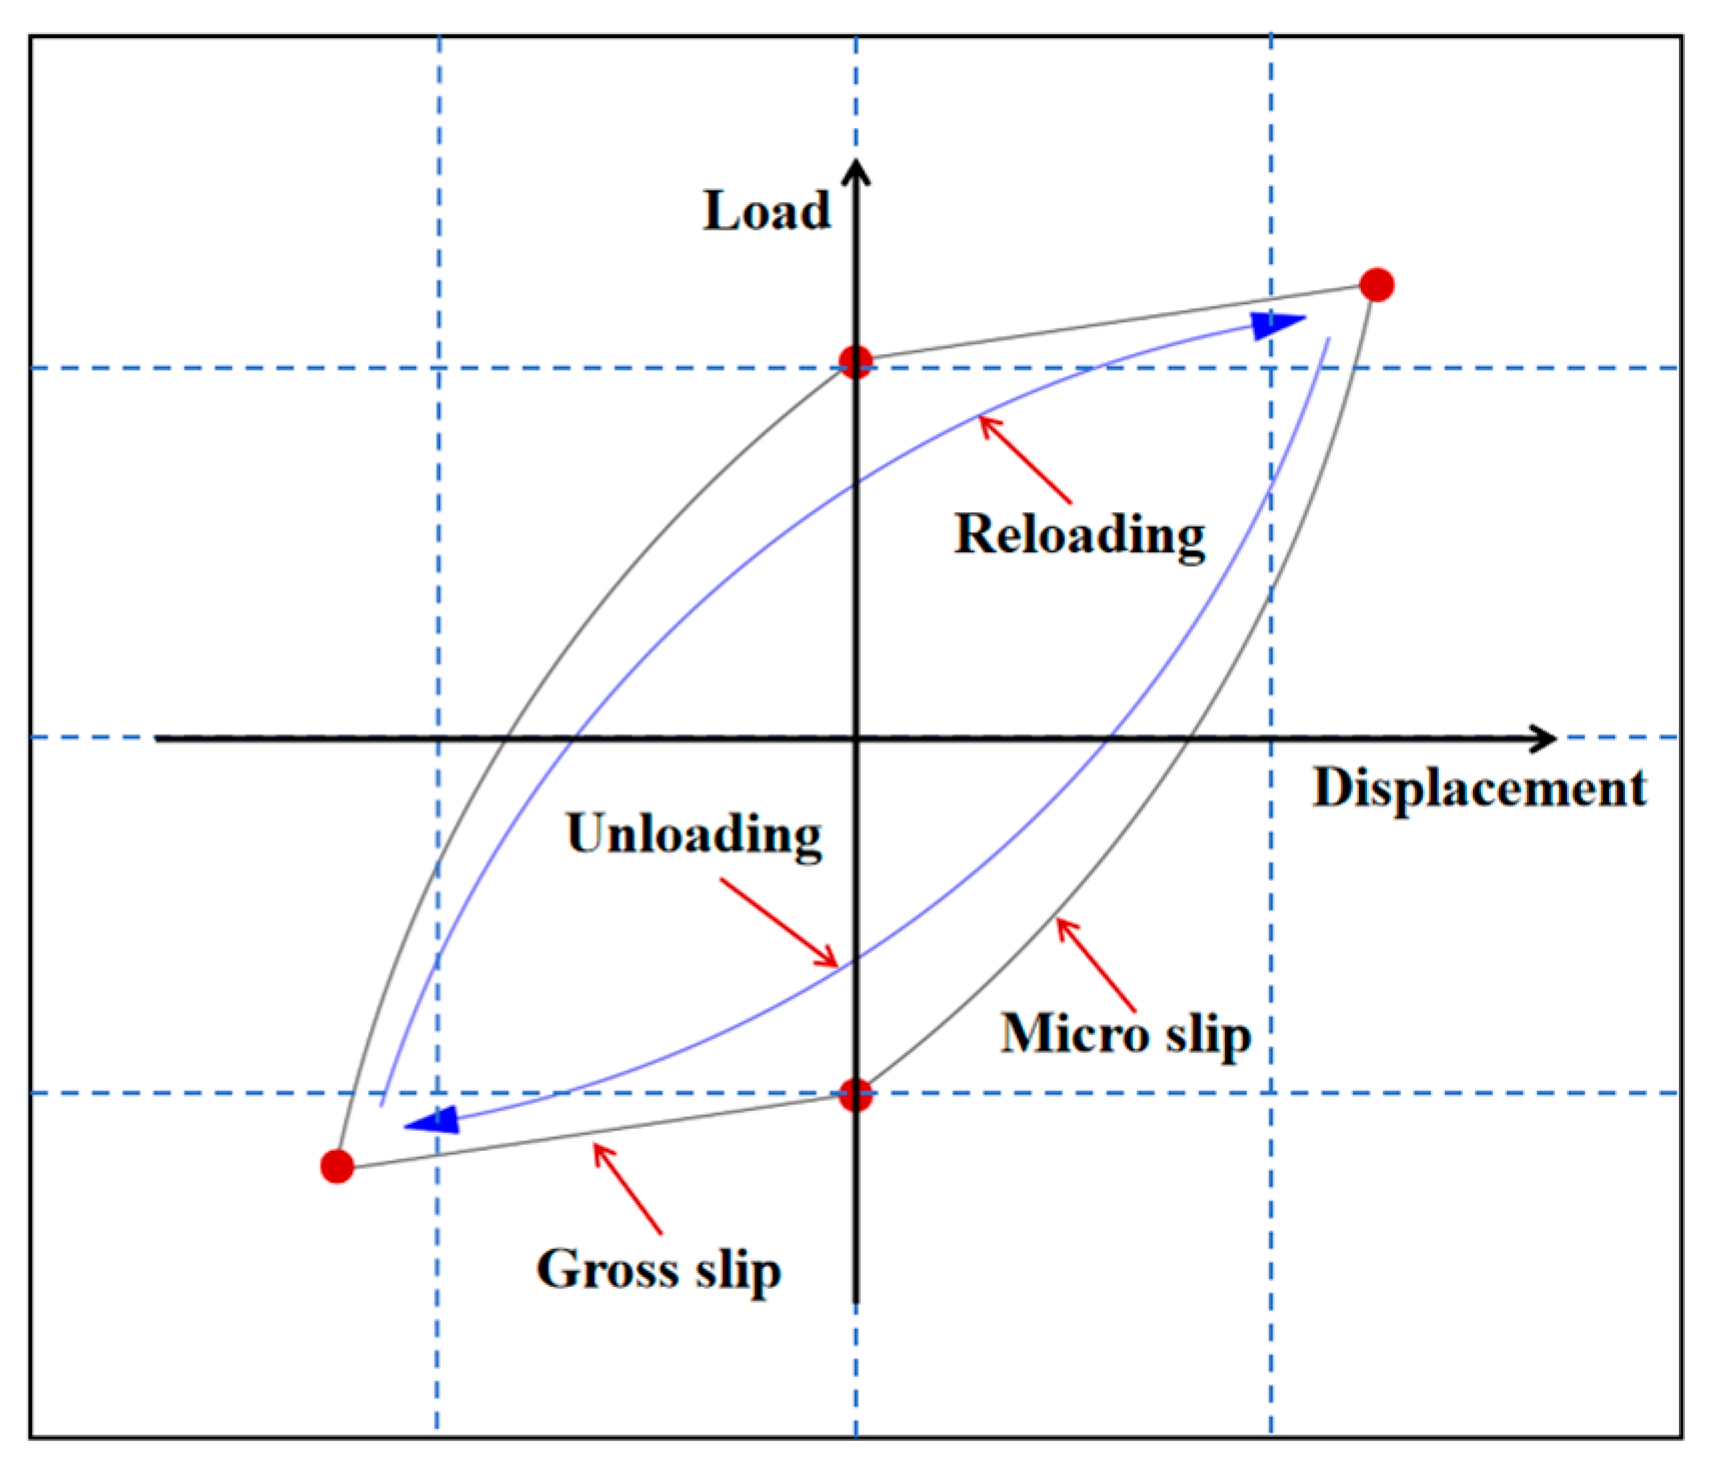
2.4.1. Method of Energy Dissipation Analysis
2.4.2. Sealing Performance Analysis Method
3. Result and Discussion
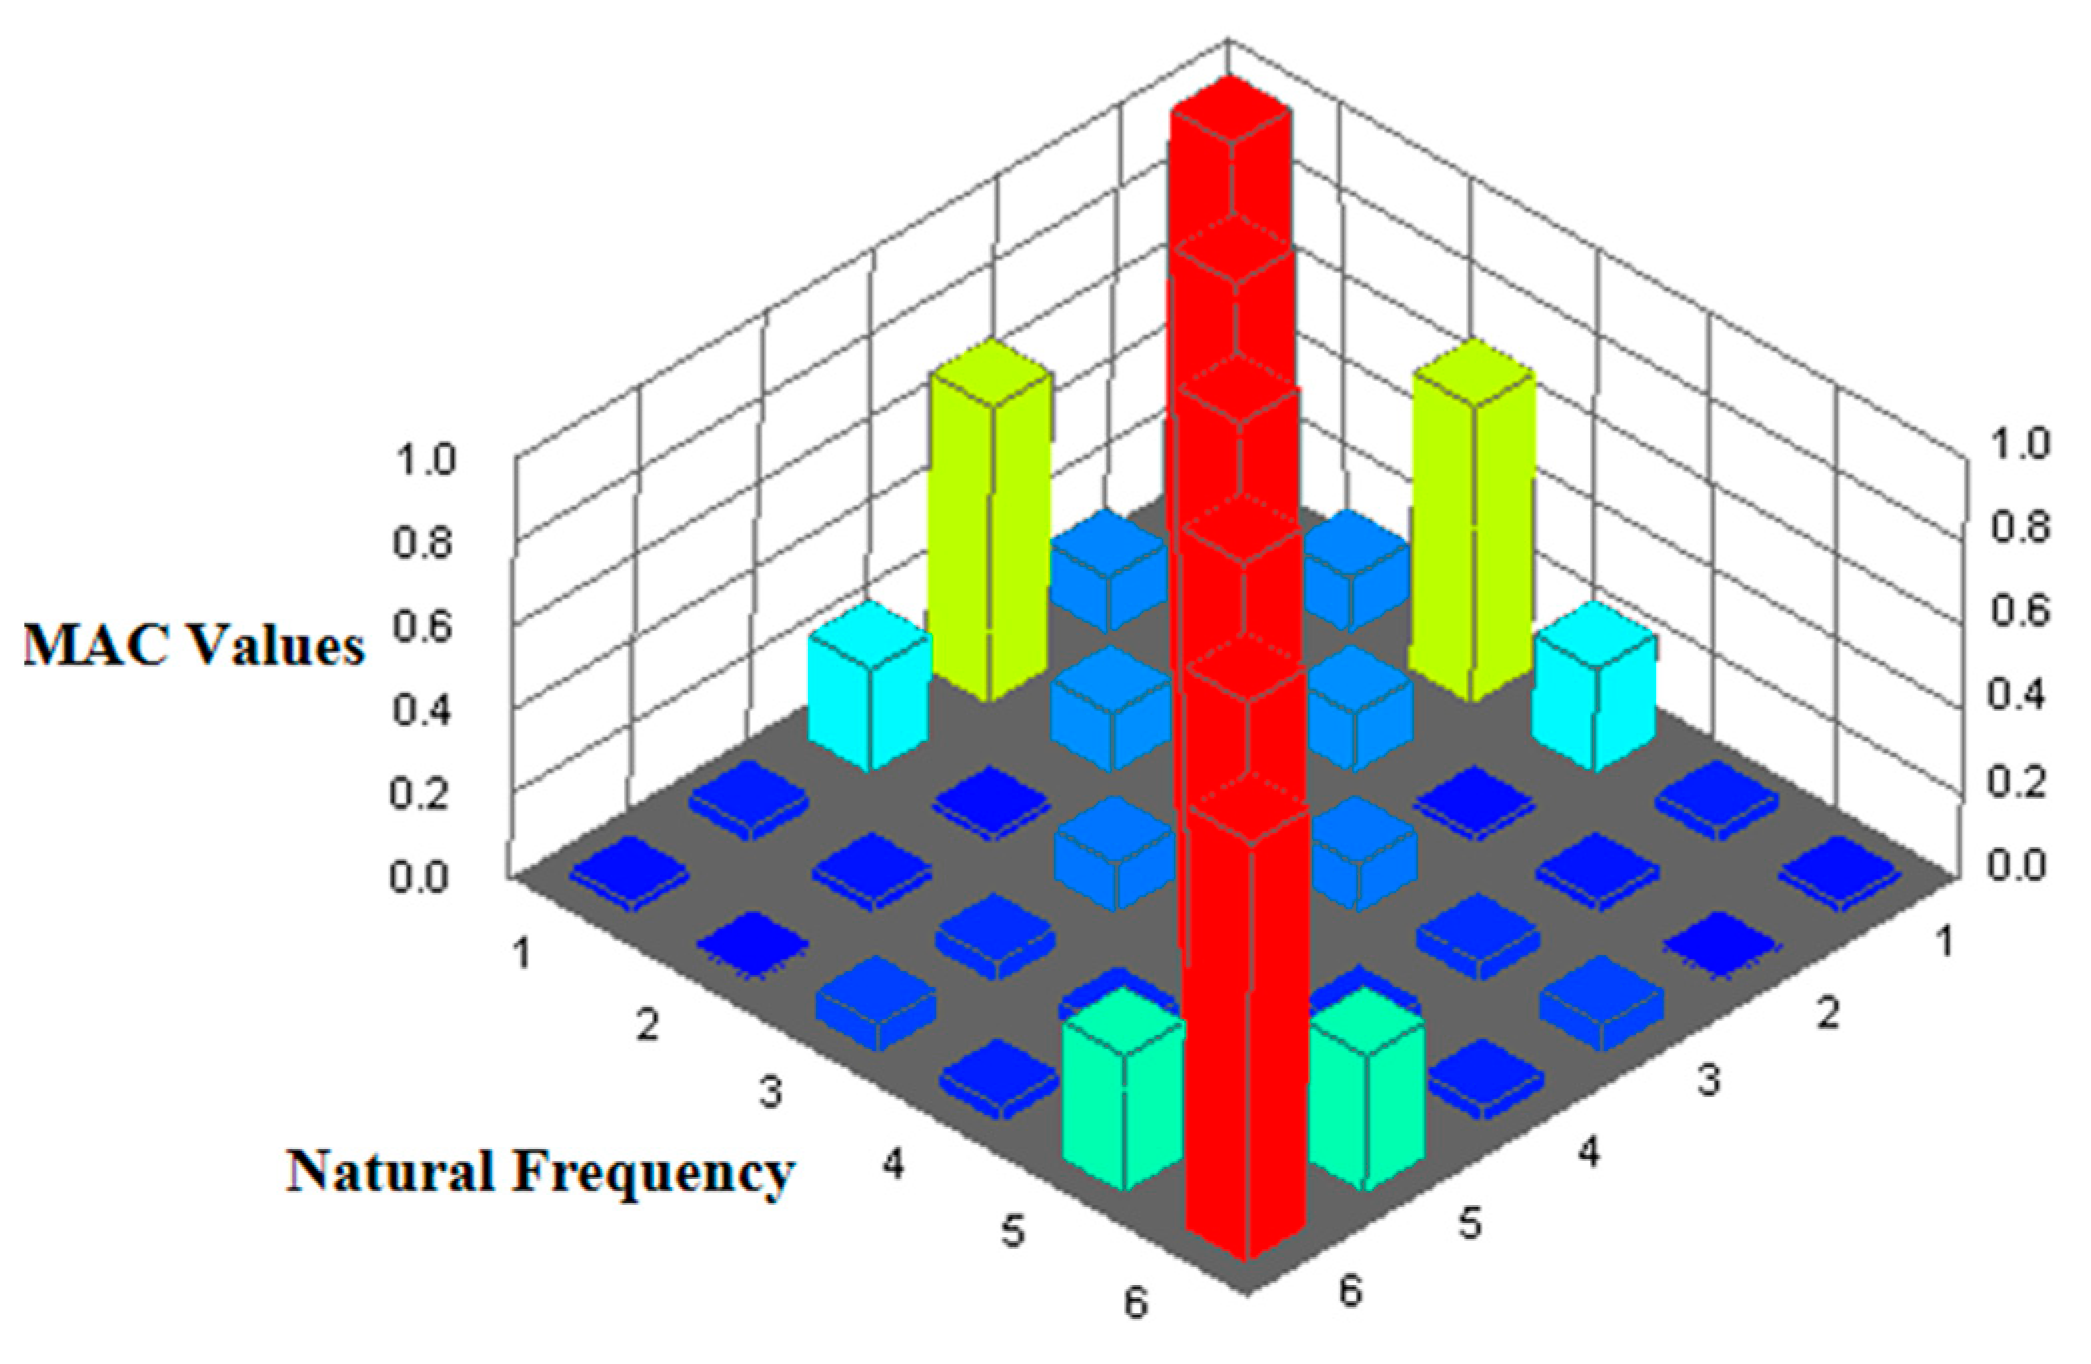
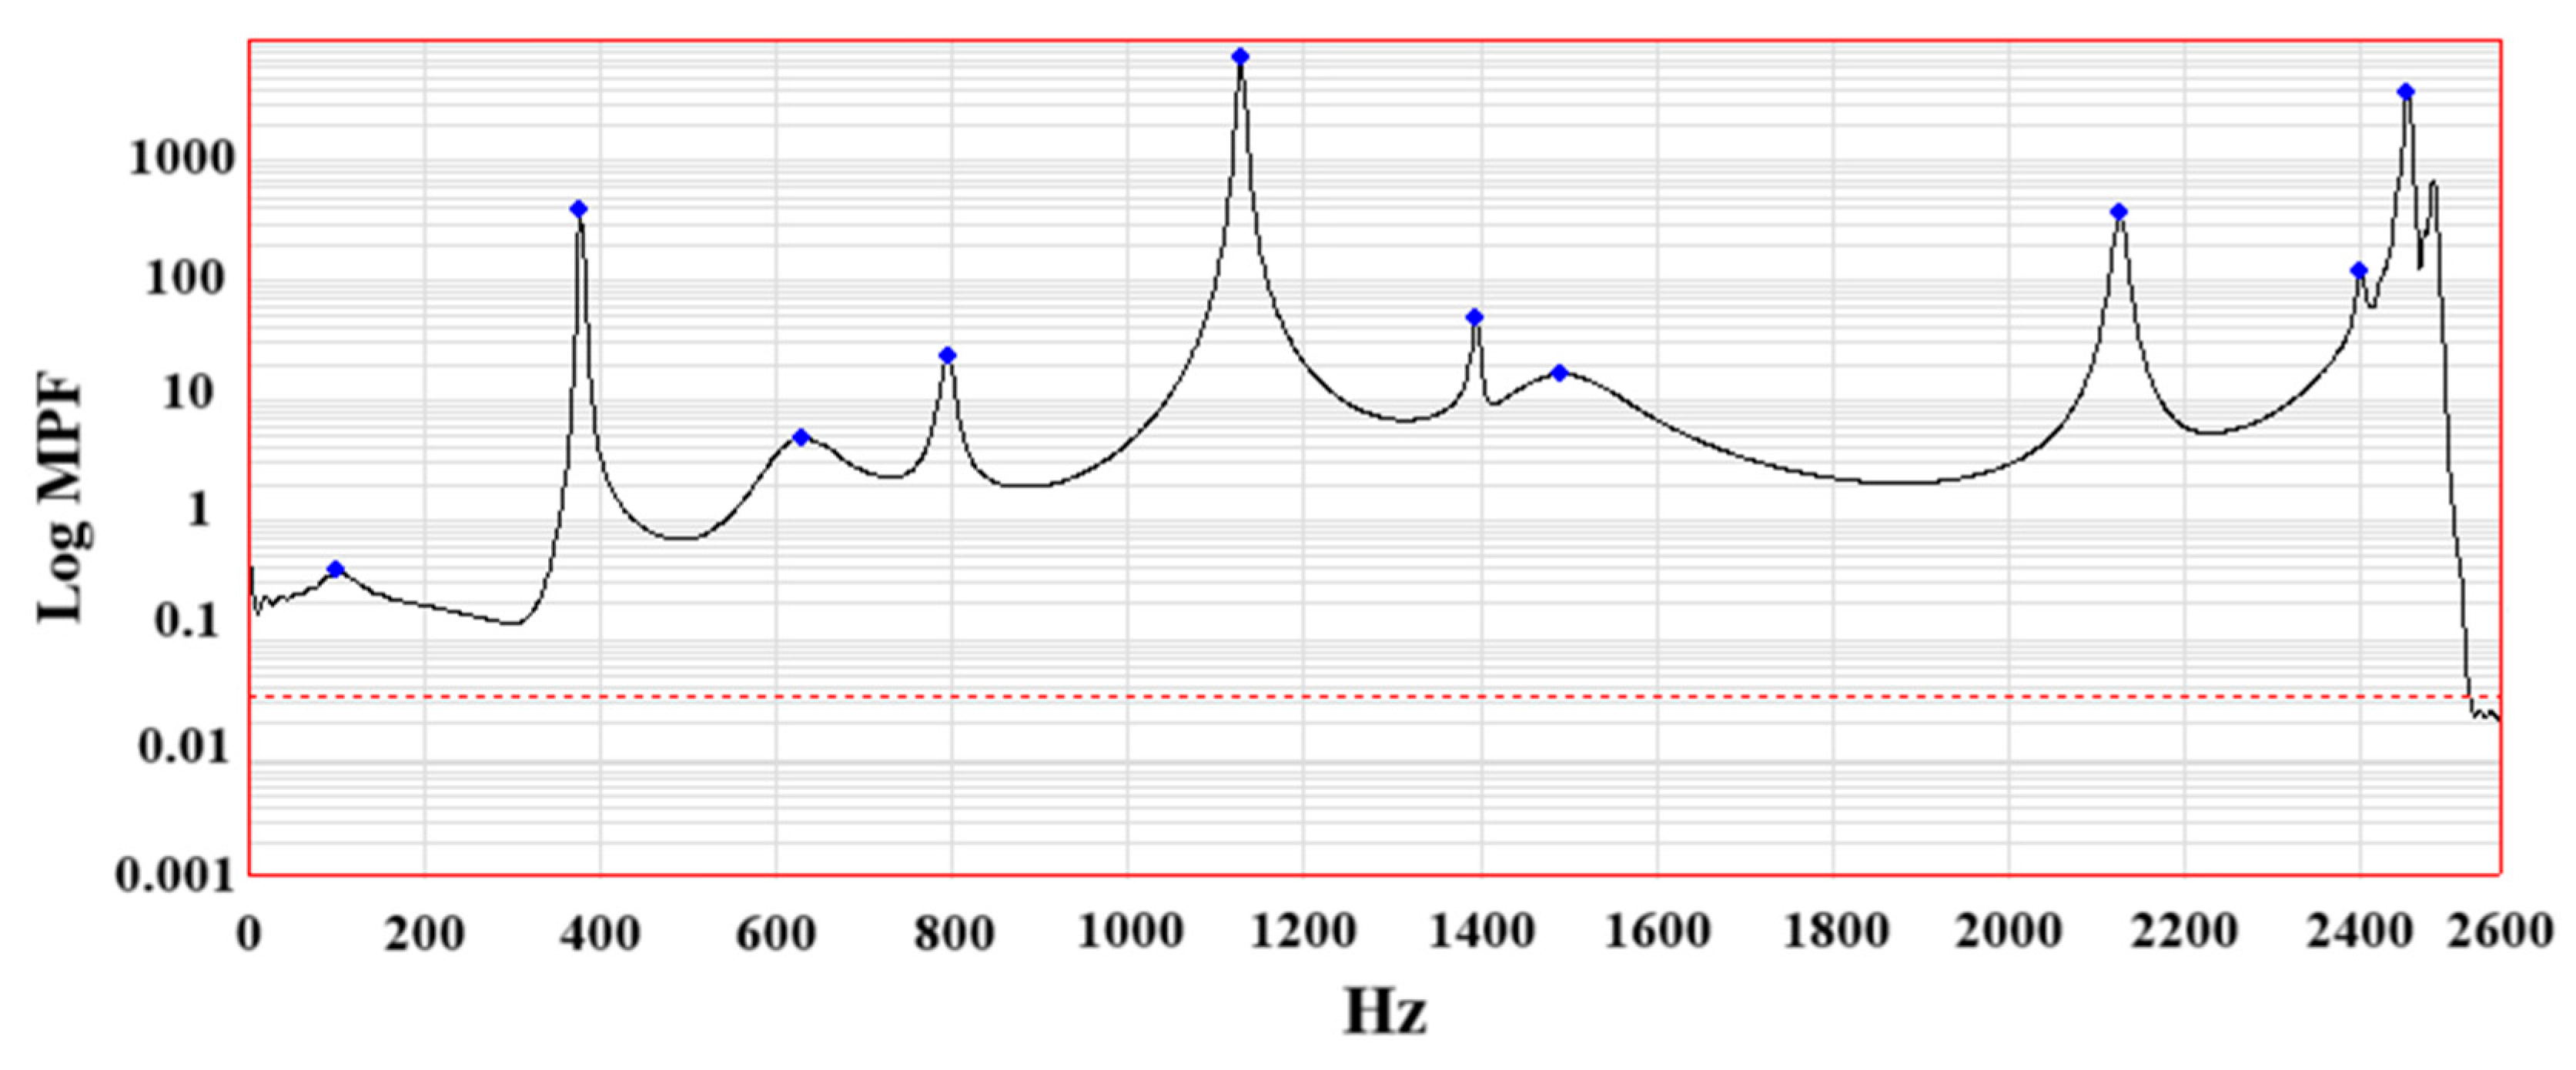
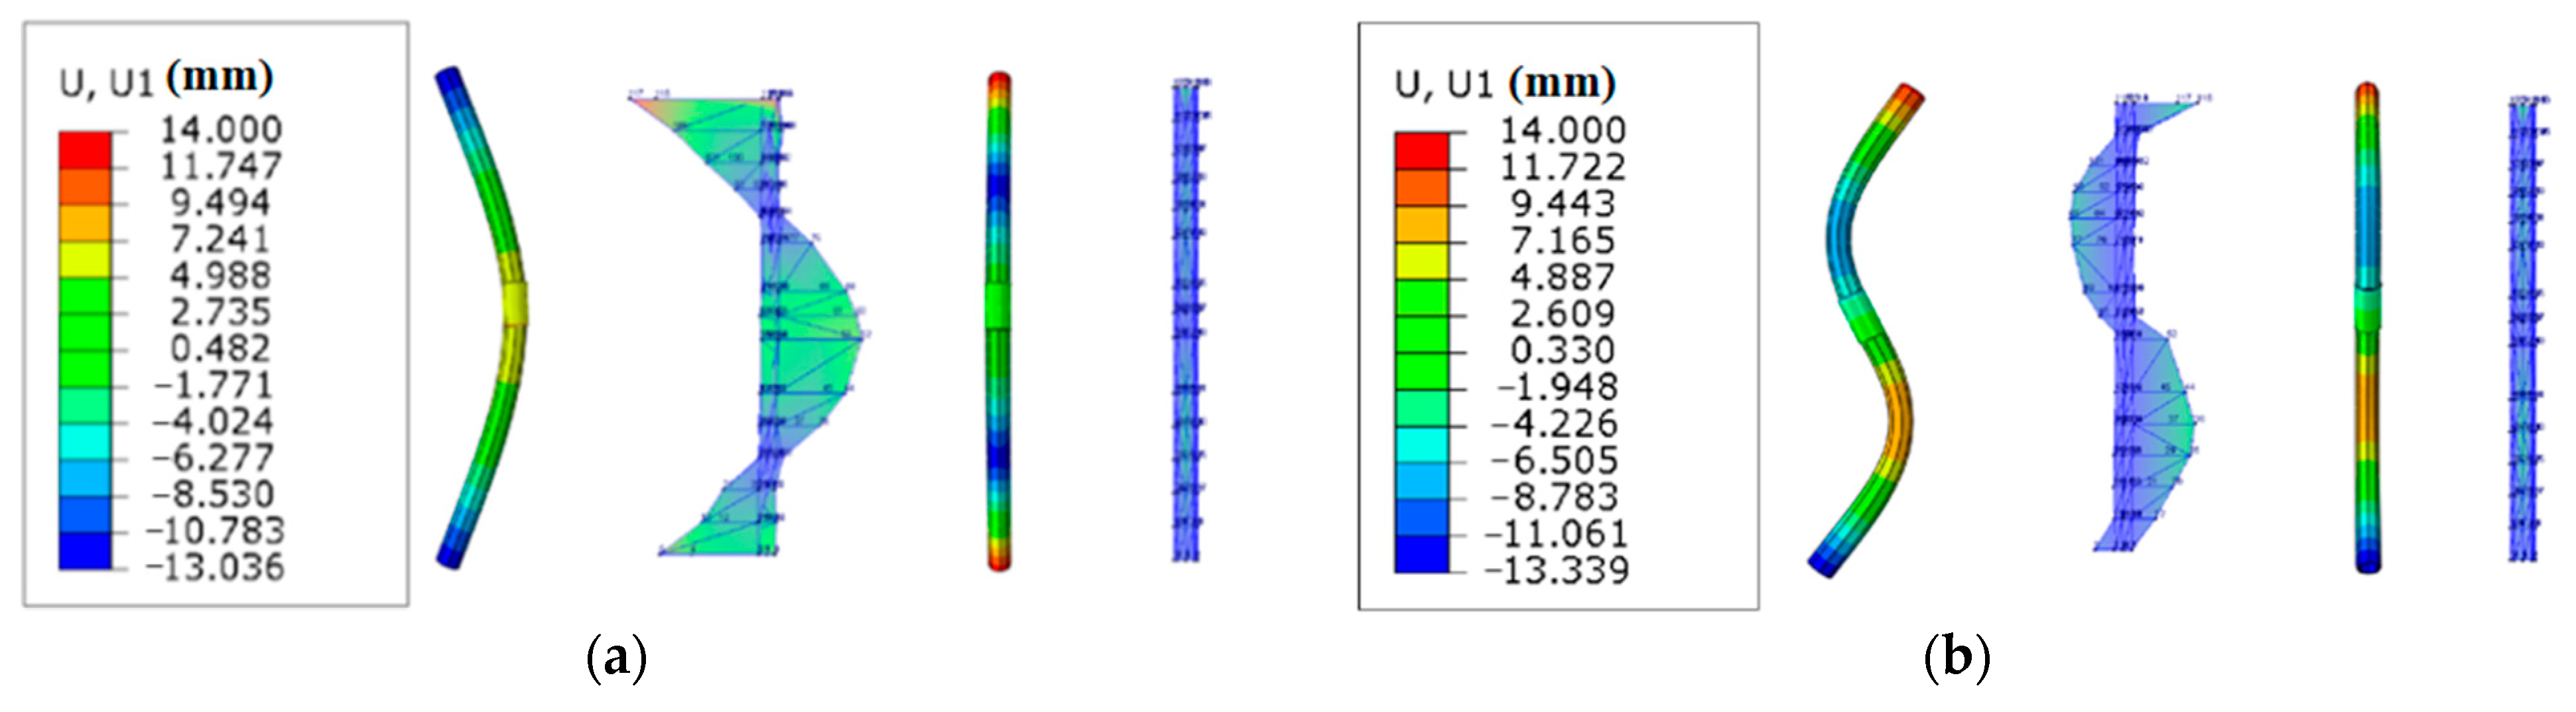
3.1. Modal Analysis and Model Validation of the Premium Connection
3.2. Energy Dissipation Analysis of the Premium Connection Under Modal Shapes
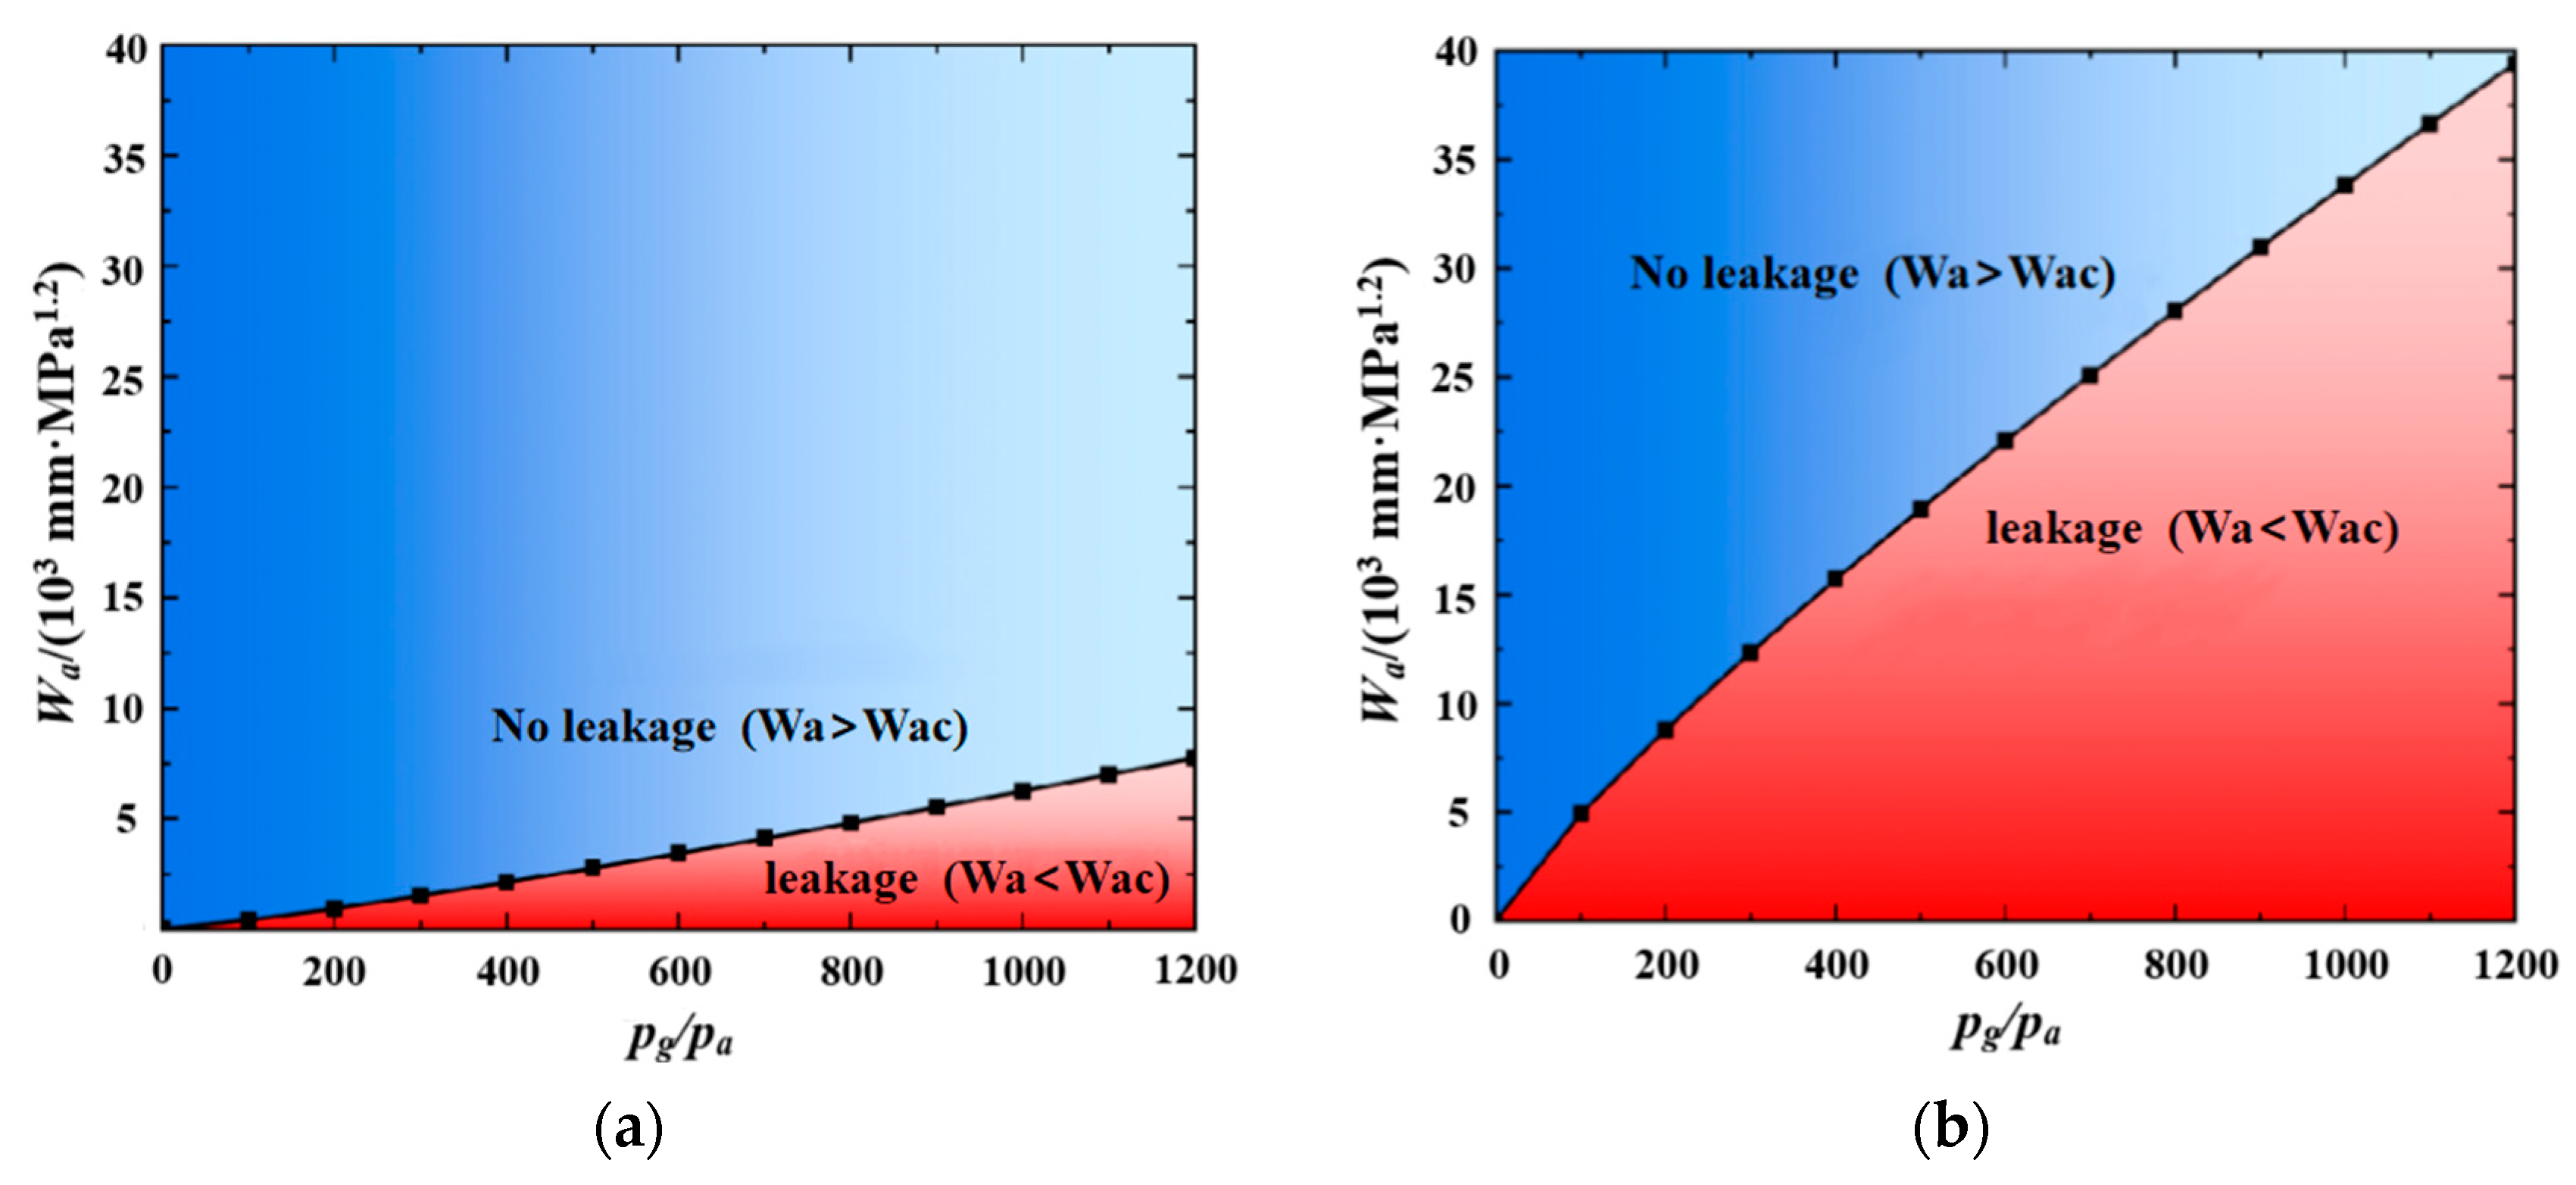
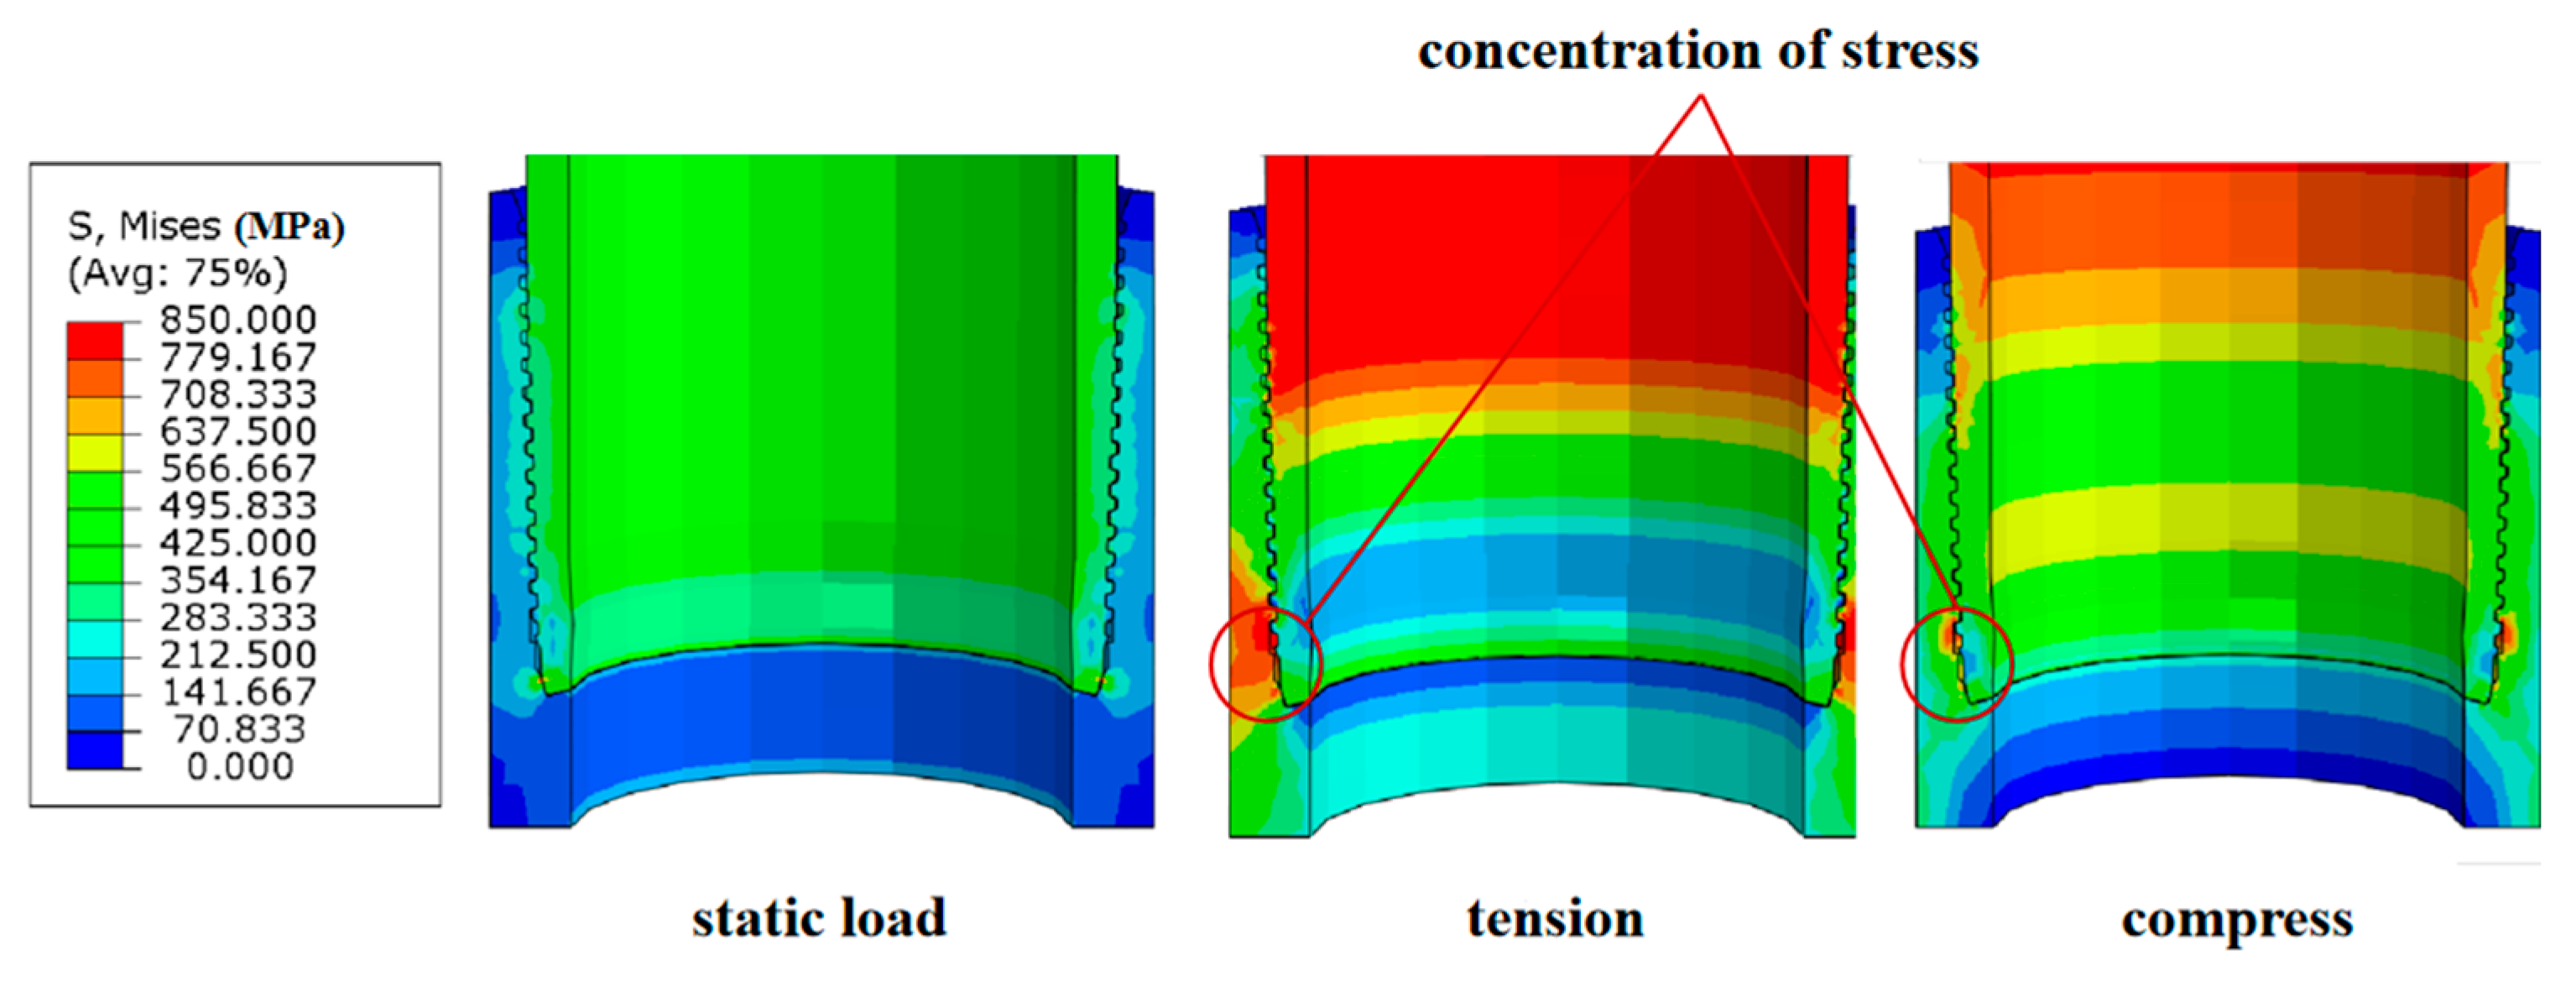
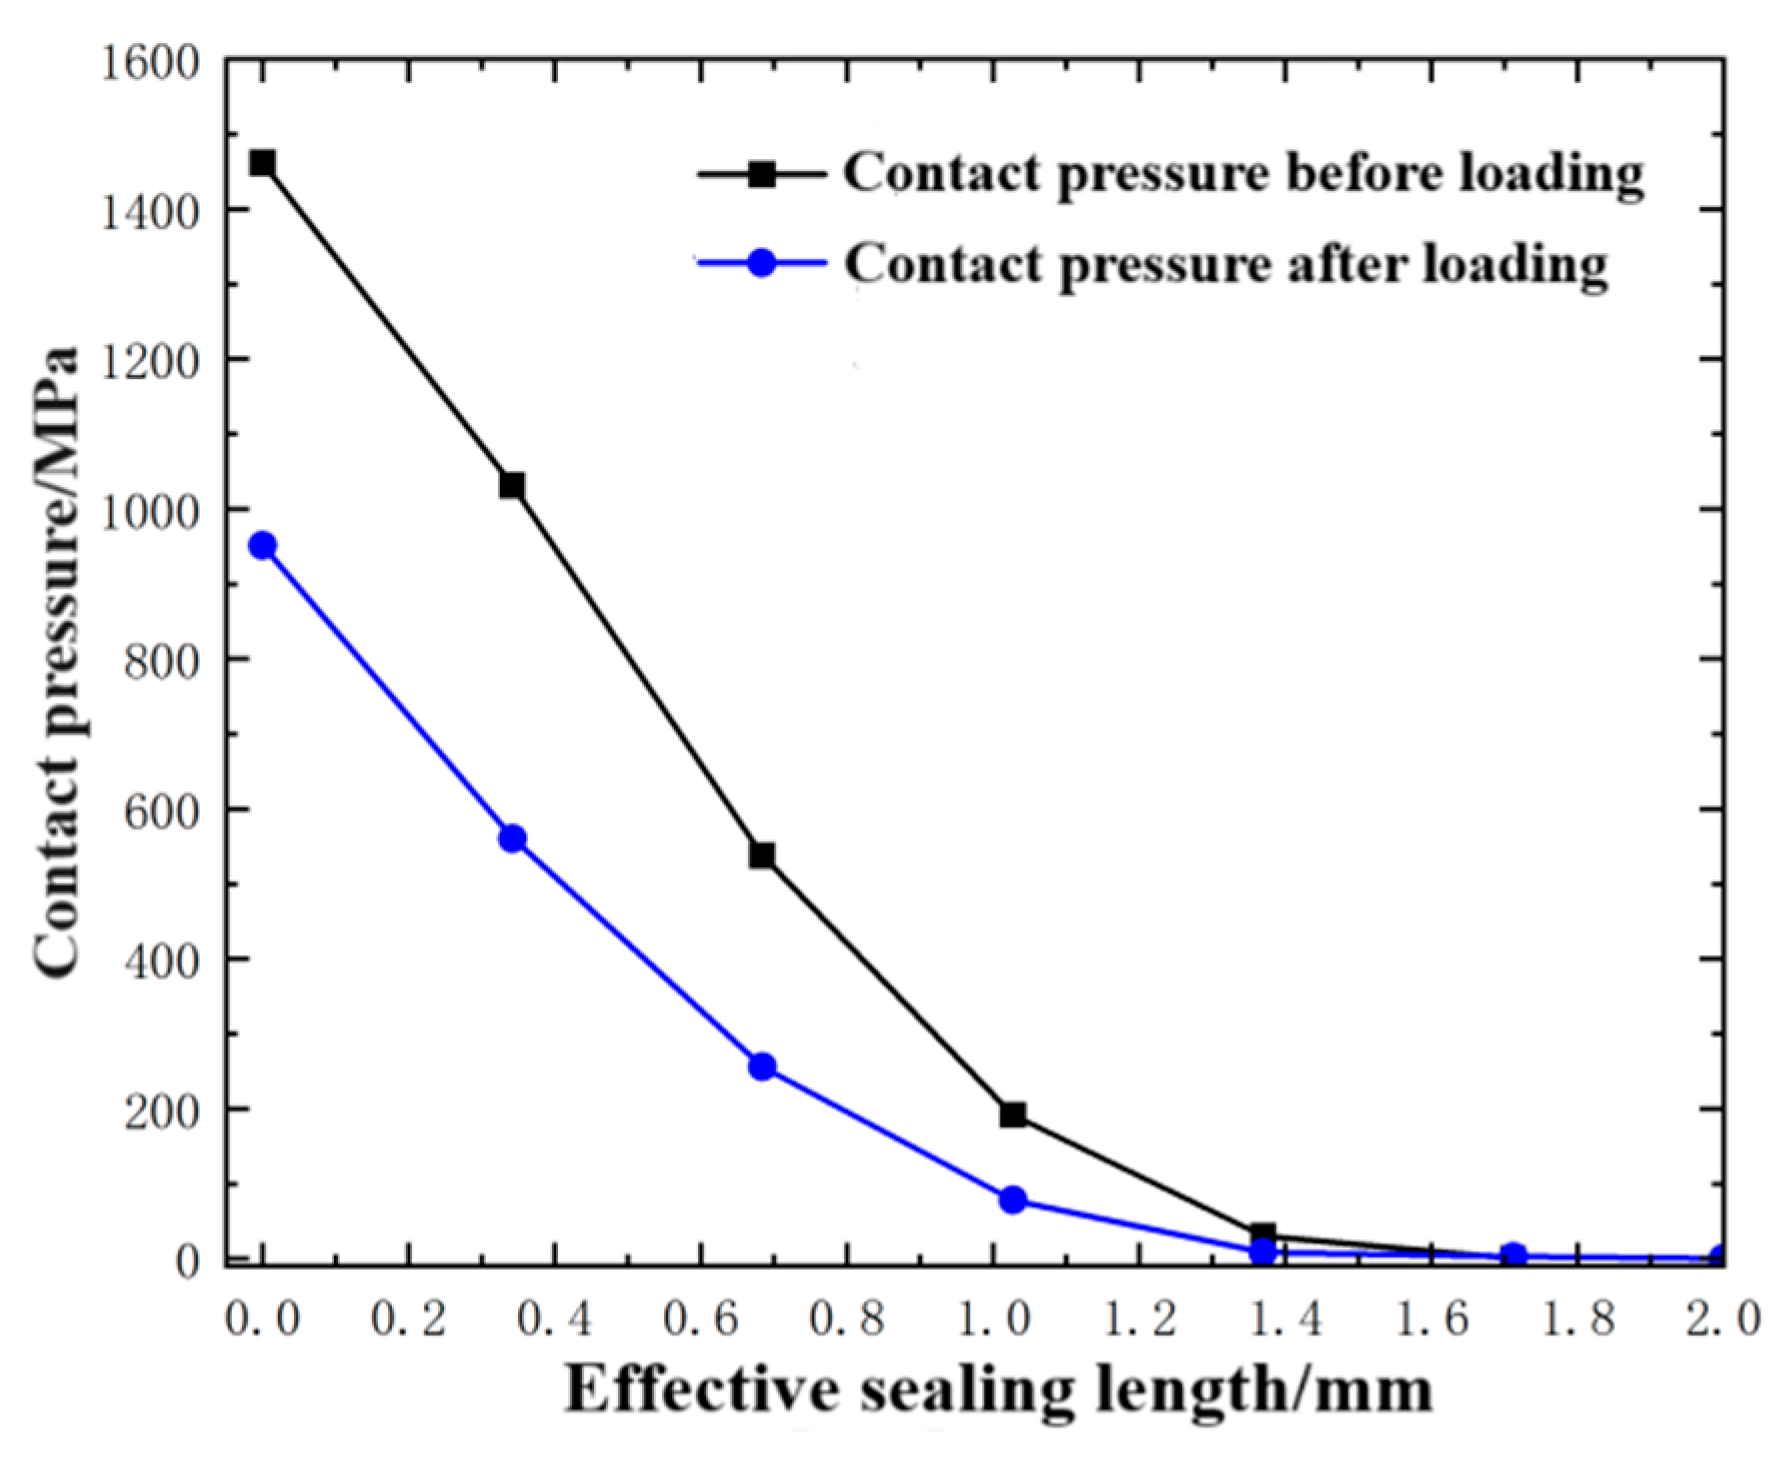
3.3. Sealing Performance Analysis of the Premium Connection Under Modal Shapes
4. Conclusions
- (1)
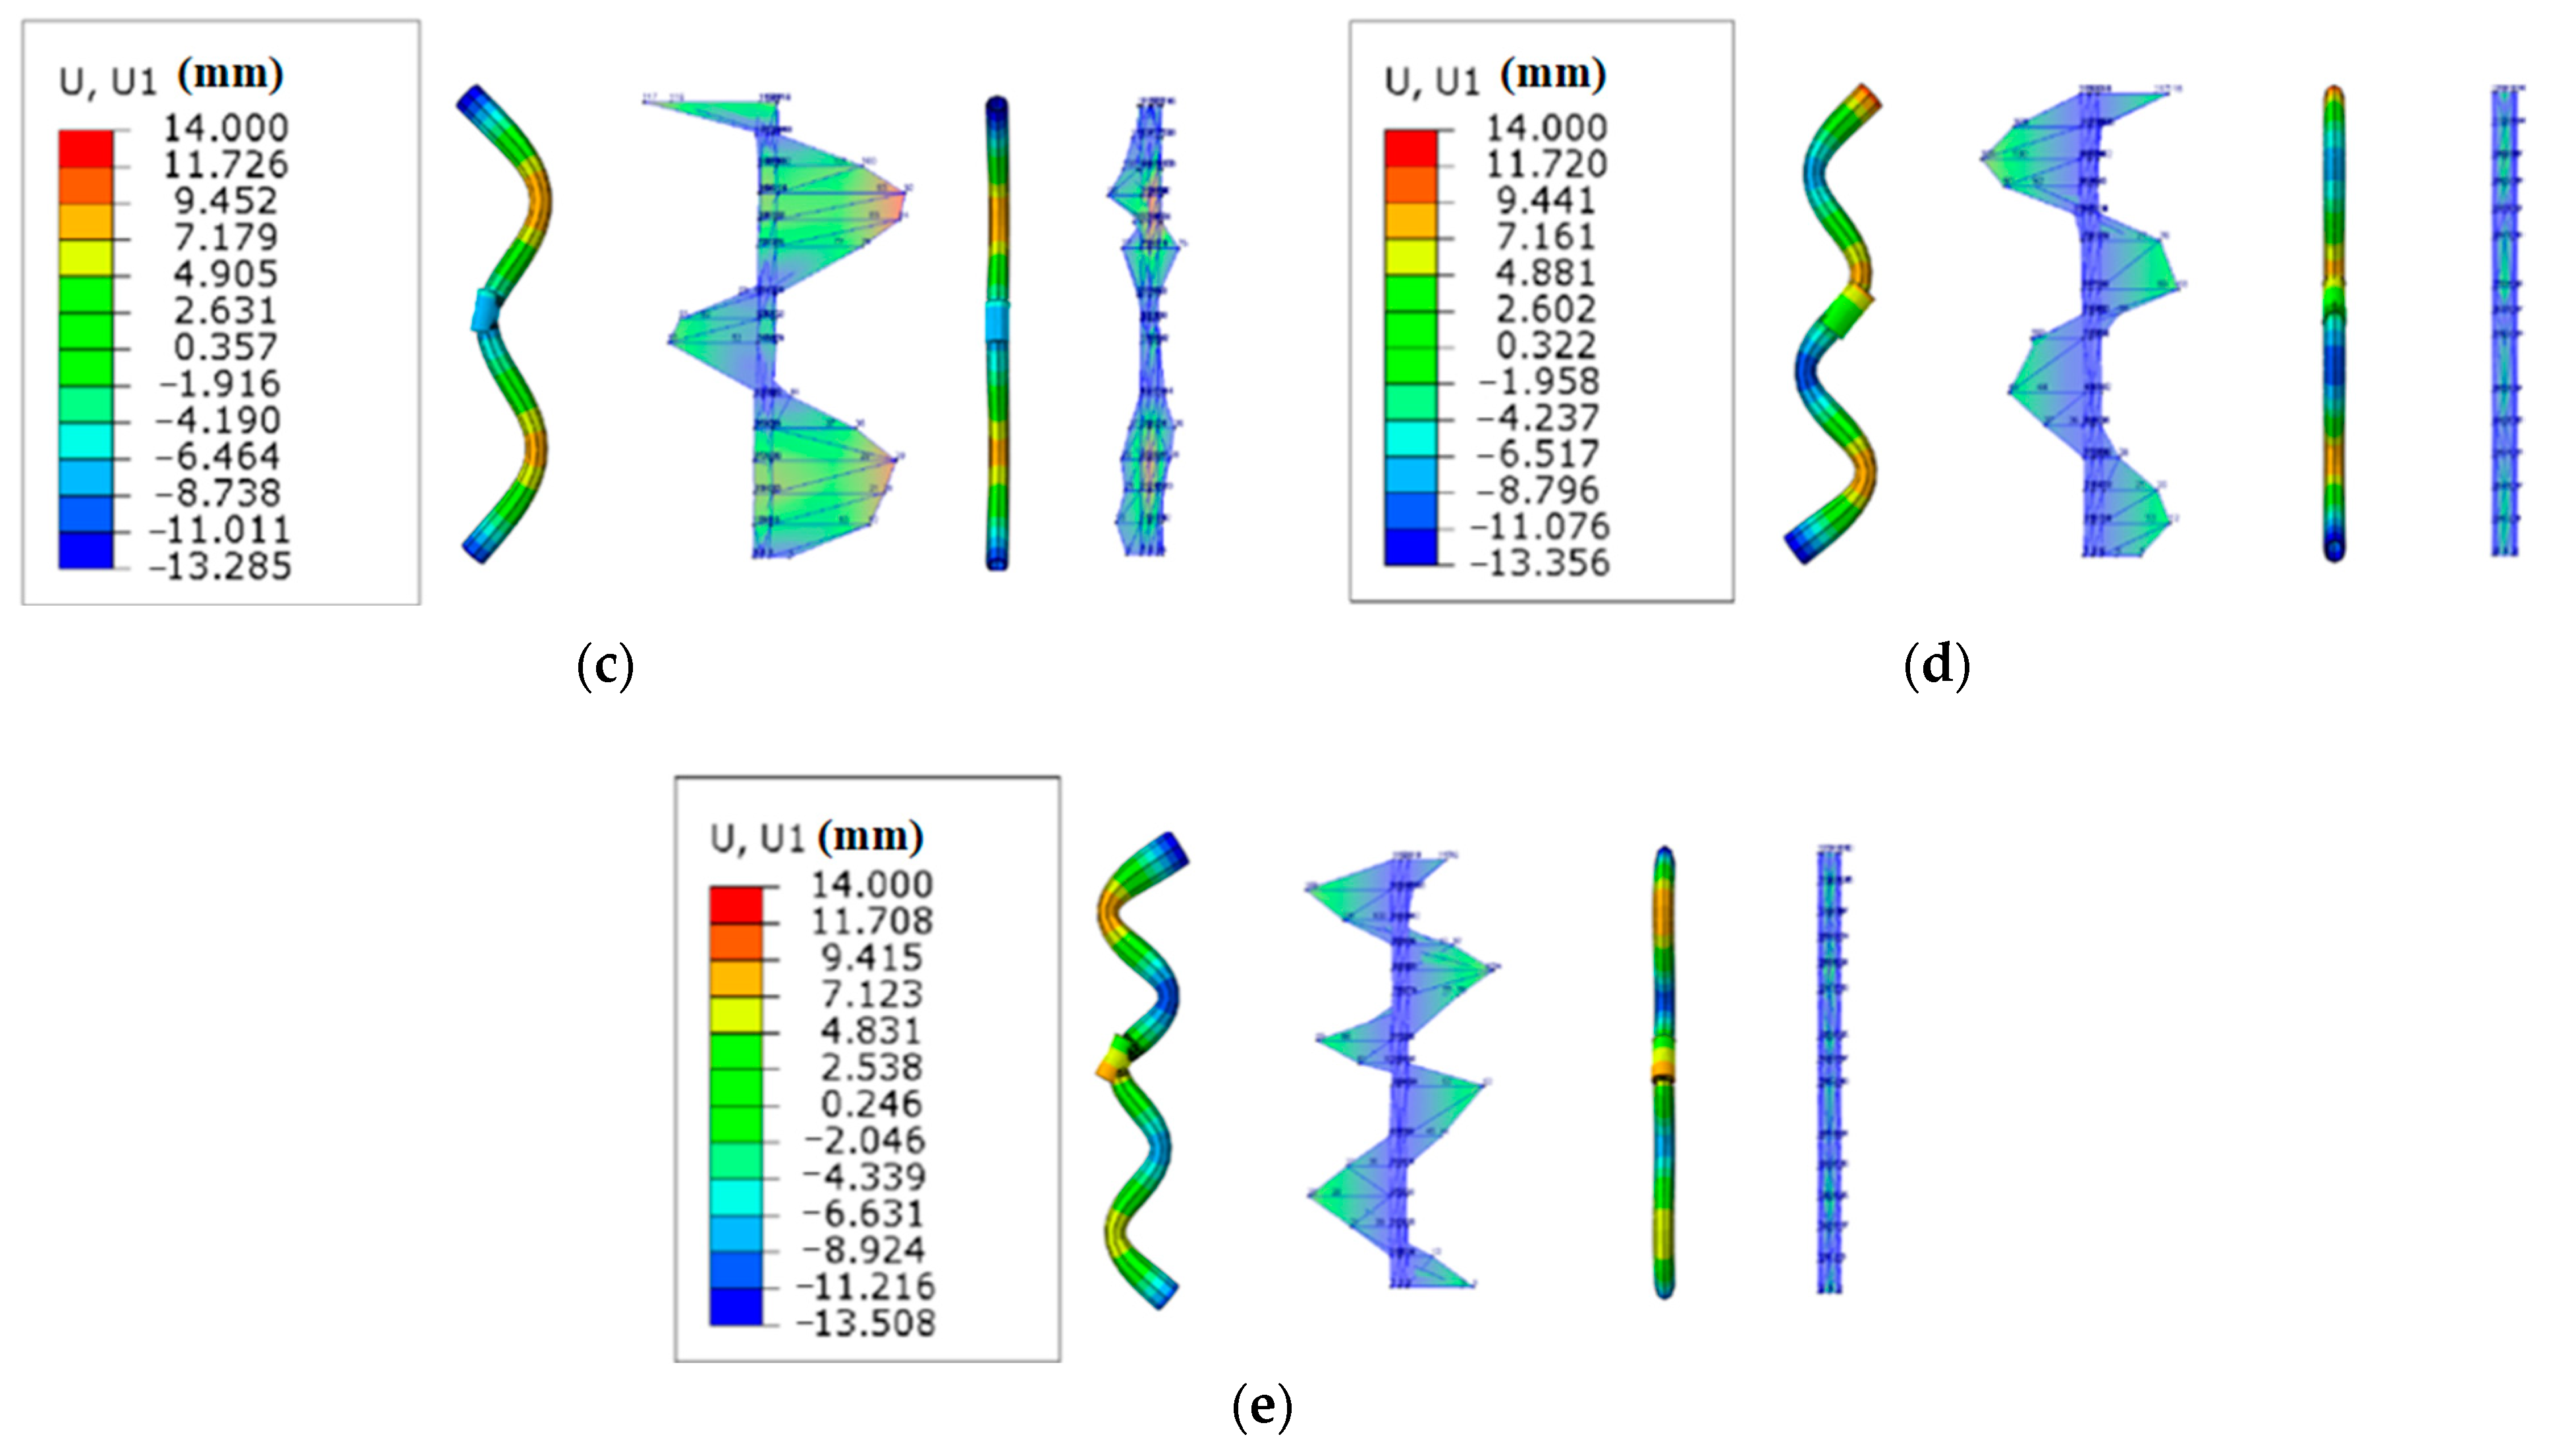
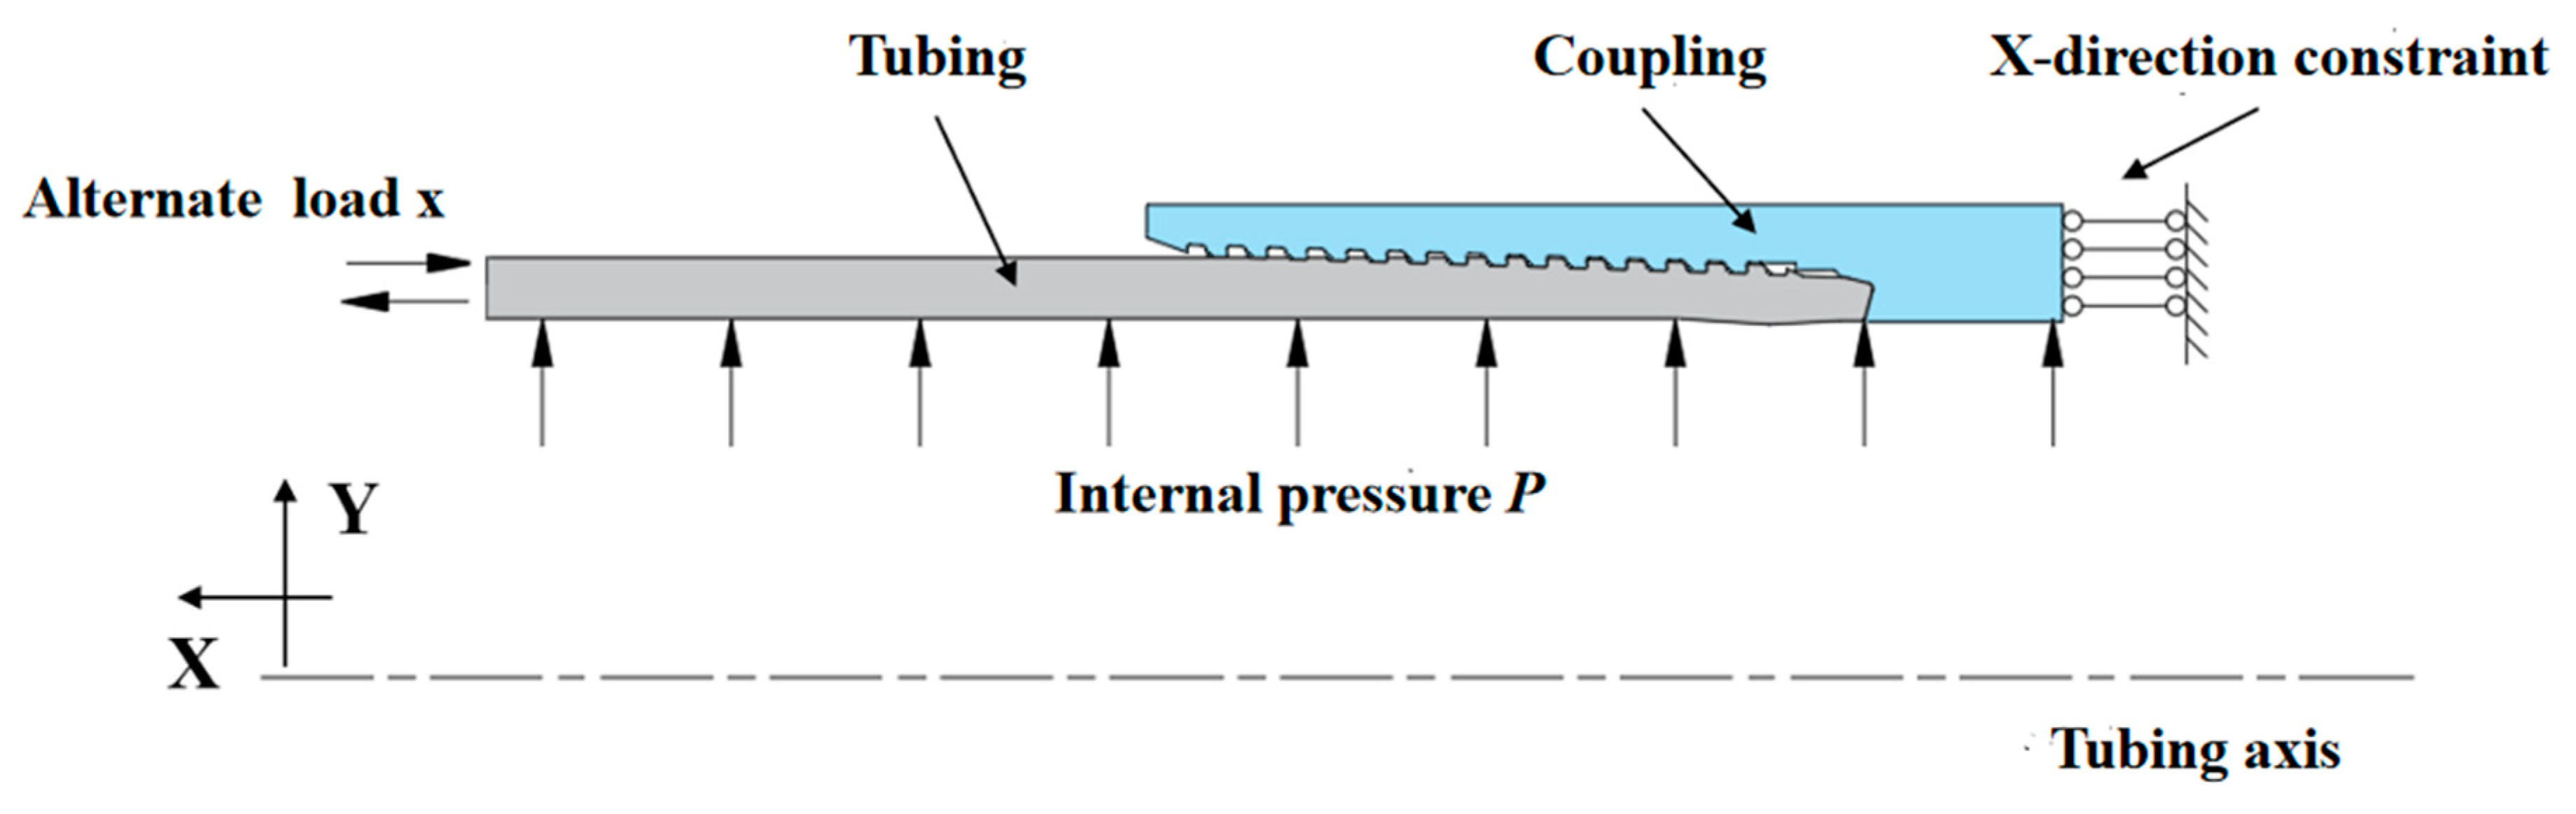
- The finite element analysis shows that the vibration modes of the first five natural frequencies mainly occur in the x-axis direction of the tubing, and the amplitude of the vibration mode in the y-axis direction is small. The test verifies the accuracy of the finite element analysis results.
- (2)
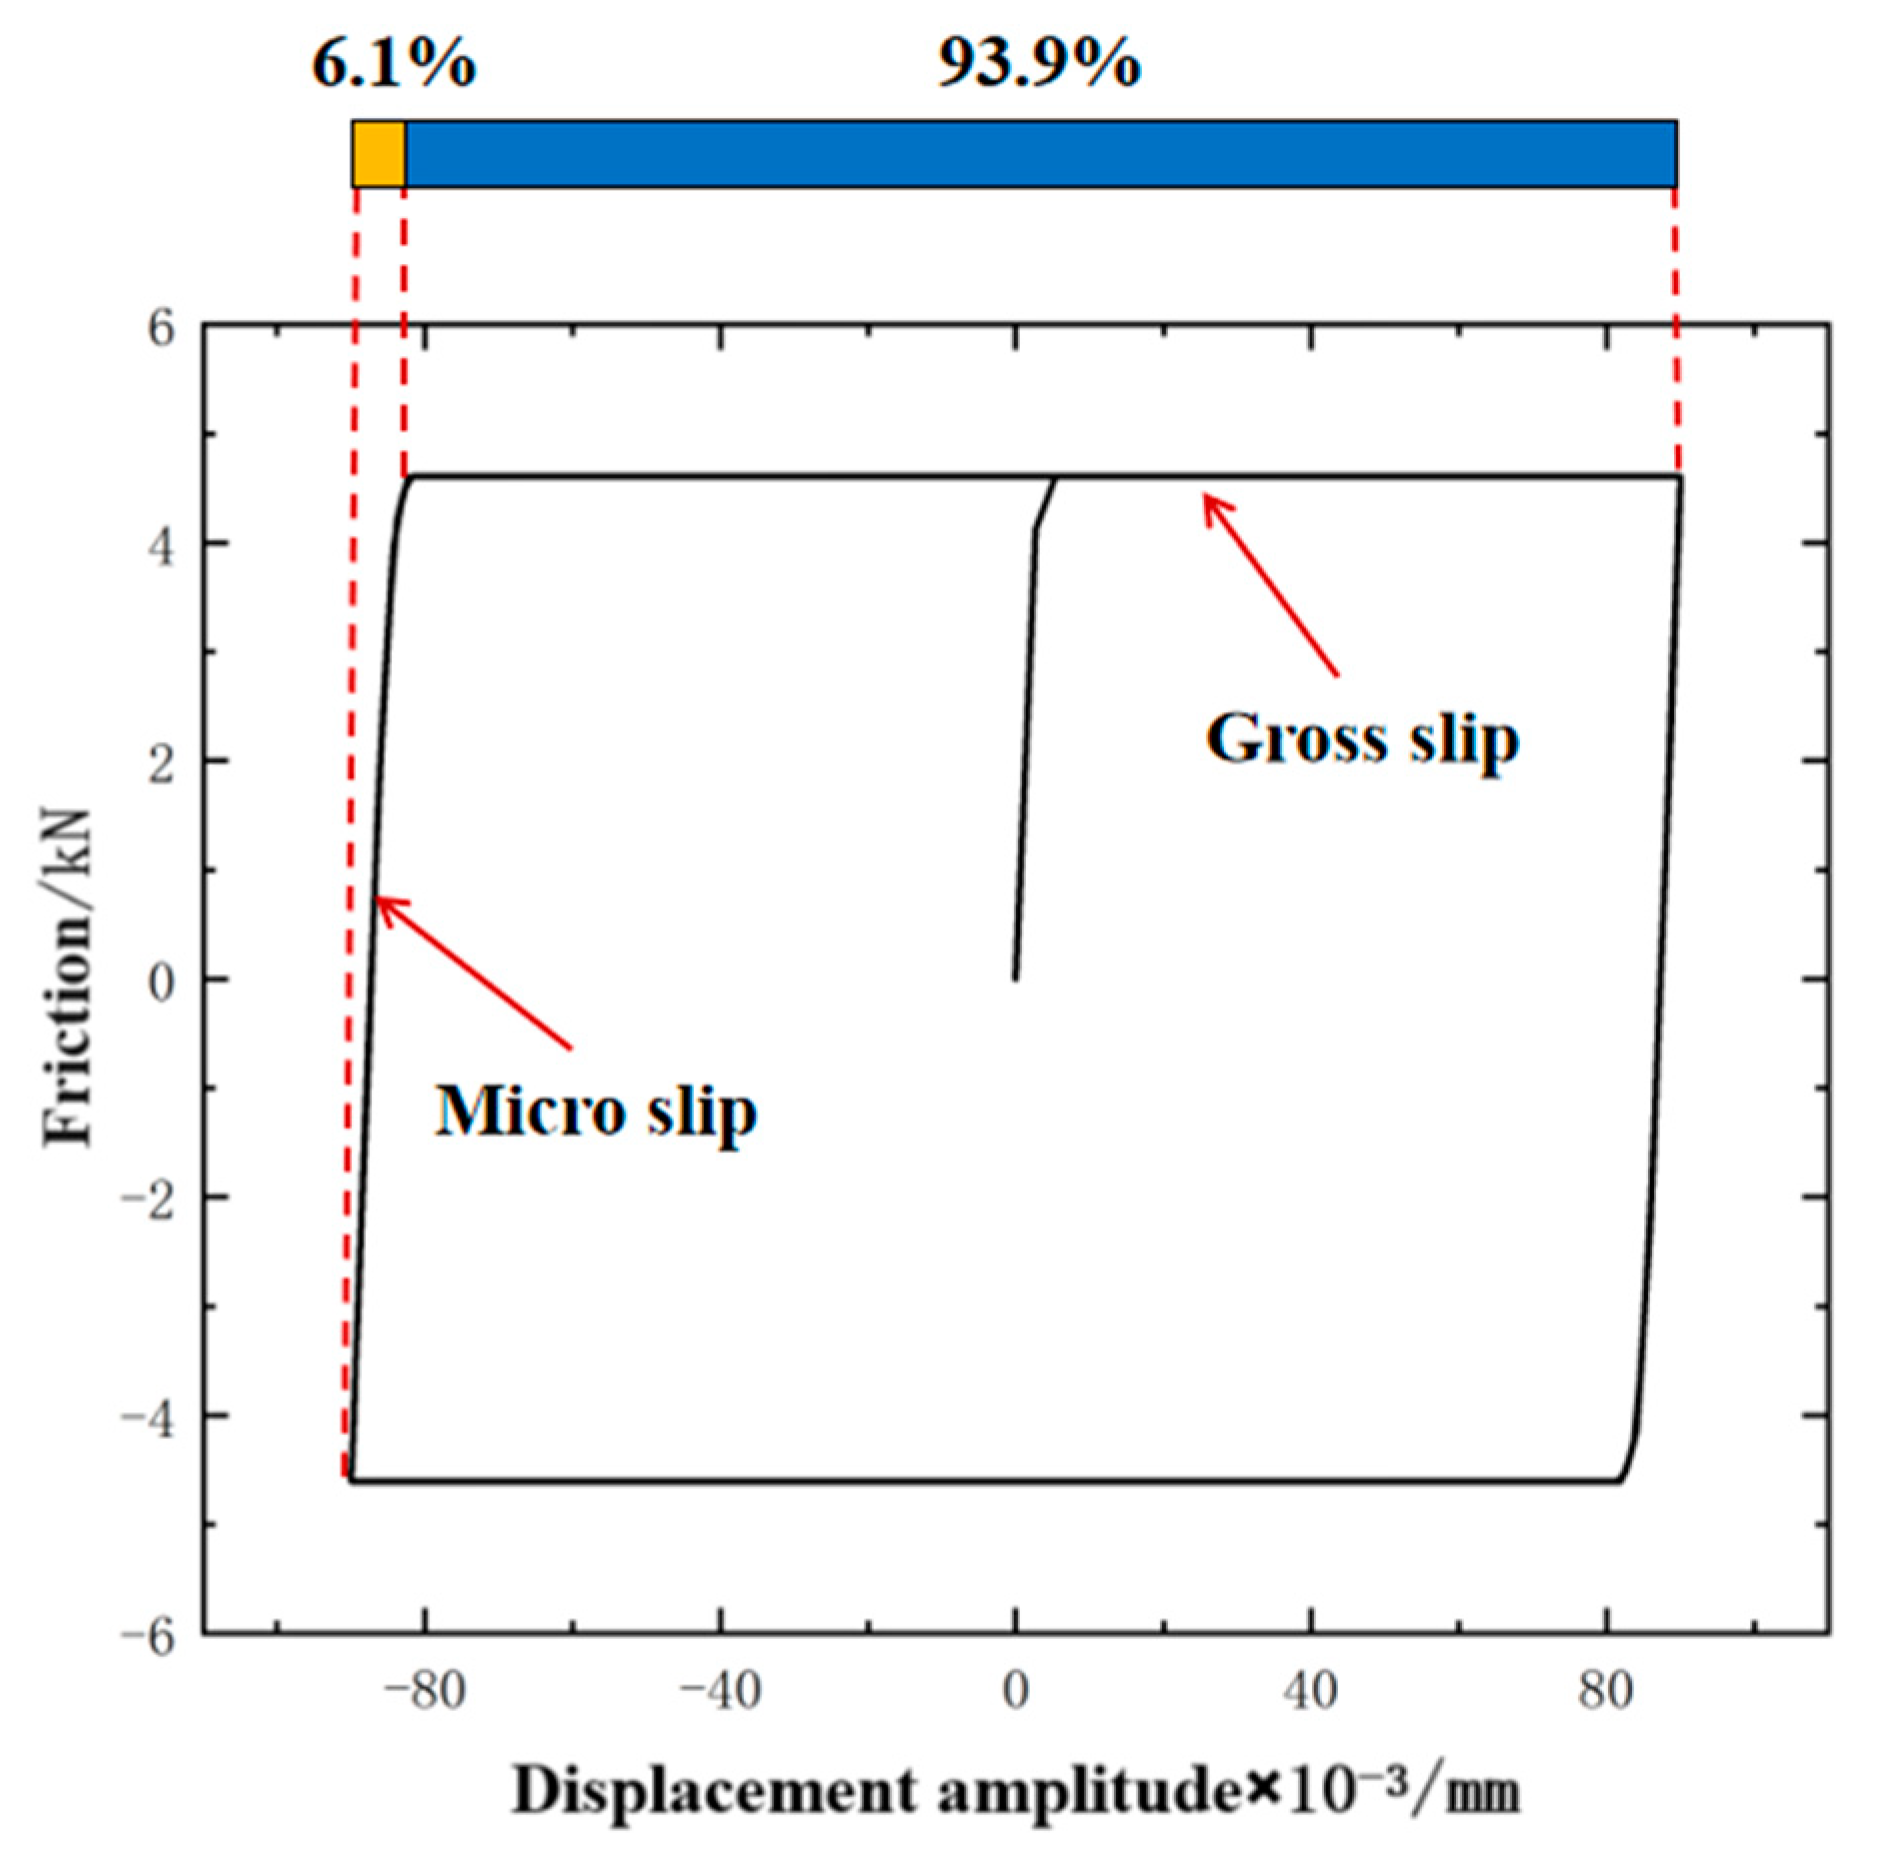
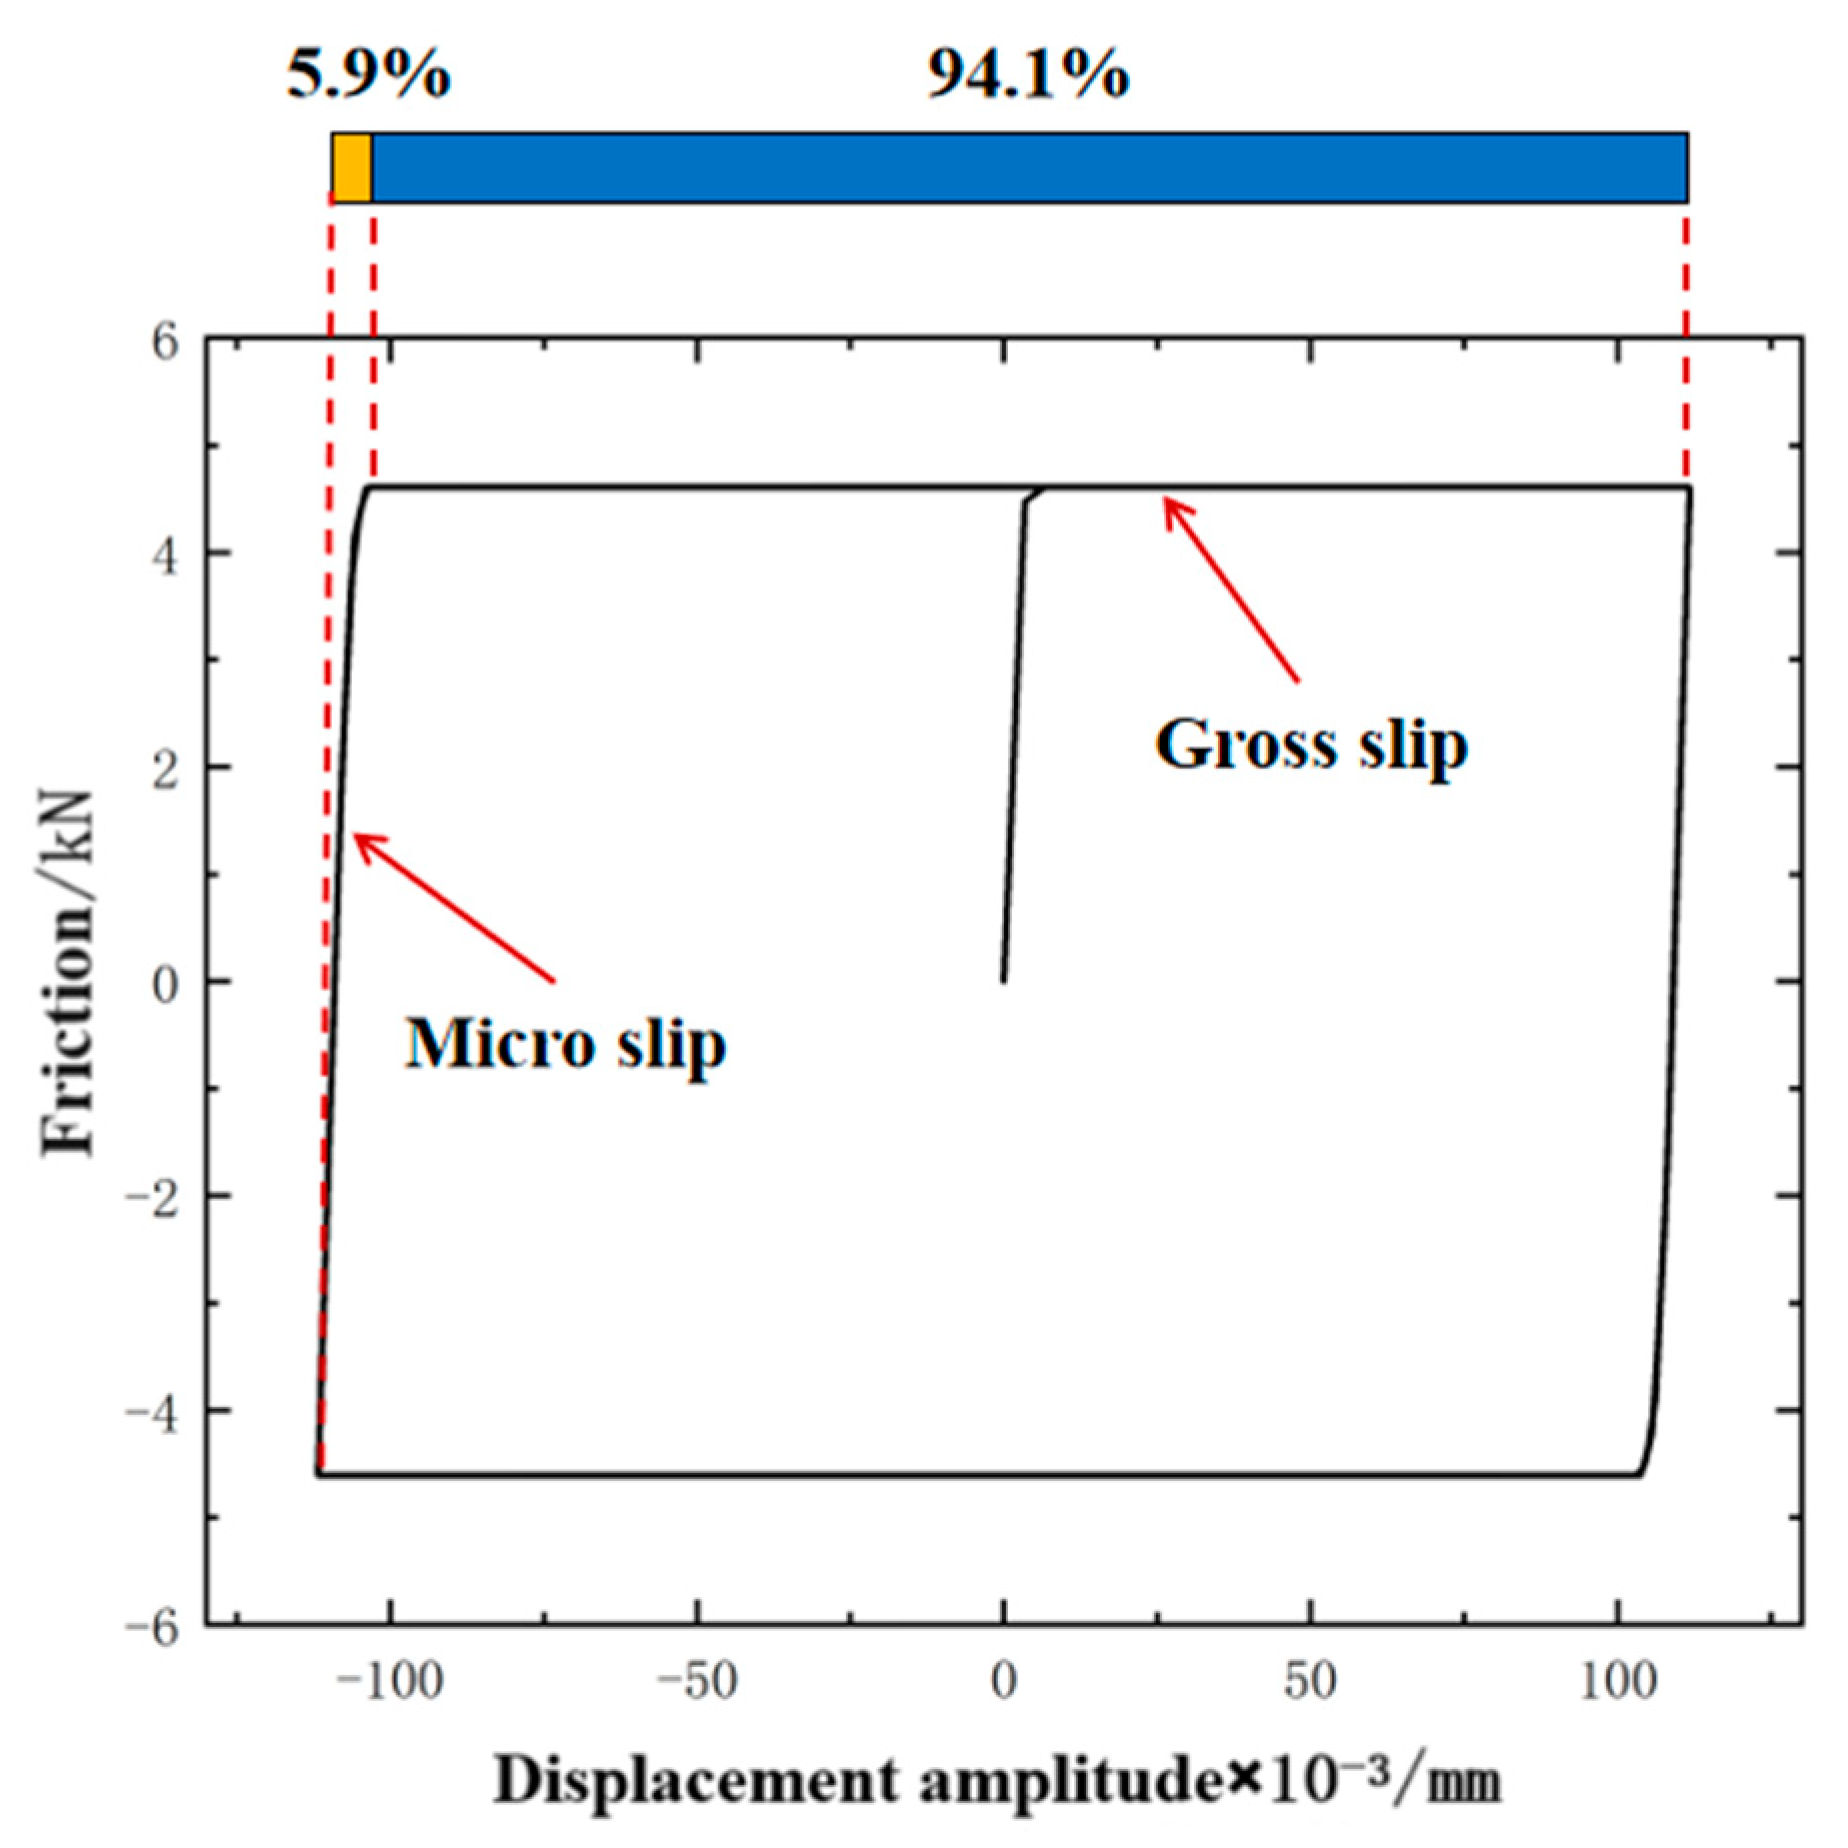
- In the displacement cycle, the gross slip stage occupies a large proportion, resulting in the hysteresis curve being a “parallelogram”. Under the second-order mode shape, the gross slip ratio is 94.1%, which is slightly higher than the 93.9% of the first-order mode shape. As the displacement amplitude increases, the macroscopic slip region and energy dissipation in the hysteresis curve increase.
- (3)
- After applying the displacement amplitude, the effective sealing length of the sealing surface of the premium connection is reduced by about 21%, and the normal contact pressure is reduced by about 30%. As the displacement amplitude increases, the sealing performance tends to be stable, indicating that the vibration load will lead to a decrease in air tightness, but the sealing performance tends to be stable under a larger displacement amplitude.
Author Contributions
Funding
Institutional Review Board Statement
Informed Consent Statement
Data Availability Statement
Conflicts of Interest
References
- ISO 13679; Petroleum and Natural Gas Industries -Procedures for Testing Casing and Tubing Connection. International Organization for Standardization: Geneva, Switzerland, 2002.
- Matthews, C. Assessing tubular connection leakage integrity. World Oil 2002, 223, 82–84. [Google Scholar]
- Xu, H. Research on the Strength and Sealing Theory of the Premium Connections in Tubing and Casing. Ph.D. Thesis, Southwest Petroleum University, Chengdu, China, 2017. [Google Scholar]
- Dou, Y.; Li, Y.; Cao, Y.; Yu, Y.; Zhang, J.; Zhang, L. FE simulation of sealing ability for premium connection based on ISO 13679 CAL IV tests. Int. J. Struct. Integr. 2021, 12, 138–148. [Google Scholar] [CrossRef]
- Bradley, A.B.; Nagasaku, S.; Verger, E. Premium connection design, testing, and installation for HPHT sour wells. In Proceedings of the SPE High Pressure/High Temperature Sour Well Design Applied Technology Workshop, OnePetro, The Woodlands, TX, USA, 17–19 May 2005. [Google Scholar] [CrossRef]
- Xie, J. Numerical evaluation of tubular connections for HPHT applications. In Proceedings of the Baosteel Conference, Shanghai, China, 4–6 January 2013. [Google Scholar]
- Cui, F.; Li, W.; Wang, G.; Gu, Z.; Wang, Z. Design and study of gas-tight premium threads for tubing and casing. J. Pet. Sci. Eng. 2015, 133, 208–217. [Google Scholar] [CrossRef]
- Yang, B.; Xu, H.; Xiang, S.; Zhang, Z.; Su, K.; Yang, Y. Effects of Make-Up Torque on the Sealability of Sphere-Type Premium Connection for Tubing and Casing Strings. Processes 2023, 11, 256. [Google Scholar] [CrossRef]
- Xu, H.; Yang, B. A Quantitative Model to Calculate Gas Sealing Capacity and Design Sealing Parameters for Premium Connection. Math. Probl. Eng. 2020, 2020, 1–7. [Google Scholar] [CrossRef]
- Xu, H.; Zhang, Z.; Xiang, S.; Yang, B.; Shi, T. Leakage Model of Tubing and Casing Premium Connection Based on Sinusoidal Contact Simulation between Rough Surfaces. Processes 2023, 11, 570. [Google Scholar] [CrossRef]
- Galle, T.; De Waele, W.; Patrick, D.B.; Van Wittenberghe, J. Influence of design features on the structural integrity of threaded pipe connections. Sustainable Construction and Design 2011 (SCAD). Int. J. Sustain. Constr. Des. 2011, 2, 237–245. [Google Scholar] [CrossRef]
- Zhang, Y.; Lian, Z.; Zhou, M.; Lin, T. Research on Micro-leakage Mechanism of premium Thread Sealing Surface of Tubing and casing. J. Lubr. Seal. 2019, 44, 93–98. [Google Scholar] [CrossRef]
- Shen, Z.; Li, H.; Zhao, G.; Wang, H.; Liu, J.; Yan, Y.; Wang, J. Discussion on Evaluation Methods for Sealing Test of Tubing and Casing Premium Connection. J. Pet. Tubul. Goods Instrum. 2024, 10, 24–27. [Google Scholar] [CrossRef]
- Liu, E.; Wang, X.; Zhao, W.; Su, Z.; Chen, Q. Analysis and research on pipeline vibration of a natural gas compressor station and vibration reduction measures. Energy Fuels 2020, 35, 479–492. [Google Scholar] [CrossRef]
- Sun, D.; Liao, R. Investigation into the effect of interface characteristics on the energy dissipation of the bolted joints. J. Comput. Theor. Nanosci. 2015, 12, 2821–2829. [Google Scholar] [CrossRef]
- Segalman, D.J. A Four-Parameter Iwan Model for Lap-Type Joints. J. Appl. Mech. 2005, 72, 752–760. [Google Scholar] [CrossRef]
- Zhu, M. Research on the Operation and Damage Mechanism of Radial and Composite Fretting. Ph.D. Thesis, Southwest Jiaotong University, Chengdu, China, 2001. [Google Scholar]
- Masuko, M.; Ito, Y.; Fujimoto, C. Behaviour of the horizontal stiffness and the micro-sliding on the bolted joint under the normal pre-load. In Proceedings of the Twelfth International Machine Tool Design and Research Conference, Birmingham, UK, 18–22 September 1972; pp. 81–88. [Google Scholar] [CrossRef]
- Masuko, M.; Ito, Y.; Koizumi, T. Horizontal stiffness and micro-slip on a bolted joint subjected to repeated tangential static loads. Bull. JSME 1974, 17, 1494–1501. [Google Scholar] [CrossRef]
- Zhang, Y.; Lian, Z.; Zhou, M.; Lin, T. Study on the Sealing Dynamics of premium Threads in Tubing Strings for High-Pressure and High-Production Gas Wells. J. China Univ. Pet. (Ed. Nat. Sci.) 2020, 44, 134–140. [Google Scholar] [CrossRef]
- Yang, Y.; Zhan, Q.; Yihua, D.; Yinping, C. Analysis of Energy Dissipation on the Sealing Surface of Premium Connections Based on a Microslip Shear Layer Model. Energies 2022, 15, 8400. [Google Scholar] [CrossRef]
- Müller, C.; Müser, M.H.; Carbone, G.; Menga, N. Significance of Elastic Coupling for Stresses and Leakage in Frictional Contacts. Phys. Rev. Lett. 2023, 131, 156201. [Google Scholar] [CrossRef] [PubMed]
- Dou, Y.H.; Cao, Y.P.; Zhang, F.X.; Yang, X.T. Analysis of Influence to the Connect and Seal Ability of Tubing Connection of Inner Pressures. Adv. Mater. Res. 2012, 503–504, 790–793. [Google Scholar] [CrossRef]
- Wang, Y.; Fan, H.; Zhang, L.; Wei, F.; Feng, G.; Niu, M. Lateral Vibration and Stability of High Temperature and High Pressure Gas Well Test String. Pet. Mach. 2011, 39, 36–38. [Google Scholar]
- Luo, J.; Zhang, K.; Liu, J.; Mu, L.; Wang, F. The Study of Tubing Vibration Mechanism in High Pressure Gas Well. World J. Eng. Technol. 2021, 9, 128. [Google Scholar] [CrossRef]
- Dong, G.H.; Yin, Q.; Liu, Y.; Yin, G.F. Identification of Joint Dynamic Stiffness Based on Modal Analysis Theory. J. Vib. Shock. 2017, 36, 125–131. [Google Scholar] [CrossRef]
- Liu, Y. Study on Energy Dissipation and Make-up Torque Control of premium connections under Dynamic Load. Master’s Thesis, Xi’an Shiyou University, Xi’an, China, 2023. [Google Scholar]
- Ding, Z.; Zhao, Z.; Luo, G.; Zhang, F.; Chen, W. Experimental Study on Impact Load Transmission Characteristics of Frictional Bolt Connections. Aeroengine 2023, 49, 105–111. [Google Scholar]
- Menq, C.H.; Bielak, J.; Griffin, J.H. The influence of microslip on vibratory response, part I: A new microslip model. J. Sound Vib. 1986, 107, 279–293. [Google Scholar] [CrossRef]
- Yu, H.; Cheng, X.; Lian, Z.; Ding, L.; Wang, H.; Chen, Y. Comprehensive Evaluation of Sealing and Safety Performance of premium connections in Tubing. Lubr. Seal. 2023, 48, 191–199. [Google Scholar] [CrossRef]
- Wang, D.; Zhang, Z. A four-parameter model for nonlinear stiffness of a bolted joint with non-Gaussian surfaces. Acta Mech. 2020, 231, 1963–1976. [Google Scholar] [CrossRef]


| Loading Flank Angle/° | Guide Surface Angle/° | Shoulder Angle/° | Thread Distance/mm | Thread Taper | Sealing Surface Taper |
|---|---|---|---|---|---|
| −3° | 10° | −10° | 4.234 | 1/16 | 1/2 |
| Density/(kg/m3) | Elastic Modulus/GPa | Friction Coefficient | Sealing Surface Taper | Yield Strength/ MPa | Poisson Ratio |
|---|---|---|---|---|---|
| 7850 | 206 | 0.02 | 1:2 | 758 | 0.3 |
| f1/Hz | f2/Hz | f3/Hz | f4/Hz | f5/Hz | |
|---|---|---|---|---|---|
| Experimental Analysis | 193.25 | 378.40 | 621.93 | 1127.64 | 1448.13 |
| Finite Element Analysis | 140 | 378 | 663 | 1127 | 1554 |
| Error | 27% | 0.1% | 6.83% | 0.05% | 6.85% |
| Internal Pressure/MPa | Sealing Index Before Loading/mm·MPa1.4 | Sealing Index After Loading/mm·MPa1.4 | Decrease Ratio/% |
|---|---|---|---|
| 80 | 4670 | 1722 | 63.12 |
| Internal Pressure/MPa | Sealing Index Before Loading/mm·MPa1.4 | Sealing Index After Loading/mm·MPa1.4 | Decrease Ratio/% |
|---|---|---|---|
| 80 | 4670 | 1704 | 63.51 |
Disclaimer/Publisher’s Note: The statements, opinions and data contained in all publications are solely those of the individual author(s) and contributor(s) and not of MDPI and/or the editor(s). MDPI and/or the editor(s) disclaim responsibility for any injury to people or property resulting from any ideas, methods, instructions or products referred to in the content. |
© 2025 by the authors. Licensee MDPI, Basel, Switzerland. This article is an open access article distributed under the terms and conditions of the Creative Commons Attribution (CC BY) license (https://creativecommons.org/licenses/by/4.0/).
Share and Cite
Yu, Y.; Liu, Y.; Cao, Y.; Yuan, Q.; Tang, J.; Dou, Y. Analysis of Energy Dissipation and Sealing Performance of the Premium Connection in Modal Vibrations. Appl. Sci. 2025, 15, 393. https://doi.org/10.3390/app15010393
Yu Y, Liu Y, Cao Y, Yuan Q, Tang J, Dou Y. Analysis of Energy Dissipation and Sealing Performance of the Premium Connection in Modal Vibrations. Applied Sciences. 2025; 15(1):393. https://doi.org/10.3390/app15010393
Chicago/Turabian StyleYu, Yang, Yang Liu, Yinping Cao, Qingying Yuan, Jiarui Tang, and Yihua Dou. 2025. "Analysis of Energy Dissipation and Sealing Performance of the Premium Connection in Modal Vibrations" Applied Sciences 15, no. 1: 393. https://doi.org/10.3390/app15010393
APA StyleYu, Y., Liu, Y., Cao, Y., Yuan, Q., Tang, J., & Dou, Y. (2025). Analysis of Energy Dissipation and Sealing Performance of the Premium Connection in Modal Vibrations. Applied Sciences, 15(1), 393. https://doi.org/10.3390/app15010393