
Analysis of China’s Low-Carbon Power Transition Path Considering Low-Carbon Energy Technology Innovation

Abstract
1. Introduction
2. Development Trends and Characteristics Modeling Analysis of Key Low-Carbon Technologies in the Energy and Power Sector
2.1. New Energy Storage Technology
2.2. CCUS Technology
2.3. Hydrogen Energy Technology
3. Optimization Model for the “Dual Carbon” Path in the Power Industry, Taking into Account Key Low-Carbon Technology Support
3.1. Objective Function
- (1)
- Power Generation Investment Cost
- (2)
- Key Low-Carbon Technology Investment Cost
- (3)
- Operating Cost
3.2. Constraints
3.2.1. Planning Capacity Constraints
3.2.2. System Operational Constraints
- (1)
- Power Balance Constraint
- (2)
- Energy Balance Constraint
- (3)
- Carbon Emission Constraint
- (4)
- Power Source Technical Parameter Constraint
4. Case Study Analysis
4.1. Case Introduction
- (1)
- Carbon Quota
- (2)
- Electricity Demand
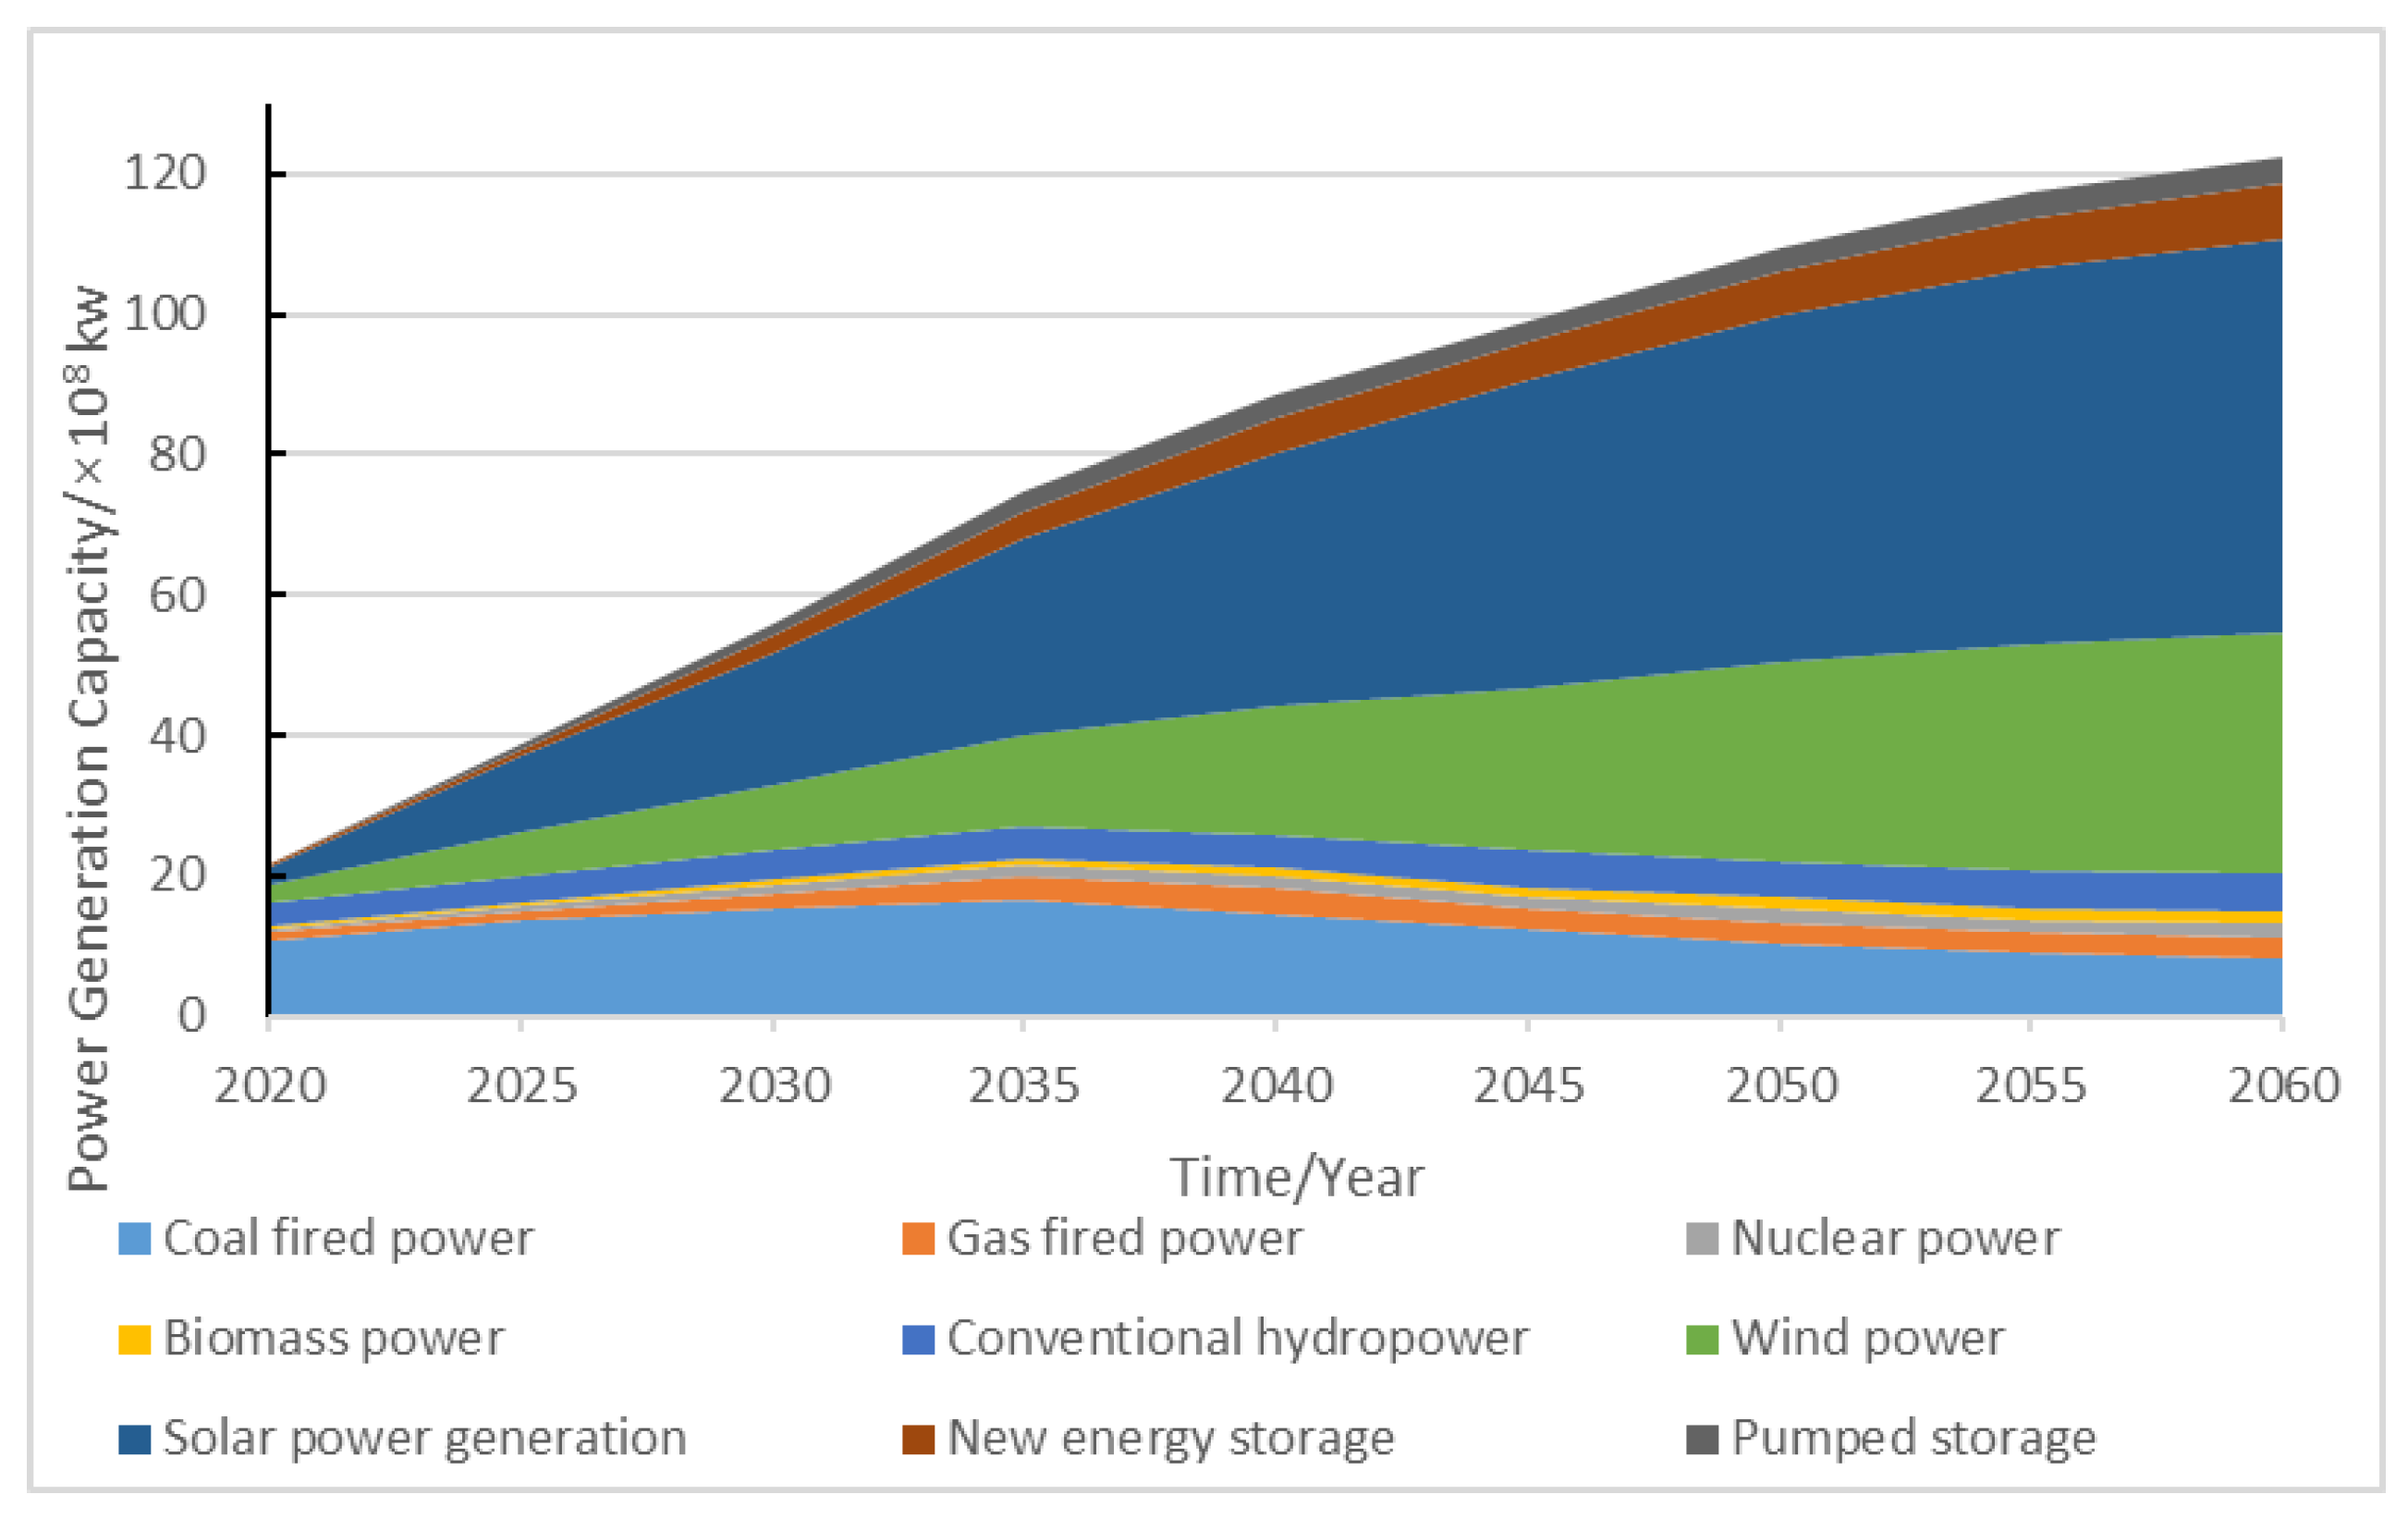
4.2. Optimization Results of the Power Sector’s “Dual Carbon” Path
- (1)
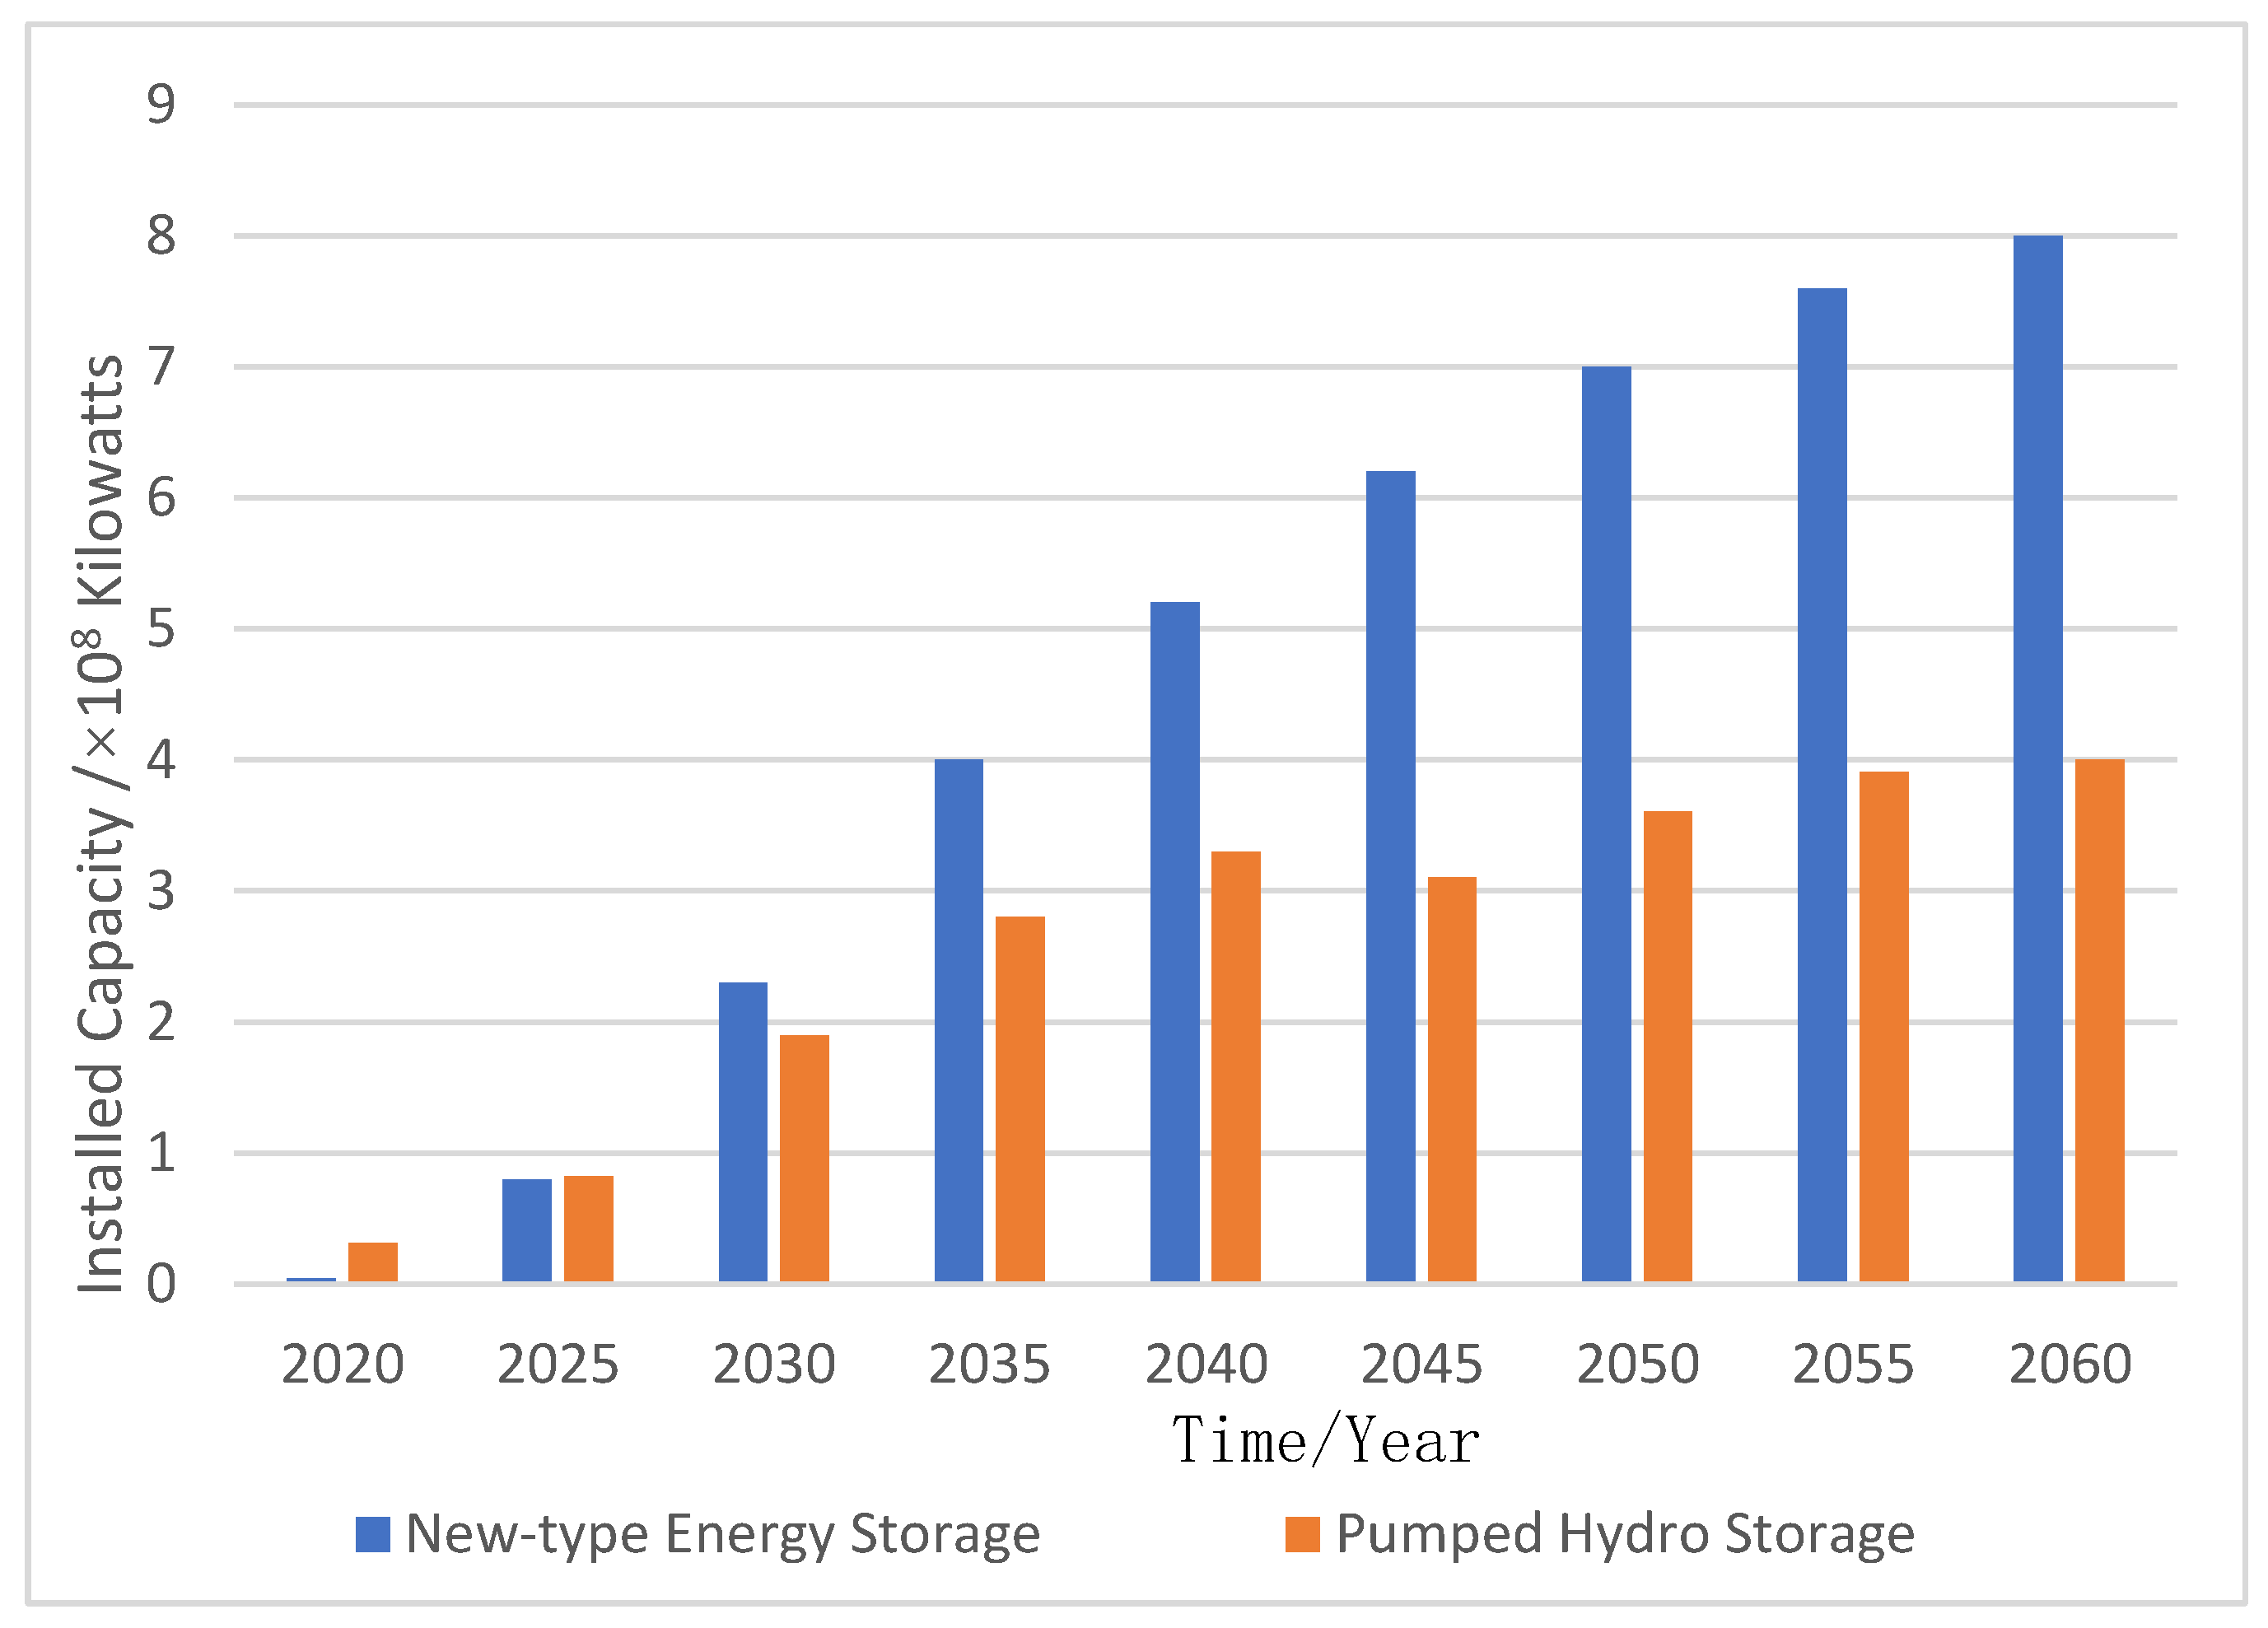
- New Energy Storage
- (2)
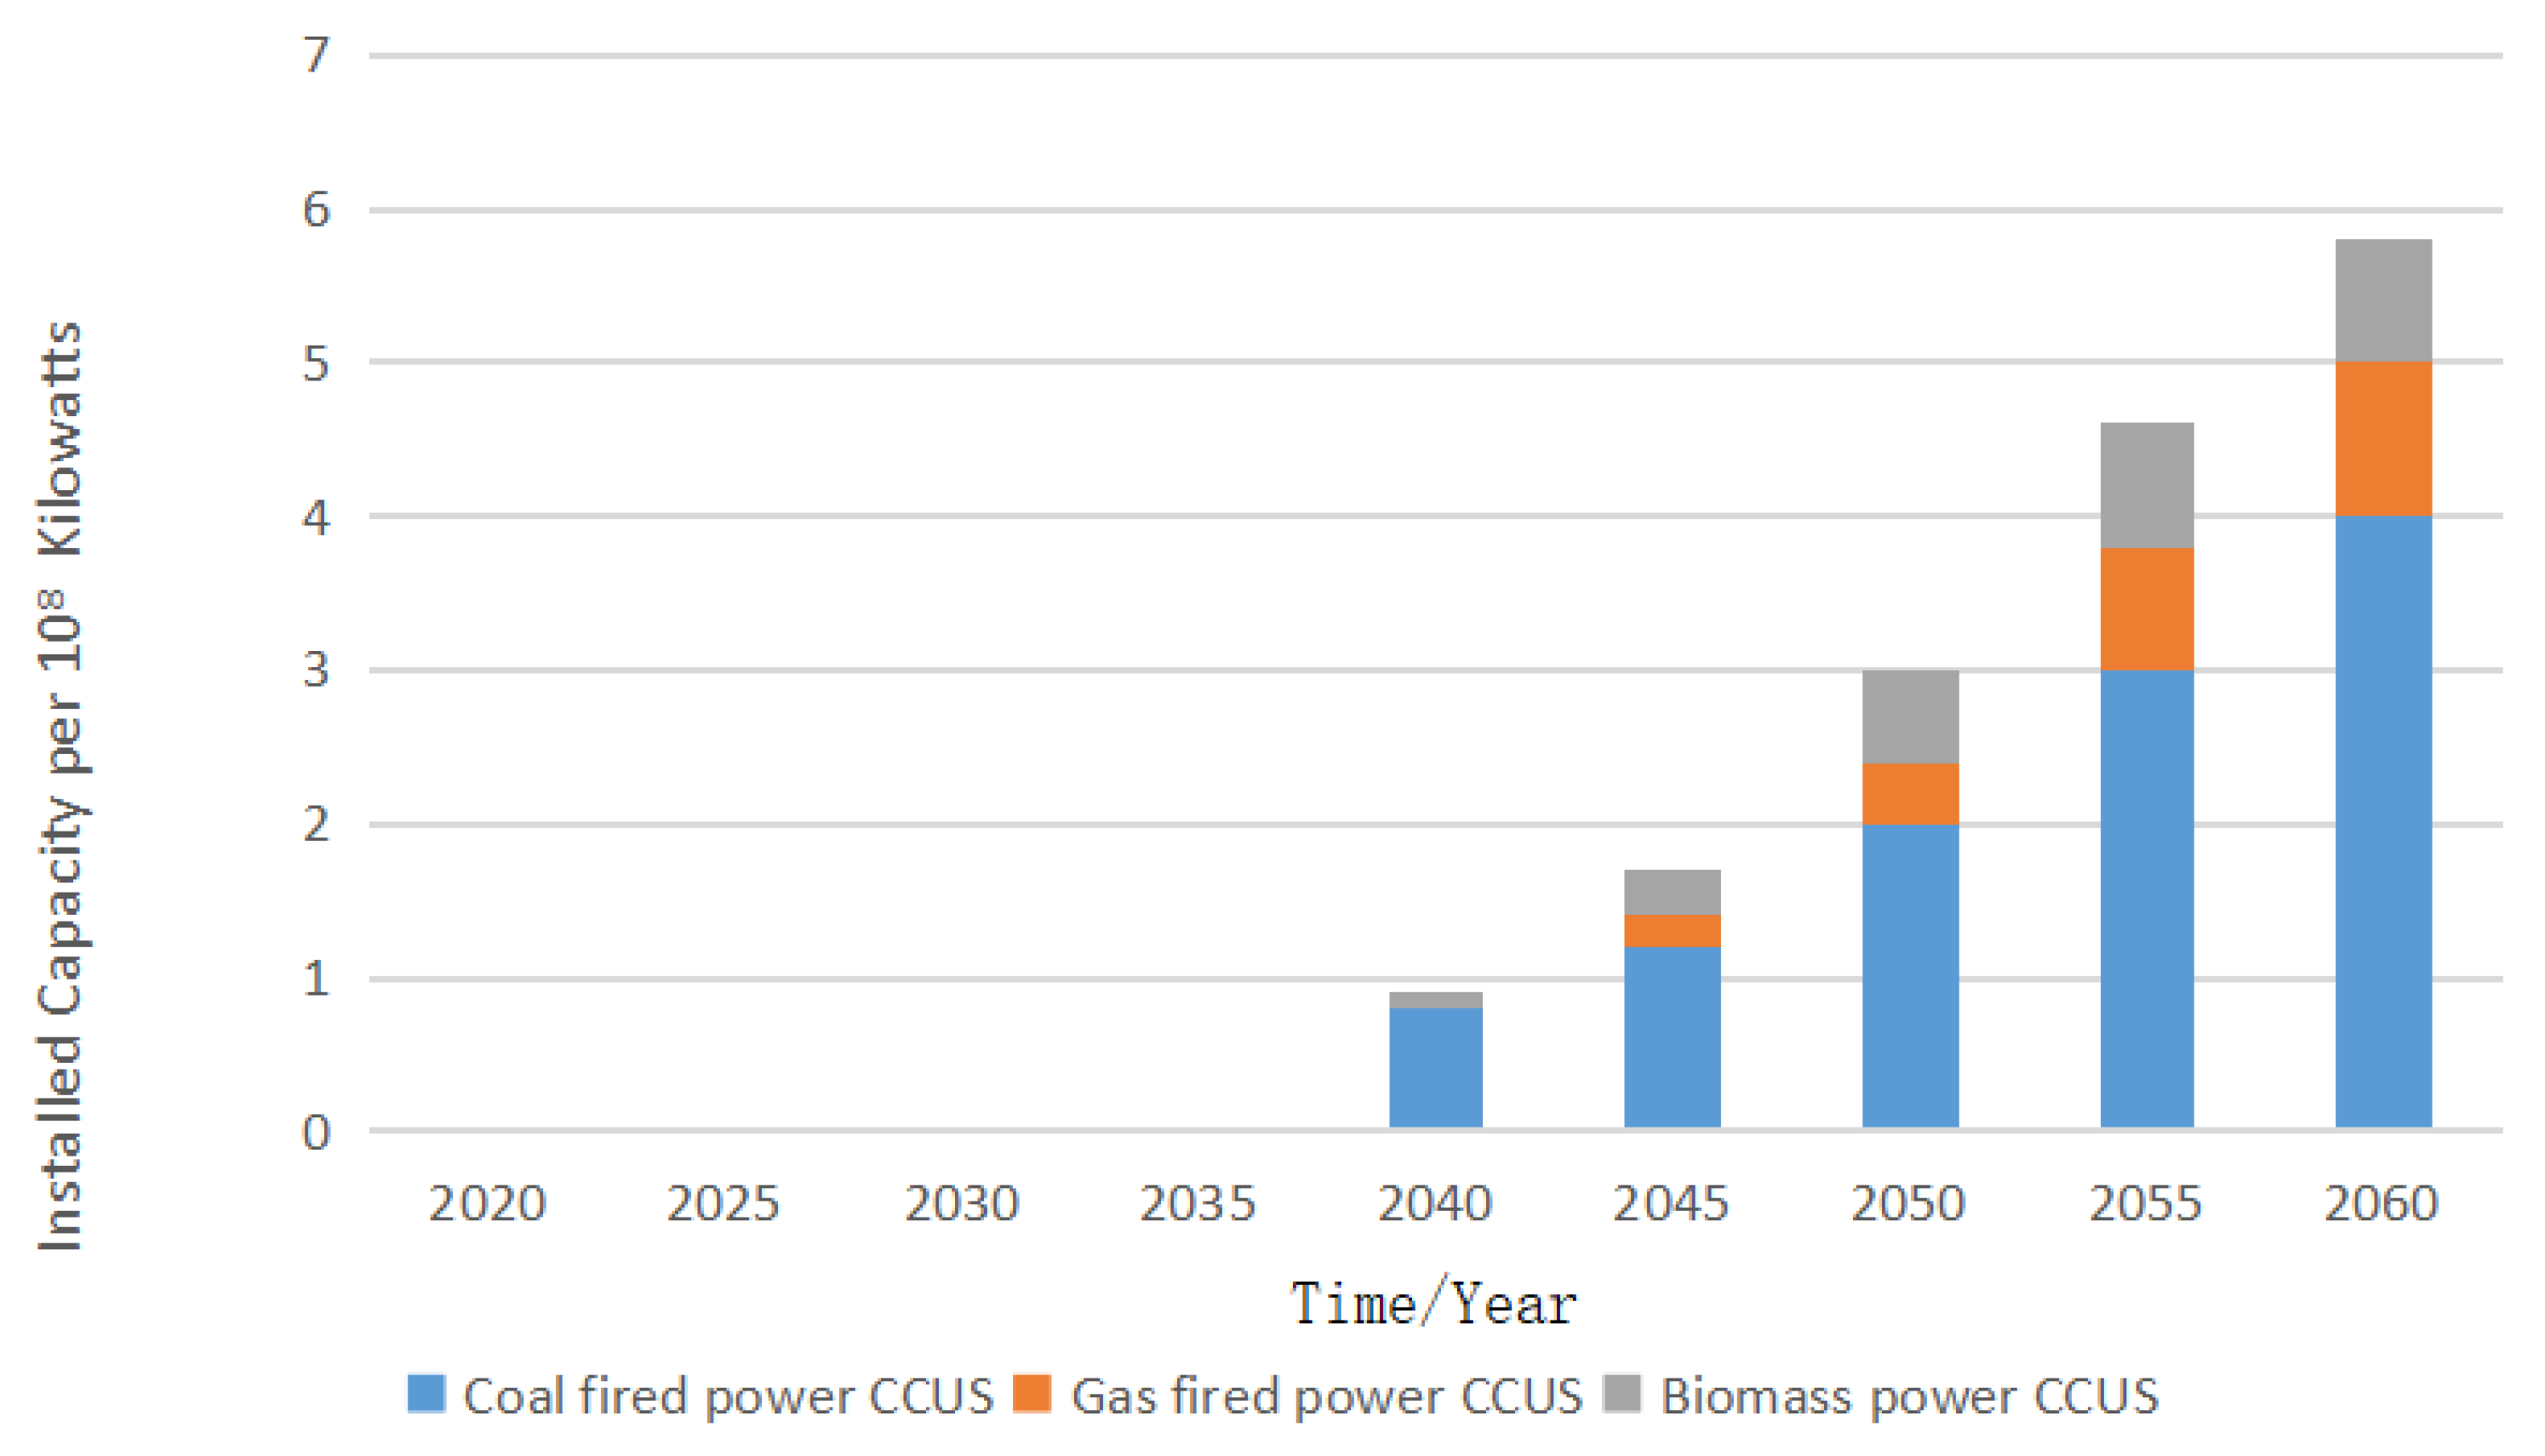
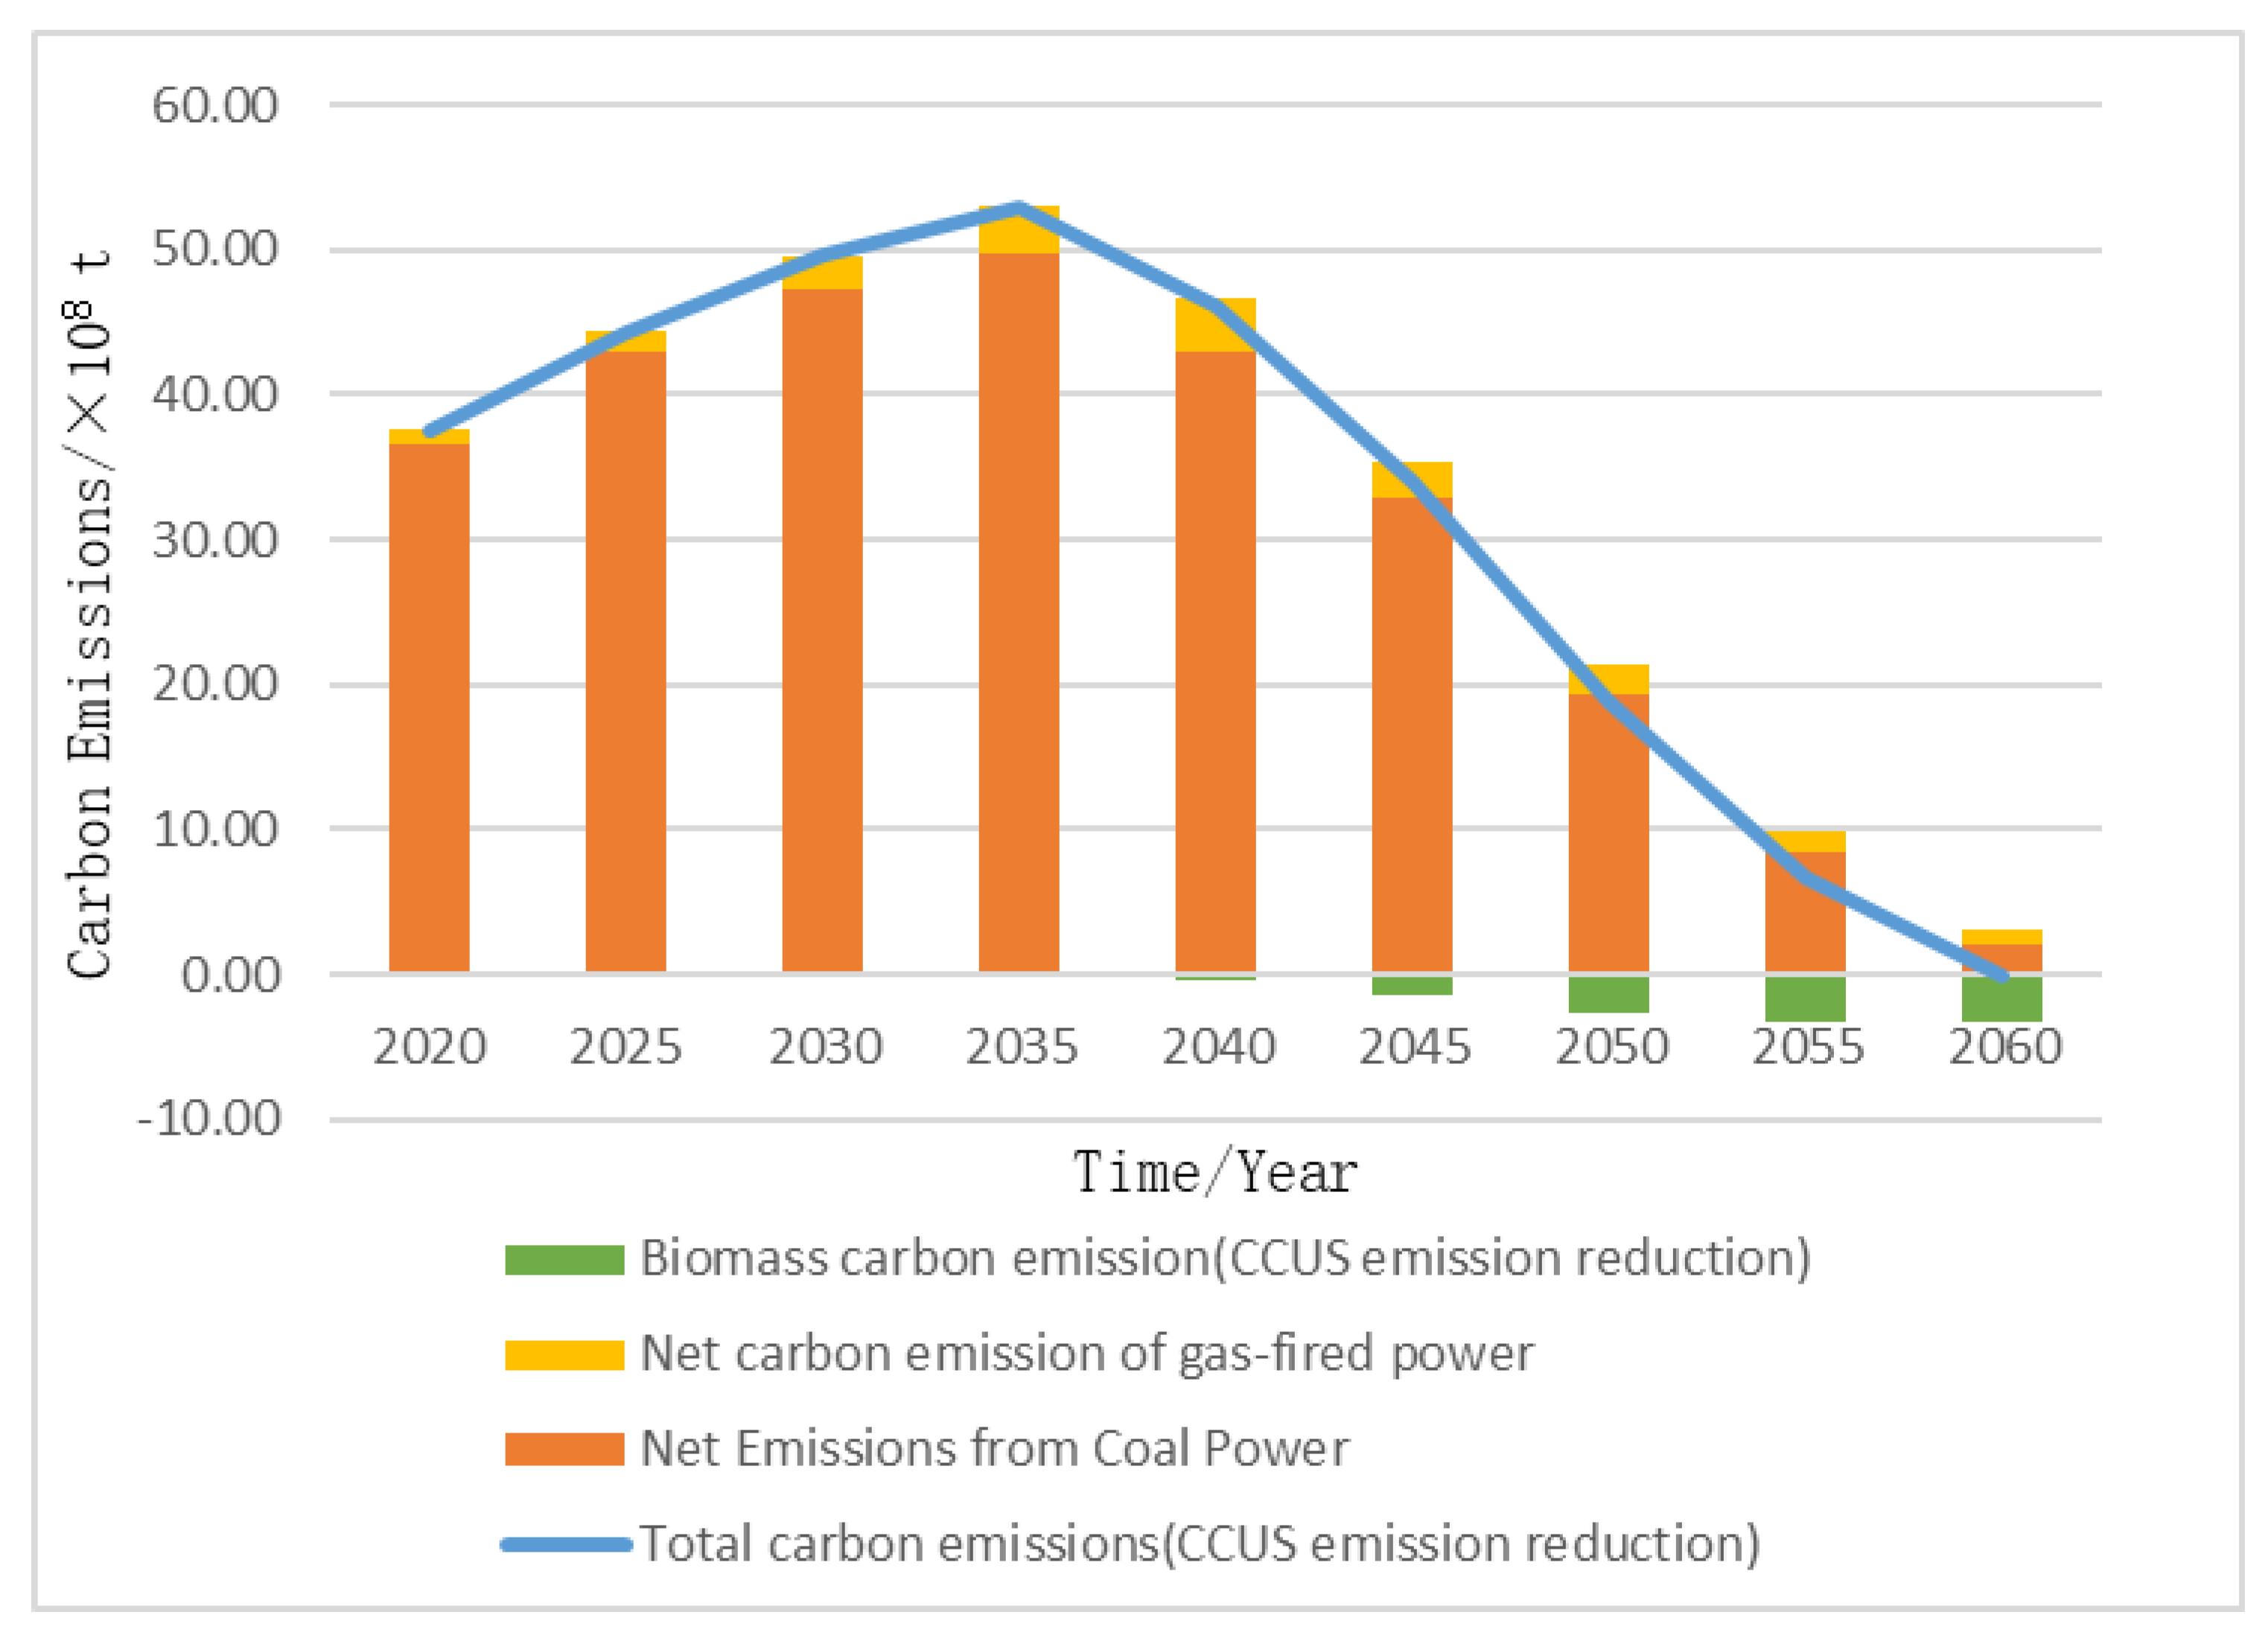
- CCUS Technology
- (3)
- Hydrogen Energy Technology
4.3. Analysis of the Impact of Key Low-Carbon Technology Breakthroughs on China’s Power Sector’s “Dual Carbon” Path
- (1)
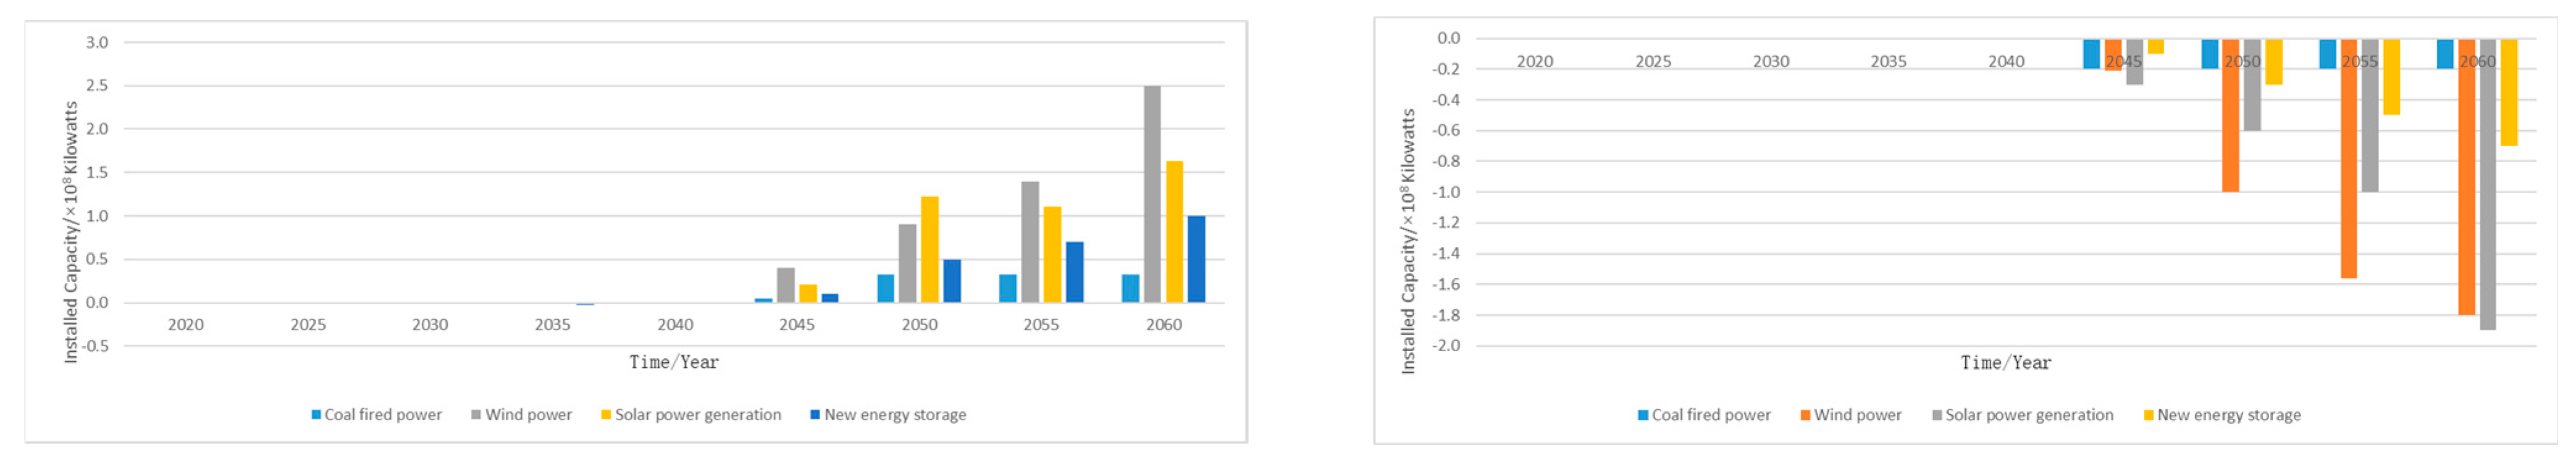
- New Energy Storage Technology
- (2)
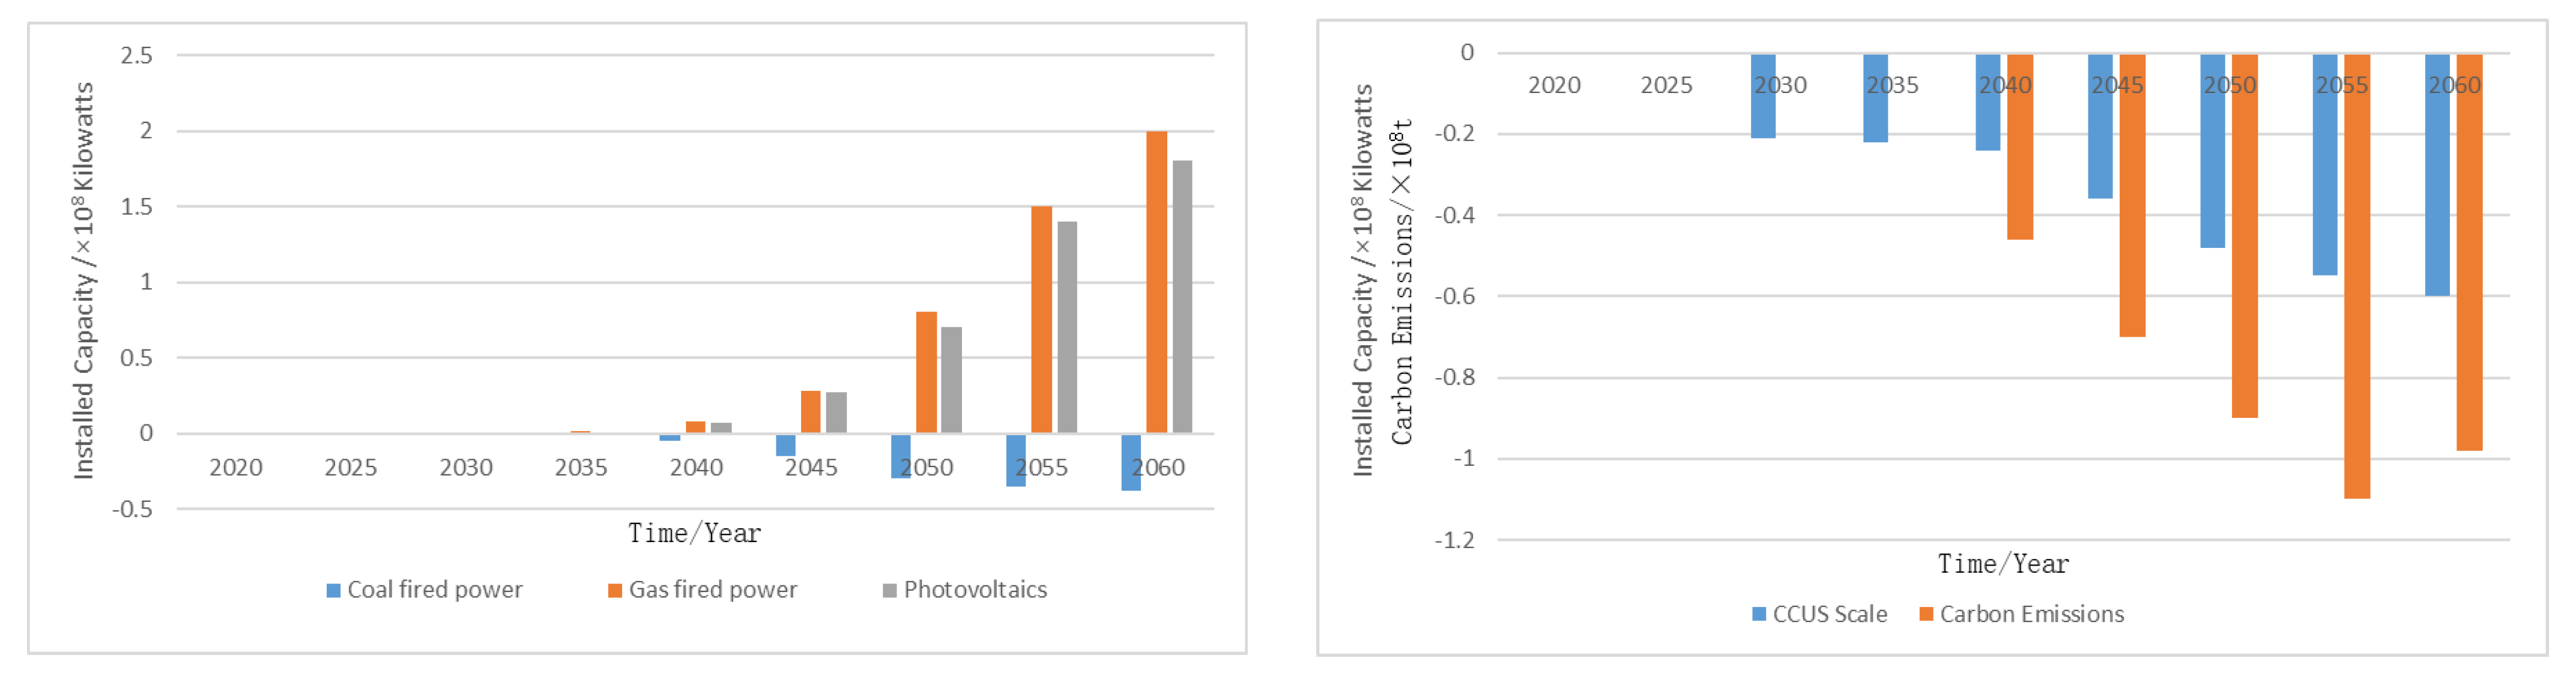
- CCUS Technology
- (3)
- Hydrogen Energy Technology
5. Conclusions
Author Contributions
Funding
Institutional Review Board Statement
Informed Consent Statement
Data Availability Statement
Acknowledgments
Conflicts of Interest
References
- Jacobson, M.Z.; Delucchi, M.A.; Cameron, M.A.; Frew, B.A. Low-cost solution to the grid reliability problem with 100% penetration of intermittent wind, water, and solar for all purposes. Proc. Natl. Acad. Sci. USA 2015, 112, 15060–15065. [Google Scholar] [CrossRef] [PubMed]
- Lee, T.; Kim, M.; Chifamba, N. Political Framework of Green New Deal: A comparative analysis of the EU and US proposals. Korean J. Int. Stud. 2021, 9, 221–246. [Google Scholar] [CrossRef]
- Bernstein, M.J.; Franssen, T.; Smith, R.D.J.; de Wilde, M. The European Commission’s Green Deal is an opportunity to rethink harmful practices of research and innovation policy. Ambio 2023, 52, 508–517. [Google Scholar] [CrossRef] [PubMed]
- Schlachtberger, D.P.; Brown, T.; Schäfer, M.; Schramm, S.; Greiner, M. Cost optimal scenarios of a future highly renewable European electricity system: Exploring the influence of weather data, cost parameters and policy constraints. Energy 2018, 163, 100–114. [Google Scholar] [CrossRef]
- Energy Transitions Commission. China 2050: A Fully Developed Rich Zero-Carbon Economy; ETC: Beijing, China, 2019. [Google Scholar]
- Clack, C.T.M.; Qvist, S.A.; Apt, J.; Bazilian, M.; Brandt, A.R.; Caldeira, K.; Davis, S.J.; Diakov, V.; Handschy, M.A.; Hines, P.D.H.; et al. Evaluation of a proposal for reliable low-cost grid power with 100% wind, water, and solar. Proc. Natl. Acad. Sci. USA 2017, 114, 6722–6727. [Google Scholar] [CrossRef] [PubMed]
- Sepulveda, N.A.; Jenkins, J.D.; de Sisternes, F.J.; Lester, R.K. The role of firm low-carbon electricity resources in deep decarbonization of power generation. Joule 2018, 2, 2403–2420. [Google Scholar] [CrossRef]
- Sithole, H.; Cockerill, T.; Hughes, K.; Ingham, D.; Ma, L.; Porter, R.; Pourkashanian, M. Developing an optimal electricity generation mix for the UK 2050 future. Energy 2016, 100, 363–373. [Google Scholar] [CrossRef]
- Zhang, N.; Xing, L.; Lu, G. Prospects and Challenges for the Medium and Long-Term Energy and Power Transformation in China. China Power Enterp. Manag. 2018, 13, 58–63. [Google Scholar]
- Yang, K. How to Build a new Power System with Renewable Energy as the Mainstay. Available online: https://www.sohu.com/a/464154951_314909 (accessed on 25 May 2021).
- Zhou, X.; Chen, S.; Lu, Z.; Huang, Y.; Ma, S.; Zhao, Q. Technical characteristics of China’s new generation power system in energy transition. Proc. Chin. Soc. Electr. Eng. 2018, 38, 1893–1904. [Google Scholar]
- Guo, J. Building a New Power System Is an Effective Way to Achieve Energy Transformation and “Dual Carbon” Goals. Available online: http://www.chinapower.com.cn/xw/sdyd/20210908/101122.html (accessed on 8 September 2021).
- Chen, G.P.; Dong, Y.; Liang, Z.F. Analysis and reflection on high-quality development of new energy with Chinese characteristics in energy transition. Proc. CSEE 2020, 40, 5493–5506. [Google Scholar]
- Feng, X.; Song, L.; Su, J. Opportunities for renewable energy transformation in China’s power industry under a low-carbon economy. Eng. Technol. Res. 2019, 4, 246–247. [Google Scholar]
- International Energy Agency. Power Transformation: The Economics of Wind, Solar and Flexible Power Systems; Wang, S., Translator; Dongbei University of Finance and Economics Press: Shenyang, China, 2018. [Google Scholar]
- Li, J. Ten Trends in Power Transformation: Energy Storage Determines the Process and Form of Power System Transformation. New Energy Trade Econ. Rev. 2018, 12, 40–43. [Google Scholar]
- Li, P. Digital Grid Will Become the Best Form to Carry the New Power System. Available online: https://mp.weixin.qq.com/s/OS8bQvwwbIhVF9SwM8E1Fg (accessed on 29 April 2021).
- Chatterjee, S.; Stavrakas, V.; Oreggioni, G.; Süsser, D.; Staffell, I.; Lilliestam, J.; Molnar, G.; Flamos, A.; Ürge-Vorsat, D. Existing tools, user needs and required model adjustments for energy demand modelling of a carbon-neutral Europe. Energy Res. Soc. Sci. 2022, 91, 102662. [Google Scholar] [CrossRef]
- Zhou, D.; Obobisa, E.S.; Ayamba, E.C. Achieving carbon neutrality goal in European countries: The role of green technology innovation, renewable energy, and financial development. Environ. Dev. Sustain. 2024, 1–31. Available online: https://link.springer.com/article/10.1007/s10668-024-04989-5 (accessed on 21 October 2024). [CrossRef]
- Halkos, G.E.; Aslanidis, P.S.C. Green Energy Pathways Towards Carbon Neutrality. Environ. Resour. Econ. 2024, 87, 1473–1496. [Google Scholar] [CrossRef]
- Rao, H. Digital Grid Promotes the Construction of a New Power System with Renewable Energy as the Mainstay. Available online: https://mp.weixin.qq.com/s/_UjdwTbHTnSWByUQMRT93A (accessed on 27 April 2021).


| Type of Energy Storage | Energy Conversion Efficiency (%) | Discharge Duration | Response Speed | Unit Capacity Cost | Expected Year of Large-Scale Application | ||||
|---|---|---|---|---|---|---|---|---|---|
| 2025 | 2030 | 2060 | 2025 | 2030 | 2060 | ||||
| Compressed air | 40~60 | 50~65 | 50~70 | Hour level | Minute level | 1120 USD/kW | 980 USD/kW | 910 USD/kw | 2030 |
| Phase change thermal storage | - | - | - | Several hours | Minute level | 23.8–28 USD/kWh | 22.4–26.6 USD/kWh | 21–25.2 USD/kWh | 2030 |
| Flywheel energy storage | - | - | - | Minute level | <2 milliseconds | 420–560 USD/kW·min | 280–350 USD/kW·min | 210–280 USD/kW·min | 2030 |
| Supercapacitor | 95 | 95 | 95 | Second-to-minute level | Millisecond level | 11,200 USD/kWh | 9800 USD/kWh | 8400 USD/kWh | 2030 |
| Lithium battery | 88–90 | 90–91 | 92–94 | Hour level | Millisecond level | 126–154 USD/kWh | 70–98 USD/kWh | 42–56 USD/kWh | 2025 |
| Vanadium redox flow battery | 65–70 | 70–72 | 72–75 | Hour level | Millisecond level | 350–420 USD/kWh | 1500–2000 USD/kWh | 1000–1500 USD/kWh | 2030 |
| Sodium-ion battery | 88–90 | 90–91 | 92–94 | Hour level | Millisecond level | 252–350 USD/kWh | 112–140 USD/kWh | 35–42 USD/kWh | 2035 |
| Year | 2025 | 2030 | 2035 | 2040 | 2050 | 2060 | |
|---|---|---|---|---|---|---|---|
| Capture cost (USD/ton) | Pre-combustion | 14~25.2 | 12.6~18.2 | 9.8~11.2 | 7~9.8 | 4.2~7 | 2.8~5.6 |
| Post-combustion | 32.2~43.4 | 26.6~39.2 | 22.4~30.8 | 15.4~25.2 | 11.2~21 | 9.8~16.8 | |
| Oxy-fuel combustion | 42~67.2 | 22.4~54.6 | 18.2~44.8 | 15.4~32.2 | 12.6~21 | 11.2~18.2 | |
| Transportation cost (USD/(ton·km)) | Tank truck transportation | 0.126~0.196 | 0.112~0.182 | 0.098~0.168 | 0.084~0.154 | 0.07~0.14 | 0.07~0.14 |
| Pipeline transportation | 0.112 | 0.098 | 0.084 | 0.07 | 0.063 | 0.056 | |
| Sequestration cost (USD/ton) | 7~8.4 | 5.6~7 | 4.9~5.6 | 4.2~4.9 | 3.5~4.2 | 2.8~3.5 | |
| Year | 2025 | 2030 | 2060 | |
|---|---|---|---|---|
| Electrolytic hydrogen production | Cost | ≤2.8 USD/H2 | ≤USD 2.1/H2 | ≤USD 1.4/H2 |
| Alkaline | Current density: 0.8 A/cm2 Single-cell capacity: 2 MW | Electricity density: 1 A/cm2 Single-cell scale: 3 MW | Electricity density: 2 A/cm2 Single-cell scale: 10 MW | |
| PEM | Single-cell scale: 1 MW Energy consumption: 4.5 kWh/Nm3 H2 Adjustment range: 5~120% Lifespan: 50,000 h | Single-cell scale: 2 MW Energy consumption: 4.3 kilowatt-hours/Nm3 H2 Adjustment range: 5~150% Lifespan: 80,000 h | Single-cell scale: 10 MW Energy consumption: 4 kilowatt-hours/Nm3 H2 Lifespan: 120,000 h | |
| Hydrogen storage | Hydrogen storage density | 4.0 wt% | 5 wt% | 7 wt% |
| Fuel Cell | Cost | 560 USD/kilowatt | 112 USD/kilowatt | 42 USD/kilowatt |
| Lifespan | 20,000 h fixed power station | 50,000 h fixed power station | 100,000 h fixed power station | |
| Cold start temperature | −30 °C | −30 °C | −40 °C | |
| Year | 2020 | 2025 | 2030 | 2035 | 2040 | 2045 | 2050 | 2055 | 2060 |
|---|---|---|---|---|---|---|---|---|---|
| Carbon quota (108 t) | 38 | 45 | 50 | 53 | 45 | 32 | 16 | 6 | 0 |
| Coal Power | Gas Power | Biomass Power Generation | |
|---|---|---|---|
| Installed capacity (billion kilowatts) | 4 | 4 | 2 |
| CCUS retrofitting (billion kilowatts) | 1.5 | 1.2 | 0.8 |
| Net emissions (billion tons) | 2.1 | 1.3 | −3.4 |
| CCUS capture (billion tons) | 3.2 | 1.2 | 3.4 |
| Fuel consumption (billion tons of standard coal) | 1.8 | 1.7 | 2.8 |
| Year | 2020 | 2025 | 2030 | 2035 | 2040 | 2045 | 2050 | 2055 | 2060 |
|---|---|---|---|---|---|---|---|---|---|
| Electrolytic hydrogen load/billion kilowatts | 0.00 | 0.05 | 0.1 | 0.6 | 1.7 | 2.9 | 4.5 | 5.5 | 6 |
| Hydrogen storage (thousand tons) | 0 | 0 | 13 | 70 | 340 | 880 | 1900 | 2440 | 2900 |
| Hydrogen fuel power Generation (billion kilowatts) | 0.00 | 0.00 | 0.00 | 0.01 | 0.05 | 0.13 | 0.27 | 0.34 | 0.40 |
Disclaimer/Publisher’s Note: The statements, opinions and data contained in all publications are solely those of the individual author(s) and contributor(s) and not of MDPI and/or the editor(s). MDPI and/or the editor(s) disclaim responsibility for any injury to people or property resulting from any ideas, methods, instructions or products referred to in the content. |
© 2025 by the authors. Licensee MDPI, Basel, Switzerland. This article is an open access article distributed under the terms and conditions of the Creative Commons Attribution (CC BY) license (https://creativecommons.org/licenses/by/4.0/).
Share and Cite
Xia, P.; Lu, G.; Yuan, B.; Gong, Y.; Chen, H. Analysis of China’s Low-Carbon Power Transition Path Considering Low-Carbon Energy Technology Innovation. Appl. Sci. 2025, 15, 340. https://doi.org/10.3390/app15010340
Xia P, Lu G, Yuan B, Gong Y, Chen H. Analysis of China’s Low-Carbon Power Transition Path Considering Low-Carbon Energy Technology Innovation. Applied Sciences. 2025; 15(1):340. https://doi.org/10.3390/app15010340
Chicago/Turabian StyleXia, Peng, Gang Lu, Bo Yuan, Yichun Gong, and Haitao Chen. 2025. "Analysis of China’s Low-Carbon Power Transition Path Considering Low-Carbon Energy Technology Innovation" Applied Sciences 15, no. 1: 340. https://doi.org/10.3390/app15010340
APA StyleXia, P., Lu, G., Yuan, B., Gong, Y., & Chen, H. (2025). Analysis of China’s Low-Carbon Power Transition Path Considering Low-Carbon Energy Technology Innovation. Applied Sciences, 15(1), 340. https://doi.org/10.3390/app15010340