Abstract
This study explores the advanced imaging of skin vasculature using Line-Field Confocal Optical Coherence Tomography (LC-OCT), which offers high-resolution, three-dimensional (3D) visualization of vascular structures, especially within skin tumors. The research aims to improve the understanding of tumor angiogenesis and the complex vascular morphology associated with malignancies. The methodology involves converting original image stacks into negative images, manually tracing vessels using the Simple Neurite Tracer (SNT) plugin, and creating smoothed binary masks to reconstruct 3D models. The study’s results highlight the ability to visualize serpiginous, corkscrew-like, and irregular vessels across various skin cancers, including melanoma, squamous cell carcinoma, and basal cell carcinoma. These visualizations provide insights into vessel morphology, spatial arrangements, and blood flow patterns, which are crucial for assessing tumor growth and potential therapeutic responses. The findings indicate that 3D reconstructions from LC-OCT can uncover vascular details previously undetectable by two-dimensional imaging techniques, making it a valuable tool in dermatology for both clinical diagnostics and research. This method allows for better monitoring of skin cancer treatment and understanding of the role of vascular polymorphism in tumor development.
1. Introduction
Non-invasive imaging is playing an increasingly important role in the diagnosis and monitoring of skin tumors, as well as in the study of vascular structures [1]. High-resolution line-field confocal optical coherence tomography (LC-OCT) has proven to be a promising technology for three-dimensional (3D) imaging of tissue. Compared to conventional methods, LC-OCT enables a more detailed in-vivo visualization of skin layers and underlying vessels [2,3,4,5].
The study of tumor vessels is of crucial importance as it provides deeper insights into the mechanisms of tumor development and metastasis. Tumor angiogenesis, the formation of new blood vessels by tumor cells, plays a decisive role in supplying tumors with oxygen and nutrients, enabling their further growth and metastasis [6]. A central mechanism of this angiogenesis is the production of vascular endothelial growth factor (VEGF) by tumor cells under hypoxia, which stimulates the proliferation and migration of endothelial cells [7]. In addition to VEGF, other growth factors such as fibroblast growth factor (FGF) and platelet-derived growth factor (PDGF), as well as hypoxia-inducible factor 1 (HIF-1) are also involved in the regulation of angiogenesis [8,9]. Therapeutic approaches focus on inhibiting tumor angiogenesis in order to stop tumor growth [10,11].
Despite these advances, structural abnormalities in tumor vessels and the ability of tumors to activate alternative angiogenic signaling pathways continue to pose challenges. These irregular and often leaky vessels lead to inefficient blood supply and promote tumor cell dissemination [11]. Hematogenous metastasis involves tumor cell invasion into the bloodstream, survival in the circulation, and metastasis to other organs, which is facilitated by interactions with endothelial cells and the involvement of integrins and matrix metalloproteinases (MMPs) [12,13,14,15].
The accurate reconstruction and visualization of vascular structures are critical for advancing our understanding of both normal and pathological processes in vascular biology. Vascular networks are fundamental to numerous physiological functions, and their disruption or abnormal formation is implicated in a wide range of diseases, including cancer and chronic inflammatory conditions. To study these complex networks in detail, particularly in a 3D context, advanced imaging and analysis techniques are essential [3].
This paper focuses on a methodical approach for reconstructing and visualizing vascular structures from 3D image stacks, which involves three key steps as described in the materials and methods section.
In addition to manual reconstruction methods, automated methods are increasingly being developed in OCT imaging to improve efficiency and the associated scalability and accuracy. Meiburger et al. provide a comprehensive overview of automated segmentation and classification methods based on machine learning. These approaches not only enable precise segmentation of complex vascular structures, but also classification of pathological patterns, which underpins their relevance for clinical diagnostics and research [16].
The significance of this reconstruction process extends beyond mere visualization. The resulting 3D models are invaluable for various applications, including the study of vascular development, the analysis of tumor vasculature, and the assessment of vascular changes in response to therapeutic interventions. By providing a more detailed and comprehensive view of vascular networks, this approach enhances our ability to diagnose, treat, and understand diseases where vascular pathology plays a central role.
This study delineates the significant advantages of utilizing three-dimensional (3D) reconstructions within the framework of Line-field confocal optical coherence tomography (LC-OCT) imaging. Chauvel-Picard et al. have already demonstrated that this technique is highly effective for examining healthy skin; however, the broader field of vascular structures remained largely unexplored in their work [17]. LC-OCT facilitates the identification of complex vascular structures that are challenging to visualize using conventional two-dimensional (2D) imaging methods like dermoscopy. In comparison to LC-OCT, dynamic optical coherence tomography (D-OCT), as described by Ulrich et al., also offers the capability to visualize blood vessels in the skin. With a penetration depth of up to 1.5 mm, D-OCT can image vessels in deeper skin layers. While earlier versions of D-OCT were limited to two-dimensional imaging, more recent advancements allow for three-dimensional vessel reconstructions, providing a more comprehensive view of the vasculature from various angles [18].
This article aims to present the detailed methodology for 3D vascular reconstruction and explore its potential applications in both clinical and research settings. Through this, we highlight the importance of advanced imaging techniques in the study of vascular biology and their contributions to improving medical science and patient outcomes.
2. Materials and Methods
The deepLive™ LC-OCT device from DAMAE Medical (Paris, France) is used in the dermatology department at Augsburg University Hospital for the rapid diagnosis of benign and malignant skin changes, as well as for study purposes. It consists of a mobile unit on four castors, which includes the housing with all the hardware and software. The handpiece, which is connected to the housing with a tubular cable harness, enables the skin images to be captured and displayed on a 23-inch EIZO full HD touchscreen.
The LC-OCT device uses a class 1 supercontinuum laser according to EN 60825-1 with a wavelength between 600 nm and 900 nm. It achieves a maximum axial and lateral resolution of less than 1.3 µm. The skin is visualised live at a frame rate of 8 frames per second (fps), while a 3D stack can be created at up to 26 fps. The dermatoscope integrated into the handpiece offers a resolution of 5 µm and a field of view of 2.5 mm.
The deepLive™ LC-OCT offers multiple modes for tissue visualisation. The Vertical Live Mode shows a vertical section through the skin, similar to histology. In Horizontal Live Mode, horizontal vessels can be visualised in longitudinal and partially in cross-section. The 3D stack mode, which enables isotropic cellular resolution, allows a block of maximum 1200 µm × 500 µm × 500 µm to be generated [19,20,21].
The rendering modes are filters available in the deepLive™ software 2.0.1. In this study, different rendering and filtering modes of the LC-OCT system were used to visualize the vascular structures as precisely as possible and to capture the different morphological characteristics. The applied modes included the deepGaussian mode and the minimum rendering mode. The deepGaussian mode is applying a gaussian filter combining several consecutive slices, which enhances contrast differences between vessels and the surrounding tissue. The minimum mode projects the minimal intensity of all considered slices, which is particularly suitable for highlighting thick-caliber vessels. The deepGaussian mode was used to detail fine, polymorphic vascular structures that are often difficult to recognize in the original image. In contrast, the minimum rendering mode facilitated the visualization of large-diameter main vascular structures, such as those frequently found in basal cell carcinomas or melanoma metastases. Users can manually adjust the number of consecutive slices to which the filter is applied, according to their rendering preferences. The choice of the appropriate rendering mode was specifically adapted to the respective properties of the vascular structures and the specific problem in order to create the best possible basis for the three-dimensional reconstruction.
The deepLive™ LC-OCT system is a direct skin contact method in which the optical head of the device is placed on the skin surface to create high-resolution images of the vascular structures. To minimize pressure artifacts, the contact pressure during the examination was deliberately kept low. This was controlled by gradually adjusting the pressure, using increased blood flow in the imaged vessels as visual feedback. This increase in blood flow served as an indicator that the pressure was minimal and that the tissue structure was affected as little as possible. The measurements were carried out exclusively by trained and experienced personnel who had extensive experience in using the LC-OCT device. This standardized procedure contributed significantly to ensuring the quality of the images and the validity of the reconstructed vascular structures.
Extreme care was also taken during the complementary dermoscopy to keep contact with the skin as light as possible and to avoid tissue deformation. These measures were crucial in order to display the natural vascular morphologies without distortion and to obtain reliable results for the three-dimensional segmentation of the vascular structures.
The process of reconstructing and visualising vascular structures from the aforementioned 3D stack mode comprises three primary steps (Figure 1):
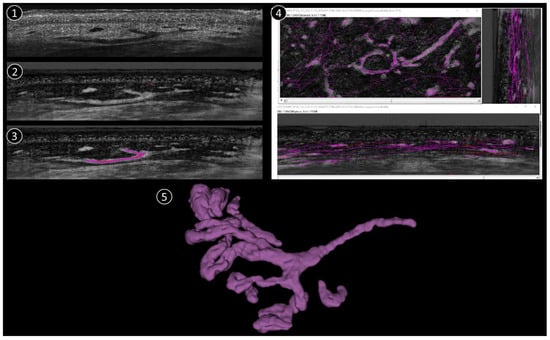
Figure 1.
Schematic reconstruction process. 1: Original LC-OCT image (vertical). 2: Negative LC-OCT image (vertical). 3: Segmentation drawn on LC-OCT images (vertical). 4: Final skeleton after segmentation applied in all 3 orientations (vertical, coronal, horizontal). 5: 3D reconstruction example.
(1) To improve the visibility of the vascular structures within the 3D image stack, the original stack is first converted into a “negative” image. In this context, the term “negative” refers to the inversion of pixel intensities, whereby structures that were originally darker become lighter and vice versa. This conversion is crucial as it allows vessels that may have appeared darker in the original stack to become more prominent and easier to recognize in the subsequent steps.
(2) After converting the image stack to a negative, the next step is to manually trace the vessel structures. The Simple Neurite Tracer (SNT) plugin in the ImageJ software (1.54k) used for this purpose. The SNT plugin is a versatile tool designed for tracing and analyzing tubular structures in 3D images, making it ideal for this application. The manual tracing process is performed in three different orientations of the image stack to ensure comprehensive coverage of the vascular network (sagittal, frontal, and horizontal). The stack is viewed from the side, providing a vertical cross-section. From the front, it provides a vertical cross-section in the coronal plane and it is viewed from above, providing a horizontal cross-section in the transverse plane. In each projection, the skeleton of each vessel is drawn manually by carefully following the course of the vessels throughout the 3D volume. This process is repeated for each vessel within the stack to ensure that the entire vascular network is accurately traced.
(3) Once manual tracing is completed in all three projections, the traced vessel skeletons are used to create a binary mask. This binary mask represents the vessel structures as a binary image in which the vessels are mapped as white pixels (value 1) against a black background (value 0). The binary mask is then smoothed to refine the representation of the vessels and remove any irregularities or artifacts that may have occurred during manual tracing. This smoothing step is crucial for a clean and accurate 3D representation of the vessel architecture.
Finally, the smoothed binary mask is used to reconstruct a 3D model of the vascular network. This 3D architecture provides a detailed and comprehensive visualization of the vessels that can be further analyzed or used for various applications such as the study of vessel morphology or the quantification of vessel parameters. One 3D corresponds to 1200 coronal images + 500 vertical images + ~400 horizontal images (the number of horizontal images depends on how deep the 3D was taken). The full process takes approximately 1h per stack, depending on the complexity of the vascular structure.
A total of 235 patients (115 women, 120 men; medium age: 75 years) with different skin tumors were examined as part of the study. Patients were mainly recruited during surgical consultations, in individual cases, also during conservative consultations of the outpatient clinic of the Department of Dermatology and Allergology at the University Hospital Augsburg. The tumors analyzed included 51 melanomas, 13 melanoma metastases, 25 squamous cell carcinomas, 110 basal cell carcinomas, 13 cases of Bowen’s disease, and 23 benign or rare skin lesions. The segmented vascular structures originated exclusively from skin tumors on the extremities, with the lower extremities being predominantly affected. The images displayed in the results are examples of tumors that were manually segmented by an employee of DAMAE Medical and are now used to train an automatic artificial intelligence for vessels. The study was conducted in accordance with the Declaration of Helsinki and was approved by the Ethics Committee of the LMU Munich for the measurement of the lesions and for the training of an artificial intelligence (protocol numbers 22-0781 and 17-699). Written informed consent was obtained from all study participants, including consent to the publication of anonymized data.
LC-OCT allowed precise visualization of the vascular structures that were characteristic of the respective histological entities of the skin tumors. The vessels were generally clearly segmentable and reproducibly visualizable, which further supported the significance of the results. The three-dimensional descriptive segmentation of tumor vessels presented here is only one aspect of a comprehensive project that is fundamentally concerned with the visualization and analysis of vascular structures in skin tumors. The aim of this project is to gain a better understanding of the vascular architecture of skin tumors in order to gain new insights for diagnostics and possible therapeutic approaches.
3. Results
This results chapter provides a comprehensive analysis of various vascular structures in different types of skin cancer, using advanced imaging techniques such as LC-OCT and the resulting 3D reconstruction. For the first time, these methods are showcased in this work. The figures demonstrate how these methods enable detailed visualization of the vessels, capturing their morphology, arrangement, and spatial relationships in both vertical and horizontal sections. The 3D segmentation further enhances understanding by revealing hidden details of vessel calibers and connections, offering new insights into their pathological roles.
3.1. Melanoma
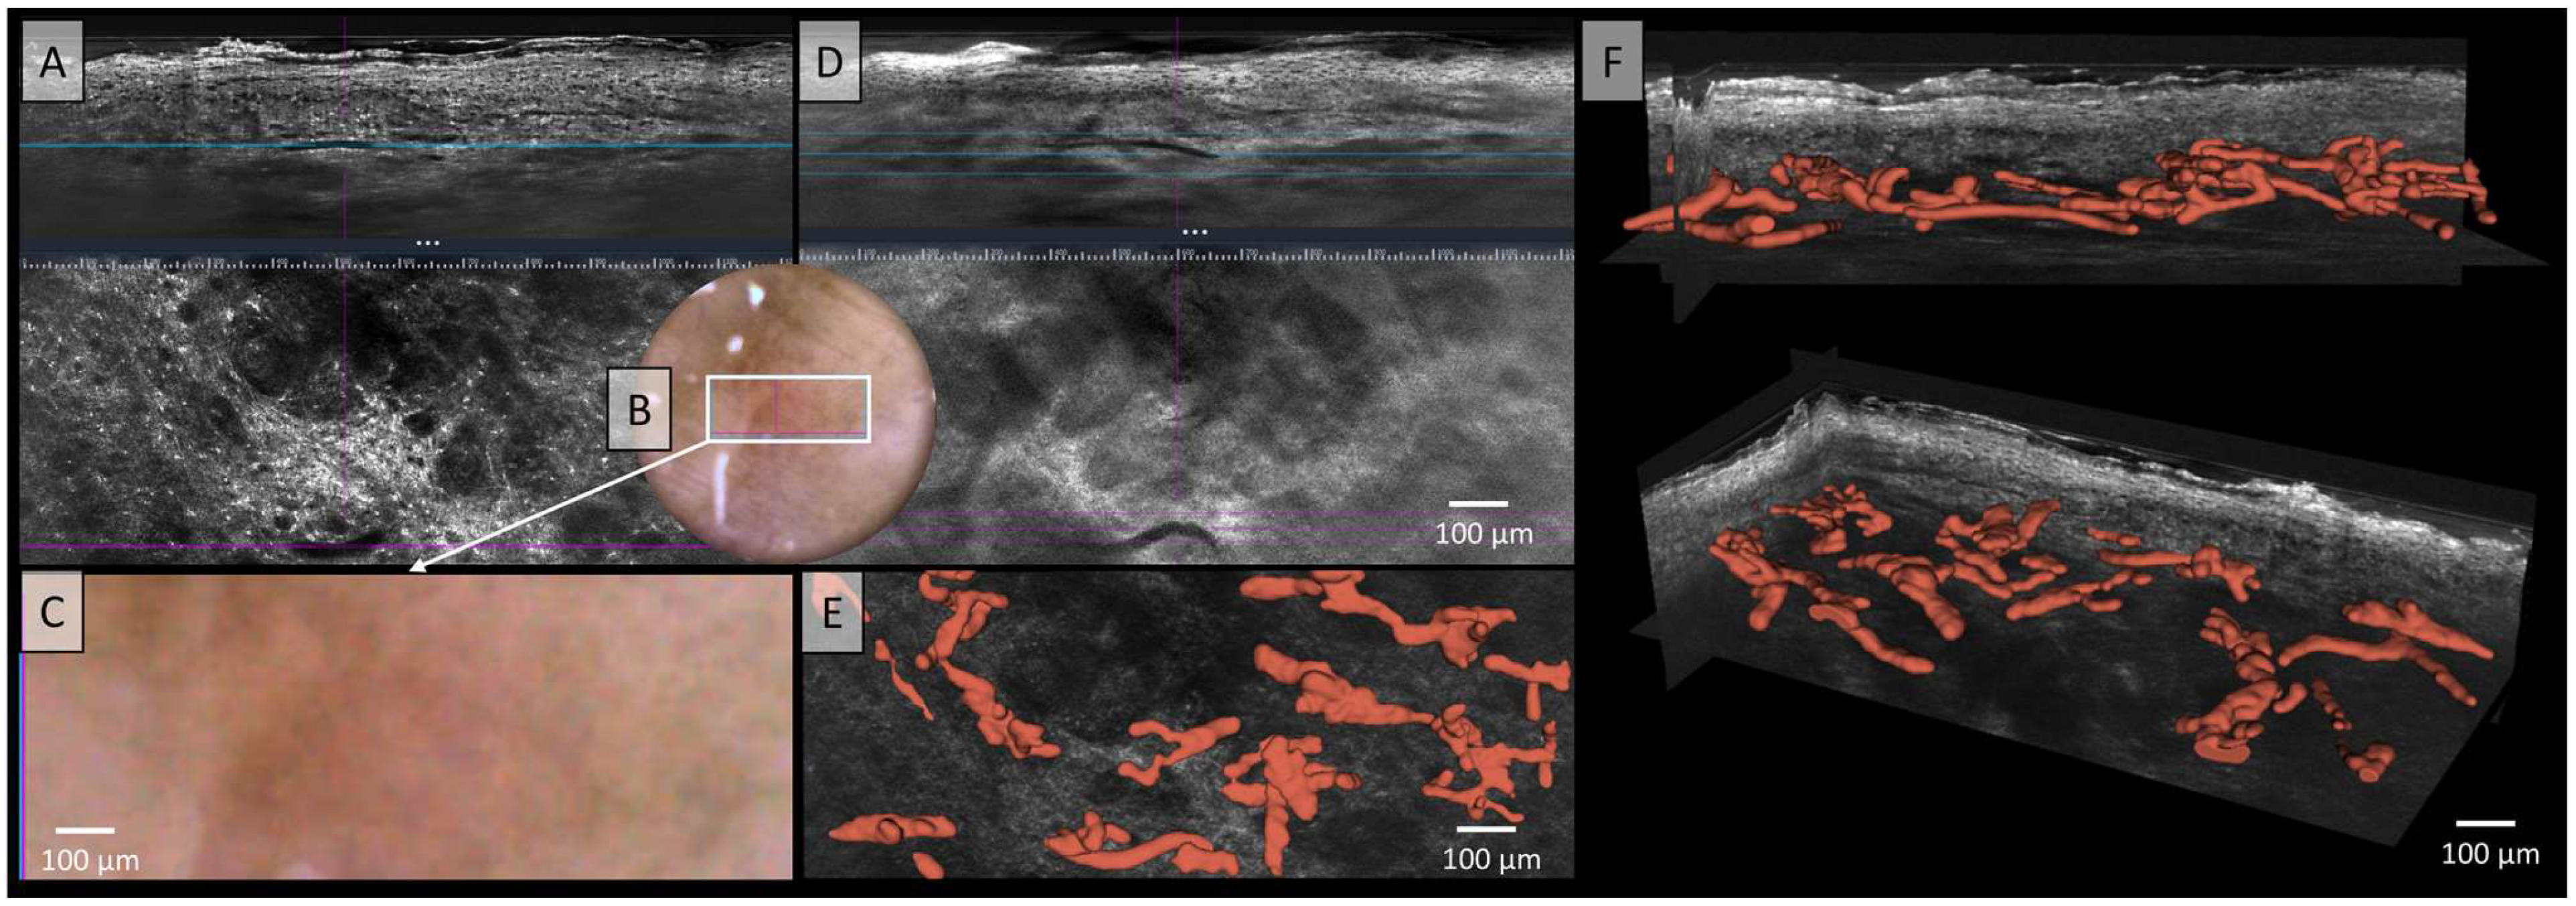
In Figure 2, no correlation between the LC-OCT and dermoscopic images can be established, likely due to pigment melanin obscuring vascular architecture. In the two illustrated LC-OCT image planes, a mixture of vessel structures can be observed, with some appearing elongated at deeper levels, while others form clusters of convoluted vascular conglomerates. No clear correlations can be drawn from the two available images. Additionally, the vessels do not display a uniform or consistent morphology, but rather exhibit marked polymorphism. The description of Figure 2 already highlighted the polymorphic nature of the vessels, characterized by elongated structures and densely arranged vascular conglomerates in deeper tissue layers. However, the relationship between these vessels remained unclear. The spatial arrangement and connections between the vessels are now clearly visualized (Figure 2E,F). A pronounced polymorphism of the vessels is observed across multiple levels and layers, with a diffuse arrangement and a wide range of vessel calibers, varying from very large to very small. However, the blood flow of this melanoma showed a medium to low velocity of the blood cells in the video (see Video S1).

Figure 2.
Vessels of a malignant melanoma in Line-field confocal optical coherence tomography (LC-OCT); (A) Normal rendering (deepGaussian) shows a diffuse arrangement of polymorphic vascular structures consisting of linear vessel parts as well as clumsy conglomerates in both vertical (top image, LC-OCT image size: 1.2 mm (width) × 0.4 mm (height)) and horizontal section (middle image, LC-OCT image size: 1.2 mm (width) × 0.5 mm (height)), the connections cannot be clearly identified, zoom on integrated LC-OCT dermoscopy ((B,C) bottom image, image size: 1.2 mm (width) × 0.5 mm (height)) shows no vessels; the white rectangle represents the area of taken LC-OCT scan. (D) Minimum rendering with large vessel thickness (top and middle image). Three-dimensional (3D) visualisation shows: (E) Horizontal view (bottom image, LC-OCT image size: 1.2 mm (width) × 0.5 mm (height)) on the 3D segmented vessels; (F) two different perspectives of the 3D reconstruction show that the vessels are primarily arranged in one plane (LC-OCT images size: 1.2 (width) × 0.5 (length) × 0.5 (height) mm3).
3.2. Melanoma Metastasis
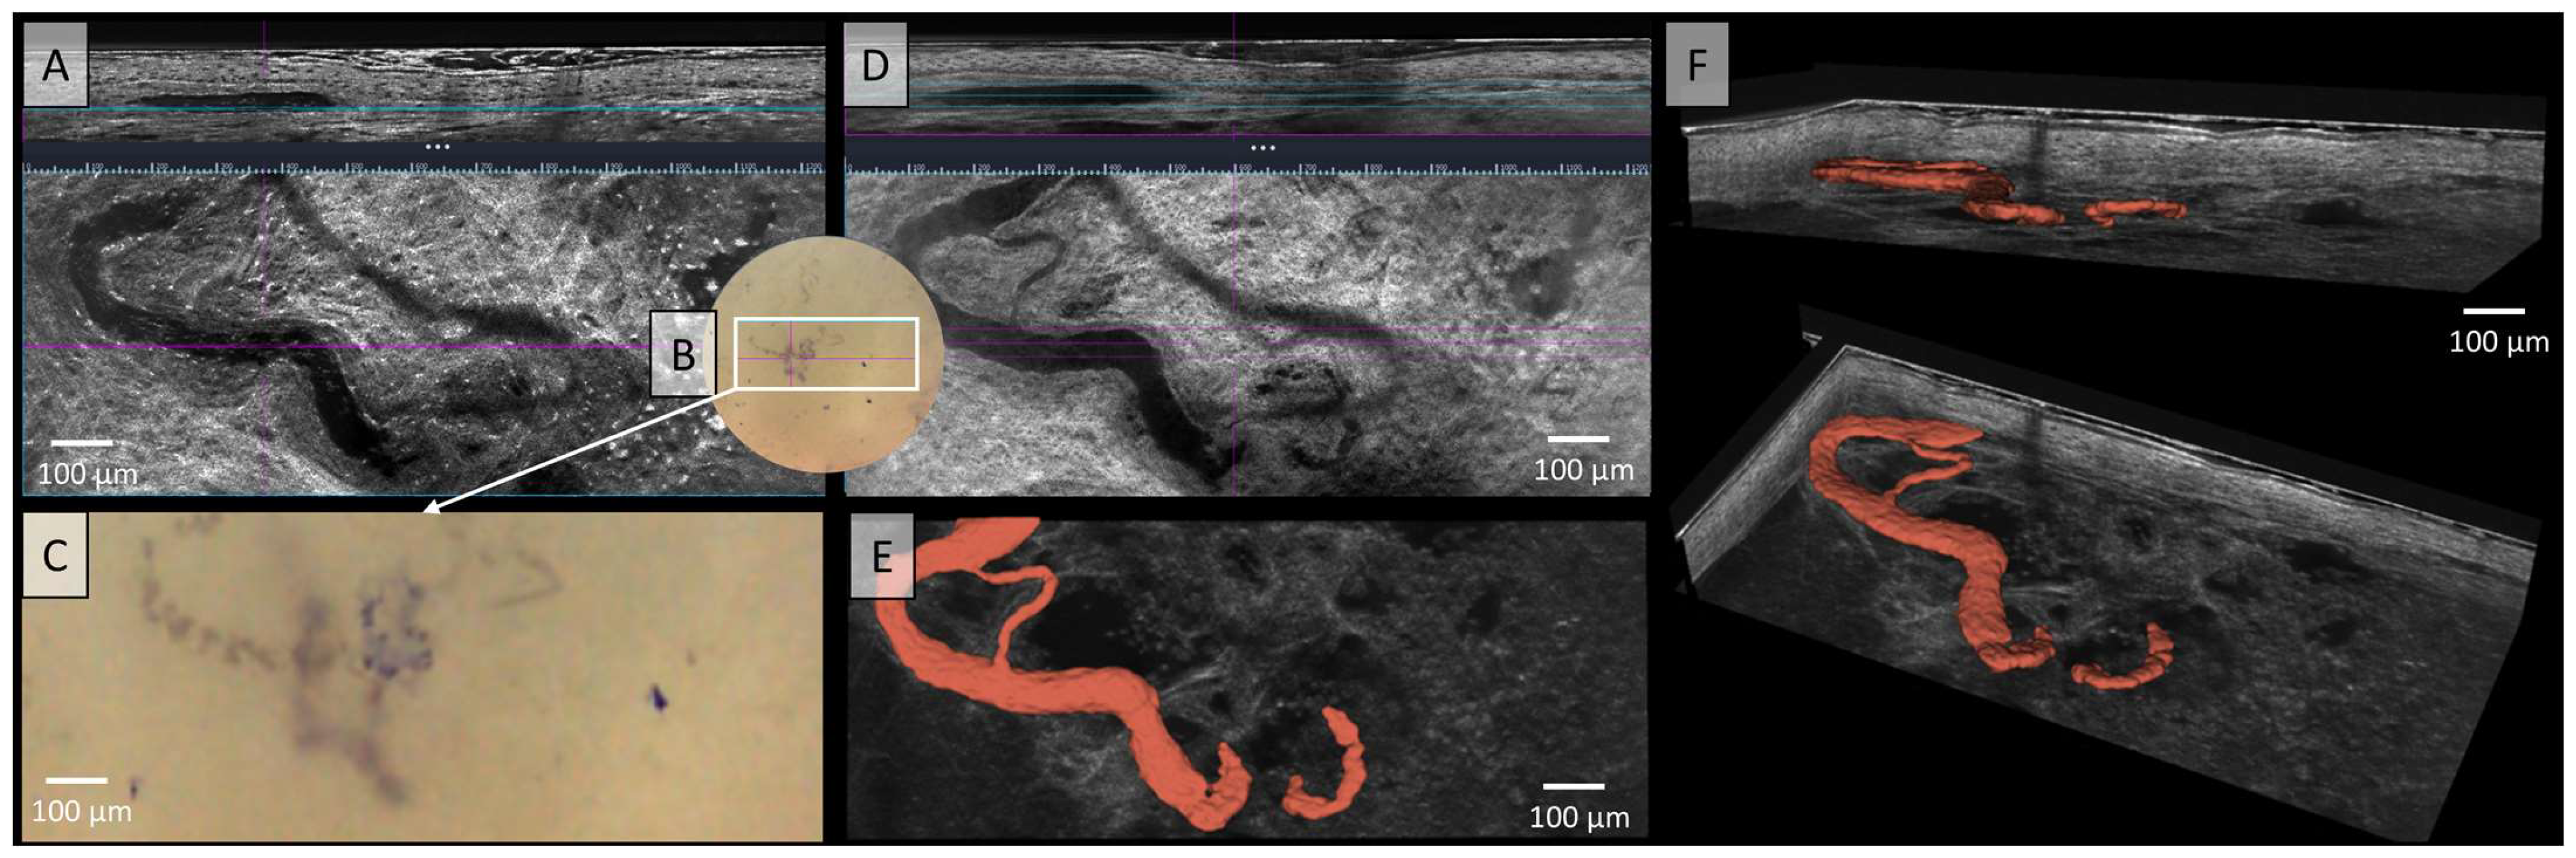
Since the introduction of the LC-OCT device, its high resolution has fundamentally enabled the detailed visualization of blood vessels. In Figure 3, the serpiginous vessel observed in the dermatoscopic image was visualized both in vertical and horizontal sections—once with high contrast (Figure 3A) and once with low contrast (Figure 3D), showing a softer course. The dermoscopy integrated in the LC-OCT shows highly tortuous corkscrew-like vessels of thick caliber with arborising branches (Figure 3C). Using the video function, not only can the vessels be visualised morphologically, but their blood flow can also be assessed both quantitatively and qualitatively. Figure 3E presents the 3D segmented vessels of the same melanoma metastasis in red within a horizontal cross-section. The prominent, yet variably calibrated serpiginous vessel meanders through this representation, forming an anastomosis with itself through arborizing branching. In Figure 3F, the vessel is depicted three-dimensionally from a lateral perspective, allowing for examination from all angles. The small side branch of the vessel was visualized only using 3D segmentation. This newly described 3D reconstruction technique enables a better understanding of morphological changes by providing a comprehensive view of structures that are only partially visible in sectional images due to the different planes.
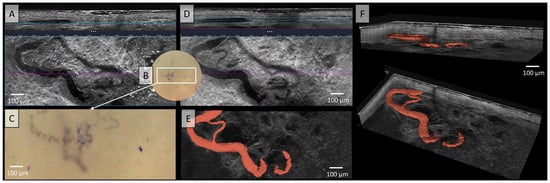
Figure 3.
Vessels of a malignant melanoma’s metastasis in Line-field confocal optical coherence tomography (LC-OCT); (A) Normal rendering (deepGaussian) shows an elongated vessel of large caliber in vertical section (top image, LC-OCT image size: 1.2 mm (width) × 0.4 mm (height)) and the same vessel now as a serpiginous vessel in horizontal section (middle image, LC-OCT image size: 1.2 mm (width) × 0.5 mm height)), zoom on integrated LC-OCT dermoscopy ((B,C) bottom image, image size: 1.2 mm (width) × 0.5 mm (height)) with thick corkscrew-like vessels; the white rectangle represents the area of taken LC-OCT scan. (D) Minimum rendering with large vessel thickness (top and middle image). (E) Horizontal view of a three-dimensional (3D) visualisation of a serpiginous vessel (red) with arborising branching (bottom image, LC-OCT image size: 1.2 mm (width) × 0.5 mm (height)); (F) two different perspectives of the 3D reconstruction (LC-OCT images size: 1.2 (width) × 0.5 (length) × 0.5 (height) mm3).
3.3. Squamous Cell Carcinoma
The vessels depicted in Figure 4 appear irregularly arranged in the LC-OCT, exhibiting various morphological forms without a clear structure. In both vertical and horizontal sections, clusters of vessels can be observed, displaying linear and tortuous patterns as well as varying vessel thicknesses. Although vessels identified in dermoscopy can generally be recognized in LC-OCT cross-sectional images, they cannot be fully visualized. The polymorphism and precise morphology of these vascular conglomerates could only be visualized through 3D segmentation and their representation in red, as shown in Figure 4E,F. In contrast, Figure 4A,D did not reveal clear relationships between the different vessel components. However, the 3D representation allows for the distinction between the vascular systems and illustrates their complexity and polymorphism.
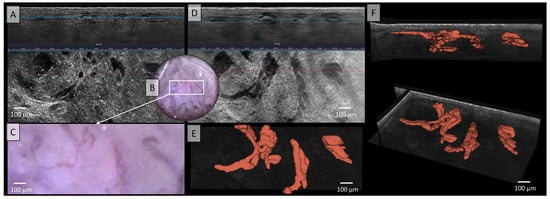
Figure 4.
Vessels of a squamous cell carcinoma in Line-field confocal optical coherence tomography (LC-OCT); (A) Normal rendering (deepGaussian) shows bizarre-looking, partly elongated, partly nodular vessels of varying caliber in both vertical (top image, LC-OCT image size: 1.2 mm (width) × 0.4 mm (height)) and horizontal section (middle image, LC-OCT image size: 1.2 mm (width) × 0.5 mm (height)), zoom on integrated LC-OCT dermoscopy ((B,C) bottom image, image size: 1.2 mm (width) × 0.5 mm (height)) shows multiple strongly twisted, partly corkscrew-like, partly meandering vessels with multiple branches and changes of direction; the white rectangle represents the area of taken LC-OCT scan. (D) Minimum rendering with large vessel thickness (top and middle image). (E) Horizontal view of three-dimensional (3D) visualisation of multiple conglomerates of linear, tortuous, and serpiginous vessels with varying calibers, lacking direct connections between them (red) (bottom image, LC-OCT image size: 1.2 mm (width) × 0.5 mm (height)); (F) two different perspectives of the 3D reconstruction (LC-OCT images size: 1.2 (width) × 0.5 (length) × 0.5 (height) mm3).
3.4. Basal Cell Carcinoma
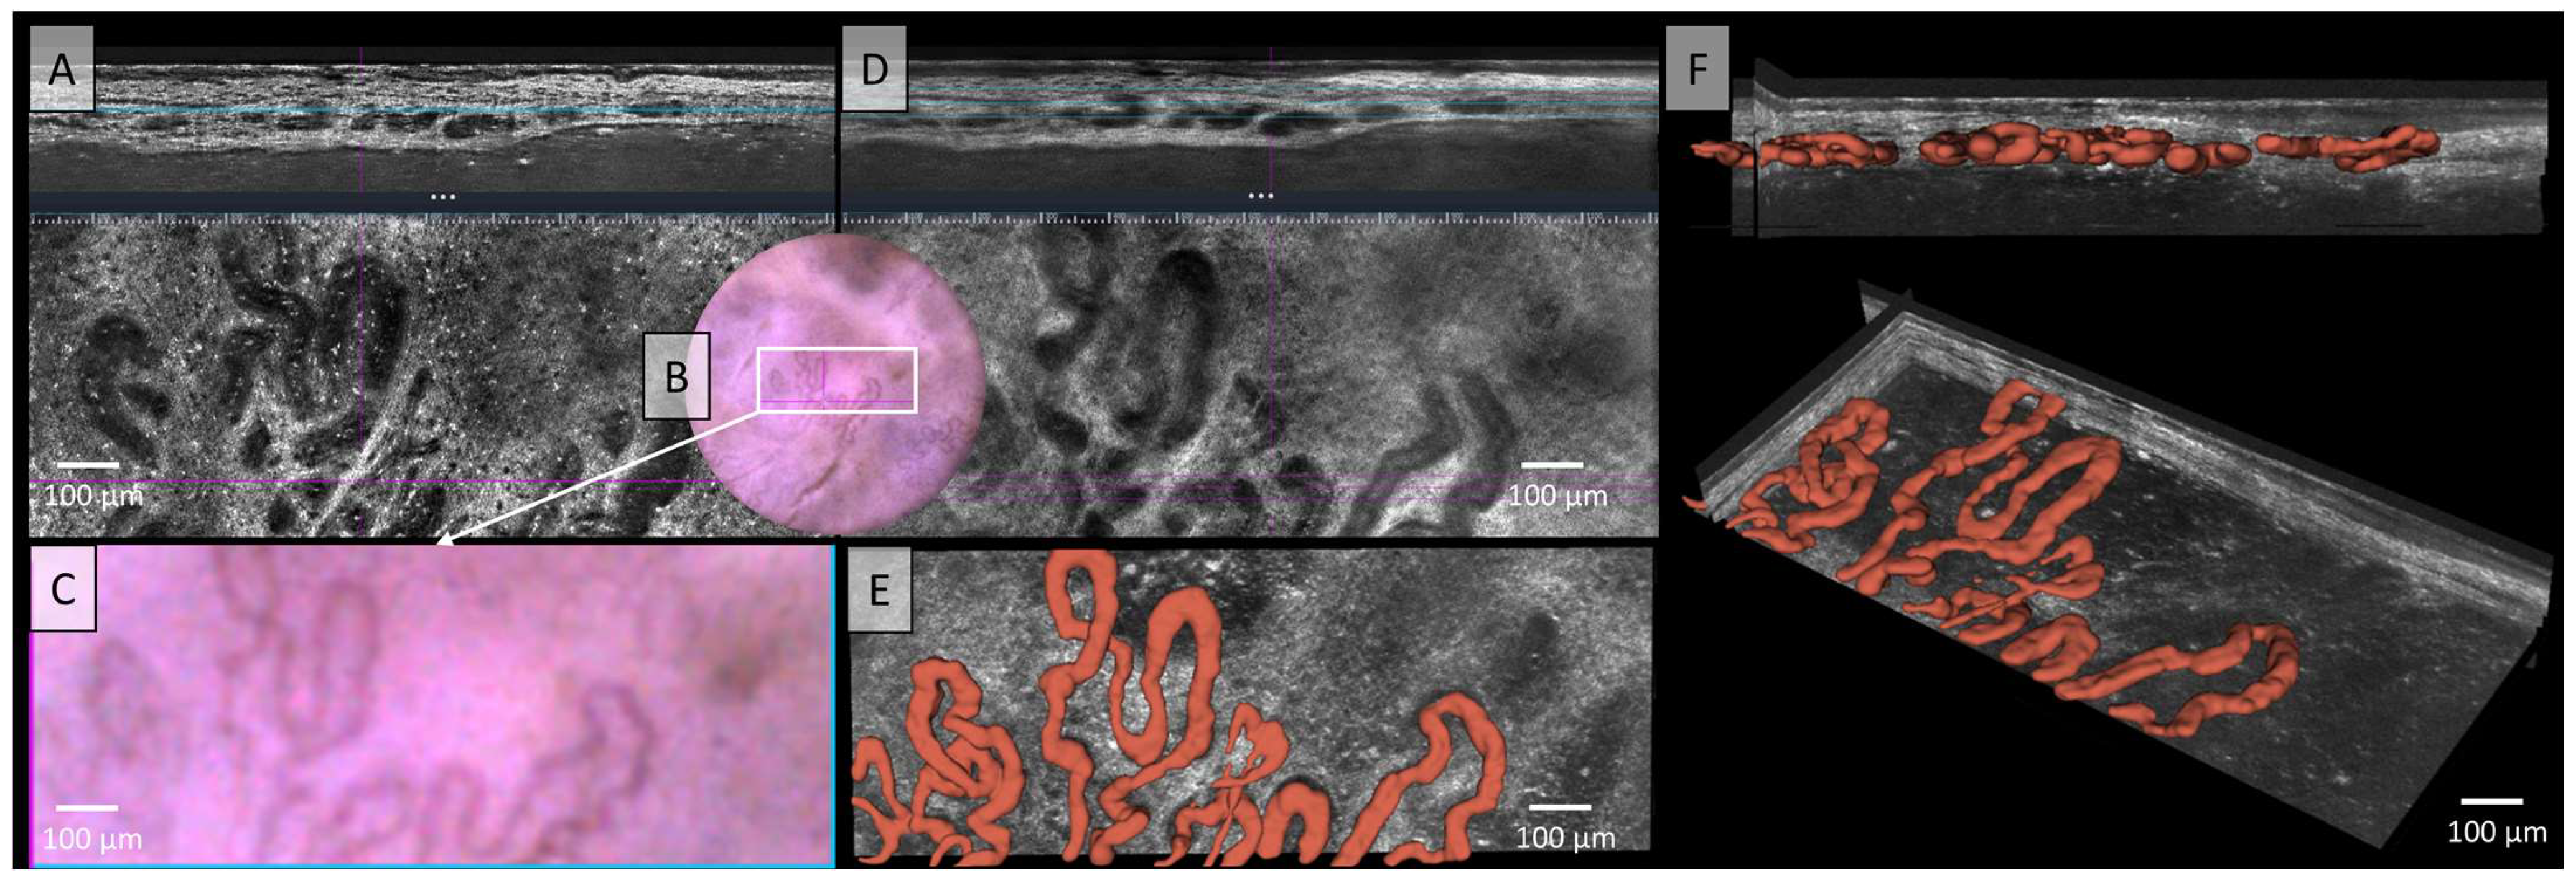
The LC-OCT image in Figure 5 shows irregular, tortuous, twisted, and dilated vessels in both vertical and horizontal sections, which can also be recognised in dermoscopy. In standard LC-OCT, the plasticity of the vessels can only be assumed by viewing both vertical and horizontal slices together. Neither static LC-OCT nor dermoscopy can clearly show whether the vessels cross above or below each other. Moving images in LC-OCT can solve this problem, but still cannot visualize full plasticity. The problem of representing vessel plasticity in space using conventional LC-OCT, already described in the previous section, was solved in Figure 5E,F through by the 3D reconstruction of the vessels, which clearly displays the spatial relationships between the vessels. Furthermore, not only intersecting vessels can be clearly displayed, but also the exact plane in which the vessels are located can be analyzed. The example of this basal cell carcinoma (BCC) clearly shows that the vessels are mostly connected, elongated, sinuous, partly hairpin-like vessels, which are very impressive in terms of caliber. A very strong blood flow with marginal leukocyte rolling can also be visualised in the moving image or video recordings (see Video S2).
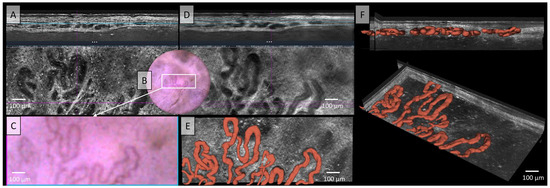
Figure 5.
Vessels of a basal cell carcinoma (BCC) in Line field confocal optical coherence tomography (LC-OCT); (A) Normal rendering (deepGaussian) shows an irregular, tortuous vascular morphology with twisted and dilated vessels in both vertical (top image, LC-OCT image size: 1.2 mm (width) × 0.4 mm (height)) and horizontal section (middle image, LC-OCT image size: 1.2 mm (width) × 0.5 mm (height)), zoom on integrated LC-OCT dermoscopy ((B,C) bottom image, image size: 1.2 mm (width) × 0.5 mm (height)) shows the same; the white rectangle represents the area of taken LC-OCT scan. (D) Minimum rendering with large vessel thickness on (top and middle image). (E) Horizontal view of three-dimensional (3D) visualisation shows multiple, mostly connected, elongated, sinuous, partly hairpin-like vessels, which are very impressive in terms of caliber (red) (bottom image, LC-OCT image size: 1.2 mm (width) × 0.5 mm (height)); (F) two different perspectives of the 3D reconstruction show that the vessels are primarily arranged in one plane (LC-OCT images size: 1.2 (width) × 0.5 (length) × 0.5 (height) mm3).
4. Discussion
LC-OCT enables high-resolution, depth-resolved imaging that captures the full spatial complexity of vascular networks, often obscured or inadequately represented in 2D images. Moreover, only 3D imaging allows for the accurate representation of the volume of hollow structures such as blood vessels. Hidalgo et al. used confocal reflectance microscopy (RCM) for the three-dimensional reconstruction of vascular structures in eccrine poromas, rare benign skin tumors. This non-invasive technique enabled a detailed visualization of the vascular architecture of the tumor and thus a more precise characterization. The study highlights the advantages of RCM 3D imaging by mapping different vascular patterns in eccrine poromas, which allows real-time in vivo examination without biopsies. This work also supports further research into 3D imaging for the characterization of various skin tumors [22]. Moreover, Rashidi et al. explored the enhancement of microvascular imaging using Optical Coherence Tomography (OCT) by leveraging 3D neural networks combined with a channel attention mechanism. They developed a specialized 3D neural network designed to process information from multiple OCT data layers, aiming to enhance the accuracy of microvascular imaging. The channel attention mechanism played a crucial role in emphasizing and extracting key features of the microvascular structure. The proposed approach demonstrated significant improvements in image quality compared to conventional OCT techniques, offering clearer and more detailed visualizations of microvessels—vital for both clinical diagnostics and research. These advancements in image processing, driven by machine learning, have the potential to further elevate OCT technology, particularly in vascular imaging applications [23]. Another interesting study from Maurya et al. presents a novel approach for diagnosing BCC by combining deep learning (DL) techniques with the analysis of telangiectasia features. Their study demonstrates that integrating DL methods in the evaluation of telangiectasias can significantly enhance diagnostic accuracy. The authors employed a neural network trained on dermoscopic images for BCC detection and incorporated telangiectasia features to optimize model performance. Their findings indicate that this fusion approach not only improves diagnostic reliability but also reduces both false positives and false negatives. This method represents a promising advancement in non-invasive skin cancer diagnosis and has the potential to lead to better clinical outcomes for patients [24]. Like our study, which provides the foundation for the training of future artificial intelligence (AI) models with LC-OCT, the publication by Casper et al. (2019) introduces an enhanced method for vessel segmentation, aimed primarily at optimizing the quantification of capillary networks in skin tissues using optical coherence tomography angiography (OCTA). This approach addresses the limitations of traditional vessel segmentation techniques, which often struggle to accurately capture fine capillaries. The key steps in this methodology include preprocessing to reduce noise and enhance image quality, initial vessel segmentation to differentiate vascular structures from background tissue, and optimization to refine the segmentation and minimize artifacts. The results demonstrate that this optimized method significantly improves the precision of capillary network visualization and quantification compared to existing techniques [25]. Meiburger et al. previously addressed the automatic determination of BCC lesion areas using OCTA in combination with a skeletonization method. The goal of this study was to precisely determine tumor areas by reducing the complex vascular network to simplified lines. By integrating OCTA imaging with a skeletonization algorithm, the boundary and area of the carcinoma could be automatically identified. Preliminary results indicated that this method shows promise for accurately and automatically determining the size and extent of BCC lesions [26].
Our study highlights in the material and methods section the challenges and the immense amount of time required to accurately reconstruct complex 3D vascular networks manually. Automations, such as the segmentation methods presented by Giarratano et al. could address some of these limitations, especially in terms of scalability and clinical applicability. The integration of automatic segmentation tools, as proposed by Giarratano et al., could significantly reduce processing time and improve the consistency of datasets in the future. However, upstream manual tracking is still a proven approach for detailed 3D reconstructions. The authors provided parafoveal OCT angiography images of the retina with associated manual segmentations as a reference. Various advanced methods for vessel enhancement and binarization, including both hand-crafted filters and neural network architectures, were investigated. The results showed that deep learning architectures such as U-Net and CS-Net achieved the best performance. Furthermore, the choice of segmentation method was found to have a significant impact on the accuracy of clinically relevant metrics, such as vessel density. The authors published their dataset and source code to support standardization efforts in OCTA image segmentation [27]. However, this work was done with OCTA for the eyes, with LC-OCT in skin just a few studies are available, in which also a U-Net was used for AI segmentation of skin layers as in healthy skin or AI [17,28,29,30,31,32,33,34,35].
Meiburger et. al. also showed that although manual tracing of vessels provides highly detailed reconstructions, it is time-consuming and prone to subjective errors. Automated segmentation algorithms, such as the U-Net architectures described by the authors, could overcome these limitations and at the same time ensure greater reproducibility [16].
In their publication, Zhang et al. described the three-dimensional modeling and analysis of retinal microvasculature, a major advance in ophthalmic imaging. They developed a precise approach for 3D reconstruction of the retinal vasculature based on high-resolution OCT angiography images. This voxel-based algorithm enables a detailed visualization of the microvasculature, including geometric parameters such as curvature, bifurcations, and diameter. The metrics presented, including the tortuosity index for quantifying vessel tortuosity and metrics for branching complexity and connectivity, provide new insights into the spatial morphology of vessels. Zhang et al. showed that this method is particularly useful for the early detection of vascular abnormalities in the eye and for monitoring changes during therapeutic interventions. The authors also mentioned the integration of machine learning to further improve the automation and accuracy of the method [36]. This is a goal that we are also pursuing with this preliminary work.
Although manual segmentation of vessels provides precise results, it is susceptible to operator bias as it depends on the subjective interpretation and manual tracing of the operator. Despite training and random checks, complete objectivity cannot be guaranteed. Future approaches using automated or AI-based methods could overcome these limitations, reducing manual effort and at the same time enabling greater consistency and reproducibility of results.
In particular, for (skin) tumors, which are known to exhibit pronounced polymorphisms in dermatoscopic evaluations, the spatial component can now be visualized with our approach in 3D. This allows for the analysis of the spatial distribution and structural characteristics of blood vessels within the tumor microenvironment. Fundamentally, these findings provide critical insights into tumor angiogenesis and vascular polymorphism, referring to the variability in vascular structures and patterns. Additionally, this introduces a new parameter and methodology that aims to enhance the understanding of tumor growth and progression, potentially leading to more effective therapeutic strategies and interventions. Ha-Wissel et al. demonstrated in 2022 that conventional D-OCT can be used effectively for therapy monitoring in inflammatory dermatoses, such as psoriasis and atopic dermatitis, during systemic treatment. In their study, changes were observed in vascular density, plexus depth, vessel diameter, and vessel count [37]. Preliminary follow-up investigations in our study on therapy monitoring, both under local and systemic immunotherapy, show promising results regarding vascular changes in various skin tumors.
In 2002, Bono et al. first described corkscrew vessels in the dermoscopy of melanoma metastases, which can be clearly identified in the dermoscopic image shown in Figure 3 [38]. The metastasis of malignant melanoma has been the subject of various research studies focusing on D-OCT imaging; however, the blood vessels associated with these melanomas have never been specifically investigated using this imaging technique [39,40]. However, until now, it was not possible to visualize these vessels in 3D. Using the deepLive™ LC-OCT device in combination with advanced image processing tools, such as the Simple Neurite Tracer (SNT) plugin in ImageJ, it is now possible to visualize and analyze these vessels in vivo, as demonstrated in Figure 3. The fact that the corkscrew vessel twists are primarily due to their extension across multiple layers can only be conclusively proven through 3D imaging.
The linear-irregular vessels described by Zalaudek et al. were also successfully visualized using 3D segmentation in Figure 4 [41]. This is particularly important in cases of vascular polymorphism in squamous cell carcinoma (SCC), where elongated, non-homogeneous vessels coexist with dotted, linear-irregular, or glomerular vessels. A 3D representation can aid in illustrating the features of these specific vessels, as described in the literature, since in 2D imaging, vessels are only partially displayed, preventing an accurate visualization of their spatial relationships [42,43]. Ulrich et al. have previously described the vessels of SCC using D-OCT. Their study revealed various irregular forms and patterns of the vessels, as well as changes in vessel diameters. The images also displayed multiple diverse and atypical vascular forms, such as dots, blobs, and curves. However, these could not be directly correlated, as the technique only allowed for visualization in a single plane. The assessment of these vessels was useful in determining the invasiveness of the carcinoma, as disordered and irregular vessels are indicative of malignancy [18].
In Figure 5, hairpin vessels were already visible in dermoscopy, and these were subsequently identified in the dermis using LC-OCT. According to the literature, this vascular morphology is observed in both melanocytic and non-melanocytic tumors, and occasionally even in benign skin lesions [44,45]. In Figure 5, these vessels were depicted in direct association with the nodular tumor nests of a nodular BCC, a finding previously described by Lupu et al. using RCM [46]. Notably, thick, large-caliber vessels, as seen in our case, are well-documented in the literature. Braun et al. describe thick, branching arborizing vessels that taper towards the periphery, while Lupu et al. reported hairpin vessels in 66.7% of cases involving aggressive BCCs of the lower extremities [46,47]. This is consistent with our findings, as the patient’s pigmented nodular BCC was located on the extensor surface of the lower leg. Ulrich et al. also described the blood vessels surrounding tumor nests in BCCs. Their studies report the presence of both very thick and very thin vessels. Similarly, our LC-OCT 3D reconstruction, as previously described, also reveals both very thick and very thin vessels. However, due to the limited examination area in our study, we cannot determine whether the vessels are primarily localized in the center, as noted in their work [18].
Figure 2A–D illustrates a diffuse arrangement of polymorphic vascular structures, comprising both linear vessel segments and irregular conglomerates, with connections that are difficult to clearly discern. In contrast, the 3D visualization in Figure 2E,F allowed for a detailed representation of vessel organization and polymorphism, showing both linear and glomerular vessels. A review of the literature on melanoma-associated vessels reveals that the term “polymorphic vessels” is frequently encountered, with the most common combination being dotted vessels and linear–irregular vessels [45]. Furthermore, Welzel et al. were able to demonstrate the polymorphism of blood vessels using D-OCT in comparison to healthy skin. In this study, a higher prevalence of linear and coiled vessels, some of which resemble glomerular vascular tufts, was observed when compared to healthy skin [40]. Additionally, the presence of distinctly varying vessel calibers is well-documented in the literature and is characteristic of melanomas and their vascular polymorphism [43]. However, little has been published on the distribution of vessels across multiple layers, likely due to the limited number of 3D visualizations of skin in existing studies. Future developments in LC-OCT technology could include the integration of AI-analysis capable of automatically detecting vessels in LC-OCT images. Our findings could be used as a foundation for the future training of AI models, since manual segmentation is time consuming. This AI feature would then not only assist in assessing the vasculature of skin tumors for treatment planning and monitoring but could also play a valuable role in the diagnosis and follow-up of inflammatory diseases. Moreover, with trained AI models, the 3D reconstruction of multiple skin tumors is possible in a very short time. Then our preliminary findings on 3D skin tumor vascularization could be confirmed in a larger study cohort.
In the future, imaging technology is expected to achieve significant advancements beyond the current capability to visualize even individual blood cells within blood vessels. With the excellent axial and lateral resolution of less than 1.3 µm, it will become possible not only to detect but also to differentiate these cells. This capability could be further enhanced with AI, which can analyze and classify complex patterns and features. Similar to flow cytometry, which is well-established in hematology, LC-OCT has the potential to analyze cells flowing through a vessel in vivo and in real-time [48]. Following appropriate manual annotation, AI could be capable of autonomously analyzing the physical and chemical properties of these cells.
Another promising application of this technology is the future visualization of lymphatic vessels in the skin. With its high resolution and advanced imaging techniques, it may enable the production of detailed images that distinguish lymphatic vessels from blood vessels, providing new insights into the function and pathology of the lymphatic system. Moreover, it could provide an early, real-time view of potential lymphatic invasion in cases of melanoma in the future.
A potential further limiting factor of this study is the influence of contact pressure during contact-based imaging with the LC-OCT system. Although pressure was deliberately minimized during measurements and visual feedback in the form of increased blood flow was used to ensure the most unbiased visualization of vascular structures, complete avoidance of pressure artifacts remains a challenge. The contact pressure can influence the morphology of the vessels, especially in sensitive tissue structures. In addition, minimizing pressure is highly dependent on the experience and care of the person performing the procedure. Although the measurements were performed exclusively by trained and experienced personnel, it cannot be completely ruled out that inter-individual differences in the application of pressure may have caused a certain variability in the results. Future studies could attempt to further standardize the influence of pressure, for example by using mechanically calibrated pressure sensors to objectively control tissue stress during imaging. These approaches could help to further improve the validity and reproducibility of the results.
Therefore, minimizing the pressure applied by the measurement probe is crucial. Proper alleviation of pressure ensures that the tissue remains in its natural state, allowing for more accurate and reliable visualization and quantification of the vascular structures. This is essential for obtaining high-quality 3D images and for ensuring that the spatial characteristics of the vessels are represented accurately.
5. Conclusions
The process of reconstructing and visualizing vascular structures from 3D image stacks, though methodically detailed, provides significant advantages for both clinical and research applications. By enhancing vessel visibility, ensuring comprehensive tracing, and creating accurate 3D models, this method offers a powerful tool for studying and understanding complex vascular networks. The insights gained from these 3D reconstructions are the foundation for the future training of AI models and can lead to better diagnostic accuracy, improved treatment planning, and a deeper understanding of vascular biology, ultimately contributing to advancements in medical science and patient care.
Supplementary Materials
The following supporting information can be downloaded at: www.mdpi.com/article/10.3390/app15010159/s1; Video S1: Live blood flow of the malignant melanoma recorded with LC-OCT (in Figure 2) illustrating small blood vessels with medium to low velocity of the blood cells. Video S2: Live blood flow of the basal cell carcinoma recorded with LC-OCT (in Figure 5) illustrating large blood vessels with high velocity of the blood cells and marginal leukocyte rolling.
Author Contributions
Conceptualization, O.M. and S.S. (Sandra Schuh); methodology, O.M. and S.S. (Sandra Schuh); software, O.M.; validation, O.M., S.S. (Sandra Schuh) and J.W.; formal analysis, O.M.; investigation, O.M.; resources, O.M., S.S. (Sandra Schuh) and J.W.; data curation, O.M.; writing—original draft preparation, O.M.; writing—review and editing, H.W., S.S. (Sophia Schlingmann), S.S. (Sandra Schuh) and J.W.; visualization, O.M.; supervision, S.S. (Sandra Schuh); project administration, S.S. (Sandra Schuh); funding acquisition, O.M. and S.S. (Sandra Schuh). All authors have read and agreed to the published version of the manuscript.
Funding
This research was funded by intramural funding of the University of Augsburg.
Institutional Review Board Statement
The study was conducted following the Declaration of Helsinki and approved by the ethics committee of LMU Munich (Protocol Number 22-0781 (11 October 2022) and 17-699 (30 June 2022).
Informed Consent Statement
Informed consent was obtained from all subjects involved in the study. Written informed consent has been obtained from the patients to publish this paper.
Data Availability Statement
The raw data supporting the conclusions of this article will be made available by the authors on request.
Acknowledgments
We thank Clara Tavernier, an employee from DAMAE Medical for the segmentation of the vessels.
Conflicts of Interest
Oliver Mayer, Hanna Wirsching and Sophia Schlingmann declare no conflict of interest. Julia Welzel: Lecture fees and travel expenses from Abbvie, Almirall, BMS, Boehringer Ingelheim, Janssen, Infectopharm Leo, Lilly, Mibe, MSD, Novartis, Pfizer, Sanofi. Sandra Schuh: Lecture fees and travel costs from Galderma and Lilly.
References
- Perwein, M.K.E.; Welzel, J.; De Carvalho, N.; Pellacani, G.; Schuh, S. Dynamic Optical Coherence Tomography: A Non-Invasive Imaging Tool for the Distinction of Nevi and Melanomas. Cancers 2022, 15, 20. [Google Scholar] [CrossRef] [PubMed]
- Latriglia, F.; Ogien, J.; Tavernier, C.; Fischman, S.; Suppa, M.; Perrot, J.L.; Dubois, A. Line-Field Confocal Optical Coherence Tomography (LC-OCT) for Skin Imaging in Dermatology. Life 2023, 13, 2268. [Google Scholar] [CrossRef] [PubMed]
- Schuh, S.; Ruini, C.; Perwein, M.K.E.; Daxenberger, F.; Gust, C.; Sattler, E.C.; Welzel, J. Line-Field Confocal Optical Coherence Tomography: A New Tool for the Differentiation between Nevi and Melanomas? Cancers 2022, 14, 1140. [Google Scholar] [CrossRef] [PubMed]
- Gust, C.; Schuh, S.; Welzel, J.; Daxenberger, F.; Hartmann, D.; French, L.E.; Ruini, C.; Sattler, E.C. Line-Field Confocal Optical Coherence Tomography Increases the Diagnostic Accuracy and Confidence for Basal Cell Carcinoma in Equivocal Lesions: A Prospective Study. Cancers 2022, 14, 1082. [Google Scholar] [CrossRef]
- Ruini, C.; Schuh, S.; Gust, C.; Kendziora, B.; Frommherz, L.; French, L.E.; Hartmann, D.; Welzel, J.; Sattler, E. Line-field optical coherence tomography: In vivo diagnosis of basal cell carcinoma subtypes compared with histopathology. Clin. Exp. Dermatol. 2021, 46, 1471–1481. [Google Scholar] [CrossRef]
- Folkman, J. Tumor angiogenesis: Therapeutic implications. N. Engl. J. Med. 1971, 285, 1182–1186. [Google Scholar] [CrossRef]
- Ferrara, N.; Kerbel, R.S. Angiogenesis as a therapeutic target. Nature 2005, 438, 967–974. [Google Scholar] [CrossRef]
- Carmeliet, P. Angiogenesis in life, disease and medicine. Nature 2005, 438, 932–936. [Google Scholar] [CrossRef]
- Semenza, G.L. Targeting HIF-1 for cancer therapy. Nat. Rev. Cancer 2003, 3, 721–732. [Google Scholar] [CrossRef]
- Ferrara, N.; Hillan, K.J.; Gerber, H.P.; Novotny, W. Discovery and development of bevacizumab, an anti-VEGF antibody for treating cancer. Nat. Rev. Drug Discov. 2004, 3, 391–400. [Google Scholar] [CrossRef]
- Jain, R.K. Normalization of tumor vasculature: An emerging concept in antiangiogenic therapy. Science 2005, 307, 58–62. [Google Scholar] [CrossRef] [PubMed]
- Talmadge, J.E.; Fidler, I.J. AACR centennial series: The biology of cancer metastasis: Historical perspective. Cancer Res. 2010, 70, 5649–5669. [Google Scholar] [CrossRef] [PubMed]
- Joyce, J.A.; Pollard, J.W. Microenvironmental regulation of metastasis. Nat. Rev. Cancer 2009, 9, 239–252. [Google Scholar] [CrossRef]
- Valastyan, S.; Weinberg, R.A. Tumor metastasis: Molecular insights and evolving paradigms. Cell 2011, 147, 275–292. [Google Scholar] [CrossRef]
- Desgrosellier, J.S.; Cheresh, D.A. Integrins in cancer: Biological implications and therapeutic opportunities. Nat. Rev. Cancer 2010, 10, 9–22. [Google Scholar] [CrossRef]
- Meiburger, K.M.; Salvi, M.; Rotunno, G.; Drexler, W.; Liu, M. Automatic Segmentation and Classification Methods Using Optical Coherence Tomography Angiography (OCTA): A Review and Handbook. Appl. Sci. 2021, 11, 9734. [Google Scholar] [CrossRef]
- Chauvel-Picard, J.; Bérot, V.; Tognetti, L.; Orte Cano, C.; Fontaine, M.; Lenoir, C.; Pérez-Anker, J.; Puig, S.; Dubois, A.; Forestier, S.; et al. Line-field confocal optical coherence tomography as a tool for three-dimensional in vivo quantification of healthy epidermis: A pilot study. J. Biophotonics 2022, 15, e202100236. [Google Scholar] [CrossRef]
- Ulrich, M.; Themstrup, L.; de Carvalho, N.; Manfredi, M.; Grana, C.; Ciardo, S.; Kästle, R.; Holmes, J.; Whitehead, R.; Jemec, G.B.; et al. Dynamic Optical Coherence Tomography in Dermatology. Dermatology 2016, 232, 298–311. [Google Scholar] [CrossRef]
- Medical, D. Overview & Specifications—Line-Field Confocal Optical Coherence Tomography (LC-OCT). Available online: https://damae-medical.com/files/Brochure_deepLive.pdf (accessed on 2 June 2024).
- Dubois, A.; Levecq, O.; Azimani, H.; Davis, A.; Ogien, J.; Siret, D.; Barut, A. Line-field confocal time-domain optical coherence tomography with dynamic focusing. Opt. Express 2018, 26, 33534–33542. [Google Scholar] [CrossRef]
- Dubois, A.; Levecq, O.; Azimani, H.; Siret, D.; Barut, A.; Suppa, M.; Del Marmol, V.; Malvehy, J.; Cinotti, E.; Rubegni, P.; et al. Line-field confocal optical coherence tomography for high-resolution noninvasive imaging of skin tumors. J. Biomed. Opt. 2018, 23, 106007. [Google Scholar] [CrossRef]
- Hidalgo, L.; Hanlon, K.L.; Correa-Selm, L.; Villaseca, M.A.; Carrasco, K.; Peirano, D.; Donoso, F.; Uribe, P.; Navarrete-Dechent, C. Three-dimensional reconstruction of eccrine poroma vessels seen under reflectance confocal microscopy. Exp. Dermatol. 2023, 32, 2040–2042. [Google Scholar] [CrossRef] [PubMed]
- Rashidi, M.; Kalenkov, G.; Green, D.J.; McLaughlin, R.A. Improved microvascular imaging with optical coherence tomography using 3D neural networks and a channel attention mechanism. Sci. Rep. 2024, 14, 17809. [Google Scholar] [CrossRef] [PubMed]
- Maurya, A.; Stanley, R.J.; Aradhyula, H.Y.; Lama, N.; Nambisan, A.K.; Patel, G.; Saeed, D.; Swinfard, S.; Smith, C.; Jagannathan, S.; et al. Basal Cell Carcinoma Diagnosis with Fusion of Deep Learning and Telangiectasia Features. J. Imaging Inform. Med. 2024, 37, 1137–1150. [Google Scholar] [CrossRef] [PubMed]
- Casper, M.; Schulz-Hildebrandt, H.; Evers, M.; Birngruber, R.; Manstein, D.; Hüttmann, G. Optimization-based vessel segmentation pipeline for robust quantification of capillary networks in skin with optical coherence tomography angiography. J. Biomed. Opt. 2019, 24, 046005. [Google Scholar] [CrossRef]
- Meiburger, K.M.; Chen, Z.; Sinz, C.; Hoover, E.; Minneman, M.; Ensher, J.; Kittler, H.; Leitgeb, R.A.; Drexler, W.; Liu, M. Automatic skin lesion area determination of basal cell carcinoma using optical coherence tomography angiography and a skeletonization approach: Preliminary results. J. Biophotonics 2019, 12, e201900131. [Google Scholar] [CrossRef]
- Giarratano, Y.; Bianchi, E.; Gray, C.; Morris, A.; MacGillivray, T.; Dhillon, B.; Bernabeu, M.O. Automated Segmentation of Optical Coherence Tomography Angiography Images: Benchmark Data and Clinically Relevant Metrics. Transl. Vis. Sci. Technol. 2020, 9, 5. [Google Scholar] [CrossRef]
- Ali, A.; Colombe, L.; Mélanie, P.; Agnes, P.L.; Meryem, N.; Samuel, R.; Guénolé, G.; Jean-Hubert, C.; Rodolphe, K.; Franck, B. Comparison of facial skin ageing in healthy Asian and Caucasian females quantified by in vivo line-field confocal optical coherence tomography 3D imaging. Skin. Res. Technol. 2024, 30, e13643. [Google Scholar] [CrossRef]
- Assi, A.; Fischman, S.; Lopez, C.; Pedrazzani, M.; Grignon, G.; Missodey, R.; Korichi, R.; Cauchard, J.H.; Ralambondrainy, S.; Bonnier, F. Evaluating facial dermis aging in healthy Caucasian females with LC-OCT and deep learning. Sci. Rep. 2024, 14, 24113. [Google Scholar] [CrossRef]
- Bonnier, F.; Pedrazzani, M.; Fischman, S.; Viel, T.; Lavoix, A.; Pegoud, D.; Nili, M.; Jimenez, Y.; Ralambondrainy, S.; Cauchard, J.H.; et al. Line-field confocal optical coherence tomography coupled with artificial intelligence algorithms to identify quantitative biomarkers of facial skin ageing. Sci. Rep. 2023, 13, 13881. [Google Scholar] [CrossRef]
- Breugnot, J.; Rouaud-Tinguely, P.; Gilardeau, S.; Rondeau, D.; Bordes, S.; Aymard, E.; Closs, B. Utilizing deep learning for dermal matrix quality assessment on in vivo line-field confocal optical coherence tomography images. Skin. Res. Technol. 2023, 29, e13221. [Google Scholar] [CrossRef]
- Daxenberger, F.; Deußing, M.; Eijkenboom, Q.; Gust, C.; Thamm, J.; Hartmann, D.; French, L.E.; Welzel, J.; Schuh, S.; Sattler, E.C. Innovation in Actinic Keratosis Assessment: Artificial Intelligence-Based Approach to LC-OCT PRO Score Evaluation. Cancers 2023, 15, 4457. [Google Scholar] [CrossRef] [PubMed]
- Fischman, S.; Pérez-Anker, J.; Tognetti, L.; Di Naro, A.; Suppa, M.; Cinotti, E.; Viel, T.; Monnier, J.; Rubegni, P.; Del Marmol, V.; et al. Non-invasive scoring of cellular atypia in keratinocyte cancers in 3D LC-OCT images using Deep Learning. Sci. Rep. 2022, 12, 481. [Google Scholar] [CrossRef] [PubMed]
- Le Blay, H.; Raynaud, E.; Bouayadi, S.; Rieux, E.; Rolland, G.; Saussine, A.; Jachiet, M.; Bouaziz, J.D.; Lynch, B. Epidermal renewal during the treatment of atopic dermatitis lesions: A study coupling line-field confocal optical coherence tomography with artificial intelligence quantifications: LC-OCT reveals new biological markers of AD. Skin. Res. Technol. 2024, 30, e13891. [Google Scholar] [CrossRef] [PubMed]
- Thamm, J.R.; Daxenberger, F.; Viel, T.; Gust, C.; Eijkenboom, Q.; French, L.E.; Welzel, J.; Sattler, E.C.; Schuh, S. Artificial intelligence-based PRO score assessment in actinic keratoses from LC-OCT imaging using Convolutional Neural Networks. J. Dtsch. Dermatol. Ges. 2023, 21, 1359–1366. [Google Scholar] [CrossRef]
- Zhang, J.; Qiao, Y.; Sarabi, M.S.; Khansari, M.M.; Gahm, J.K.; Kashani, A.H.; Shi, Y. 3D Shape Modeling and Analysis of Retinal Microvasculature in OCT-Angiography Images. IEEE Trans. Med. Imaging 2020, 39, 1335–1346. [Google Scholar] [CrossRef]
- Ha-Wissel, L.; Yasak, H.; Huber, R.; Zillikens, D.; Ludwig, R.J.; Thaçi, D.; Hundt, J.E. Case report: Optical coherence tomography for monitoring biologic therapy in psoriasis and atopic dermatitis. Front. Med. 2022, 9, 995883. [Google Scholar] [CrossRef]
- Bono, R.; Giampetruzzi, A.R.; Concolino, F.; Puddu, P.; Scoppola, A.; Sera, F.; Marchetti, P. Dermoscopic patterns of cutaneous melanoma metastases. Melanoma Res. 2004, 14, 367–373. [Google Scholar] [CrossRef]
- Schuh, S.; Sattler, E.C.; Rubeck, A.; Schiele, S.; De Carvalho, N.; Themstrup, L.; Ulrich, M.; Jemec, G.B.E.; Holmes, J.; Pellacani, G.; et al. Dynamic Optical Coherence Tomography of Blood Vessels in Cutaneous Melanoma-Correlation with Histology, Immunohistochemistry and Dermoscopy. Cancers 2023, 15, 4222. [Google Scholar] [CrossRef]
- Welzel, J.; Schuh, S.; De Carvalho, N.; Themstrup, L.; Ulrich, M.; Jemec, G.B.E.; Holmes, J.; Pellacani, G. Dynamic optical coherence tomography shows characteristic alterations of blood vessels in malignant melanoma. J. Eur. Acad. Dermatol. Venereol. 2021, 35, 1087–1093. [Google Scholar] [CrossRef]
- Zalaudek, I.; Giacomel, J.; Schmid, K.; Bondino, S.; Rosendahl, C.; Cavicchini, S.; Tourlaki, A.; Gasparini, S.; Bourne, P.; Keir, J.; et al. Dermatoscopy of facial actinic keratosis, intraepidermal carcinoma, and invasive squamous cell carcinoma: A progression model. J. Am. Acad. Dermatol. 2012, 66, 589–597. [Google Scholar] [CrossRef]
- Kreusch, J.F. Vascular patterns in skin tumors. Clin. Dermatol. 2002, 20, 248–254. [Google Scholar] [CrossRef] [PubMed]
- Ayhan, E.; Ucmak, D.; Akkurt, Z. Vascular structures in dermoscopy. An. Bras. Dermatol. 2015, 90, 545–553. [Google Scholar] [CrossRef] [PubMed]
- Braun, R.P.; Rabinovitz, H.S.; Krischer, J.; Kreusch, J.; Oliviero, M.; Naldi, L.; Kopf, A.W.; Saurat, J.H. Dermoscopy of pigmented seborrheic keratosis: A morphological study. Arch. Dermatol. 2002, 138, 1556–1560. [Google Scholar] [CrossRef]
- Argenziano, G.; Zalaudek, I.; Corona, R.; Sera, F.; Cicale, L.; Petrillo, G.; Ruocco, E.; Hofmann-Wellenhof, R.; Soyer, H.P. Vascular structures in skin tumors: A dermoscopy study. Arch. Dermatol. 2004, 140, 1485–1489. [Google Scholar] [CrossRef]
- Lupu, M.; Caruntu, C.; Popa, M.I.; Voiculescu, V.M.; Zurac, S.; Boda, D. Vascular patterns in basal cell carcinoma: Dermoscopic, confocal and histopathological perspectives. Oncol. Lett. 2019, 17, 4112–4125. [Google Scholar] [CrossRef]
- Braun, R.P.; Oliviero, M.; Kolm, I.; French, L.E.; Marghoob, A.A.; Rabinovitz, H. Dermoscopy: What’s new? Clin. Dermatol. 2009, 27, 26–34. [Google Scholar] [CrossRef]
- McKinnon, K.M. Flow Cytometry: An Overview. Curr. Protoc. Immunol. 2018, 120, 5.1.1–5.1.11. [Google Scholar] [CrossRef]


Disclaimer/Publisher’s Note: The statements, opinions and data contained in all publications are solely those of the individual author(s) and contributor(s) and not of MDPI and/or the editor(s). MDPI and/or the editor(s) disclaim responsibility for any injury to people or property resulting from any ideas, methods, instructions or products referred to in the content. |
© 2024 by the authors. Licensee MDPI, Basel, Switzerland. This article is an open access article distributed under the terms and conditions of the Creative Commons Attribution (CC BY) license (https://creativecommons.org/licenses/by/4.0/).