1. Introduction
As a major constituent of the human diet, milk is an important source of minerals grouped into macro- and microminerals that are involved in several physiological processes. The main minerals in milk include sodium, potassium and chlorine. Together with lactose, these compounds are responsible for the generation of the osmotic pressure of milk and affect its physical properties and stabilization of proteins. Furthermore, the macro- and microelements present in milk support metabolic transformations that proceed in the human body as well as influence the chemical and functional properties of milk proteins [
1]. It has been established that the mineral composition of milk is not constant but varies with the stage of lactation, nutritional status, genetic variance, season, animal species, soil contamination, health status and milk yield of an individual animal [
2,
3,
4,
5]. Stocco et al. [
6] reported that the breed was a major source of variation for most essential minerals in milk. They showed the advantage of Jersey and Brown Swiss breeds in terms of mineral levels in milk. Gołębiewski et al. [
7] showed that Montbéliarde (mb) cows could improve the functional properties of other dairy breeds. The resulting crossbreeds are characterized by a higher health status [
8]. It has also been stated that concentrations of microelements, such as Fe, Zn, Mn and Cu, in milk range depending on the different phases, especially in the early stages of lactation [
4]. The transition period during parturition and the initiation of lactation is very critical for the dairy cow production cycle because there are increased hormonal and metabolic changes [
9,
10]. High-yielding cows’ greater demand for the nutrients needed to synthesize milk can lead to negative energy balances and micronutrient deficiencies in the early stages of lactation [
11]. Milk from high-producing Polish Holstein-Friesian (phf) cows may contain insufficient concentrations of selected macronutrients, in particular Ca and Mg, relative to the relevant standards [
12]. An alternative to them may be other breeds of cows whose milk will contain more minerals. This study aimed to determine the effect of the cow breed on the contents of minerals in milk depending on the stage of lactation. It was assumed that the milk of mb cows would be characterized by a higher content of the analyzed minerals.
2. Materials and Methods
The study material was the milk of 30 cows of two breeds, Montbéliarde (mb;
n = 15) and black-and-white Polish Holstein-Friesian (phf;
n = 15), kept at the same farm. The phf cows were matched with the mb cows by analogs considering the stage and number of successive lactations. The mean number of lactations of all cows reached 2.3 ± 0.65. All cows calved in the spring–summer season. The animals were housed in a stanchion barn with feeding alleys alongside the lateral walls of the building. They were fed in a traditional system with feed mixtures prepared at the farm (maize silage and the pre-wilted silage of grasses) and the addition of feed concentrates. In the spring–summer period, the cows grazed on pasture and received maize silage and feed concentrates in the barn. The feed samples were collected, and the chemical composition of the diets fed to the cows was determined by standard methods [
13] (
Table 1). The ingredients and chemical composition of the diets are given in
Table 2.
Milk for analysis was collected from each cow six times during lactation on the 1st, 2nd, 5th, 6th, 9th and 10th month of lactation. Milking was performed twice a day using a milking pipeline machine. Representative milk samples were collected during the official test milking. Approximately 50 mL milk samples were collected in glass containers with 1 mL (20% w/v) of 2-bromo-2-nitropro-pane-1,3-diol (bronopol; VWR International AB, Stockholm, Sweden). The milk samples were transported at a refrigeration temperature to the laboratory. The fresh milk was analyzed for its proximate chemical composition (protein, fat, lactose and dry matter) using the infrared spectrophotometry method with a MilkoScan FT 120 apparatus (FossElectric, Hillerød, Denmark), and for the somatic cell count (SCC), the method of flow absorption was employed using a BactoCount apparatus (Bentley, Maroeuil, France). Data on the milk performance of the cows were derived from the SYMLEK system and made available by the Polish Federation of Cattle Breeders and Dairy Farmers (PFHBiPM, Warsaw, Poland). The actual somatic cell count was transformed into a natural logarithm to meet the conditions of normal distribution.
A total of 50 mL of milk was stored at −20 °C and used to analyze the concentration of minerals in milk. After thawing, the samples were mineralized via a wet-processing treatment with a supplement of hydrochloric acid and nitric acid (3 mL of milk + 1 mL HCl + 6 mL HNO3). We applied the microwave digestion technique using an MARS microwave oven (Varian, Palo Alto, CA, USA). This process involved three steps and had different parameters and conditions: I. At 800 W and 100% power, increase the temperature to 140 degrees for 10 min, and next, keep it for 5 min; II. At 800 W and 100% power, increase the temperature to 200 degrees for 10 min, and next, keep it for 15 min; and III. Cool for 25 min. Minerals (Ca, Mg, K, Na and Zn) were identified in the mineralization by flame atomic absorption spectrophotometry using a SpectrAA280FZ (Varian, Palo Alto, CA, USA).
For statistical analysis, the numerical material was divided into two groups regarding the breed and three and six groups regarding the stage and month of lactation: early stage (1st and 2nd month of lactation; average time after calving—33.4 ± 14.1 days; n = 60), middle stage (5th and 6th month of lactation; average time after calving—155.9 ± 18 days; n = 60) and late stage (9th and 10th month of lactation; average time after calving—259.4 ± 22.2 days; n = 60). Mean values and standard deviation (Sd) were calculated for each trait. The effect of breed, stage and month of lactation was evaluated using one-way analysis of variance in the non-orthogonal system. The significance of the differences between the mean values was determined with the Fisher’s NIR test. The results were processed statistically with STATISTICA software 13.3 by Stat-Soft Inc., and the differences were considered at significance levels of p ≤ 0.05 and p ≤ 0.01.
3. Results
Analysis of the milk samples in terms of performance and proximate composition demonstrates statistically significant differences between breeds (
Table 3). The phf cows were characterized by a higher milk yield than the mb cows (23.2 kg vs. 21.7 kg). However, the milk samples from mb cows compared to the milk of phf cows had higher contents of all basic milk constituents. Significant differences were, however, only determined for the contents of lactose (
p ≤ 0.01) and fat (
p ≤ 0.05).
A higher content of potassium was assayed in the milk of phf cows (1623.79 mg/L) compared to mb cows (1564.38 mg/L), but the difference was not confirmed statistically (
Table 4). The milk of mb cows was, in turn, characterized by significantly higher contents of sodium, magnesium, calcium and zinc than the milk from phf cows (
p ≤ 0.01).
The highest content of potassium was noted in milk from the middle stage of lactation of the phf breed (1674.82 mg/L;
Table 5), and, together with the content in milk from the late stage of lactation, it was significantly higher than in the early stage (
p ≤ 0.01). The highest contents of magnesium and calcium were noted in milk from the early stage of lactation of the phf breed (95.87 mg/L and 870.90 mg/L, respectively). Statistical differences were confirmed between the early and the middle (
p ≤ 0.05) and late (
p ≤ 0.01) stages of lactation for magnesium and between the early and late (
p ≤ 0.05) stages of lactation for calcium. A significantly higher (
p ≤ 0.05) content of zinc was noted in milk from the middle stage of lactation (4.59 mg/L) compared to the late stage (3.84 mg/L).
Similar to the milk of phf cows, in the milk of mb cows, the highest content of potassium was noted in milk from the middle stage of lactation (1655.14 mg/L). However, statistical differences were only confirmed between the middle and late (
p ≤ 0.05) stages of lactation (
Table 6). The opposite situation was the case regarding the sodium content in the milk of mb cows; the lowest content of this element was recorded in the middle phase of lactation (428.92 mg/L), and it was significantly (
p ≤ 0.05) lower than in the early and late stages of lactation.
The milk of mb cows was characterized by a greater variability of minerals in the subsequent months of lactation (
Figure 1,
Figure 2,
Figure 3,
Figure 4 and
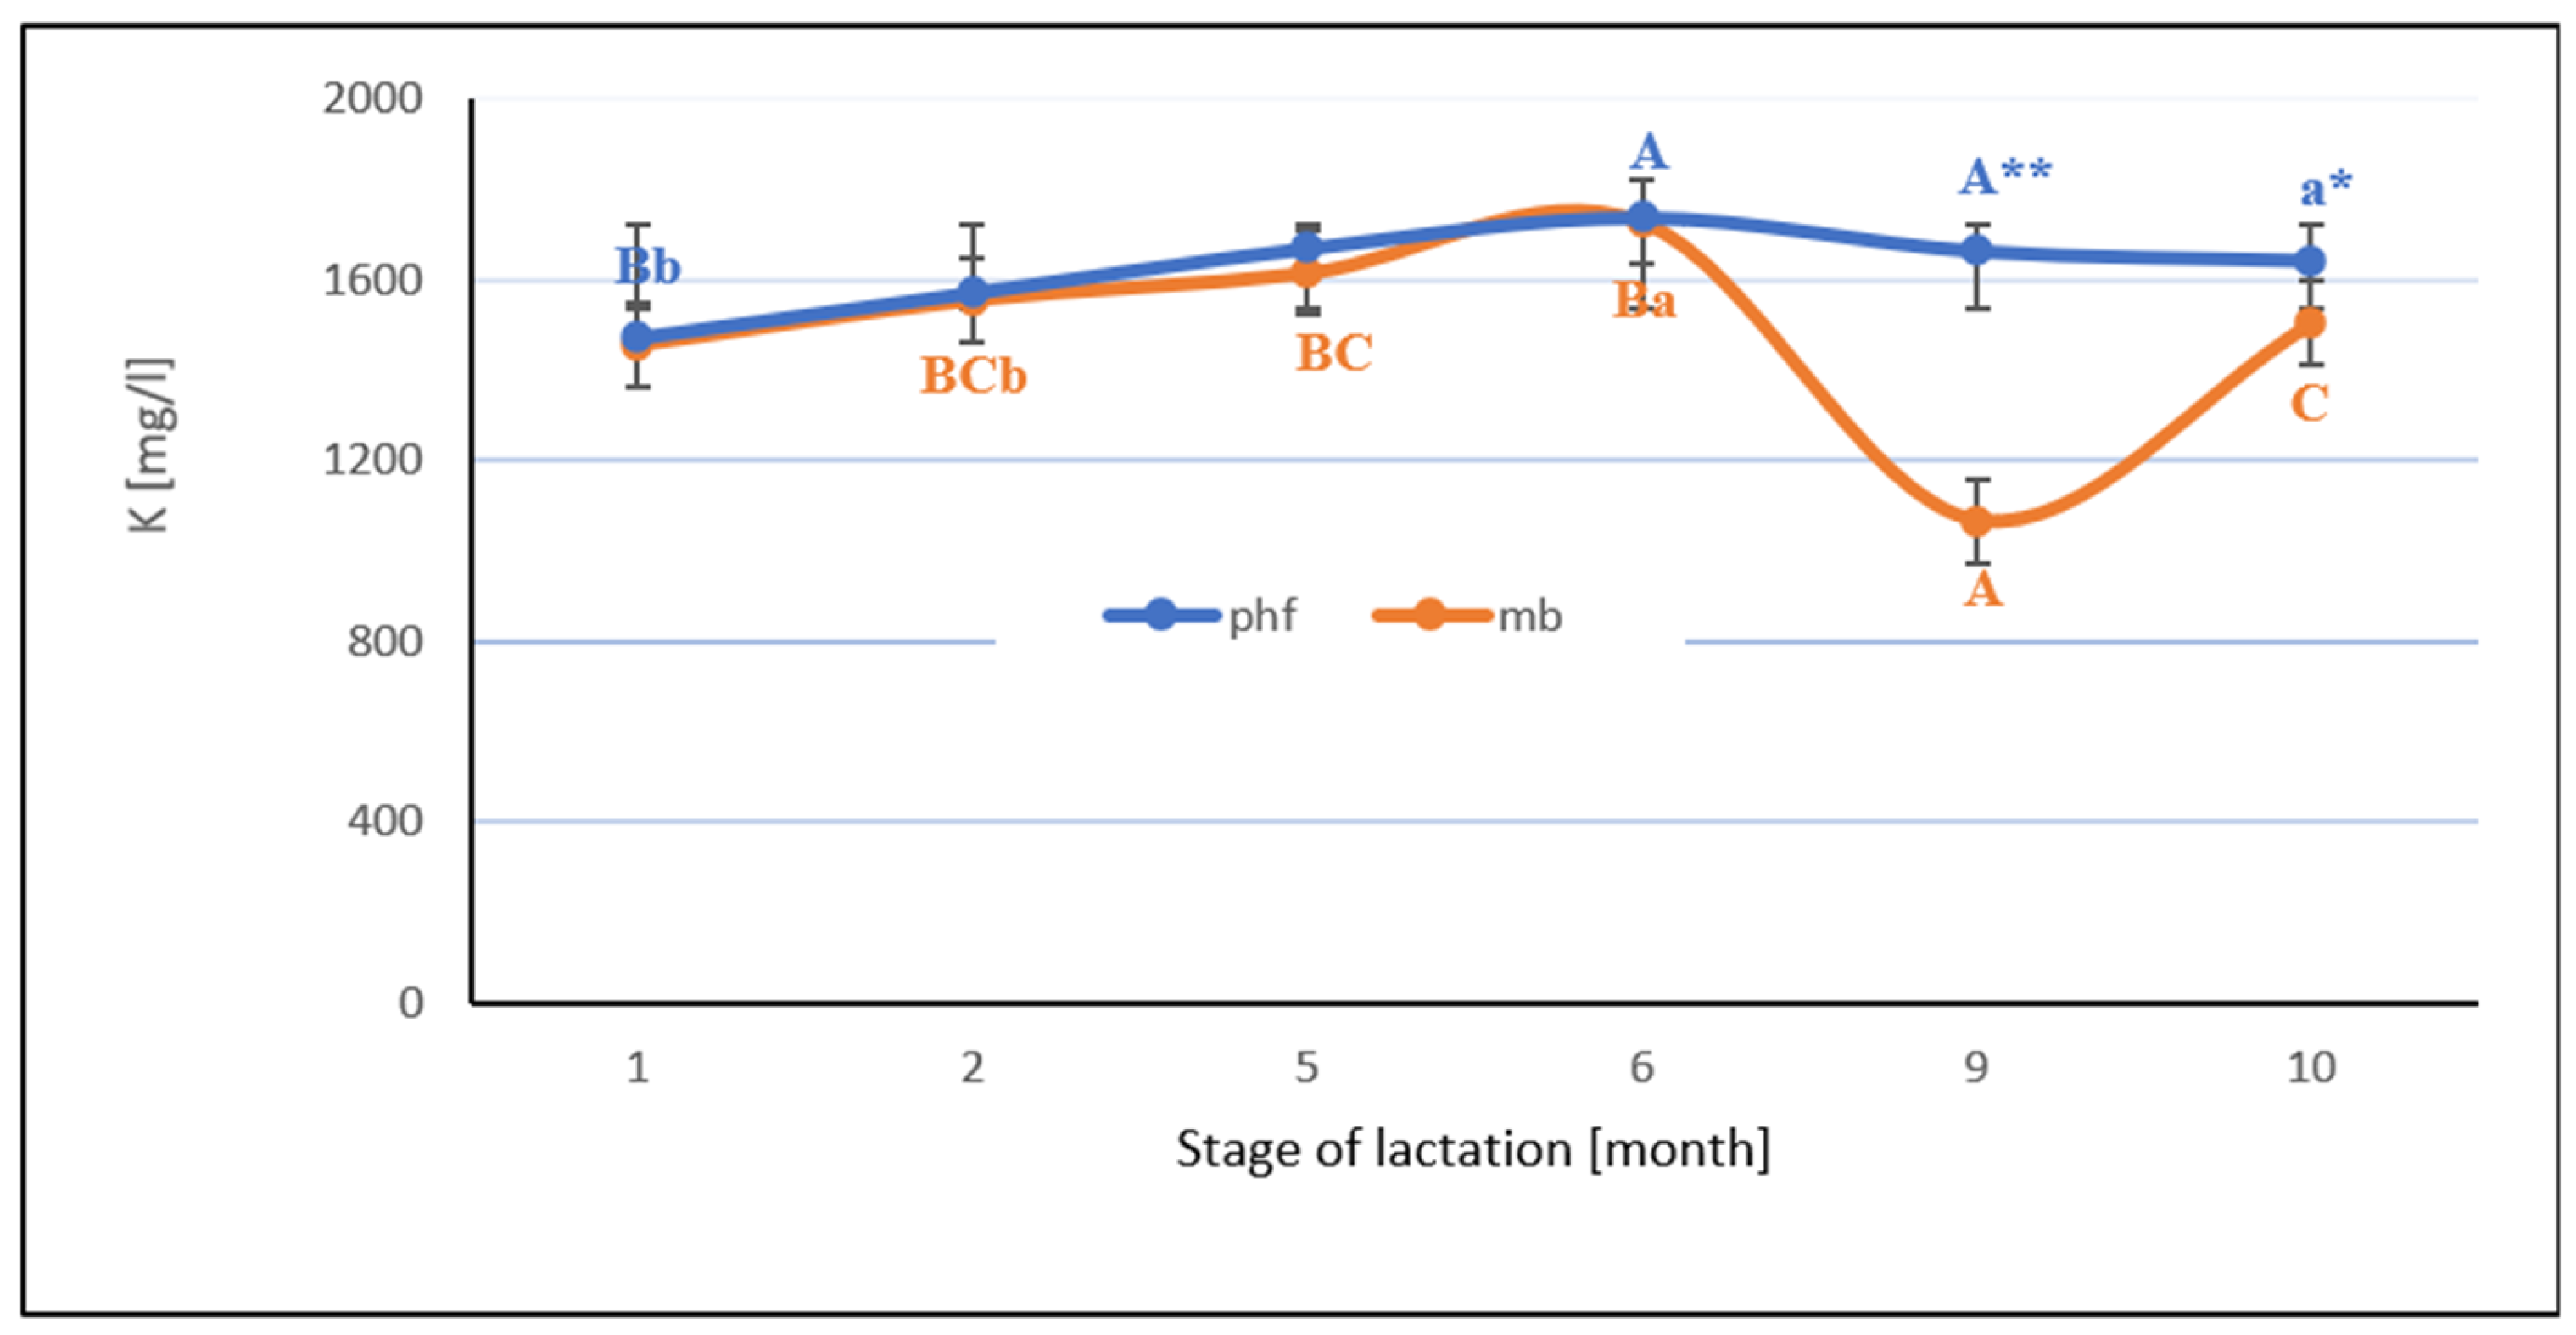
Figure 5). There was noted an increase in the potassium content of the milk of phf cows with the time since parturition, with the highest content of this element in the milk of phf cows at the sixth and ninth months of lactation (
Figure 1). Differences in the potassium content of milk between the sixth and ninth months of lactation in comparison to the first month after the parturition of phf cows were confirmed statistically (
p ≤ 0.01). A descending tendency was determined in the potassium content of the milk of mb cows in the ninth month of lactation (
Figure 1), and differences in its content were confirmed statistically (
p ≤ 0.01).
In turn, the sodium content in the milk of phf cows in the subsequent months of lactation was almost unchanged (
Figure 2). However, its content in the milk of the mb cows was significantly higher (
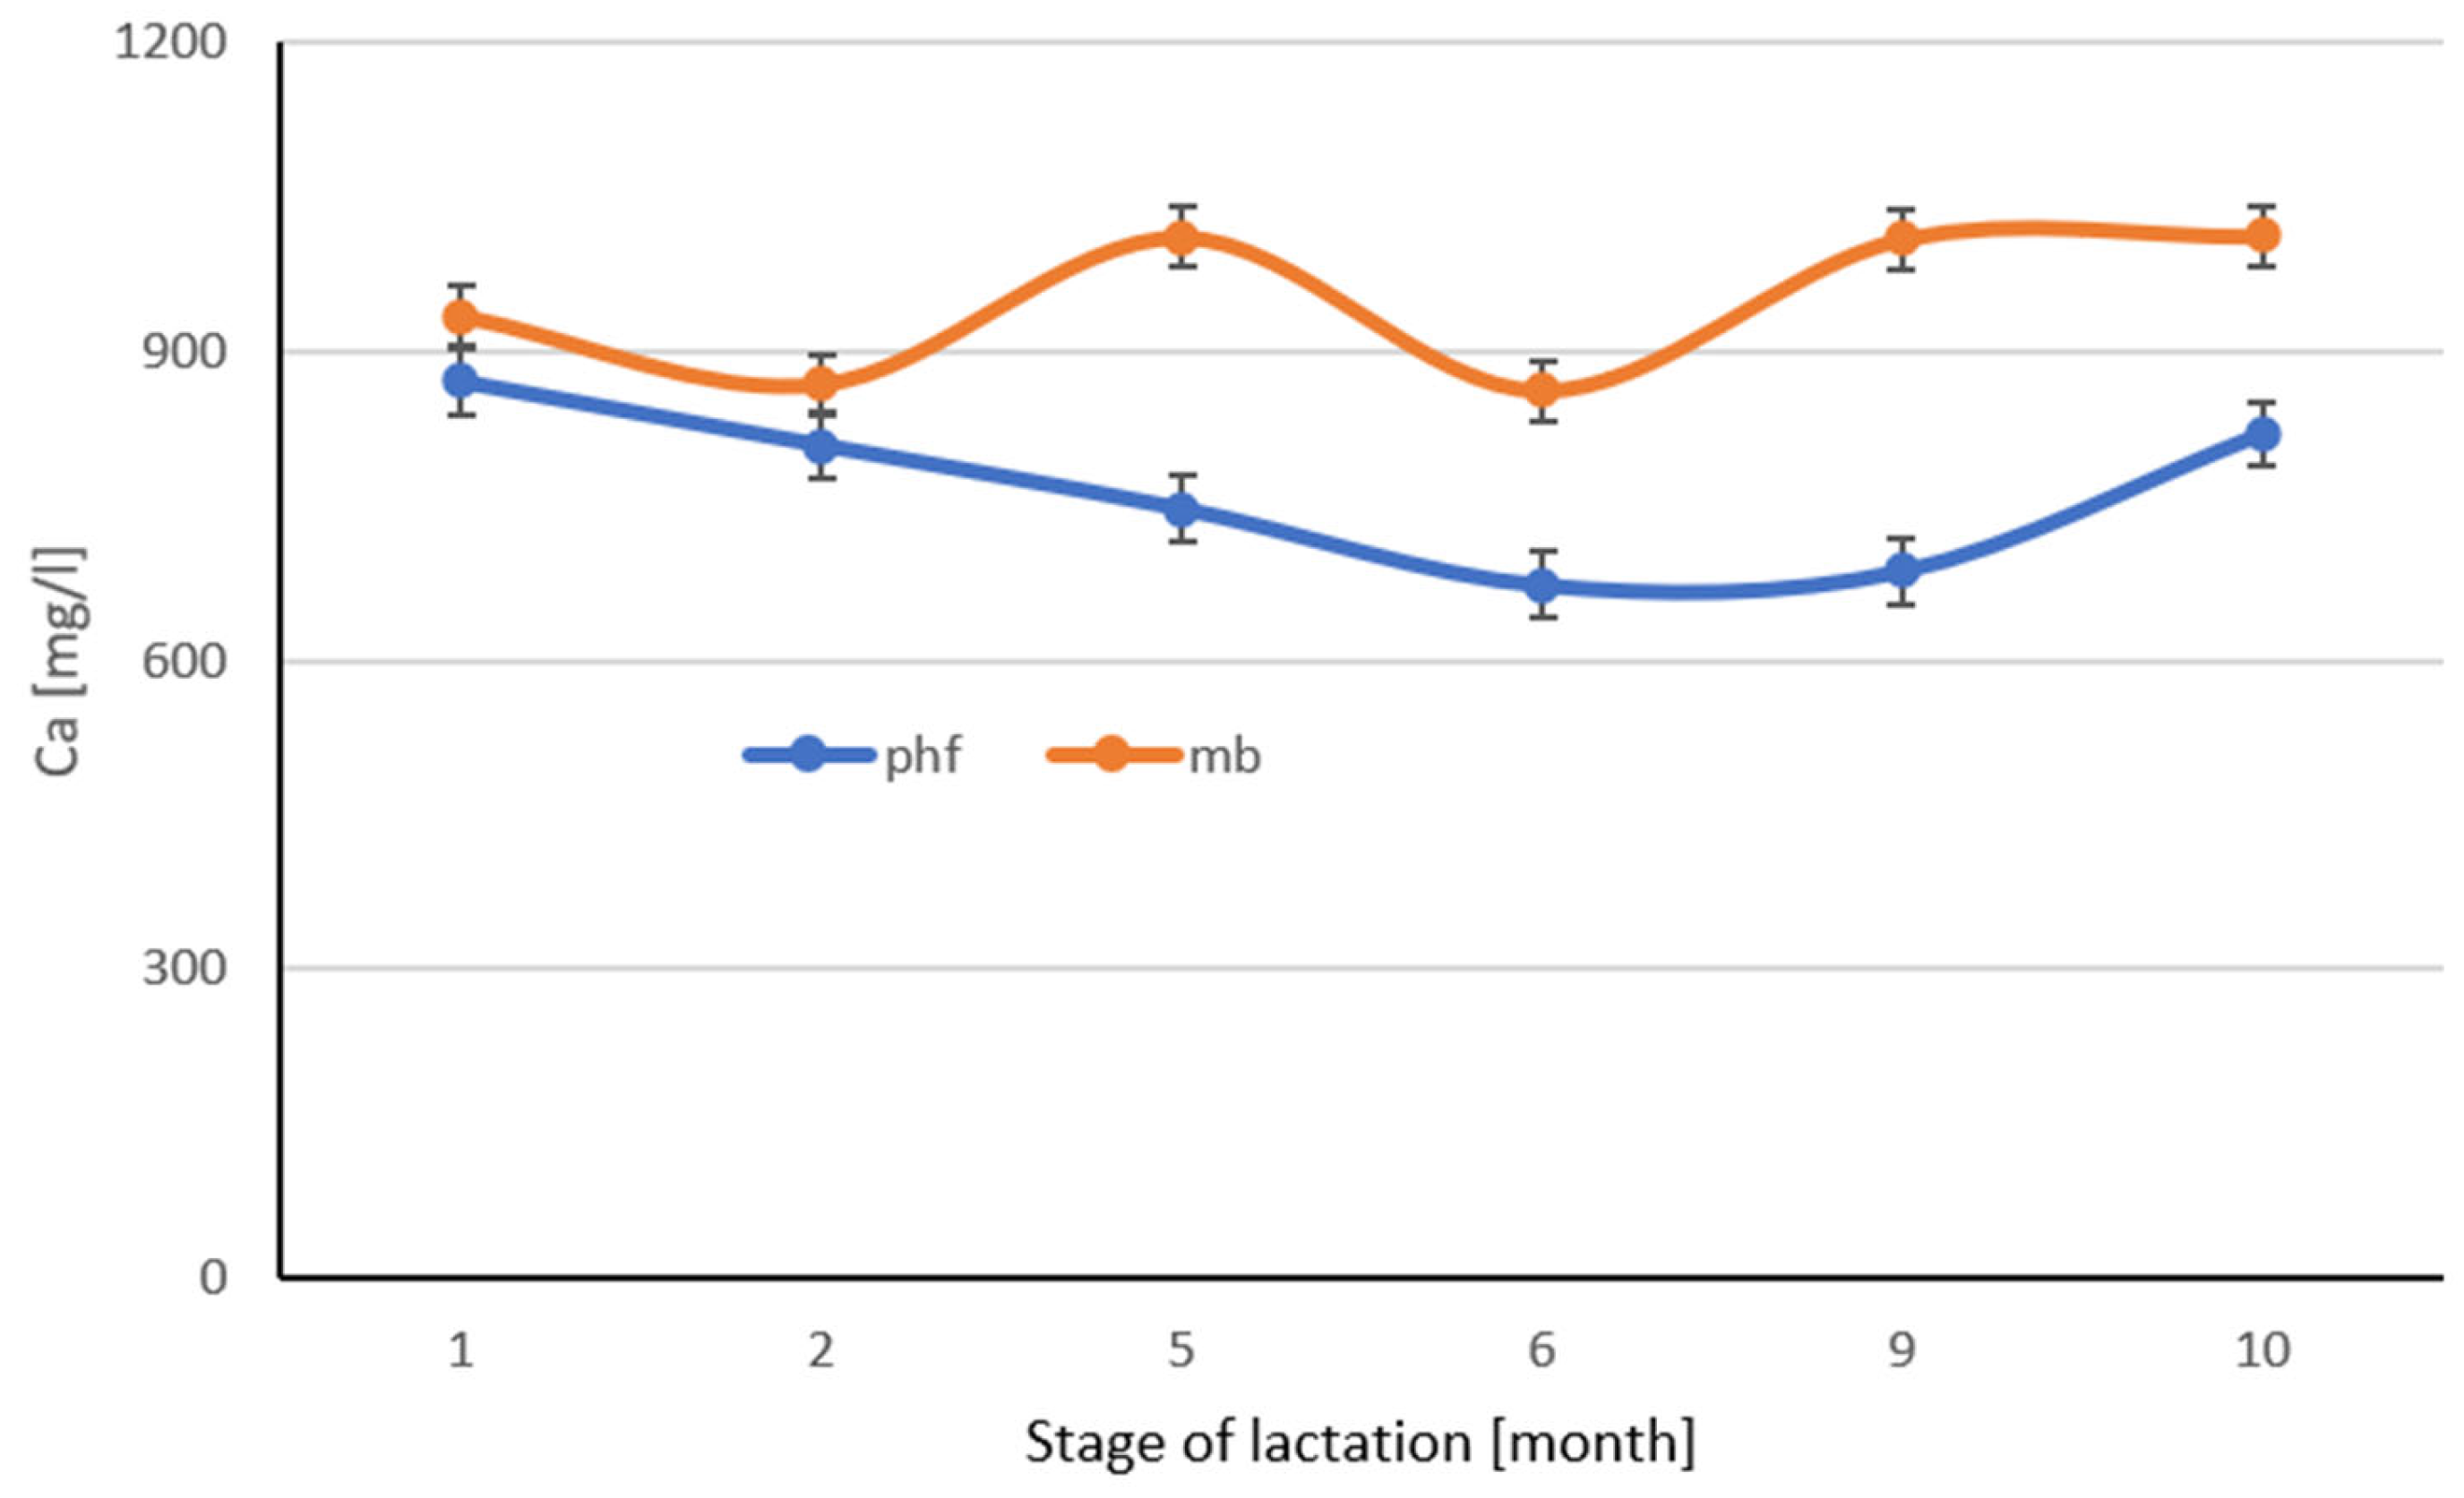
p ≤ 0.01) than in the milk of phf cows in the first, ninth and tenth months after parturition. Irrespective of the breed, the highest content of calcium was determined in milk from the tenth month of lactation compared to the previous months (
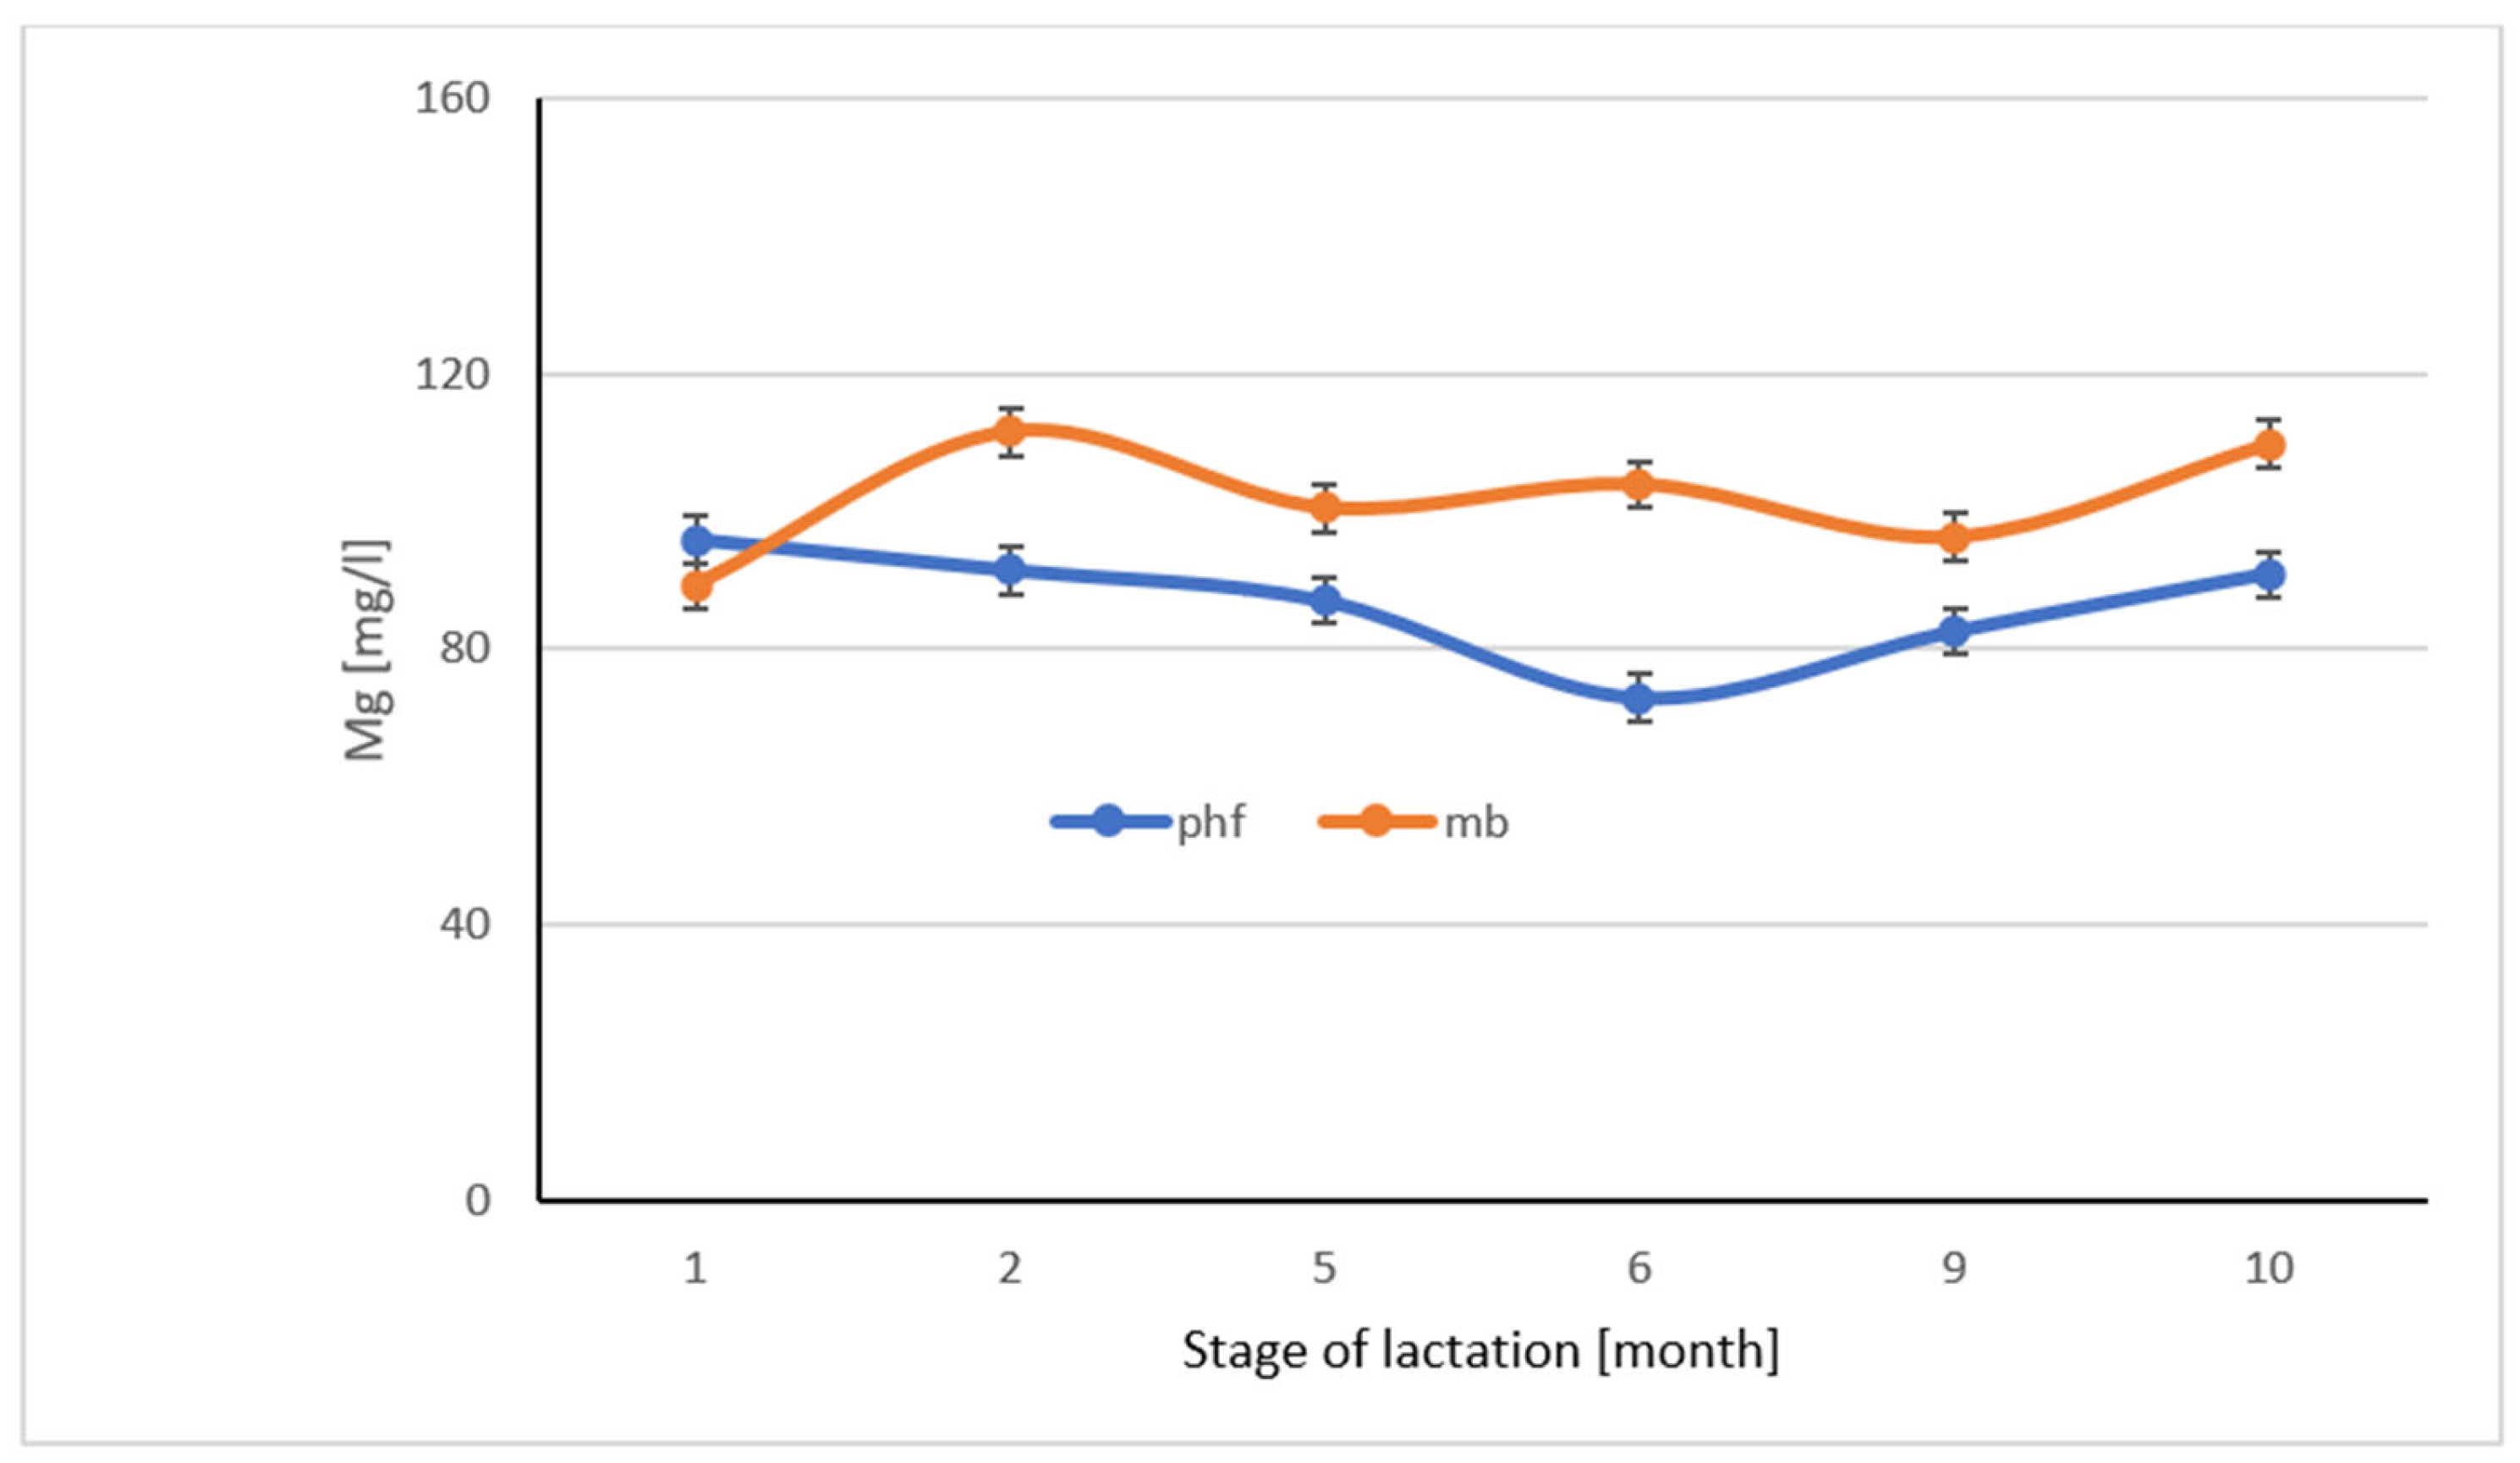
Figure 3). The milk of mb cows, irrespective of the month of lactation, contained more calcium than the milk of the Polish Holstein-Friesian breed. A higher content of magnesium, irrespective of the breed, was determined in milk from the tenth month of lactation compared to the previous months (
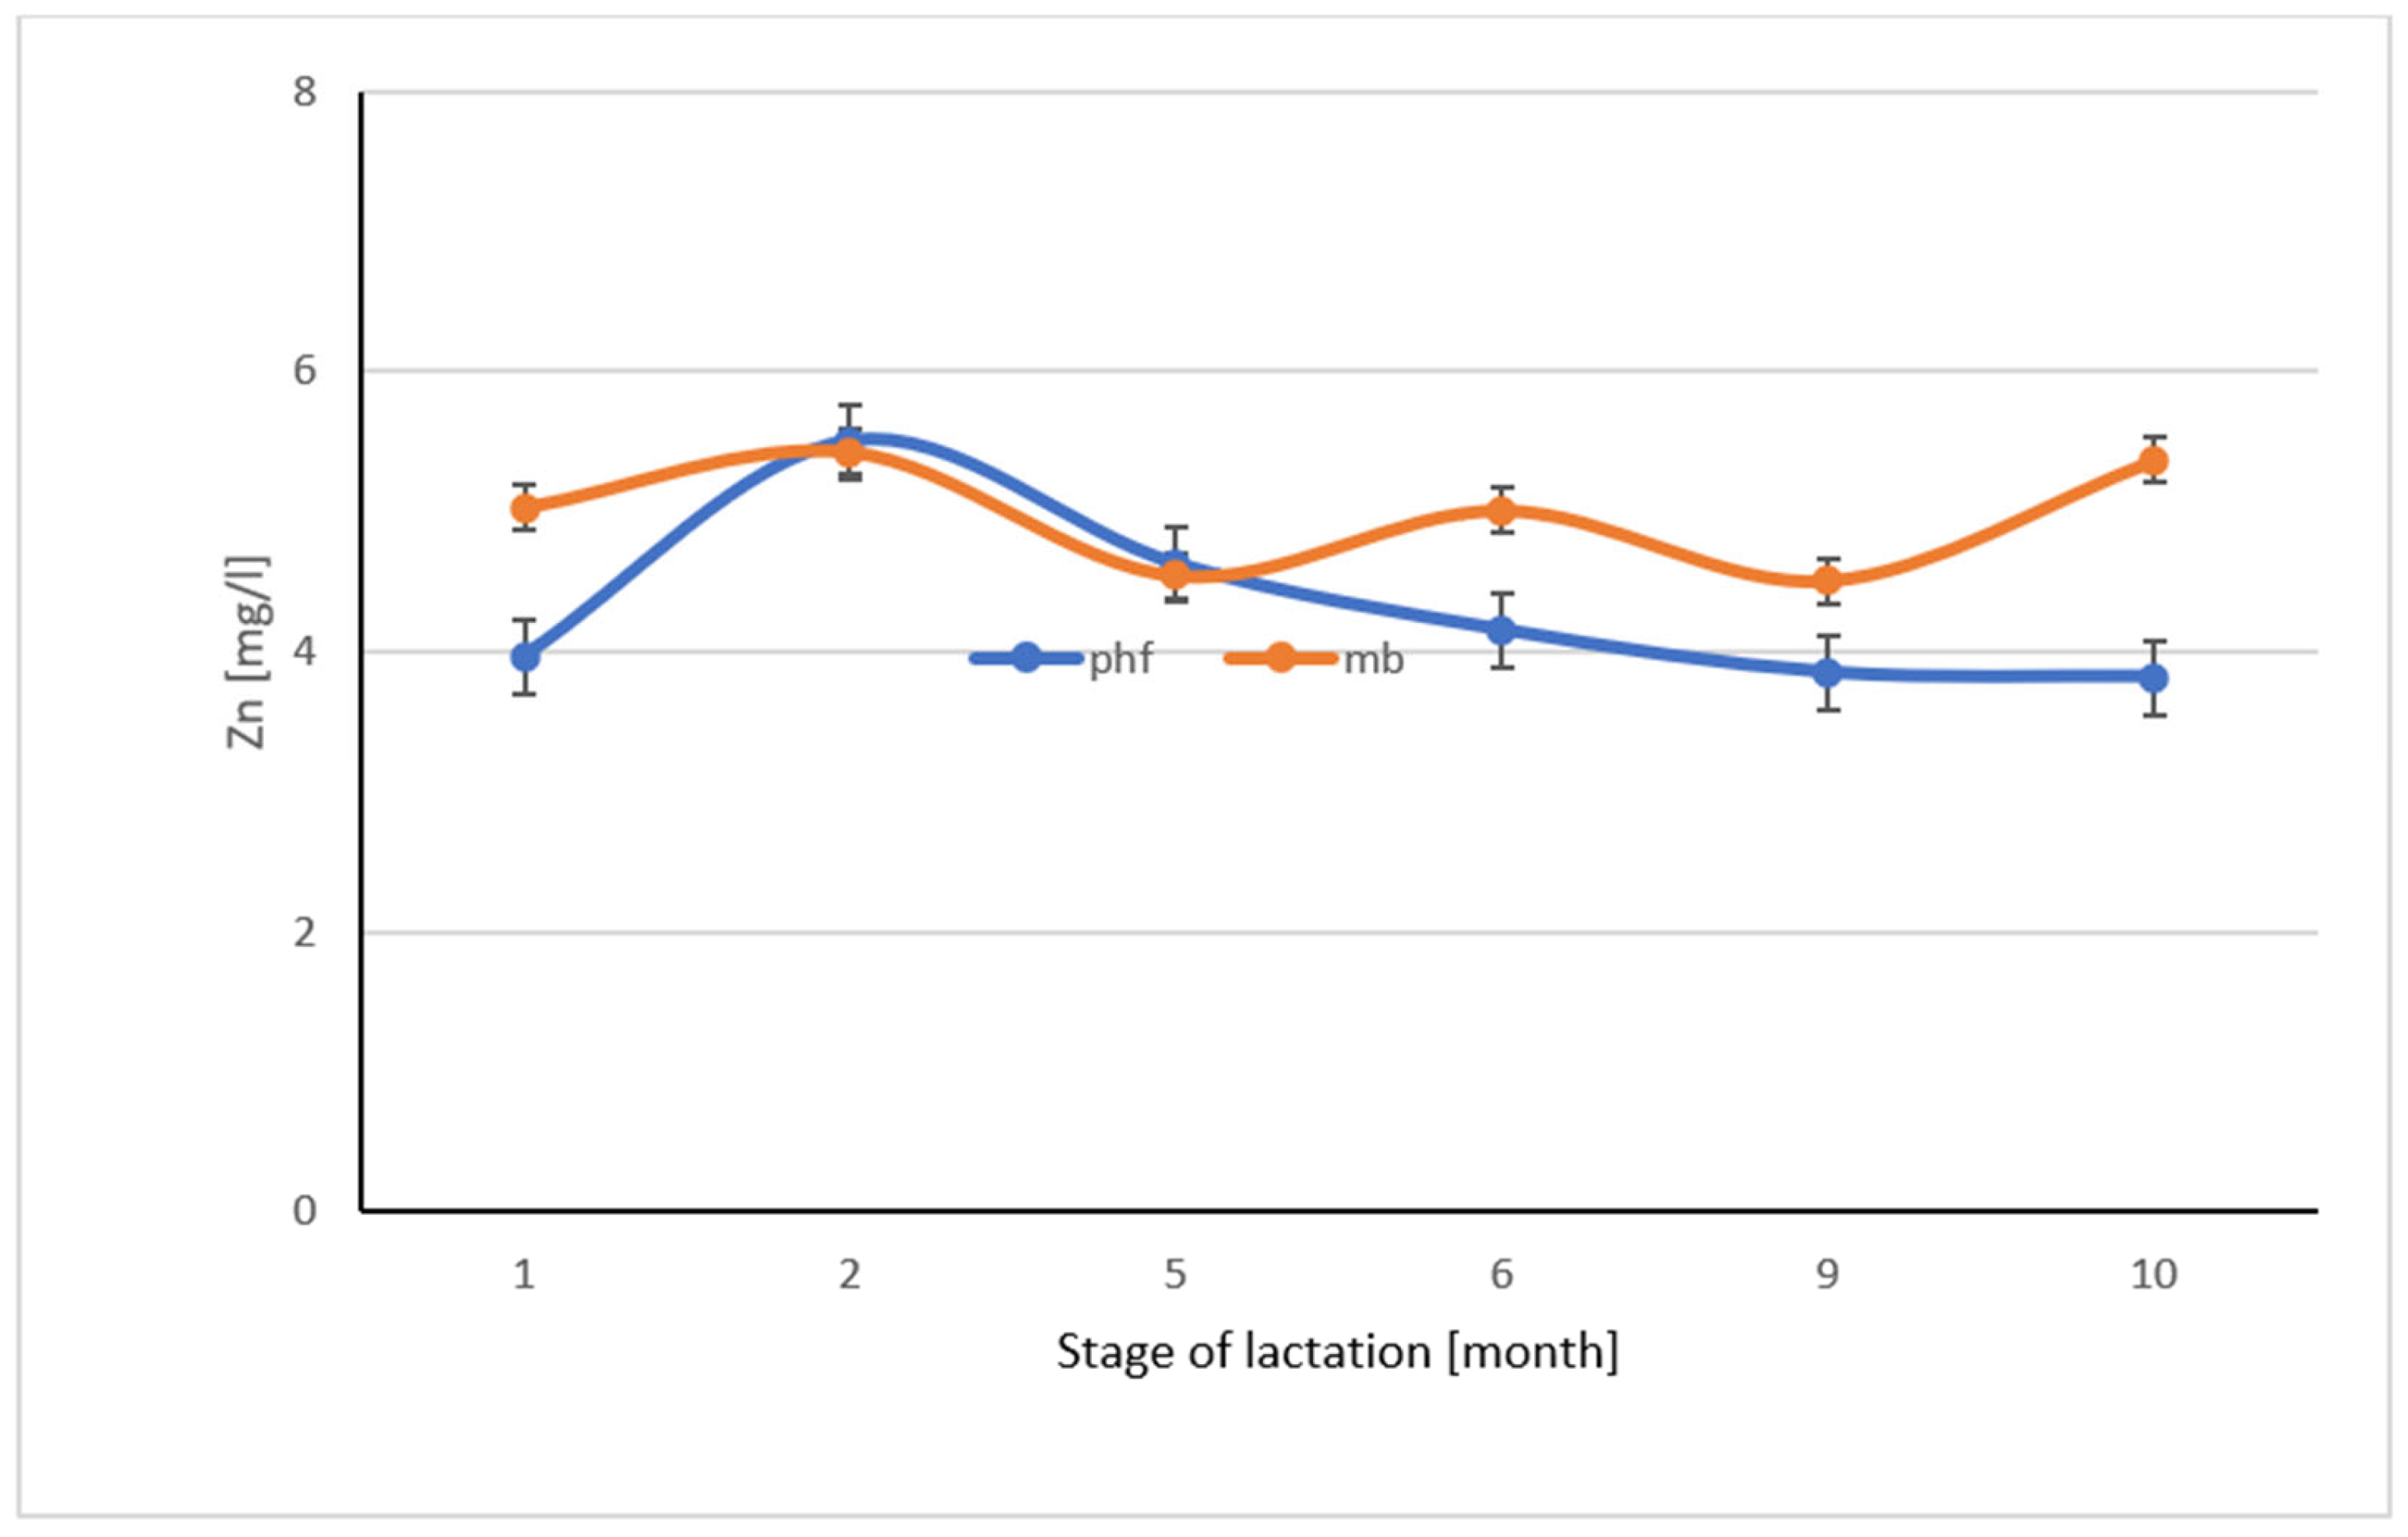
Figure 4). A descending tendency was determined in the zinc content of the milk of phf cows (
Figure 5), while its content in the milk of mb cows was at a similar level.
4. Discussion
The variability of the mineral content in milk depending on the breed has also been confirmed in other studies. Król et al. [
14] showed that milk produced in low-input farms where native cattle breeds (White-backed, Polish Red and Simmental) are raised has higher concentrations of Na, Mg, Cu and Mn and a lower content of Zn and Fe in comparison with milk from high-producing PHF cows. Grega et al. [
15] demonstrated that the milk of Simmental cows was the most valuable source of Ca, whereas Rodríguez et al. [
16] determined significantly higher concentrations of K and Na in the milk of Holstein cows from the Canary Islands compared to the milk of Holstein-Friesian cows. According to Barłowska [
17], the highest contents of calcium and magnesium were reported in the milk of Jersey cows. Similar results were found by Davies et al. [
18], who reported higher concentrations of Ca in Jersey than in Friesian cow milk. Knowles et al. [
19] explained this variation by the breed–protein content interaction, with Jersey cows having a better milk protein content. Barłowska et al. [
20] also claimed that the contents of calcium and magnesium are usually higher in milk richer in protein, including casein. This is confirmed by the results of a study by Gaucheron [
2], who demonstrated that the calcium concentration in milk is correlated with the protein content. This state may explain the higher content of these elements in the milk of Montbéliarde cows compared to the milk of Polish Holstein-Friesian cows. Similarly, zinc in cow’s milk primarily binds to casein and, to a small extent, citrate, while Wiking et al. [
21] showed that the Zn concentration in bovine milk is significantly affected by the dietary intake of fat. The transfer of fat from the diet to milk facilitates the transfer of Zn from the diet to milk. Nogalska et al. [
12] showed that there were highly significant positive correlations between the fat content of milk and the levels of Ca, Mg and Zn.
The analyses of changes in the contents of the analyzed elements demonstrate their variability as also being affected by the stage of lactation. Górska and Oprządek [
22] also demonstrated the variability of macroelements with time since calving. In their study, the contents of iron and zinc were highest at the early stage of lactation, which partly confirms our results. The concentration of microelements in milk during lactation was also studied by Bedo et al. [
23]. Their results show that the concentrations of Zn tended to decrease during lactation. According to van Hulzen et al. [
5], the stage of lactation has a significant effect on all milk mineral concentrations. These authors found that the levels of Ca, Zn and Mg increased during lactation, whereas the concentration of K in milk was found to decrease with the stage of lactation, which partly confirms our results. Zamberlin et al. [
24] reported that there is a lower concentration of potassium in colostrum than in milk, but it increases with days of the lactation period until a normal value is reached. Similarly, Nogalska et al. [
21,
25] reported that the K concentration increased with the progress of lactation. In contrast, Konar et al. [
26] state that the potassium concentration in goat milk does not depend on the lactation stage. Zamberlin et al. [
24] also reported that similar to our study, the concentration of calcium in cow’s milk is negligibly higher at the early and late stages of lactation and that especially high levels of sodium are found in colostrum and milk from the terminal stage of lactation, which is linked with lower performance in that period. Gaucheron [
2], Nogalska et al. [
25] and Toffanin et al. [
27] found that calcium and magnesium contents are high at the beginning of lactation, decrease rapidly until 6 to 8 weeks, and increase thereafter, which partly confirms our results. Toffanin et al. [
27] reported that this trend in the changes of macro- and microelements during lactation can be explained by changes in the nutritional composition of the diet or a dilution effect across lactation.
5. Conclusions
The milk of Montbéliarde cows contained significantly more sodium, calcium, magnesium and zinc compared to the milk of the Polish Holstein-Friesian cows kept at the same farm, which enables the conclusion that the contents of these elements are determined by breed.
This study demonstrates the variability of the contents of the analyzed minerals with time since calving. During lactation, the contents of potassium, calcium, magnesium and sodium were highest at the late stage of lactation, especially in the tenth month of lactation.
Author Contributions
Conceptualization, M.S.-S.; Formal analysis, M.M.; Data curation, P.P.-P. and M.M.; Writing—original draft, M.S.-S.; Writing—review & editing, Z.N.; Visualization, M.S.-S. and P.P.-P.; Supervision, Z.N. All authors have read and agreed to the published version of the manuscript.
Funding
This research received no external funding.
Institutional Review Board Statement
Ethical review and approval were waived for this study due to the scope of activities performed exhausts the definition described in Article 1. Point 2.5 of the Law on the Protection of Animals Used for Scientific or Educational Purposes of 15 January 2015 (Journal of Laws 2015, item 266).
Informed Consent Statement
Not applicable.
Data Availability Statement
The raw data supporting the conclusions of this article will be made available by the authors on request.
Conflicts of Interest
The authors declare no conflict of interest.
References
- Brodziak, A.; Litwińczuk, A.; Kędzierska-Matysek, M.; Król, J. Content of selected macro- and microelements in milk of different cows breeds and renet whey. Ochr. Śr. Zasobów Nat. 2011, 48, 467–474, (In Polish with English Abstract). [Google Scholar]
- Gaucheron, F. The minerals of milk. Reprod. Nutr. Dev. 2005, 45, 473–483. [Google Scholar] [CrossRef] [PubMed]
- Cashman, K.D. Milk minerals (including trace elements) and bone health. Int. Dairy J. 2006, 16, 1389–1398. [Google Scholar] [CrossRef]
- Gallego, L.; Landete-Castillejos, T.; Garcia, A.; Sanchez, P.J. Seasonal and lactational changes in mineral composition of milk from Iberian Red Deer (Cervus elaphus hispanicus). J. Dairy Sci. 2006, 89, 589–595. [Google Scholar] [CrossRef]
- van Hulzen, K.J.E.; Sprong, R.C.; van der Meer, R.; van Arendonk, J.A.M. Genetic and nongenetic variation in concentration of selenium, calcium, potassium, zinc, magnesium, and phosphorus in milk of Dutch Holstein-Friesian cows. J. Dairy Sci. 2009, 92, 5754–5759. [Google Scholar] [CrossRef]
- Stocco, G.; Summer, A.; Malacarne, M.; Cecchinato, A.; Bittante, G. Detailed macro- and micromineral profile of milk: Effects of herd productivity, parity, and stage of lactation of cows of 6 dairy and dual-purpose breeds. J. Dairy Sci. 2019, 102, 9727–9739. [Google Scholar] [CrossRef]
- Gołębiewski, M.; Puppel, K.; Kuczyńska, B. Characteristics of the national population of cows breeds of utilized milky with particular emphasis on the composition of milk. The level of components of milk of cows Montbeliarde breeds. Przegląd Mleczarski 2012, 6, 24–28. (In Polish) [Google Scholar]
- Wojtas, E.; Zachwieja, A. The composition and physicochemical properties of colostrum in Black-and-White polish holstein-friesian cows, Montbéliarde cows and their crossbreeds. Acta. Sci. Pol. Zootech. 2016, 15, 87–98. [Google Scholar] [CrossRef]
- Grummer, R.R.; Mashek, D.G.; Hayirli, A. Dry matter intake and energy balance in the transition period. Vet. Clin. N. Am. Food Amin. Pract. 2004, 20, 447–470. [Google Scholar] [CrossRef]
- Smith, B.; Risco, C.A. Management of preparturient disorders in dairy cattle. Vet. Clin. N. Am. Food Amin. Pract. 2005, 21, 503–521. [Google Scholar]
- Grešáková, L.; Holodová, M.; Szumacher-Strabel, M.; Huang, H.; Ślósarz, P.; Wojtczak, J.; Sowińska, N.; Cieślak, A. Mineral status and enteric methane production in dairy cows during different stages of lactation. BMC Vet. Res. 2021, 17, 287–296. [Google Scholar] [CrossRef] [PubMed]
- Nogalska, A.; Momot, M.; Sobczuk-Szul, M.; Pogorzelska-Przybyłek, P.; Nogalski, Z. The effect of milk production performance of Polish Holstein-Friesian (PHF) cows on the mineral content of milk. J. Elem. 2018, 23, 589–597. [Google Scholar] [CrossRef]
- Association of Official Analytical Chemists. Official Methods of Analysis, 15th ed.; Association of Official Analytical Chemists: Arlington, TX, USA, 1990. [Google Scholar]
- Król, J.; Litwińczuk, Z.; Matwijczuk, A. The effect of the production season on the basic chemical composition and mineral content of milk produced on low-input farms. Ann. UMCS Sect. EE 2016, 34, 29–36. (In Polish) [Google Scholar]
- Grega, T.; Sady, M.; Farot, A.; Pustkowiak, H. Level of calcium, phosphorus, lactose and citric acid in the milk of cows of different breeds. Rocz. Nauk. Zootech. Suppl. 2000, 5, 27–30. (In Polish) [Google Scholar]
- Rodríguez, E.M.; Sanz Alaejos, M.; Diaz Romero, C. Mineral concentrations in cows milk from the Canary Island. J. Food Compos. Anal. 2001, 14, 419–430. [Google Scholar] [CrossRef]
- Barłowska, J. Nutritional Value and Technological Usefulness of Cows Milk from 7 Breeds Performanced in Poland; Academic Press: Lublin, Poland, 2007. [Google Scholar]
- Davies, S.R.; Farr, V.C.; Knowles, O.S.; Lee, J.; Kolver, E.; Auldist, M. Sources of variation in milk calcium content. Aust. J. Dairy. Technol. 2001, 56, 156. [Google Scholar]
- Knowles, S.O.; Grace, N.D.; Knight, T.W.; McNabb, W.C.; Lee, J. Reasons and means for manipulating the micronutrient composition of milk from grazing dairy cattle. Anim. Feed. Sci. Technol. 2006, 131, 154–167. [Google Scholar] [CrossRef]
- Barłowska, J.; Teter, A.; Kędzierska-Matysek, M.; Litwińczuk, Z. Effect of production season on basic chemical composition and content of macro- and microelements in cow’s and goat’s milk. Food Sci. Technol. Qual. 2013, 6, 69–78. [Google Scholar] [CrossRef]
- Wiking, L.; Larsen, T.; Sehested, J. Transfer of dietary zinc and fat to milk-evaluation of milk fat quality, milk fat precursors, and mastitis indicators. J. Dairy. Sci. 2008, 91, 1544–1551. [Google Scholar] [CrossRef]
- Górska, A.; Oprządek, K.B. Concentration of trace elements in raw milk depending on the lactation period and age of cows. Acta Vet. Brno 2011, 80, 203–206. [Google Scholar] [CrossRef]
- Bedo, S.; Nikodemusz, E.; Percsich, K.; Bardos, L. Variations in the milk yield and milk composition of dairy cows during lactation. Acta Vet. Hung. 1995, 43, 163–171. [Google Scholar] [PubMed]
- Zamberlin, Š.; Antunac, N.; Havranek, J.; Samaržija, D. Mineral elements in milk and dairy products. Mljekarstvo 2012, 62, 111–125. [Google Scholar]
- Nogalska, A.; Momot, M.; Nogalski, Z. The Mineral Composition of Milk from High-Yielding Dairy Cows Depending on the Month of Lactation and Udder Health. Appl. Sci. 2020, 10, 4803. [Google Scholar] [CrossRef]
- Konar, A.; Thomas, P.C.; Rook, J.A.F. The concentration of some water soluble constituents in the milk of cows, sows, ewes and goats. J. Dairy Res. 1971, 38, 333–341. [Google Scholar] [CrossRef]
- Toffanin, V.; Penasa, M.; McParland, S.; Berry, D.P.; Cassandro, M.; De Marchi, M. Genetic parameters for milk mineral content and acidity predicted by mid-infrared spectroscopy in Holstein-Friesan cows. Animal 2015, 9, 775–780. [Google Scholar] [CrossRef]
| Disclaimer/Publisher’s Note: The statements, opinions and data contained in all publications are solely those of the individual author(s) and contributor(s) and not of MDPI and/or the editor(s). MDPI and/or the editor(s) disclaim responsibility for any injury to people or property resulting from any ideas, methods, instructions or products referred to in the content. |
© 2024 by the authors. Licensee MDPI, Basel, Switzerland. This article is an open access article distributed under the terms and conditions of the Creative Commons Attribution (CC BY) license (https://creativecommons.org/licenses/by/4.0/).


