Article

Land-Use Transitions Impact the Ecosystem Services Value in a Coastal Region by Coupling the Geo-Informatic Tupu and Benefit-Transfer Method: The Case of Ningde City, China

1
College of Digital Economy, Fujian Agriculture and Forestry University, Fuzhou 350002, China
2
Institute of Agroecology, Fujian Agriculture and Forestry University, Fuzhou 350002, China
3
College of Rural Revitalization, Fujian Agriculture and Forestry University, Fuzhou 350002, China
4
Ecological Civilization Research Center, Fujian Agriculture and Forestry University, Fuzhou 350002, China
*
Authors to whom correspondence should be addressed.
Appl. Sci. 2024, 14(9), 3643; https://doi.org/10.3390/app14093643
Submission received: 4 April 2024 / Revised: 21 April 2024 / Accepted: 23 April 2024 / Published: 25 April 2024
(This article belongs to the Special Issue Ecosystems and Landscape Ecology)

Abstract

:
Exploring the mechanisms and processes of land-use transitions (LUTs) and their impact on ecosystem services can effectively elucidate the intricate interactions between human and natural systems, which is pivotal for advancing the sustainable development of regional economies and enhancing ecological environments. However, the existing literature lacks comprehensive analysis regarding the spatial and temporal evolution of LUTs, with insufficient integration of the “spatial pattern” and “time process”. Moreover, traditional assessments of the ecosystem services value (ESV) often overlook their negative costs. To address these gaps, this study first utilized the Google Earth Engine (GEE) cloud platform and employed the random forest algorithm to conduct supervised classification on Landsat remote-sensing images from the years 2000, 2010, and 2020 within the research area, thereby obtaining land-use data for three distinct periods. And then, we investigated the geographic features of LUTs and their ecological effects in the Ningde City of China from 2000 to 2020. The geo-informatic Tupu model and a newly revised method of benefit transfer were primarily employed for this purpose. The findings indicate the following: (1) Over the study period, the land-use structure of Ningde City predominantly comprised cultivated land and forest land, with continuous decreases in both types and a concurrent increase in built-up land. (2) Significant disparities exist in the spatial distribution of Tupu units, notably with “forest land → cultivated land” and “cultivated land → built-up land” as crucial units influencing ESV changes. (3) The ESV in Ningde City decreased from CNY 1105.54 × 108 to CNY 1020.47 × 108 over 2000–2020, while the ecosystem dis-services value exhibited an opposing trend, rising from CNY 12.68 × 10⁸ to CNY 20.39 × 10⁸. (4) The net ESV in Ningde City showed a decline over the same period, indicating a certain vulnerability in the city’s ecological system structure. This study aims to enhance our understanding of the influence of land-use patterns on ESV, offering valuable insights for regional ecological–environment management and land-use policy formulation, thereby fostering sustainable development in ecological, environmental, and socio-economic dimensions. Furthermore, the results serve as a reference for evaluating net ecosystem services value in other countries/regions.

1. Introduction

China’s rapid urbanization and industrialization processes have significantly accelerated land-use transitions (LUTs), making them a pivotal driver and integral component of global environmental change, thereby posing substantial threats to ecosystems. Ecosystem services (ESs) encompass the eco-environmental conditions and utilities vital for human survival, generated and sustained by ecosystems. These services encompass all benefits humans directly or indirectly derive from ecosystems [1,2,3,4]. The ESs approach is widely recognized as a promising avenue for achieving sustainable development goals [5]. Sustainable development programs, by providing ecosystem services value (ESV), offer a balanced framework aligning economic and environmental agendas, thus constituting an optimal strategy for urban development [6,7].
Land-use transitions (LUTs) arise from the interaction between human socio-economic activities and the natural environment [8]. Various land-use types possess distinct capacities to deliver diverse types, quantities, and qualities of ecosystem services. LUTs serve as primary drivers of ecosystem services and climate change, consequently rendering ecosystems vulnerable [9,10,11]. Acting as a bridge between nature and society, ESs intricately connect LUTs with human well-being, thereby serving as a crucial nexus for regional ecological security and socio-economic development [12,13]. However, alongside urbanization, industrialization, and socio-economic development, certain unsustainable land-use patterns have inflicted severe damage on ecosystems [14,15,16], significantly diminishing the regional ecosystem services value and impairing the capacity of ecosystems to provide essential services [9,17,18]. Moreover, studies indicate that climate change directly impacts biological communities by altering temperature, precipitation, and other factors, further disrupting ecosystem services’ capacity [19]. With the exacerbation of the conflict between eco-environment and socio-economic development, the pressing question arises: Can limited natural resources and fragile ecosystems sustain long-term socio-economic development worldwide? This emerges as a critical scientific challenge requiring urgent resolution.
Since the advent of industrial civilization, rapid economic development, unbridled resource consumption, and unchecked development have spawned a plethora of eco-environmental challenges, including ecosystem degradation, biodiversity loss, and the weakening of ecosystem services, thereby posing serious threats to human survival and development [20,21,22]. Ecosystem services valuation serves as a crucial tool for assessing the efficacy of ecological protection and holds significant reference value for regional ecological compensation [23,24,25,26], ecological security pattern construction [27], and ecological civilization construction [28]. Hence, quantitatively examining the influence of LUTs on the ecosystem services value is imperative for coordinating regional sustainable development. The evaluation of the ecosystem services value (ESV) has emerged as a frontier and prominent issue since Costanza’s pioneering global ESV assessment in 1997 [2]. Scholars have closely monitored this field, tracking dynamic changes in global ESV [29,30,31,32]. For instance, Ouyang et al. (1999) conducted an initial estimation of China’s terrestrial ESV [33]; Xie et al. (2003) evaluated the ecological assets of the Qinghai-Tibet Plateau and established per-unit-area service value tables for terrestrial ecosystems in China, which were subsequently revised [34], and then constantly revised the equivalent scale [35]. Woldeyohannes et al. (2020) analyzed the impact of land-use dynamic changes on the ecosystem services value in the Abaya-Chamo basin in southern Ethiopia using local and global ecosystem services value coefficients [36]. Additionally, scholars have extensively discussed how drastic land-use changes and climate change induce ecosystem degradation and affect the ecosystem services value [19,37,38,39,40,41].
Analysis of the existing academic literature reveals that many researchers have employed the ecosystem services valuation method proposed and refined by Costanza et al. (1997) and Xie et al. (2015) to assess ESs across various ecological units and spatio-temporal scales [9]. This approach has yielded substantial findings and advanced the research on ecosystem services valuation, offering a valuable framework for our study. However, existing literature requires improvements in several key areas. Firstly, it is widely acknowledged that the evolutionary trajectory of land use influences changes in ESV. While many studies analyze the spatio-temporal patterns of land-use transitions (LUTs) using models such as the land-use dynamic degree model, CLUE-S model, and landscape pattern index, these methods only partially integrate spatial and temporal aspects. Consequently, LUTs results lack visual representation, and non-spatial attribute data are inadequately expressed in terms of spatial location. Therefore, there is a critical need for a spatio-temporal composite analysis method capable of visually and dynamically illustrating LUTs processes through mapping units. Geo-informatic Tupu was first proposed in 2000 by the Chinese scholar Chen shupeng [42], who has since completed and improved the relevant aspects of the methodology by publishing a series of articles and books [43]. Geo-informatic Tupu, a spatio-temporal compound analysis approach, fulfills this need by visually representing the changing geographical elements through Tupu units [44,45]. Thus, this study aims to employ the geo-informatic Tupu method to spatially delineate LUTs. Secondly, most studies have focused solely on the impact of ESV within individual ecosystem units, overlooking the fact that different units have varying capacities to provide ecosystem services. These discrepancies directly or indirectly influence the formation and provision of ESs. Thirdly, ecosystems, while beneficial to human well-being, also produce negative effects, known as ecosystem dis-services (EDSs) [46,47]. EDSs can originate from natural landscapes as well as human activities, including pollen sensitization [46], air pollution [48], and carbon emissions [49], etc. Although the definition of EDSs remains debated in academic circles, their existence is generally acknowledged [47]. However, most previous scholars assessing ESV did not incorporate an EDS value into the evaluation system or neglected the costs associated with ESs. This omission limits the accuracy of value assessments and undermines the scientificity and feasibility of land-use planning and relevant environmental protection policies.
The above analysis illustrates that the spatio-temporal evolution of land use and its ecological impacts have emerged as prominent and pressing issues in current research, both regionally and globally. Given the heterogeneity of ecosystems [50,51], and the complexity inherent in ecosystem services valuation, it is imperative to conduct coefficient corrections tailored to the specific circumstances of each region when assessing ESV. Moreover, to enhance the accuracy of evaluation results, it is essential to incorporate factors such as the ability to pay, willingness to pay, and the value of ecosystem dis-services into the ecosystem services value (ESV) evaluation system. Furthermore, hilly and mountainous areas exhibit a more intricate geological structure and a higher degree of landmass fragmentation, rendering their eco-environments susceptible to significant human-induced disturbances [25]. Additionally, these regions are particularly vulnerable to the impacts of climate change [52], introducing further uncertainties into ecosystem services dynamics.
Coastal cities, historically pioneers in the development of the marine economy due to their abundant natural and economic resources, now face new challenges in land-use planning and management as they pursue sustainable development. Consequently, exploring the land-use evolution in coastal cities is particularly pertinent [53,54,55]. As a key component of Southeast China’s Economic Zone, Ningde City in Fujian Province boasts rich biodiversity resources and occupies a crucial position in the ecological security pattern of Southeast China. However, in recent years, urbanization and industrialization have led to a significant expansion of built-up land in Ningde City, resulting in the depletion of resources, including cultivated land, and exacerbating the conflict between economic development and eco-environmental protection [56]. Despite these challenges, studies on the relationship between LUTs and ESV in Ningde City remain scarce. Therefore, it is imperative to monitor and analyze these changes, exploring the spatio-temporal variations in LUTs and their impact on ESV. Accordingly, this study initially analyzed the spatio-temporal variations in land use in Ningde City, China, utilizing the geo-informatic Tupu method. Building upon this analysis, we developed an evaluation model to assess the net ESV and investigate its influence on LUTs. The findings of this study not only provide scientific data for land-use management and regional eco-compensation but also serve as a reference for evaluating the net ESV in other countries/regions.

2. Materials and Methods

2.1. Study Area Overview

Ningde City is located in the northeast of Fujian Province, Southeast China (between 118°32′~120°43′ E and 26°18′~27°44′ N) (Figure 1). It has jurisdiction over 9 districts and counties, namely Fu’an City, Shouning County, Jiaocheng District, Gutian County, Pingnan County, Xiapu County, Zhouning County, Fuding City, and Zherong County. The predominant landform consists of hills and mountains, encompassing 94% of the total land area, while plains occupy merely 3.8%.
Renowned as a key coastal collective forest area in Fujian Province, Ningde City boasts significant forest resources, covering an area of 99.14 × 10⁸ hm2 of forest land, with a forest storage capacity of 5549.52 × 108 m3, and a forest coverage rate of 69.98%. These figures rank Ningde City first among mainland China’s coastal municipalities and fourth within Fujian Province. The city’s green industries, including flower and seedling cultivation, bamboo industry, oil tea production, forest economy, and forest ecotourism, contribute significantly to its economic output, with the forestry industry alone generating a total value of CNY 528.54 × 10⁸. Ningde City experiences a north subtropical monsoon climate, characterized by an annual average temperature of approximately 17.5 °C and an annual average precipitation of 2350 mm. Meanwhile, Ningde has a well-developed water system and dense rivers, mostly from northwest to southeast. Among them, the two largest river systems, Jiaoxi and Huotong Creek, cover an area of 7800 square kilometers, accounting for 65.5% of the total watershed area of the city. However, in the past 20 years, soil erosion in the region is relatively serious due to large-scale and disorderly development of orchard land and development disturbance of production and construction projects [57]. Furthermore, Ningde City is home to CATL (Contemporary Amperex Technology Co., Ltd., Ningde, China), a leading global power battery manufacturer. As of 2020, Ningde’s GDP reached CNY 2619 × 108, with a resident population of 3.14 million. The city’s economic structure is characterized by a 12.44% contribution from the primary (agriculture-based) sector, 50.39% from the secondary (industry-based) sector, and 37.17% from the tertiary (service-oriented) sector in 2020. Given the constraints posed by limited land resources and the imperative to balance economic and social development with ecological conservation, achieving this equilibrium remains a critical imperative.

2.2. Data Acquisition and Processing

Land-use data for Ningde City in 2000, 2010, and 2020, at a resolution of 30 m, were generated based on Landsat remote-sensing images. Before land-use classification, radiometric normalization, geometric and atmospheric correction, etc., were adopted to eliminate factors affected by the sensors and atmosphere by using ArcGIS 10.8. And then, the land-use classification data of study area were acquired through the operation of human–computer interactive visual interpretation of the above remote-sensing images. Moreover, the above-mentioned land-use maps were verified by Google Earth’s real-time data. The results showed that the coefficient values of Kappa test were all greater than 0.8, and the interpretation accuracies of the three stages of remote-sensing images were all more than 90%. Land-use types were classified into cultivated land (CL), forest land (FL), orchard land (OL), grassland (GL), water body (WB), built-up land (BL), and unutilized land (UL), according to the specific conditions and research objectives of the study area. Subsequently, a land-use spatial database for Ningde City was established by assigning Codes 1 through 7 to each land type, respectively.
Additionally, the data of temperature and precipitation were provided by the National Meteorological Information Center (http://data.cma.cn, accessed on 16 November 2023). The socio-economic data were all from “Ningde Statistical Yearbook (2001–2021)”. Fujian Provincial Grain and Price Reserve Bureau provided us with grain prices (http://lsj.fujian.gov.cn/xxgk/tjxx/, accessed on 16 November 2023).

2.3. Methodologies

According to the above analysis, this study first utilized the GEE cloud platform, and employed the random forest algorithm to conduct supervised classification on Landsat remote-sensing images from the years 2000, 2010, and 2020 within the research area, thereby obtaining land-use data for three distinct periods. And then, the geo-informatic Tupu model and a newly revised method of benefit transfer were primarily employed for investigating the geographic features of LUTs and their ecological effects from 2000 to 2020. A detailed description of each method is shown below.

2.3.1. Geo-Informatic Tupu

Geo-informatic Tupu records the spatial and temporal composite information of LUTs with Tupu units, which have the composite characteristics of the quantitative representation of the “spatial pattern” and “temporal sequence feature” under the condition of multiple spatio-temporal conditions, making LUTs analysis more intuitive and accurate [56]. The Tupu unit is formed by the combination of spatial units and time-series units, and its selection and collection are two key steps in creating the Tupu. The main steps are as follows:
(1)
Composite Tupu unit. The spatial resolution of 30 m × 30 m was selected as the basic spatial geographical unit for Tupu analysis. Remote-sensing image data of three stages in the study area were selected to determine the time-series units of Tupu from 2000 to 2010 and from 2010 to 2020.
(2)
Tupu construction. The map algebra method is used to carry out the map algebra superposition operation of the two stages of land-use Tupu units, and to realize the Tupu fusion. The specific equation is as follows:
C = 10 A + B
where C is the Tupu code for land-use, that is, the land-use type of the Tupu unit. A and B are the code value of the land-use unit at the beginning of the research phase and at the end of the research phase, respectively. The basic principle of geo-informatic Tupu is to overlay two periods of land-use data, with land types coded at the beginning of the study as the tens-digit and those at the end set as the units-digit, and synthesize the two into a land-use change map with a 2-digit code. For instance, Code 12 means the transition of cultivated land to forest land. Code 26 signifies the transition of forest land to built-up land. The rest of the code follows the same rules.
Moreover, the ratio of LUCs represents the percentage of the conversion area of land-use types to the total conversion area of study area, which is used to further reflect the quantitative change characteristics of Tupu units for LUTs. The calculation formula is:
P = S i j i = 1 n j = 1 n S i j ( i j ) × 100 %
where P represents the ratio of land-use change; Sij denotes the area of the Tupu unit where the initial i-th land-use type is transformed into the final j-th land-use type; n is the number of land-use types.

2.3.2. Land-Use Dynamic Degree

Land-use dynamic degree quantitatively describes the speed of LUTs and plays an important role in comparing the regional differences and trends of LUTs [57]. The equation is as follows:
K = U b U a U a × 1 T × 100 %
where K refers to the land-use dynamic degree for a specific land-use type; Ua and Ub represent areas that are annually under specific land-use types, respectively; and T denotes the research period.

2.3.3. Tupu Feature Statistics

The “TU” characteristic mainly describes the spatial performance of the temporal-change process for land-use Tupu units, and the “PU” of LUTs is the quantitative characteristics of the Tupu units [56]. By adopting the spatial separation degree (for its equation, see Equation (4)) and visual observation of the Tupu process at different stages, the “TU” characteristics of LUTs in this study were demonstrated in the form of a quantity. Meanwhile, the corresponding “PU” features were mainly shown through the table of Tupu units.
F i j = 1 2 × N i j i = 1 n j = 1 n A i j A i j i = 1 n j = 1 n A i j × 100 %
where Fij refers to spatial separation degree that denotes the dispersion degree of the Tupu unit; Aij denotes the i-th land-use type converted to the j-th land-use type during a selected research period; Nij and n represent the number of Tupu units and land-use types, respectively.

2.3.4. Ecosystem Services Valuation Model

The benefit-transfer method was first proposed by Costanza et al. [2], which is commonly employed to evaluate ESV using monetary values (value coefficients) [34,35]. However, some of these coefficients were unreasonable and the researchers have raised several issues indirectly adopting the value coefficients in the developing countries [58]. To apply this method appropriately in China, Xie et al. (2015) modified the Chinese ecosystem’s value coefficients based on the framework of Costanza et al. (1997). Due to the heterogeneity of the ecosystem [9], we modified the value coefficients and divided the ESs into 4 types and 11 sub-types for the study area (Table 1), based the framework of Xie et al. (2015). A model for evaluating ESV in Ningde City is as follows:
E S V = ( A i × V C i × S i × P I )
where ESV represents the ecosystem services value in Ningde City (CNY 108); Ai and VCi indicate the i-th land-use type area and the ESV adjustment coefficient for the i-th land-use type, respectively (Table 1); Si is the adjustment factor for biomass factors, while PI is the adjusting factor of social and economic factors, based on the human willingness to pay and ability to pay. The calculation process of the above parameters is not described here in detail; this can be found in our previous work [9].

2.3.5. Ecosystem Dis-Services Valuation Model (DESV)

It is difficult to obtain and quantify the data of negative ecosystem services generated from the natural landscape; therefore, this study mainly estimated the ecosystem dis-services value in Ningde City based on the influencing factors caused by human activities. We selected land-use-driven carbon emissions, water consumption, pesticide pollution, plastic film pollution, and fertilizer loss as negative value evaluation indicators.
(1)
Land-use-driven carbon emissions valuation model
V l a n d = V 1 + V 2
where Vland denotes the total value of land-use induced carbon emissions; V1 and V2 represent the value of carbon emissions from each land-use type (excluding built-up land) and built-up land-induced carbon emissions, respectively.
V 1 = P C × A i δ i
where PC indicates the carbon trading price, which is 20 CNY/ton based on the average trading price in the carbon trading market of Fujian Province [59]; Ai is each land-use type area; δi represents the carbon emission and carbon absorption coefficients of various land-use types (Table 2). The carbon emission is positive and the carbon absorption is negative.
Built-up land carries a large amount of energy consumed by human activities, and its carbon emissions are estimated indirectly. In this study, eight main energy sources including raw coal, coke, fuel oil, gasoline, kerosene, diesel gas, natural gas, and liquefied petroleum gas were selected for calculation, according to the data availability in the research area. The calculation formula is as follows.
V 2 = P C × e i × β i × γ i × 44 / 12
where ei is the consumption of i-th fossil energy, βi is the coefficient of conversion of various fossil energy into standard coal (coefficient of standard coal), and γi is the carbon emissions coefficient of the i-th fossil energy. The specific coefficients are shown in Table 3.
(2)
Water consumption valuation model
The value of water consumption can be calculated by the water storage cost method of the available reservoir [64].
V water = W × R × C w
Vwater represents the negative value of water consumption; W is the water consumption for agricultural irrigation (m3); R is the agricultural water consumption rate (%), with a value of 35%; Cw is the storage cost of the reservoir (1.17 CNY/m3) [65].
(3)
Pesticide pollution valuation model
During the use of pesticides in China, 20–40% of the pesticides are released into the air and 40–60% fall on the ground, which results in the ineffective use of pesticides [66]. In this study, the value of 39.8% was taken as the pesticide utilization rate, according to the Ministry of Agriculture and Rural Affairs of China [67]; the average pesticide price was 30,000 CNY/t, and the negative value of pesticides was estimated from the above data.
V p e s t i c i d e = S P × ( 1 n ) × P P
where Vpesticide means the negative value of pesticide pollution; SP, n and PP represent the pesticide usage (t), pesticide utilization rate, and pesticide price (CNY/t), respectively.
(4)
Fertilizer loss valuation model
While increasing crop yield, chemical fertilizers also bring about many ecological and environmental problems, such as water eutrophication [68], soil pollution and acidification [69], etc. The value of water eutrophication caused by the loss of chemical fertilizer is difficult to calculate and quantify. This study only considers the value of chemical fertilizer loss and calculates the negative value of chemical fertilizer application.
V f e r t i l i z e r = S F × ( 1 r ) × P F
where Vfertilizer means negative value of fertilizer loss; SF denotes fertilizer usage (t); r and PF represent the fertilizer utilization rate with a value of 39.2% [67] and fertilizer price of Ningde City with an average value of 3600 CNY/t, respectively.
(5)
Agricultural plastic-film residual pollution valuation model
China is a big agricultural country, with the largest user of plastic-film in the world. However, plastic-film mulching technology not only increases the effective output of crops, but also leads to the continuous accumulation of plastic-film residues in the soil. The eco-environmental problems caused by plastic-film residues have become increasingly prominent, such as reducing soil fertility and affecting the growth of crops, etc. [70]. According to the survey, the residual rate of agricultural plastic film in Ningde City reaches an average of 40%; the cost of manual treatment and mechanical treatment are 8292.5 CNY/t and 2421.4 CNY/t, respectively, with an average value of 5356.9 CNY/t. Therefore, this study selected 40% and 5356.9 CNY/t as the basic data to calculate the negative value caused by the treatment of agricultural film residues.
V p l a s t i c - f i l m = S M × R × P M
where Vplastic-film means the negative value of agricultural plastic-film residual pollution; SF denotes plastic-film usage (t); R and PM denote the plastic-film residual rate (%) and price required for the disposal of plastic-film residue (CNY/t).
Accordingly, the ecosystem dis-services value (DESV) is evaluated by the following formula.
D E S V = V l a n d + V water + V p e s t i c i d e + V f e r t i l i z e r + V p l a s t i c - f i l m

2.3.6. A Model for Net Ecosystem Services Value (NESV)

The NESV is the net benefit brought to human beings by ecosystem services which takes into account the ecological cost (DESV). Hence, we defined NESV as the net value after subtracting DESV:
N E S V = E S V D E S V

3. Results Analysis

3.1. Land-Use Change Characteristics

Forest land was the main land-use type in Ninde City (Figure 2 and Figure 3), accounting for more than 60% of the total area. Cultivated land had an area of more than 1000 km2, and its area accounted for 16.96% of the total coverage, which makes it the second largest land-use type in Ningde City during 2000–2020. From 2000 to 2020, the area of cultivated land and forest land showed a decreasing trend, and the area of these two land-use types declined from 1420.59 km2 and 9711.50 km2 in 2000 to 1368.43 km2 and 9601.11 km2 in 2020, respectively. Due to the large coverage area of cultivated land and forest land, the land-use dynamic degrees were only −1.00% and −0.06%, respectively. The area of orchard land and water bodies demonstrated a continuous increasing trend, among which the change in water bodies was more obvious, from 259.28 km2 in 2000 to 442.70 km2 in 2020, with an increase of 70.74%. It is worth noting that built-up land exhibited a continuous upward trend, and the growth rate is increasing. Its area was only 132.98 km2 in 2000; however, its area increased to 449.47 km2 in 2020, with an increase of more than 3 times.

3.2. Tupu Analysis of Land-Use Transitions (LUTs)

3.2.1. Tupu Analysis of LUTs from 2000 to 2010

In the analysis of LUTs using the Tupu method in Ningde City from 2000 to 2010, a total of 49 types of Tupu units were identified, with 27 undergoing changes, encompassing a combined area of 318.73 km2 (Table 4). The spatial distribution of Tupu units exhibited notable disparities during the aforementioned period (Figure 4a).
As can be seen from Table 4 and Figure 4a, the conversion area of cultivated land was 210.42 km2, of which 37.61% was converted to forest land (79.15 km2, code 12), 28.97% to water bodies (60.97 km2, code 15), 21.6% to grassland (45.45 km2, code 14), and 8.81% to built-up land (9.22 km2, code 16); the transferred area of cultivated land was 43.59 km2, of which 95.79% came from forest land (41.76 km2, code 21) and 3.33% from grassland (1.45 km2, code 41). Moreover, the area of forest land transfer was 96.98 km2, of which 43.06% was converted to cultivated land (41.76 km2, code 21) and 30.35% was converted to grassland (29.43 km2, code 24); the area of forest land transferred was 81.60 km2, mainly from cultivated land (code 12) and orchard land (code 32). Furthermore, the most obvious changes in Tupu units were “cultivated land → forest land” (code 21), “cultivated land → water bodies” (code 15), “cultivated land → grassland” (code 14), and “forest land → cultivated land” (code 21), accounting for 24.83%, 19.13%, 14.26%, and 13.10% of the total land-use types that were converted, respectively. In addition, the Tupu units “forest land → grassland” (code 24) and “cultivated land → built-up land” (code 16) were noteworthy, accounting for 9.23% and 5.82%, respectively. In short, the amount of cultivated land transfer was the largest type of all types of land, the cultivated land that has changed is scattered throughout Ningde City, mainly converted to built-up land in the main urban area, and converted to forest land and grassland in areas such as Fuding and Gutian Counties.

3.2.2. Tupu Analysis of LUTs from 2010 to 2020

In the analysis of LUTs using the Tupu method in Ningde City from 2010 to 2020, a total of 31 types of Tupu units underwent changes, covering a combined area of 298.35 km2 (Table 5). The distribution pattern of Tupu units exhibited significant differences during the period of 2010–2020 (Figure 4b), with the total number of Tupu units decreasing compared to the previous decade.
It can be seen from Table 5 and Figure 4b that 151.55 km2 of cultivated land was converted, of which 35.83% was converted to built-up land (54.30 km2, code 16), 27.08% was converted to forest land (41.04 km2, code 12), and 25.49% was converted to grassland (38.64 km2, code 14); the transferred area of cultivated land was 111.53 km2, mainly from forest land and grassland. Meanwhile, the conversion area of forest land was 106.22 km2, and the percentage of conversion to cultivated land, grassland, and orchard land was 74.47%, 18.47%, and 6.38%, respectively. The transfer-in area of grassland was larger than the transfer-out area, with a difference of 20.12 km2. The transfer-in part mainly came from cultivated land and forest land, while the transferred-out area was mainly cultivated land. Additionally, “forest land → cultivated land” (code 21) and “cultivated land → built-up land” (code 16) were the important Tupu units, accounting for 26.51% and 18.20%, respectively, of the total land-use types that were converted.

3.3. Land-Use Rising/Falling Tupu Analysis

3.3.1. Land-Use Rising Tupu

The upward trend mapping of the two time series units of 2000–2010 and 2010–2020 in Ningde City is shown in Figure 5, while the differences and changes in each county and city are counted (Table 6).
As shown in Table 6 combined with Figure 4, the total area of unchanged area of land use and the total area of changed area in the study area during 2000–2010 were divided into 12,757.33 km2 and 318.4 km2, which accounted for 97.56% and 2.44% of the longitudinal surface of the study area, respectively. In the change area, the new increased forest land had the largest area of 81.59 km2, accounting for 25.63% of the total new increased area, followed by new increased grassland, new increased water bodies, and new increased cultivated land, with the areas of 75.08 km2, 63.01 km2, and 43.6 km2, respectively, and the smallest area of new increased unutilized land. There are obvious differences in the land-use changes among counties and cities in Ningde City, with Gutian County having the highest proportion of unchanged area (18.26%) and the most stable land-use changes, while Zherong County has the lowest proportion of unchanged area (4.14%), indicating that it is the most active in land-use changes, with the highest area of new increased forest land at 14.59 km2; Xiapu County has the highest area of new increased cultivated land at 7.38 km2. Gutian County has the highest area of new increased cultivated land, 7.38 km2, and Gutian County has the second highest area of new increased cultivated land after Xiapu County, 7.28 km2; Fuding City has the highest area of new increased water bodies, 11.38 km2, and it has the second highest area of new increased built-up land, 6.6 km2; and the land-use change in Zhouning County is relatively stable.
During the period of 2010–2020, the area of land-use change area decreased compared with the previous stage, but the spatial distribution range of the change area was wider. The area of new increased cultivated land increased significantly, reaching 111.52 km2, accounting for 36.51% of the total area of new increased land; followed by the area of new increased built-up land, expanding by 27.17 km2 compared with the previous period, indicating that urbanization and industrialization in Ningde City increased the demand for built-up land in this period; the area of new increased forest land and new increased grassland decreased by 39.42 km2 and 16.65 km2, indicating a slowdown in ecological land protection during this period. The area of new increased cultivated land in Gutian County was still the largest, reaching 21.94 km2, and the area of new increased land in Fuding City followed with 16.4 km2; it is worth paying attention to the fact that, except for Zherong County, the area of new increased built-up land in the rest of the counties and cities increased significantly compared with the previous period, among which the area of new increased built-up land in Jiaocheng City had the largest increase; in addition, the area of new increased forest land in all the counties and cities decreased significantly compared with the previous period, among which the decrease was the largest in Fu’an City; Xiapu County’s new increased grassland area is second only to Gutian County, indicating that the returning farmland to forest and grassland project is selective to the terrain.

3.3.2. Land-Use Falling Tupu

The fall potential mapping of the two time-series units in Ningde City from 2000 to 2010 and from 2010 to 2020 is shown in Figure 6, while the differences and changes in each county and city were also counted (Table 7).
As shown in Table 7 combined with Figure 6, during the period of 2000–2010, the decreased area of cultivated land in the study area was the highest, 210.42 km2, accounting for 66.1% of the shrinkage area; followed by the decreased area of forest land, 96.98 km2; and again, by the decreased area of grassland, 5.68 km2; and the decreased area of built-up land and the decreased area of unutilized land were both unchanged. There are obvious differences in land-use changes among counties and cities, with the highest shrinkage of cultivated land in Gutian County, 33.91 km2; the highest shrinkage of forested land in Fuding City, 17.85 km2; and the highest shrinkage of grassland in Xiapu County, 1.23 km2, which is three times as much as that of Fu’an City, the city with the lowest shrinkage of grassland.
During the period from 2010 to 2020, the area of each land-use type in the study area decreased compared with the previous period (2000–2010), but the spatial distribution range expanded. Among them, the decreased area of cultivated land was still the highest, at 155.81 km2, indicating that the trend of cultivated land occupation has further intensified in this stage; followed by forest land and grassland, with decreased areas of 97.76 km2 and 36.24 km2, respectively, and the spatial distribution spreading further; the water and unutilized land decreased areas are the smallest, and the change is not obvious. Among the counties and cities, Fuding City had the highest decreased area of arable land, 33.35 km2, which is the administrative unit with the largest land-use change rate at this stage; the decreased area of cultivated land in Gutian County was second only to that of Fuding City, 25.02 km2, and the decreased area of cultivated land in the rest of counties was also reduced compared with that in the previous stage; the decreased areas of forest land and grassland in Gutian County were both the highest. The decreased areas of forest land and grassland in Gutian County were the highest, with 18.43 km2 and 8.99 km2, respectively; the decreased area of forest land in Fu’an City followed, with 16.44 km2.

3.4. Net Ecosystem Services Value

From Table 8, we can see that the ESV in Ningde City demonstrated a downward trend, from CNY 85.07 × 10⁸ in 20 years, a decrease of 7.69%, which indicated that the ecosystem structure of Ningde is fragile. It is worth noting that the dominant land-use types in Ningde’s ESV are forest land, water bodies, and orchard land, and the proportion of ESV in the total value fluctuates between 94.76% and 96.35%, indicating that these three land-use types play an extremely vital role in the ecological function of Ningde City. Among them, forest land provides the highest value of ecosystem services of all land-use types and has been in a leading position during the whole research period; however, its ESV has generally decreased over the past 20 years from CNY 890.95 × 10⁸ in 2000 to CNY 786.70 × 10⁸ in 2020, with a decrease of 11.7%. On the other hand, the ESV of grassland decreased gradually from 2000 to 2020, mainly due to its decreasing area. Additionally, the percentage of ESV in orchard land and water bodies increased continuously, while the percentage of ESV for unutilized land was the smallest, which indicated that the change in ESV of unutilized land had little influence on the total ESV.
It can also be observed from Table 8 that ESV in Ningde City showed different trends in different stages. From 2000 to 2010, with the exception of unutilized land, the ESV of cultivated land and forest land changed greatly, while that of orchard land changed the least. Contrary to the previous stage, the ESV of all land-types illustrated a positive change from 2010 to 2020, but the overall increase was not large, with a range of less than 3%. In general, forest land and water bodies contributed the most to total ESV, followed by grassland and cultivated land, which indicated that the evolution of land-use pattern in Ningde City has a direct and significant influence on ESV.
It was observed that the sub-type of ESV in Ningde City displayed a downward trend in the fluctuation during 2000–2020 (Table 9). Among them, food production’s ESV descended at the fastest rate, with a declining rate of 14.99%; followed by the maintaining nutrient cycle, with the change rate of −13.23%, which was mainly due to the direct relationship between the reduction in forest land area with a larger value coefficient. The decreasing trends of the ESV for aesthetic landscape, climate regulation, and bio-diversity were relatively slow, while purifying the environment was the slowest of all ecological services, with a decline of −9.83%. Furthermore, climate regulation, hydrological regulation, and soil conservation were the main parts of ecosystem services in Ningde City, accounting for more than 61.53% of the total value; however, the ESV of the water supply only accounted for 0.78% of the total ESV.
In addition, from the perspective of the ecosystem services type (Figure 7), the regulating service was the most important function of ESs in Ningde City, with a value of CNY 2092.64 × 108 during the 20 years, accounting for 68.43% of the total ESV; followed by the supporting services, which accounted for 21.39%, while the cultural services had the lowest value, accounting for only 4.31% of the total value. Specifically, the regulating service, supporting service, provisioning service, and cultural service decreased from CNY 751.58 × 10⁸, CNY 241.41 × 10⁸, CNY 64.19 × 10⁸, and CNY 48.36 × 10⁸ in 2000 to CNY 704.03 × 10⁸, CNY 212.53 × 10⁸, CNY 60.76 × 10⁸, and CNY 43.15 × 10⁸ in 2020, respectively.
The total ecosystem dis-services value in Ningde City showed a continuous increasing trend, with a total increase of CNY 3.25 × 10⁸ in 20 years, with an average annual increase of CNY 0.181 × 10⁸ (Figure 8). Apart from land-use-driven carbon emissions, the negative value caused by other negative effects continues to decrease; among them, water consumption accounted for the largest proportion, and its ratio hovered between 21.35 and 38.40%. Meanwhile, the negative value caused by pesticide pollution, plastic film pollution, and fertilizer loss decreased from CNY 0.825 × 10⁸, CNY 0.005 × 10⁸, and CNY 1.804 × 10⁸ in 2000 to CNY 0.937 × 10⁸, CNY 0.027 × 10⁸, and CNY 1.927 × 10⁸ in 2020, respectively; its ratio declined from 10.91%, 0.07%, and 23.86% in 2000 to 8.67%, 0.25%, and 17.82% in 2020, respectively. It is worth noting that the negative value caused by land-use-driven carbon emissions presented an increasing trend, from CNY 5.179 × 10⁸ in 2000 to CNY 13.148 × 10⁸ in 2020, an increase of 153.90%. It can be seen from the comprehensive LUTs that with the conversion of cultivated land and forest land to built-up land, its area expands continuously, and carbon emissions also increase accordingly.
As can be seen from Figure 9, the net value of ecosystem services in Ningde City decreased at first and then increased. The net value fell by 16.01% from CNY 1092.86 × 108 in 2000 to CNY 917.93 × 10⁸ in 2010, and then rose to CNY 1000.08 × 108 in 2020, with an increase of 8.95%.

4. Conclusions and Discussion

Starting from the spatial–temporal change pattern of land-use in a South-East coastal region, this study took Ningde City of China as the research area to explore how its land-use transitions (LUTs) change the ecosystem and its spatial distribution, thus affecting the structure and function of the ecosystem services during 2000–2020. Specifically, the geo-informatic Tupu method was applied to demonstrate the spatio-temporal trajectory and LUTs patterns in recent 20 years based on remote-sensing interpretation data. On this basis, we applied the newly revised benefit-transfer method (equivalent factor method), and developed an evaluation model to assess the net value of ecosystem services caused by different land-use types. The findings can provide scientific data for the policies of land-use and eco-compensation standards. Accordingly, the conclusions are as follows.
(1)
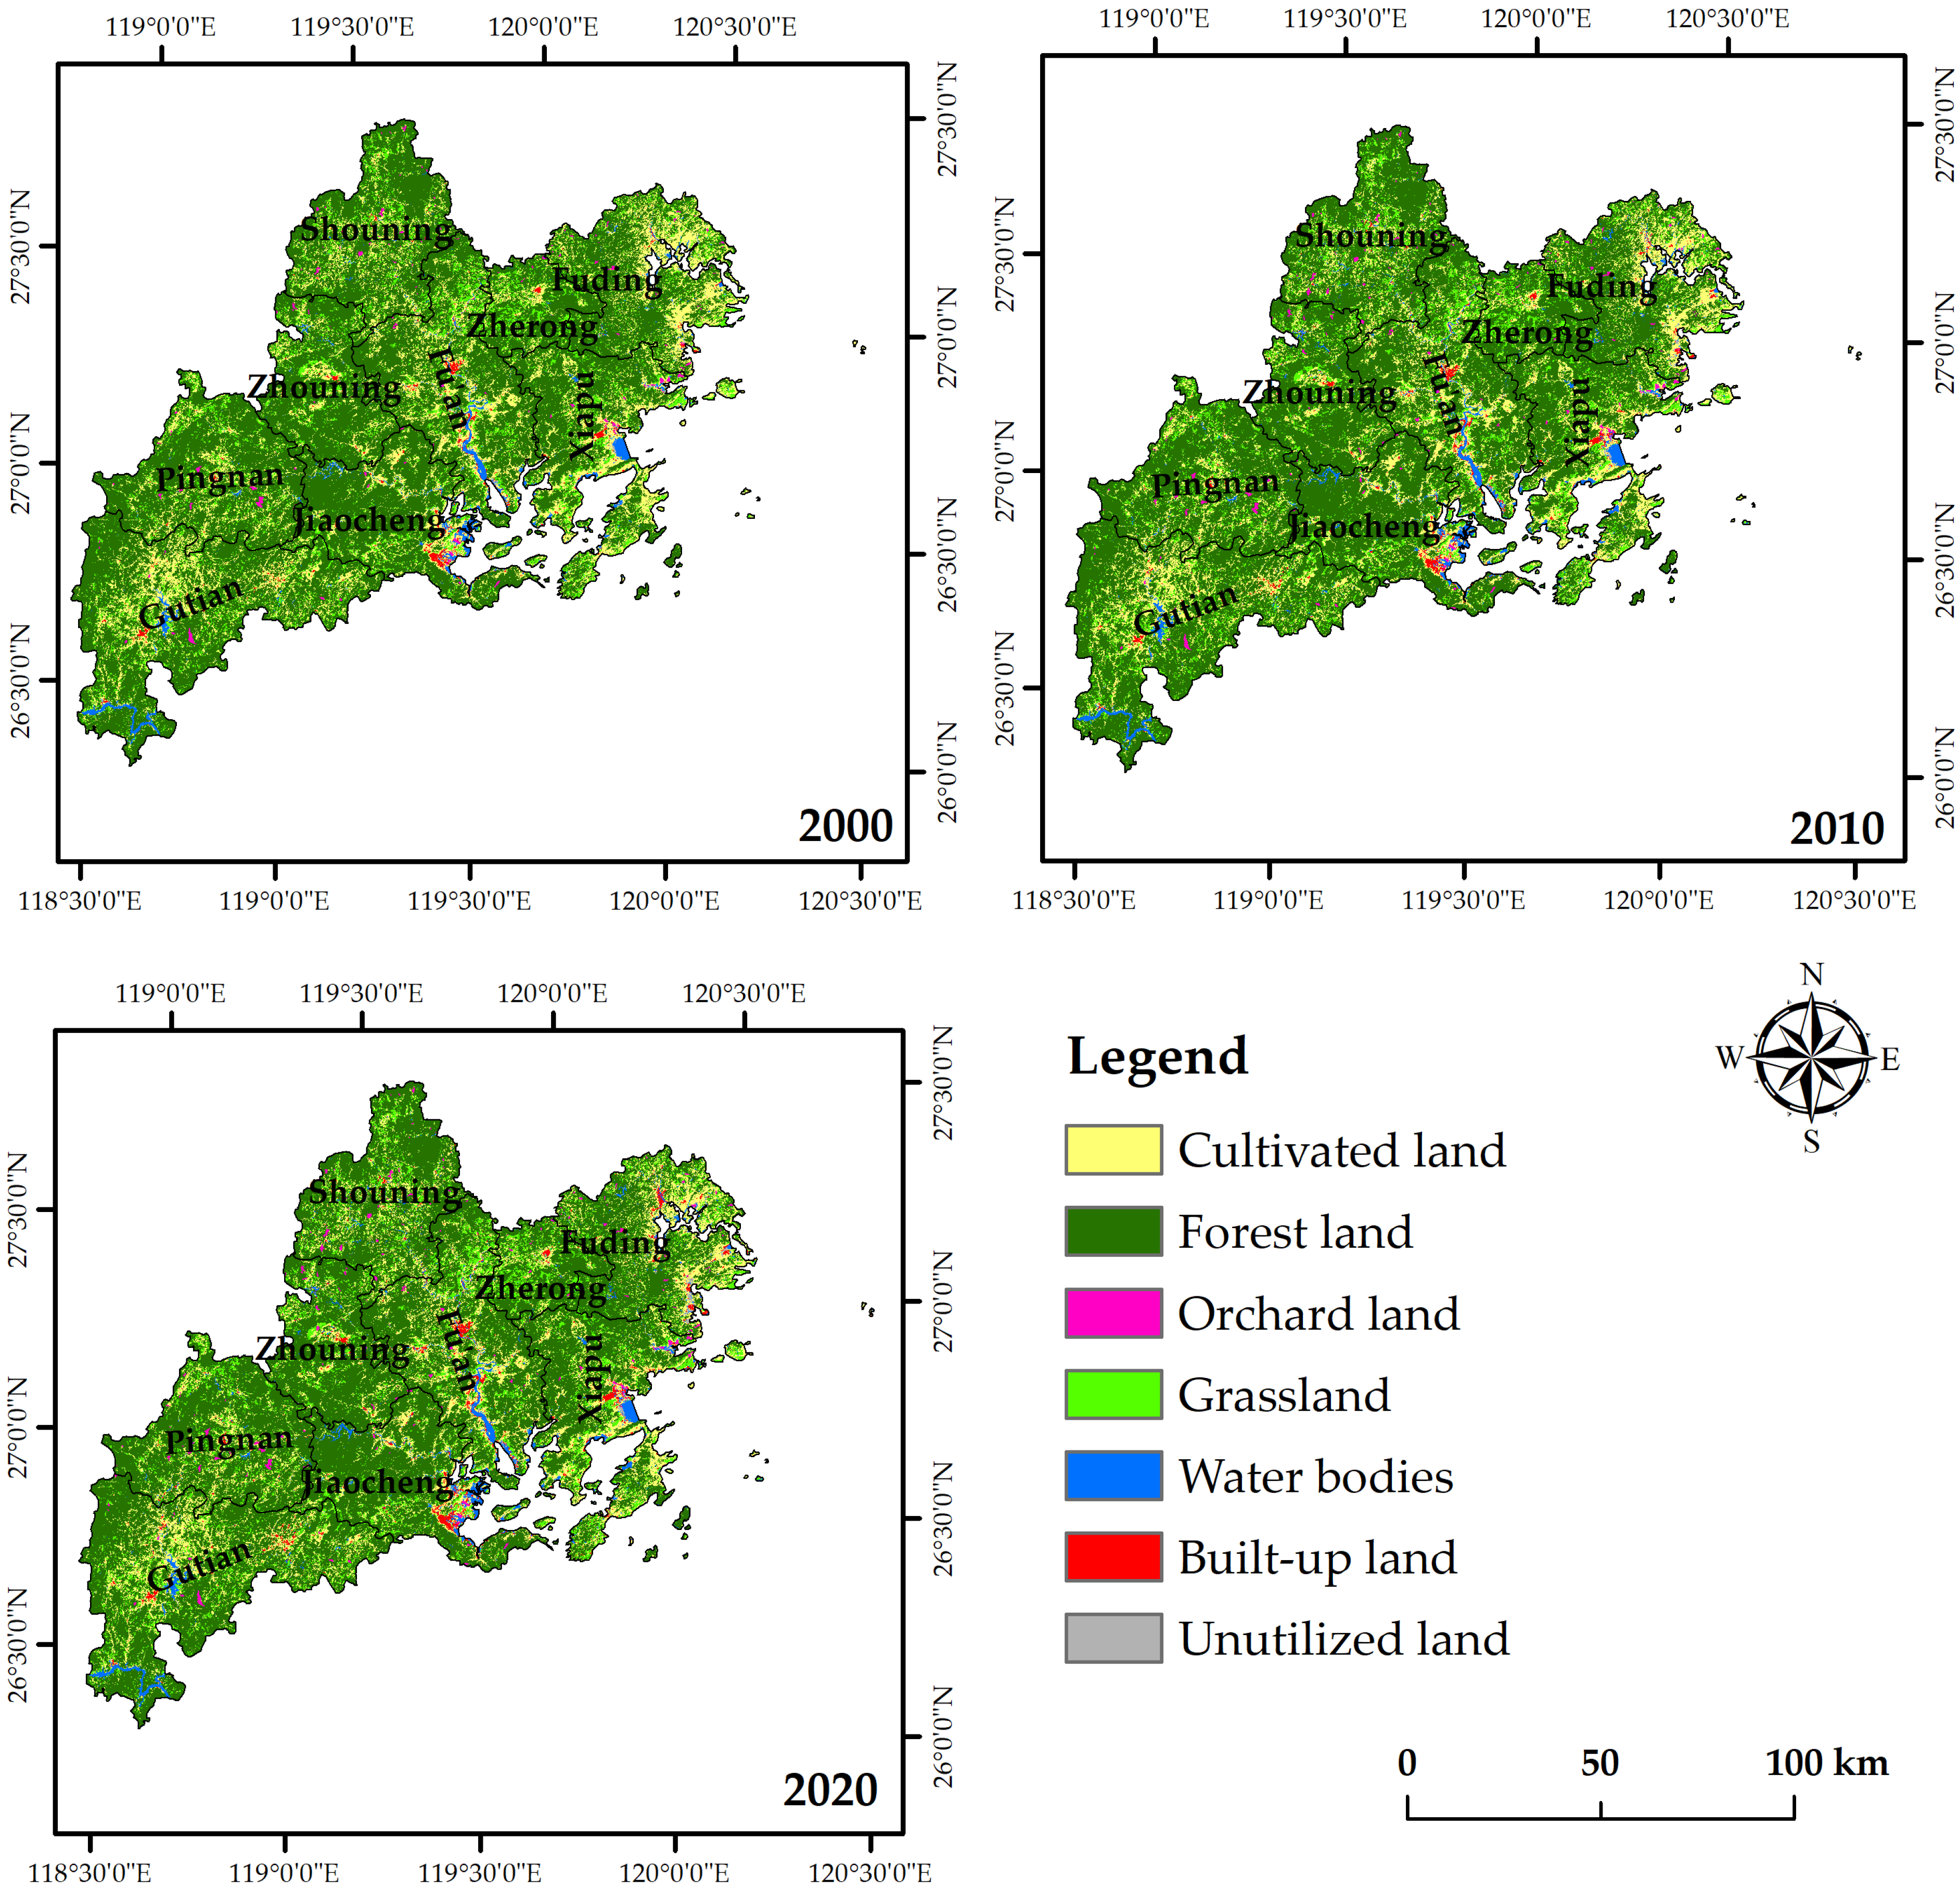
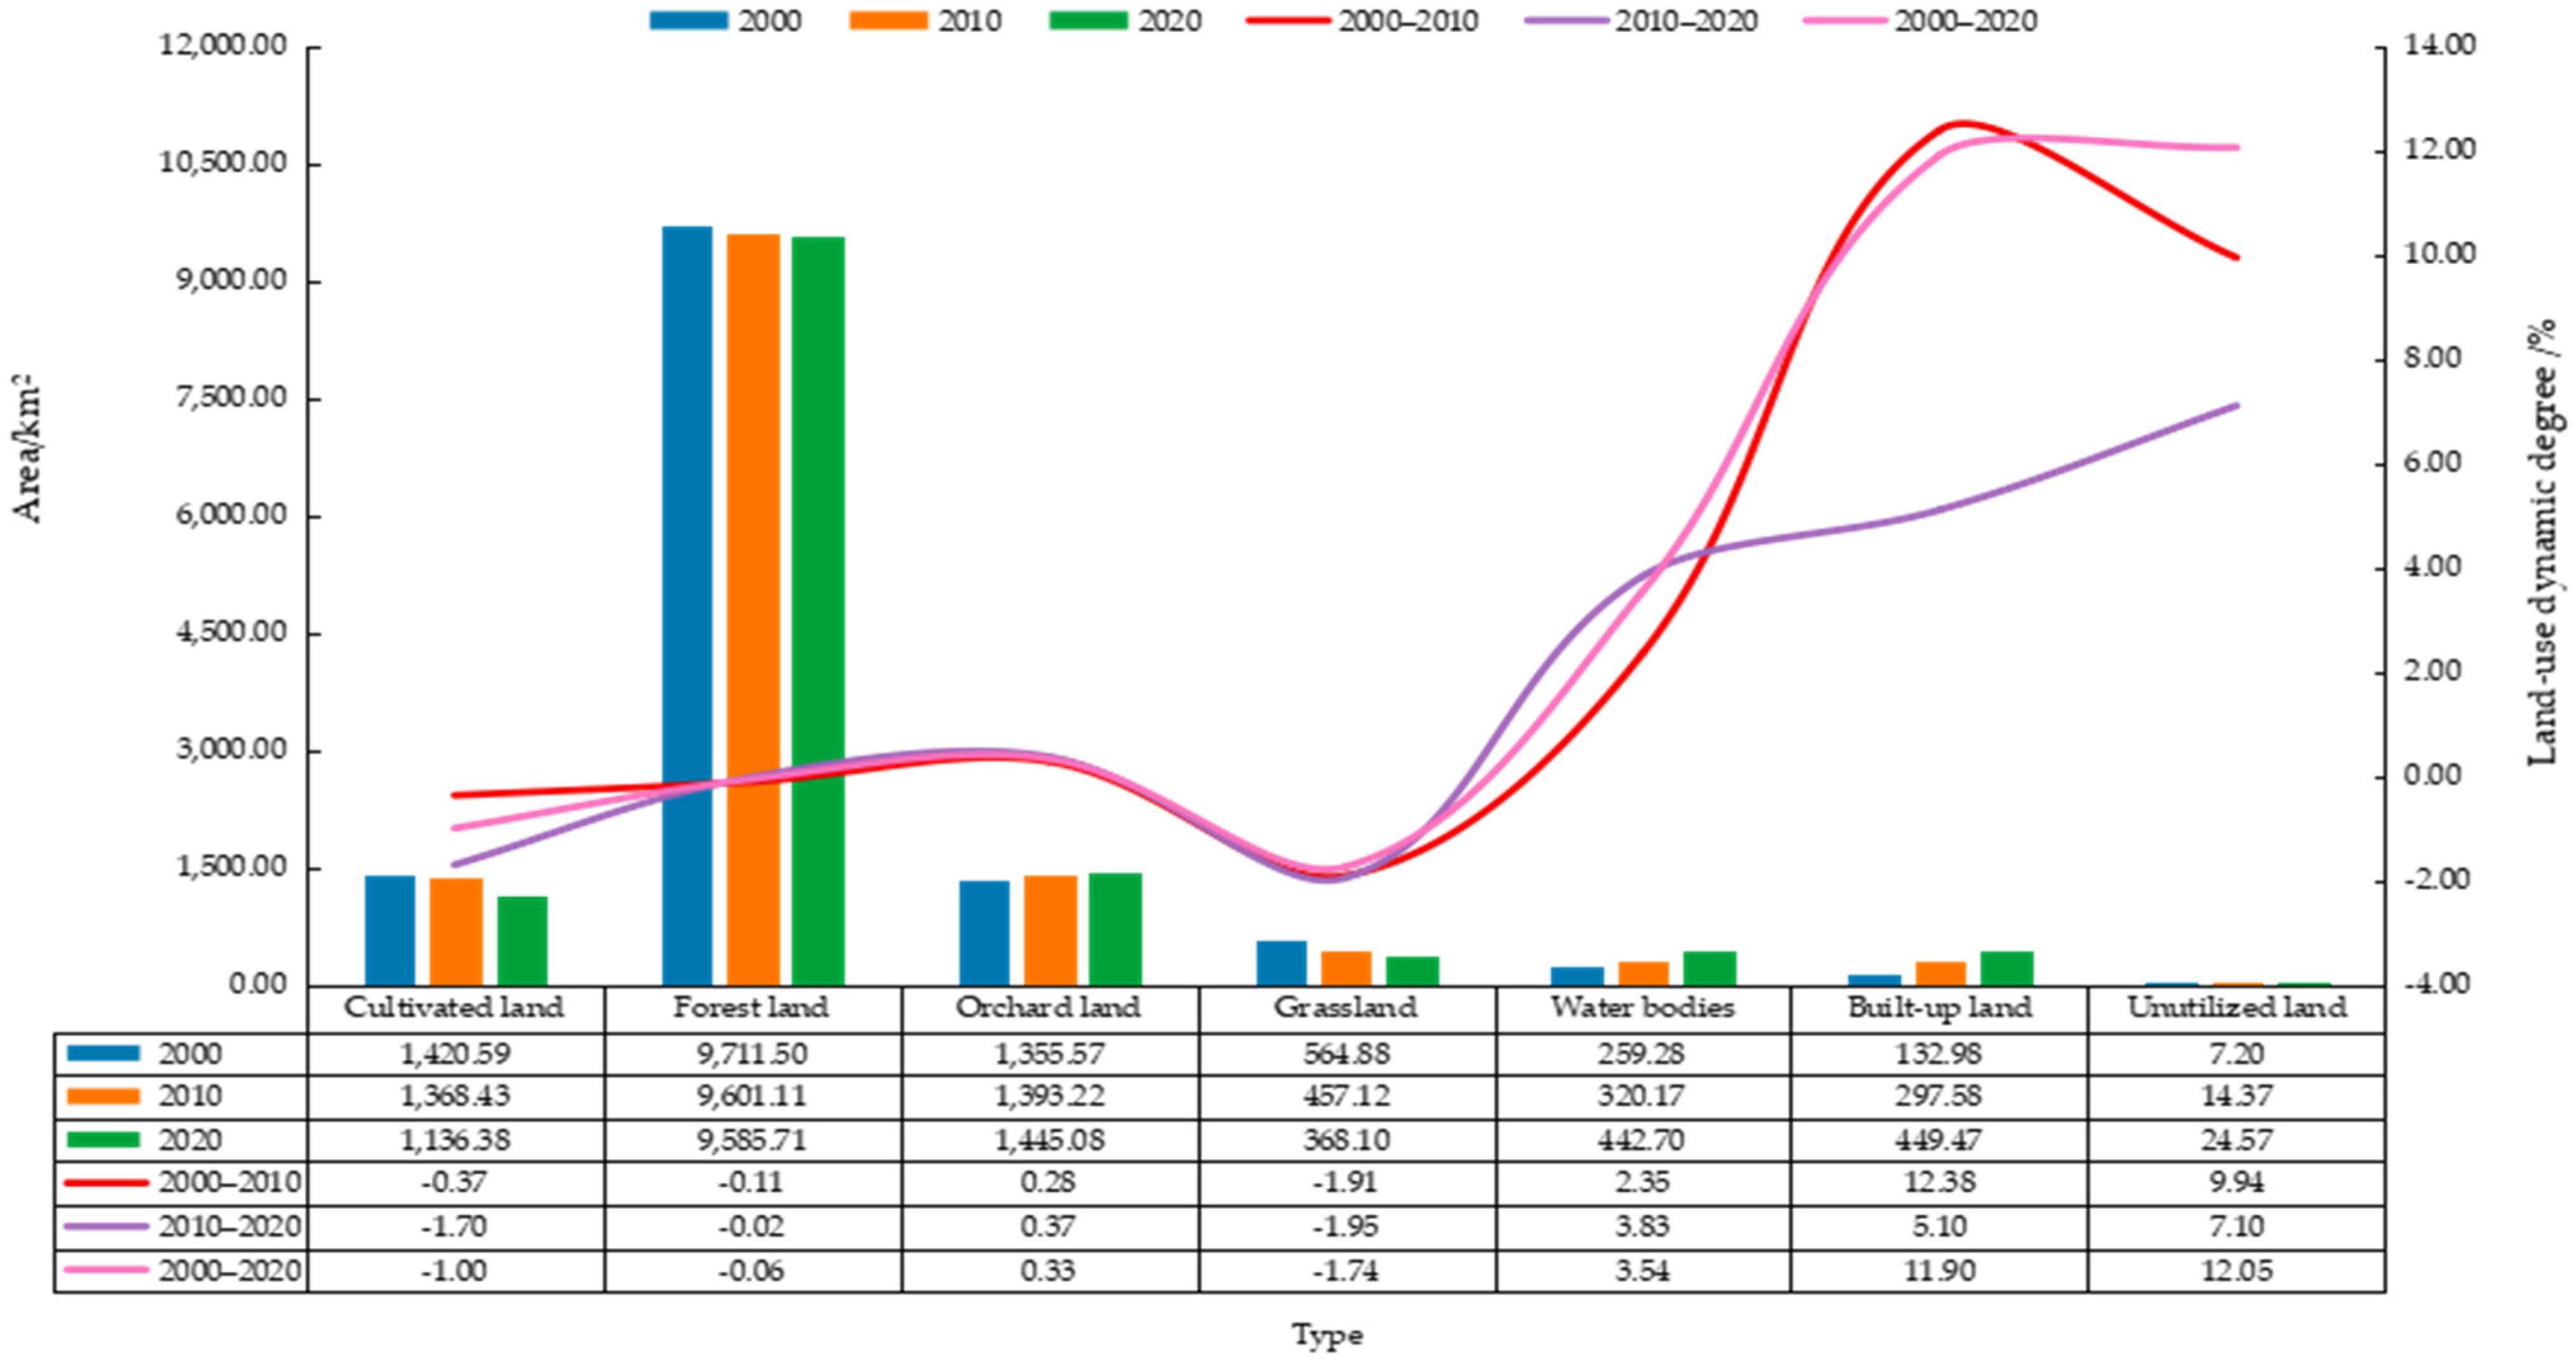
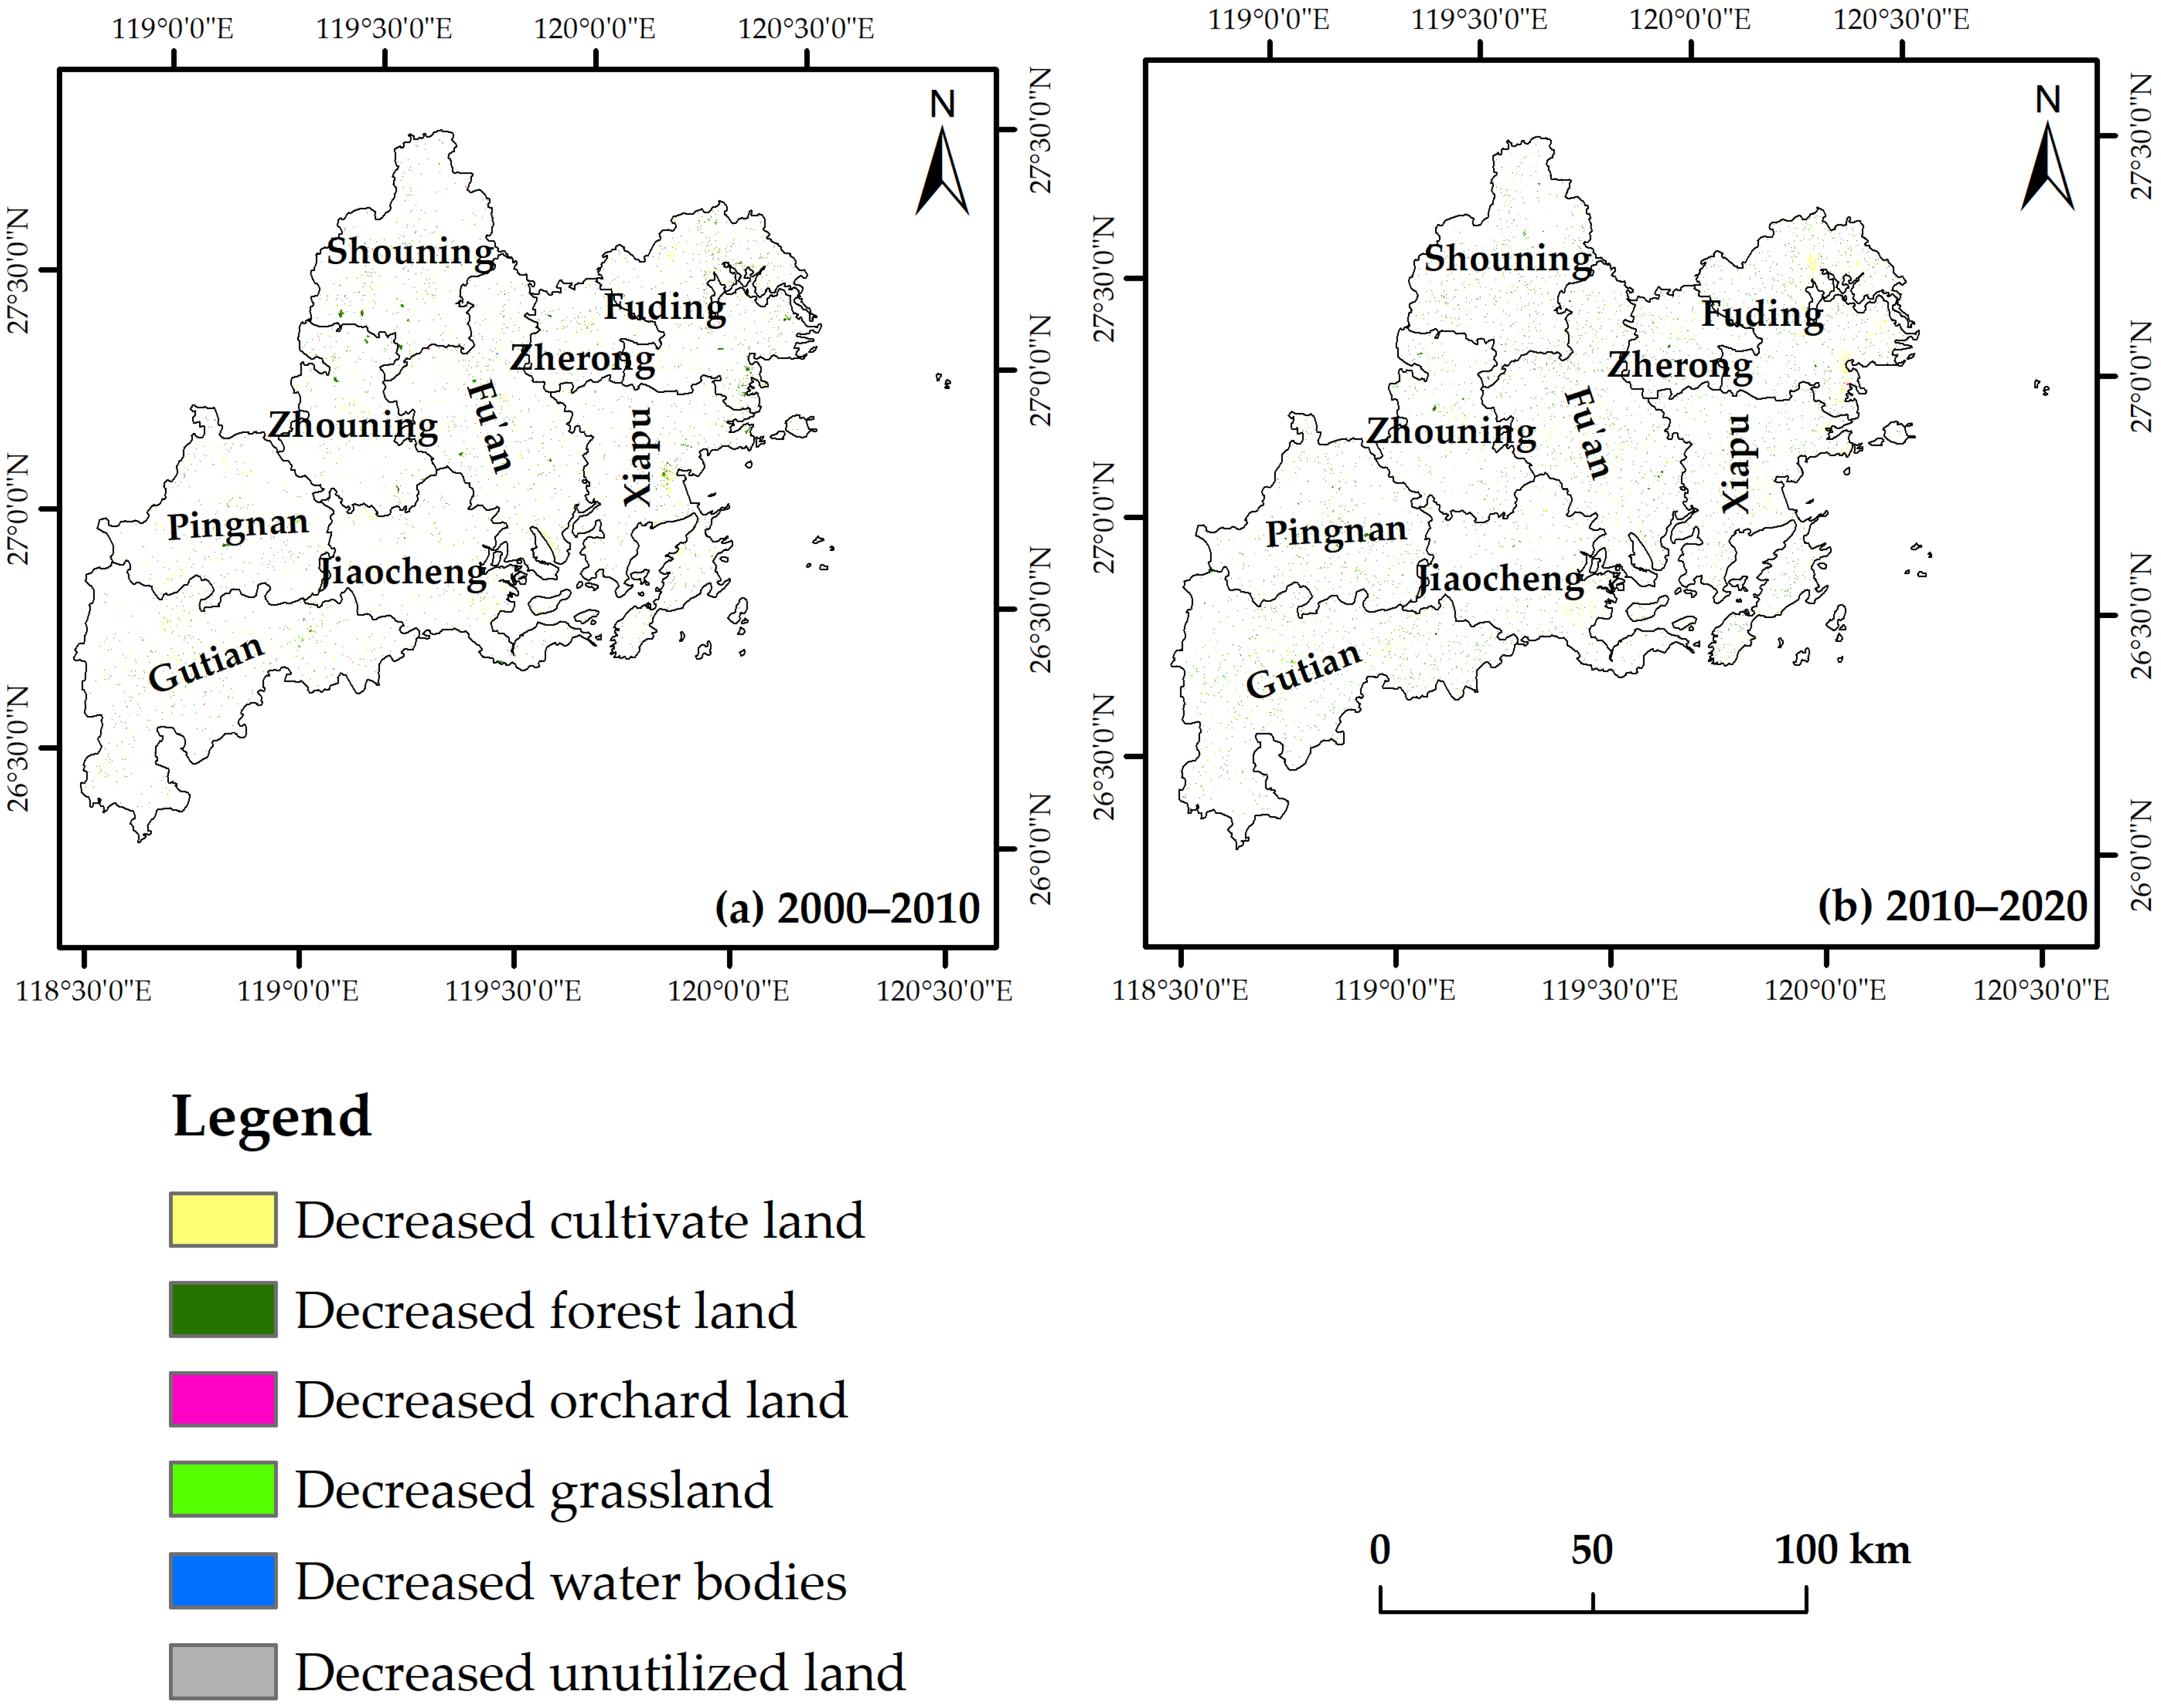
The land-use structure of Ningde City showed a remarkable pattern evolution. The study results indicate that from 2000 to 2020, the land-use structure of Ningde City was primarily characterized by cultivated land and forest land, collectively constituting over 80% of the total area. These land-use types significantly influence the ESV in Ningde City. Notably, the main trends observed for each land-use type include a consistent decline in cultivated land and forest land, accompanied by a continuous expansion of orchard land, water bodies, and built-up land. Conversely, the area of unutilized land showed negligible changes during the study period.
From 2000 to 2020, the area of cultivated land transferred out has slowed down, from mainly forest land and water bodies to mainly built-up land, and at the same time, the area transferred out as forest land is getting smaller and smaller, while the area transferred out as built-up land is getting larger and larger; the area transferred out as forest land is mainly due to the implementation of the policy of returning farmland to forest, and the area transferred out as built-up land is mainly concentrated in the economically developed areas around the urban areas of counties and municipalities, which indicates that urbanization and industrialization in Ningde City are taking up a large amount of arable land. This indicates that urbanization and industrialization in Ningde City have taken up a large amount of cultivated land. The conversion of forest land and grassland into cultivated land is more obvious, mainly in the plains in front of the mountains where the terrain is more balanced. Over the past 20 years, along with the social and economic development of Ningde City and the acceleration of urbanization and industrialization, a large amount of cultivated land has been taken up by non-agricultural constructions, resulting in a continuous decline in the area of cultivated land, which has made the per capita cultivated land area of Ningde City more and more tense. In 1998, China issued and implemented the Land Management Law, which explicitly stipulates a “Compensation System for Occupying Arable Land”; driven by the cultivated land protection policy, people have strengthened land remediation and reclamation, thus prompting the conversion of residual forest land, grassland, and abandoned garden land into cultivated land. Since areas with high elevation and steep slopes are unsuitable for farming activities, the implementation of measures to balance the occupation and replenishment of arable land has prioritized areas with relatively gentle terrain.
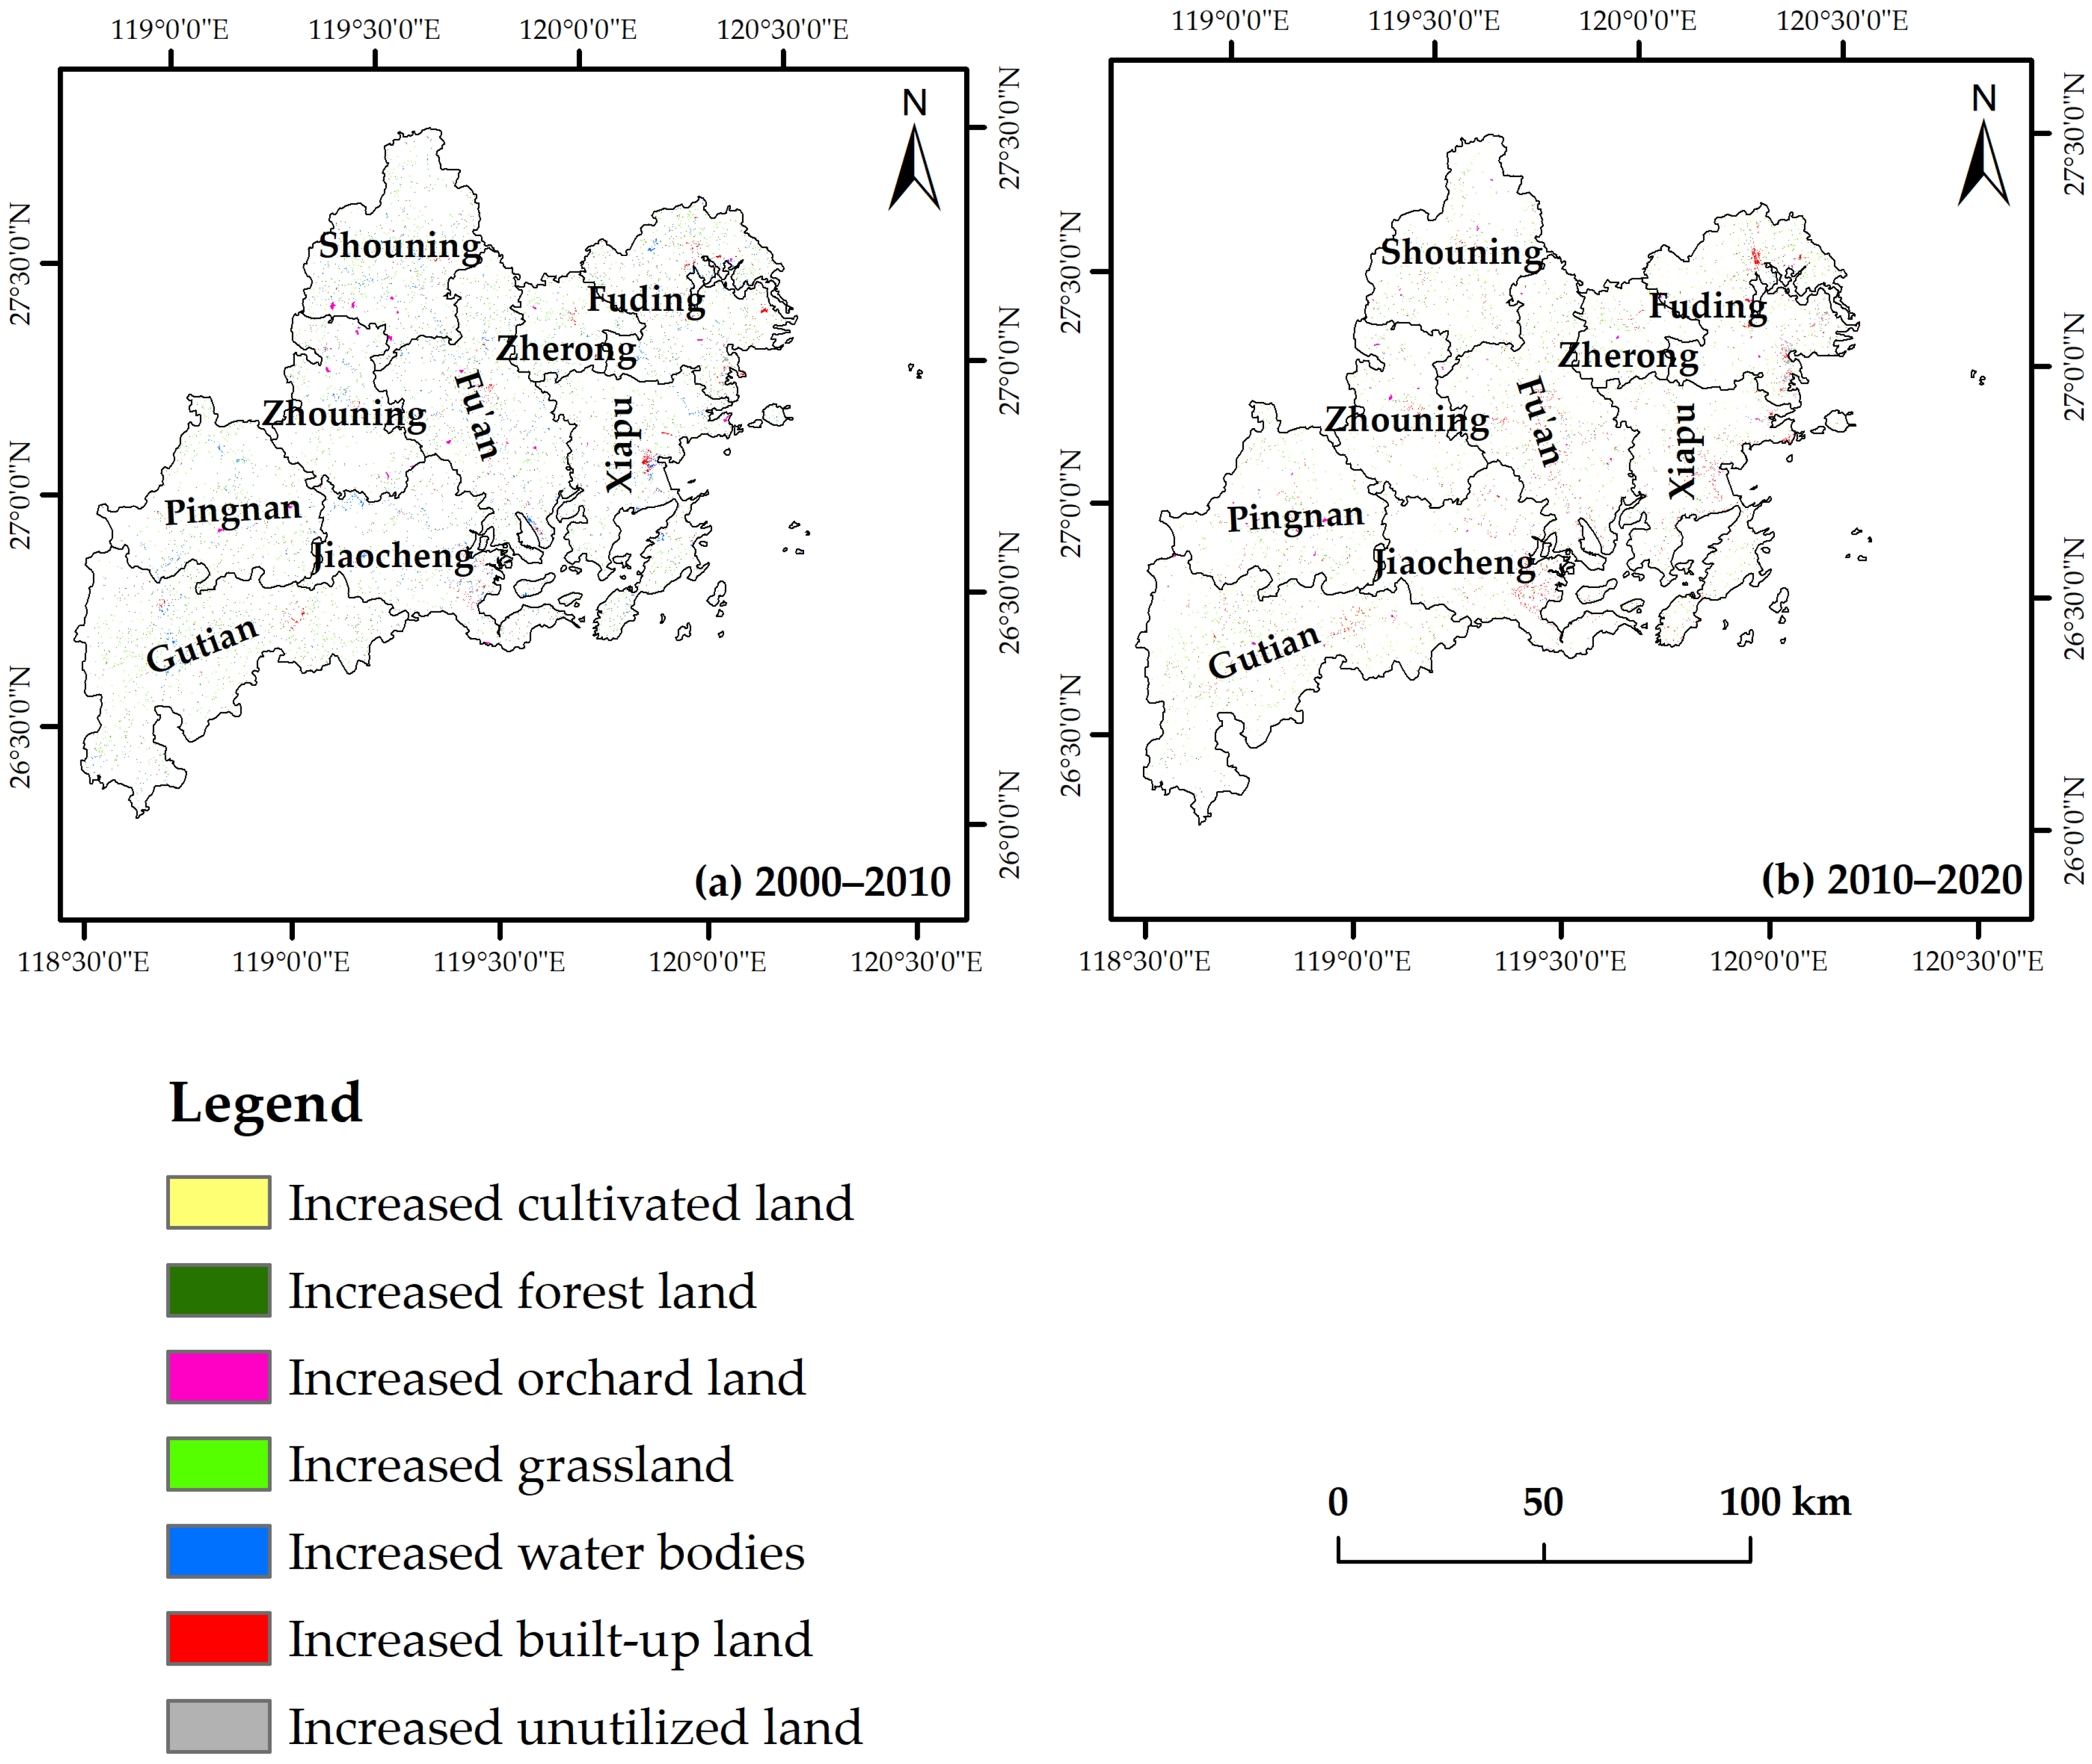
In the two time-series units, there are obvious differences in the changes in both upward and downward mapping in the counties and districts of Ningde City. From 2000 to 2010, Gutian County has the most stable land-use change, while Zherong County is the most active; Gutian County has the largest rate of land-use change, with the highest area of new increased grassland and the highest area of decreased cultivated land; and Fu’an and Xiapu Counties have the largest area of new increased built-up land. From 2010 to 2020, the Ningde City counties and cities had a decrease in the area of land-use change, but their spatial distribution was wider. The land-use change in Zherong County was the most stable, followed by Zhouning County, while the land-use change in Gutian County shifted to be active, in which both the area of new increased cultivated land, and the area of new increased grassland were the highest; Fuding City, Xiapu County, and Jiaocheng City had the highest area of new increased built-up land, which accounted for 57.91% of the total area of new increased built-up land in the period, and also had the highest area of decreased cultivated land, which amounted to 73.62 km2, accounting for the new increased cultivated land in the period.
The analysis reveals that over the past 20 years, the spatio-temporal evolution of land-use change in Ningde City has been characterized by a consistent decrease in cultivated land and forest land, coupled with a continual expansion of built-up land area, leading to tighter constraints on ecological resources. The rapid urbanization and industrialization witnessed in Ningde City have driven significant variations in its land-use pattern, driven primarily by increased demand for built-up land for industrial, commercial, residential, and transportation purposes. Consequently, the areas of forest land and cultivated land have steadily diminished, while orchard land, water bodies, and built-up land have experienced continuous growth. Notably, the built-up land area has exhibited the fastest increase, with an average annual change rate of 11.9%. Additionally, the water bodies area in Ningde City has seen an average annual growth rate of 3.54% from 2000 to 2020, attributed in part to the region’s abundant rainfall and the construction of numerous reservoirs and mountain ponds by the Ningde municipal government to mitigate flood and waterlogging disasters. To address these trends, the government should enhance land-use efficiency through the rational allocation and optimization of land resources. Furthermore, it is crucial to prudently limit the rate of built-up land expansion to mitigate the encroachment on agricultural and ecological land space.
(2)
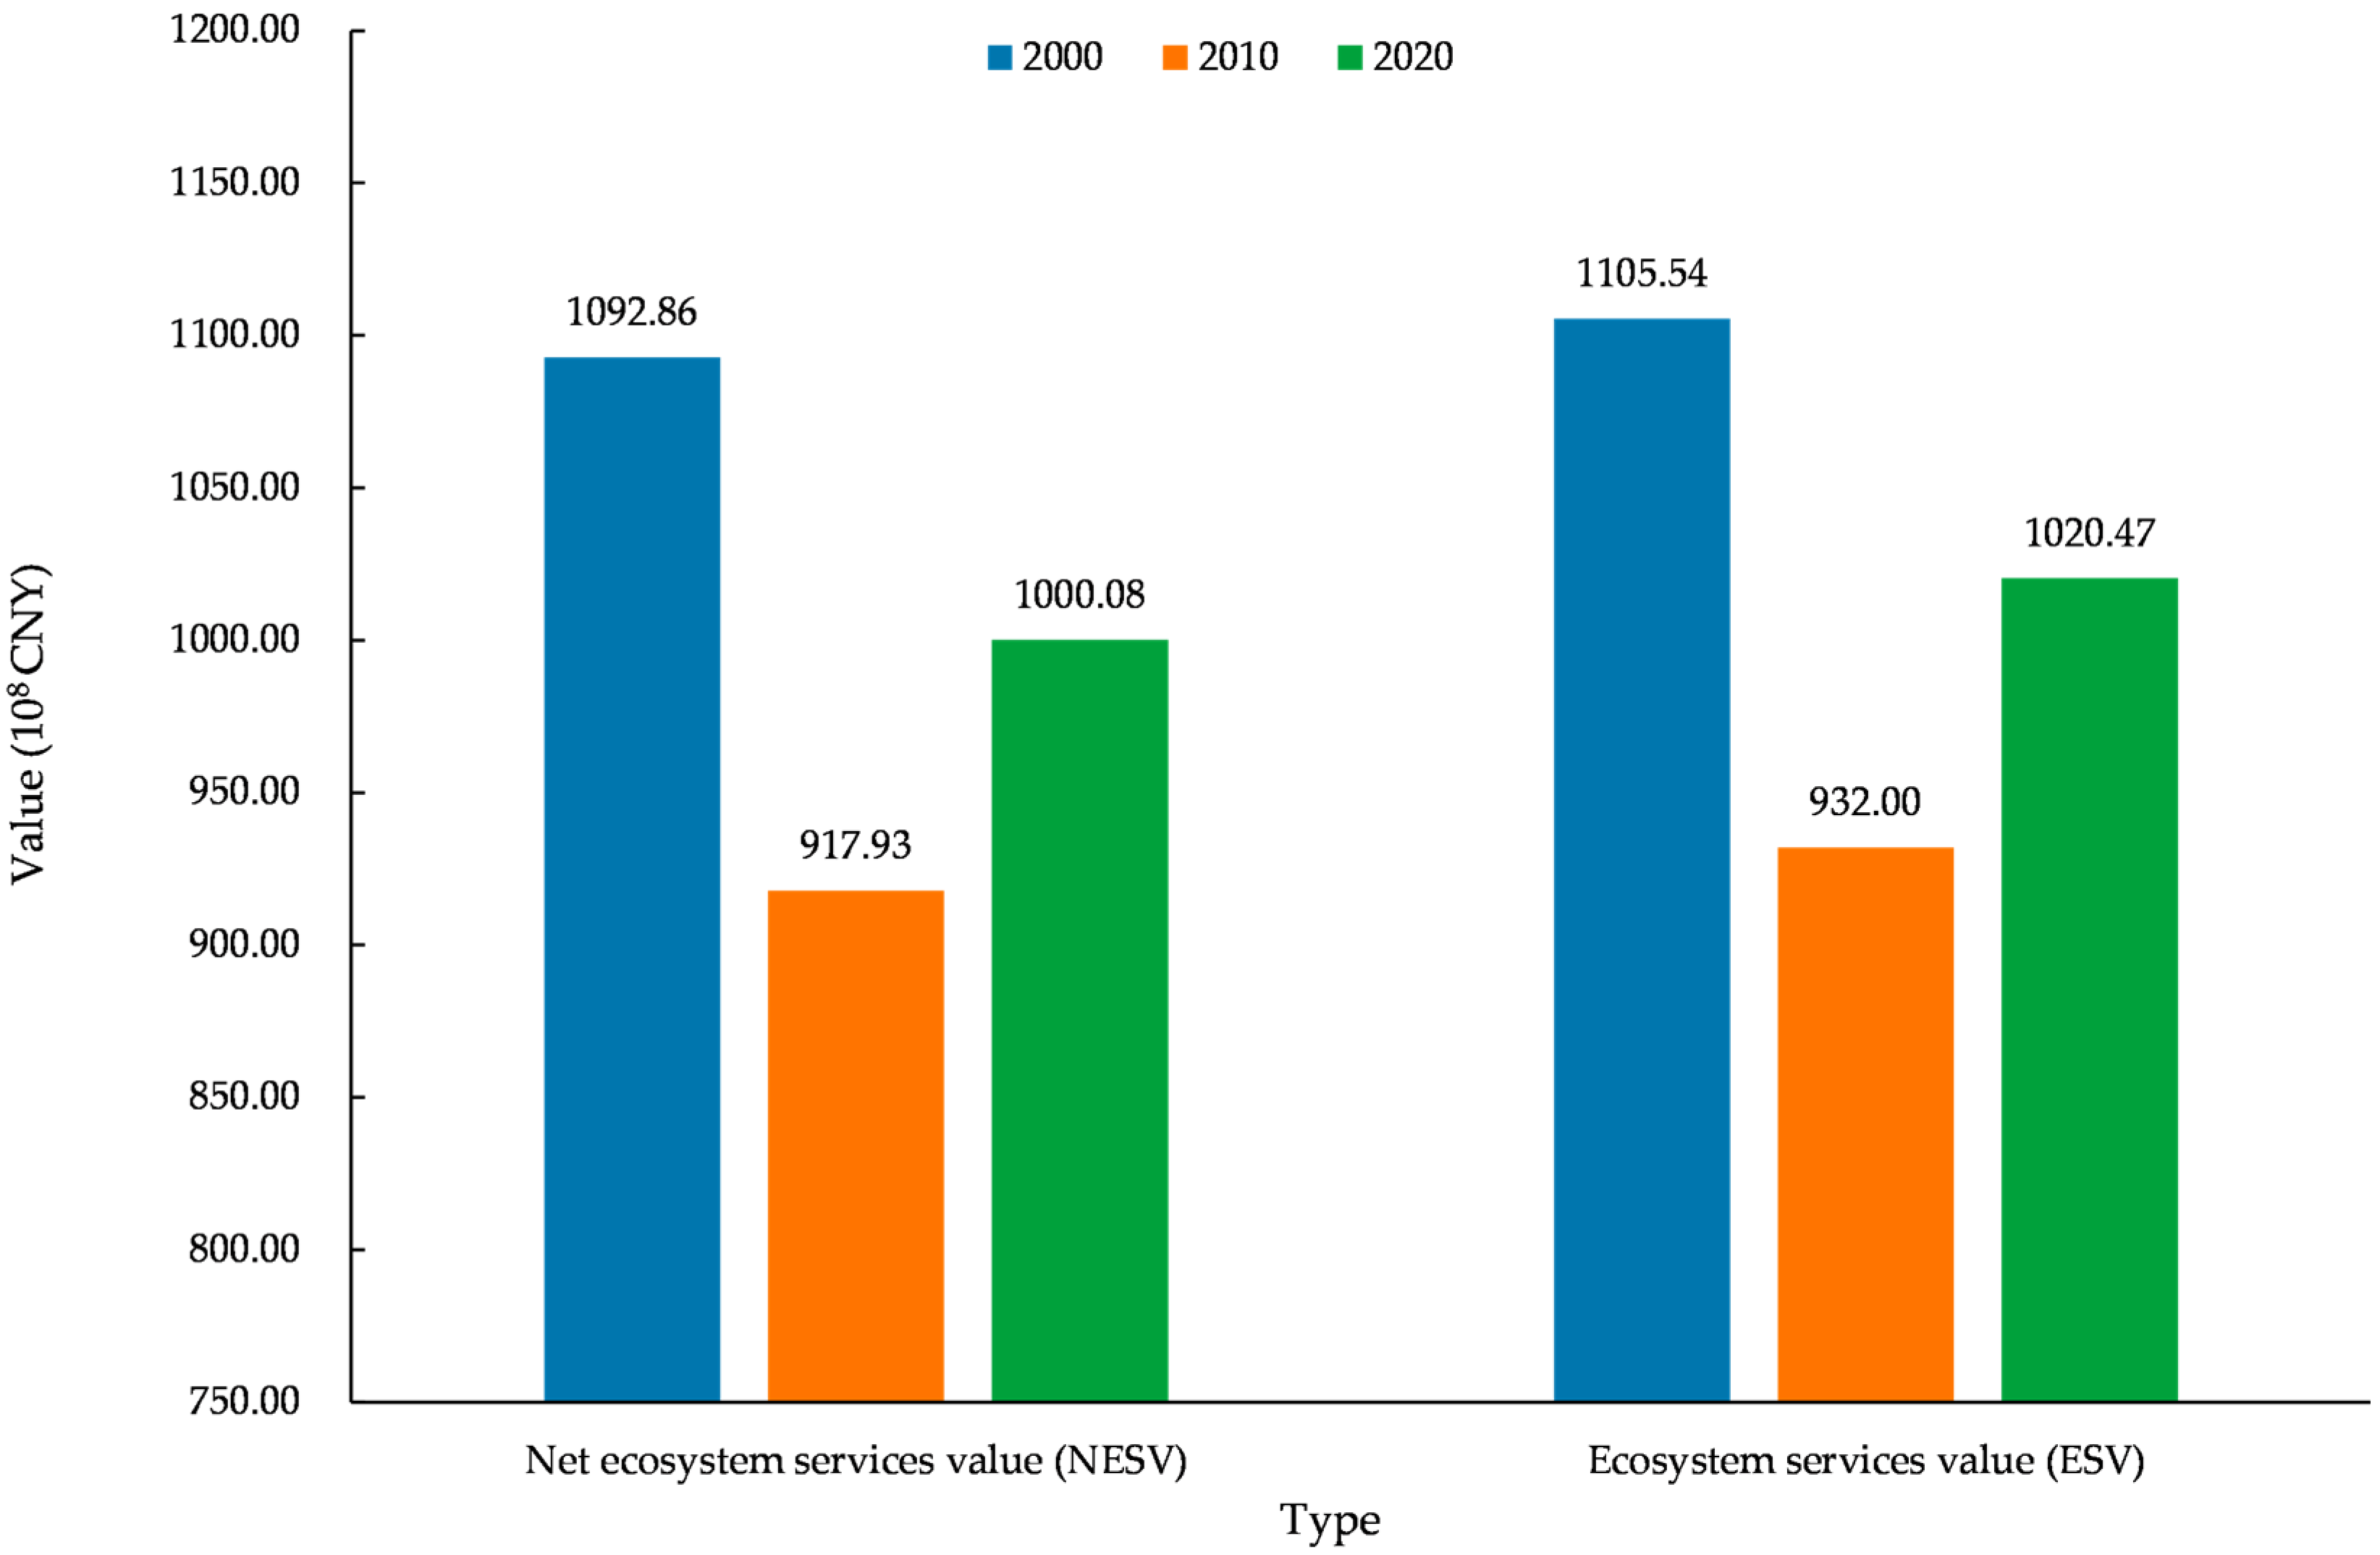
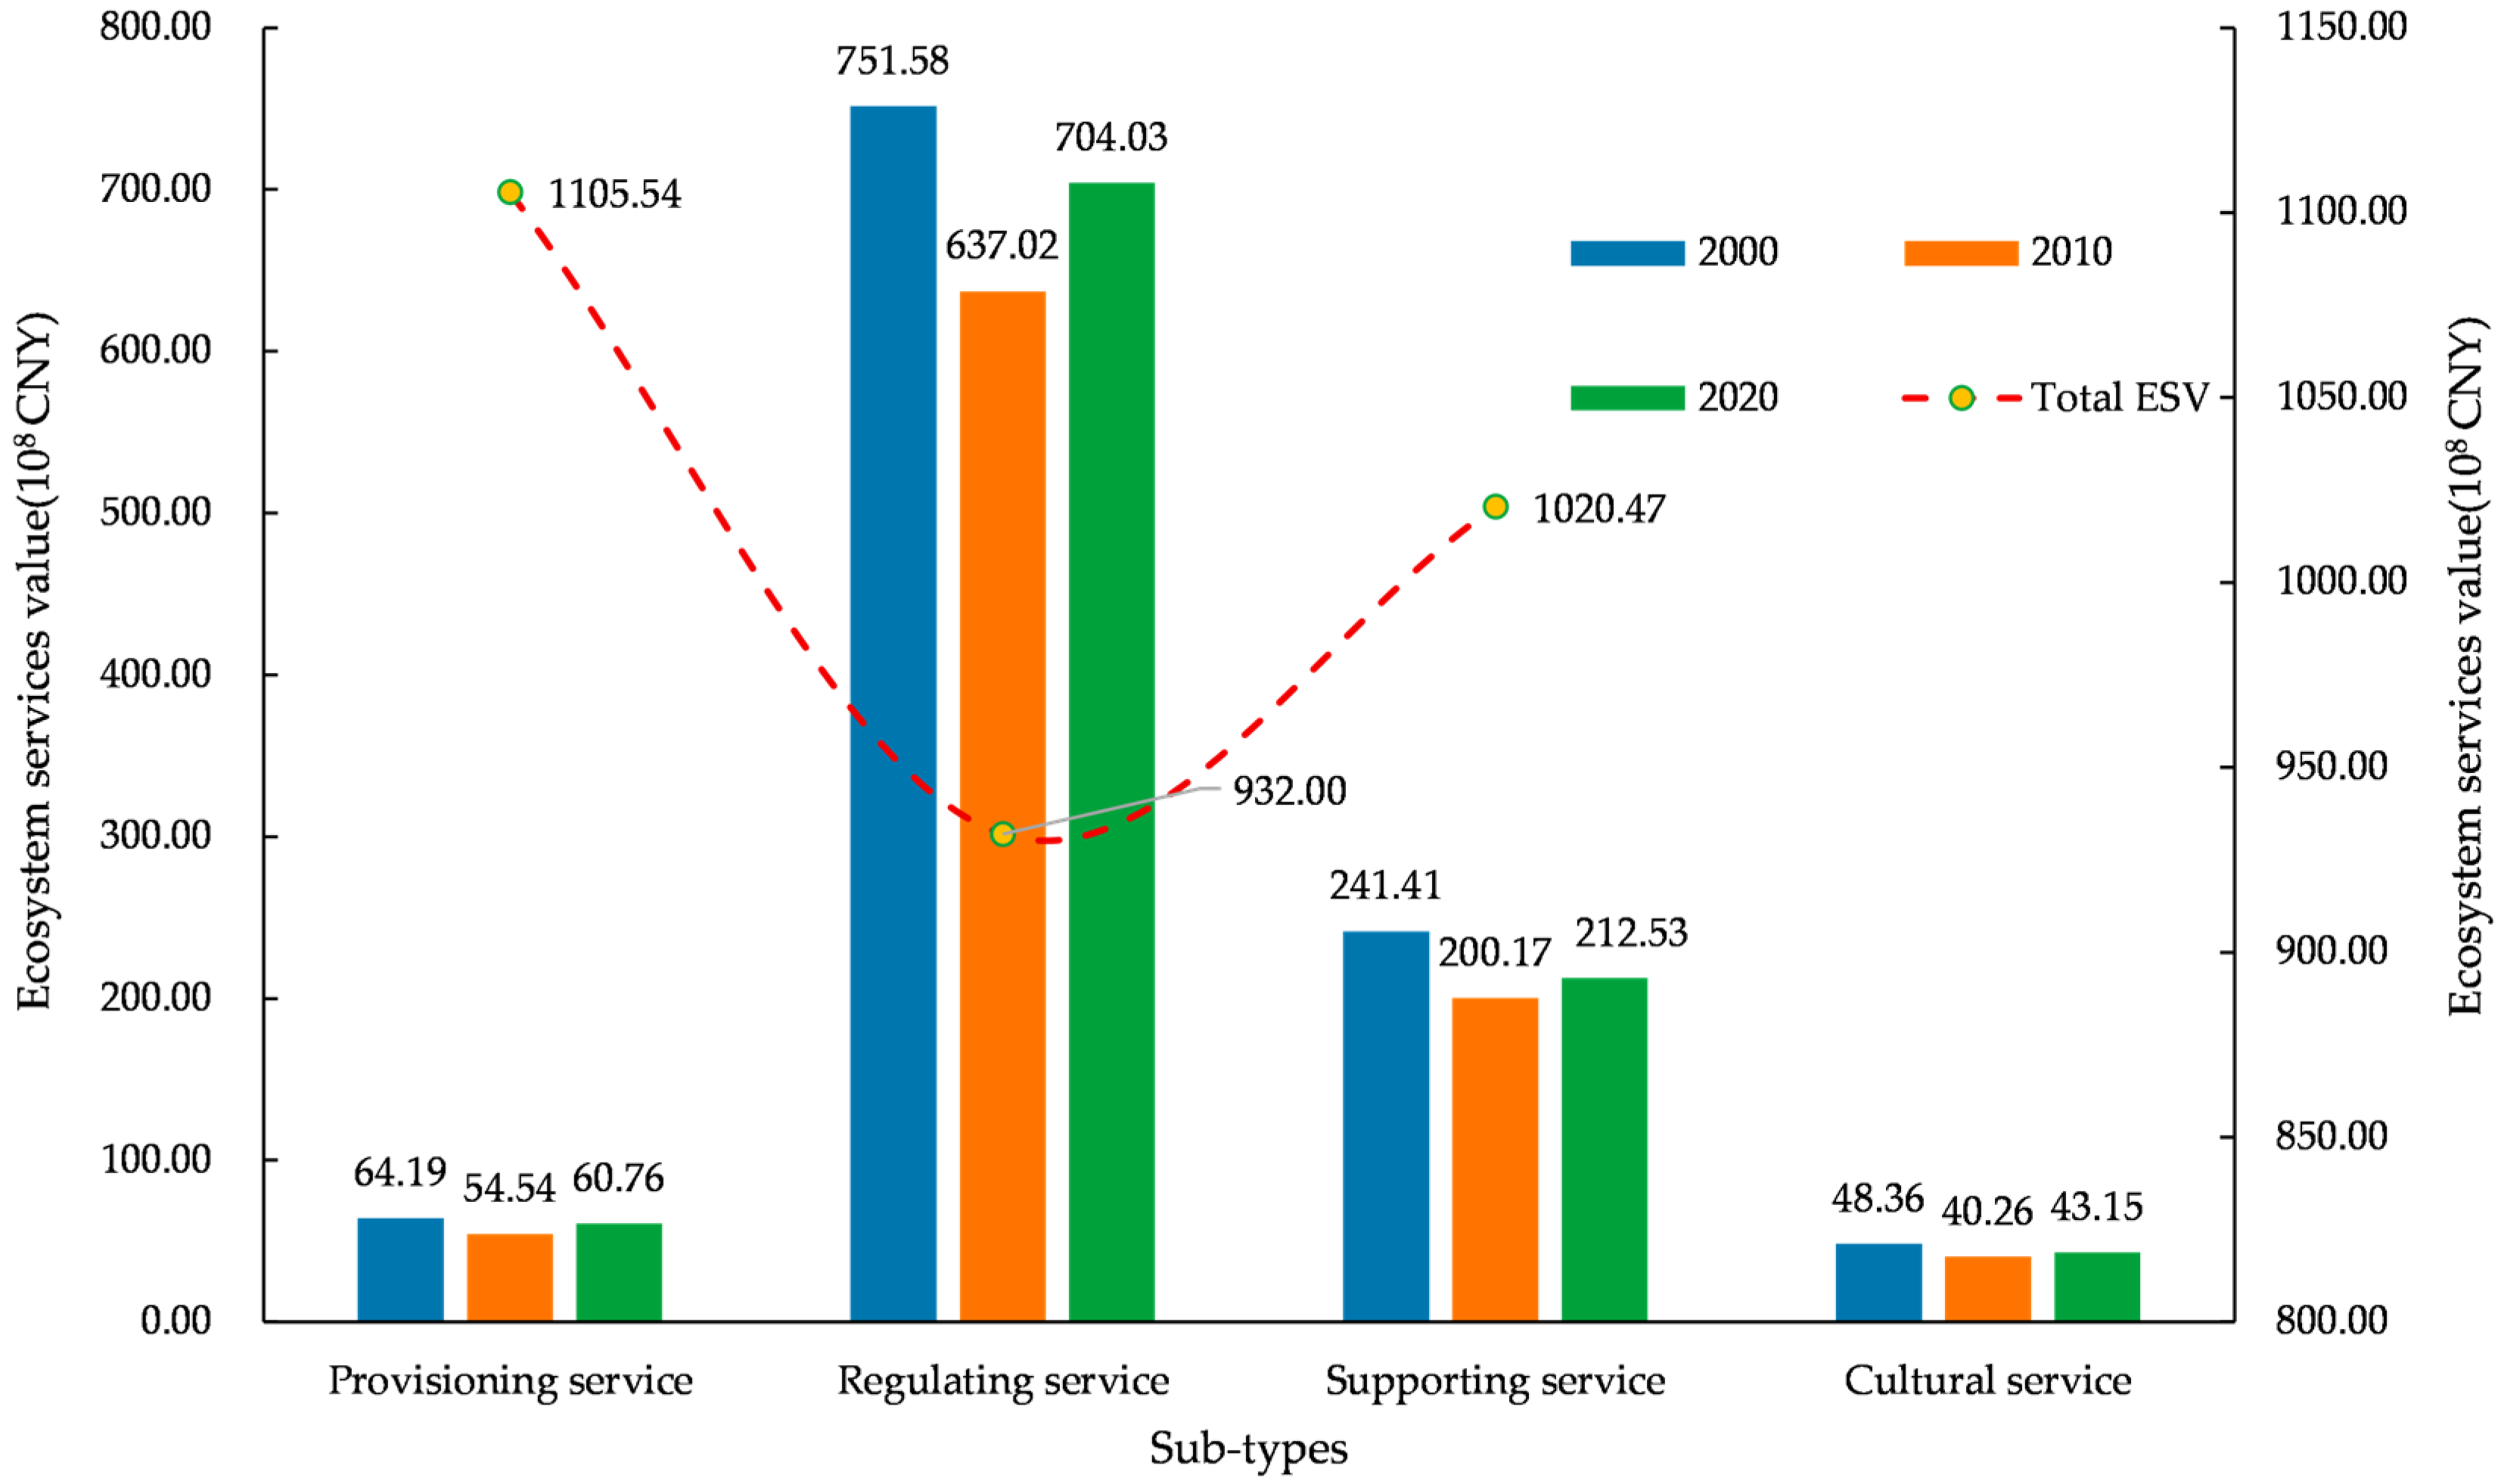
Land-use transitions are the main driver of changes in the distribution pattern and supply of ecosystem services in Ningde City. The results exhibited that the positive ESV in Ningde City during 2000–2020 is CNY 1105.54 × 108, CNY 932.00 × 10⁸, and CNY 1020.47 × 108, respectively, showing an overall downward trend. The negative ESV displayed an opposite trend, rising from CNY 12.68 × 10⁸ in 2000 to CNY 20.39 × 10⁸ in 2020. After subtracting the negative value, the net ESV in Ningde City was CNY 1092.86 × 108, CNY 917.93 × 10⁸, and CNY 1000.08 × 108, respectively. This indicated that the ecological system structure of Ningde City is vulnerable to a certain extent. Meanwhile, the findings suggested that the ESV provided by forest land has generally shown a downward trend in the past 20 years, which may be related to the consecutive monoculture problem of forest land. According to statistics, the area of new afforestation in Ningde City over the past 20 years was more than 160,000 hm2, and the forest structure was mostly Coniferous forest, Cunninghamia lanceolata, and Phyllostachys pubescen, which can easily lead to a consecutive monoculture problem [71], thus resulting in the decline of its ESs. Further analysis demonstrated that along with the social–economic development, urbanization, and industrialization of Ningde City during the past 20 years, non-agricultural construction has occupied a large amount of cultivated land, resulting in the continuous decline of cultivated land area, which makes the per-capita cultivated land area of Ningde City increasingly tight, making it another important factor for the decline of ESs; the percentage of ESV of cultivated land decreased from 2.36% to 1.83%, which was the biggest decline among all land types. Apart from the decrease in cultivated land area, the possible reason for the decline of cultivated land in ESV may also be related to the implementation of “the balanced system of cultivated land occupation and compensation” (hereinafter referred to as the “Compensation System”) by the government. According to the survey, in order to compensate cultivated land occupied for built-up land, e.g., urbanization and industrial uses, the Chinese government introduced this Compensation System. According to the stipulations, the local government must provide the same amount of cultivated land of the same quality (hereinafter referred to as the “same amount and same quality”) as compensation. But the government has not been strictly in accordance with this provision for compensation in the actual implementation process. Thus, the government should strictly implement the principle of the “same amount and same quality” in carrying out the “Compensation System”. In formulating relevant policies, it should also consider the changes in ecosystem services value brought by land-use transformation, and control the transfer of cultivated land to ecosystem services value that decreases synergistically, such as built-up land and unutilized land. Meanwhile, farmers should be guided to establish the concept that “the natural environment and ecological functions are valuable” in order to reduce the negative effects which are generated by the agricultural production to the ecological environment and finally enhance the overall ESV of cultivated land.
Furthermore, from the perspective of the types of ecosystem services in this region, regulating services are the most important function of its ecosystem services, and their value has reached CNY 2092.64 × 108 over the past 20 years, accounting for 68.43% of the total value of ESV. The second is supporting services, which account for 21.39%, but the cultural services value is the lowest, accounting for only 4.31% of the total value. This phenomenon has also been verified in the planning analysis of township area. Consequently, we suggest that the development and utilization of resources in Ningde City attach importance to the constraints of ecological sensitivity and ecological suitability. Simultaneously, farmers’ production activities are guided by the development conviction that lucid waters and lush mountains are invaluable assets, and sticks to the path of green and sustainable development.
The preceding discussion underscores the importance of embracing environmentally friendly and resource-conserving technologies to foster the development of ecological agriculture, thereby facilitating the ecologicalization and ecological industrialization of rural industries. Given Ningde City’s location in a hilly mountainous area characterized by complex geological structures and high fragmentation degrees, human activities strongly impact its ecological environment. In response to this situation, we advocate for meticulous planning prior to the formulation of regional economic development plans. The Ningde municipal government should undertake scientific spatial control planning and functional regionalization for industrial development based on the analysis results of the ecological sensitivity of regional resources and land ecological suitability. Taking agriculture as an illustrative example, the adoption of resource-conserving and environment-friendly technologies is essential to cultivate modern characteristic ecological agriculture characterized by the principles of “low-input, asset-light, famous-special, and high-quality species, with short-adaptable-fast” attributes. This approach aims to mitigate negative impacts such as agricultural carbon emissions, pesticide pollution, and plastic film pollution. Furthermore, it represents a pivotal avenue for promoting the transformation and upgrading of traditional agriculture, thereby facilitating regional ecological industrialization and industrial ecology. Ultimately, this strategy ensures the essential path choice and development direction of agricultural sustainable development.
In summary, this study delves into the land-use transitions and their ecological effects in Ningde City, China, providing valuable insights for the formulation of relevant land resource management and eco-environmental protection policies. Additionally, it contributes significantly to the advancement of ecosystem management theory and addresses the gap in regional assessment of the ecosystem services value (ESV). However, discrepancies exist among different assessment methods in estimating ESV. Despite our efforts to enhance the “benefit-transfer method,” there is a need to focus on improving the accuracy of the value coefficients of ecosystem services. By conducting field testing and extensive multi-sample research visits, we aim to refine the accuracy of the value coefficients for each land-use type, thereby enhancing the precision of the evaluation results. This represents the primary direction of our future research endeavors.

Author Contributions

Conceptualization, K.S.; methodology, Q.P. and K.S; software, Q.P., L.S. and K.S.; validation, Q.P., W.L. and S.F.; formal analysis, Q.P. and K.S.; investigation, Q.P., L.S. and K.S.; data curation, Q.P. and L.S.; writing—original draft preparation, Q.P.; writing—review and editing, K.S., S.F. and W.L.; visualization, Q.P. and K.S.; supervision, W.L. and S.F.; funding acquisition, S.F., W.L. and K.S. All authors have read and agreed to the published version of the manuscript.

Funding

This research was funded by the Humanity and Social Science Foundation of Ministry of Education of China (Grant No. 23YJCZH192), Natural Science Foundation of Fujian Province (Grant No. 2021J01650), Major Project Funding for Social Science Research Base in Fujian Province Social Science Planning: Ecological Civilization Research Center (Grant No. FJ2022JDZ035), Fujian Agriculture and Forestry University Tea Industry Chain Science and Technology Innovation Team Project: Tea Industry Economy and Creativity Research (Grant No. K1520012A08), Science and Education Special Project of Fujian Province: Science and Technology Integration and Mechanism of “Small Industrial Courtyard” for Special Modern Agriculture (Grant No. K8120K01a), and National Scientific Research Project Cultivation Plan of Anxi College of Tea Science of Fujian Agricultural and Forestry University (Grant No. ACKY2023011).

Institutional Review Board Statement

Not applicable.

Informed Consent Statement

Not applicable.

Data Availability Statement

The data that support the findings of this study are available from the authors upon reasonable request.

Acknowledgments

The authors also thank “Fujian Provincial Key Laboratory of Agroecological Processing and Safety Monitoring” and “Fujian-Taiwan Joint Innovative Centre for Germplasm Resources and Cultivation of Crops (Grant No. 2015-75)” for their support.

Conflicts of Interest

The authors declare no conflicts of interest.

References

  1. Costanza, R.; de Groot, R.; Braat, L.; Kubiszewski, I.; Fioramonti, L.; Sutton, P.; Farber, S.; Grasso, M. Twenty Years of Ecosystem Services: How Far Have We Come and How Far Do We Still Need to Go? Ecosyst. Serv. 2017, 28, 1–16. [Google Scholar] [CrossRef]
  2. Costanza, R.; D’Arge, R.; De Groot, R.; Farber, S.; Grasso, M.; Hannon, B.; Limburg, K.; Naeem, S.; O’Neill, R.V.; Paruelo, J.; et al. The Value of the World’s Ecosystem Services and Natural Capital. Nature 1997, 387, 253–260. [Google Scholar] [CrossRef]
  3. de Groot, R.; Brander, L.; van der Ploeg, S.; Costanza, R.; Bernard, F.; Braat, L.; Christie, M.; Crossman, N.; Ghermandi, A.; Hein, L.; et al. Global Estimates of the Value of Ecosystems and Their Services in Monetary Units. Ecosyst. Serv. 2012, 1, 50–61. [Google Scholar] [CrossRef]
  4. Daily, G.C.; Matson, P.A. Ecosystem Services: From Theory to Implementation. Proc. Natl. Acad. Sci. USA 2008, 105, 9455–9456. [Google Scholar] [CrossRef]
  5. Rozas-Vásquez, D.; Fürst, C.; Geneletti, D. Integrating Ecosystem Services in Spatial Planning and Strategic Environmental Assessment: The Role of the Cascade Model. Environ. Impact Assess. Rev. 2019, 78, 106291. [Google Scholar] [CrossRef]
  6. Huang, C.; Zhao, D.; Liu, C.; Liao, Q. Integrating Territorial Pattern and Socioeconomic Development into Ecosystem Service Value Assessment. Environ. Impact Assess. Rev. 2023, 100, 107088. [Google Scholar] [CrossRef]
  7. Zhang, X.; Zheng, Z.; Sun, S.; Wen, Y.; Chen, H. Study on the Driving Factors of Ecosystem Service Value under the Dual Influence of Natural Environment and Human Activities. J. Clean. Prod. 2023, 420, 138408. [Google Scholar] [CrossRef]
  8. Fu, B.J.; Wang, S.; Su, C.H.; Forsius, M. Linking Ecosystem Processes and Ecosystem Services. Curr. Opin. Environ. Sustain. 2013, 5, 4–10. [Google Scholar] [CrossRef]
  9. Su, K.; Wei, D.; Lin, W. Evaluation of Ecosystem Services Value and Its Implications for Policy Making in China—A Case Study of Fujian Province. Ecol. Indic. 2020, 108, 105752. [Google Scholar] [CrossRef]
  10. Li, S.; Bing, Z.; Jin, G. Spatially Explicit Mapping of Soil Conservation Service in Monetary Units due to Land Use/Cover Change for the Three Gorges Reservoir Area, China. Remote Sens. 2019, 11, 468. [Google Scholar] [CrossRef]
  11. Zhu, Z.; Fu, W.; Liu, Q. Correlation between Urbanization and Ecosystem Services in Xiamen, China. Environ. Dev. Sustain. 2020, 23, 101–121. [Google Scholar] [CrossRef]
  12. Wang, X.C.; Dong, X.B.; Liu, H.M.; Wei, H.J.; Fan, W.G.; Lu, N.C.; Xu, Z.H.; Ren, J.H.; Xing, K.X. Linking Land Use Change, Ecosystem Services and Human Well-Being: A Case Study of the Manas River Basin of Xinjiang, China. Ecosyst. Serv. 2017, 27, 113–123. [Google Scholar] [CrossRef]
  13. Xue, L.Q.; Zhu, B.L.; Wu, Y.P.; Wei, G.H.; Liao, S.M.; Yang, C.B.; Wang, J.; Zhang, H.; Ren, L.; Han, Q. Dynamic Projection of Ecological Risk in the Manas River Basin Based on Terrain Gradients. Sci. Total Environ. 2019, 653, 283–293. [Google Scholar] [CrossRef] [PubMed]
  14. Hong, X.; Peng, Q.; Zheng, R.; Lin, W.; Fan, S.; Su, K. Evaluating the Spatial Evolution of the Eco-Economy Harmony in Anxi County, China, Based on Ecosystem Services Value. Sustainability 2024, 16, 1491. [Google Scholar] [CrossRef]
  15. Lawler, J.J.; Lewis, D.J.; Nelson, E.; Plantinga, A.J.; Polasky, S.; Withey, J.C.; Helmers, D.P.; Martinuzzi, S.; Pennington, D.; Radeloff, V.C. Projected Land-Use Change Impacts on Ecosystem Services in the United States. Proc. Natl. Acad. Sci. USA 2014, 111, 7492–7497. [Google Scholar] [CrossRef] [PubMed]
  16. Schirpke, U.; Tasser, E.; Borsky, S.; Braun, M.; Eitzinger, J.; Gaube, V.; Getzner, M.; Glatzel, S.; Gschwantner, T.; Kirchner, M.; et al. Past and Future Impacts of Land-Use Changes on Ecosystem Services in Austria. J. Environ. Manag. 2023, 345, 118728. [Google Scholar] [CrossRef] [PubMed]
  17. Kang, J.; Li, C.; Zhang, B.; Zhang, J.; Li, M.; Hu, Y. How Do Natural and Human Factors Influence Ecosystem Services Changing? A Case Study in Two Most Developed Regions of China. Ecol. Indic. 2023, 146, 109891. [Google Scholar] [CrossRef]
  18. Hasan, S.S.; Zhen, L.; Miah, M.; Ahamed, T.; Samie, A. Impact of Land Use Change on Ecosystem Services: A Review. Environ. Dev. 2020, 34, 100527. [Google Scholar] [CrossRef]
  19. Underwood, E.C.; Hollander, A.D.; Safford, H.D.; Kim, J.B.; Srivastava, L.; Drapek, R.J. The Impacts of Climate Change on Ecosystem Services in Southern California. Ecosyst. Serv. 2019, 39, 101008. [Google Scholar] [CrossRef]
  20. Hayes, T.; Murtinho, F.; Wolff, H.; López-Sandoval, M.F.; Salazar, J. Effectiveness of Payment for Ecosystem Services after Loss and Uncertainty of Compensation. Nat. Sustain. 2022, 5, 81–88. [Google Scholar] [CrossRef]
  21. Srivathsa, A.; Vasudev, D.; Nair, T.; Chakrabarti, S.; Chanchani, P.; DeFries, R.; Deomurari, A.; Dutta, S.; Ghose, D.; Goswami, V.R.; et al. Prioritizing India’s Landscapes for Biodiversity, Ecosystem Services and Human Well-Being. Nat. Sustain. 2023, 6, 568–577. [Google Scholar] [CrossRef]
  22. Sun, L.; Yu, H.; Sun, M.; Wang, Y. Coupled Impacts of Climate and Land Use Changes on Regional Ecosystem Services. J. Environ. Manag. 2023, 326, 116753. [Google Scholar] [CrossRef] [PubMed]
  23. Yost, A.; An, L.; Bilsborrow, R.; Shi, L.; Chen, X.; Yang, S.; Zhang, W. Mechanisms behind Concurrent Payments for Ecosystem Services in a Chinese Nature Reserve. Ecol. Econ. 2020, 169, 106509. [Google Scholar] [CrossRef]
  24. Sonter, L.J.; Simmonds, J.S.; Watson, J.E.M.; Jones, J.P.G.; Kiesecker, J.M.; Costa, H.M.; Bennun, L.; Edwards, S.; Grantham, H.S.; Griffiths, V.F.; et al. Local Conditions and Policy Design Determine Whether Ecological Compensation Can Achieve No Net Loss Goals. Nat. Commun. 2020, 11, 2072. [Google Scholar] [CrossRef] [PubMed]
  25. Wang, Y.H.; Dai, E.F. Spatial-Temporal Changes in Ecosystem Services and the Trade-off Relationship in Mountain Regions: A Case Study of Hengduan Mountain Region in Southwest China. J. Clean. Prod. 2020, 264, 121530. [Google Scholar] [CrossRef]
  26. Ligate, E.J.; Chen, C.; Wu, C. Evaluation of Tropical Coastal Land Cover and Land Use Changes and Their Impacts on Ecosystem Service Values. Ecosyst. Health Sustain. 2018, 4, 188–204. [Google Scholar] [CrossRef]
  27. Peng, J.; Yang, Y.; Liu, Y.X.; Hu, Y.N.; Du, Y.Y.; Meersmans, J.; Qiu, S.J. Linking Ecosystem Services and Circuit Theory to Identify Ecological Security Patterns. Sci. Total Environ. 2018, 644, 781–790. [Google Scholar] [CrossRef] [PubMed]
  28. Meng, Y.; Liu, J.G.; Wang, J.; Mao, G.Q.; Wang, K.; Wang, Z.F.; Wang, M. Ecosystem Services for Ecological Civilization: Review of 9th Ecosystem Services Partnership World Conference. Acta Ecol. Sin. 2018, 38, 4088–4095. [Google Scholar]
  29. Narducci, J.; Quintas-Soriano, C.; Castro, A.; Som-Castellano, R.; Brandt, J.S. Implications of Urban Growth and Farmland Loss for Ecosystem Services in the Western United States. Land Use Policy 2019, 86, 1–11. [Google Scholar] [CrossRef]
  30. Zheng, W.; Ke, X.; Xiao, B.; Zhou, T. Optimising Land Use Allocation to Balance Ecosystem Services and Economic Benefits—A Case Study in Wuhan, China. J. Environ. Manag. 2019, 248, 109306. [Google Scholar] [CrossRef]
  31. Schirpke, U.; Tscholl, S.; Tasser, E. Spatio-Temporal Changes in Ecosystem Service Values: Effects of Land-Use Changes from Past to Future (1860–2100). J. Environ. Manag. 2020, 272, 111068. [Google Scholar] [CrossRef]
  32. Jiang, W.; Lü, Y.; Liu, Y.; Gao, W. Ecosystem Service Value of the Qinghai-Tibet Plateau Significantly Increased during 25 Years. Ecosyst. Serv. 2020, 44, 101146. [Google Scholar] [CrossRef]
  33. Ouyang, Z.Y.; Wang, X.K.; Miao, H. A Primary Study on Chinese Terrestrial Ecosystem Services and Their Ecological-Economic Values. Acta Ecol. Sin. 1999, 19, 607–613. [Google Scholar]
  34. Xie, G.D.; Lu, C.X.; Leng, Y.F.; Zheng, D.; Li, S.C. Ecological Assets Valuation of the Tibetan Plateau. J. Nat. Resour. 2003, 18, 189–196. [Google Scholar]
  35. Xie, G.D.; Zhang, C.X.; Zhang, C.S.; Xiao, Y.; Lu, C.X. The Value of Ecosystem Services in China. Resour. Sci. 2015, 37, 1740–1746. [Google Scholar]
  36. Woldeyohannes, A.; Cotter, M.; Biru, W.D.; Kelboro, G. Assessing Changes in Ecosystem Service Values over 1985–2050 in Response to Land Use and Land Cover Dynamics in Abaya-Chamo Basin, Southern Ethiopia. Land 2020, 9, 37. [Google Scholar] [CrossRef]
  37. Bai, Y.; Ochuodho, T.O.; Yang, J. Impact of Land Use and Climate Change on Water-Related Ecosystem Services in Kentucky, USA. Ecol. Indic. 2019, 102, 51–64. [Google Scholar] [CrossRef]
  38. Deng, G.; Jiang, H.; Zhu, S.; Wen, Y.; He, C.; Wang, X.; Sheng, L.; Guo, Y.; Cao, Y. Projecting the Response of Ecological Risk to Land Use/Land Cover Change in Ecologically Fragile Regions. Sci. Total Environ. 2024, 914, 169908. [Google Scholar] [CrossRef]
  39. James, R.K.; Keyzer, L.M.; van de Velde, S.J.; Herman, P.M.J.; van Katwijk, M.M.; Bouma, T.J. Climate Change Mitigation by Coral Reefs and Seagrass Beds at Risk: How Global Change Compromises Coastal Ecosystem Services. Sci. Total Environ. 2023, 857, 159576. [Google Scholar] [CrossRef]
  40. Li, W.; Geng, J.; Bao, J.; Lin, W.; Wu, Z.; Fan, S. Spatial and Temporal Evolution Patterns of Habitat Quality under Tea Plantation Expansion and Multi-Scenario Simulation Study: Anxi County as an Example. Land 2023, 12, 1308. [Google Scholar] [CrossRef]
  41. Scheiter, S.; Schulte, J.; Pfeiffer, M.; Martens, C.; Erasmus, B.F.N.; Twine, W.C. How Does Climate Change Influence the Economic Value of Ecosystem Services in Savanna Rangelands? Ecol. Econ. 2019, 157, 342–356. [Google Scholar] [CrossRef]
  42. Chen, S.; Yue, T.; Li, H. Studies on Geo-Informatic Tupu and its application. Geogr. Res. 2000, 19, 337–343. [Google Scholar]
  43. Cheng, W.; Song, K.; Zhou, C.; Tang, G. Commentaries and Prospect on the Geomorphic Information Spectrum. Adv. Earth Sci. 2022, 37, 661–679. [Google Scholar]
  44. Chen, W.; Zhao, H.; Li, J.; Zhu, L.; Wang, Z.; Zeng, J. Land Use Transitions and the Associated Impacts on Ecosystem Services in the Middle Reaches of the Yangtze River Economic Belt in China Based on the Geo-Informatic Tupu Method. Sci. Total Environ. 2020, 701, 134690. [Google Scholar] [CrossRef] [PubMed]
  45. Ye, Q.L.; Tian, G.L.; Liu, G.H.R.; Ye, J.M.; Yao, X.; Liu, Q.S.; Lou, W.G.; Wu, S.G. Tupu Methods of Spatial-Temporal Pattern on Land Use Change. J. Geogr. Sci. 2004, 14, 131–142. [Google Scholar] [CrossRef]
  46. Shapiro, J.; Báldi, A. Accurate Accounting: How to Balance Ecosystem Services and Disservices. Ecosyst. Serv. 2014, 7, 201–202. [Google Scholar] [CrossRef]
  47. von Döhren, P.; Haase, D. Ecosystem Disservices Research: A Review of the State of the Art with a Focus on Cities. Ecol. Indic. 2015, 52, 490–497. [Google Scholar] [CrossRef]
  48. Drillet, Z.; Fung, T.K.; Leong, R.A.T.; Sachidhanandam, U.; Edwards, P.; Richards, D. Urban Vegetation Types Are Not Perceived Equally in Providing Ecosystem Services and Disservices. Sustainability 2020, 12, 2076. [Google Scholar] [CrossRef]
  49. Su, K.; Wei, D.Z.; Lin, W.X. Influencing Factors and Spatial Patterns of Energy-Related Carbon Emissions at the City-Scale in Fujian Province, Southeastern China. J. Clean. Prod. 2020, 244, 118840. [Google Scholar] [CrossRef]
  50. Dronova, I. Environmental Heterogeneity as a Bridge between Ecosystem Service and Visual Quality Objectives in Management, Planning and Design. Landsc. Urban Plan. 2017, 163, 90–106. [Google Scholar] [CrossRef]
  51. Vannier, C.; Lasseur, R.; Crouzat, E.; Byczek, C.; Lafond, V.; Cordonnier, T.; Longaretti, P.Y.; Lavorel, S. Mapping Ecosystem Services Bundles in a Heterogeneous Mountain Region. Ecosyst. People 2019, 15, 74–88. [Google Scholar] [CrossRef]
  52. Tarolli, P.; Straffelini, E. Agriculture in Hilly and Mountainous Landscapes: Threats, Monitoring and Sustainable Management. Geogr. Sustain. 2020, 1, 70–76. [Google Scholar] [CrossRef]
  53. Zhu, L.; Song, R.; Sun, S.; Li, Y.; Hu, K. Land Use/Land Cover Change and Its Impact on Ecosystem Carbon Storage in Coastal Areas of China from 1980 to 2050. Ecol. Indic. 2022, 142, 109178. [Google Scholar] [CrossRef]
  54. Abijith, D.; Saravanan, S. Assessment of Land Use and Land Cover Change Detection and Prediction Using Remote Sensing and CA Markov in the Northern Coastal Districts of Tamil Nadu, India. Environ. Sci. Pollut. Res. 2022, 29, 86055–86067. [Google Scholar] [CrossRef] [PubMed]
  55. Xin, X.; Zhang, T.; He, F.; Zhang, W.; Chen, K. Assessing and Simulating Changes in Ecosystem Service Value Based on Land Use/Cover Change in Coastal Cities: A Case Study of Shanghai, China. Ocean Coast. Manag. 2023, 239, 106591. [Google Scholar] [CrossRef]
  56. Zhan, J.W. Study on the Coordination between Urbanization and Preservation of the Cultivated Land under the Perspective of Eco-Civilization: A Case Study in Ningde City, Fujian Province. China J. Agric. Resour. Reg. Plan. 2014, 35, 13–19. [Google Scholar]
  57. Niu, Z.H.; Zhang, Y.X.; Fang, Y. Research on Regionalization and Management Model of Soil and Water Conservation in Ningde Municipality of Fujian Province. Subtrop. Soil Water Conserv. 2017, 29, 8–10+32. [Google Scholar]
  58. Jiang, L.; Wang, Z.; Zuo, Q.; Du, H. Simulating the Impact of Land Use Change on Ecosystem Services in Agricultural Production Areas with Multiple Scenarios Considering Ecosystem Service Richness. J. Clean. Prod. 2023, 397, 136485. [Google Scholar] [CrossRef]
  59. do Boer, D.; Roldao, R.; Slater, H.; Qian, G.Q. 2019 China Carbon Pricing Survey; China Carbon Forum: Beijing, China, 2019. [Google Scholar]
  60. Sun, H.; Liang, H.M.; Chang, X.L.; Cui, Q.C.; Tao, Y. Land Use Patterns on Carbon Emission and Spatial Association in China. Econ. Geogr. 2015, 35, 154–162. [Google Scholar] [CrossRef]
  61. Fang, J.Y.; Guo, Z.D.; Piao, S.L.; Chen, A.P. Estimation of Terrestrial Vegetation Carbon Sequestration in China from 1981 to 2000. Sci. China Ser. D-Earth Sci. 2007, 37, 804–812. [Google Scholar]
  62. Cai, Z.C.; Kang, G.-D.; Tsuruta, H.; Mosier, A. Estimate of CH4 Emissions from Year-Round Flooded Rice Fields during Rice Growing Season in China. Pedosphere 2005, 15, 66–71. [Google Scholar]
  63. Alexander, L.; Allen, S.; Bindoff, N.; Breon, F.-M.; Church, J.; Cubasch, U.; Emori, S.; Forster, P.; Friedlingstein, P.; Gillett, N.; et al. Climate Change 2013: The Physical Science Basis; Contribution of Working Group I (WGI) to the Fifth Assessment Report (AR5) of the Intergovernmental Panel on Climate Change (IPCC); Intergovernmental Panel on Climate Change: Geneva, Switzerland, 2013. [Google Scholar]
  64. Sun, X.Z.; Zhou, H.L.; Xie, G. Di Ecological Services and Their Values of Chinese Agroecosystem. China Popul. Resour. Environ. 2007, 17, 55–60. [Google Scholar]
  65. Xia, X.X.; Zhu, L.; Yang, A.M.; Jin, H.; Zhang, Q.Q. Evaluate the Positive and Negative Value of Ecosystem Services Based on MODS: Basin in Xinjiang. Acta Ecol. Sin. 2020, 40, 1–14. [Google Scholar]
  66. Liu, P.J.; Ma, Y.Q.; Guo, Y.Z. Current Situation of Pesticide Residues in China’s Agricultural Products and Its Impact on Export Trade. J. Agric. Sci. Technol. 2017, 19, 8–14. [Google Scholar]
  67. Ministry of Agriculture and Rural Affairs of the People’s Republic of China. Use Efficiency of Fertilizers and Pesticides Saw Steady Improvement. Available online: http://www.moa.gov.cn/xw/zwdt/201912/t20191218_6333443.htm (accessed on 18 November 2023).
  68. Domagalski, J.; Lin, C.; Luo, Y.; Kang, J.; Wang, S.M.; Brown, L.R.; Munn, M.D. Eutrophication Study at the Panjiakou-Daheiting Reservoir System, Northern Hebei Province, People’s Republic of China: Chlorophyll-a Model and Sources of Phosphorus and Nitrogen. Agric. Water Manag. 2007, 94, 43–53. [Google Scholar] [CrossRef]
  69. Aguilera, E.; Lassaletta, L.; Gattinger, A.; Gimeno, B.S. Managing Soil Carbon for Climate Change Mitigation and Adaptation in Mediterranean Cropping Systems: A Meta-Analysis. Agric. Ecosyst. Environ. 2013, 168, 25–36. [Google Scholar] [CrossRef]
  70. Gao, H.H.; Yan, C.R.; Liu, Q.; Ding, W.L.; Chen, B.Q.; Li, Z. Effects of Plastic Mulching and Plastic Residue on Agricultural Production: A Meta-Analysis. Sci. Total Environ. 2019, 651, 484–492. [Google Scholar] [CrossRef]
  71. Wu, Z.; Li, J.; Zheng, J.; Liu, J.; Liu, S.; Lin, W.; Wu, C. Soil Microbial Community Structure and Catabolic Activity Are Significantly Degenerated in Successive Rotations of Chinese Fir Plantations. Sci. Rep. 2017, 7, 6691. [Google Scholar] [CrossRef]
Figure 1. Geographical location of Ningde City in Fujian Province, China.
Applsci 14 03643 g001
Figure 2. Statistics of land-use transitions (LUTs) in Ningde City from 2000 to 2020.
Applsci 14 03643 g002
Figure 3. Land-use patterns in Ningde City from 2000–2020.
Applsci 14 03643 g003
Figure 4. Tupu patterns of LUTs in Ningde City during 2000–2020.
Applsci 14 03643 g004
Figure 5. Land-use rising Tupu in Ningde City from 2000 to 2020.
Applsci 14 03643 g005
Figure 6. Land-use falling Tupu in Ningde City from 2000 to 2020.
Applsci 14 03643 g006
Figure 7. ESV in Ningde City from 2000 to 2020 (by service type).
Applsci 14 03643 g007
Figure 8. Ecosystem dis-services value in Ningde City from 2000 to 2020.
Applsci 14 03643 g008
Figure 9. Net value of ecosystem services in Ningde City from 2000 to 2020.
Applsci 14 03643 g009
Table 1. Ecosystem services equivalent value per unit area of Ningde City (Unit: CNY/hm2·a).
TypeSub-TypeCLFLOLGLWBUL
Provisioning services, PSFood production, FP3475.16794.102134.63733.821257.9815.72
Material production, MP770.511824.071297.291079.76361.6747.17
Water supply, WS−4104.15943.48−1580.33597.5416,432.3131.45
Regulating services, RSGas regulation, GS2799.005998.974398.983794.891493.85204.42
Climate regulation, CR1462.4017,949.749706.0710,032.364450.09157.25
Purify environment, PE424.575259.912842.243312.678978.80644.71
Hydrologic adjustment, HD4701.6911,746.358224.027348.68171,981.04377.39
Supporting services, SSSoil conservation, SC1635.377304.124469.754623.061462.40235.87
Maintaining nutrient cycle, MNC487.47558.23522.85356.43110.0715.72
Bio-diversity, BD534.646651.553593.094203.744025.52220.15
Supporting services, SSAesthetic landscape, AL235.872916.931576.401855.513113.4994.35
Note: Built-up land is land used for human activities such as housing, industry, commerce, and transportation and is one of the most significant forms of anthropogenic interference with ecosystems. Compared with other land types, the provision of ecosystem services by built-up land is usually low. Therefore, referring to the existing literature [9,14,58], the ecosystem services value provided by built-up land is set to zero in this study.
Table 2. Carbon emission coefficient of different land-use types.
TypeCLFLOLGLWBUL
Carbon emission coefficient (t·hm−2·a−1)0.3190−0.6036−0.2100−0.2887−0.2380−0.0005
Notes: The coefficients in the table refer to the research results of [60,61,62].
Table 3. Carbon emissions coefficients of energy consumption.
CategoryUnitsStandard Coal Coefficient (tce/t)Carbon Emission Coefficient (tce/t)
Raw coalt0.71430.7559
Coket0.97140.855
Gasolinet1.47140.5538
Kerosenet1.47140.5714
Diesel fuelt1.45710.5921
Fuel oilt1.42860.6185
Natural gast1.330.4483
Liquefied petroleum gast1.71430.5042
Notes: Carbon emissions coefficient referenced from [63].
Table 4. Tupu units of LUTs during 2000–2010 in Ningde City (Top 10).
CodeNumber of Tupu UnitsArea/km2Change Ratio/%
1287,93979.1524.83
1567,74460.9719.13
1450,50345.4514.26
2146,39741.7613.10
2432,70029.439.23
1620,60318.545.82
2313,54112.193.82
2699398.952.81
1748654.381.37
2730052.700.85
Note: Code 1–7 represent cultivated land, forest land, orchard land, grassland, water bodies, built-up land, and unutilized land, respectively. For example, Code 12 means the transition of cultivated land to forest land. Code 26 signifies the transition of forest land to built-up land. The rest of the code follows the same rules.
Table 5. Tupu units of LUTs during 2010–2020 in Ningde City (Top 10).
CodeNumber of Tupu UnitsArea/km2Change Ratio/%
2187,89279.1026.51
1660,32954.3018.20
1245,59541.0413.75
1442,93138.6412.95
4135,75732.1810.79
2421,80219.626.58
1711,24910.123.39
2375276.772.27
1566836.012.02
4638213.441.15
Table 6. Land-use rising Tupu in Ningde City from 2000 to 2020 (km2).
PeriodDistrict or CountyIncreased CLIncreased FLIncreased OLIncreased GLIncreased WBIncreased BLIncreased UL
2000–2010Jiaocheng3.216.731.275.309.344.140.40
Fu’an6.2712.931.938.109.365.711.05
Fuding9.0012.681.558.9211.386.602.06
Gutian7.2814.590.2915.886.972.941.48
Xiapu7.389.391.608.8510.907.071.68
Zhouning1.924.852.875.653.601.360.07
Shouning4.0610.034.398.775.431.170.19
Pingnan3.437.951.988.524.811.090.16
Zherong1.052.440.955.091.221.030.09
2010–2020Jiaocheng8.783.090.303.881.0310.110.40
Fu’an15.316.210.906.771.349.440.62
Fuding16.408.431.227.611.1712.486.21
Gutian21.947.221.5912.620.916.621.68
Xiapu12.886.570.587.060.9611.161.52
Zhouning7.181.971.513.990.322.277.18
Shouning13.094.131.496.720.542.500.04
Pingnan11.463.472.546.430.422.780.02
Zherong4.481.080.443.350.090.920.01
Table 7. Land-use falling Tupu in Ningde City from 2000 to 2020 (km2).
PeriodDistrict or CountyDecreased CLDecreased FLDecreased OLDecreased GLDecreased WBDecreased BLDecreased UL
2000–2010Jiaocheng22.476.580.240.550.540.000.00
Fu’an31.4412.520.390.410.590.000.00
Fuding33.0617.850.530.510.240.000.00
Gutian33.9114.420.290.770.030.000.00
Xiapu30.0314.740.351.230.510.000.00
Zhouning12.676.920.180.500.040.000.00
Shouning20.7311.840.700.670.090.000.00
Pingnan18.858.050.410.570.060.000.00
Zherong7.254.060.070.470.020.000.00
2010–2020Jiaocheng16.268.200.112.970.010.000.05
Fu’an20.5316.440.063.510.000.000.07
Fuding33.3514.990.554.360.250.000.02
Gutian25.0218.430.088.990.000.000.06
Xiapu24.0111.970.124.320.210.000.12
Zhouning6.827.490.082.900.000.000.01
Shouning10.9013.050.234.320.000.000.02
Pingnan15.332.730.002.620.000.000.26
Zherong3.594.460.062.250.000.000.00
Table 8. Ecosystem services value in Ningde City from 2000 to 2020.
YearCultivated LandForest LandOrchard LandGrasslandWater BodiesUnutilized LandTotal
ESV/108 CNY200026.13890.9574.6531.7482.050.021105.54
201021.14739.7364.4321.5785.090.04932.00
202018.70786.7071.1918.50125.320.071020.47
Change rate/%2000–2010−0.19−0.17−0.14−0.320.040.67−0.16
2010–2020−0.120.060.10−0.140.470.820.09
2000–2020−0.28−0.12−0.05−0.420.532.05−0.08
Table 9. Changes in ecosystem services value (sub-type) in Ningde City during 2000–2020.
Sub-TypeESV (108 CNY)Change Rate (%)
2000201020202000–20102010–20202000–2020
Food production, FP24.1120.0120.50−17.002.42−14.99
Material production, MP31.5026.1027.55−17.155.55−12.55
Water supply, WS8.578.4312.71−1.7050.8048.23
Gas regulation, GS104.7586.7891.55−17.165.50−12.60
Climate regulation, CR290.82241.13256.24−17.096.27−11.89
Purify environment, PE88.4773.9379.78−16.447.92−9.83
Hydrologic adjustment, HD267.53235.19276.46−12.0917.553.34
Soil conservation, SC121.90100.96106.90−17.175.88−12.30
Maintaining nutrient cycle, MNC10.448.659.06−17.204.79−13.23
Bio-diversity, BD109.0790.5696.57−16.976.64−11.46
Aesthetic landscape, AL48.3640.2643.15−16.757.18−10.78
Disclaimer/Publisher’s Note: The statements, opinions and data contained in all publications are solely those of the individual author(s) and contributor(s) and not of MDPI and/or the editor(s). MDPI and/or the editor(s) disclaim responsibility for any injury to people or property resulting from any ideas, methods, instructions or products referred to in the content.

