Abstract
Human actions have led to consistent and profound alterations in land use, which in turn have had a notable effect on the services provided by ecosystems. In this research, the Google Earth Engine (GEE) was initially employed to perform a supervised classification of Landsat satellite images from 2000 to 2020, which allowed us to obtain land-use data for Putian City, China. Next, the geo-informatic Tupu model and the revised valuation model were used to explore the spatial attributes and ecological effects of land-use changes (LUCs). Subsequently, EEH (eco-economic harmony), ESTD (ecosystem services tradeoffs and synergies degree index), and ESDA (exploratory spatial data analysis) methods were employed to further analyze the coordination level, trade-offs, synergies, and spatial patterns of ecological-economic system development. The findings revealed that: (1) The land-use composition in Putian City was predominantly cultivated land and forest land, with other types of land intermixed. Concurrently, there was an ongoing trend of expansion in urban areas. (2) ESV in Putian City exhibited an upward trend, increasing from 15.4 billion CNY to 23.1 billion CNY from 2000 to 2020. (3) ESV exhibited an imbalance in spatial distribution, with high-high agglomeration areas concentrated in the central part of Putian City and the coastal region of Hanjiang District, while low-low agglomeration areas were prevalent in Xianyou County in the southwest, Xiuyu District along the coast, and Licheng District in the urban center. (4) Synergistic relationships among ESs predominated, though the trade-off relationship showed a tendency to expand. (5) The ecological environment and economic progress in Putian City collectively faced a region of potential risk. The findings of this study are intended to serve as a guide for improving the distribution of land resources and for developing strategies that ensure the sustainable development of the region’s socio-economic framework.
1. Introduction
Land-use changes (LUCs) are regarded as the most prominent and direct driver of terrestrial ecosystems, capable of profoundly altering ecosystem dynamics and their spatial distribution, thereby impacting ecosystem structure and function and often diminishing the ecosystem’s capacity to provide diverse essential services [1,2,3,4,5]. Ecosystem services (ESs) encompass a broad range of benefits derived by humans from the structure, function, and processes of ecosystems. These benefits include tangible products, such as food production, raw materials, and clean water sources, as well as intangible services, like water and soil conservation, gas regulation, and landscape culture [6,7]. Collectively, these contribute to the establishment and sustenance of environmental conditions and the material foundation essential for human survival.
The quantification and expression of these benefits are encapsulated by the concept of ecosystem services value (ESV). ESV, an essential indicator of a region’s ecological health and environmental benefits, holds profound implications for regional ecological civilization and sustainable development. The progression of social and economic factors propels the transformation of land utilization, particularly altering ecological zones for construction and industrial activities, which leads to a decrease in biodiversity. This alteration induces instability in ecosystem structure, diminishes ESs, and poses a threat to the sustainable development of the region. Simultaneously, it precipitates an ecosystem imbalance, elevating the costs associated with restoration [8]. Traditional land-use policies are failing to adequately measure and reflect ESs’ hidden value and cost, which is a major contributor to their decline [9]. These policies often overlook the intricate relationship between ESs and LUCs [10]. Human activity and migration are significant factors influencing LUCs and ESs provision across distinct spatial and temporal scales, according to research [11,12]. LUCs primarily impact ecosystem processes, including energy exchange, soil erosion, water cycling, aesthetic landscape, and biogeochemical cycles [13,14,15,16,17], ultimately influencing the provisioning of ESs. A land-use practice’s specific impact determines the magnitude of this impact [18]. Therefore, to explore the spatial-temporal evolution of land use and to assess the mechanisms behind the impacts of LUCs, ESV is crucial not only for promoting the rational utilization of land resources and fostering sustainable socio-economic development but also for building ecological civilization and a framework for ecological security in the contemporary age.
Coastal cities, pioneers in marine economy development due to their rich natural and economic resources, now confront new challenges in land-use planning and management as they pursue sustainable development. Consequently, exploring the LUCs in coastal cities is particularly pertinent and illustrative [19,20,21,22]. This study aims to investigate the spatial-temporal evolution of LUCs and their impacts on ecosystem services. Our primary objectives are twofold: (1) to understand how LUCs and ESV evolve and differentiate spatially, and (2) to explore the underlying mechanisms affecting these patterns.
2. Literature Review
Land-use changes (LUCs) stem from the interplay between human socio-economic endeavors and the natural environment. As a key factor influencing both ecosystem services and climate change, LUCs can make ecosystems susceptible to damage [23,24]. Acting as a bridge between nature and society, ecosystem services intricately connect LUCs with human well-being, thereby serving as a crucial nexus for regional ecological security and socio-economic development [25,26]. Nevertheless, in the wake of urban expansion, industrial growth, and socio-economic progress, certain land-use practices that are not sustainable have caused considerable harm to natural ecosystems [27,28,29]. This has led to a marked reduction in the value of regional ecosystem services and has weakened the ecosystems’ ability to offer vital functions [30,31,32]. As the conflict between ecological and socio-economic development intensifies, an urgent issue presents itself: whether finite natural resources and delicate ecosystems can endure the demands of continuous global socio-economic growth. This issue poses a significant scientific challenge that demands immediate attention and resolution.
Additionally, ecosystem services (ESs) exhibit trade-offs or synergies [33,34,35], where the provision of one service may be associated with either an increase or decrease in other services. Trade-offs refer to situations where an increase in the provision of one ecosystem service is accompanied by a decline in one or more other services. Synergies, on the other hand, occur when the provision of two or more ecosystem services increases or decreases simultaneously [36,37]. These relationships between ESs have become a central focus of ecosystem research, with scholars employing models such as ARIES (Artificial Intelligence for Ecosystem Services), CASA (Carnegie Ames Stanford Approach), and InVEST (Integrated Valuation of Ecosystem Services and Tradeoffs) to explore the scale effects, spatial patterns, and underlying mechanisms of these interactions [37,38,39,40,41,42]. Current research on ESs is primarily focused on theoretical analysis and model simulation, with limited application in translating scientific knowledge into decision-making processes. However, evaluating ESs in monetary terms has the potential to quantify the benefits derived from ecosystems, enabling the calculation of natural capital, gross ecosystem product, the sustainable use of land resources, and the formulation of ecological compensation standards [43,44,45]. Quantifying the monetary value of ESs can enhance decision-making processes and has gained increasing prominence among policymakers and scholars in recent years [42,46,47,48,49,50]. Land-use patterns vary considerably across regions, leading to distinct ecosystem service provision. Costanza et al. pioneered the evaluation of ESV [6], Chinese researchers Xie et al. extended Costanza’s approach by developing the “equivalent factor table of ecosystem services value in China”, a widely adopted tool for ESV assessments [8]. Due to the heterogeneous nature of ecosystems [51,52,53,54,55], the equivalent factor table, which is based on national averages, requires adjustments to account for the specific characteristics of the study area. As people increasingly value the quality of their environment, they are willing to contribute financially to its protection [4,56]. Therefore, incorporating ability-to-pay and willingness-to-pay considerations into ecosystem services value assessments is essential for establishing an effective ecological compensation mechanism [4,47,57,58].
A review of the literature shows that numerous investigators have utilized the ecosystem services valuation technique introduced and refined by [6,8] to evaluate ESV across a range of ecological entities and at different scales of space and time [30]. This methodology has led to significant discoveries and has propelled the field of ecosystem services valuation, providing a beneficial structure for our research. However, the current body of literature identifies several pivotal areas that necessitate further enhancement. Firstly, it is a common understanding that the progression of land use shapes the variations in the economic value of ecosystem services. Numerous studies have examined the spatial and temporal trends of land-use changes (LUCs) through models like the land-use dynamic degree model, landscape pattern indices, etc. But these approaches often offer only a partial synthesis of the spatial and temporal dimensions. Although these research methodologies shed light on the characteristics of LUCs’ spatial and temporal evolution, they frequently fall short of seamlessly merging the temporal sequence with spatial configurations. The characteristics derived from such analyses often lack a visual component, and non-spatial data are not fully represented in terms of their geographical placement. Thus, there is an essential requirement for a spatio-temporal composite analysis method that can visually and dynamically depict the processes of LUCs using mapped units. Fortunately, the geo-informatic Tupu model provides a spatio-temporal analysis technique that is capable of delineating the spatial structural traits and temporal shifts of events through advanced data mining and specific processing techniques. This method, by creating a series of intuitive graphs, images, and schematic information in the form of Tupu units, aids in the visualization of the processes of LUCs [59,60,61,62,63]. Essentially, the geo-informatic Tupu model allows for the recording of complex spatiotemporal land-use data using Tupu units, which enhances the precision, clarity, and realism of LUCs research. Secondly, the majority of prior research has concentrated on the impact of ESV within individual ecological units, neglecting the reality that different units possess distinct abilities to supply ecosystem services (ESs). These variations have direct and indirect effects on the emergence and provision of ESs. In summary, while current research on LUCs and ESV has yielded important findings, there is a need for more in-depth study in two principal areas: (1) Current studies predominantly concentrate on the temporal trends and spatial patterns of LUCs and ESV, with less attention given to the underlying mechanisms that dictate how specific land use affects ecosystems. (2) While some researchers have begun to explore spatial interaction as a factor influencing ESV, studies employing a grid-based approach are relatively limited [64]. The grid method utilizes grid cells as the primary data carriers and analytical units, ensuring uniform grid areas. This approach significantly enhances the accuracy of ESV analysis within the study area and facilitates more meaningful comparisons of ecosystem services values [65,66,67,68].
Putian City, a burgeoning coastal tourist hub in China, is celebrated for its rich biodiversity and is the national production base for longan, litchi, and olive. It’s also a key region for subtropical crops such as loquat and Wendan pomelo and has been designated as “China’s premier loquat hometown” by the Ministry of Agriculture and Rural Affairs. Putian City, situated as a key element within the Economic Zone on the West Bank of the Strait, holds an essential position in the ecological security structure of Fujian Province in China. In recent years, the rapid expansion of highway and railway networks, along with the processes of industrialization and urbanization, have led to a substantial transformation of agricultural and ecological lands into urban and built-up areas. This development has sparked a conflict between the protection of arable land, ecological preservation, and the growth of urban spaces. These patterns of resource exploitation have given rise to challenges such as sensitive shifts in land use and suboptimal urban development [69]. Nonetheless, there has been a scarcity of research on LUCs and their ecological consequences within Putian City. It is imperative, we contend, to closely monitor and analyze the transformations in land use, and to conduct a timely examination of the spatial and temporal dynamics of LUCs, as well as the root causes behind these changes.
Accordingly, the main objectives of this study were: (1) understanding how LUCs and ESV evolve and differentiate spatially; and (2) how they are affected by underlying mechanisms. Therefore, this study initially analyzed the spatial-temporal evolution pattern of land use by utilizing the geo-informatic Tupu method from 2000 to 2020. Building upon this analysis, we modified the traditional ecosystem services valuation model by incorporating adjustment coefficients for biomass and socioeconomic factors, enabling us to investigate the ecosystem’s response to LUCs and their impact mechanisms at the multi-scale. And then, this study analyzed the coordination level, trade-offs, synergies, and spatial patterns of regional ecological-economic system development by using EEH, ESTD, and ESDA methods. The findings of this study not only provide decision-making references for optimizing land resource allocation but also inform the formulation of regional socio-economic sustainable development strategies.
3. Study Area and Methodologies
3.1. Study Area
Putian City, with its distinct geographical advantages, is located in the central coastal region of Fujian Province, China (24°59′–25°46′ N and 118°27′–119°39′ E). It is connected to the north with the provincial capital, Fuzhou City, and to the south with the historic city of Quanzhou. To the west, it is bordered by the Daiyun Mountains, and to the southeast, it faces the Taiwan Strait, looking across the sea towards Taiwan Province. Putian City governs one county and four districts (Xianyou County, Licheng District, Chengxiang District, Hanjiang District, and Xiuyu District), with a maritime area of 11,000 square kilometers (Figure 1). It covers a total area of 3923.49 km2. Throughout the study period from 2000 to 2020, the city’s boundaries remained consistent, with no administrative changes that could influence the land use indicators presented in this analysis.
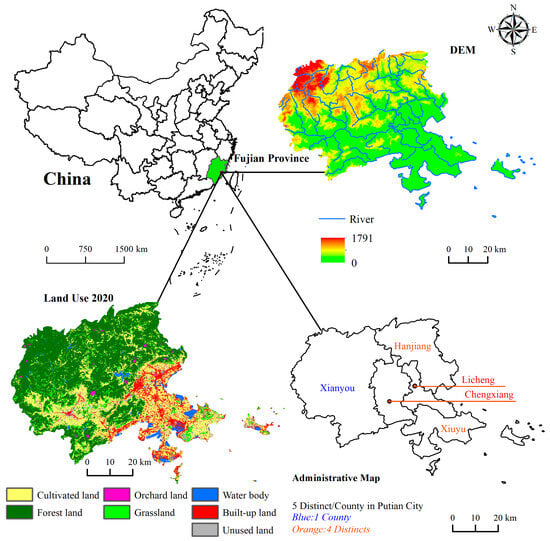
Figure 1.
Location of the study area. Sources: Drawings from this study.
Putian City, the focal point of this study, has experienced notable land use changes in the past [70,71]. Putian’s topography exhibits a distinct contrast between its northwest mountainous region and its southeast coastal plain, with the Xinghua Plain, the third largest plain in Fujian Province, forming the city’s major agricultural and aquaculture hub. This plain is traversed by three rivers flowing northwest to southeast, providing crucial water resources for industry, agriculture, and domestic use. And biodiversity within the region is characterized by a rich tapestry of species with notable diversity and abundance, particularly in the Xinghua Plain, which serves as a critical habitat for numerous endemic and migratory species. The species composition varies across different land use types, reflecting the ecological responses to human activities. Climatically, Putian City is situated in the subtropical zone, marked by distinct seasons, moderate temperatures, and a humid climate. The soil primarily consists of red soil and paddy soil, with evergreen broad-leaved forests dominating the vegetation. In 2020, the city’s Gross Domestic Product (GDP) stood at 264.34 billion CNY, with the primary sector (agriculture-based) contributing 4.75%, the secondary sector (industry-based) contributing 51.53%, and the tertiary sector (service-oriented) contributing 43.72%. Faced with the limitations of scarce land resources and the necessity to harmonize economic and social progress with ecological protection, maintaining this balance is of paramount importance.
3.2. Methodologies
3.2.1. Geo-Informatic Tupu
The geo-informatic Tupu model captures the spatiotemporal composite information of land-use changes (LUCs) through Tupu units, which possess the integrated attributes of quantitatively representing “spatial pattern” and “temporal sequence” under various spatiotemporal conditions, thereby enhancing the intuitiveness and precision of LUCs analysis [63]. The Tupu unit is constituted by the amalgamation of spatial units with time series units, and the process of selecting and gathering these units is a pivotal phase in the creation of the Tupu. Given the complexity and lengthiness of the operational processes associated with the aforementioned parameters and considering that numerous studies have already detailed these procedures, this paper will not repeat them [27,63].
3.2.2. Land-Use Dynamic Degree
The land-use dynamic degree provides a quantitative measure of the pace at which LUCs occur, playing a significant role in assessing and comparing the regional disparities and tendencies of LUCs [72]. The equation is as follows:
where K signifies the rate of change, or dynamic degree, associated with a particular category of land use; Ua and Ub denote the respective areas occupied by that specific land-use type at two distinct points within the time frame of the study; and T symbolizes the duration of the research period over which the land-use changes are being observed and measured.
3.2.3. Ecosystem Service Classification System
The Millennium Ecosystem Assessment (MEA) represents a comprehensive, global effort to evaluate the state and trends of ecosystem services, the contributions of these services to human well-being, and the options available to conserve and use them sustainably [73]. Guided by the MEA, ecosystem services (ESs) are categorized into 4 types: provisioning services (e.g., food, raw materials, and medical resources, etc.), regulating services (such as ecological processes and dynamics, climate regulation, and carbon sequestration, etc.), supporting services (such as nutrient cycling and primary production, etc.), and cultural services (e.g., aesthetic landscapes, cultural heritage values, etc.). Based on the classification system proposed by Xie et al. [8], the study adopted 4 top-level indicators and 11 secondary-level indicators, as shown in Table 1.

Table 1.
Classification system of ecosystem services.
3.2.4. Ecosystem Services Valuation Model
As described above, Costanza et al. pioneered the evaluation of ESV [6], Chinese researchers Xie et al. extended Costanza’s approach by developing the “equivalent factor table of ecosystem services value in China”, a widely adopted tool for ESV assessments [8]. Due to the heterogeneity of ecosystems [74], we modified the value coefficients and divided the ESs into 4 types and 11 sub-types for the study area (Table 2), based on the framework of [8]. An evaluation model of ESV suitable for the study area was constructed using the socioeconomic coefficient factor and biomass factor [4], as shown below:
where ESV stands for the total economic value of the ecosystem services (108 CNY) provided; Ai represents the area (hm2) of the i-th land-use type; VCi is the ESV equivalent per unit area in Putian City (Table 2); S and PI are adjustment coefficients that account for the biomass factor and the socio-economic factor, respectively; and n is the total count of land-use types. Given the complexity and lengthiness of the operational processes associated with the aforementioned parameters, and considering that numerous studies have already detailed these procedures, this paper will not repeat them [4].
Table 2.
ESV equivalent per unit area in Putian City (unit: CNY/hm2·a).
3.2.5. Ecosystem Services Tradeoffs and Synergies Degree Index (ESTD)
ESTD was used for the trade-offs and synergies between ESs [37]. The calculation formula is as follows:
where ESTDij is the tradeoffs/synergies between the i-th and j-th ecosystem service (ES); ESVib represents the amount of change in the i-th ES at time b (the final state); and ESVia represents the amount of change in the i-th ES at time a (the initial state). If ESTD is negative, it means that there is a trade-off relationship; conversely, synergy relationships.
3.2.6. Coordination Degree Model of the Eco-Economic System
This study referred to the research of existing literature [38] and constructed the regional eco-economic harmony (EEH). The calculation formula was as follows:
where EEH refers to the regional eco-economic harmony; ESVpi and ESVpj represent the ESV per unit area (104 CNY/hm2) at the beginning and end of a period, respectively; GDPpi and GDPpj represent GDP per unit area (104 CNY/hm2) at the beginning and end of a period, respectively.
Since there is no unified standard for the classification of EEH, the study drew on previous research experience and divided the EEH into 10 levels. The details are shown in Table 3.
Table 3.
The classification of EEH.
3.2.7. Exploratory Spatial Data Analysis (ESDA)
ESDA is usually used to reveal the spatial structure and correlation of attribute values [75], mainly including global spatial autocorrelation (GSA) and local spatial autocorrelation (LSA). In order to avoid large differences in ESV caused by the different sizes of grid cells at the edge of Putian City, this study used the ESV intensity (the ratio of ESV to the area of each grid) for spatial autocorrelation analysis.
GSA can reveal the overall agglomeration of the study area, and the global Moran’s I index is used to measure and test the global autocorrelation of the ESV intensity in Putian City at 1 km × 1 km grid scale. The equation is as follows:
where Ig represents the global autocorrelation index, with a value range from −1 to 1; n is the grid number (4296 grid cells in total in Putian City); xi and xj represent the attribute values of the i-th grid and the j-th grid, respectively; is the attribute mean; and Wij is the spatial weight matrix.
When the Ig value approaches 1, it indicates that the index has a clustering pattern, that is, the ESV intensity has a positive spatial correlation; when the Ig value approaches −1, it indicates that the indicator has a dispersion mode, that is, the ESV intensity has a spatial negative correlation; when the Ig value is equal to 0, it means that the indicator has a random pattern, that is, there is no spatial correlation of ESV intensity.
LSA can be used to test whether there is a clustering phenomenon between grid cells and the surrounding grid cells in space or not, analyze the clustering and differentiation characteristics of spatial elements, and reveal the local clustering characteristics of spatial cell attributes. The LISA distribution map was drawn on the basis of the z-test (p < 0.05). The equation is as follows:
where zi and zj are the standardization of attribute values for the i-th grid and the j-th grid, respectively.
If the Il value is positive, it indicates that there are clusters with similar attributes between the two grids, including high-high clustering (HH, indicating that the ESV intensity of the grid and adjacent grids is high) and low-low clustering (LL, indicating that the ESV intensity of the grid and adjacent grids is low); If the Il value is negative, it indicates that there are clusters with opposite attributes between the two grids, including high-low clustering (HL, indicating that ESV intensity of the grid is relatively high, and the ESV intensity of the neighboring grid is low) and low-high clustering (LH, indicating that the ESV intensity of the grid is low, but the ESV intensity of the surrounding grid is high).
3.3. Data Acquisition and Processing
Downloading and pre-processing images with the help of traditional remote sensing analysis means facing the problems of huge data volume and low processing efficiency, while the cloud platform of Google Earth Engine (GEE) has already carried out the pre-processing work of atmospheric correction, geometric alignment, radiometric calibration, and other pre-processing work for commonly used images, and it can quickly realize the image acquisition, batch processing, computation, and analysis by means of on-line programming, which greatly improves the operation efficiency [76]. Therefore, land use classification based on the GEE cloud platform has obvious characteristic advantages compared with using local software (e.g., ENVI 5.3, ArcGIS 10.8).
Accordingly, the Google Earth Engine (GEE) was initially employed to perform a supervised classification of Landsat satellite images from 2000 to 2020, which allowed us to obtain the 30 m resolution of land-use data for Putian City, China. The findings indicated that the Kappa test’s coefficient values exceeded 0.8 for all time periods, and the overall accuracy for the remote-sensing imagery at each of the three stages surpassed 90%. Land-use categories were delineated into several types based on the unique conditions and research goals of the study area: cultivated land (CL), forest land (FL), orchard land (OL), grassland (GL), water bodies (WB), built-up areas (BL), and unused land (UL). Subsequently, a land-use spatial database for Putian City was constructed using ArcGIS 10.8 by allocating codes ranging from 1 to 7 to each specific land-use type. For instance, the code 12 represents a shift from cultivated land to forest land, while the code 26 indicates a change from forest land to built-up land. The remaining codes are assigned in accordance with the same systematic approach.
After experimentation, the 1 km × 1 km grid scale was ultimately selected for the study area, considering the scale effect on measurement results. The Create Fishnet function of ArcGIS 10.8 was utilized to divide the study area into grids (a total of 4296 grid cells). Subsequently, the Kriging tool of ArcGIS 10.8 software was employed for interpolation analysis, and target information was collected to establish a foundation for further research. The following is a comprehensive list of the software used, including version numbers, manufacturers, and access information:
Google Earth Engine (GEE): Version 1.0.1, developed by Google LLC. GEE is a cloud-based platform for geospatial data analysis that is freely accessible to users (https://earthengine.google.com/, accessed on 17 October 2023).
ArcGIS 10.8: Version 10.8, developed by Esri. ArcGIS is a comprehensive Geographic Information System software suite used for spatial analysis and map creation. It requires a license, which can be obtained through Esri or its authorized distributors.
GeoDa 1.20: Version 1.20, developed by the GeoDa Center for Geospatial Analysis and Computation at Arizona State University. GeoDa is free, open-source software for spatial data analysis (https://geodacenter.github.io/, accessed on 11 December 2023).
Microsoft Excel: Version 2021, developed by Microsoft Corporation. Excel was employed for basic data management and calculations. It is part of the Microsoft Office suite and requires a subscription.
Origin 2022: Version 2022, developed by OriginLab Corporation. Origin is a data analysis and graphing software used for scientific research. It is proprietary software and requires a license (https://www.originlab.com/, accessed on 23 October 2023).
Additionally, temperature and precipitation data were provided by the National Meteorological Information Center (http://data.cma.cn, accessed on 23 December 2023). The socio-economic data were all from the “Ningde Statistical Yearbook (2001–2021)”. Fujian Provincial Grain and Price Reserve Bureau provided us with grain prices (http://lsj.fujian.gov.cn/xxgk/tjxx/, accessed on 16 December 2023).
4. Results Analysis
4.1. Temporal Change Characteristics of Land-Use Changes (LUCs)
From Figure 2 and Table 4, forest land areas made up the majority of the land, accounting for more than half of the total land area at each of the three time points analyzed. Cultivated land (CL) followed as the second-largest type, covering an area exceeding 1000 km2. The average proportion of CL to the total area across the three-time nodes reached 28.80%. This indicates that the land-use structure of Putian City over the past two decades has primarily centered on agricultural and forestry production. Nevertheless, the areas of CL, forest land (FL), and grassland (GL) experienced declines during this period, while orchard land (OL), water bodies (WB), built-up land (BL), and unused land (UL) witnessed increases. Notably, CL experienced the most substantial decline among all land types, exhibiting a continuous downward trajectory from 1261.15 km2 in 2000 to 1003.29 km2 in 2020, representing a decrease of 20.45%. Among all land types, FL exhibited the smallest area reduction over the past 20 years, with a decrease of 24.79 km2. The GL area experienced a notable decline from 2000 to 2010, with a reduction area of 45.44 km2 and an average annual reduction rate of 0.09%; however, from 2010 to 2020, there was a minor expansion of 2.67 km2. As for OL, its area started at 12.76 km2 in 2000 and saw a growth of 50.86% over twenty years, culminating in an area of 19.25 km2. This increase is largely due to the favorable climate of Putian City, situated in the mid-subtropics, which supports the cultivation of local fruit species like longan, lychee, loquat, grapefruit, and olive. The local government has been proactively encouraging the development of this category of agriculture. The area of BL has seen a substantial expansion, from 109.15 km2 in 2000, which constituted 2.78% of the total area, to 335.65 km2 in 2020. This represents a more than twofold increase and is the most significant growth among all land-use types. Additionally, the area of WB has shown a steady increase, which can be credited to Putian City’s initiatives in advancing river ecological management and the ecological restoration and management project of the Mulan River, both of which have led to notable achievements.
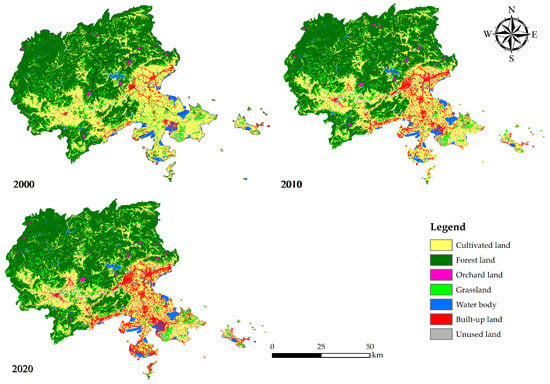
Figure 2.
Land-use structure in Putian City during 2000–2020. Sources: Drawings from this study.
Table 4.
Land-use structure in Putian City from 2000 to 2020.
The variation in the land-use dynamic degree can also be utilized as an indicator to assess changes in the land-use structure within a defined timeframe from an alternative perspective. As shown in Table 4, the average land-use dynamic degree values for the intervals between 2000 and 2010, and between 2010 and 2020, were 21.96% and 8.17%, respectively. This indicates ongoing LUCs in Putian City for the past two decades. The rate of LUCs from 2000 to 2020 reached 19.09%, reflecting a substantial human impact on the city’s LUCs. From 2000 to 2020, the dynamic degrees of cultivated land, forest land, and grassland were −1.02%, −0.06%, and −0.69%, respectively, indicating a downward trend in the area of these land types. In contrast, the WB’s change rate was 0.49%, indicating a gradual expansion. OL showed a more rapid increase, with a change rate of 2.55%. The BL had the highest change rate at 10.37%, while the UL had the second-highest rate at 7.44%, both indicating a quickened pace of expansion.
From the distribution results of land use (Figure 2), distinct patterns of LUCs were observed across the city’s spatial distribution. Starting from the urban core and extending to the outskirts, the primary types of land shifted from urban areas to agricultural and forested regions, among others. CL was notably dense in the southeastern Xiuyu District and the southwestern Xianyou County of Putian City. Conversely, FL was mainly distributed in Hanjiang District in the northeast and Xianyou County in the northwest. Grassland was chiefly found in the southeastern plains of the city, with the Xiuyu District having the highest concentration, possibly due to the transformation of abandoned arid land into grassy areas. OL was mainly distributed in the dry land and plateau regions of Hanjiang District and Xianyou County. WB were predominantly found in coastal areas such as Hanjiang District and Xiuyu District, excluding the reservoirs in the districts and counties.
4.2. Tupu Analysis of LUCs
4.2.1. Tupu Analysis from 2000 to 2010
The spatial arrangement of Tupu units reflecting LUCs in Putian City from 2000 to 2010 exhibited considerable variation. The most prominent shifts within the Tupu units were characterized by the transitions from “CL→BL” (code 16), “GL→BL” (code 46), and “CL→UL” (code 17), which constituted 28.56%, 23.79%, and 18.18% of all the land-use types that underwent conversion, respectively (Table 5). These particular types of Tupu units were observed in expansive, densely packed areas throughout the research region (as depicted in Figure 3a). Furthermore, the transitions “CL→FL” (code 12) and “FL→CL” (code 21) made up 6.70% and 6.03% of the total converted land-use types, respectively. Other significant Tupu units included “CL→WB” (code 15) and “CL→GL” (code 14), which accounted for 4.11% and 3.34% of the total converted land-use types, respectively. These latter land-use conversions were predominantly found across the southern and coastal regions of the study area.
Table 5.
Tupu unit ranking of LUCs in Putian City from 2000 to 2010 (Top 10).
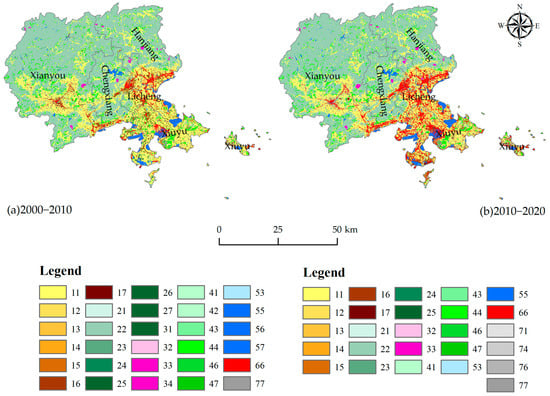
Figure 3.
Tupu of LUCs in Putian City from 2000 to 2020. Sources: Drawings from this study.
Based on the findings regarding the transition zones for each land category (as shown in Table 5), cultivated land exhibited the largest transfer-out area among all land types, amounting to 150.94 km2. Within this area, 46.62% was converted into BL (70.37 km2), 29.68% into UL (44.80 km2), 10.94% into FL (16.52 km2), 6.71% into WB (10.12 km2), 5.45% into GL (8.23 km2), and 0.60% into OL (0.90 km2). Conversely, the transfer-in area of cultivated land was only 15.63 km2, with 95.10% originating from FL (14.86 km2) and the remaining from GL (0.77 km2). When looking at where the CL was reallocated, it was predominantly transformed into BL, while in certain mountainous regions like Xianyou County and Hanjiang District, it was converted into FL and OL.
4.2.2. Tupu Analysis from 2010 to 2020
From 2010 to 2020, the total area of LUCs in Putian City, as detailed in Table 6, was 183.21 km2, signifying a reduction of 63.17 km2 when compared to the preceding period from 2000 to 2010. Among the various transitioning Tupu units, CL continued to be the most extensively transformed land type, with a total of 146.38 km2 being converted. More than half of this area, specifically 58.41% (85.50 km2), was transformed into BL, with a significant concentration along the coastal regions, especially in the Xiuyu District, as illustrated in Figure 3b. The area of CL that was converted into other types totaled only 23.80 km2, mainly from transitions involving FL and GL. The proportions of increase and decrease in CL were markedly imbalanced. The area of FL that underwent transition was 22.26 km2, with the majority, 74.10% (16.50 km2), being converted to CL. Other conversions included 17.21% (3.83 km2) to GL, 8.14% (1.81 km2) to OL, and a minimal 0.55% (0.12 km2) to water bodies (WB). The area of FL that was converted into other types was 14.10 km2, primarily from CL and OL. The GL area that was converted out, which was 9.01 km2, was less than the area that was converted in (7.73 km2), resulting in a net loss of 1.28 km2. The primary conversion out of GL was to CL (5.35 km2), while the primary source for the increase in GL area was the conversion from CL (7.49 km2). The shift of CL into GL was largely due to the abandonment of CL, which then naturally transitioned into GL. Subsequently, a significant portion of the GL was eventually repurposed for BL.
Table 6.
Tupu unit ranking of LUCs in Putian City from 2010 to 2020 (Top 10).
4.3. Land-Use Rising/Falling Tupu Analysis
4.3.1. Land-Use Rising Tupu
The examination of the differences in the transitions of the land-use structure in Putian City was conducted by creating the ascending Tupu for the periods from 2000 to 2010 and from 2010 to 2020, as depicted in Figure 4. Additionally, a statistical analysis was performed on the data pertaining to the transitions, which is summarized in Table 7.
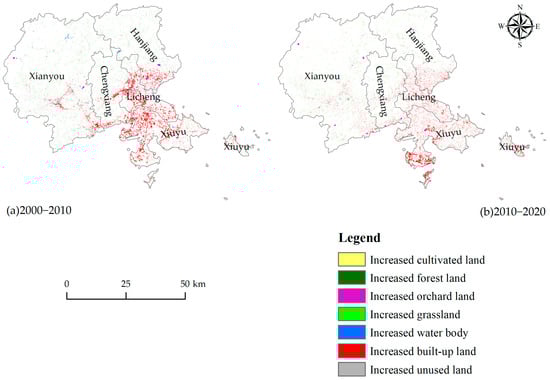
Figure 4.
Land-use rising Tupu in Putian City from 2000 to 2020. Sources: Drawings from this study.
Table 7.
The structure list of land-use rising Tupu in Putian City from 2000 to 2020 (km2).
Table 7 and Figure 4a present data indicating that between 2000 and 2010, the areas of land use that underwent change and those that remained unchanged in Putian City were 246.45 km2 and 3676.32 km2, respectively. These figures represent 6.28% and 93.72% of the total area of the study region. Within the areas that experienced change, the most significant increase was observed in BL, which added up to 136.45 km2, or 55.37% of the total area that saw an increase. This was followed by UL (48.93 km2), FL (16.89 km2), CL (15.63 km2), GL (14.65 km2), WB (10.52 km2), and OL (3.38 km2). In terms of regional distribution, Xianyou County had the largest proportion of land that remained unchanged, at 48.49%, suggesting that it experienced the most stable land-use changes (LUCs) during the period. On the contrary, Licheng District had the smallest proportion of unaltered areas, at 6.57%, and the largest addition to BL, with an area of 30.04 km2. This highlights its prominent role in the land-use changes (LUCs) within the study area.
When it comes to the extent of newly added land types, Xianyou County had the greatest expanse of new cultivated land at 6.52 km2, followed by Xiuyu District (3.56 km2), Hanjiang District (2.46 km2), Chengxiang District (2.00 km2), and Licheng District (1.10 km2). In the context of FL, Xianyou County, Hanjiang District, and Chengxiang District were identified as the top three areas with the most significant additions of new forest land, collectively accounting for 92.78% of the total new FL added. As the primary fruit production hubs within Putian City, both Hanjiang District and Xianyou County saw an addition of 3.28 km2 to their OL, which constituted 97.04% of the overall new OL that was added. It is also notable that among the areas where BL expanded, Xiuyu District had the largest increase, with 57.87 km2 of new BL, followed by Licheng District, Chengxiang District, Xianyou County, and Hanjiang District. As a result, the conversion of land use to BL was most pronounced in Xiuyu District during the observed period, whereas Chengxiang District exhibited a comparatively stable land-use pattern.
Table 7 and Figure 4b further demonstrate that during the period from 2010 to 2020, the area affected by land-use changes (LUCs) in Putian City was less than that of the preceding period from 2000 to 2010, amounting to a total of 168.88 km2. The BL saw the most significant increase, with a new addition of 90.04 km2. This expansion was predominantly a result of the rapid urbanization and industrialization processes, which led to the conversion of CL, FL, and GL into BL areas due to the pressures of development. The increase in CL was 23.82 km2, which constituted 14.10% of the total area that experienced an increase. In contrast, there was a decrease in the area of newly added FL and GL by 2.64 km2 and 2.90 km2, respectively, when compared to the earlier period from 2000 to 2010. This suggests a trend of land-use conversion from these natural land types to other uses, particularly towards urban and industrial development.
When examining the data from a district and county perspective, Xianyou County had the largest expansion in CL, with a new increase of 12.61 km2, followed closely by Hanjiang District with an additional 5.08 km2. Across all districts and counties, there was a notable decrease in the area of newly increased BL when compared to the period from 2000 to 2010, with Licheng District recording the most significant reduction of 16.20 km2. Furthermore, with the exception of Licheng District and Xiuyu District, the area of newly increased FL saw a decline in all other districts and counties relative to the previous period, with Xianyou County experiencing the most substantial decrease. The newly added OL was predominantly situated in Xianyou County (2.15 km2), followed by Xiuyu District (0.63 km2), Chengxiang District (0.60 km2), and Licheng District (0.01 km2).
4.3.2. Land-Use Falling Tupu
The temporal and spatial evolution of land-use changes (LUCs) in Putian City was explored by creating the descending Tupu for the city for the periods from 2000 to 2010 and from 2010 to 2020, as shown in Figure 5. Concurrently, a statistical analysis was performed on the data regarding these transitions, which is detailed in Table 8.
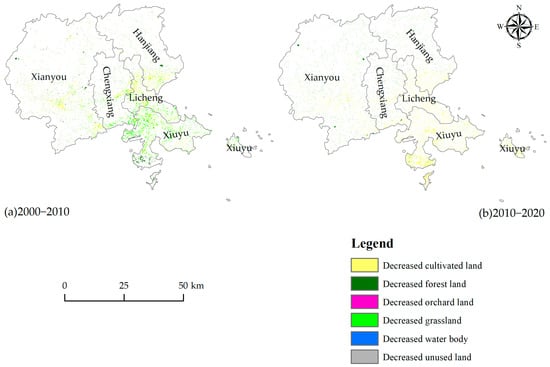
Figure 5.
Land-use falling Tupu in Putian City from 2000 to 2020. Sources: Drawings from this study.
Table 8.
The structure list of land-use falling Tupu in Putian City from 2000 to 2020 (km2).
Based on the information provided in Table 8 and illustrated in Figure 5, it is clear that the area of CL that decreased in Putian City from 2000 to 2010 was 150.94 km2, which constituted 61.24% of the total reduction in land area. This was followed by decreases in GL and FL, which accounted for 24.38% and 13.64% of the total decrease, respectively. The areas of OL, WB, and UL that experienced a decline were significantly smaller, each representing less than 1% of the total decrease. In terms of the geographical distribution of these decreases, the loss of CL was mainly concentrated in Xianyou County and Xiuyu District, which together made up 55.55% of the overall reduction. Within the central region of Putian City, which includes Chengxiang District and Licheng District, the predominant types of land that decreased were CL and GL, with a combined area of 62.76 km2. This is markedly larger than the newly added area for these two land types, which was only 5.30 km2 during the same timeframe.
From 2010 to 2020, the pattern of land type reduction in terms of area and structure in Putian City closely resembled that of the previous period. It is significant to note that while the area of CL that decreased was not considerably different from the prior period, it continued to be the land type with the largest reduction, suggesting that the trend of CL being taken over had persisted. In comparison to the period from 2000 to 2010, there was a substantial decrease in the area of GL that diminished in Xiuyu District, dropping from 32.66 km2 in the earlier period to 2.31 km2, which is a reduction of 92.93%. This significant reduction is linked to the establishment of the district, where land that was previously abandoned and had turned into GL was subsequently developed into BL. The reduction in other land types was relatively minor, with no major changes observed. Among all the districts and counties, Xiuyu District had the largest decrease in the area of CL, amounting to 71.56 km2, followed by Xianyou County with a decrease of 27.65 km2. Other districts and counties also reported reductions. Specifically, the decreased area for FL and GL in Xianyou County was 12.12 km2 and 4.46 km2, respectively, while Hanjiang District saw a decrease in FL of 4.76 km2.
4.4. Temporal Change Characteristics of the ESV
According to Equation (2), the ESV of Putian City from 2000 to 2020 was calculated, as presented in Table 9 and Figure 6. The results indicated a consistent upward trend of ESV in Putian City from 2000 to 2020, rising steadily from 15.4 billion CNY to 23.1 billion CNY. Over the past two decades, this represents a total increase of 7.7 billion CNY and a remarkable growth rate of 50.29%. Furthermore, the ESV intensity increased from 39,300 CNY/hm2 to 59,000 CNY/hm2, highlighting the enhanced ecosystem services provided by the city’s natural environment.
Table 9.
Ecosystem services value in Putian City from 2000 to 2020.
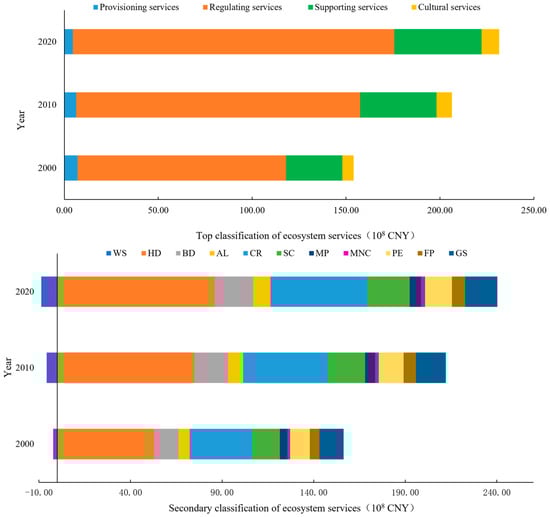
Figure 6.
Structure comparison of ESV in Putian City from 2000 to 2020. Note: Abbreviations are the same as those given in Table 1. Sources: Drawings from this study.
A detailed analysis of ESV across different land-use types revealed a clear dominance of forest land (67.63%), followed by water bodies (23.47%), cultivated land (7.44%), grassland (5.62%), orchard land (0.32%), and unused land (0.18%). Notably, built-up land exhibited a negative ESV, making it the sole land type with detrimental ecological effects. Excluding built-up land, all other land types displayed an upward trend in ESV over the study period, with growth rates ranging from 2.95% for unused land to 0.57% for forest land. The ESV of each land type exhibited distinct trends between the two periods of study. From 2000 to 2010, unused land, orchard land, and water bodies experienced significant changes, while grassland ESV exhibited the smallest variation. In contrast, ESV increased for all land types during 2010–2020, albeit with a modest overall growth rate of approximately 5%.
A comprehensive analysis of ESV across various service functions revealed that regulating services were the most prominent in Putian City, contributing 73.95% of the total ESV, reaching 17.118 billion CNY over 20 years. Supporting services followed closely, accounting for 20.03%, while provisioning services held the least share, contributing only 1.97% of the total ESV. A notable trend was the continuous decline in provisioning services, from 703 million CNY in 2000 to 455 million CNY in 2020, representing a decline of 35.26%. The primary cause of this decline was the conversion of cultivated land into built-up land. It is anticipated that the expansion of built-up land in Putian will continue in the future, potentially leading to a further decrease in provisioning services. Despite the decline in PS, RS, SS, and CS all exhibited an upward trend over the study period. Regulating services increased from 11.1 billion CNY to 17.1 billion CNY, while supporting services increased from 2.996 billion CNY to 4.636 billion CNY, and cultural services increased from 602 million CNY to 939 million CNY.
In terms of specific ecosystem service types, the average value of each function varied significantly. The highest-valued service was hydrologic adjustment, with an average value of 7.13 billion CNY, followed by climate regulation (4.44 billion CNY), soil conservation (1.95 billion CNY), biodiversity (1.75 billion CNY), gas regulation (1.58 billion CNY), purify environment (1.30 billion CNY), aesthetic landscape (787 million CNY), food production (633 million CNY), material production (527 million CNY), maintaining nutrient cycle (192 million CNY), and water supply (−565 million CNY). Among these services, hydrologic adjustment exhibited the most significant increase, with a growth of 62.61%. Biodiversity and the aesthetic landscape also experienced notable growth, while maintaining the nutrient cycle, purifying the environment, and food production experienced slower growth rates. Gas regulation showed the slowest growth among all ecosystem services, with an increase of only 33.17%.
A district-wise analysis of ESV (Figure 7) revealed a consistent upward trend across all districts and counties, with Xianyou County demonstrating the most remarkable growth, reaching 4.186 billion yuan. Hanjiang District followed closely with 1.674 billion CNY, while Chengxiang District (1.103 billion CNY), Xiuyu District (479 million CNY), and Licheng District (304 million CNY) trailed behind. In terms of ESV intensity, Xianyou County and Hanjiang District exhibited a similar pattern, with their ESV intensity increasing from 39,300 CNY/hm2 to 62,000 CNY/hm2 and 39,000 CNY/hm2 to 61,200 CNY/hm2, respectively, between 2000 and 2020. This represented growth rates of 57.83% and 56.94%. In contrast, Xiuyu District displayed the lowest ESV intensity, with only an increase of 8600 CNY/hm2 from 2000 to 2020, reflecting an average annual increase of 427.58 CNY/ha. This disparity is attributed to the conversion of high-service-value ecological land, such as cultivated land, orchard land, and grassland, into low-service-value built-up land in the Xiuyu District.
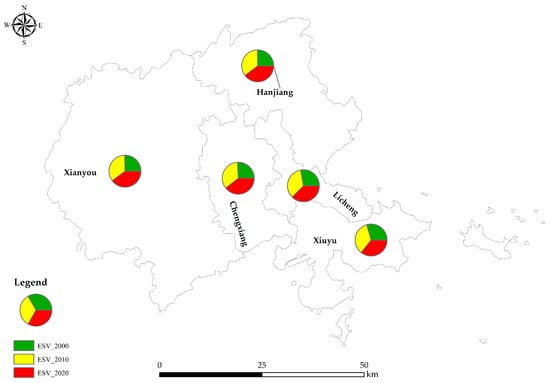
Figure 7.
Ecosystem services value of districts or counties in Putian from 2000 to 2020. Sources: Drawings from this study.
4.5. Spatial Change Characteristics of the ESV
Using the ArcGIS 10.8 platform, ESV was calculated for each grid cell, followed by interpolation analysis employing the kriging tool. Subsequently, the natural breakpoint method was employed to classify ESV in Putian City into five grades from low to high, as depicted in Figure 8.
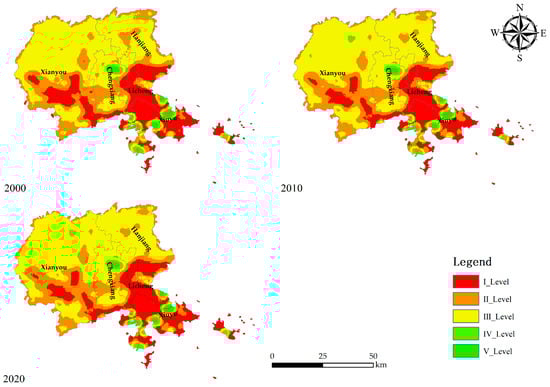
Figure 8.
Spatial differentiation of ESV in Putian from 2000 to 2020. Sources: Drawings from this study.
As illustrated in Figure 8, Putian City exhibited a distinct spatial pattern of ecosystem services value (ESV), with higher values concentrated in the north and lower values in the south. Low-value areas (Grade I and Grade II) represented a small fraction of the city, primarily encompassing regions with dense populations and intense human activities, such as Licheng District and Xiuyu District. Moderate-value areas (Grade III) were the most prevalent, predominantly distributed in Xianyou County and Hanjiang District. These areas were characterized by high forest cover, a substantial proportion of forest land, and relatively developed fruit and forestry industries. High-value areas (Grade IV and Grade V) were primarily concentrated in the Xinghua Plain, located in the southern and northern reaches of the lower Mulan River. These regions, endowed with abundant water resources, served as Putian’s primary centers for food, vegetable, and aquatic product production. Their superior ecological conditions contributed to their elevated ecosystem services value. From an evolutionary perspective, the ecosystem services value of Grade II and Grade III remained relatively stable between 2000 and 2020, while the value of Grade I, Grade IV, and Grade V expanded. This suggests that Putian City effectively responded to the national “Three Regions and Three Lines” strategy, achieving notable progress in ecological conservation. However, it is noteworthy that ESV in most areas of the Licheng District and Xiuyu District gradually declined over the study period. This decline primarily stemmed from the conversion of significant portions of cultivated land and grassland into built-up land during this time, leading to a continuous decrease in provisioning services in these areas.
4.6. Spatial Autocorrelation Analysis of ESV
The global Moran’s I index was employed to assess the spatial autocorrelation of ESV intensity at a grid scale by using ArcGIS 10.8. The results revealed that the global Moran’s I index for Putian City in 2000, 2010, and 2020 was 0.646, 0.640, and 0.637, respectively. These values were accompanied by Z-scores of 58.21, 57.60, and 57.39, respectively, and p-values that were all less than 0.0001. This indicates that ESV intensity in Putian City exhibited a positive spatial autocorrelation, demonstrating a non-random distribution pattern at the 1 km × 1 km grid scale. The observed declining trend in Moran’s I indices suggests a weakening spatial autocorrelation of ESV intensity in Putian City over time. This implies that the spatial clustering of ESV values has become less pronounced, suggesting a more dispersed distribution of ESs across the city.
To further investigate the spatial patterns of ESV intensity, local spatial autocorrelation analysis was conducted using GeoDa 1.20 software. The results (Figure 9) revealed that the overall spatial pattern of ESV intensity in Putian City remained relatively stable from 2010 to 2020, with high-high (HH) and low-low (LL) agglomerations dominating the landscape. High-low (HL) and low-high (LH) agglomerations were less significant. HH agglomerations were primarily concentrated in the central and coastal regions of Putian City, characterized by flat terrain and extensive areas of cultivated land, grassland, and water bodies. These areas benefited from a favorable ecological environment, contributing to their elevated ESV intensity. In contrast, LL agglomerations were the most widespread, predominantly concentrated in Xianyou County in the southwest, Xiuyu District along the coast, and Licheng District in the city center. These areas were densely populated and underwent intense urbanization, leading to a decline in ESV intensity due to land-use conversion and environmental degradation. HL and LH agglomerations were sparsely distributed and scattered around the HH and LL agglomerations. These areas were primarily located at the interface between cultivated land, forest land, and orchard land. Significantly, the range of LL agglomerations was larger than that of HH agglomerations, and both ranges exhibited a gradual reduction over time, albeit at a slow rate. The range of insignificant regions remained relatively stable, suggesting a subtle weakening of spatial aggregation in ESV intensity. These findings highlight the persistent spatial disparities in ESV intensity across Putian City. While some areas have maintained or even enhanced their ecological value, others have experienced degradation due to urbanization and land-use change. The insights from this analysis are crucial for informed decision-making in land-use planning and conservation efforts, aiming to mitigate the negative impacts of urbanization and promote sustainable development in Putian City.
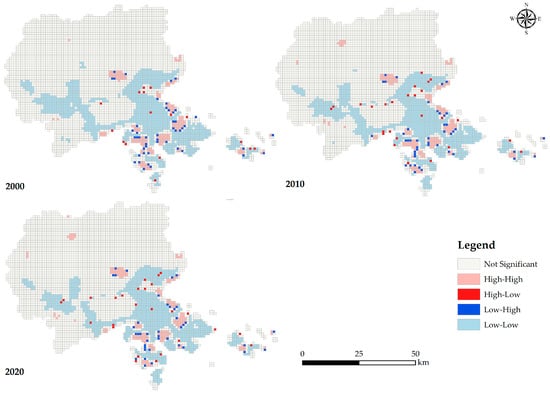
Figure 9.
LISA aggregation of ESV intensity in Putian City at the grid scale from 2000 to 2020. Sources: Drawings from this study.
4.7. Trade-Offs/Synergies Analysis on ESs
The trade-off and synergy index between ESs can be obtained through Equation (3), as shown in Figure 10.
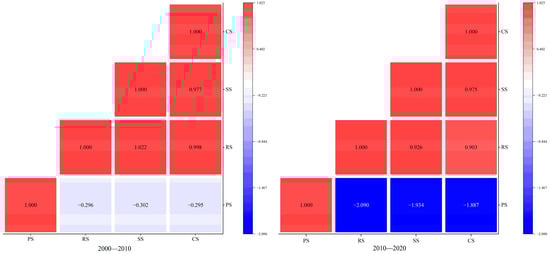
Figure 10.
ESTD in Putian City from 2000 to 2020. Note: Abbreviations are the same as those given in Table 1. Sources: Drawings from this study.
An analysis of trade-offs and synergies among TCES in Putian City revealed a dynamic interplay over the 20-year study period. Synergy dominated the relationships, with the strongest association observed between regulating and supporting services. Conversely, trade-offs emerged between provisioning–regulating services and supporting–cultural services, with the most pronounced trade-off occurring between provisioning–regulating services. Specifically, the synergy degree between regulating–supporting services peaked at 1.022 from 2000 to 2010, exceeding the lowest synergy degree of 0.977 observed between supporting and cultural services by a significant margin. This suggests that regulating and supporting services exhibited a mutually reinforcing relationship, where the improvement of one service often led to synergistic benefits for the other. However, trade-offs between provisioning–regulating services and supporting–cultural services highlighted the potential conflicts between different ESs. This underscores the need for careful management to optimize the balance among these services and ensure the sustainability of ecosystems. Interestingly, the synergy degree between supporting and cultural services exhibited a reversal from 2010 to 2020, with the synergy degree decreasing to 0.975. This may be attributed to the increasing pressure on ecological land due to accelerated urbanization and industrialization, which may have disrupted the balance between these services.
Equation (3) was applied to calculate the trade-off and synergy degree indices for SCES in Putian City, as presented in Figure 11.
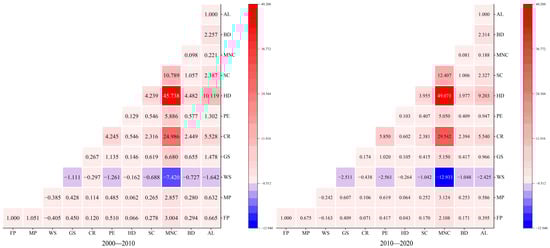
Figure 11.
SCES in Putian from 2000 to 2020. Note: Abbreviations are the same as those given in Table 1. Sources: Drawings from this study.
Figure 11 presents the trade-off and synergy patterns among SCES in Putian City from 2000 to 2020. The data reveal a prevalence of synergistic relationships, with 10 negative values out of 55 pairs, indicating that synergistic interactions dominate the ecosystem service network. In the trade-off relationship, the highest trade-off intensity was observed between water supply and maintaining the nutrient cycle (−7.420), while the lowest trade-off intensity was found between hydrologic adjustment and water supply (−0.162). Regarding synergy, the synergy degree demonstrated a relatively stable trend over the two study periods, with maintaining the nutrient cycle and hydrologic adjustment exhibiting the highest synergy degree (45.738), followed by gas regulation and water supply (1.319). A comparison of the two stages showcases distinct patterns of change across ecosystem services. Out of 55 pairs, 20 experienced an increase in synergy degree, while 35 exhibited a decrease, indicating an overall decline in synergy. This variability highlights the dynamic nature of ESs in Putian City over the past two decades. The trade-off degree between food production and water supply declined by 59.73% from 2000 to 2020, while the synergy degree between gas regulation and water supply increased by 126.08%.
4.8. Eco-Economic Harmony (EEH)
EEH in Putian City was calculated for three periods: 2000–2010, 2010–2020, and 2000–2020 using Equation (4), and is presented in Table 10.
Table 10.
The EEH value in Putian City from 2000 to 2020.
Table 10 reveals that the EEH value for Putian City over the entire study period (2000–2020) was 0.031, indicating a moderate overall value with a downward trend. This value falls within the potential crisis zone, suggesting that the growth rate of ESV in Putian City was lower than the economic growth rate. However, ESV was still increasing, indicating that economic development did not lead to a continuous deterioration of the ecological environment but posed a potential risk. The data highlight the dominance of forest land and cultivated land in Putian City. Forest land contributes substantially to regulating, supporting, and cultural services, while cultivated land provides high provisioning service value for food production. These land types play a key role in maintaining the stability of ESV in Putian City. However, rapid urbanization and industrialization have led to a significant demand for land resources, leading to the encroachment of ecological lands, including forests and cultivated land. This encroachment, if left unchecked, could pose a serious threat to the ecosystem and further hinder sustainable development in Putian City. These findings underscore the need for effective ecological protection measures to safeguard the balance between ecologically sustainable and socio-economic development in Putian City. Such measures should focus on conserving and managing ecological lands, particularly forests and cultivated land, to ensure the long-term provisioning of ESs and support sustainable development.
5. Discussion
Although the current studies on land-use changes (LUCs) and ecosystem service value (ESV) have yielded important understanding, additional comprehensive research is needed in two main areas: (1) Most of the research to date has concentrated on the temporal trends and geographic spread of LUCs and ESV, with scarce attention given to the fundamental processes through which particular land-use types affect ecosystems. (2) The transformation of land-use types and their geographic spread have varying impacts on the ESV of a region. To address these gaps, this study used the geo-informatic Tupu, a newly revised method of benefit transfer, EEH, ESTD, and ESDA to explore the main objectives.
5.1. Land-Use Changes (LUCs)
During the two-decade span from 2000 to 2020, there was a consistent trend in Putian City of other land types being converted into built-up land. Over these 20 years, a total of 226.45 km2 was transformed into built-up areas, predominantly in the economically vibrant regions surrounding the city centers and county seats, with Xiuyu District being particularly affected. The dominant patterns of land-use transition observed during the periods of 2000–2010 and 2010–2020 were “cultivated land to built-up land” and “cultivated land to grassland to built-up land”. Over the course of the past 20 years, there was a net transfer of 297.32 km2 of cultivated land out, with only 39.43 km2 being transferred in, indicating a considerable disparity in the shifts of cultivated land. Especially noteworthy was the rate of expansion of built-up land in Xiuyu District, which outpaced all other districts and counties with a 275% increase, amounting to an expansion of 109.75 km2 over the two-decade period. Given the scarcity of land resources, the ongoing expansion of urban land is bound to encroach upon other types of land, particularly those used for agricultural production and ecological preservation. This situation underscores the need for careful land-use planning and management to balance urban development with the conservation of vital agricultural and ecological lands.
In addition, regions throughout Putian City have been progressively forsaken to different extents as a consequence of issues such as adverse agricultural conditions (e.g., soil with high salinity and alkalinity), low crop yields, and the migration of rural labor, leading to the emergence of deserted fields that often turn into grasslands. This situation contributes to the wasteful use of scarce land resources. As a key grain-producing region within Fujian Province, Putian City is heavily dependent on external sources for its grain needs. The city’s essential farmland is mainly located in Xiuyu District and Xianyou County, which presents substantial difficulties in safeguarding food security and preventing the conversion of arable land to non-agricultural and non-grain uses. In light of these challenges, it is imperative for the government to take proactive measures to tackle this issue. To meet these challenges head-on, it is essential to improve the spatial arrangement of urban, rural, industrial, and mining lands, and to revitalize abandoned areas. Such actions can help in the efficient use of land resources, support local agricultural productivity, and ensure the preservation of land for food production, thereby maintaining a sustainable balance between urban development and agricultural needs. Furthermore, it is crucial to improve the efficiency of land resource utilization. For example, the research team discovered that the fields in Xiuyu District are predominantly saline and alkaline, which have low fertility. This soil condition restricts the types of crops that can be grown, with sweet potatoes and soybeans being the mainstays. The prevalence of monoculture farming practices has led to ongoing challenges in cultivation, which in turn has caused a decline in both the quantity and quality of the harvest. Enhancing the use of such lands would involve adopting strategies such as crop rotation, the use of soil amendments to improve fertility, and the introduction of more salt-tolerant crop varieties to maintain and increase productivity on these lands [77,78]. Additionally, the research findings suggest that geomatic mapping of information offers significant benefits when it comes to examining LUCs. This approach can effectively illustrate the spatial arrangement of each category, present multifaceted spatial details, and represent an innovative technique for investigating LUCs. Other research results have the same conclusions as ours [60,63,79,80].
5.2. LUCs Impact Ecosystem Services Value (ESV)
The results revealed that Putian City’s ESV increased steadily, reaching 15.403 billion CNY in 2000, 20.635 billion CNY in 2010, and 23.148 billion CNY in 2020. The average proportions of ESV across land-use types were as follows: forest land (67.63%) > water body (23.47%) > cultivated land (7.44%) > grassland (5.62%) > orchard land (0.32%) > unused land (0.18%), indicating the substantial contributions of forest land, water bodies, and cultivated land to Putian City’s ecological services. The study also revealed that built-up land exhibited a negative ESV, the only land type to demonstrate such an ecological impact. Moreover, this negative trend intensified over time, while the ESV of other land types continued to grow. These findings are attributed to the rapid urbanization rate and unsustainable resource allocation in Putian during the study period, leading to low urbanization efficiency. According to the study team’s analysis, Putian City possesses the lowest urbanization efficiency among the nine cities in Fujian Province. This inefficiency stems from the city’s excessive resource input, inadequate expected output, and excessive unintended output. Resource waste, unreasonable resource input scale and structure, inefficient resource utilization, and excessive discharge of wastewater and exhaust gases have all contributed to the negative impact on ESs [69]. Therefore, rational planning of construction land is crucial for improving urban environmental quality, enhancing regional ecosystem ecological efficiency and service value, and bolstering ecosystem service capacity. This is a critical scientific challenge facing cities in the era of ecological civilization.
An analysis of the various types of ecosystem services showed that regulatory services were the most prominent, amassing an ecological value of 17.12 billion CNY over the last twenty years. This represents a significant portion, specifically 73.95%, of the entire ESV. Supporting services followed, contributing 20.03%, while cultural services played a minor role, accounting for 4.05%. Provisioning services held the lowest value, representing a mere 1.97% of the total. This distribution can be attributed to several factors, including the shrinking of cultivated land due to urban expansion, poor agricultural conditions (e.g., saline and alkaline soils), low food production efficiency, rural labor migration, and the subsequent abandonment of cultivated land in various regions of Putian City. This abandoned land often transitioned into wasteland (grassland) with weeds, resulting in limited land resource utilization. Among the SCES, hydrologic adjustment, climate regulation, and soil conservation emerged as the primary functions in Putian City, while the ecological value of food production held a smaller share. Putian City, a major grain sales area in Fujian Province, relies heavily on external food supplies. Its basic farmland primarily lies in Xiuyu District and Xianyou County. The government should prioritize addressing this issue. The study suggests that along with enhancing the planning of urban and rural settlements as well as industrial and mining zones and rehabilitating deserted areas, it is essential to boost the efficient use of land resources. This might include advancing the modernization of agriculture, bolstering its infrastructure, and putting into action initiatives that support sustainable farming methods.
An examination of ESV across districts and counties revealed a consistent increase from 2000 to 2020. Xianyou County exhibited the most significant growth, reaching 4.186 billion CNY. Hanjiang District followed with 1.674 billion CNY, Chengxiang District with 1.103 billion CNY, Xiuyu District with 479 million CNY, and Licheng District with 304 million CNY. In terms of ESV intensity, Xianyou County and Hanjiang District exhibited a comparable upward trend. ESV intensity increased from 39,300 CNY/hm2 and 39,000 CNY/hm2 in 2000 to 62,000 CNY/hm2 and 61,200 CNY/hm2 in 2020, representing a growth of 57.83% and 56.94%, respectively. In contrast, Xiuyu District displayed the lowest ESV intensity, with a modest increase of 8600 CNY/hm2 over the past two decades, representing an average annual increase of 427.58 CNY/ha. Xiuyu District, characterized by extensive dry land, exhibited a relatively low ESV intensity. This implies that the transformation of ecological assets into economic value is not effective, indicating a suboptimal distribution of resources within the region, which results in a slow or ineffective urban development process. This is primarily due to the conversion of high-value land, e.g., cultivated land, into built-up land with a negative ESV. This underlying issue warrants serious consideration by the district government and scientists. The findings highlight the importance of optimizing land-use patterns and promoting sustainable development strategies in Xiuyu District to enhance ESV intensity and achieve a more equitable distribution of ESs across Putian City.
5.3. Spatial Pattern of the ESV
The study revealed that Grade I and II low ecosystem services value areas constituted a small proportion of the city’s land area and were primarily concentrated in densely populated areas with intensive human activities, such as the Licheng and Xiuyu Districts. This finding further corroborates the earlier observation that the inefficient allocation of resources in these newly developed regions led to reduced urbanization and ecological efficiency. Grade III medium ecosystem services value areas were more prevalent, predominantly encompassing Xianyou County and Hanjiang District. These areas featured elevated forest cover, a substantial proportion of forest land, and relatively developed fruit and understory forest economic industries. Grade IV and V high ecosystem services value areas were primarily concentrated in the Xinghua Plain, situated along the lower reaches of the Mulan River. These regions, endowed with abundant water resources, served as Putian’s principal agricultural production zones for food, vegetables, and aquatic products. The superior ecological environment of these areas contributed to their higher ESV.
The ESV evolution patterns in Putian City revealed that Level II and III ESV remained relatively stable overall from 2000 to 2020, while Level I, IV, and V ESV areas expanded. This indicates that Putian City actively responded to the national “three districts and three lines” policy, placing significant emphasis on spatial planning and national land utilization management, achieving notable outcomes. Nevertheless, it was observed that there was a slow decrease in the ESV in the majority of regions within the Licheng and Xiuyu Districts. This downturn was mainly due to the transformation of a large portion of agricultural and grassland into land for development between the years 2000 and 2020. Consequently, this resulted in an ongoing drop in the provisioning services within these districts. Additionally, local spatial autocorrelation analysis revealed a concentration of high-high ESV agglomerations in the central part of Putian City and coastal areas of Hanjiang District, characterized by flat topography and extensive cultivated land, grassland, and water bodies. Conversely, low-low ESV agglomerations were most prevalent, primarily encompassing Xianyou County in the southwest of Putian City, Xiuyu District in the coastal region, and Licheng District in the city center. These areas exhibited high population densities and significant urbanization levels, prioritizing rapid economic growth over ecosystem protection, resulting in low regional ESV intensity. High-low and low-high ESV agglomerations were less widespread, scattered around their high-high and low-low counterparts. These agglomerations were primarily located at the interface of forest land, cultivated land, and orchard land, with a notable presence in the Mulan River’s northern mountainous region. To tackle the variances in ESV, the following suggestions are made to the Putian Municipal Government: (a) In regions where high ESV concentrations are present, it is advised to strategically ease limitations on development for production and residential purposes, all the while preserving the ecological area. (b) In zones characterized by low ESV clusters, the focus should be on ecological rehabilitation via tree planting initiatives, converting cultivated land back to forest, and the creation of nature reserves. (c) For areas that show minimal correlation in ESV intensity, it is crucial to enhance ecological conservation efforts and broaden the scope of ecological preservation.
5.4. Ecosystem Services Tradeoffs and Synergies Degree
The study findings indicated that regulating, supporting, and cultural services exhibited a significant synergistic relationship, with the highest synergy observed between regulating and supporting services. The synergy degree between supporting and cultural services was lower and diminished over time. In contrast, provisioning services demonstrated a trade-off relationship with regulating, supporting, and cultural services, with the trade-off degree escalating with time, particularly between provisioning and regulating services. Among secondary ecosystem services, the trade-off between water supply and maintaining nutrient cycling was the most pronounced, while the trade-off between hydrologic adjustment and water supply was the least evident. Simultaneously, the synergy between material production and hydrologic adjustment was the weakest, while the synergy between maintaining nutrient cycling and hydrologic adjustment was the most prominent. Overall, while synergy remained the dominant relationship among ecosystem services, the trade-off pattern exhibited an expanding tendency. This observation underscores the detrimental impacts on regional ecology associated with the conversion of high-ESV cultivated land to negative-ESV built-up land.
5.5. Ecosystem Services Tradeoffs and Synergies Degree
The research results revealed that, the harmony between the ecological environment and economic development in Putian City from 2000 to 2020 was in a potential crisis area and had a downward trend. This indicated that the land utilization practices in Putian City were detrimental to the area’s economic growth. It also revealed that economic progress had resulted in the irrational exploitation of land assets, posing an ongoing threat to the sustainability of the ecological-economic framework. It can be seen that whether the land use is reasonable or not will inevitably affect the ecosystem services and their value realization, and thus affect the sustainable development of the social economy. Other research results have the same opinion as ours [27]. Thus, it is necessary to further strengthen the research on optimization and improvement of ecosystem services in the whole region, especially to attach importance to the construction of the ecological source and ecological protective screen of the widely distributed low-low agglomeration areas in the city, enhance ESV intensity, and promote harmonized and sustainable development in Putian City.
6. Conclusions
This study took Putian City, China, as the research area to explore the response characteristics of the ecosystem to land-use changes (LUCs) and their impact mechanisms during 2000–2020. Accordingly, the conclusions are as follows:
- (1)
- The spatial distribution of Tupu units, which represent LUCs in Putian City, showed significant variations, with the most pronounced alterations observed in the areas of cultivated land and grassland.
- (2)
- The spatial pattern of ESV evolution and the overall service supply capacity change in Putian were the ultimate outcomes of LUCs.
- (3)
- The ESV of Putian City exhibited a distinct spatial pattern. And ES relationships revealed a prevailing synergistic pattern, while the degree of trade-off exhibited a rising trend.
- (4)
- The ecological environment and economic progress in Putian City collectively faced a region of potential risk.
To sum up, ESV exhibits a dynamic interplay within the overarching ecological process, mirroring the transformations between social development and land-use patterns in the study area. This study, while providing a comprehensive analysis of land-use changes (LUCs) and their impact on ecosystem services value (ESV) in Putian City, has several limitations. Firstly, the reliance on remote sensing data for land-use classification, although a standard approach, may not capture the full complexity of LUCs at finer scales. Meanwhile, the benefit transfer method used for ESV assessment is subject to uncertainties due to the variability in local ecological conditions and economic values. Additionally, while ecosystems offer a multitude of services, they can also trigger trade-offs or degradation in other services, potentially leading to negative environmental consequences. This study does not include the negative services provided by the ecosystem in the evaluation system. Hence, future research could incorporate higher-resolution imagery and ground-truth data to refine land-use classifications. And an urgent need exists to develop a framework and methodology that can assess the net value of ecosystem services, enabling informed resource allocation decisions. Moreover, future studies could also benefit from integrating local knowledge and stakeholder perspectives to better understand the human dimensions of LUCs and their impacts on ESV.
Author Contributions
Conceptualization, K.S.; methodology, Q.P. and K.S.; software, Q.P. and K.S.; formal analysis, Q.P. and K.S.; investigation, Q.P., D.W. and K.S.; data curation, Q.P. and S.F.; writing—original draft preparation, Q.P.; writing—review and editing, K.S., S.F. and W.L.; visualization, Q.P., D.W. and K.S.; supervision, W.L. and S.F.; project administration, S.F.; funding acquisition, S.F., W.L. and K.S. All authors have read and agreed to the published version of the manuscript.
Funding
This research was funded by the Humanity and Social Science Foundation of Ministry of Education of China (Grant No. 23YJCZH192), Natural Science Foundation of Fujian Province (Grant No. 2021J01650), Major Project Funding for Social Science Research Base in Fujian Province Social Science Planning: Ecological Civilization Research Center (Grant No. FJ2022JDZ035), Key Program of New Think Tank in Fujian Province (Grant No. 24MZKB38), Joint Program on Innovation Strategy Research in Fujian Province (Grant No. 2023R0147), and National Scientific Research Project Cultivation Plan of Anxi College of Tea Science of Fujian Agricultural and Forestry University (Grant No. ACKY2023011).
Institutional Review Board Statement
Not applicable.
Informed Consent Statement
Not applicable.
Data Availability Statement
The data that support the findings of this study are available from the authors upon reasonable request.
Acknowledgments
The authors also thank “Fujian Provincial Key Laboratory of Agroecological Processing and Safety Monitoring” and “Fujian-Taiwan Joint Innovative Centre for Gersmplasm Resources and Cultivation of Crop” for their support.
Conflicts of Interest
The authors declare no conflicts of interest.
References
- Foley, J.; Defries, R.; Asner, G.; Barford, C.; Bonan, G.; Carpenter, S.; Chapin, F.S., III; Coe, M.; Daily, G.; Gibbs, H.; et al. Global Consequences of Land Use. Science 2005, 309, 570–574. [Google Scholar] [CrossRef] [PubMed]
- Gibson, L.; Lee, T.M.; Koh, L.P.; Brook, B.W.; Gardner, T.A.; Barlow, J.; Peres, C.A.; Bradshaw, C.J.A.; Laurance, W.F.; Lovejoy, T.E.; et al. Primary Forests Are Irreplaceable for Sustaining Tropical Biodiversity. Nature 2011, 478, 378–381. [Google Scholar] [CrossRef]
- Peng, K.; Jiang, W.; Ling, Z.; Hou, P.; Deng, Y. Evaluating the Potential Impacts of Land Use Changes on Ecosystem Service Value under Multiple Scenarios in Support of SDG Reporting: A Case Study of the Wuhan Urban Agglomeration. J. Clean. Prod. 2021, 307, 127321. [Google Scholar] [CrossRef]
- Su, K.; Wei, D.; Lin, W. Evaluation of Ecosystem Services Value and Its Implications for Policy Making in China—A Case Study of Fujian Province. Ecol. Indic. 2020, 108, 105752. [Google Scholar] [CrossRef]
- Jiang, Z.; Gan, X.; Liu, J.; Bi, X.; Kang, A.; Zhou, B. Landscape Ecological Risk Assessment and Zoning Control Based on Ecosystem Service Value: Taking Sichuan Province as an Example. Appl. Sci. 2023, 13, 12103. [Google Scholar] [CrossRef]
- Costanza, R.; Limburg, K.; Naeem, S.; O’Neill, R.V.; Paruelo, J.; Raskin, R.G.; Sutton, P. The Value of the World’s Ecosystem Services and Natural Capital. Nature 1997, 387, 253–260. [Google Scholar] [CrossRef]
- Daily, G.C.; Matson, P.A. Ecosystem Services: From Theory to Implementation. Proc. Natl. Acad. Sci. USA 2008, 105, 9455–9456. [Google Scholar] [CrossRef] [PubMed]
- Xie, G.; Zhang, C.; Zhang, L.; Chen, W.; Li, S. Improvement of the evaluation method for ecosystem service value based on per unit area. J. Nat. Resour. 2015, 30, 1243–1254. [Google Scholar]
- Sonter, L.J.; Johnson, J.A.; Nicholson, C.C.; Richardson, L.L.; Watson, K.B.; Ricketts, T.H. Multi-Site Interactions: Understanding the Offsite Impacts of Land Use Change on the Use and Supply of Ecosystem Services. Ecosyst. Serv. 2017, 23, 158–164. [Google Scholar] [CrossRef]
- Shoemaker, D.A.; BenDor, T.K.; Meentemeyer, R.K. Anticipating Trade-Offs between Urban Patterns and Ecosystem Service Production: Scenario Analyses of Sprawl Alternatives for a Rapidly Urbanizing Region. Comput. Environ. Urban Syst. 2019, 74, 114–125. [Google Scholar] [CrossRef]
- Liao, C.; Yue, Y.; Wang, K.; Fensholt, R.; Tong, X.; Brandt, M. Ecological Restoration Enhances Ecosystem Health in the Karst Regions of Southwest China. Ecol. Indic. 2018, 90, 416–425. [Google Scholar] [CrossRef]
- Tolessa, T.; Senbeta, F.; Kidane, M. The Impact of Land Use/Land Cover Change on Ecosystem Services in the Central Highlands of Ethiopia. Ecosyst. Serv. 2017, 23, 47–54. [Google Scholar] [CrossRef]
- Chen, W.; Chi, G. Urbanization and Ecosystem Services: The Multi-Scale Spatial Spillover Effects and Spatial Variations. Land Use Policy 2022, 114, 105964. [Google Scholar] [CrossRef]
- Dreoni, I.; Matthews, Z.; Schaafsma, M. The Impacts of Soy Production on Multi-Dimensional Well-Being and Ecosystem Services: A Systematic Review. J. Clean. Prod. 2022, 335, 130182. [Google Scholar] [CrossRef]
- Liu, W.; Zhan, J.; Zhao, F.; Wang, C.; Zhang, F.; Teng, Y.; Chu, X.; Kumi, M.A. Spatio-Temporal Variations of Ecosystem Services and Their Drivers in the Pearl River Delta, China. J. Clean. Prod. 2022, 337, 130466. [Google Scholar] [CrossRef]
- Meena, R.S.; Yadav, A.; Kumar, S.; Jhariya, M.K.; Jatav, S.S. Agriculture Ecosystem Models for CO2 Sequestration, Improving Soil Physicochemical Properties, and Restoring Degraded Land. Ecol. Eng. 2022, 176, 106546. [Google Scholar] [CrossRef]
- Rosenfield, M.F.; Miedema Brown, L.; Anand, M. Increasing Cover of Natural Areas at Smaller Scales Can Improve the Provision of Biodiversity and Ecosystem Services in Agroecological Mosaic Landscapes. J. Environ. Manag. 2022, 303, 114248. [Google Scholar] [CrossRef]
- Fu, B.; Wang, S.; Su, C.; Forsius, M. Linking Ecosystem Processes and Ecosystem Services. Curr. Opin. Environ. Sustain. 2013, 5, 4–10. [Google Scholar] [CrossRef]
- Zhu, L.; Song, R.; Sun, S.; Li, Y.; Hu, K. Land Use/Land Cover Change and Its Impact on Ecosystem Carbon Storage in Coastal Areas of China from 1980 to 2050. Ecol. Indic. 2022, 142, 109178. [Google Scholar] [CrossRef]
- Abijith, D.; Saravanan, S. Assessment of Land Use and Land Cover Change Detection and Prediction Using Remote Sensing and CA Markov in the Northern Coastal Districts of Tamil Nadu, India. Env. Sci Pollut Res 2022, 29, 86055–86067. [Google Scholar] [CrossRef]
- Xin, X.; Zhang, T.; He, F.; Zhang, W.; Chen, K. Assessing and Simulating Changes in Ecosystem Service Value Based on Land Use/Cover Change in Coastal Cities: A Case Study of Shanghai, China. Ocean Coast. Manag. 2023, 239, 106591. [Google Scholar] [CrossRef]
- Zhang, X.; Ning, J. Land Use Change in Coastal Zones of China from 1985 to 2020. Front. Mar. Sci. 2024, 11, 1323032. [Google Scholar] [CrossRef]
- Li, S.; Bing, Z.; Jin, G. Spatially Explicit Mapping of Soil Conservation Service in Monetary Units Due to Land Use/Cover Change for the Three Gorges Reservoir Area, China. Remote Sens. 2019, 11, 468. [Google Scholar] [CrossRef]
- Zhu, Z.; Fu, W.; Liu, Q. Correlation between Urbanization and Ecosystem Services in Xiamen, China. Environ. Dev. Sustain. 2020, 23, 101–121. [Google Scholar] [CrossRef]
- Wang, X.C.; Dong, X.B.; Liu, H.M.; Wei, H.J.; Fan, W.G.; Lu, N.C.; Xu, Z.H.; Ren, J.H.; Xing, K.X. Linking Land Use Change, Ecosystem Services and Human Well-Being: A Case Study of the Manas River Basin of Xinjiang, China. Ecosyst. Serv. 2017, 27, 113–123. [Google Scholar] [CrossRef]
- Xue, L.Q.; Zhu, B.L.; Wu, Y.P.; Wei, G.H.; Liao, S.M.; Yang, C.B.; Wang, J.; Zhang, H.; Ren, L.; Han, Q. Dynamic Projection of Ecological Risk in the Manas River Basin Based on Terrain Gradients. Sci. Total Environ. 2019, 653, 283–293. [Google Scholar] [CrossRef] [PubMed]
- Hong, X.; Peng, Q.; Zheng, R.; Lin, W.; Fan, S.; Su, K. Evaluating the Spatial Evolution of the Eco-Economy Harmony in Anxi County, China, Based on Ecosystem Services Value. Sustainability 2024, 16, 1491. [Google Scholar] [CrossRef]
- Lawler, J.J.; Lewis, D.J.; Nelson, E.; Plantinga, A.J.; Polasky, S.; Withey, J.C.; Helmers, D.P.; Martinuzzi, S.; Pennington, D.; Radeloff, V.C. Projected Land-Use Change Impacts on Ecosystem Services in the United States. Proc. Natl. Acad. Sci. USA 2014, 111, 7492–7497. [Google Scholar] [CrossRef]
- Schirpke, U.; Tasser, E.; Borsky, S.; Braun, M.; Eitzinger, J.; Gaube, V.; Getzner, M.; Glatzel, S.; Gschwantner, T.; Kirchner, M.; et al. Past and Future Impacts of Land-Use Changes on Ecosystem Services in Austria. J. Environ. Manag. 2023, 345, 118728. [Google Scholar] [CrossRef]
- Barati, A.A.; Zhoolideh, M.; Azadi, H.; Lee, J.-H.; Scheffran, J. Interactions of Land-Use Cover and Climate Change at Global Level: How to Mitigate the Environmental Risks and Warming Effects. Ecol. Indic. 2023, 146, 109829. [Google Scholar] [CrossRef]
- Kang, J.; Li, C.; Zhang, B.; Zhang, J.; Li, M.; Hu, Y. How Do Natural and Human Factors Influence Ecosystem Services Changing? A Case Study in Two Most Developed Regions of China. Ecol. Indic. 2023, 146, 109891. [Google Scholar] [CrossRef]
- Hasan, S.S.; Zhen, L.; Miah, M.; Ahamed, T.; Samie, A. Impact of Land Use Change on Ecosystem Services: A Review. Environ. Dev. 2020, 34, 100527. [Google Scholar] [CrossRef]
- Belaire, J.A.; Higgins, C.; Zoll, D.; Lieberknecht, K.; Bixler, R.P.; Neff, J.L.; Keitt, T.H.; Jha, S. Fine-Scale Monitoring and Mapping of Biodiversity and Ecosystem Services Reveals Multiple Synergies and Few Tradeoffs in Urban Green Space Management. Sci. Total Environ. 2022, 849, 157801. [Google Scholar] [CrossRef] [PubMed]
- Liang, S.; Yang, F.; Zhang, J.; Xiong, S.; Xu, Z. Assessment and Management Zoning of Ecosystem Service Trade-Off/Synergy Based on the Social–Ecological Balance: A Case of the Chang-Zhu-Tan Metropolitan Area. Land 2024, 13, 127. [Google Scholar] [CrossRef]
- Xu, F.; Chen, S.; Wang, X.; Wang, X. Spatio-Temporal Changes and Trade-Offs/Synergies among Ecosystem Services in Beijing from 2000 to 2020. Forests 2023, 14, 2314. [Google Scholar] [CrossRef]
- Bennett, E.M.; Peterson, G.D.; Gordon, L.J. Understanding Relationships among Multiple Ecosystem Services. Ecol. Lett. 2009, 12, 1394–1404. [Google Scholar] [CrossRef] [PubMed]
- Gong, J.; Liu, D.; Zhang, J.; Xie, Y.; Cao, E.; Li, H. Tradeoffs/Synergies of Multiple Ecosystem Services Based on Land Use Simulation in a Mountain-Basin Area, Western China. Ecol. Indic. 2019, 99, 283–293. [Google Scholar] [CrossRef]
- Caro, C.; Marques, J.C.; Cunha, P.P.; Teixeira, Z. Ecosystem Services as a Resilience Descriptor in Habitat Risk Assessment Using the InVEST Model. Ecol. Indic. 2020, 115, 106426. [Google Scholar] [CrossRef]
- Liu, C.; Sun, W.; Li, M. Evolution of Ecosystem Service Value in Rural Regions Based on Geographical Scope of Entities: A Case Study of Nanjing, China. Ecol. Inform. 2021, 64, 101368. [Google Scholar] [CrossRef]
- Nedkov, S.; Campagne, S.; Borisova, B.; Krpec, P.; Prodanova, H.; Kokkoris, I.P.; Hristova, D.; Le Clec’h, S.; Santos-Martin, F.; Burkhard, B.; et al. Modeling Water Regulation Ecosystem Services: A Review in the Context of Ecosystem Accounting. Ecosyst. Serv. 2022, 56, 101458. [Google Scholar] [CrossRef]
- Nti, E.K.; Cobbina, S.J.; Attafuah, E.E.; Opoku, E.; Gyan, M.A. Environmental Sustainability Technologies in Biodiversity, Energy, Transportation and Water Management Using Artificial Intelligence: A Systematic Review. Sustain. Futures 2022, 4, 100068. [Google Scholar] [CrossRef]
- Sannigrahi, S.; Zhang, Q.; Joshi, P.K.; Sutton, P.C.; Keesstra, S.; Roy, P.S.; Pilla, F.; Basu, B.; Wang, Y.; Jha, S.; et al. Examining Effects of Climate Change and Land Use Dynamic on Biophysical and Economic Values of Ecosystem Services of a Natural Reserve Region. J. Clean. Prod. 2020, 257, 120424. [Google Scholar] [CrossRef]
- Capriolo, A.; Boschetto, R.G.; Mascolo, R.A.; Balbi, S.; Villa, F. Biophysical and Economic Assessment of Four Ecosystem Services for Natural Capital Accounting in Italy. Ecosyst. Serv. 2020, 46, 101207. [Google Scholar] [CrossRef]
- Costanza, R.; de Groot, R.; Braat, L.; Kubiszewski, I.; Fioramonti, L.; Sutton, P.; Farber, S.; Grasso, M. Twenty Years of Ecosystem Services: How Far Have We Come and How Far Do We Still Need to Go? Ecosyst. Serv. 2017, 28, 1–16. [Google Scholar] [CrossRef]
- Ouyang, Z.; Song, C.; Zheng, H.; Polasky, S.; Xiao, Y.; Bateman, I.J.; Liu, J.; Ruckelshaus, M.; Shi, F.; Xiao, Y.; et al. Using Gross Ecosystem Product (GEP) to Value Nature in Decision Making. Proc. Natl. Acad. Sci. USA 2020, 117, 14593–14601. [Google Scholar] [CrossRef] [PubMed]
- de Groot, R.; Brander, L.; van der Ploeg, S.; Costanza, R.; Bernard, F.; Braat, L.; Christie, M.; Crossman, N.; Ghermandi, A.; Hein, L.; et al. Global Estimates of the Value of Ecosystems and Their Services in Monetary Units. Ecosyst. Serv. 2012, 1, 50–61. [Google Scholar] [CrossRef]
- Jiang, W.; Wu, T.; Fu, B. The Value of Ecosystem Services in China: A Systematic Review for Twenty Years. Ecosyst. Serv. 2021, 52, 101365. [Google Scholar] [CrossRef]
- Tan, Z.; Guan, Q.; Lin, J.; Yang, L.; Luo, H.; Ma, Y.; Tian, J.; Wang, Q.; Wang, N. The Response and Simulation of Ecosystem Services Value to Land Use/Land Cover in an Oasis, Northwest China. Ecol. Indic. 2020, 118, 106711. [Google Scholar] [CrossRef]
- Wang, J.; Peng, J.; Zhao, M.; Liu, Y.; Chen, Y. Significant Trade-off for the Impact of Grain-for-Green Programme on Ecosystem Services in North-Western Yunnan, China. Sci. Total Environ. 2017, 574, 57–64. [Google Scholar] [CrossRef] [PubMed]
- Xie, Z.; Li, X.; Chi, Y.; Jiang, D.; Zhang, Y.; Ma, Y.; Chen, S. Ecosystem Service Value Decreases More Rapidly under the Dual Pressures of Land Use Change and Ecological Vulnerability: A Case Study in Zhujiajian Island. Ocean Coast. Manag. 2021, 201, 105493. [Google Scholar] [CrossRef]
- Chan, K.M.A.; Shaw, M.R.; Cameron, D.R.; Underwood, E.C.; Daily, G.C. Conservation Planning for Ecosystem Services. PLoS Biol. 2006, 4, e379. [Google Scholar] [CrossRef] [PubMed]
- Li, R.; Shi, Y.; Feng, C.-C.; Guo, L. The Spatial Relationship between Ecosystem Service Scarcity Value and Urbanization from the Perspective of Heterogeneity in Typical Arid and Semiarid Regions of China. Ecol. Indic. 2021, 132, 108299. [Google Scholar] [CrossRef]
- Rodríguez, J.P.; Beard, T.D.; Bennett, E.M.; Cumming, G.S.; Cork, S.J.; Agard, J.; Dobson, A.P.; Peterson, G.D. Trade-Offs across Space, Time, and Ecosystem Services. Ecol. Soc. 2006, 11, 28. [Google Scholar] [CrossRef]
- Yang, Y.; Li, M.; Feng, X.; Yan, H.; Su, M.; Wu, M. Spatiotemporal Variation of Essential Ecosystem Services and Their Trade-off/Synergy along with Rapid Urbanization in the Lower Pearl River Basin, China. Ecol. Indic. 2021, 133, 108439. [Google Scholar] [CrossRef]
- Han, Q.; Li, L.; Wei, H.; Wu, X. Identifying the Relationships between Landscape Pattern and Ecosystem Service Value from a Spatiotemporal Variation Perspective in a Mountain–Hill–Plain Region. Forests 2023, 14, 2446. [Google Scholar] [CrossRef]
- Liu, L. A Sustainability Index with Attention to Environmental Justice for Eco-City Classification and Assessment. Ecol. Indic. 2018, 85, 904–914. [Google Scholar] [CrossRef]
- Fu, B.; Zhang, L. Land-use change and ecosystem services: Concepts, methods and progress. Prog. Geogr. 2014, 33, 441–446. [Google Scholar] [CrossRef]
- Narducci, J.; Quintas-Soriano, C.; Castro, A.; Som-Castellano, R.; Brandt, J.S. Implications of Urban Growth and Farmland Loss for Ecosystem Services in the Western United States. Land Use Policy 2019, 86, 1–11. [Google Scholar] [CrossRef]
- Kong, X.; Han, M.; Li, Y.; Kong, F.; Sun, J.; Zhu, W.; Wei, F. Spatial Differentiation and Formation Mechanism of Ecological Sensitivity in Large River Basins: A Case Study of the Yellow River Basin, China. Ecol. Indic. 2024, 158, 111571. [Google Scholar] [CrossRef]
- Chen, W.; Zhao, H.; Li, J.; Zhu, L.; Wang, Z.; Zeng, J. Land Use Transitions and the Associated Impacts on Ecosystem Services in the Middle Reaches of the Yangtze River Economic Belt in China Based on the Geo-Informatic Tupu Method. Sci. Total Environ. 2020, 701, 134690. [Google Scholar] [CrossRef]
- Wang, Y.; Zhang, Z.; Chen, X. Land Use Transitions and the Associated Impacts on Carbon Storage in the Poyang Lake Basin, China. Remote Sens. 2023, 15, 2703. [Google Scholar] [CrossRef]
- Xing, J.; Zhang, J.; Wang, J.; Li, M.; Nie, S.; Qian, M. Ecological Restoration in the Loess Plateau, China Necessitates Targeted Management Strategy: Evidence from the Beiluo River Basin. Forests 2023, 14, 1753. [Google Scholar] [CrossRef]
- Long, H.; Yuan, L.; Yin, Z.; Wu, X. Spatiotemporal of Ecosystem Service Values Response to Land Use/Cover Change Based on Geo-Informatic Tupu—A Case Study in Tianjin, China. Ecol. Indic. 2023, 154, 110511. [Google Scholar] [CrossRef]
- Tanner, M.K.; Moity, N.; Costa, M.T.; Marin Jarrin, J.R.; Aburto-Oropeza, O.; Salinas-de-León, P. Mangroves in the Galapagos: Ecosystem Services and Their Valuation. Ecol. Econ. 2019, 160, 12–24. [Google Scholar] [CrossRef]
- Han, J.; Hu, Z.; Wang, P.; Yan, Z.; Li, G.; Zhang, Y.; Zhou, T. Spatio-Temporal Evolution and Optimization Analysis of Ecosystem Service Value—A Case Study of Coal Resource-Based City Group in Shandong, China. J. Clean. Prod. 2022, 363, 132602. [Google Scholar] [CrossRef]
- He, Z.; Shang, X.; Zhang, T.; Yun, J. Coupled Regulatory Mechanisms and Synergy/Trade-off Strategies of Human Activity and Climate Change on Ecosystem Service Value in the Loess Hilly Fragile Region of Northern Shaanxi, China. Ecol. Indic. 2022, 143, 109325. [Google Scholar] [CrossRef]
- Zhou, L.; Zhang, H.; Bi, G.; Su, K.; Wang, L.; Chen, H.; Yang, Q. Multiscale Perspective Research on the Evolution Characteristics of the Ecosystem Services Supply-Demand Relationship in the Chongqing Section of the Three Gorges Reservoir Area. Ecol. Indic. 2022, 142, 109227. [Google Scholar] [CrossRef]
- Stoeckl, N.; Condie, S.; Anthony, K. Assessing Changes to Ecosystem Service Values at Large Geographic Scale: A Case Study for Australia’s Great Barrier Reef. Ecosyst. Serv. 2021, 51, 101352. [Google Scholar] [CrossRef]
- Su, K.; Wei, D.; Lin, W. Regional differences and spatial patterns of urbanization efficiency in Fujian Province, China. Acta Ecol. Sin. 2019, 39, 5450–5459. [Google Scholar]
- Peng, Q.; Wu, D.; Lin, W.; Fan, S.; Su, K. Land-Use Transitions and Its Driving Mechanism Analysis in Putian City, China, during 2000–2020. Sustainability 2024, 16, 3549. [Google Scholar] [CrossRef]
- Li, S.; Cao, Y.; Liu, J.; Wang, S.; Zhou, W. Assessing Spatiotemporal Dynamics of Land Use and Cover Change and Carbon Storage in China’s Ecological Conservation Pilot Zone: A Case Study in Fujian Province. Remote Sens. 2022, 14, 4111. [Google Scholar] [CrossRef]
- Gao, P.; Niu, X.; Wang, B.; Zheng, Y.L. Land Use Changes and Its Driving Forces in Hilly Ecological Restoration Area Based on Gis and Rs of Northern China. Sci. Rep. 2015, 5, 11038. [Google Scholar] [CrossRef]
- Millennium Ecosystem Assessment (MEA). Ecosystems and Human Well-Being: Synthesis; Island Press: Washington, DC, USA, 2005; ISBN 1-59726-040-1. [Google Scholar]
- Shen, J.S.; Li, S.C.; Liang, Z.; Liu, L.B.; Li, D.L.; Wu, S.Y. Exploring the Heterogeneity and Nonlinearity of Trade-Offs and Synergies among Ecosystem Services Bundles in the Beijing-Tianjin-Hebei Urban Agglomeration. Ecosyst. Serv. 2020, 43, 101103. [Google Scholar] [CrossRef]
- Anselin, L. Interactive Techniques & Exploratory Spatial Data Analysis; John Wiley & Sons Press: Hoboken, NJ, USA, 1999. [Google Scholar]
- Tamiminia, H.; Salehi, B.; Mahdianpari, M.; Quackenbush, L.; Adeli, S.; Brisco, B. Google Earth Engine for Geo-Big Data Applications: A Meta-Analysis and Systematic Review. ISPRS J. Photogramm. Remote Sens. 2020, 164, 152–170. [Google Scholar] [CrossRef]
- Arafat, Y.; Tayyab, M.; Khan, M.U.; Chen, T.; Amjad, H.; Awais, S.; Lin, X.; Lin, W.; Lin, S. Long-Term Monoculture Negatively Regulates Fungal Community Composition and Abundance of Tea Orchards. Agronomy 2019, 9, 466. [Google Scholar] [CrossRef]
- Liu, Y.; Liu, Y.; Zeng, C.; Wang, J.; Nyimbo, W.J.; Jiao, Y.; Wu, L.; Chen, T.; Fang, C.; Lin, W. Intercropping with Achyranthes Bidentata Alleviates Rehmannia Glutinosa Consecutive Monoculture Problem by Reestablishing Rhizosphere Microenvironment. Front. Plant Sci. 2022, 13, 1041561. [Google Scholar] [CrossRef]
- Zhang, Y.; Peng, J.; Wang, J.; Yang, H. Analysis on spatial and temporal change of land use in Jianghan Plain based on Geo-information Atlas. Res. Soil Water Conserv. 2020, 27, 85–92+2. [Google Scholar] [CrossRef]
- Li, B.; Griffith, D.A. The Moran Spectrum as a Geoinformatic Tupu: Implications for the First Law of Geography. Ann. GIS 2022, 28, 69–83. [Google Scholar] [CrossRef]
Disclaimer/Publisher’s Note: The statements, opinions and data contained in all publications are solely those of the individual author(s) and contributor(s) and not of MDPI and/or the editor(s). MDPI and/or the editor(s) disclaim responsibility for any injury to people or property resulting from any ideas, methods, instructions or products referred to in the content. |
© 2024 by the authors. Licensee MDPI, Basel, Switzerland. This article is an open access article distributed under the terms and conditions of the Creative Commons Attribution (CC BY) license (https://creativecommons.org/licenses/by/4.0/).