Abstract
In the mosaic creation of multiple high-resolution synthetic aperture radar (SAR) images, achieving an optimal seamline in overlapping areas is crucial for seamless and visually satisfactory results. Many existing seamline generation methods are designed primarily for optical remote sensing images, but due to the differing characteristics of SAR images and optical images, applying these methods directly to SAR images poses challenges in finding the optimal seamline. In response, this paper proposes a segmentation-based optimal seamline generation (SOSG) method for SAR image mosaics. The SOSG method involves a multi-step process. First, SAR image joint segmentation is performed within the overlapping areas. Subsequently, homogeneous areas are identified based on the segmentation results. Following this, a pixel cost matrix is constructed, incorporating homogeneous areas and intensity differences. Finally, the minimum path cost from the starting pixel to the end pixel is computed using the Dijkstra algorithm to determine the optimal path. To assess the feasibility and effectiveness of the proposed method, experiments are conducted using multiple SAR images from the Chinese Gaofen-3 01 satellite as datasets. The experimental results demonstrate that the proposed method yields seamless mosaic images when compared to other methods, while delivering satisfactory outcomes. This indicates the potential of the proposed method in addressing the unique challenges posed by SAR images and enhancing the quality of SAR image mosaics.
1. Introduction
The emergence of synthetic aperture radar (SAR) technology marks a significant advancement in Earth observation, offering high-resolution imaging capabilities independent of weather conditions and daylight. SAR’s unique advantages make it a powerful tool in applications such as resource exploration [1], environmental monitoring [2], disaster assessment [3], ocean monitoring [4], and mapping [5]. Its contribution has elevated SAR to a crucial role in high-resolution Earth observation and global resource management. As the range of SAR applications continues to expand across diverse fields, the demand for accurate image processing techniques becomes increasingly imperative.
In contemporary times, the proliferation of SAR images captured by numerous SAR satellites has led to the continuous accumulation of data in historical databases. This abundance of data provides extensive coverage of the region of interest (ROI). The limitation of SAR sensor design constrains the coverage of a single high-resolution image, necessitating the mosaic of multiple SAR images to achieve a broader coverage [6]. Particularly in the case of high-resolution SAR images, the coverage of a single image tends to be relatively limited. Addressing the diverse requirements of various research and applications has become progressively challenging due to these limitations. Consequently, the synthesis of a large-range SAR image is accomplished through the mosaicking of multiple SAR images. The mosaicking encompasses four key aspects [7]: SAR image registration, radiometric normalization, seamline generation, and image blending. SAR image registration is pivotal, ensuring consistent geometric alignment among multiple SAR images to be mosaicked. This alignment is fundamental for the success of the mosaicking process. Radiometric normalization plays a crucial role in minimizing radiometric inconsistencies between images within the SAR mosaic, ensuring visually satisfactory and coherent results. Seamline generation is an essential step in achieving a seamless mosaic and maintaining the integrity of ground objects. It involves determining the optimal location for the seamline among the images, considering factors such as geometry and radiometry. The generated seamlines serve as a basis for subsequent image blending. Image blending is the final step in the mosaicking process, aimed at eliminating slight radiometric differences near the seamlines. This enhances visual performance by creating a cohesive and aesthetically pleasing composite image. The comprehensive integration of these four aspects ensures the successful creation of large-range SAR mosaics that meet the diverse needs of various research and applications.
In the realm of remote sensing image mosaicking, the generation of seamline stands out as a crucial step, prompting extensive exploration by scholars. The seamline generation for multiple images commonly involves an initial seamline network, subsequently refined for optimal results [8]. Various methods have been devised for the initial seamline network using Voronoi diagrams. Hsu et al. [9] employed a conventional Voronoi diagram based on a point set and images as the face set, but it led to blank space at the boundary. Pan et al. [10] introduced a method using area Voronoi diagrams with overlap (AVDO), which proved efficient but showed limitations in handling complex polygons, especially concave ones. Another method proposed by Song et al. [11] utilized bounded Voronoi diagrams, employing geometric operations to crop diagrams for initial tessellations. However, this method involved numerous geometric operations, potentially leading to topological issues in the generated seamline. Yuan et al. [12] introduced a Voronoi centerline-based seamline network generation method; however, this had high computational effort and occasional failures when dealing with complex graphs. Recent years have witnessed the emergence of diverse seamline generation methods, broadly categorized into pixel-based, object-based, and auxiliary data-based methods. Pixel-based methods focus on constructing a cost matrix for the image’s overlapping area and selecting search strategies for optimal mosaic generation. Cost matrices commonly consider gray scale, texture, gradient differences, and other factors. Commonly used search strategies include dynamic programming algorithms [13], Dijkstra’s algorithm [14], bottleneck models [15], snake models [16], ant colony algorithms [17], and graph cut models [18]. For example, Kerschner [19] proposed an energy-minimizing method using the twin snakes model, yet faced challenges in non-convergence, particularly in forested areas. Chon et al. [20] employed Dijkstra’s algorithm and the minimax algorithm, but they required specified start and end points. Dong and Liu [21] used various graph-cutting methods for seamline generation. Meanwhile, Wang et al. [22] implemented a continuous space ant colony algorithm based on gray difference and gradient, albeit with limitations in optimizing the vertices of unordered paths. Object-based methods integrate object-level information, such as image segmentation, feature classification, and change detection, to refine seamline generation. Soille [23] utilized a watershed algorithm to segment images and identify seamlines along feature boundaries, mitigating potential mosaic seam issues. Other methods involve segmentation-based urban orthophoto mosaic generation [24], watershed segmentation-based optimization [25], and determining orthophoto seamlines using regional rate of change [26]. Additionally, superpixel segmentation has been applied, utilizing a graph cut algorithm to obtain optimal seamlines [27]. Auxiliary data-based methods leverage external information, such as point cloud data, digital surface models (DSM), and vector data, to guide seamline direction. Examples include using laser radar point cloud for seamline detection [28], road vector data for seamline determination [29], and elevation information from DSM for seamline direction [30]. Wang et al. [31] employed vector road maps to construct a weighted graph, using Dijkstra’s algorithm to find optimal paths as seamlines. In a similar vein, Yuan et al. [32] proposed determining seamlines based on road probability maps, obtained using a D-LinkNet neural network and post-processing. The preferred road areas are identified through binarizing the road probability maps in overlapping areas, and Dijkstra’s algorithm determines the optimal seamline.
Presently, the majority of seamline generation methods focuses on optical images, overlooking the distinct characteristic of SAR images, which are susceptible to random speckle noise inherent in SAR data, potentially impacting processing outcomes. Recognizing the limitations of pixel-based information in fully distinguishing feature targets and obtaining high-quality auxiliary data, an object-based method emerges as a suitable method for seamline generation. In response, a segmentation-based optimal seamline generation (SOSG) method for SAR image mosaics is proposed, aiming to create seamless SAR mosaic images. For multiple SAR images, the proposed SOSG method follows a systematic method. Initially, SAR image registration based on the rational function model and radiometric normalization processing is completed. Subsequently, joint segmentation of overlapping areas between images is implemented. Building on these joint segmentation results, the screening of homogeneous areas is performed. Then, under the constraint of homogeneous areas, the cost matrix is constructed by combining the intensity information of pixels. Finally, a shortest path search algorithm is employed to determine the optimal seamline within the cost matrix. This comprehensive method enhances the seamlessness of SAR mosaic images, considering the unique characteristics and challenges posed by SAR data. The SAR mosaic results with complete ground objects are helpful for subsequent image interpretation and analysis.
The main contributions are as follows:
- Introducing a SOSG method, this method is designed to identify optimal seamlines between SAR images, enhancing the seamlessness of the resulting mosaic and the integrity of ground targets.
- The method incorporates a joint segmentation technique and a clustering method for SAR images. This method forms the foundation for effectively classifying areas within SAR images as either homogeneous or non-homogeneous, providing a valuable basis for subsequent processing steps.
- Notably, the proposed SOSG method demonstrates an improvement in the quality of SAR image mosaics when compared to existing methods. This signifies the effectiveness and potential advancements introduced by the proposed method in the field of SAR image processing.
2. Materials and Methods
2.1. Overview
The procedural flow of this paper is visually represented in Figure 1. In the initial phase, registration and radiometric normalization procedures are applied to multiple single-look complex (SLC) images, representing the essential radiometric and geometric preprocessing stage crucial for mosaic creation. In the initial seamline network established through the AVDO method [10], each seamline is generated solely based on geometry, resulting in paths that traverse numerous feature targets, and hence may not be optimal. Recognizing the challenges associated with pixel-based information and the difficulty of obtaining high-quality auxiliary data, an object-based method emerges as a suitable alternative for seamline generation. The proposed SOSG model initiates with the joint segmentation of SAR images, followed by the screening of homogeneous areas, the construction of a cost matrix, and ultimately the generation of optimal seamlines. The final steps involve mosaicking and image blending processes, culminating in the formation of a comprehensive mosaic image. This comprehensive model aims to overcome the limitations of pixel-based methods and enhance the effectiveness of seamline generation in SAR image mosaicking.
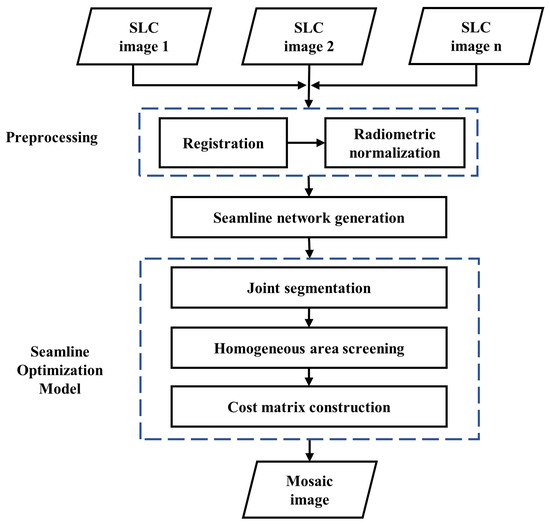
Figure 1.
Framework diagram of the proposed method.
2.2. Preprocessing and Seamline Network Generation
The fundamental task of mosaicking, image registration, involves aligning images acquired at different times and under diverse imaging conditions. In this paper, a geometry-aware image registration method [33] is employed. This method extracts intrinsic orientation features and prioritizes geometry-invariant areas, ensuring consistent geometry alignment among multiple SAR images slated for mosaicking. Following the registration step, a radiometric normalization method [34] rooted in the radiometric principles of SAR is applied to eliminate the radiometric differences between images.
Once the ortho-rectification of all SAR images is completed, the generation of the initial seamline network is executed using the AVDO method.
2.3. Segmentation-Based Optimal Seamline Generation Model
2.3.1. Joint Segmentation
During the processing of remote sensing image mosaicking, the geometric and radiometric differences between ortho-rectificated images make selecting the optimal seamline a challenge. The goal is to circumvent areas with significant discrepancies, thus ensuring the visual effect and the integrity of geographic targets in the mosaic images. Furthermore, the selection and optimization of the seamline are not only critical steps in the mosaicking procedure but are also complicated. Traditional methods mainly rely on pixels or blocks as the basic processing units, employing a pixel-by-pixel path search strategy across the entire overlap area. To achieve optimal mosaicking, a segmentation-based method is employed to partition the overlap areas to extract consistency parcels. This ensures the radiometric and geometric consistency of signification features across overlap areas.
Unlike traditional segmentation-based seamline extraction techniques, this paper employs joint segmentation of SAR images to process the overlapping areas. For individual image segmentation, the fractal net evolution approach (FNEA) is used to generate superpixels [35]. FNEA is a bottom-up area-merging algorithm that uses spectral and shape features to describe each parcel. The essence of FNEA lies in its merging rule, which prioritizes the combination of adjacent parcel pairs that minimizes the heterogeneity increment upon merging. The merging criterion is described as follows:
where h indicates the heterogeneity increment, which is calculated as the weighted sum of spectral heterogeneity, , and shape heterogeneity, . is derived from the weighted standard deviation of each of the channels, while consists of the compactness and smoothness of the parcels, with detailed calculations found in reference [35]. T represents a predefined threshold.
Image mosaicking involves processing multiple images, which requires ensuring that the segmentation results remain consistent across overlap images. To achieve this, a joint segmentation strategy is introduced to establish an interaction between each individual image segmentation procedure and produce a common segmentation result. Consider two images denoted as and , with segmentation procedures employing thresholds and , respectively. The FNEA is then executed according to the following joint strategy:
where and denote the heterogeneity increment calculated from and , respectively. The joint strategy describes the implication that the parcel pairs can only be merged if the merging conditions in both and are simultaneously met. The benefit of the joint segmentation method is that the radiometric consistency and geometric integrity of segmented parcels in single images can be improved. Meanwhile, the geographic target’s consistency across overlap images can be maintained. Moreover, this method can be easily extended to more images. Figure 2 illustrates the comparison between the traditional segmentation and joint segmentation frameworks.
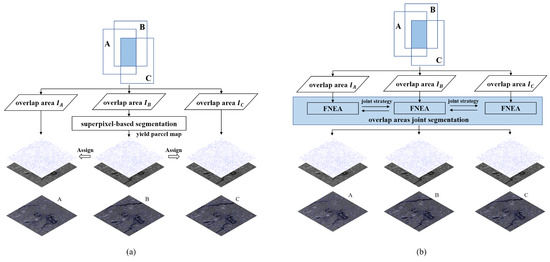
Figure 2.
Schematic of parcels extraction. (a) Traditional segmentation-based parcel extraction technique. (b) Joint segmentation-based parcel extraction framework.
2.3.2. Homogeneous Area Screening
After generating parcels by joint segmentation, statistical analysis can be conducted to identify and extract consistency-stable parcels, that is, homogeneous areas. The extraction of these consistency-stable parcels is crucial in narrowing the scope of the seamline search, as it effectively eliminates areas with significant projection differences and notable radiometric disparity. Through this method, the most optimal seamline can be precisely searched within the filtered, consistency-stable candidate areas and the effectiveness can be greatly improved.
Mean and standard deviations are used to describe the stability degree of the parcels. This is because mean and standard deviation can reveal the microwave scattering mechanism on the surface as well as the scattering characteristics of ground objects to a certain extent. For example, specular areas typically exhibit low mean and standard deviation, while double-bounce areas show high mean and standard deviation. Double-bounce mainly occurs in urban or built-up areas, which have significant geometric distortion. To reduce geometric misalignments during the mosaicking, seamline should ideally avoid double-bounce areas. Specular areas usually occur on smooth water surfaces, and mosaicking along these smooth surfaces does not introduce significant geometric and radiometric differences. It makes a great contribution to improving the overall mosaic quality. The insights derived from these observations motivate the extraction of consistency-stable parcels from overlapping images.
Assuming N parcels are extracted by joint segmentation, denoted as For each parcel, , its mean ( and ) and standard deviation ( and ) in the overlap areas and are calculated, represented as and for image and and for image . These statistics describe the homogeneity and stability of parcels in the overlap areas. Next, , , , and are classified into k classes. In this paper, the larger the value of k, the better the constraint on the direction of the final seamline. However, in order to balance classification accuracy and efficiency, k is set to 3 based on experience. By applying k-means [36], three class sets can be obtained, , , and , each taking values , where a small class value indicates better stability of parcels. Then, the and can be added to create a new classification result, , which ranges from 0 to 4. Similarly, is constructed in the same manner. The and are used to represent the stability of parcels in and , respectively.
Due to factors such as the acquisition time, observation angles, polarization mode, and random errors, the stability of parcels in and may vary, resulting in a different stability level. Therefore, an integration strategy is employed to take into account and , to derive a unified classification, . For parcels and , their stability level in and can be represented as and , respectively. Then, the integration rule is described as follows:
Finally, a unified stability classification with 8 levels can be derived. In , a lower value indicates that parcel has a higher similarity and stronger homogeneity in and , suggesting higher stability. The consistency-stable parcels with higher values of have distinct feature targets in them, so in the optimal seamline generation stage the generation is prioritized inside consistency-stable parcels with lower values of , which effectively narrows down the search range and greatly reduces the effect of geometric and radiometric differences and the seamlines become more accurate and avoids areas that may reduce the mosaic quality, such as urban built-up areas. Figure 3 shows the classification process and consistency-stable parcels extraction process.
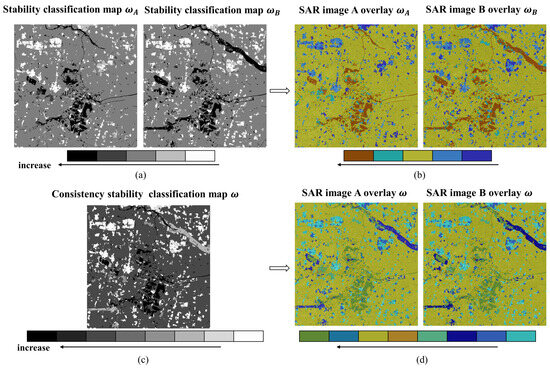
Figure 3.
The process of extracting consistent and stable parcels. (a) Stability classification map and for and , where darker areas indicate higher stability. (b) Visualization results obtained by overlaying and onto and , with enhanced stability indicated by the direction of arrows. (c) A unified classification map generated and . (d) Color-coded visualization obtained by overlaying onto and , depicting stability enhancement in the direction of the arrows.
The acquisition of reflects the level of homogeneous areas, which lays the foundation for the subsequent construction of the cost matrix.
2.3.3. Cost Matrix Construction
In the context of optical remote sensing images, an optimal seamline is expected to traverse the most similar portion of the overlapping areas of two images, minimizing inconsistencies [37]. Similarly, for SAR images a high-quality seamline should pass through homogeneous areas. Thus, the optimal seamline in SAR images should preferably traverse similar homogeneous areas, especially the joint homogeneous areas with lower weights identified during the screening process described above.
Treating optimal seamline generation as a shortest path problem in a matrix, the objective is to find a path in the overlapping area that minimizes the cost [37]. In the case of two SAR images, a cost matrix of dimensions is created, encompassing pixels in the overlapping area, where W and H denote the width and height of the overlapping area, respectively. Each pixel in this matrix is assigned a non-negative cost, and the optimal seamline should exclude high-cost pixels. Contrasting with a costly short-segment seamline, a low-cost long-segment seamline has the advantage of bypassing feature targets. This transformation turns the optimal seamline problem into finding the path that minimizes the cost in the cost matrix.
The construction of the cost matrix involves calculating the cost for each pixel in the overlapping area. Using pixel-based methods may be susceptible to speckle noise; the proposed method extracts joint homogeneous areas and searches for seamlines in joint homogeneous areas with lower weights to achieve building avoidance. In order to make the seamlines lie inside the joint homogeneous areas, a combination of parcel and pixel intensity difference is used to construct the cost matrix, which also reduces the effect of speckle noise compared to using only pixel-based methods. In this paper, the cost function is constructed using joint homogeneous areas and image intensity differences, which reflects both the results of the joint segmentation as well as the relationship between the image pixels. For two images, and , the cost function, , is defined as:
where represents the pixel with coordinates in the overlap area and is the intensity difference of pixels () in the overlapping areas of neighboring images, which is defined as:
where and denote the pixel gray values of the of and , respectively. represents the absolute value.
By utilizing Equation (4), the cost for each pixel in the overlapping area is calculated, thereby completing the construction of the cost matrix. Finally, the Dijkstra algorithm is applied to identify the optimal path in the cost matrix. Dijkstra’s algorithm is a widely used method for searching the shortest path in graph theory. It systematically extends outward layer by layer from the starting point (following the breadth-first search idea) until reaching the endpoint. Once the initial seam network is constructed, the intersection points of the image boundary are extracted, designating these points as the starting and ending points for the Dijkstra algorithm.
Guided by the optimal seamline, the SAR image mosaic is successfully executed.
3. Results and Analysis
3.1. Experimental Dataset
To assess the effectiveness of the proposed method, two sets of experiments are conducted using multiple SAR images acquired from the Chinese Gaofen-3 01 satellite. This satellite is the inaugural civil microwave remote sensing imaging satellite included in the “National High-resolution Earth Observation System Major Project” and is distinguished as the initial C-band multi-polarization SAR satellite, featuring a nominal resolution ranging from 1 m to 500 m. The two datasets are outlined as follows:
- (1)
- Dataset 1: The ROI spans from 44.56∘ to 45.67∘ N latitude and 123.71∘ to 125.05∘ E longitude. This dataset comprises 10 ascending orbit images collected between November 2019 and April 2021.
- (2)
- Dataset 2: The ROI extends from 33.55∘ to 35.07∘ N latitude and 116.16∘ to 117.57∘ E longitude. This dataset consists of 21 ascending orbit images collected from October 2022 to December 2022.
All SAR images are SLC products from the Gaofen-3 01 satellite, and the imaging mode is ultra-fine stripe (UFS). Detailed information is presented in Table 1 [38]. The geometric distribution can be visualized in Figure 4. Notably, the dataset encompasses diverse viewing conditions, including various incidence angles and different-side views, contributing to a comprehensive evaluation of the proposed method.

Table 1.
Detailed information of two datasets.
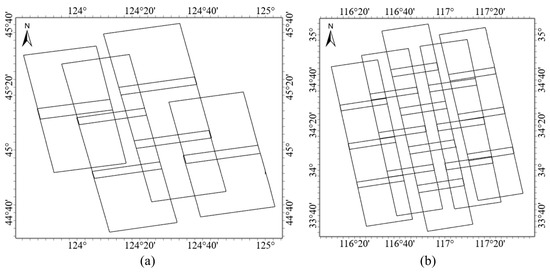
Figure 4.
Geometric distribution of two datasets. (a) Dataset 1. (b) Dataset 2.
3.2. Experimental Results
Both of the aforementioned datasets undergo identical preprocessing steps, followed by the application of the SOSG method. The results obtained from the proposed method are then juxtaposed with those from Chon et al. [20] and Wang et al. [25]. The Chon et al. [20] method is pixel-based, utilizing pixels in the optical image overlapping areas to construct a difference matrix and searching for optimal seamlines through the Dijkstra algorithm. On the other hand, Wang et al. [25] presents a typical object-based method for optical image optimal seamline generation. The experimental results are depicted in Figure 5 and Figure 6, with detailed results showcased in Figure 7 and Figure 8.
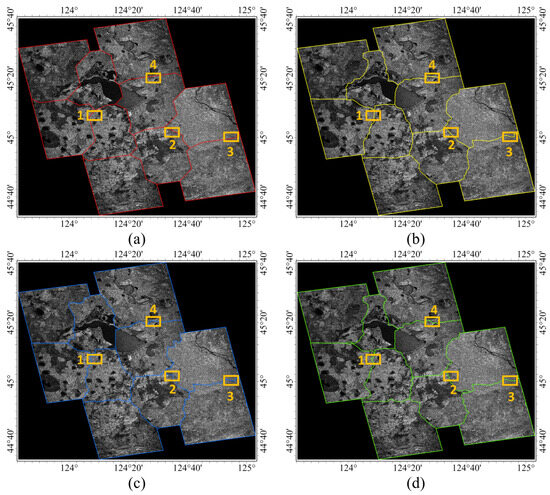
Figure 5.
Comparison of results of Dataset 1. (a) Initial seamline network and its mosaic result. (b) Chon et al. [20] method result. (c) Wang et al. [25] method result. (d) SOSG method result. The red, yellow, blue, and green lines are the seamline network in (a), (b), (c), and (d), respectively.
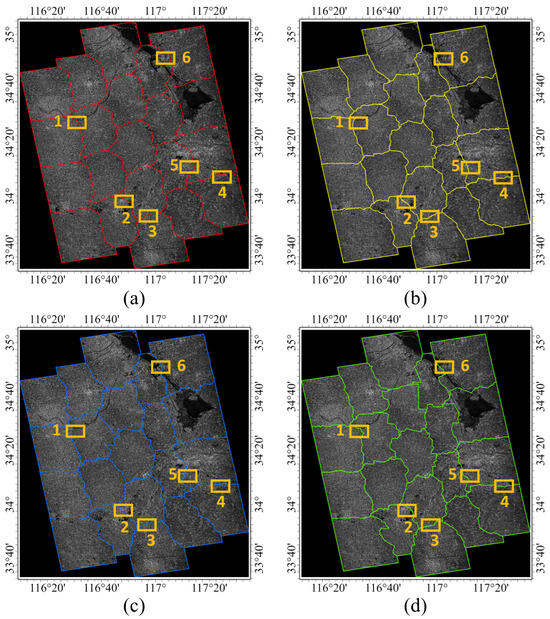
Figure 6.
Comparison of results of Dataset 2. (a) Initial seamline network and its mosaic result. (b) Chon et al. [20] method result. (c) Wang et al. [25] method result. (d) SOSG method result. The red, yellow, blue, and green lines are the seamline network in (a), (b), (c), and (d), respectively.
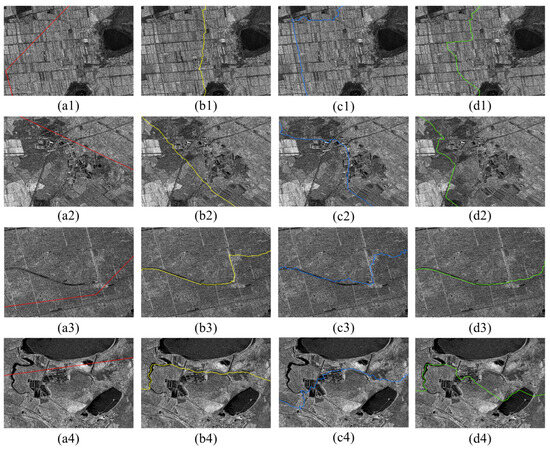
Figure 7.
Detail comparison of results of Dataset 1. (a1–a4) Initial seamline network result details, respectively, corresponding to the orange box area in Figure 5a. (b1–b4) Chon et al. [20] method result details, respectively corresponding to the orange box area in Figure 5b. (c1–c4) Wang et al. [25] method result details, respectively corresponding to the orange box area in Figure 5c. (d1–d4) SOSG method result details, respectively corresponding to the orange box area in Figure 5d.
3.3. Visual Assessments
Figure 5 and Figure 6 reveal that all three methods contribute to optimizing the seamline compared to the initial seamline. However, the optimization effects of the three methods vary significantly.
Dataset 1 does not contain very large regions of topographic undulation, and it is dominated by farmland and urban regions, with a small number of lakes. Figure 7(a1–a4) show the initial seamlines, which clearly cross obvious features such as buildings.
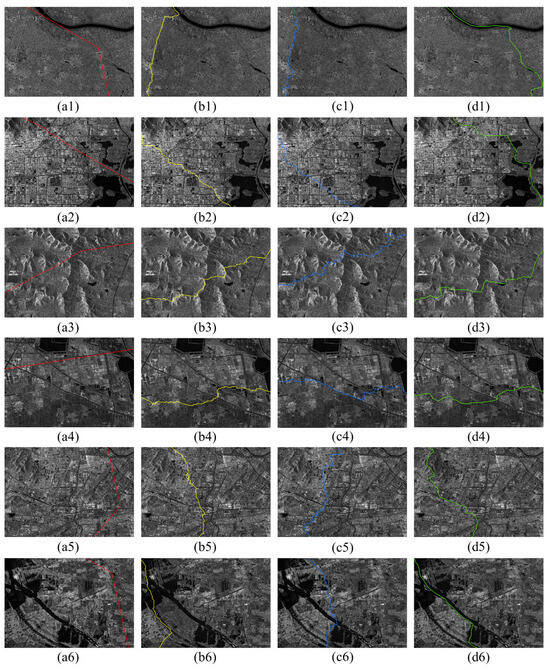
Figure 8.
Detail comparison of results of Dataset 2. (a1–a6) Initial seamline network result details, respectively corresponding to the orange box area in Figure 5a. (b1–b6) Chon et al. [20] method result details, respectively corresponding to the orange box area in Figure 5b. (c1–c6) Wang et al. [25] method result details, respectively corresponding to the orange box area in Figure 5c. (d1–d6) SOSG method result details, respectively, corresponding to the orange box area in Figure 5d.
Figure 7(b1–b4) show the seamlines generated by the Chon et al. [20] method, and it can be seen that in Figure 7(b1), when there are buildings in the vast farmland, the Chon et al. [20] method generates a seamline that does not bypass, but crosses right through. In Figure 7(b2), the seamline generated by the Chon et al. [20] method bypasses a few obvious features such as buildings, but the seamline is very close to the buildings, which may pose a small challenge to the feathering fusion afterwards. In Figure 7(b3), there is a very obvious wide road in the left area and the center area, which is a very desirable route for the seamline to be selected, and the Chon et al. [20] method successfully recognizes this. As the road extends, there is a cluster of buildings in the right area, and the Chon et al. [20] method, after searching for the seamline along the road to the north, did not make the decision to go east earlier and crossed between the two clusters of buildings. In Figure 7(b4), there are several lakes and a river, with a distinct cluster of buildings in the right area, and the seamline is satisfactorily routed in the left area and in the center area, but the decision to bypass the buildings is not accomplished when confronted with a larger number of buildings in the right side.
Figure 7(c1) shows the choice of the Wang et al. [25] method when faced with vast farmland, first searching along the east–west road, but buildings appear at the end of the road, which are not avoided, and then searching to the south after traversing the buildings, with a farmland region in the middle, which is a more ideal homogeneous area, the seamline in this area is in line with the optimal seamline, but in terms of the path, there is a longer path length. In Figure 7(c2), the decision of the Wang et al. [25] method is to search for the optimal seamline along the road, but there are more building clusters on both sides of the road, and the method does not perform the dodge, and then the seamline is selected on the road between the buildings. In Figure 7(c3), there are obvious roads in the left area and center area, but the segmentation method in the Wang et al. [25] method does not segment the roads well, resulting in the seamline not fitting the roads perfectly, while the Wang et al. [25] method makes the same decision as the Chon et al. [20] method in the right area but crosses more buildings than the Chon et al. [20] method. In Figure 7(c4), in the left area, the Wang et al. [25] method did not choose to search for the seamline along the river, but rather searched in a more homogeneous area just below the river, and the result is acceptable, but on the right side of the complex, it still crosses the building.
Figure 7(d1–d4) shows the optimal seamlines generated by the SOSG method. In Figure 7(d1), the SOSG method first searches for the seamlines along the farmland in the upper side area, but unlike the Wang et al. [25] method is different in that it searches towards the central farmland area when buildings are about to be encountered, thus effectively avoiding the complexes in the center area, similarly to the Chon et al. [20] method. In the lower side area there is a small lake, and the nearby area is a more desirable homogeneous area, and the SOSG method chooses the seamline near this area, because from the divided consistency-stable parcels this area parcels with lower weight; the SOSG method has the advantage over the other two methods in d1. In Figure 7(d2), the SOSG method makes a different decision than either of the other two methods, searching for a seamline along a very obvious road while fully avoiding the building complexes. In Figure 7(d3), the obvious roads in the left and center areas are clearly ideal locations for the optimal seamline, and the SOSG method accomplishes this, but in the right area the SOSG method traverses directly next to a smaller building because there is a much larger cluster of buildings in the upper area. In Figure 7(d4), there are quite a few buildings in the right area. The Chon et al. [20] method and Wang et al. [25] method did not avoid them, while the SOSG method fully considers the characteristics of consistency-stable parcels and uses the pond in the bottom-right area to search to avoid buildings. In areas with rivers, the optimal seamline can also be selected. In this dataset, it is fully demonstrated that the SOSG method has the advantage over the other two methods, and the generated seamlines have a stronger ability to avoid obvious ground targets compared to the other two seamlines.
Dataset 2, which is close to Dataset 1 terrain, is dominated by plains, but has some smaller areas of undulating terrain.
Figure 8(b1–b6) show the seamlines generated by the Chon et al. [20] method. In Figure 8(b1), there is a more obvious river in the upper side area, and there is a small stream on the right side of the road. The Chon et al. [20] method uses the road on the left side as the optimal choice for searching the seamline, but there are more and more buildings on both sides of the road, which is a reflection of the fact that the Chon et al. [20] method cannot accurately identify object-level targets. In Figure 8(b2), there are a large number of buildings, and there are landforms such as rivers and lakes on the right area, and the seamline is unable to avoid the building clusters; the Chon et al. [20] method chooses to traverse it directly. In Figure 8(b3), there is a smaller terrain undulation area, and thus some layover areas are generated; the Chon et al. [20] method generates the cost matrix based on the pixel information and does not treat the layover areas specifically, which results in the generated seamlines not avoiding the layover areas, and at the same time some of the seamlines follow the boundaries of the layover areas and the non-layover areas for search, but when there is a road, the Chon et al. [20] method can still recognize it. In Figure 8(b4), the landscape is dominated by features such as farmland and man-made ponds, and there are a number of very distinct roads; the seamline crosses the buildings on the left area and then proceeds along the homogeneous area such as the farmland, and it does not turn into a road when it encounters one. Figure 8(b5) is a very complex area with a variety of buildings, a challenge for various algorithms; the Chon et al. [20] method traverses a large number of buildings when it is not possible to avoid them. Figure 8(b6) has a wide range of water with many options for the location of the seamlines, in which case the seamlines generated by the Chon et al. [20] method can meet the requirements for usage.
Figure 8(c1–c6) are the seamlines generated by the Wang et al. [25] method. The seamline generated by the Wang et al. [25] method in Figure 8(c1) is more similar to the seamline generated by the Chon et al. [20] method, and the decision-making is similar for both methods. Similarly, in the presence of more complex scenarios, the seamline generated by the Wang et al. [25] method is similar to that of the Chon et al. [20] method, as shown in Figure 8(c2). In Figure 8(c3), the Wang et al. [25] method avoids some of the layover areas, but still traverses some of the layover areas, compared to the Chon et al. [20] method. In Figure 8(c4), the decision of the Wang et al. [25] method is to prioritize the crossing of the road, and therefore the seamlines are concentrated towards the road sides. In Figure 8(c5), in the same complex scenario, the decision of the Wang et al. [25] method is to search for the seamline along the road or the boundary between buildings and non-buildings, which is more reflective of the Chon et al. [20] method than the segmentation effect, but still traverses more buildings. In the presence of a large amount of water, the Wang et al. [25] method still has a higher priority for roads, with the seamline preferentially following the road, as shown in Figure 8(c6).
Figure 8(d1–d6) show the seamlines generated by the SOSG method. In Figure 8(d1), the SOSG method chooses a river between a road and a river, and the seamline on the right area uses a stream as the basis for searching, because there are fewer buildings on both sides of the seamline, and therefore the overall visual effect is better than the other two methods. The performance of the SOSG method in the case of complex scenarios faced is demonstrated in Figure 8(d2), where the right area has roads and lakes that have a very high level of selection of seamlines in the extraction of consistency-stable parcels, and therefore, in the case of not being able to avoid the complex of buildings, the SOSG method is more advantageous than the other two methods by traversing the least number of buildings and moving to parcels with lower weights for the seamline search. Figure 8(d3) shows the existence of a layover area; in this case, due to the characteristics of the layover area, the consistency-stable parcel extraction process can also judge the layover area as parcels with higher weights, so that the layover area can be avoided. As can be seen from the figure, the parcels are avoided in the face of multiple layover areas, and the parcels can also be selected in the road when the road appears. As shown in Figure 8(d4), the SOSG method has good judgment for homogeneous areas like farmland, generating seamlines in farmland areas while avoiding building clusters as much as possible, and at the same time the path is the shortest compared to the other two methods. In complex scenarios, faced with the unavoidable traversal of building complexes, the seamline generated by the SOSG method chooses to prioritize the search along roads, as shown in Figure 8(d5), and the decision is similar to that of the Wang et al. [25] method, but less obvious feature targets than the Wang et al. [25] method traverses fewer obvious feature targets. In Figure 8(d6), the large amount of water provides more choices for seamline detection, and the SOSG method prioritizes searching for seamlines along the water, which is different from the mosaics detected by the Chon et al. [20] method, but the decision making is similar. In this dataset, it is well demonstrated that the SOSG method, guided by consistency-stable parcels, has a better ability to select seamlines, and the location of seamlines is more in line with human intuition.
In conclusion, the proposed SOSG method proves effective in generating optimal seamlines for SAR images, yielding more comprehensive mosaic images of feature targets.
3.4. Statistical Analysis
To conduct a more in-depth evaluation of the proposed method, quantitative indicators such as the number of crossings of visible feature targets and the processing times are selected for analysis. The statistical results of different methods are presented in Table 2.
Table 2.
Statistical results of different methods.
In Dataset 1, characterized by a predominantly flat landscape with a few building complexes, the Chon et al. [20] method traversed 87 obvious buildings within a processing time of 30 s. In comparison, Wang et al. [25] traversed fewer buildings (67), while showing that segmentation-based methods can offer advantages over pixel-based methods. The proposed SOSG method demonstrated the least number of crossings of obvious feature targets in this dataset but incurred the highest processing time.
Dataset 2 features a large number of buildings and some areas of undulating terrain. The Chon et al. [20] method and the Wang et al. [25] method showed comparable seamline performance in this dataset, with Wang et al. [25] requiring more time. The proposed SOSG method passed through significantly fewer obvious objects than other methods in this dataset, although it also exhibited the longest processing time.
In summary, the statistical results affirm that the SOSG method effectively avoids obvious ground objects, generating optimal seamlines that enhance visual quality and quantitative performance. However, achieving a balance between efficiency and accuracy remains a challenge, and future work will focus on improving the time efficiency of the proposed method.
4. Conclusions
This paper introduces an SOSG method for SAR image mosaicking, aiming to enhance the integrity of feature targets in mosaic images and realize seamless mosaicking. The proposed method, designed with a consideration of SAR image characteristics, involves generating parcels through joint segmentation. Analysis is performed on the parcels extracted by joint segmentation, and the consistency-stable parcels, namely homogeneous areas, are extracted and assigned different weights. The consistency-stable parcels with higher weights contain obvious ground objects. By constructing a cost matrix combining segmentation and pixel characteristics, the optimal seamline is selected in the areas with lower weights, and the obvious ground object target is successfully bypassed. The SOSG method proves effective in enhancing feature target information in SAR mosaic images, as is evident in the experimental results. While successfully avoiding obvious feature targets, it improves both the visual quality and quantitative performance of SAR mosaic images. However, it is acknowledged that the time efficiency of joint segmentation may impact the overall efficiency of the SOSG method, and future work will focus on addressing this limitation. Furthermore, this holistic method presents significant advantages for subsequent SAR mosaic image interpretation.
Author Contributions
Conceptualization, R.L.; methodology, R.L. and J.Z.; validation, R.L.; formal analysis, R.L. and N.J.; investigation, R.L.; resources, R.L.; data curation, R.L.; writing—original draft, R.L.; writing—review and editing, J.Z., N.J. and Y.C.; visualization, R.L.; supervision, H.Y.; project administration, N.J. and H.Y.; funding acquisition, N.J. and H.Y. All authors have read and agreed to the published version of the manuscript.
Funding
This work was supported by the Future Star Foundation of Aerospace Information Research Institute, Chinese Academy of Sciences, under Grant Number E3Z108010F.
Institutional Review Board Statement
Not applicable.
Informed Consent Statement
Not applicable.
Data Availability Statement
The data presented in this study are available on request from the corresponding author. The data are not publicly available due to confidentiality.
Conflicts of Interest
The authors declare no conflicts of interest.
References
- Dabbagh, A.E.; Al-Hinai, K.G.; Khan, M.A. Detection of sand-covered geologic features in the Arabian Peninsula using SIR-C/X-SAR data. Remote Sens. Environ. 1997, 59, 375–382. [Google Scholar] [CrossRef]
- Rosenqvist, A.; Shimada, M.; Ito, N.; Watanabe, M. ALOS PALSAR: A pathfinder mission for global-scale monitoring of the environment. IEEE Trans. Geosci. Remote Sens. 2007, 45, 3307–3316. [Google Scholar] [CrossRef]
- Guo, H.; Wang, X.; Li, X.; Liu, G.; Zhang, L.; Yan, S. Yushu earthquake synergic analysis using multimodal SAR datasets. Chin. Sci. Bull. 2010, 55, 3499–3503. [Google Scholar] [CrossRef]
- Fan, J.; Wang, D.; Zhao, J.; Song, D.; Han, M.; Jiang, D. National sea area use dynamic monitoring based on GF-3 SAR imagery. J. Radars 2017, 6, 456–472. [Google Scholar]
- Gella, G.W.; Bijker, W.; Belgiu, M. Mapping crop types in complex farming areas using SAR imagery with dynamic time warping. ISPRS J. Photogramm. Remote Sens. 2021, 175, 171–183. [Google Scholar] [CrossRef]
- Zhang, G.; Cui, H.; Wang, T.; Li, Z.; Jiang, B.; Li, X.; Wang, H.; Zhu, Y. Random cross-observation intensity consistency method for large-scale SAR images mosaics: An example of Gaofen-3 SAR images covering China. ISPRS J. Photogramm. Remote Sens. 2019, 156, 215–234. [Google Scholar] [CrossRef]
- Li, X.; Feng, R.; Guan, X.; Shen, H.; Zhang, L. Remote sensing image mosaicking: Achievements and challenges. IEEE Geosci. Remote Sens. Mag. 2019, 7, 8–22. [Google Scholar] [CrossRef]
- Pan, J.; Wang, M.; Li, D. Approach for Automatic Generation and Optimization of Seamline Network. Acta Geod. Cartogr. Sin. 2010, 39, 289–294. [Google Scholar]
- Hsu, S.; Sawhney, H.S.; Kumar, R. Automated mosaics via topology inference. IEEE Comput. Graph. Appl. 2002, 22, 44–54. [Google Scholar] [CrossRef]
- Pan, J.; Wang, M.; Li, D.; Li, J. Automatic generation of seamline network using area Voronoi diagrams with overlap. IEEE Trans. Geosci. Remote Sens. 2009, 47, 1737–1744. [Google Scholar] [CrossRef]
- Song, M.; Ji, Z.; Huang, S.; Fu, J. Mosaicking UAV orthoimages using bounded Voronoi diagrams and watersheds. Int. J. Remote Sens. 2018, 39, 4960–4979. [Google Scholar] [CrossRef]
- Yuan, X.; Cai, Y.; Yuan, W. Voronoi Centerline-Based Seamline Network Generation Method. Remote Sens. 2023, 15, 917. [Google Scholar] [CrossRef]
- Agrawal, H.; Horgan, J.R. Dynamic program slicing. ACM SIGPlan Not. 1990, 25, 246–256. [Google Scholar] [CrossRef]
- Dijkstra, E.W. A note on two problems in connexion with graphs. In Edsger Wybe Dijkstra: His Life, Work, and Legacy; ACM Books: New York, NY, USA, 2022; pp. 287–290. [Google Scholar]
- Fernandez, E.; Garfinkel, R.; Arbiol, R. Mosaicking of aerial photographic maps via seams defined by bottleneck shortest paths. Oper. Res. 1998, 46, 293–304. [Google Scholar] [CrossRef]
- Kass, M.; Witkin, A.; Terzopoulos, D. Snakes: Active contour models. Int. J. Comput. Vis. 1988, 1, 321–331. [Google Scholar] [CrossRef]
- Dorigo, M.; Birattari, M.; Stutzle, T. Ant colony optimization. IEEE Comput. Intell. Mag. 2006, 1, 28–39. [Google Scholar] [CrossRef]
- Greig, D.M.; Porteous, B.T.; Seheult, A.H. Exact maximum a posteriori estimation for binary images. J. R. Stat. Soc. Ser. Stat. Methodol. 1989, 51, 271–279. [Google Scholar] [CrossRef]
- Kerschner, M. Seamline detection in colour orthoimage mosaicking by use of twin snakes. ISPRS J. Photogramm. Remote Sens. 2001, 56, 53–64. [Google Scholar] [CrossRef]
- Chon, J.; Kim, H.; Lin, C.S. Seam-line determination for image mosaicking: A technique minimizing the maximum local mismatch and the global cost. ISPRS J. Photogramm. Remote Sens. 2010, 65, 86–92. [Google Scholar] [CrossRef]
- Dong, Q.; Liu, J. Seamline determination based on PKGC segmentation for remote sensing image mosaicking. Sensors 2017, 17, 1721. [Google Scholar] [CrossRef] [PubMed]
- Wang, Q.; Zhou, G.; Song, R.; Xie, Y.; Luo, M.; Yue, T. Continuous space ant colony algorithm for automatic selection of orthophoto mosaic seamline network. ISPRS J. Photogramm. Remote Sens. 2022, 186, 201–217. [Google Scholar] [CrossRef]
- Soille, P. Morphological image compositing. IEEE Trans. Pattern Anal. Mach. Intell. 2006, 28, 673–683. [Google Scholar] [CrossRef] [PubMed]
- Pan, J.; Zhou, Q.; Wang, M. Seamline determination based on segmentation for urban image mosaicking. IEEE Geosci. Remote Sens. Lett. 2013, 11, 1335–1339. [Google Scholar] [CrossRef]
- Wang, M.; Yuan, S.; Pan, J.; Fang, L.; Zhou, Q.; Yang, G. Seamline determination for high resolution orthoimage mosaicking using watershed segmentation. Photogramm. Eng. Remote Sens. 2016, 82, 121–133. [Google Scholar] [CrossRef]
- Pan, J.; Wang, M.; Li, J.; Yuan, S.; Hu, F. Region change rate-driven seamline determination method. ISPRS J. Photogramm. Remote Sens. 2015, 105, 141–154. [Google Scholar] [CrossRef]
- Yuan, Y.; Fang, F.; Zhang, G. Superpixel-based seamless image stitching for UAV images. IEEE Trans. Geosci. Remote Sens. 2020, 59, 1565–1576. [Google Scholar] [CrossRef]
- Ma, H.c.; Sun, J. Intelligent optimization of seam-line finding for orthophoto mosaicking with LiDAR point clouds. J. Zhejiang Univ. Sci. C 2011, 12, 417–429. [Google Scholar] [CrossRef]
- Wan, Y.; Wang, D.; Xiao, J.; Lai, X.; Xu, J. Automatic determination of seamlines for aerial image mosaicking based on vector roads alone. ISPRS J. Photogramm. Remote Sens. 2013, 76, 1–10. [Google Scholar] [CrossRef]
- Chen, Q.; Sun, M.; Hu, X.; Zhang, Z. Automatic seamline network generation for urban orthophoto mosaicking with the use of a digital surface model. Remote Sens. 2014, 6, 12334–12359. [Google Scholar] [CrossRef]
- Wang, D.; Cao, W.; Xin, X.; Shao, Q.; Brolly, M.; Xiao, J.; Wan, Y.; Zhang, Y. Using vector building maps to aid in generating seams for low-attitude aerial orthoimage mosaicking: Advantages in avoiding the crossing of buildings. ISPRS J. Photogramm. Remote Sens. 2017, 125, 207–224. [Google Scholar] [CrossRef]
- Yuan, S.; Yang, K.; Li, X.; Cai, H. Automatic Seamline Determination for Urban Image Mosaicking Based on Road Probability Map from the D-LinkNet Neural Network. Sensors 2020, 20, 1832. [Google Scholar] [CrossRef] [PubMed]
- Xiang, Y.; Jiao, N.; Liu, R.; Wang, F.; You, H.; Qiu, X.; Fu, K. A Geometry-Aware Registration Algorithm for Multiview High-Resolution SAR Images. IEEE Trans. Geosci. Remote Sens. 2022, 60, 5234818. [Google Scholar] [CrossRef]
- Liu, R.; Wang, F.; Jiao, N.; Yu, W.; You, H.; Liu, F. Radiometric Principle-Based Radiometric Normalization Method for SAR Images Mosaic. IEEE Geosci. Remote Sens. Lett. 2022, 19, 4509905. [Google Scholar] [CrossRef]
- Zhu, J.; Wang, F.; You, H. Segmentation-based VHR SAR images built-up area change detection: A coarse-to-fine approach. J. Appl. Remote Sens. 2024, 18, 016503. [Google Scholar] [CrossRef]
- MacQueen, J. Some methods for classification and analysis of multivariate observations. In Proceedings of the Fifth Berkeley Symposium on Mathematical Statistics and Probability, Oakland, CA, USA, 21 June–18 July 1965; Volume 1, pp. 281–297. [Google Scholar]
- Shen, H.; Zhou, W.; Li, X. A Fast Globally Optimal Seamline Detection Method for High-Resolution Remote Sensing Images. IEEE Geosci. Remote Sens. Lett. 2023, 20, 6003305. [Google Scholar] [CrossRef]
- Zhang, Q. System Design and Key Technologies of the GF-3 Satellite. Acta Geod. Cartogr. Sin. 2017, 46, 269. [Google Scholar]
Disclaimer/Publisher’s Note: The statements, opinions and data contained in all publications are solely those of the individual author(s) and contributor(s) and not of MDPI and/or the editor(s). MDPI and/or the editor(s) disclaim responsibility for any injury to people or property resulting from any ideas, methods, instructions or products referred to in the content. |
© 2024 by the authors. Licensee MDPI, Basel, Switzerland. This article is an open access article distributed under the terms and conditions of the Creative Commons Attribution (CC BY) license (https://creativecommons.org/licenses/by/4.0/).